 Yang Lu1,2,3,4
 Wei Huang1,3,4*
 Shenghui Cui1,3,4Jiexin Deng1,2,3,4Yin Zhang1,2,3,4Yunfeng Huang5
 Bing Gao1,3,4*
- 1Institute of Urban Environment, Chinese Academy of Sciences, Xiamen, China
- 2University of Chinese Academy of Sciences, Beijing, China
- 3State Key Laboratory of Regional and Urban Ecology, Institute of Urban Environment, Chinese Academy of Sciences, Xiamen, China
- 4Xiamen Key Lab of Urban Metabolism, Xiamen, China
- 5Department of Environmental Engineering, Jimei University, Xiamen, China
Introduction: Phosphorus (P) is a vital nutrient for food production, yet a significant pollutant when mismanaged.
Methods: This study analyzes the phosphorus flow of the food system in the Guangdong-Hong Kong-Macao Greater Bay Area (GBA) in 2020, using a Substance Flow Analysis framework. The research examines natural and anthropogenic inputs, outputs and accumulation of phosphorus.
Results: Results reveal that the GBA is heavily dependent on external phosphorus inputs, with a total input of 187.69 Gg. The two largest sources of phosphorus inputs are aquaculture (36%) and food consumption (33%). The phosphorus use efficiency (PUE) in crop production, animal husbandry, and aquaculture were approximately 48.8, 32.37, and 10.01%, respectively. However, only 7.89% of phosphorus is recycled, while substantial losses (76% to soil and 24% to water bodies) exacerbate environmental pressures. Spatial analysis highlights distinct patterns between production-oriented cities (e.g., Jiangmen and Zhaoqing) and consumption-oriented cities (e.g., Shenzhen and Hong Kong).
Discussion: Policy recommendations include enhancing aquaculture management, improving phosphorus recycling technologies, and fostering intercity collaboration to create a sustainable phosphorus management framework. These findings provide critical insights for addressing phosphorus-related challenges in urban agglomerations.
1 Introduction
Phosphorus (P) is a critical nutrient for the growth of organisms, but excessive application can lead to overaccumulation, particularly in aquatic environments, causing severe and persistent eutrophication (Conley et al., 2009; Guo et al., 2024). This issue is exacerbated by the fact that phosphorus is a non-renewable resource; thus, its overuse can cause long-term environmental damage (Zou et al., 2022). Agricultural phosphorus use is inefficient, with seasonal fertilizer use efficiency being less than one-fifth, which contributes to phosphorus accumulation in soils and subsequent water pollution (Carpenter and Bennett, 2011). Only about 15% of phosphorus input is converted into animal products, while approximately 40% is lost to the environment as waste. This loss not only represents a resource inefficiency but may also lead to environmental degradation (Yuan et al., 2019). Furthermore, the phosphorus-use efficiency (PUE) in aquaculture in China ranges from 8.7 to 21.2%, indicating significant environmental loss rates (Zhang et al., 2015). Therefore, managing phosphorus application and comprehensively understanding its metabolic pathways are essential for sustaining agricultural productivity and protecting aquatic ecosystems.
Phosphorus plays a pivotal role in human society and exerts a profound environmental influence during its utilization. At the global scale, research on the spatiotemporal dynamics of phosphorus metabolism has provided valuable insights into its implications for resource sustainability. For example, Koppelaar and Weikard (2013) analyzed the consumption of phosphate rock and the feasibility of recycling, highlighting the risks of global phosphorus resource depletion. Similarly, Bouwman et al. (2013) explored the historical evolution of nitrogen and phosphorus cycles in agriculture from 1900 to 2050, emphasizing the significant influence of livestock production on phosphorus metabolism. At the regional scale, studies have focused on the spatial distribution and driving mechanisms of phosphorus flows. Liu et al. (2022) examined the characteristics of phosphorus emissions in the Yangtze River Economic Belt, while Chen et al. (2024) investigated phosphorus flows within waste systems in the Poyang Lake Basin. Additionally, Chen et al. (2021) analyzed the effects of urban characteristics on phosphorus metabolism in the Greater Bay Area. In food systems, research has primarily centered on phosphorus metabolism pathways and recycling strategies. Roy et al. (2019) and Tasmeea et al. (2021) used material flow analysis to uncover the patterns of phosphorus metabolism in Bangladesh’s food system, whereas Yang and Zhang (2023) identified food processing as the dominant source of phosphorus outflows in multiple regions of China. Esculier et al. (2019) addressed the sustainable management of nitrogen (N) and phosphorus (P) within the water-agriculture-food system in the Paris metropolitan area, revealing that most phosphorus remains unrecovered during incineration and ultimately exists as ash. Collectively, these studies demonstrate the multi-scale complexity of phosphorus flows. Although significant progress has been made in understanding phosphorus flows within socio-economic systems, there is still a lack of research on phosphorus flows and related environmental issues at the scale of urban agglomerations, particularly in the context of food systems. Moreover, the varying contributions of different city types within urban agglomerations remain understudied. These gaps underscore the need for further investigation to better understand and address the complexities of phosphorus metabolism at this scale.
Therefore, by employing Substance Flow Analysis (SFA), we construct a phosphorus metabolism model to systematically analyze the process of phosphorus flows within the food system. Through integrating various sectors involved in both natural and anthropogenic processes, the study evaluates the characteristics of phosphorus metabolism specific to the GBA urban agglomeration. The primary objective is to elucidate differences in phosphorus flow patterns and their underlying mechanisms among cities in the GBA urban agglomeration, enhancing regional phosphorus management strategies and promoting sustainable development.
2 Materials and methods
2.1 Study area
The GBA comprises eleven cities: Guangzhou, Shenzhen, Zhuhai, Foshan, Huizhou, Dongguan, Zhongshan, Jiangmen, Zhaoqing, Hong Kong, and Macao. In 2020, the GBA accounted for approximately 0.6% of China’s total land area but attracted 5% of the national population. Over the past decade, the region has witnessed a 35% increase in population, leading to a significant rise in population agglomeration within the urban cluster. Consequently, the demand for food has surged dramatically. Meanwhile, the production of phosphorus pollutants has been substantial, yet the effectiveness of pollution control measures remains inadequate (Cross-media, 2022). The surface water quality in the Pearl River Delta river network is lower than the average level of Guangdong Province, and seawater below Class IV standards is primarily distributed in estuarine bays such as the Pearl River Estuary, with active phosphate being the primary pollutant (Guangdong Provincial Department of Ecology and Environment, 2020). With the further expansion and intensification of urbanization in the GBA, there is an urgent need to conduct in-depth research on phosphorus metabolism processes within the urban agglomeration’s food system from a systemic perspective. This research is essential for improving phosphorus pollution control measures and exploring pathways that contribute to enhancing the overall ecological and environmental quality of the GBA.
2.2 Phosphorus metabolism framework
This study focuses on the phosphorus flow in the urban agglomeration food system of the GBA in 2020, including 11 cities within the area. The study constructs a phosphorus metabolism model of the urban agglomeration food system (shown in Figure 1). The aim is to comprehensively analyze and quantify the phosphorus flow in various cities and sectors within the region. The constructed model employs the administrative boundaries of each city as its horizontal boundary, sets the upper vertical boundary at 1,000 meters above ground level, and defines the lower boundary as the bedrock (Gu et al., 2015). It covers the natural and anthropogenic input processes of phosphorus, as well as its migration, transformation, and output processes among various sectors within urban agglomeration.
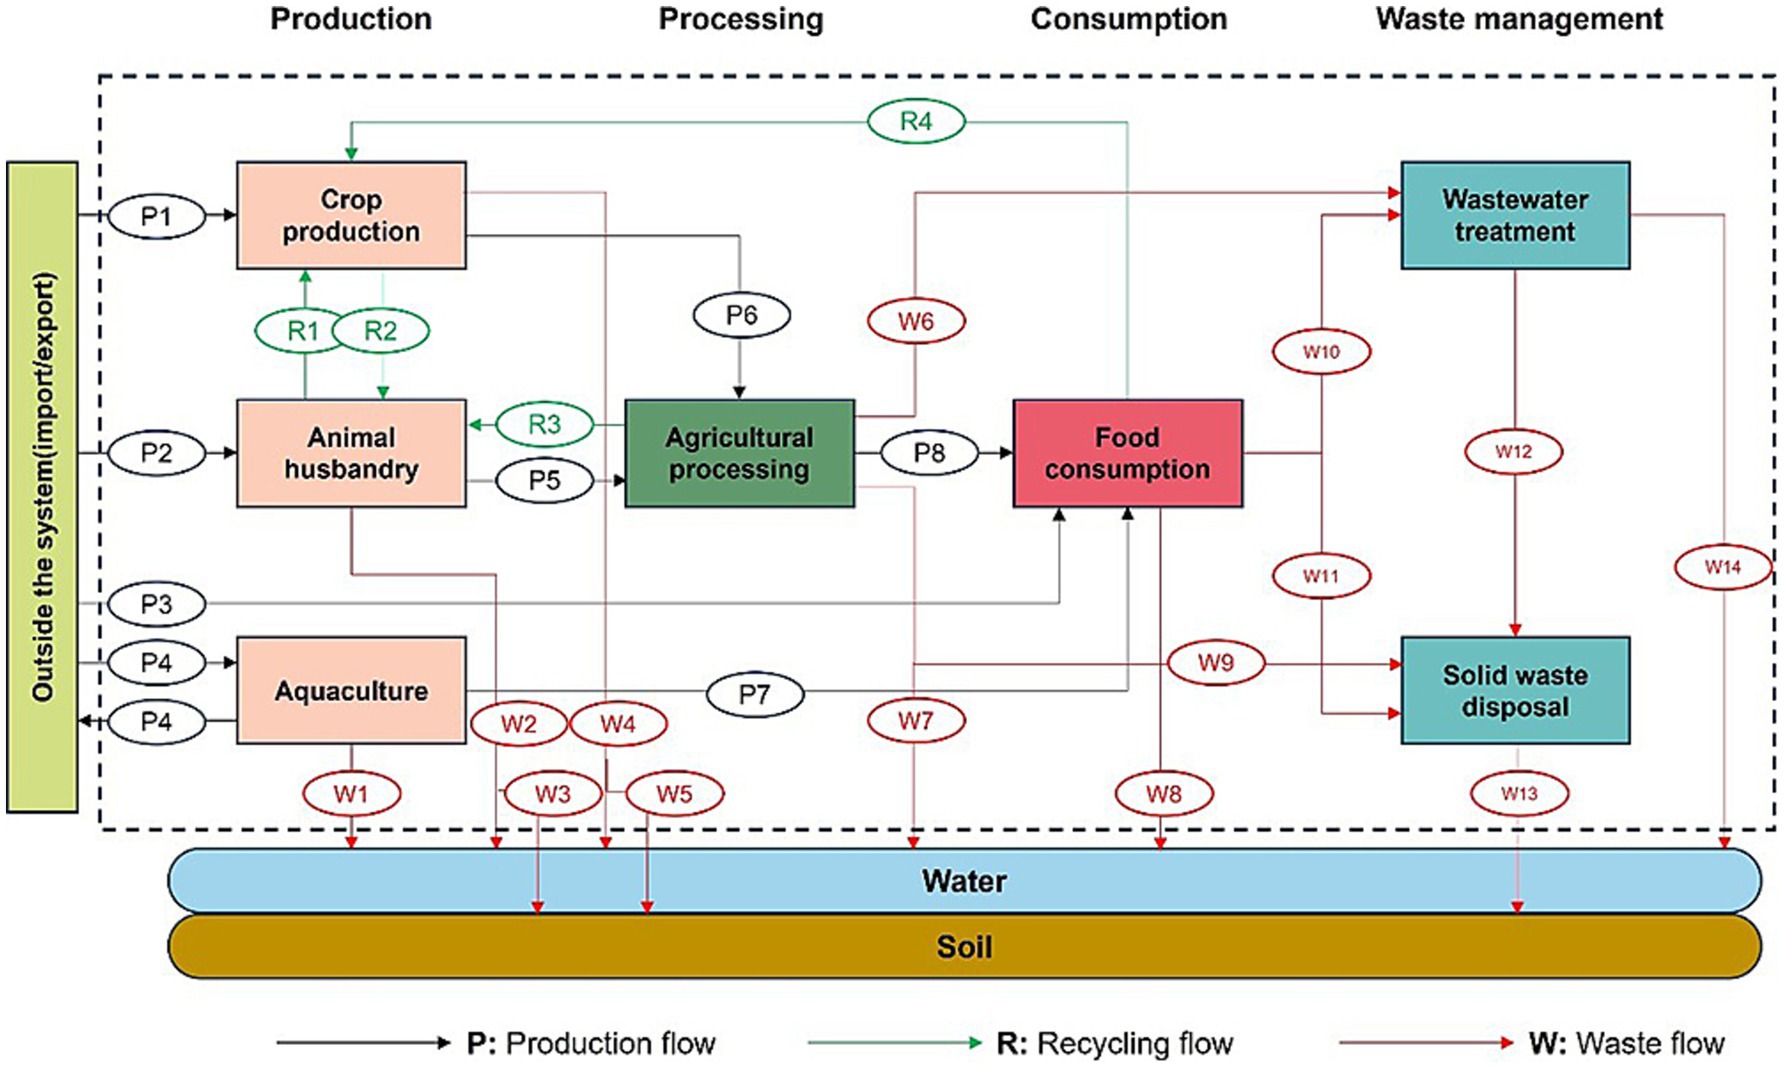
Figure 1. Framework of the phosphorus flows model of the urban agglomeration food system.
This study establishes a multi-sectoral phosphorus metabolism model framework for urban agglomeration food system, covering four stages: agricultural production, agricultural product processing, food consumption, and waste treatment. These stages are further divided into seven sectors, including (1) Crop production; (2) Animal husbandry; (3) Aquaculture; (4) Agricultural product processing; (5) Food consumption; (6) Wastewater treatment and (7) Solid waste disposal. To ensure the accuracy of the analysis, the material inputs and outputs of each sector and metabolic process are balanced based on the substance flow analysis method.
The crop production sector quantifies phosphorus flows from 11 major crop types, including rice, soybeans, tubers, corn, sugarcane, peanuts, rapeseed, other tubers, vegetables, fruits, and tea. The animal husbandry sector includes five primary livestock categories: cattle, sheep, pigs, poultry, and rabbits. The aquaculture sector comprises four main groups: fish, crustaceans (e.g., shrimp and crab), mollusks, and other aquatic products. The agricultural product processing sector considers three key activities that utilize harvested crops and livestock: oil production, slaughtering, and feed processing. The food consumption sector represents household dietary intake, which generates both solid waste and wastewater. Wastewater treatment refers to the centralized removal of contaminants from both household and agricultural product processing effluents. Solid waste disposal involves the treatment of diverse solid waste streams through landfilling, incineration, and other treatments such as stockpiling and composting.
2.3 Calculation of the phosphorus flows
Based on the established framework for phosphorus metabolism analysis, the calculation of phosphorus flows primarily employs two computational methods. One method involves calculating individual phosphorus flows through relevant data and parameters, as shown in Equation1.
Where, and represent the phosphorus input and output flows, respectively. represents the accumulation of phosphorus.
Phosphorus enters the system mainly through four pathways: as chemical fertilizers, pesticides, atmospheric deposition and irrigation into the crop production sector; as animal feed into the animal husbandry sector; as aquaculture feed into the aquaculture sector; and as food into the food consumption sector. Phosphorus loss from the system mainly occurs through the following pathways: straw from the crop production sector, animal manure from the animal husbandry sector, wastewater from the aquaculture sector, animal slaughtering and oil production wastewater from agricultural product processing, domestic sewage from the food consumption sector, effluent from the wastewater treatment sector, and incineration ash and landfill waste from the solid waste disposal sector. The detailed computing equations of the P flows in each sector are in Supporting Information.
Within the food system, two key indicators were utilized to assess nutrient use efficiency: Phosphorus use efficiency (PUE) and the phosphorus recycling rate. PUE is defined as the ratio of P output in harvested products to total P inputs within a system (Biswas Chowdhury and Zhang, 2021; Huang et al., 2019). The phosphorus recycling rate was defined as the ratio of total recycled phosphorus (P) to total new P inputs within the food system (Huang et al., 2019). Here, recycled P specifically denotes phosphorus recovered from crop residues, animal excreta, and kitchen residues. Total new P inputs encompass a broader range of sources, including atmospheric deposition, chemical fertilizers, seeds, irrigation water, net feed inputs by livestock and aquaculture, and net food imports.
2.4 Data collection
The data sources for this study include: (1) statistical yearbooks published by the Chinese government, such as China Statistical Yearbook, Guangdong Statistical Yearbook, Guangdong Rural Statistical Yearbook, China Urban Construction Statistical Yearbook, etc.;(2)other statistical reports published by the Chinese government, such as Hong Kong Agriculture, Fisheries and Conservation Department Annual Report, China Population Census County-Level Data – 2020, Guangdong Province Water Resources Bulletin, etc.; (3) official reports or databases from other national governments or international organizations, such as Food and Agriculture Organization of the United Nations(FAO);(4)published literature, mainly to obtain some phosphorus-related coefficients or other production and consumption-related coefficients for accounting. The primary data operations were conducted using Microsoft Excel. Figure 2 was created using e! Sankey 5, while all spatial distribution maps were generated using ArcGIS Pro.

Figure 2. Overall phosphorus flows in the food system of the GBA in 2020.
3 Results and discussion
3.1 Phosphorus flow patterns in the GBA
Figure 2 illustrates the phosphorus metabolism process in the food system of the GBA in 2020. Due to the absence of local phosphorus ore resources and mining industries, the GBA relies heavily on external phosphorus inputs. In 2020, the total external phosphorus input to the GBA food system reached 187.69 Gg. Among this, 67.22 Gg (36% of the external P input) was supplied to the aquaculture sector in the form of feed. This high input is largely attributed to Guangdong being the largest aquaculture producer in China. Its major aquatic product hubs—Jiangmen, Foshan, Zhuhai, and Zhongshan, all within the GBA—drive significant demand for aquaculture feed. Additionally, 61.27 Gg of phosphorus (33% of the external P input) was directly supplied to the food consumption sector, reflecting the high urbanization level and large population in the GBA, where local agricultural production cannot fully meet the food demands of residents. The phosphorus input into the crop production sector in the form of chemical fertilizers and pesticides was 37.6 Gg, accounting for 20% of the total external phosphorus input.
The food system of the GBA heavily relies on external phosphorus resources, making it vulnerable to fluctuations in the global phosphorus market (Yang et al., 2019), posing potential food security risks. Guangdong, as the largest aquaculture production area in China (accounting for 14.3% of the national total), has a high demand for feed, especially in cities like Jiangmen, Foshan, Zhuhai, and Zhongshan, which exacerbates the region’s dependence on external phosphorus resources. Moreover, the phosphorus recycling rate is only 7.89%, indicating a very low proportion of phosphorus that can be recycled from waste (Huang et al., 2019), leading to significant resource waste. This low recovery rate further intensifies the region’s reliance on external phosphorus supplies and places additional pressure on the environment (Zhang et al., 2023). Therefore, future efforts should focus on improving the efficient use and recycling technologies of phosphorus resources to reduce external dependence and promote the sustainable development of the regional food system.
The total phosphorus output from the food system in GBA to the environment is as high as 105.62 Gg, of which 80.63 Gg of phosphorus is lost to the soil, accounting for 76% of the total discharge. The remaining 25Gg of phosphorus is lost to water bodies, accounting for 24% of the total discharge. The phosphorus entering the soil mainly comes from the solid waste disposal sector, which is 75.42 Gg, accounting for 93.5% of soil phosphorus loss. Within the solid waste disposal sector, phosphorus primarily originates from sludge in wastewater treatment, kitchen waste from food consumption, and food processing waste. It ultimately enters the soil through incineration and landfilling. Phosphorus entering water bodies primarily originates from the aquaculture sector (10.21 Gg, accounting for 40.9% of the loss), followed by effluent from the wastewater treatment sector (6.04 Gg, 24.2% of the loss).
The total phosphorus accumulation in the food system of the GBA amounts to 81.37 Gg, with the majority accumulating in the aquaculture and crop production sectors, accounting for 61.9 and 23.5% of the total accumulation, respectively. Specifically, 50.33 Gg of phosphorus accumulates in aquaculture sediment, while 19.14 Gg accumulates in agricultural soils. The aquaculture-derived P accumulation primarily originates from unconsumed feed inputs and metabolic waste excretion. The sediment–water interface exhibits dynamic P migration patterns governed by multiple environmental parameters, including thermal stratification, pH variations, and dissolved oxygen gradients (Ye and Shu, 2021). Additionally, the enrichment of organic matter in sediments can lead to bottom oxygen depletion, thereby promoting a significant increase in ammonia-oxidizing bacteria. This consequently results in elevated levels of ammonium and nitrite in water bodies, causing toxic effects on aquatic organisms (Liu et al., 2018).
In 2020, the PUE in the crop production, animal husbandry, and aquaculture sectors of the GBA was 48.8, 32.37, and 10.01%, respectively. Compared to the findings of Chen et al. (2021), the PUE values for the crop production and animal husbandry sectors were higher than those reported in 2017 (33 and 27.8%, respectively). The PUE values for crop production and animal husbandry are comparable at China’s national levels of 36–41% and 21–37.95%, respectively (Liu et al., 2016; Wu et al., 2015; Ma et al., 2010). In contrast, the PUE of the aquaculture sector was lower than that reported by Chen et al. (2021) (26.7%). The improvement in PUE for the crop production and animal husbandry sectors may be attributed to government policies targeting both pollution source reduction (e.g., fertilizer quotas) and end-of-pipe treatment (e.g., wastewater regulations). For instance, the Three-Year Action Plan for Pollution Prevention and Control in Guangdong Province (2018–2020) promoted the reduction of agricultural non-point source pollution, and the World Bank Loan-funded Guangdong Agricultural Non-Point Source Pollution Control Project (2020) aimed to reduce the application of fertilizers and pesticides within the project areas. The significant discrepancy in aquaculture PUE is primarily due to differences in the calculation methods of feed conversion efficiency. This study refined the feed conversion ratios and phosphorus content for different aquaculture species, resulting in findings that align more closely with the national aquaculture PUE range of 8.7 to 21.2% in China (Zhang et al., 2015; Huang et al., 2019).
3.2 Distribution patterns and regional characteristics of phosphorus metabolism
Figure 3 provides a detailed overview of the external phosphorus inputs across cities in the GBA. Jiangmen has the highest external phosphorus input, reaching 33.29 Gg, 61% of which is directed to the aquaculture sector as feed. This highlights Jiangmen’s large-scale aquaculture industry, which accounts for 22% of the total aquaculture production in the GBA. Guangzhou follows with an external phosphorus input of 31.37 Gg, 46% of which is allocated to the food consumption sector, underscoring the city’s limited local agricultural production and heavy reliance on external food supplies. Zhaoqing, which has an external phosphorus input of 28.88 Gg, allocates 45% of this input to the crop production sector in the form of fertilizers, reflecting its agricultural advantage given that its arable land constitutes 26% of the GBA’s total. In cities such as Foshan, Zhuhai, and Zhongshan, which are major aquaculture hubs, external phosphorus inputs are primarily directed to the aquaculture sector. In contrast, in consumer-oriented cities such as Shenzhen, Dongguan, Hong Kong, Macao, and Guangzhou, external phosphorus inputs are mainly allocated to food consumption sector. In terms of food consumption, 90% of the phosphorus demand in Shenzhen, Dongguan, Hong Kong, and Macao relies on external inputs, indicating a high dependence on external food sources. Conversely, Jiangmen and Zhaoqing have sufficient local food phosphorus supply to meet their demand, with surplus available for export to other cities. The differences in phosphorus input structures across GBA cities reflect their distinct industrial characteristics and urbanization levels. Zhaoqing and Jiangmen have the highest contributions of primary industry to their GDP, at 18.9 and 8.6% respectively, whereas in Shenzhen, Dongguan, Hong Kong, and Macao, this contribution is below 2%. Moreover, the urbanization levels of Zhaoqing and Jiangmen are the lowest in the GBA, at 51 and 68%, respectively, whereas the urbanization levels of Shenzhen, Dongguan, Hong Kong, and Macao exceed 90%.
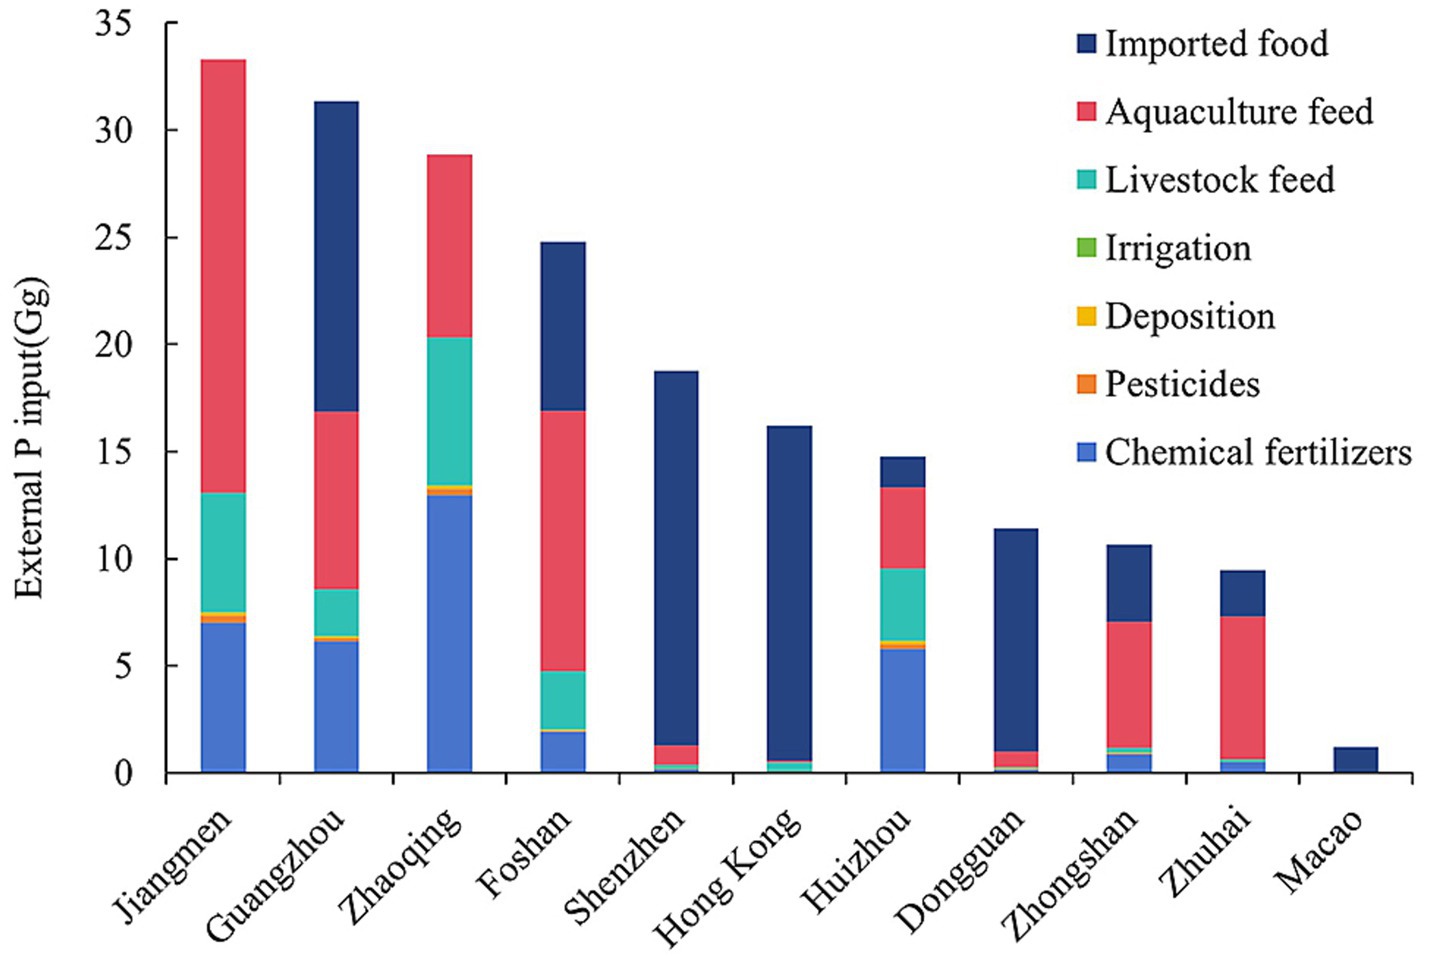
Figure 3. External P input by city in the GBA, 2020.
The total phosphorus (P) losses across cities in the GBA are illustrated in Figure 4A. Guangzhou exhibits the highest phosphorus loss, with emissions reaching 19.07 Gg, accounting for 18% of the total P emissions in the GBA. Shenzhen follows with 16.18 Gg, contributing 15%, while Macao has the lowest P loss at only 1.08 Gg, representing 1% of the total.
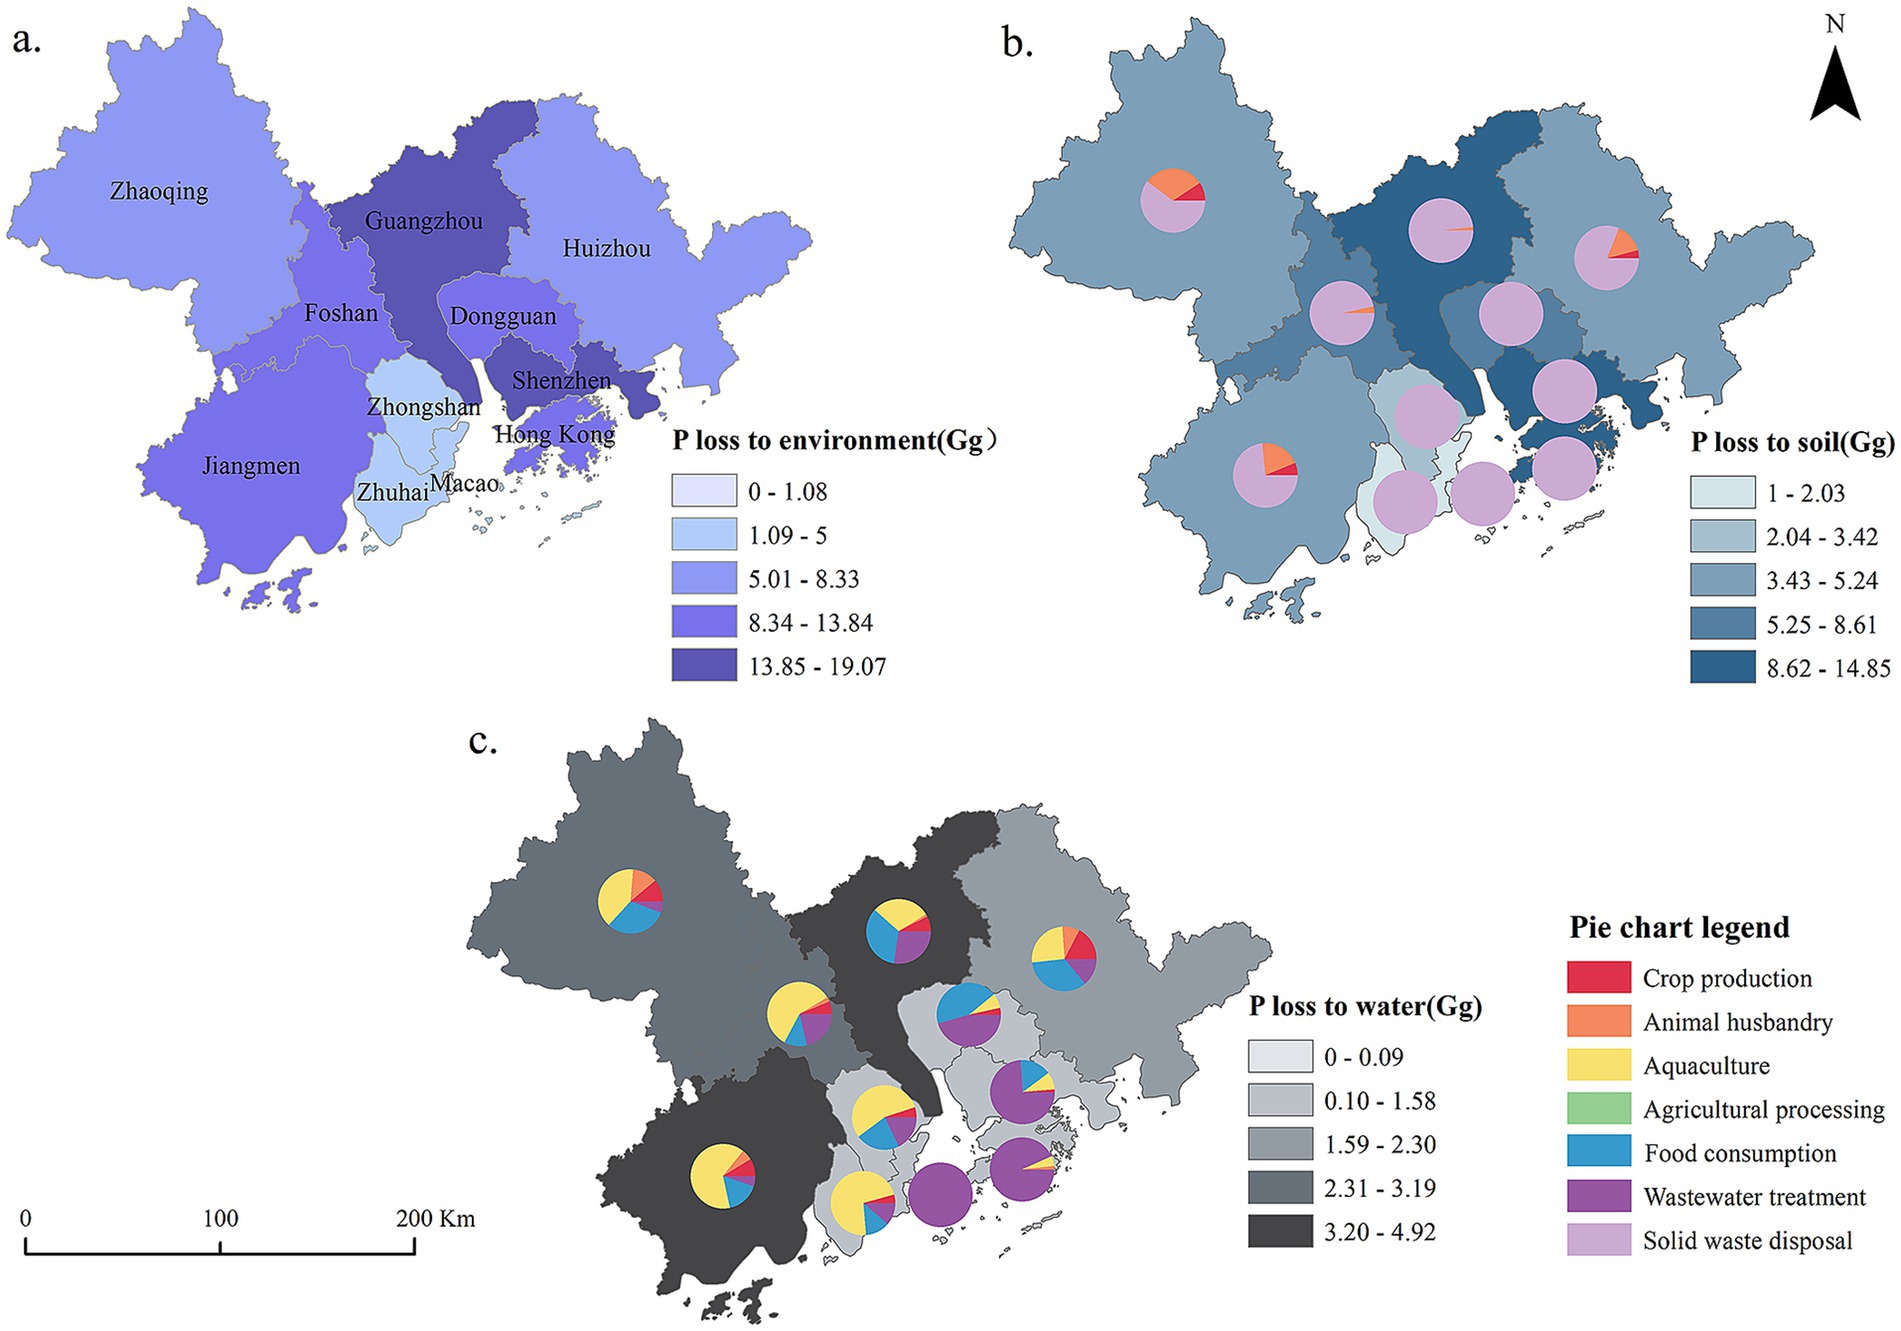
Figure 4. Distribution of phosphorus loss by city in the GBA, 2020 (A) P loss to environment; (B) P loss to soil; (C) P loss to water.
As shown in Figure 4B, phosphorus losses to soil are closely related to urban population size. In densely populated cities such as Guangzhou, Shenzhen, Dongguan, Foshan, and Hong Kong, P emissions to soil are primarily attributed to solid waste management practices, including incineration and landfill disposal. In contrast, in food production-oriented cities such as Jiangmen and Zhaoqing, a considerable proportion of phosphorus loss originates from the animal husbandry sector, mainly due to the landfilling of untreated animal manure.
Figure 4C depicts phosphorus losses to water bodies, which exhibit a spatial pattern where upstream cities experience higher P losses compared to downstream areas. In aquaculture-intensive cities such as Jiangmen, Foshan, Zhaoqing, Zhongshan, and Zhuhai, aquaculture wastewater is the primary contributor to waterborne phosphorus pollution. On the other hand, in food consumption-oriented cities such as Shenzhen, Dongguan, Hong Kong, and Macao, the main source of P emissions to water bodies is the effluent from wastewater treatment plants.
Phosphorus emission management in the GBA varies significantly between food production-oriented and food consumption-oriented cities. In cities such as Jiangmen and Zhaoqing, which resemble typical agricultural regions (Huang et al., 2019; Huang et al., 2019; Xu et al., 2016), major sources of phosphorus emissions include aquaculture wastewater, animal manure, and agricultural runoff, largely driven by excessive feed input and fertilizer application. Effective mitigation measures include optimizing feed utilization efficiency, promoting aquaculture tailwater treatment technologies, and implementing precision fertilization and manure recycling. In contrast, in food consumption-oriented cities such as Shenzhen, Hong Kong, and Macao, similar to international cities such as Paris (Esculier et al., 2019) and Dar es Salaam (Xiong et al., 2020), phosphorus emissions mainly stem from municipal solid waste and wastewater treatment systems. Enhancing phosphorus removal processes in wastewater treatment plants and promoting food waste recycling are effective strategies to reduce phosphorus emissions in these cities.
As shown in Figure 5, the average phosphorus (P) emissions per unit area across the GBA are 18.89 kg/ha. Notably, Shenzhen, Hong Kong, and Macao exhibit phosphorus emission intensities that are more than four times higher than the regional average, while Jiangmen, Zhaoqing, and Huizhou demonstrate lower emissions compared to the GBA average, highlighting significant intercity variations. The spatial distribution of phosphorus emission intensities presents a pattern of high values in the central region and lower values in the surrounding areas. The high-emission areas are primarily concentrated in the food consumption-oriented central cities of the GBA. The observed trends can be attributed to several interrelated factors, notably constrained urban areas coupled with high population density and intensive economic activities, as well as limited agricultural production capacity. These conditions collectively impede local phosphorus recycling efforts, creating a challenge in achieving reuse within the same city. Specifically, higher population density exacerbates phosphorus emissions at the consumption end, while smaller urban areas and limited agricultural output further complicate local phosphorus recovery. This combination of factors results in significant barriers to regional phosphorus reuse.
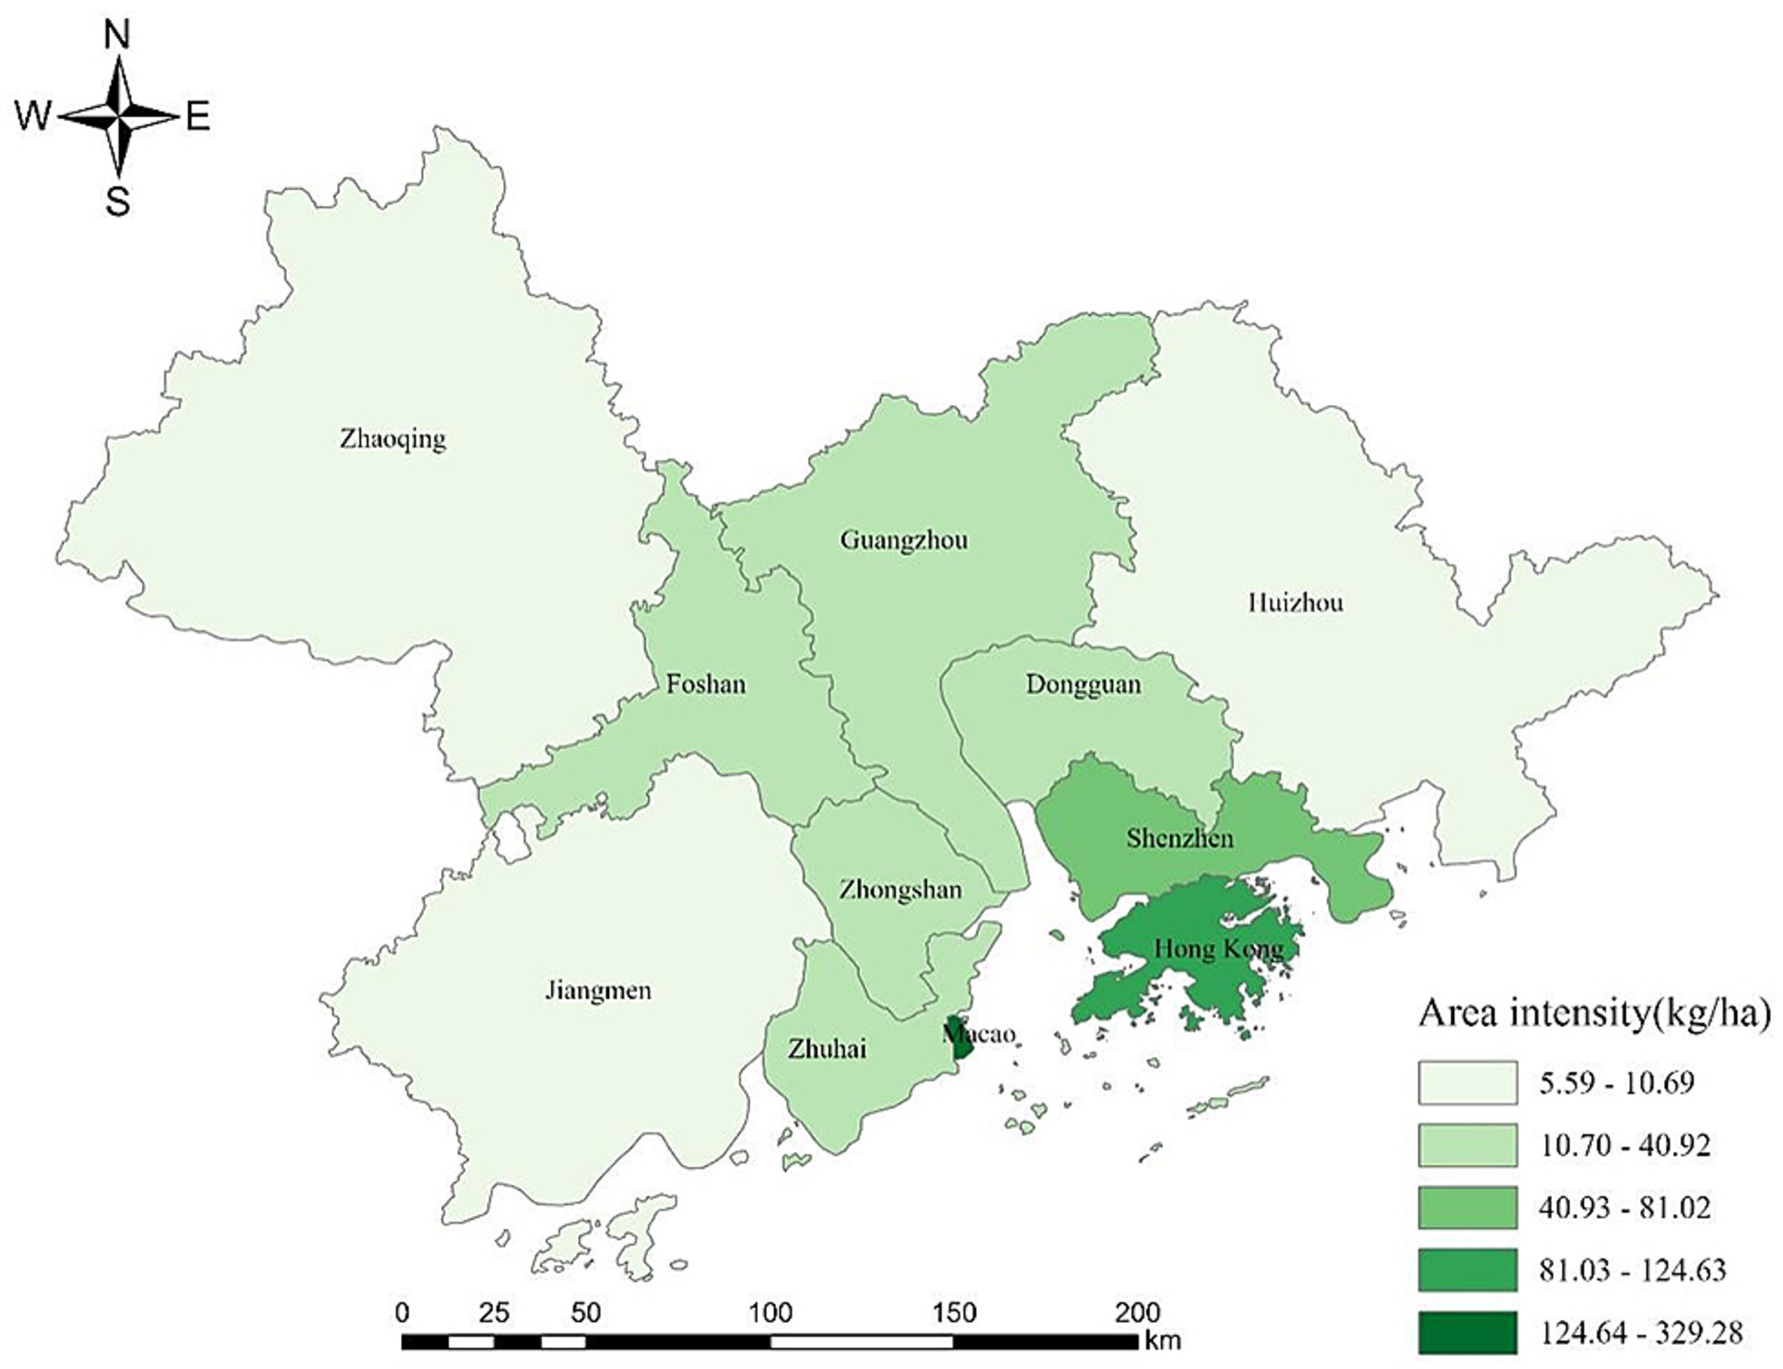
Figure 5. Distribution of area intensity of phosphorus loss by city in the GBA in 2020.
3.3 Policy implications
Phosphorus (P) management in the food system of the GBA is a complex and systematic endeavor. The metabolic processes of high-density P consumption and high-intensity P pollution emissions occur within various sectors of the food system, while P undergoes migration and transformation between these sectors. Additionally, the continuous spatial interactions among cities further shape an interdependent and highly interactive P metabolism system across the region. Based on the research findings, this study proposes policy recommendations at three levels: within sectors, between sectors, and among cities in the GBA food system.
First, priority should be given to addressing P emissions in key sectors. Regarding P losses to water bodies, the aquaculture sector has the lowest phosphorus use efficiency (PUE) at only 10.01%, indicating substantial P losses. Optimizing feed conversion ratios, reducing excess feed inputs, and improving aquaculture techniques are essential to mitigate environmental impacts. For instance, in freshwater aquaculture, site-specific tailwater treatment systems such as the “three-pond-two-dam” system, the “two-dam-three-zone” system, and the rice field coupling system can achieve total phosphorus (TP) removal rates of 50, 99.3, and 32%, respectively (Chen et al., 2023). Implementing recirculating aquaculture systems, integrating permitted aquaculture production with reduced feed usage, and promoting new business models where farms use waste as fertilizer for vegetable cultivation can also be effective strategies (Nielsen et al., 2016). Regarding P losses to soil, sewage sludge from wastewater treatment plants constitutes the largest source of P emissions from the solid waste disposal sector. Phosphorus recovery can be achieved from sludge dewatering effluent, digested concentrated sludge, and incineration fly ash (Lin et al., 2022).
Second, efforts should be intensified to enhance food waste recycling, thereby replacing a portion of chemical fertilizers with organic fertilizers. Food waste is also a significant source of P in the solid waste disposal sector. By adopting microbial aerobic fermentation techniques, organic fertilizers can be produced with a P recovery rate of 49.7% (Fang et al., 2023). If implemented, this approach could recover 8.52 Gg of P from solid waste disposal, which could then be applied to the crop production sector, potentially reducing chemical P fertilizer inputs by 24%.
Finally, the GBA should be regarded as an integrated whole, and intercity collaboration is essential. Cities such as Zhaoqing and Jiangmen serve as major food production hubs within the regional division of labor and bear the environmental pressure of intensive agricultural activities imposed by food consumption-oriented cities, posing a significant threat to soil quality. Moreover, runoff carrying soil pollutants, leaching, and aquaculture water exchange continuously contribute to the risk of eutrophication in downstream water bodies (Cross-media, 2022), undermining the overall environmental quality of the GBA. Thus, food production-oriented cities such as Zhaoqing and Jiangmen should adopt measures such as precision fertilization, establishing buffer zones, and applying stubble mulching tillage techniques to effectively reduce non-point source P pollution and prevent pollution transfer to downstream cities (Li et al., 2020). On the other hand, consumption-oriented cities have limited primary industry capacity and lack application scenarios for resource-based P waste utilization. Transferring organic waste from consumption-oriented cities to production-oriented cities for resource recovery could further enhance the overall P management efficiency of the GBA.
4 Conclusion
This study provides a comprehensive analysis of phosphorus metabolism in the food system of the GBA, revealing its heavy reliance on external phosphorus inputs and significant phosphorus losses to the environment. In 2020, the total phosphorus input to the GBA was 187.69 Gg, with 36% directed to aquaculture and 33% to food consumption. The phosphorus recycling rate was only 7.89%, while 76% of phosphorus losses were to soil and 24% to water bodies, thereby imposing notable environmental pressures. The study also highlights distinct phosphorus metabolism patterns between production-oriented cities (e.g., Jiangmen and Zhaoqing) and consumption-oriented cities (e.g., Shenzhen and Hong Kong). These findings offer new insights into phosphorus dynamics in urban agglomerations and provide a basis for optimizing resource use and reducing environmental pollution. The research underscores the importance of cross-city collaboration and multi-sectoral coordination for sustainable phosphorus management.
However, the study has limitations, such as issues with data precision and its focus on a single year, which constrain the assessment of temporal dynamics and the generalizability of the results. Future research should explore phosphorus recovery technologies, evaluate the long-term impacts of policy interventions, and examine the potential of behavioral changes in phosphorus management. Additionally, policy recommendations include strengthening cooperation between production-oriented and consumption-oriented cities and promoting phosphorus recycling along with sustainable agricultural practices to achieve regional phosphorus sustainability.
Data availability statement
The original contributions presented in the study are included in the article/Supplementary material, further inquiries can be directed to the corresponding author.
Author contributions
YL: Writing – review & editing, Writing – original draft. WH: Writing – original draft, Writing – review & editing. SC: Funding acquisition, Writing – review & editing, Conceptualization. JD: Formal analysis, Data curation, Writing – review & editing. YZ: Writing – review & editing, Formal Analysis. YH: Conceptualization, Writing – review & editing. BG: Conceptualization, Writing – review & editing.
Funding
The author(s) declare that financial support was received for the research and/or publication of this article. This work was supported by the grants from national Key R&D Program of China (2022YFF1301201) and the International (Regional) Cooperation and Exchange Program, the National Natural Science Foundation of China (32261143730).
Conflict of interest
The authors declare that the research was conducted in the absence of any commercial or financial relationships that could be construed as a potential conflict of interest.
Generative AI statement
The authors declare that no Gen AI was used in the creation of this manuscript.
Publisher’s note
All claims expressed in this article are solely those of the authors and do not necessarily represent those of their affiliated organizations, or those of the publisher, the editors and the reviewers. Any product that may be evaluated in this article, or claim that may be made by its manufacturer, is not guaranteed or endorsed by the publisher.
Supplementary material
The Supplementary material for this article can be found online at: https://www.frontiersin.org/articles/10.3389/fsufs.2025.1613137/full#supplementary-material
References
Biswas Chowdhury, R., and Zhang, X. (2021). Phosphorus use efficiency in agricultural systems: a comprehensive assessment through the review of national scale substance flow analyses. Ecol. Indic. 121:107172. doi: 10.1016/j.ecolind.2020.107172
Bouwman, L., Goldewijk, K. K., Van Der Hoek, K. W., Beusen, A. H. W., Van Vuuren, D. P., Willems, J., et al. (2013). Exploring global changes in nitrogen and phosphorus cycles in agriculture induced by livestock production over the 1900–2050 period. Proc. Natl. Acad. Sci. USA 110, 20882–20887. doi: 10.1073/pnas.1012878108
Carpenter, S. R., and Bennett, E. M. (2011). Reconsideration of the planetary boundary for phosphorus. Environ. Res. Lett. 6:4009. doi: 10.1088/1748-9326/6/1/014009
Chen, X., Li, W., Li, M., Cai, Z., Gong, H., and Yan, M. (2023). Advance on three common aquaculture tailwater treatment technologies. Fisheries Science Technology Information 50, 194–200. doi: 10.16446/j.fsti.20210500116
Chen, C., Wen, Z., Sheng, N., and Song, Q. (2024). Uneven agricultural contraction within fast-urbanizing urban agglomeration decreases the nitrogen use efficiency of crop production. Nat Food 5, 390–401. doi: 10.1038/s43016-024-00980-5
Chen, C., Yao, Z., Wen, Z., and Sheng, N. (2021). Impact of city characteristics on its phosphorus metabolism in the bay area: a comparative analysis of cities in the Greater Bay Area of China. J. Clean. Prod. 286:124925. doi: 10.1016/j.jclepro.2020.124925
Conley, D. J., Paerl, H. W., Howarth, R. W., Boesch, D. F., Seitzinger, S. P., Havens, K. E., et al. (2009). Controlling eutrophication: nitrogen and phosphorus. Science 323, 1014–1015. doi: 10.1126/science.1167755
Cross-media, Chen C. Metabolism of C, N, and P and Coordinated Pollution Control paths in Guangdong-Hong Kong-Macao Greater Bay Area. [Doctoral dissertation]. Beijing, China: Tsinghua University. (2022). 166.
Esculier, F., Le Noë, J., Barles, S., Billen, G., Créno, B., Garnier, J., et al. (2019). The biogeochemical imprint of human metabolism in Paris megacity: a regionalized analysis of a water-agro-food system. J. Hydrol. 573, 1028–1045. doi: 10.1016/j.jhydrol.2018.02.043
Fang, X., Gao, B., Zhong, D., Wang, L., Borrion, A., Huang, W., et al. (2023). Closing the food waste loop: analysis of the agronomic performance and potential of food waste disposal products. J. Clean. Prod. 382:135174. doi: 10.1016/j.jclepro.2022.135174
Gu, B., Ju, X., Chang, J., Ge, Y., and Vitousek, P. M. (2015). Integrated reactive nitrogen budgets and future trends in China. Proc. Natl. Acad. Sci. 112, 8792–8797. doi: 10.1073/pnas.1510211112
Guangdong Provincial Department of Ecology and Environment. (2020). Report on the state of Guangdong provincial ecology and environment. Available online at: https://gdee.gd.gov.cn/hjzkgb/content/post_3266052.html (Accessed June 23, 2025).
Guo, Z., Chen, S. S., Xiong, C., Mkumbo, A. C., Gao, Q., Shen, Q., et al. (2024). Conjoint analysis of nitrogen and phosphorus metabolism in urban system: a case study of Dar Es Salaam, Tanzania. J. Ind. Ecol. 28, 768–782. doi: 10.1111/jiec.13492
Huang, W., Gao, B., Huang, Y., Zhang, Z., Xu, S., Xu, L., et al. (2019). Transforming nitrogen management of the urban food system in a food-sink city. J. Environ. Manag. 249:109180. doi: 10.1016/j.jenvman.2019.06.081
Huang, C.-L., Gao, B., Xu, S., Huang, Y., Yan, X., and Cui, S. (2019). Changing phosphorus metabolism of a global aquaculture city. J. Clean. Prod. 225, 1118–1133. doi: 10.1016/j.jclepro.2019.03.298
Huang, C.-L., Qu, S., Gao, B., Huang, Y., Fang, H., Yan, X., et al. (2019). Effects of urbanization on phosphorus metabolism in a typical agricultural area. J. Clean. Prod. 214, 803–815. doi: 10.1016/j.jclepro.2019.01.008
Koppelaar, R. H. E. M., and Weikard, H. P. (2013). Assessing phosphate rock depletion and phosphorus recycling options. Glob. Environ. Change 23, 1454–1466. doi: 10.1016/j.gloenvcha.2013.09.002
Li, W., Zhe, C., Hui-ying, L., and Dun-qiu, W. (2020). Simulation of nitrogen and phosphorus pollution in typical agricultural and forested basins as well as relevant reduction effect based on SWAT model. Water Supply 21, 992–1004. doi: 10.2166/ws.2020.237
Lin, L., Hu, W., and Wang, L. (2022). Phosphorus recovery techniques review and application prospect in municipal wastewater and sludge:taking Shanghai as an example. Water Wastewater Eng. 58, 23–30. doi: 10.13789/j.cnki.wwe1964.2021.06.18.0004
Liu, D., Bai, L., Li, X., Zhang, Y., Qiao, Q., Lu, Z., et al. (2022). Spatial characteristics and driving forces of anthropogenic phosphorus emissions in the Yangtze River Economic Belt, China. Resour. Conserv. Recycling 176:105937. doi: 10.1016/j.resconrec.2021.105937
Liu, X., Sheng, H., Jiang, S., Yuan, Z., Zhang, C., and Elser, J. J. (2016). Intensification of phosphorus cycling in China since the 1600s. Proc. Natl. Acad. Sci. 113, 2609–2614. doi: 10.1073/pnas.1519554113
Liu, G., Xu, P., Wu, T., Xu, Z., and Xu, G. (2018). Present condition of aquaculture nitrogen and phosphorus environmental pollution and future development strategy. Jiangsu J. Agric. Sci. 34, 225–233.
Ma, L., Ma, W. Q., Velthof, G. L., Wang, F. H., Qin, W., Zhang, F. S., et al. (2010). Modeling nutrient flows in the food chain of China. J of Env Quality 39, 1279–1289. doi: 10.2134/jeq2009.0403
Nielsen, R., Asche, F., and Nielsen, M. (2016). Restructuring European freshwater aquaculture from family-owned to large-scale firms – lessons from Danish aquaculture. Aquac. Res. 47, 3852–3866. doi: 10.1111/are.12836
Roy, B. B., Biswas Chowdhury, R., Baroi, A. R., Rahman, S., Powers, S. M., Milne, N., et al. (2019). Unravelling the anthropogenic pathways of phosphorus in the food production and consumption system of Bangladesh through the lens of substance flow analysis. J. Ind. Ecol. 23, 1439–1455. doi: 10.1111/jiec.12935
Tasmeea, T., Roy, B. B., Chowdhury, R. B., Hossain, M. M., and Sujauddin, M. (2021). Urban metabolism of phosphorus in the food production-consumption system of Bangladesh. J. Environ. Manag. 292:112715. doi: 10.1016/j.jenvman.2021.112715
Wu, H., Yuan, Z., Gao, L., Zhang, L., and Zhang, Y. (2015). Life-cycle phosphorus management of the crop production–consumption system in China, 1980–2012. Sci. Total Environ. 502, 706–721. doi: 10.1016/j.scitotenv.2014.09.056
Xiong, C., Guo, Z., Chen, S. S., Gao, Q., Kishe, M. A., and Shen, Q. (2020). Understanding the pathway of phosphorus metabolism in urban household consumption system: a case study of Dar Es Salaam, Tanzania. J. Clean. Prod. 274:122874. doi: 10.1016/j.jclepro.2020.122874
Xu, S., Huang, Y., Gao, B., Huang, W., and Cui, S. (2016). Study on phosphorus footprint of urban food: a case study in Longyan City. Acta Ecol. Sin. 36, 7279–7287. doi: 10.5846/stxb201601010001
Yang, H., Liu, Y., Liu, J., Meng, J., Hu, X., and Tao, S. (2019). Improving the imbalanced global supply chain of phosphorus fertilizers. Earths Future 7, 638–651. doi: 10.1029/2018EF001005
Yang, M., and Zhang, Y. (2023). Food processing as the dominant contributor of phosphorus output in nearly half of China’s regions. Resour. Conserv. Recycling 198:107178. doi: 10.1016/j.resconrec.2023.107178
Ye, S., and Shu, X. (2021). Migration and transformation of phosphorus in polluted water in sediment-water. Hans J Agricul. Sci. 11:974. doi: 10.12677/HJAS.2021.1111130
Yuan, Z., Ji, J., Sheng, H., Jiang, S., Chen, T., Liu, X., et al. (2019). Animal based diets and environment: perspective from phosphorus flow quantifications of livestock and poultry raising in China. J. Environ. Manag. 244, 199–207. doi: 10.1016/j.jenvman.2019.04.028
Zhang, Y., Bleeker, A., and Liu, J. (2015). Nutrient discharge from China’s aquaculture industry and associated environmental impacts. Environ. Res. Lett. 10:045002. doi: 10.1088/1748-9326/10/4/045002
Zhang, W., Chen, X., Ma, L., Deng, Y., Cao, N., Xiao, R., et al. (2023). Re-prediction of phosphate fertilizer demand in China based on agriculture green development. Acta Pedol. Sin. 60, 1389–1397.
Keywords: phosphorus metabolism, food system, Guangdong-Hong Kong-Macao Greater Bay Area, urban agglomeration, substance flow analysis
Citation: Lu Y, Huang W, Cui S, Deng J, Zhang Y, Huang Y and Gao B (2025) Phosphorus metabolism of the food system in the Guangdong-Hong Kong-Macao Greater Bay Area urban agglomeration. Front. Sustain. Food Syst. 9:1613137. doi: 10.3389/fsufs.2025.1613137
Edited by:
Amélia Delgado, University of Algarve, PortugalReviewed by:
Yuanchao Hu, Wuhan University, ChinaChen Chen, The University of Hong Kong, Hong Kong SAR, China
Copyright © 2025 Lu, Huang, Cui, Deng, Zhang, Huang and Gao. This is an open-access article distributed under the terms of the Creative Commons Attribution License (CC BY). The use, distribution or reproduction in other forums is permitted, provided the original author(s) and the copyright owner(s) are credited and that the original publication in this journal is cited, in accordance with accepted academic practice. No use, distribution or reproduction is permitted which does not comply with these terms.
*Correspondence: Wei Huang, d2h1YW5nQGl1ZS5hYy5jbg==; Bing Gao, QmluZ2dhb0BpdWUuYWMuY24=