 Liping Liu
 Bin Zheng
 Junye Zhao
 Shuai Hao
- 1Agricultural Information Institute, Chinese Academy of Agricultural Sciences, Beijing, China
- 2Institute of Agricultural Economics and Development, Chinese Academy of Agricultural Sciences, Beijing, China
Improving production efficiency and promoting green transformation are essential pathways toward ensuring food security and advancing sustainable agricultural development. This study focused on 15 major wheat-producing provinces in China and employed a three-stage DEA-GML model to measure the green total factor productivity (GTFP) of wheat from 2004 to 2022, adjusting for environmental variables and random disturbances. The evolution and spatial dynamics of GTFP were further examined using both global and local Moran’s I indices, along with kernel density estimation. The study produced the following results: (1) After adjusting with the three-stage DEA–GML model, the average GTFP of major wheat-producing areas was 1.006, lower than the first-stage unadjusted mean of 1.028. This indicates that eliminating the influence of external environmental factors and random errors enhances the robustness and scientific validity of the efficiency estimates. (2) Over time, the adjusted GTFP of wheat exhibited a fluctuating upward trend, with technological progress (TC) contributing slightly more to GTFP growth than technical efficiency (EC). At the regional level, the Huang-Huai-Hai wheat advantage zone achieved the highest average GTFP of 1.016, with strong performance in both EC and TC. In contrast, the Southwest wheat zone recorded the lowest average GTFP of 0.986, where lagging technological progress constrained overall efficiency. (3) Spatial analysis revealed significant positive spatial autocorrelation in wheat GTFP from 2005 to 2012, followed by a weakening of spatial clustering and an expansion of interregional disparities after 2012. Kernel density analysis further showed that the distribution of wheat GTFP evolved from a unimodal to a bimodal or multimodal pattern, indicating an intensifying spatial divergence in green production efficiency. These findings provide valuable insights for enhancing wheat productivity and advancing the green transformation of agriculture.
1 Introduction
With the continuous advancement of ecological civilization, China’s agricultural development is gradually shifting from a yield-oriented paradigm to one that emphasizes green and high-efficiency growth. As a resource-intensive sector, agriculture plays a vital role in ensuring food security and supporting economic development, yet it also faces significant challenges, including excessive resource exploitation, non-point source pollution, and ecological degradation. In response, the Chinese government has introduced a series of measures to curb agricultural non-point source pollution and energy consumption, aiming to achieve a balance between environmental sustainability and output growth. The 14th Five-Year Plan mandates that by 2025 the use of chemical fertilizers for major crops must experience zero or negative growth, while pesticide application should continue to decline. Against this context of high-quality agricultural development, characterized by both quantity expansion and quality enhancement, methods for effectively improving agricultural green total factor productivity (GTFP) and achieving the dual goals of production efficiency and environmental protection have become a central concern for China’s agricultural sector (Huang et al., 2022; Xu et al., 2019).
Traditional total factor productivity (TFP) models often emphasize gains in efficiency through increased inputs, such as labor and capital, while overlooking issues related to resource depletion and environmental pollution. Green total factor productivity offers a more comprehensive metric for evaluating agricultural performance. It extends beyond the conventional input–output relationship of TFP by incorporating resource use and environmental impacts into the measurement framework (Lin and Chen, 2018). This approach provides a more accurate reflection of both productivity and sustainability, highlighting environmental friendliness and the efficient use of resources (He and Han, 2024; Liu and Feng, 2019). Existing studies on agricultural GTFP have primarily employed conventional DEA and stochastic frontier analysis (SFA) methods (Li et al., 2017; Liu et al., 2021). Although widely applied, these models often fail to account for external environmental conditions and stochastic disturbances adequately, resulting in substantial deviations between measured and actual efficiency (Adamie et al., 2019). In contrast, the three-stage DEA model improves estimation accuracy by optimizing slack variables and eliminating the influence of external environmental factors, thereby correcting data asymmetries and random noise (Zhang et al., 2017; Yin et al., 2019).
In the context of agricultural green transformation, wheat as one of China’s three staple food crops, plays a pivotal role in ensuring national food security and advancing ecological civilization. With wide geographic coverage, high yield, and strong adaptability, wheat serves as a cornerstone of both the food supply and emergency reserve systems in China (Zhang et al., 2023). In recent years, supported by technological advancements and favorable policies, China’s wheat output has increased steadily. According to data from the National Bureau of Statistics, the total wheat production in 2024 reached 140 million tons, accounting for 17.6% of global output. However, the long-standing reliance on resource-intensive practices in wheat cultivation, characterized by excessive use of chemical fertilizers and pesticides and inefficient water utilization, have not only diminished farm profitability but also exacerbated agricultural non-point source pollution and greenhouse gas emissions, thereby constraining the sustainable development of the wheat sector.
Against this backdrop, there is an urgent need to assess wheat GTFP accurately using robust scientific methods, identify key drivers of efficiency improvement, and uncover regional disparities. Such insights are essential to inform evidence-based policymaking and guide the dissemination of green technologies. To this end, this study employed a three-stage Data Envelopment Analysis-Global Malmquist–Luenberger (DEA-GML) model based on panel data from 15 major wheat-producing provinces in China spanning the years 2004–2022. A comprehensive GTFP indicator system incorporating both fertilizer-induced non-point source pollution and carbon emissions associated with wheat production was constructed. Furthermore, global and local Moran’s I indices, along with kernel density estimation, were applied to evaluate the spatial and temporal evolution of wheat GTFP across regions in China systematically. The goal of the study was to provide a theoretical foundation and policy reference for promoting regionally differentiated strategies for green wheat development.
Compared with the results of existing studies, the main marginal contributions of this paper are as follows: (1) This study is the first to introduce the three-stage DEA-GML model into the measurement of wheat GTFP, thus addressing the limitations of conventional DEA models that confound environmental factors, random errors, and managerial inefficiency. By applying SFA in the second stage to isolate the influence of exogenous factors, the resulting efficiency estimates more closely reflect the true level of technical efficiency, thereby enhancing the scientific rigor of the results. (2) From the perspective of green development, this study incorporates carbon emissions and fertilizer-related non-point source pollution as undesirable outputs in constructing a more comprehensive GTFP indicator system for wheat. This approach better captures the ecological costs and environmental externalities embedded in the wheat production process and aligns with the growing emphasis of the national dual-carbon strategy on assessing green production efficiency. (3) Building on the efficiency estimates, the study further applies both global and local spatial autocorrelation indicators to identify spatial clustering and evolutionary patterns of wheat GTFP across different years. Kernel density estimation is also employed to trace the evolution of its distributional characteristics. This integrated analytical framework not only enriches the methodological dimensions of green TFP research but also provides more targeted theoretical support for regional policy design.
The remainder of this paper is organized as follows: Section 2 presents a brief review of the relevant literature, Section 3 describes the research methodology, Section 4 discusses variable selection and data sources, Section 5 reports the empirical results, which are followed by further discussion in Section 6. Finally, Section 7 concludes the paper and offers policy recommendations.
2 Literature review
2.1 Measurement methods for agricultural green total factor productivity
In recent years, green total factor productivity (GTFP) has received increasing attention in the field of agriculture (Grzelak et al., 2019; Liu et al., 2020; Fei and Lin, 2017). Compared to traditional total factor productivity (TFP), GTFP extends the conventional evaluation framework by incorporating unintended environmental impacts, such as pollution, into the analysis, thereby enabling a more accurate assessment of both economic efficiency and ecological performance in agricultural production (Luo et al., 2023).
Regarding the measurement of GTFP (see Table 1), the literature has evolved from static to dynamic approaches and from single-dimensional to multi-dimensional frameworks (Benedetti et al., 2019; Gong, 2018; Emrouznejad and Yang, 2018). Early studies primarily employed Data Envelopment Analysis (DEA) to assess GTFP (Fried et al., 2002; Chung et al., 1997), but the radial nature of traditional DEA models limited their ability to handle undesirable outputs and non-radial inputs effectively (Charnes et al., 1978). To address this shortcoming, alternative models such as the non-radial Slack-Based Measure (SBM) model (Tone, 2001) and the Directional Distance Function (DDF) were developed. To measure productivity changes dynamically, Chung et al. (1997) proposed the Malmquist–Luenberger (ML) index, which uses distance functions to capture efficiency variations (Chung et al., 1997). Pastor and Lovell (2005) further advanced this approach by developing a global benchmark method that constructs a unified frontier across all periods (Pastor and Lovell, 2005), leading to the Global Malmquist–Luenberger (GML) index (Oh, 2010). The GML index not only provides a more objective measurement of dynamic efficiency change but also enhances the stability of the results.
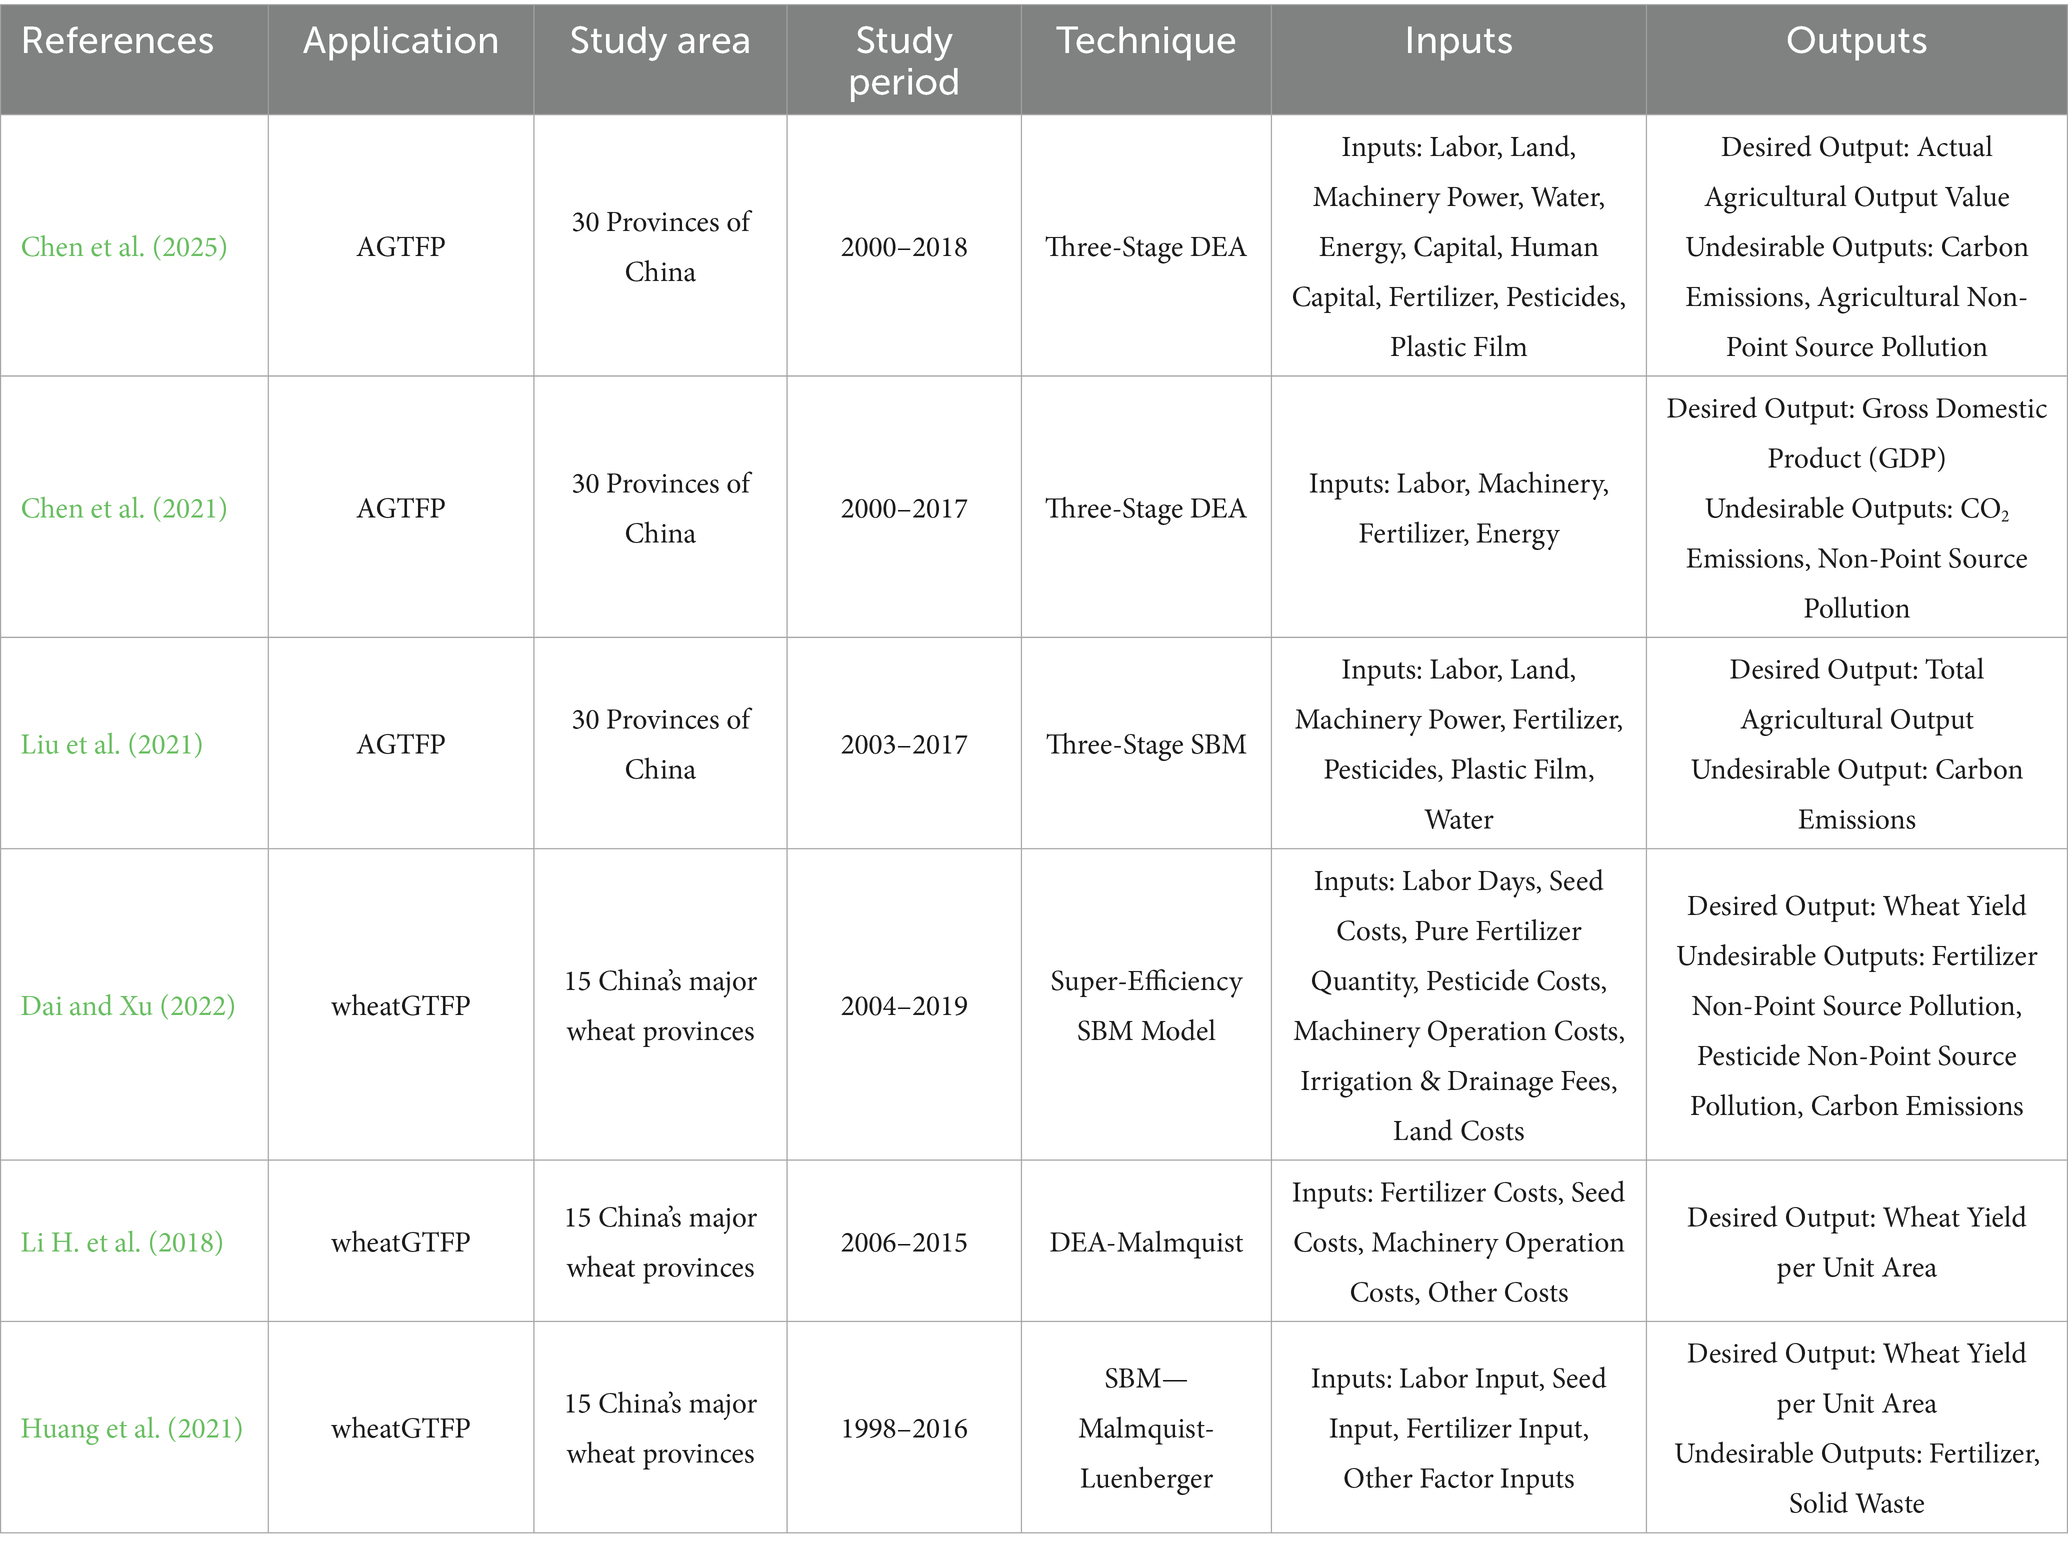
Table 1. Typical papers of AGTFP.
However, these methods are generally unable to eliminate the confounding effects of external environmental factors and random noise. To overcome this limitation, Fried et al. (2002) proposed the three-stage DEA model (Fried et al., 2002), which incorporates SFA to adjust the slack variables derived in the first stage (O’Donnell and Coelli, 2005). This approach effectively filters out the influence of environmental and stochastic disturbances, thereby improving the accuracy of efficiency measurement (Tone and Tsutsui, 2014). The three-stage DEA model has been widely applied to efficiency assessments across diverse sectors, including agriculture (Li H. S. et al., 2018), forestry (Lin and Ge, 2019), construction (Zhang et al., 2018), industry (Zhang et al., 2017), water resources (Lu and Xu, 2019), and energy (Zhao et al., 2019).
In the wheat sector, some studies have employed methods such as the super-efficiency SBM model to measure wheat production efficiency in China (Fei and Lin, 2017; Grzelak et al., 2019; Liu et al., 2020) and explore the effects of environmental regulations (Huang et al., 2021). Nevertheless, existing research on indicator system construction remains limited, as most studies have considered only agricultural carbon emissions (ACE) as a single undesirable output (West and Marland, 2002), neglecting the severe negative externalities of agricultural non-point source pollution (ANSP) on ecosystems (Liao et al., 2021; Liu et al., 2021). This omission restricts the comprehensiveness and precision of green efficiency evaluations (Li et al., 2011; Solomon, 2007). Therefore, it is necessary to build a more integrated undesirable output system within the three-stage DEA-GML framework by jointly incorporating carbon emissions and non-point source pollution, thereby enabling a more accurate assessment of the synergy between wheat production efficiency and ecological performance.
2.2 Spatial evolution of agricultural green total factor productivity
With the growing application of spatial econometric methods, increasing attention has been paid to the spatial distribution patterns, clustering characteristics, and dynamic transitions of agricultural GTFP (Areal et al., 2012). Existing studies commonly employ Exploratory Spatial Data Analysis (ESDA) techniques, particularly global and local Moran’s I indices, Local Indicators of Spatial Association (LISA) cluster maps, and hotspot analysis methods, which are effective in identifying spatial agglomeration and dispersion trends in agricultural efficiency (Zhang et al., 2021; Wang et al., 2025). For instance, Zhang et al. (2024) utilized a combination of tools including standard deviational ellipses and kernel density estimation to analyze the spatial distribution patterns of agricultural GTFP in China and trace their evolution across regions (Zhang et al., 2024).
However, much of the current literature on spatial analysis focuses on overall agriculture or aggregated crop productivity, and spatially explicit studies on the GTFP of specific crops such as wheat remain relatively underexplored. Dai and Xu (2022), using wheat as a case study, found significant spatial heterogeneity and regional disparities in GTFP growth trends through global GML index analysis (Dai and Xu, 2022). Lu et al. (2020) employed a DEA-ESDA framework to examine the spatiotemporal patterns of productivity for various crops in China, including corn, wheat, and aggregated grain (Lu et al., 2020). Nevertheless, these studies have yet to fully uncover the underlying spatial mechanisms and causal dynamics that drive regional differences. Thus, a deeper understanding of the spatial configuration and regional differentiation of green efficiency in the wheat sector holds not only theoretical importance but also practical significance. It provides a scientific foundation for the formulation and implementation of more targeted and region-specific agricultural policies that support sustainable development.
A review of the existing literature reveals that while substantial progress has been made in the study of GTFP, several important gaps remain to be addressed. (1) In terms of research perspective, prior studies on agricultural GTFP have primarily focused on the broader agricultural or grain sectors. As one of China’s three major staple crops, wheat is characterized by wide cultivation coverage, intensive input use, and a high dependency on fertilizers and irrigation. Its production model, resource demands, and ecological impacts differ substantially from those of other crops. Therefore, a specialized investigation into wheat GTFP not only enriches the theoretical framework of green productivity but also provides critical insights for crop-specific management and targeted policy design. (2) Regarding methodology, many existing studies have relied on single-stage DEA models or basic stochastic frontier analysis (SFA), often failing to account for the influence of environmental variables and random noise. This methodological limitation compromises the accuracy and robustness of the efficiency estimates, highlighting the need for more adaptive approaches such as the three-stage DEA model. (3) In terms of indicator selection, most studies focus on single pollutants or limited emission sources, which is insufficient to capture the complexity and heterogeneity of environmental impacts in crop production—especially for wheat. Under increasing climate pressures and environmental regulations, the incorporation and standardization of multi-source non-point pollutants and greenhouse gas emissions is necessary to more accurately reflect the true level of GTFP. (4) China’s regions exhibit considerable variation in climate conditions, agricultural endowments, and production technologies, resulting in pronounced spatial heterogeneity in wheat input–output efficiency and resource utilization patterns. Although spatial disparities in agricultural efficiency have begun to attract attention, there remains a lack of in-depth analysis on the spatial evolution of GTFP for individual crops.
Against this backdrop, this study employs panel data from 2004 to 2022 across 15 major wheat-producing provinces in China to construct a GTFP indicator system that incorporates both fertilizer-based non-point source pollution and carbon emissions. The three-stage DEA–GML model is applied to measure and analyze wheat GTFP. In addition, spatial analytical methods are introduced to examine the spatial clustering characteristics of wheat GTFP across provinces. The goal is to gain deeper insights into the spatiotemporal evolution of wheat GTFP in China and enhance the precision of decision-making for improving green productivity in the wheat sector.
3 Methods
3.1 Three-stage DEA-Malmquist model
Traditional Data Envelopment Analysis (DEA) methods are unable to distinguish technical inefficiency caused by environmental variation or random shocks, which often leads to biased measurement results. The three-stage DEA model addresses this limitation by incorporating stochastic frontier analysis (SFA), effectively eliminating the heterogeneity introduced by external environmental factors, random errors, and managerial inefficiency. This allows for a more accurate assessment of true productivity under multi-input and multi-output conditions by placing decision-making units under a common operating environment for comparison (Fried et al., 2002).
Accordingly, this study constructs a three-stage DEA–Global Malmquist–Luenberger (DEA–GML) model to evaluate the GTFP of wheat production in China. First, the Global Malmquist–Luenberger index is employed to compute the initial efficiency scores and slack variables based on the original dataset. Second, environmental variables are selected, and SFA regression is conducted to remove the influence of external environmental factors and random disturbances from the input variables. Finally, using the adjusted inputs and original outputs, the GML index is reapplied to calculate the actual production efficiency (Chung et al., 1997). Figure 1 presents the methodological framework for assessing wheat GTFP in China using the three-stage DEA–GML approach.
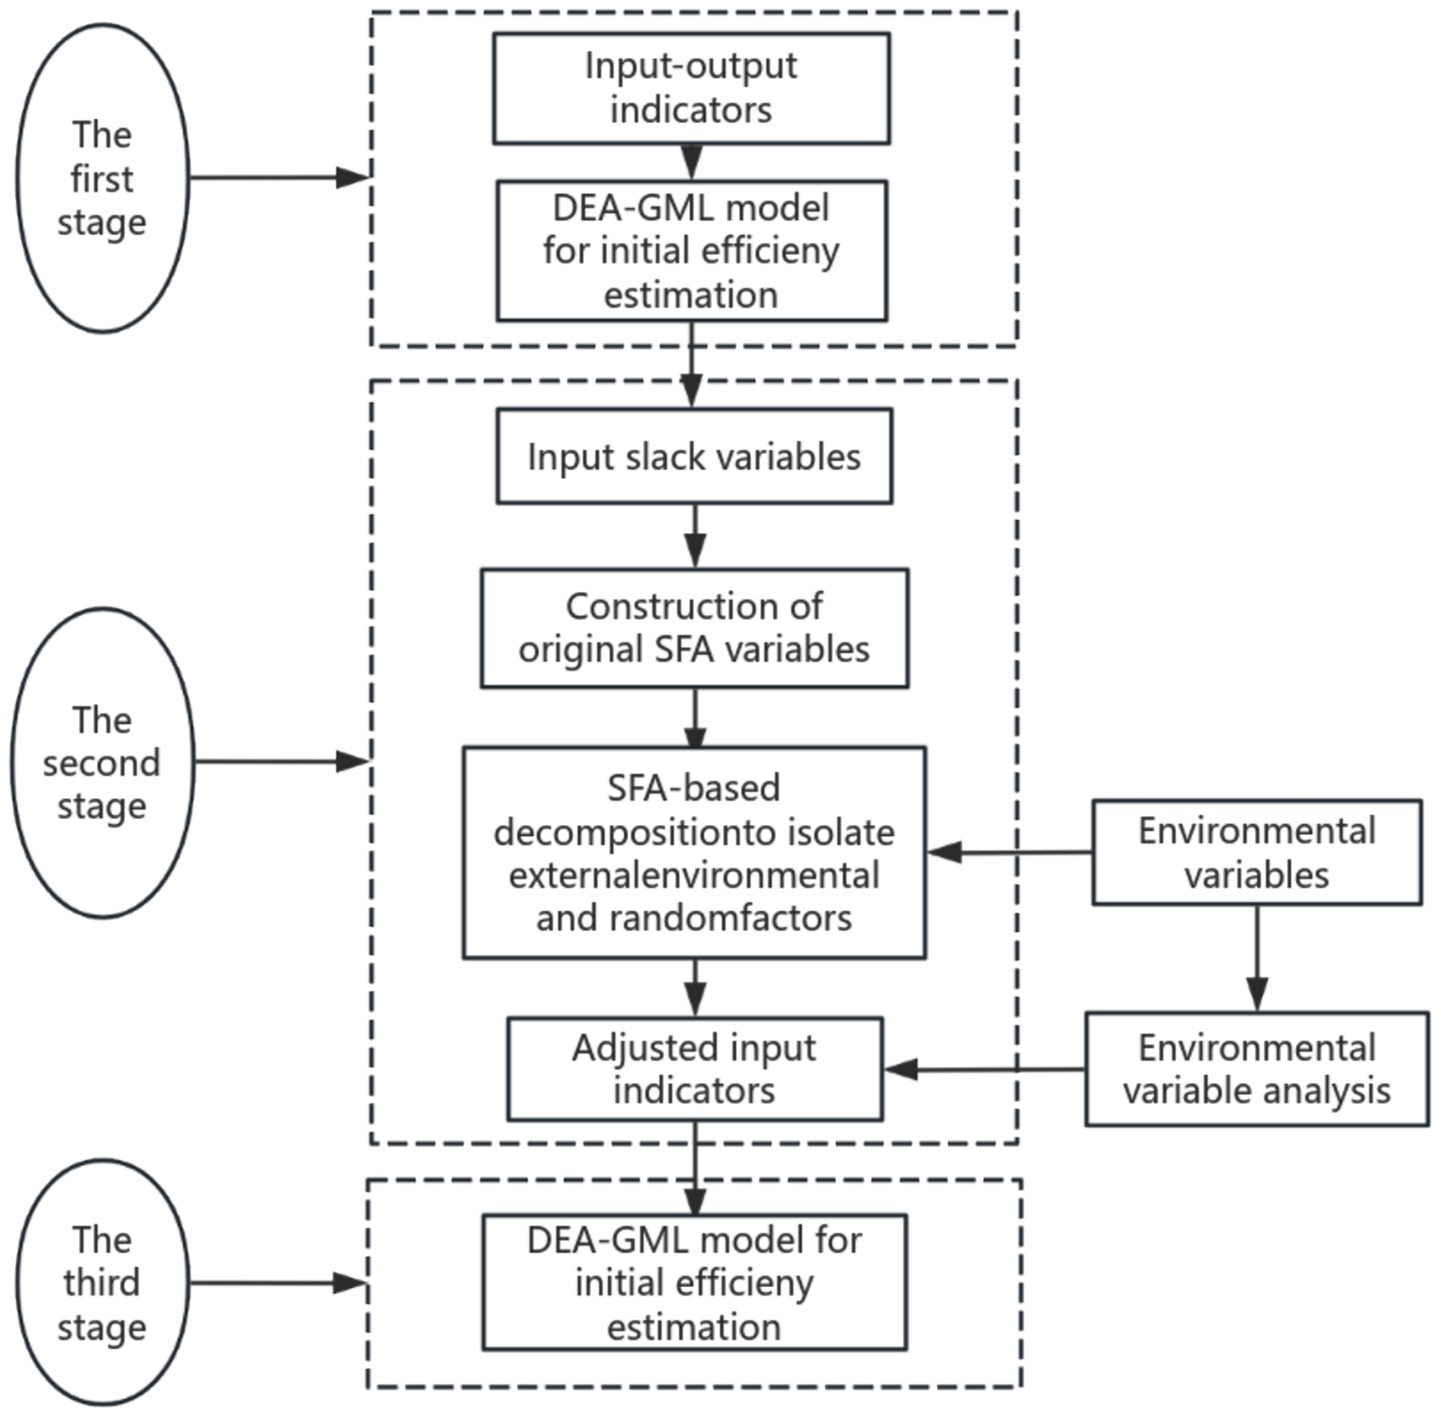
Figure 1. Schematic diagram of the three-stage DEA–GML model.
3.1.1 The first stage: GML index and its decomposition
First stage: Constructing the DEA-GML index model. The Malmquist productivity index is defined based on the distance function and quantifies the total factor productivity change between two data points by calculating the ratio of each point’s distance to the generalized technology frontier. The TFP index is computed as the geometric mean of the Malmquist productivity index over the period from t to t + 1. The geometric mean of the Malmquist productivity index is used for the calculation of the output-oriented TFP index of the following form, with reference to the study by Meng and Qu (2022), the GML index expression for wheat production efficiency from period t to t + 1 is given as shown in Equation 1:
According to research requirements, the GML index is decomposed into changes in technical efficiency (EC) and technological progress (TC), with the decomposition formulas shown in Equations 2 and 3 (Oh, 2010):
In the formula, represents the directional distance function based on the global production possibility set PG(x). Technical efficiency change (EC) reflects the variation in a decision-making unit’s proximity to the production frontier under given technological conditions; an increase in EC generally indicates that factors such as optimized management practices and more efficient resource allocation have driven improvements in internal efficiency. Technical change (TC) measures whether the production frontier itself has shifted outward, signifying enhancements in overall production capacity resulting from technological innovation, the application of agricultural research outcomes, and the introduction of new equipment. When GML > 1, EC > 1, TC > 1, it indicates that wheat production activities are at the production frontier, meaning efficiency has improved. This signifies an increase in wheat production efficiency, optimization of technical efficiency, and progress in technological innovation. Conversely, when GML < 1, EC < 1, TC < 1, it indicates a decline in wheat production efficiency, deterioration in technical efficiency, and regression in technological innovation.
The distance function required for the results of the Malmquist index model is derived based on solving the SBM-DEA model. In this paper, the SBM-DEA model containing non-expected outputs is used to construct the distance function for solving the model, as shown in Equations 4 and 5 below:
In the formula, ρ denotes the efficiency value of the decision-making unit (DMU), The range of values is ρ ∈ [0,1]. When ρ = 1, it indicates that the evaluated unit is efficient and strongly efficient. Variables S−, Sg, Sb represent the slack values of inputs, desirable outputs, and undesirable outputs, respectively. Variables X, Yg, Yb represent the actual values of inputs, desirable outputs, and undesirable outputs, respectively. The symbol λ represents the intensity vector. When ρ < 1, it indicates efficiency loss within the evaluated unit, necessitating improvements in input and output indicators.
3.1.2 The second stage: stochastic frontier analysis
Considering that the comprehensive efficiency measured in the first stage is influenced by multiple factors such as managerial efficiency, environmental factors, and random disturbances, Fried et al. (2002) proposed using SFA-like model to eliminate these second-stage effects and established the following regression function, as shown in Equation 6 (Fried et al., 2002):
Here, Sni represents the slack value of the nth input for the ith decision-making unit (DMU); Zi represents environmental variables, and βn denotes their coefficients; νni + μni is the composite error term, where νni represents random disturbances, and μni denotes managerial inefficiency. Here, is the random error term, indicating the impact of stochastic disturbances on input slack variables, while μni represents managerial inefficiency, reflecting the effect of management factors on input slack variables . is used to determine which factor dominates inefficient DMUs. When γ → 0, random factors are more influential, whereas when γ → 1, managerial inefficiency has a greater impact. After estimating the unknown parameters using maximum likelihood estimation (MLE), the initial input data is adjusted according to the following Equation 7:
Here, represents the adjusted input; Xni is the original input; accounts for adjustments to external environmental factors; and normalizes all DMUs to the same stochastic conditions. After this adjustment, all provinces are placed under the same external environmental conditions, facilitating a more accurate reflection of the internal managerial efficiency of each DMU and enabling a meaningful comparison of differences independent of external pressures.
To remove the impact of stochastic factors, the managerial inefficiency and random error components are decomposed using the following Equation 8:
Here, εni is the composite error term; ; ϕ and φ represent the probability density function (PDF) and cumulative distribution function (CDF) of the standard normal distribution, respectively.
3.1.3 The third stage: adjusted DEA-GML model
The adjusted input data replaces the original data, and the GML index model from the first stage is reapplied to estimate efficiency. Since the effects of environmental factors and random errors have been eliminated, the new efficiency values can more accurately reflect the actual efficiency levels of decision-making units.
3.2 Spatial correlation analysis
Global spatial autocorrelation reflects the overall spatial clustering tendency of a variable within the study region, indicating whether there exists a general pattern of positive or negative spatial correlation across the entire area. In contrast, local spatial autocorrelation focuses on the spatial association between individual units and their neighboring areas, and is used to identify spatial clusters or outliers in specific locations or subregions.
3.2.1 Global spatial autocorrelation
The production factors of wheat GTFP in different provinces (regions) of China exhibit significant spatial mobility, leading to potential spatial correlation in wheat production efficiency among regions. This study applies Moran’s I index to examine whether there is a clustering effect in the spatial distribution of wheat GTFP across Chinese provinces (Sun et al., 2022). The specific formula for global Moran’s I is shown in Equation 9:
Where N is the total number of regions in the study area, wij represents the spatial weight, and xi and xj denote the wheat production efficiency in regions i and j, respectively, with representing the mean production efficiency.
3.2.2 Local spatial autocorrelation
The local Moran’s I index is used to determine which specific province (region) exhibit clustering effects (Zhang and Lu, 2022). The specific formula for local Moran’s I is shown in Equation 10:
The meanings of the symbols in this equation are the same as those in the previous formula and will not be repeated here.
3.3 Kernel density analysis
In order to deeply explore the overall distribution of GTFP among regions and its evolutionary characteristics, this paper adopts the kernel density estimation method (Wang et al., 2025) to characterize its time-series distribution, whose kernel density function of the random variable x is defined as shown in Equation 11:
Where Xi represents the GTFP of each city; GTFPi represents independently distributed observations. denotes the mean GTFP; n is the number of observations, m is the bandwidth, and K(x) represents the Gaussian function and density function.
4 Indicator selection and data sources
4.1 Indicator selection
4.1.1 Input indicators
The selection of input indicators primarily encompasses three aspects of the wheat production process: labor, capital, and land. Specifically, “labor days per mu” is used as the proxy for labor input; capital input is represented by the total cost of seeds, fertilizers, pesticides, and machinery rental; and land input is measured by land cost. For missing data in certain provinces during specific years, interpolation is conducted using the average difference method based on adjacent years. To mitigate the potential impact of price fluctuations on the regression results, all monetary variables are adjusted to constant 2004 prices using relevant price indices. Variable description and descriptive statistics are shown in Table 2.
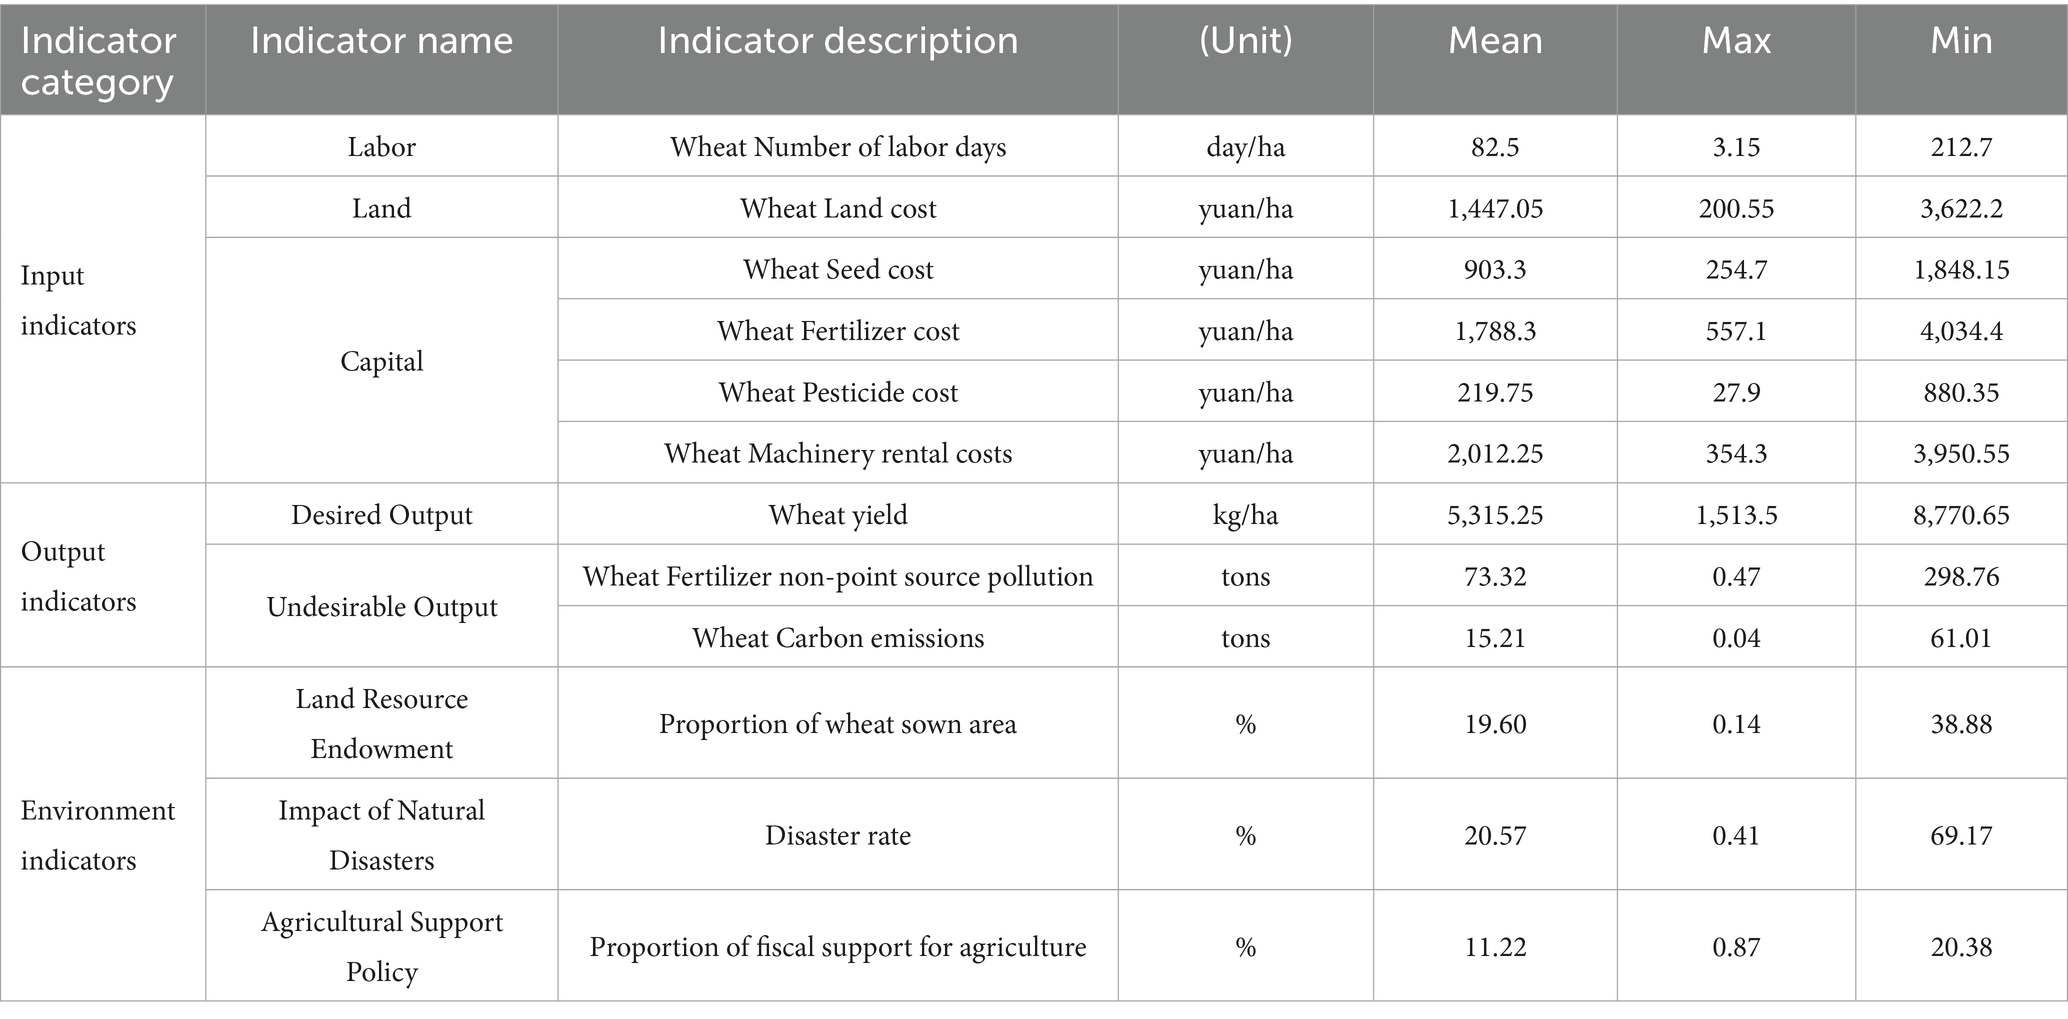
Table 2. Variable description and descriptive statistics.
4.1.2 Output indicators
In this study, wheat output includes both desirable and undesirable outputs. To eliminate the influence of price fluctuations, the desirable output is measured by the average wheat yield per mu across years. Regarding undesirable outputs, this study considers non-point source pollution from fertilizers and carbon emissions as indicators of ecological loss in the wheat production process.
The coefficients for fertilizer-induced non-point source pollution are derived from the Handbook of Emission Source Statistics and Accounting Methods and Coefficients, published by the Ministry of Ecology and Environment in 2021. In addition, parameter settings are informed by the works of Liu and Xu (2015). Specifically, the nitrogen fertilizer utilization rate for wheat is set at 35%, with atmospheric loss at 7%, soil erosion at 49%, and surface runoff at 9%. For phosphate fertilizer, the utilization rate is set at 15%, with 70% remaining in the soil, 5% lost to the atmosphere, and the remainder attributed to surface runoff (Li et al., 2017). Agricultural carbon emission source, coefficient and reference sources are shown in Table 3.
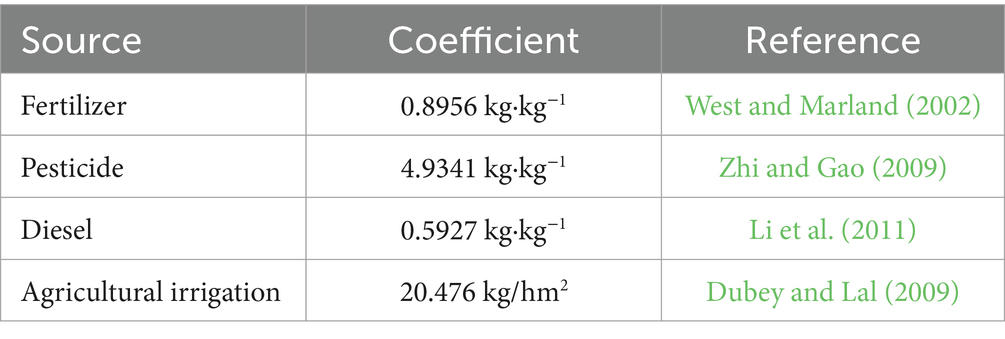
Table 3. Agricultural carbon emission source, coefficient and reference sources.
The carbon emissions generated during wheat production are calculated using the following formula: WE = α*E, Where WE represents the total carbon emissions from wheat production; E denotes total agricultural carbon emissions; and α is the ratio of wheat sown area to total crop sown area, as mentioned earlier (Dai and Xu, 2022). The carbon emission coefficients for fertilizers, agricultural film, diesel, and irrigation are based on the research findings of Li et al. (2011).
4.1.3 Environmental variables
Environmental variables refer to factors that affect efficiency scores but fall outside the subjective control of the decision-making units. Their presence may result in higher observed efficiency for individuals operating in more favorable external conditions. Therefore, to ensure the objectivity and accuracy of efficiency estimations, it is essential to isolate the influence of environmental variables during the analytical process. Based on the production characteristics of wheat (Abman and Carney, 2020; Chen and Gong, 2021), this study selects the following three variables as environmental factors:
1. Proportion of wheat-sown area: This indicator captures the scale and specialization level of wheat cultivation in a region. A more specialized cropping structure typically correlates with the agglomeration of complementary resources such as technologies, management practices, and infrastructure, thereby indirectly affecting agricultural efficiency.
2. Disaster incidence rate: This variable reflects the extent of natural disasters, which are sudden and uncontrollable events that disrupt the normal input–output relationship in agricultural production. It is considered a key exogenous factor influencing efficiency.
3. Share of agricultural fiscal expenditure: Measured by the ratio of expenditures on agriculture, forestry, and water affairs to total local fiscal spending, this indicator captures the intensity of governmental support for agriculture. Regions with greater fiscal investment tend to have better infrastructure, more extensive extension services, and stronger pest and disease control systems, all of which can indirectly enhance farmers’ production efficiency (FuJun et al., 2018).
These three variables are beyond farmers’ direct control yet significantly influence wheat production efficiency; thus, they are treated as environmental variables to ensure statistical validity in efficiency estimation.
4.2 Data sources
This study selects 15 major wheat-producing provinces in China from 2004 to 2022 as the research region and period. To analyze the regional characteristics of wheat production efficiency in China, this study follows the “Wheat Advantageous Regional Layout Plan (2008–2015)” and divides the 15 provinces into five wheat production regions, see Table 4; The data used in this study are obtained from publicly available statistical sources, with production material data on fertilizers, pesticides, machinery, and irrigation sourced from the Compilation of National Agricultural Product Cost–Benefit Data. Data on environmental variables are from the China Statistical Yearbook.
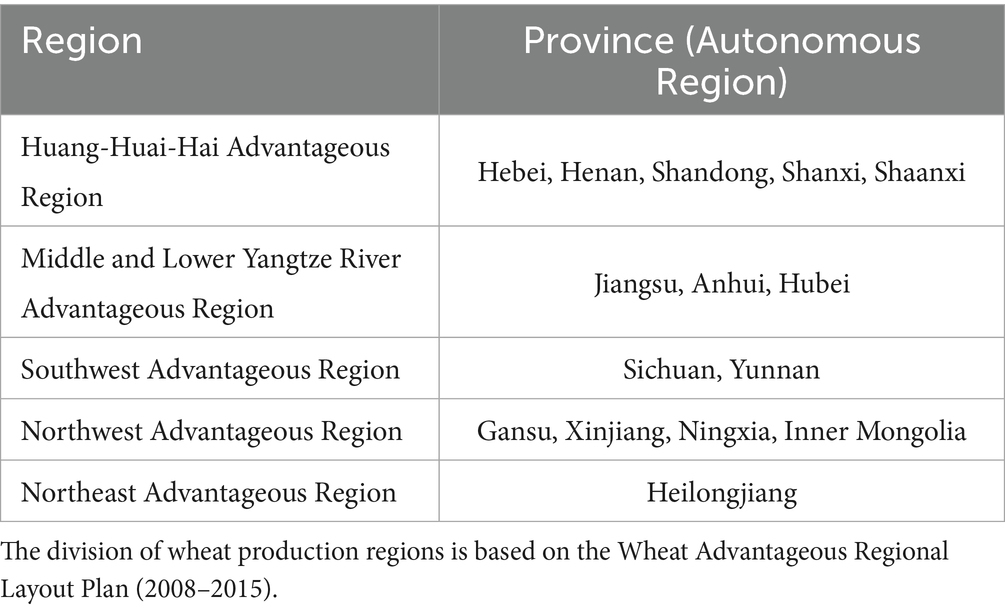
Table 4. Distribution of research regions.
5 Results
5.1 Results of first stage: the original GTFP
This study employs MATLAB 2022a to estimate the GTFP of wheat across 15 major producing provinces in China during the period 2004–2022, using 2004 as the base year (Table 5). The first-stage GTFP results are presented in Table 5. Without accounting for random disturbances and external environmental influences, the estimated GTFP values range from 0.799 to 1.289, with an average of 1.028 over the study period. Notably, several years exhibit substantial volatility—for instance, GTFP dropped to 0.865 in 2009, further declined to 0.799 in 2018, and then surged to 1.289 in 2019. These fluctuations are likely attributable to inter-provincial differences in environmental conditions and the presence of stochastic errors. Such findings suggest that relying solely on first-stage estimates may fail to accurately capture the true efficiency level.
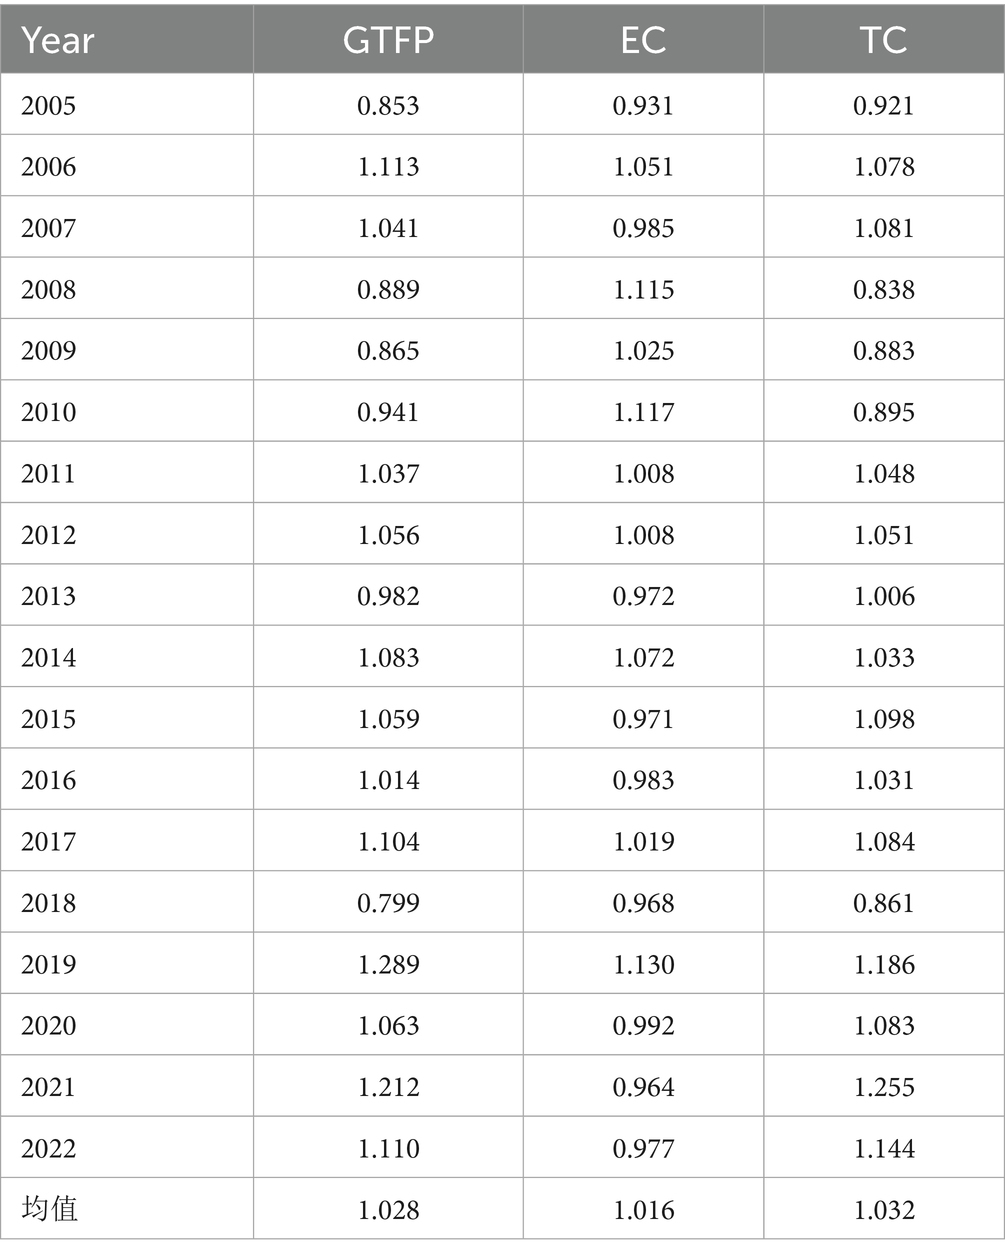
Table 5. Average GTFP in stage 1 (2005–2022).
5.2 Results of second stage: SFA-like regression
In the second stage, SFA-like regression was used to eliminate the influence of environmental factors and random disturbances. The input slack variables obtained in the first stage were taken as the dependent variables, and the proportion of wheat sown area, disaster rate, and proportion of fiscal support for agriculture served as explanatory variables. The SFA regression was conducted using Frontier 4.1 software. A positive regression coefficient indicates excessive input redundancy, which is detrimental to improving wheat production efficiency, whereas a negative coefficient suggests efficiency improvement (Banker et al., 1984; Ball et al., 2004). The detailed regression results are presented in Table 6.
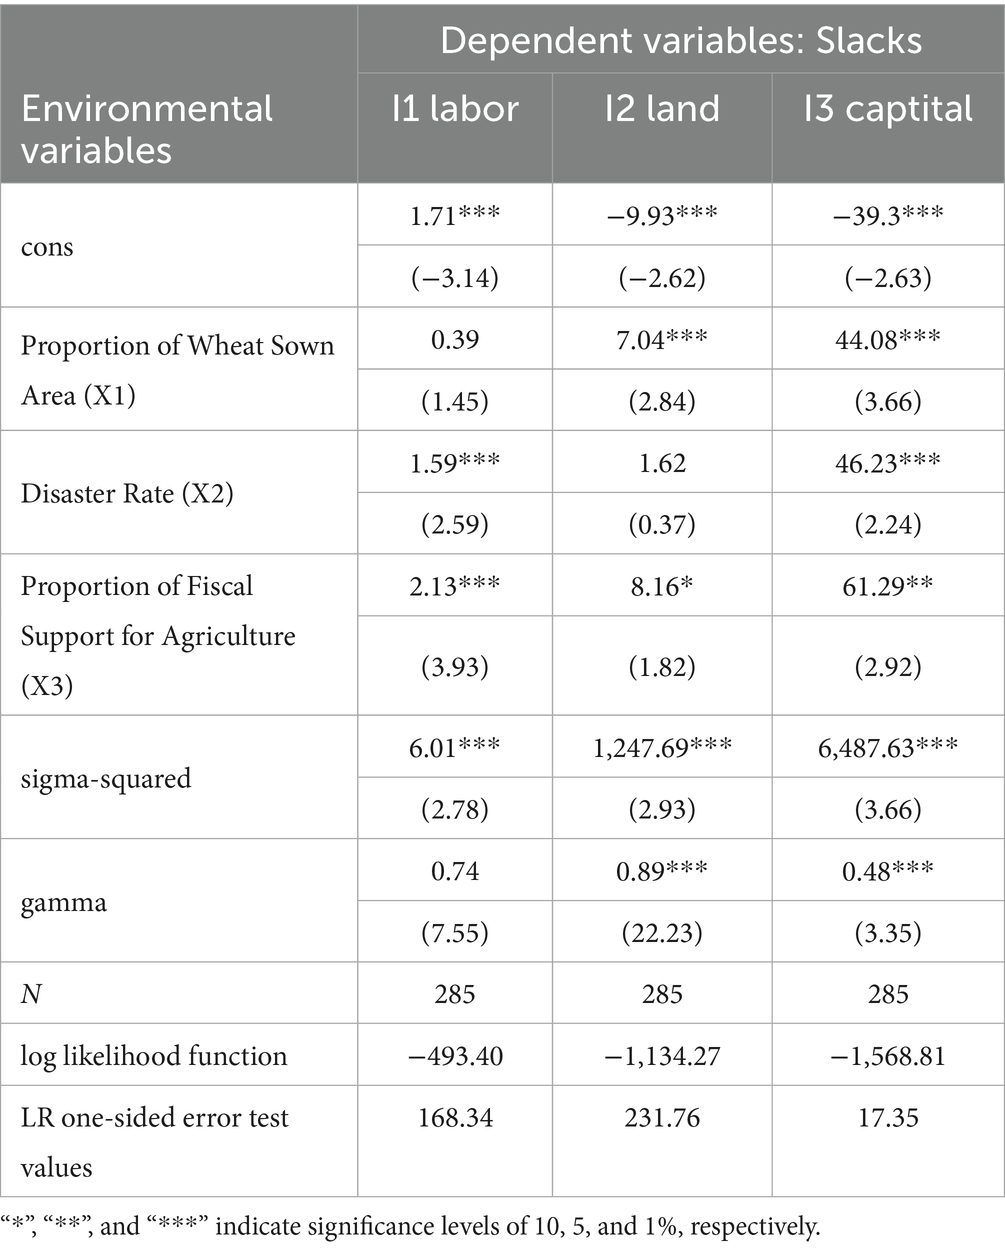
Table 6. The results of SFA-like regression.
As shown in Table 6, the γ-values for land and labor inputs both exceed 0.7, indicating that management inefficiency is the dominant factor contributing to slack in these two inputs. This underscores the critical role of improving managerial efficiency in enhancing overall production performance. In contrast, the γ-value for capital input is between 0.4 and 0.5, suggesting that the redundancy in capital use is more strongly influenced by external environmental conditions and random shocks. Moreover, all input slack variables pass the one-sided LR error test and are statistically significant at the 1% level, which confirms the necessity and effectiveness of using the SFA regression approach to control for environmental and stochastic disturbances. Overall, most environmental variables exert significant effects on input slacks, lending support to the robustness and rationality of the results.
The following section presents a more detailed discussion of the SFA regression results:
1. Wheat sown area ratio (X1): This variable shows a significant positive association with the slack variables of land and capital inputs. A higher wheat sown area ratio increases the redundancy in land and capital usage, thereby hindering improvements in GTFP. This outcome may reflect the lack of refined management and intensive factor allocation in certain regions, where insufficient marginal returns to input factors constrain the green efficiency of wheat production.
2. Disaster rate (X2): The disaster rate exhibits a significantly positive correlation with the slack variables of labor, land, and capital inputs. This suggests that more severe natural disasters lead to higher input redundancies and thereby exert a negative effect on wheat GTFP. This finding is consistent with theoretical expectations.
3. Fiscal support ratio (X3): Table 6 indicates that fiscal support for agriculture is positively associated with the slack variables of labor, land, and capital inputs. This suggests that increased agricultural subsidies have not translated into measurable gains in efficiency. Although fiscal support policies serve the overall goal of agricultural development, they may, in the short term, suffer from inefficiencies in fund allocation or a lack of supervision over fund utilization, leading to resource misallocation that undermines improvements in green productivity in wheat production.
5.3 Results of third stage: adjusted GTFP
The adjusted input and output variables were reintroduced into the DEA–GML model using MATLAB 2022a, thereby eliminating the influence of external environmental factors and stochastic errors. As illustrated in Figure 2, the comparison between the original and adjusted GTFP values reveals that the adjusted GTFP for wheat across the 15 major producing provinces averaged 1.006 during 2005–2022, which is lower than the first-stage average of 1.028. This downward adjustment is consistent with previous studies (Liu et al., 2022). The adjusted GTFP fluctuated within a narrower range of 0.863–1.039, and the overall trajectory became significantly smoother, with extreme fluctuations largely eliminated. These findings confirm that the three-stage DEA–GML model substantially enhances the robustness and scientific reliability of efficiency estimates by removing environmental heterogeneity and random noise, thus providing a more solid foundation for subsequent empirical analysis.
1. From a temporal perspective, the adjusted wheat GTFP exhibits a generally upward trend with fluctuations over time (Table 7). Between 2005 and 2014, GTFP fluctuated within a range of 0.863–1.039. Since the implementation of the “Zero Growth Action Plan for Fertilizer Use by 2020” in 2015, GTFP increased from 1.009 to a peak of 1.148 in 2019, reflecting the positive effects of green production initiatives and related policy measures. Although a slight decline was observed after 2019, GTFP consistently remained above 1. During the entire period from 2005 to 2022, the average values of technical efficiency change (EC) and technological progress (TC) were 1.006 and 1.011, respectively, indicating that TC played a slightly stronger role in driving GTFP growth. The synergistic effect of technological progress and efficiency improvement, together with sustained policy support, constitutes the primary driving force behind the steady enhancement of wheat GTFP.
2. From a regional perspective, the average third-stage GTFP values across all regions declined to varying degrees compared to the original first-stage estimates, confirming the reliability of the results obtained from the three-stage DEA–GML model. Specifically, the average GTFP in the Huang-Huai-Hai Plain, the middle and lower reaches of the Yangtze River, and the Northeastern advantage zone decreased from 1.046, 1.039, and 1.030 to 1.016, 1.013, and 1.010, respectively (Table 8). Despite these downward adjustments, the GTFP levels in these regions remain relatively high, indicating that their efficiency improvements are largely attributable to technological progress and managerial optimization. In contrast, the declines observed in the Southwestern and Northwestern regions were more modest—from 1.001 to 0.986 and from 1.012 to 0.998, respectively—suggesting that green productivity in these regions relies less on favorable external conditions and more on endogenous improvements.
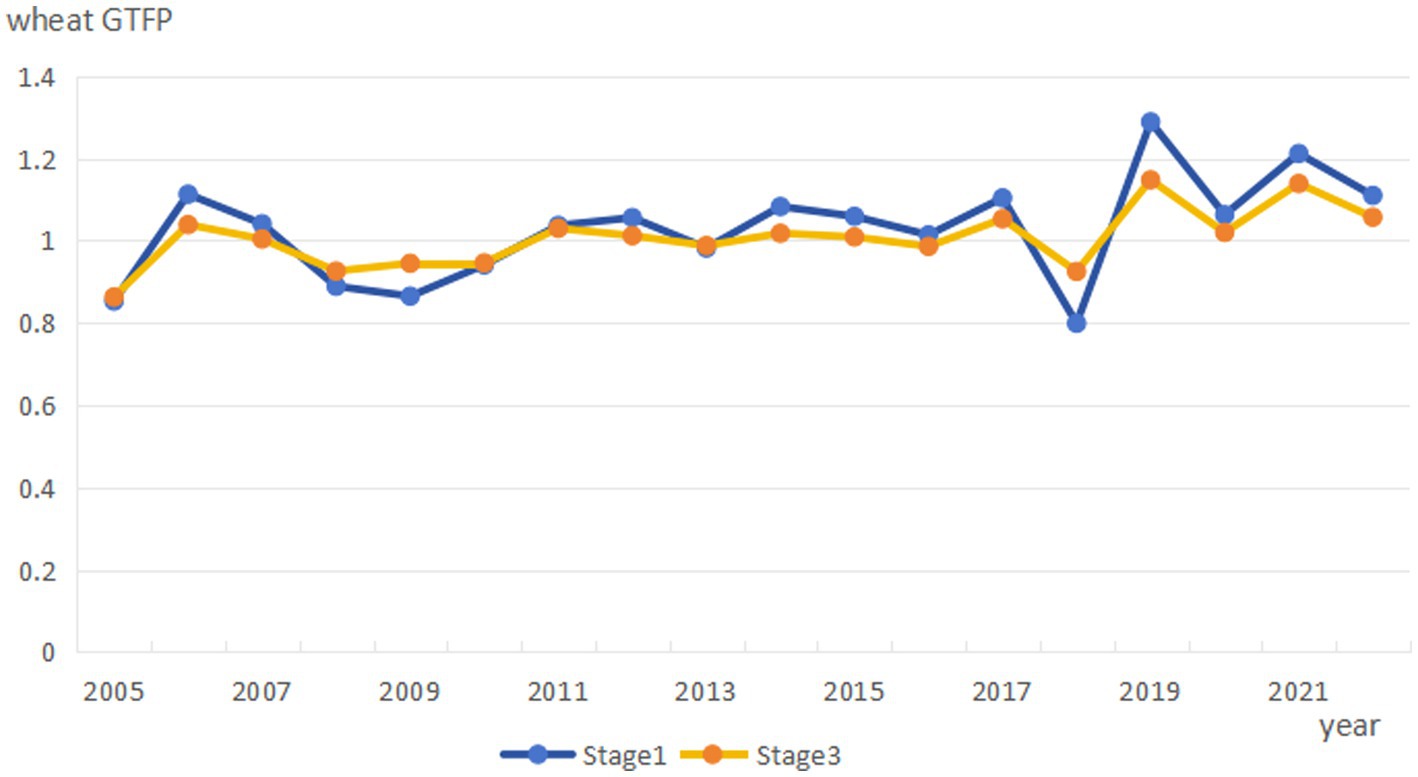
Figure 2. Comparison of GTFP in Stage 1 and Stage 3.
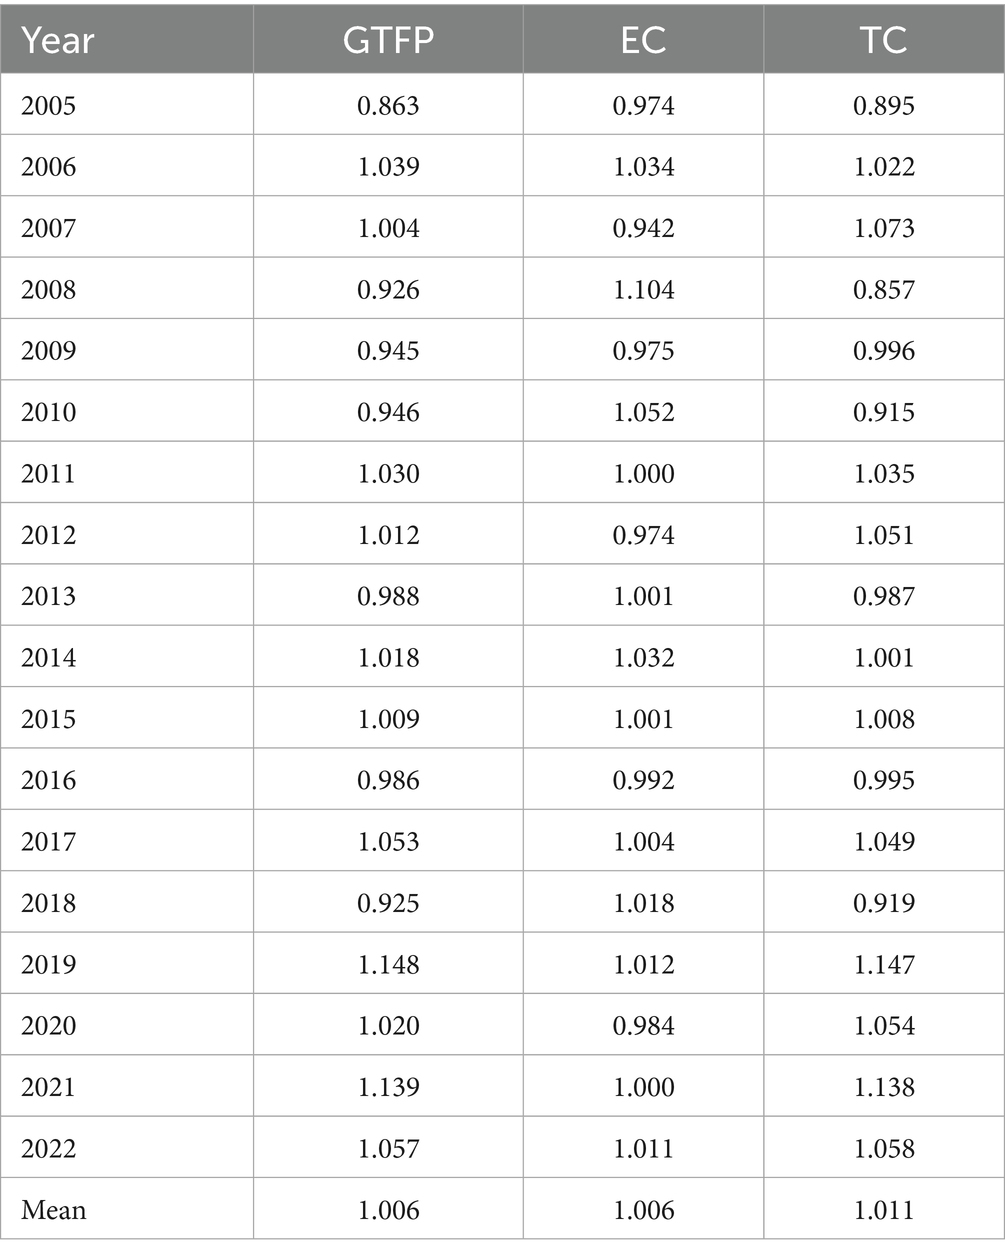
Table 7. Average GTFP in stage 3 (2005–2022).
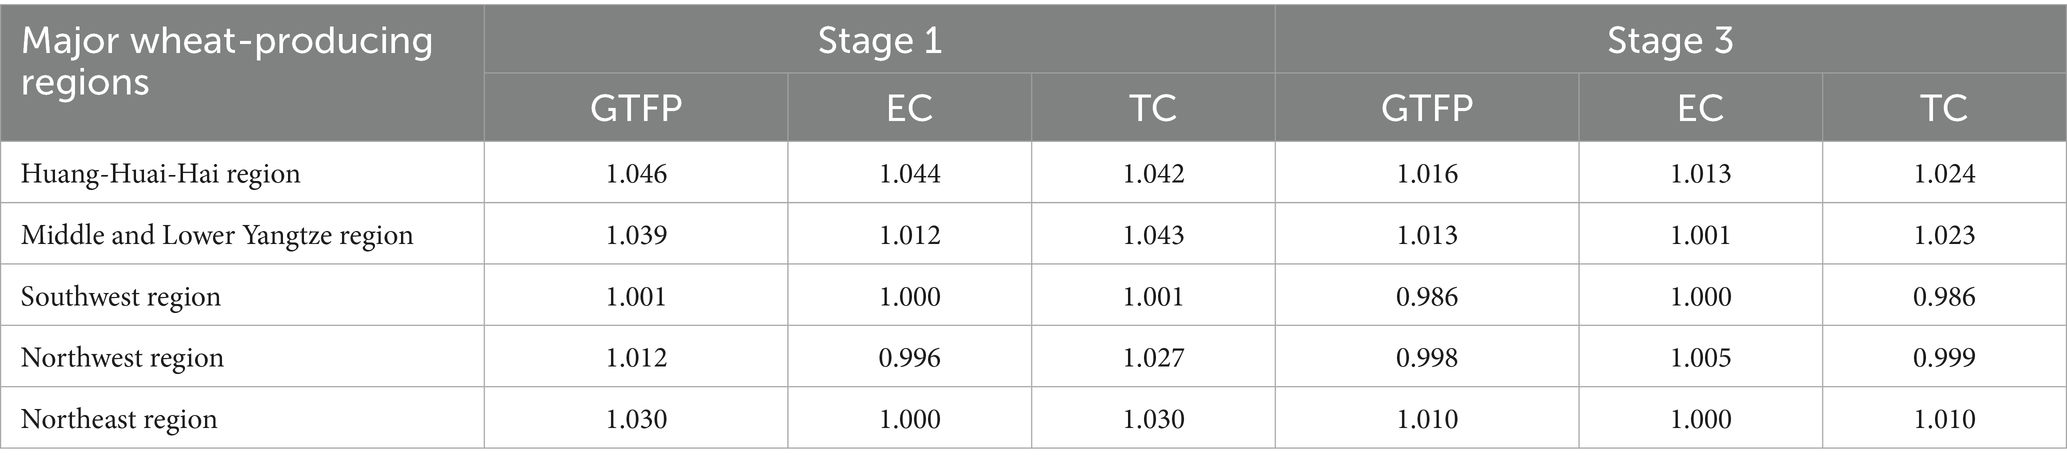
Table 8. Average GTFP in Stage 1 and Stage 3 of five regions in China.
In terms of EC and TC dynamics, the Huang-Huai-Hai and Yangtze River regions continue to exhibit clear advantages in technological progress, with TC values reaching 1.024 and 1.023, respectively. Their managerial efficiency (EC) also remains above unity. However, in the Southwest, Northwest, and Northeast, the impetus from technological advancement has weakened, with both EC and TC values approaching or falling slightly below 1, reflecting the constraints imposed by regional heterogeneity and ecological limitations. Overall, the three-stage estimation provides a more accurate and credible assessment of green production efficiency across China’s key wheat-producing regions, offering valuable insights into spatial heterogeneity and informing the formulation of region-specific agricultural sustainability policies.
1. At the provincial level, to facilitate a more intuitive comparison, we employed a spatial distribution maps (Figures 3, 4) to visualize the differences between the original and adjusted GTFP values across 15 major wheat-producing provinces. The results indicate that, after removing the influence of environmental and stochastic factors, GTFP values in all provinces declined to varying degrees. The post-adjustment values also exhibit a more centralized distribution with reduced volatility, underscoring the robustness of the three-stage DEA–GML model.
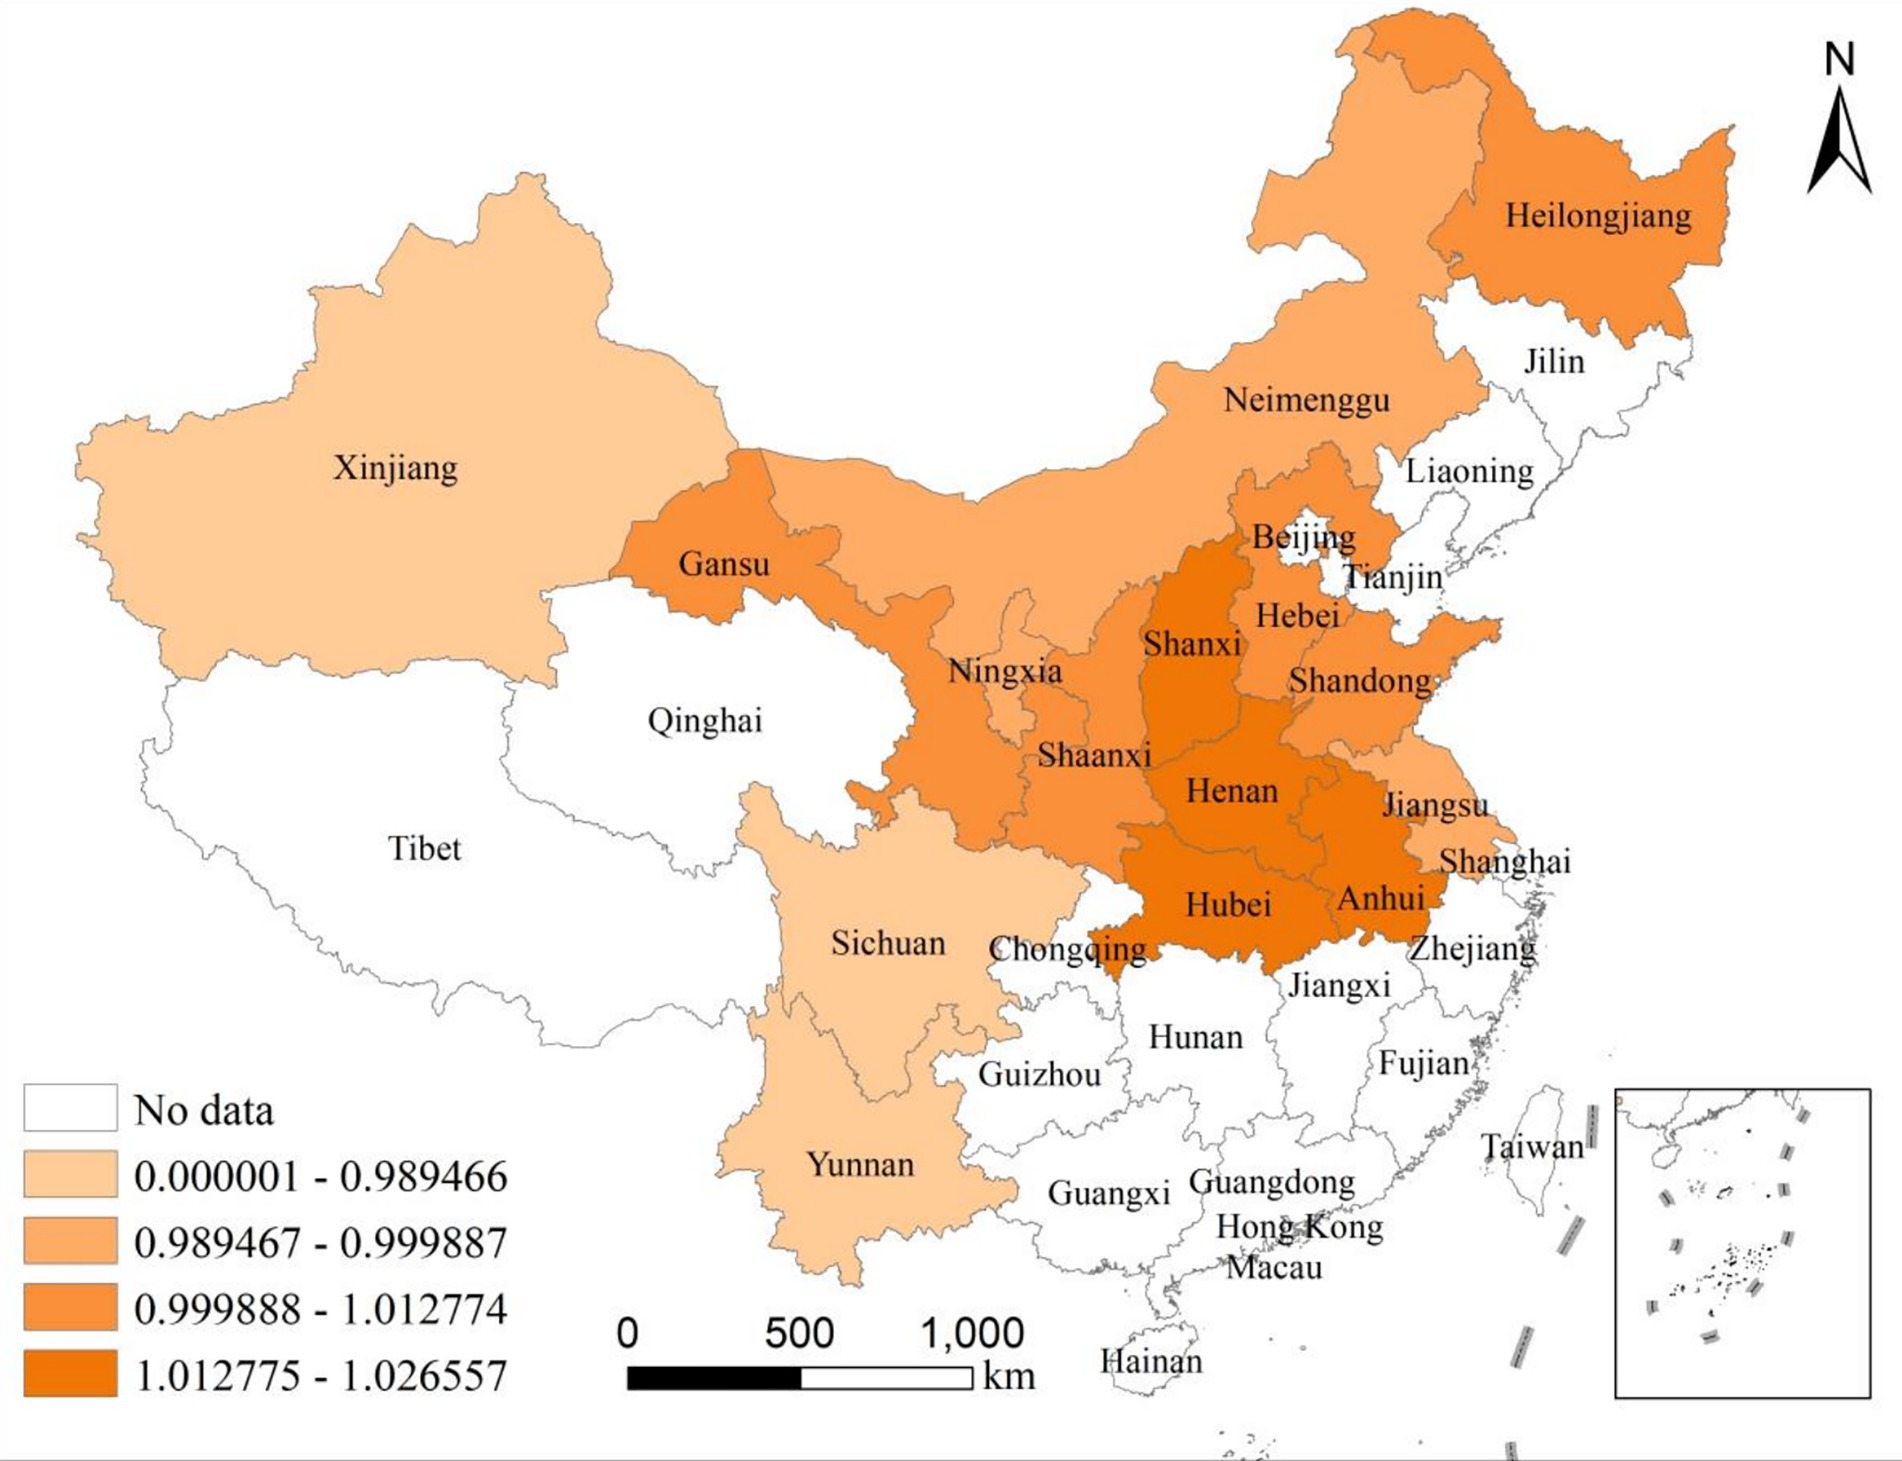
Figure 3. Wheat GTFP in Stage 1.
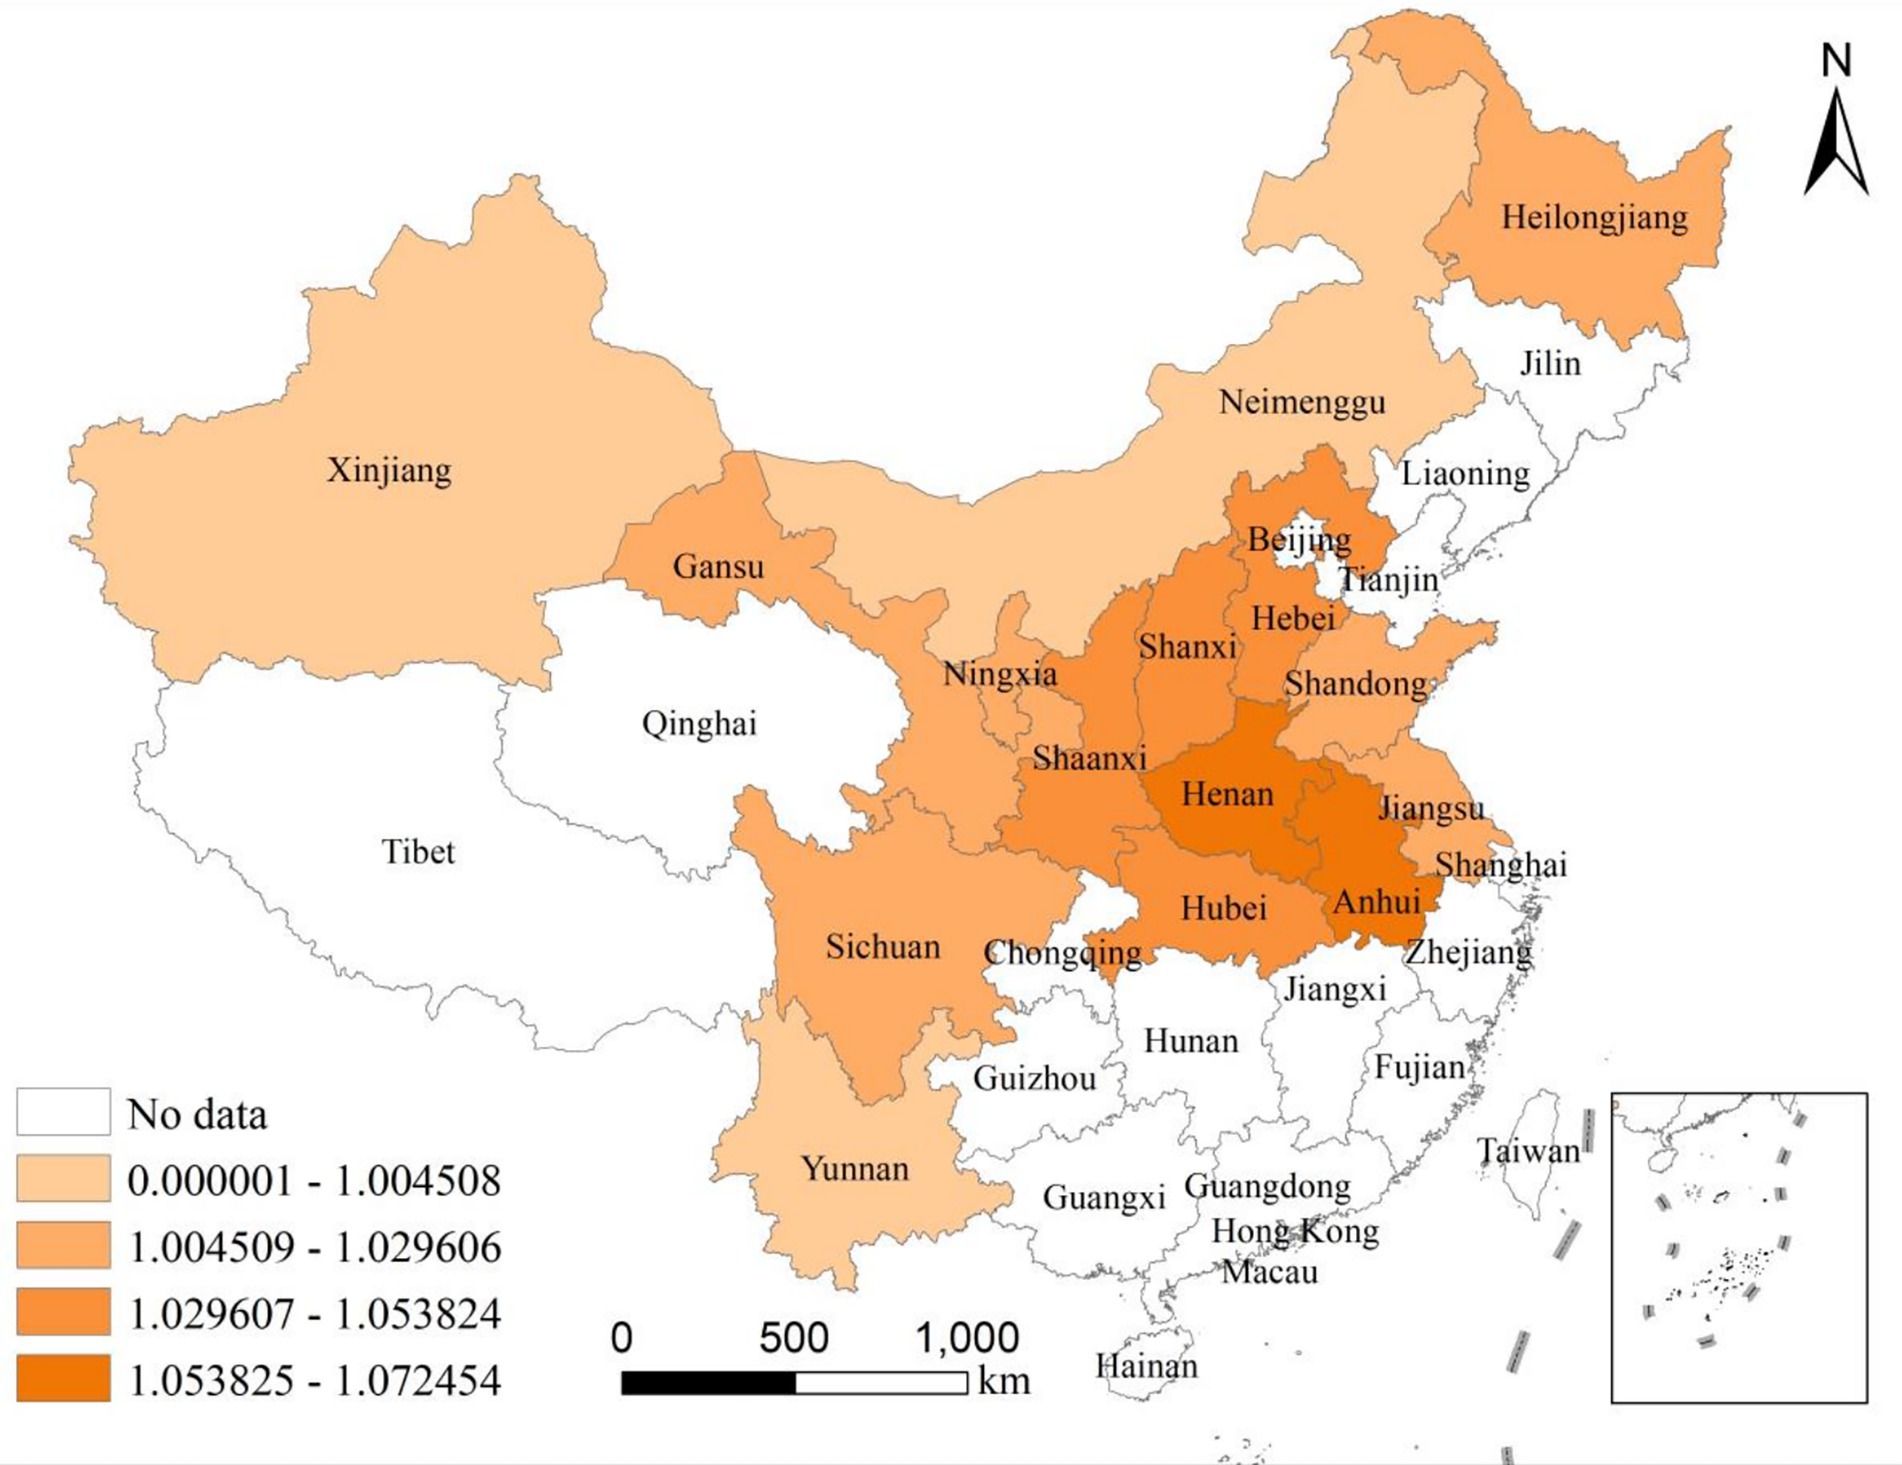
Figure 4. Wheat GTFP in Stage 3.
Specifically, Henan and Shandong—the two core wheat-producing provinces—experienced the largest downward adjustments, suggesting that their previously observed green productivity levels were largely bolstered by favorable natural endowments and well-developed infrastructure. In these cases, the original GTFP estimates appear to have been partially inflated by environmental advantages. In contrast, provinces such as Xinjiang, Gansu, and Ningxia, which are characterized by more pronounced ecological constraints, showed the smallest adjustments. This implies that their production efficiency is primarily driven by endogenous technological and managerial improvements, with minimal distortion from environmental conditions. Provinces like Jiangsu, Anhui, Hebei, and Sichuan fall in the middle range, with moderate reductions, indicating a combination of external support and internal capacity for green efficiency enhancement.
Overall, the provincial-level trends in GTFP adjustment are highly consistent with the regional-level findings, further confirming the presence of significant structural heterogeneity in wheat production efficiency across China. This heterogeneity highlights the differential impacts of environmental factors on efficiency measurement and provides a solid empirical foundation for developing more refined, region- and province-specific green production policies.
6 Discussion
The empirical results reveal temporal differences in GTFP across major wheat-producing provinces; however, they do not sufficiently uncover the spatial agglomeration effects and dynamic evolutionary patterns. Therefore, further analyses using spatial autocorrelation and kernel density estimation techniques were conducted to explore the spatial distribution characteristics and temporal dynamics of agricultural GTFP in greater depth.
6.1 Spatial distribution of GTFP
6.1.1 Global spatial autocorrelation analysis
To examine the spatial agglomeration characteristics of wheat TFP in China’s major wheat-producing regions, the Global Moran’s I index was calculated using GeoDa software. The spatial weight matrix was constructed based on a binary contiguity structure following the Queen criterion, with 999 random permutations used to build the standard normal statistic. The results are presented in Table 9. Spatial correlation across different years exhibited significant fluctuations. From 2005 to 2012, most of the Global Moran’s I values were positive and statistically significant, indicating a notable positive spatial correlation in wheat TFP—high-efficiency regions tended to cluster with other high-efficiency regions, and low-efficiency regions clustered together as well. However, after 2012, the Moran’s I index showed a declining trend and occasionally turned negative, suggesting an increase in spatial disparity and a weakening of spatial agglomeration in wheat TFP across regions.
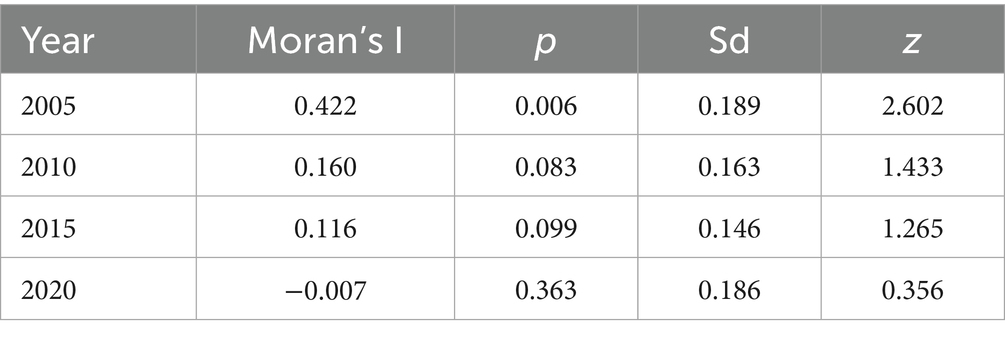
Table 9. Global Moran’s I index and statistical test values.
6.1.2 Local spatial autocorrelation analysis
Local spatial autocorrelation analysis helps to identify localized clustering patterns and potential spillover effects. The Moran scatterplot classifies spatial units into four quadrants: Quadrant I (High–High) clusters, where both a locality’s wheat GTFP and that of its neighbors are high, reflecting diffusion effects in spatial association; Quadrant II (Low–High) clusters, where local GTFP is low but neighboring GTFP is high, representing a transitional pattern; Quadrant III (Low–Low) clusters, where both local and neighboring GTFP are low, denoting low-growth regions; and Quadrant IV (High–Low) clusters, where local GTFP is high while neighboring GTFP is low, manifesting polarization effects. Quadrants I and III correspond to positive spatial autocorrelation, characterized by clustered distributions, whereas Quadrants II and IV correspond to negative spatial autocorrelation, characterized by dispersed distributions.
From the scatterplot (Figure 5), the 2010 observations are primarily concentrated in Quadrants I (H–H) and III (L–L), with the regression line exhibiting a clear positive slope (Global Moran’s I = 0.160). This indicates a significant positive spatial clustering of wheat GTFP in that year, whereby high-value areas diffused into neighboring regions and low-value areas also formed clusters. By contrast, in 2020 the sample points are more evenly distributed across all four quadrants and the regression line is nearly flat (Global Moran’s I = –0.007), demonstrating an absence of significant spatial autocorrelation and suggesting that the spatial clustering of wheat GTFP has greatly weakened, with interregional efficiency differences becoming more randomized.
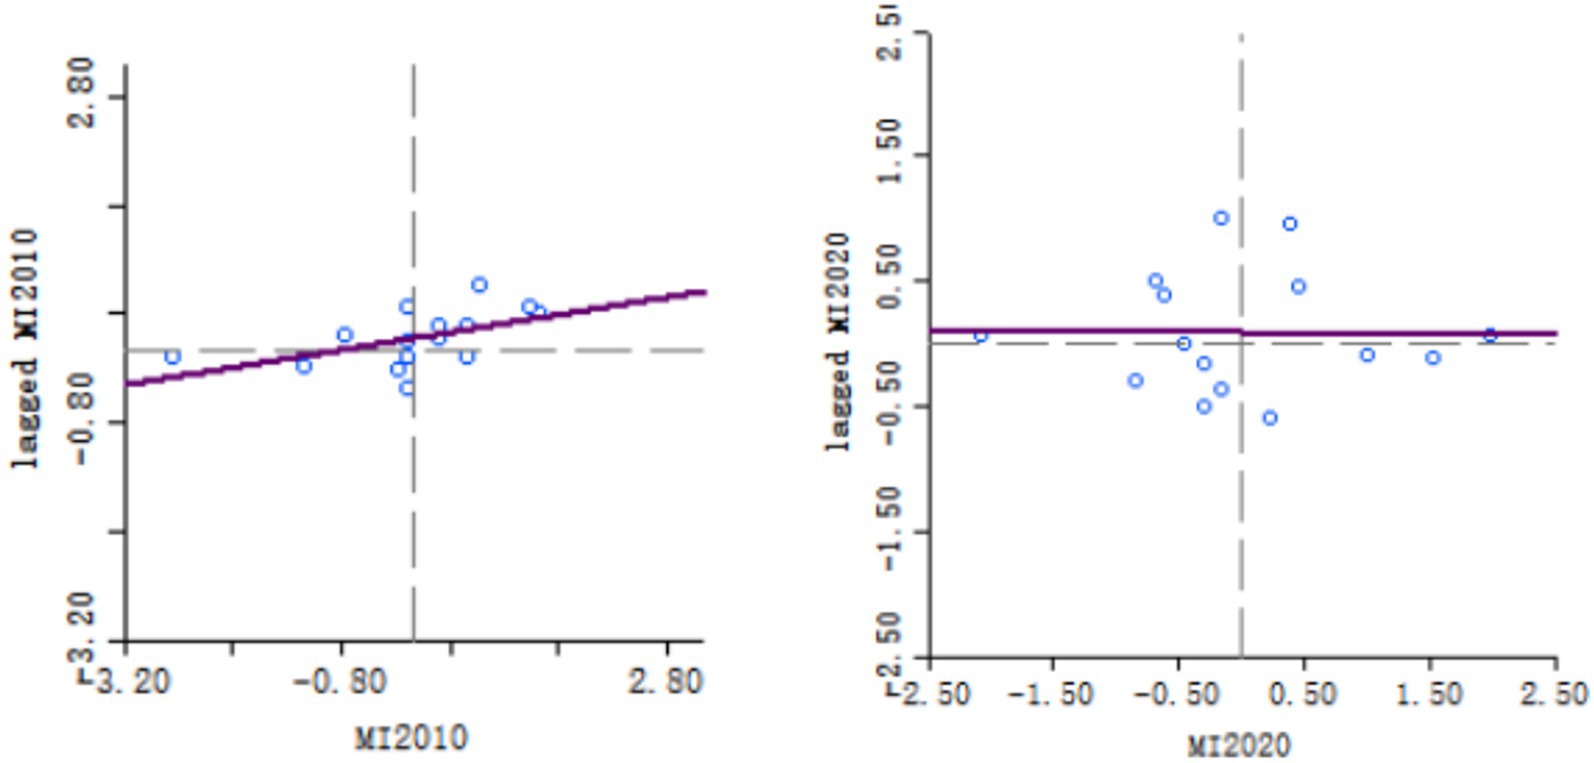
Figure 5. Moran scatter plots of wheat GTFP in 2010 and 2020.
6.2 Dynamic analysis of GTFP: kernel density estimation of temporal evolution
This study employed kernel density estimation to investigate the temporal dynamics of green total factor productivity (GTFP) across China’s 15 major wheat-producing provinces. As illustrated in Figure 6, the overall distribution curve of wheat GTFP shifted toward the right from 2004 to 2022, indicating a transition from lower to higher values. The central surface of the distribution rose steadily from an initial baseline of approximately 0.6 to values exceeding 1.8, confirming the continuous improvement in wheat GTFP at the national level.
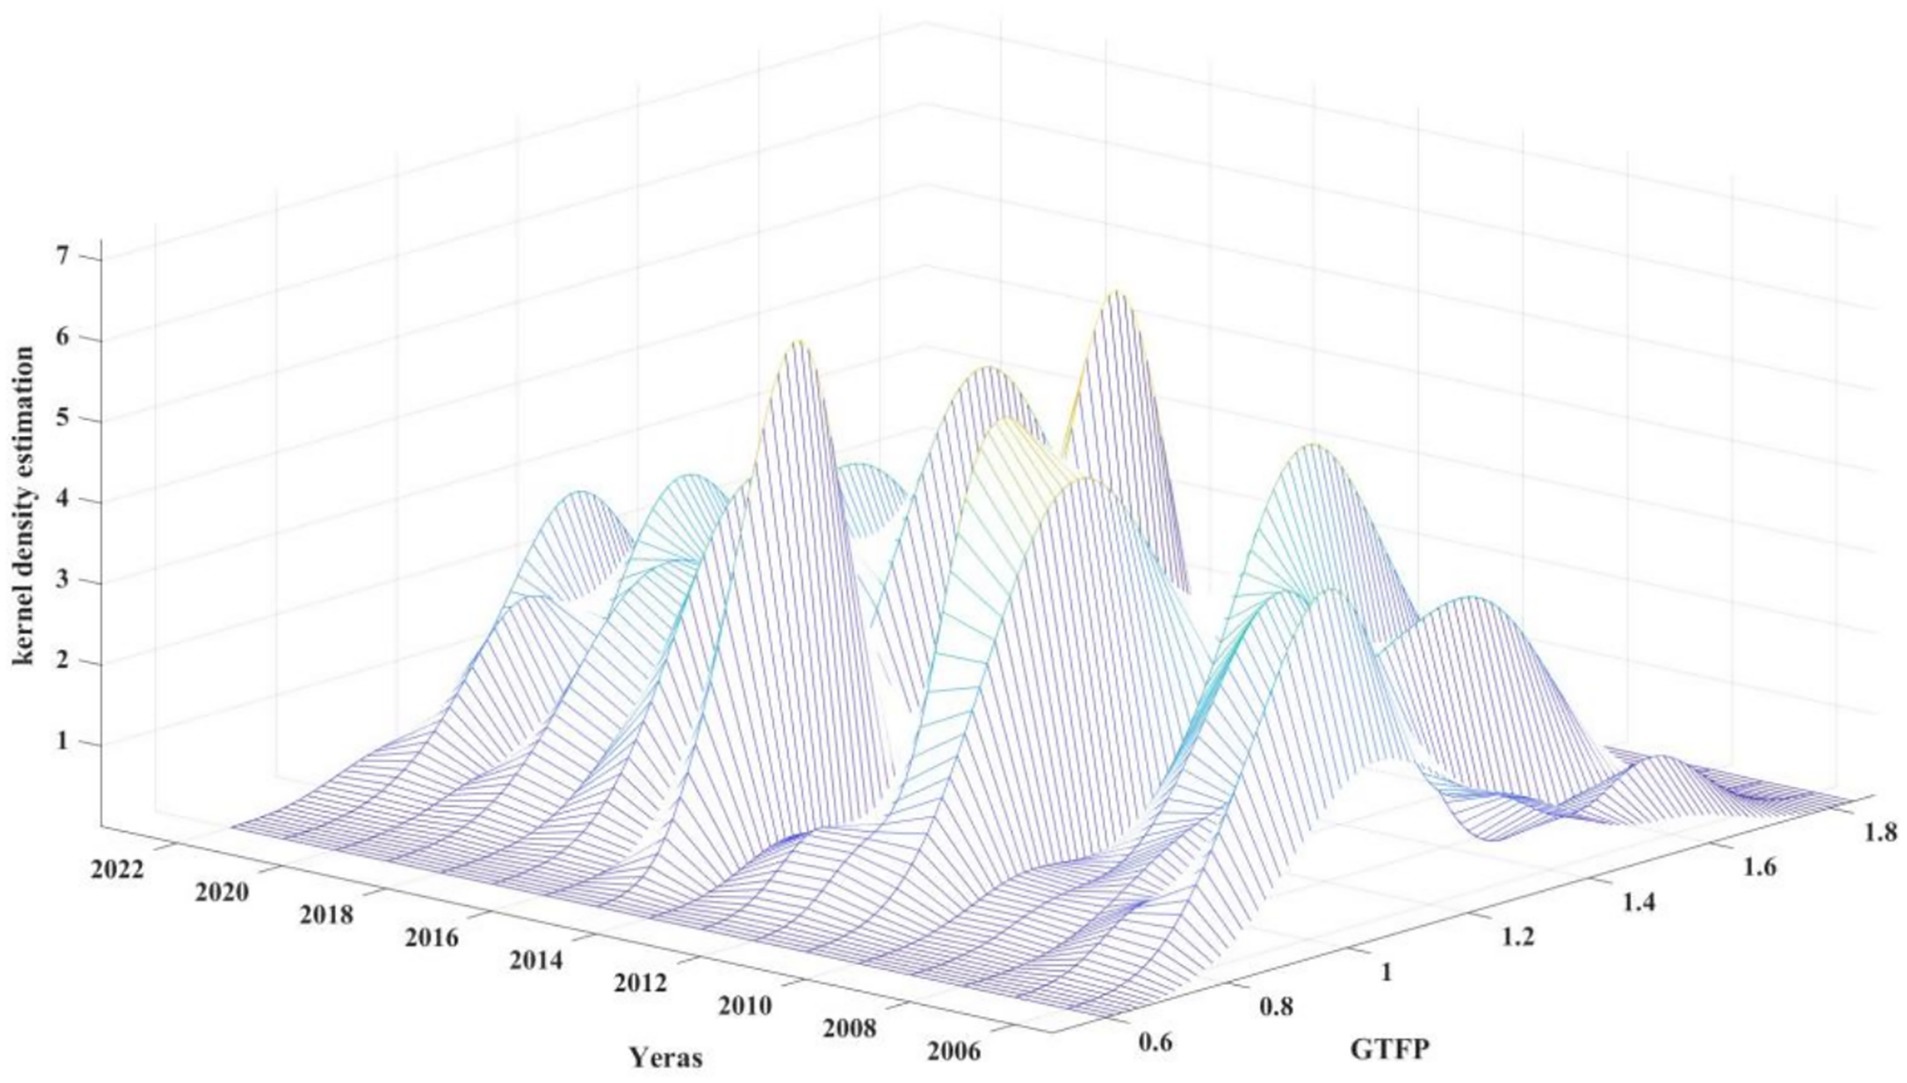
Figure 6. GTFP of wheat in 15 main producing provinces of China.
The “peaks” of the distribution represent regions with high probability density, denoting the dominant GTFP intervals across provinces. Over time, the shape of the surface evolved from a unimodal to a multimodal structure. Between 2004 and 2010, the distribution exhibited a single-peak pattern; from 2011 to 2017, it bifurcated into a bimodal structure; and by 2018, it further evolved into a trimodal form with one main peak and two secondary peaks.
In parallel, the bandwidth of GTFP distribution expanded markedly, and the amplitude of the surface increased, suggesting growing interprovincial disparities in GTFP. This divergence may arise from variations in the degree of emphasis placed on green agriculture, differences in economic structure, and disparities in resource endowment among provinces. Consequently, progress in the development, adoption, and implementation of green agricultural technologies and related policies has been uneven, amplifying provincial-level differences in GTFP.
7 Conclusions and policy implications
This study employed a three-stage DEA-GML model to examine the influence of environmental factors and stochastic disturbances on the green total factor productivity (GTFP) of major wheat-producing provinces in China. In combination with spatial autocorrelation and kernel density estimation techniques, we analyzed the temporal dynamics and spatial clustering patterns of GTFP across 15 key provinces between 2004 and 2022. The main findings are summarized as follows:
1. In the first stage, without accounting for environmental effects, China’s wheat GTFP fluctuated through time between 0.80 and 1.29, with a mean value of 1.028. In the second stage, SFA regression was used to isolate exogenous influences, revealing that redundancy in labor and land inputs was primarily driven by managerial inefficiencies, while capital input redundancy was more attributable to environmental constraints and stochastic shocks. In the third stage, after adjusting for these external factors using the DEA-GML model, the average GTFP across the 15 provinces declined to 1.011, suggesting that conventional DEA approaches may overestimate efficiency. The three-stage model offers a more accurate reflection of the true level of wheat GTFP by incorporating environmental and random factors.
2. From a temporal perspective, the annual changes in wheat GTFP, after three-stage adjustment, exhibit a fluctuating upward trend. Between 2005 and 2014, GTFP fluctuated within a range of 0.863–1.039. Following the implementation of the “Zero Growth Action Plan for Fertilizer Use by 2020” in 2015, GTFP increased from 1.009 to a peak of 1.148 in 2019. Although a slight decline occurred after 2019, GTFP remained consistently above 1, reflecting the positive effects of green production principles and related policy interventions.
3. From a regional distribution perspective, the adjusted GTFP levels exhibit marked spatial variation across provinces. The Huang-Huai-Hai wheat zone recorded the highest average GTFP (1.016), driven by synergistic gains in technical efficiency and technological progress, with Henan emerging as the regional leader. The Middle and Lower Yangtze River zone (1.013) and the Northeast zone (1.010) showed comparable performance, indicating notable progress in green agricultural transformation. In contrast, the Northwest (0.998) and Southwest (0.986) zones lagged behind, underscoring the constraining effects of ecological and environmental factors on productivity improvement in those regions.
4. Spatial Pattern Dynamics: The evolving spatial pattern of wheat GTFP reflects growing regional divergence and weak coordination. Global spatial autocorrelation results show significant positive clustering between 2005 and 2012, which diminished in later years, indicating a dispersal of GTFP and widening of regional disparities. Kernel density analysis further confirmed this trend, with the distribution evolving from a unimodal to a bimodal and even trimodal structure, revealing increasingly pronounced interprovincial gaps—likely due to unbalanced progress in green technology development, resource allocation, and policy implementation across regions.
Based on the research findings, the following policy recommendations are proposed:
1. Strengthen Technological Innovation and Improve Resource Allocation Efficiency:
Governments should prioritize the development and dissemination of green agricultural technologies, including water-saving irrigation and precision fertilization. Demonstration zones, training programs, and cross-regional knowledge diffusion mechanisms can help transfer advanced technologies to lagging regions, narrowing the green efficiency gap.
2. Optimize Fiscal Support to Improve the Agricultural Production Environment:
Fiscal policies should be differentiated by region. In central and western provinces with lower efficiency, public investments should target infrastructure, ecological protection, and the promotion of green technologies. In the eastern regions, funding should emphasize upgrading green technologies and fostering institutional innovation, thereby enhancing the overall efficiency and spillover effects of fiscal expenditures.
3. Promote Regional Coordination and Technology Matching for Balanced Development:
To address the pronounced GTFP disparities, region-specific agricultural development strategies are necessary. Interregional cooperation and information sharing should be enhanced through the creation of trans-provincial platforms for green agriculture. Joint training, pilot programs, and collaborative projects can help harmonize green productivity across regions and foster high-quality, sustainable agricultural development nationwide.
Data availability statement
The raw data supporting the conclusions of this article will be made available by the authors without undue reservation.
Author contributions
LL: Visualization, Software, Data curation, Writing – review & editing, Conceptualization, Methodology, Writing – original draft. BZ: Validation, Methodology, Data curation, Writing – review & editing, Conceptualization, Writing – original draft, Software. JZ: Writing – review & editing, Supervision, Formal analysis, Resources, Funding acquisition, Validation. SH: Methodology, Software, Validation, Supervision, Writing – review & editing, Data curation.
Funding
The author(s) declare that financial support was received for the research and/or publication of this article. The research was funded by the National Key Research and Development Program (2023YFD2000102), the Scientific and Technological Innovation Project of the Chinese Academy of Agricultural Sciences (CAAS-ASTIP-2024-AII) and the Agricultural Science and Technology Innovation Program (CAAS-ZDRW202420).
Acknowledgments
All the authors are grateful to the reviewers and editors.
Conflict of interest
The authors declare that the research was conducted in the absence of any commercial or financial relationships that could be construed as a potential conflict of interest.
Generative AI statement
The authors declare that no Gen AI was used in the creation of this manuscript.
Publisher’s note
All claims expressed in this article are solely those of the authors and do not necessarily represent those of their affiliated organizations, or those of the publisher, the editors and the reviewers. Any product that may be evaluated in this article, or claim that may be made by its manufacturer, is not guaranteed or endorsed by the publisher.
References
Abman, R., and Carney, C. (2020). Agricultural productivity and deforestation: evidence from input subsidies and ethnic favoritism in Malawi. J. Environ. Econ. Manag. 103:102342. doi: 10.1016/j.jeem.2020.102342
Adamie, B. A., Balezentis, T., and Asmild, M. (2019). Environmental production factors and efficiency of smallholder agricultural households: using non-parametric conditional frontier methods. J. Agric. Econ. 70, 471–487. doi: 10.1111/1477-9552.12308
Areal, F. J., Balcombe, K., and Tiffin, R. (2012). Integrating spatial dependence into stochastic frontier analysis. Aust. J. Agric. Resour. Econ. 56, 521–541. doi: 10.1111/j.1467-8489.2012.00597.x
Ball, V. E., Lovell, C. A. K., Luu, H., and Nehring, R. (2004). Incorporating environmental impacts in the measurement of agricultural productivity growth. J. Agric. Resour. Econ. 29, 436–460. Avaialble at: http://www.jstor.org/stable/40987243
Banker, R. D., Charnes, A., and Cooper, W. W. (1984). Some models for estimating technical and scale inefficiencies in data envelopment analysis. Manag. Sci. 30, 1078–1092. doi: 10.1287/mnsc.30.9.1078
Benedetti, I., Branca, G., and Zucaro, R. (2019). Evaluating input use efficiency in agriculture through a stochastic frontier production: an application on a case study in apulia (Italy). J. Clean. Prod. 236:117609. doi: 10.1016/j.jclepro.2019.117609
Charnes, A., Cooper, W. W., and Rhodes, E. (1978). Measuring the efficiency of decision making units. Eur. J. Oper. Res. 2, 429–444. doi: 10.1016/0377-2217(78)90138-8
Chen, S., and Gong, B. (2021). Response and adaptation of agriculture to climate change: evidence from China. J. Dev. Econ. 148:102557. doi: 10.1016/j.jdeveco.2020.102557
Chen, Y., Hu, S., Lu, W., Zhu, W., Pan, Y., and Shen, Y. (2025). Improvement of agricultural energy efficiency calculation method based on three-stage DEA. Chin. J. Eco-Agric. 33, 153−165. doi: 10.12357/cjea.20240068
Chen, Y., Miao, J., and Zhu, Z. (2021). Measuring green total factor productivity of China’s agricultural sector: a three-stage SBM-DEA model with non-point source pollution and CO2 emissions. J. Clean. Prod. 318:128543. doi: 10.1016/j.jclepro.2021.128543
Chung, Y. H., Färe, R., and Grosskopf, S. (1997). Productivity and undesirable outputs: a directional distance function approach. J. Environ. Manag. 51, 229–240. doi: 10.1006/jema.1997.0146
Dai, R., and Xu, S. (2022). Spatiotemporal characteristics and influencing factors of the green total factor productivity of wheat in China. Trans. CSAE 38, 304–314. doi: 10.11975/j.issn.1002-6819.2022.08.035
Dubey, A., and Lal, R. (2009). Carbon footprint and sustainability of agricultural production systems in Punjab, India, and Ohio, USA. J. Crop Improv. 23, 332–350. doi: 10.1080/15427520902969906
Emrouznejad, A., and Yang, G. L. (2018). A survey and analysis of the first 40 years of scholarly literature in DEA: 1978–2016. Socio Econ. Plan. Sci. 61, 4–8. doi: 10.1016/j.seps.2017.01.008
Fei, R., and Lin, B. (2017). The integrated efficiency of inputs–outputs and energy – CO2 emissions performance of China’s agricultural sector. Renew. Sust. Energ. Rev. 75, 668–676. doi: 10.1016/j.rser.2016.11.040
Fried, H. O., Lovell, C. A. K., Schmidt, S. S., and Yaisawarng, S. (2002). Accounting for environmental effects and statistical noise in data envelopment analysis. J. Prod. Anal. 17, 157–174. doi: 10.1023/A:1013548723393
FuJun, W., Zhou, Y., YingGang, O., XiangJun, Z., and JieLi, D. (2018). “Government-industry-university-research- promotion” collaborative innovation mechanism construction to promote the development of agricultural machinery technology. IFAC-PapersOnLine 51, 552–559. doi: 10.1016/j.ifacol.2018.08.147
Gong, B. (2018). Agricultural reforms and production in China: changes in provincial production function and productivity in 1978–2015. J. Dev. Econ. 132, 18–31. doi: 10.1016/j.jdeveco.2017.12.005
Grzelak, A., Guth, M., Matuszczak, A., Czyżewski, B., and Brelik, A. (2019). Approaching the environmental sustainable value in agriculture: how factor endowments foster the eco-efficiency. J. Clean. Prod. 241:118304. doi: 10.1016/j.jclepro.2019.118304
He, J., and Han, M. (2024). Analysis of spatial and temporal characteristics and evolution of green total factor productivity in agriculture in the lower yellow river basin. Front. Sustain. Food Syst. 8:1474813. doi: 10.3389/fsufs.2024.1474813
Huang, X., Feng, C., Qin, J., Wang, X., and Zhang, T. (2022). Measuring China’s agricultural green total factor productivity and its drivers during 1998–2019. Sci. Total Environ. 829:154477. doi: 10.1016/j.scitotenv.2022.154477
Huang, W. H., Qi, C. J., Fang, G. Z., and Lei, Q. (2021). Does the agricultural environment regulation promote the improvement of wheaten GTFP. Resour. Environ. Yangtze Basin 30, 459–471. doi: 10.11870/cjlyzyyhj202102020
Li, H. S., Hu, C. P., and Qu, C. H. (2018). Spatio-temporal feature of wheat production efficiency in main producing provinces of China. Chin. J. Agric. Resour. Reg. Plan 39, 91–99. doi: 10.7621/cjarrp.1005-9121.20181015
Li, N., Jiang, Y., Yu, Z., and Shang, L. (2017). Analysis of agriculture total-factor energy efficiency in China based on DEA and malmquist indices. Energy Procedia 142, 2397–2402. doi: 10.1016/j.egypro.2017.12.173
Li, B., Zhang, J., and Li, H. (2011). Research on spatial-temporal characteristics and affecting factors decomposition of agricultural carbon emission in China. China Popul. Resour. Environ. 21, 80–86.
Li, H., Zhang, J., Wang, C., Wang, Y., and Coffey, V. (2018). An evaluation of the impact of environmental regulation on the efficiency of technology innovation using the combined DEA model: a case study of Xi’an, China. Sustain. Cities Soc. 42, 355–369. doi: 10.1016/j.scs.2018.07.001
Liao, J., Yu, C., Feng, Z., Zhao, H., Wu, K., and Ma, X. (2021). Spatial differentiation characteristics and driving factors of agricultural eco-efficiency in Chinese provinces from the perspective of ecosystem services. J. Clean. Prod. 288:125466. doi: 10.1016/j.jclepro.2020.125466
Lin, B., and Chen, Z. (2018). Does factor market distortion inhibit the green total factor productivity in China? J. Clean. Prod. 197, 25–33. doi: 10.1016/j.jclepro.2018.06.094
Lin, B., and Ge, J. (2019). Carbon sinks and output of China’s forestry sector: an ecological economic development perspective. Sci. Total Environ. 655, 1169–1180. doi: 10.1016/j.scitotenv.2018.11.219
Liu, J., and Xu, W. H. H. (2015). Estimation of environmental cost of chemical fertilizer usage in China’s summer and autumn grain production. J. China Agric. Univ. 20, 225–232. doi: 10.1021/jf505172m
Liu, Y., and Feng, C. (2019). What drives the fluctuations of “green” productivity in China’s agricultural sector? A weighted Russell directional distance approach. Resour. Conserv. Recycl. 147, 201–213. doi: 10.1016/j.resconrec.2019.04.013
Liu, S., Lei, P., Li, X., and Li, Y. (2022). A nonseparable undesirable output modified three-stage data envelopment analysis application for evaluation of agricultural green total factor productivity in China. Sci. Total Environ. 838:155947. doi: 10.1016/j.scitotenv.2022.155947
Liu, Y., Sun, D., Wang, H., Wang, X., Yu, G., and Zhao, X. (2020). An evaluation of China’s agricultural green production: 1978–2017. J. Clean. Prod. 243:118483. doi: 10.1016/j.jclepro.2019.118483
Liu, D., Zhu, X., and Wang, Y. (2021). China’s agricultural green total factor productivity based on carbon emission: an analysis of evolution trend and influencing factors. J. Clean. Prod. 278:123692. doi: 10.1016/j.jclepro.2020.123692
Lu, H. W., Li, T. T., Luo, Q. Y., and Gao, M. J. (2020). Spatio-temporal characteristics analysis of the potato production efficiency in China based on the DEA-ESDA model. Research of Agricultural Modernization, 41, 833–842. doi: 10.13872/j.1000-0275.2020.0085
Lu, X., and Xu, C. (2019). The difference and convergence of total factor productivity of inter-provincial water resources in China based on three- stage DEA-Malmquist index model. Sustain. Comput. Inf. Syst. 22, 75–83. doi: 10.1016/j.suscom.2019.01.019
Luo, J., Huang, M., Hu, M., and Bai, Y. (2023). How does agricultural production agglomeration affect green total factor productivity?: empirical evidence from China. Environ. Sci. Pollut. Res. 30, 67865–67879. doi: 10.1007/s11356-023-27106-x
Meng, M., and Qu, D. (2022). Understanding the green energy efficiencies of provinces in China: a super-SBM and GML analysis. Energy 239:121912. doi: 10.1016/j.energy.2021.121912
O’Donnell, C. J., and Coelli, T. J. (2005). A Bayesian approach to imposing curvature on distance functions. J. Econ. 126, 493–523. doi: 10.1016/j.jeconom.2004.05.011
Oh, D. H. (2010). A global Malmquist-Luenberger productivity index. J. Prod. Anal. 34, 183–197. doi: 10.1007/s11123-010-0178-y
Pastor, J. T., and Lovell, C. A. K. (2005). A global Malmquist productivity index. Econ. Lett. 88, 266–271. doi: 10.1016/j.econlet.2005.02.013
Solomon, S. (2007). IPCC (2007): climate change the physical science basis. AGU Fall Meet. Abstr. 2007, U43D–U01D.
Sun, Y., Li, Y., Gao, J., and Yan, Y. (2022). Spatial and temporal patterns of urban land use structure in small towns in China. Land 11:1262. doi: 10.3390/land11081262
Tone, K. (2001). A slacks-based measure of efficiency in data envelopment analysis. Eur. J. Oper. Res. 130, 498–509. doi: 10.1016/S0377-2217(99)00407-5
Tone, K., and Tsutsui, M. (2014). Dynamic DEA with network structure: a slacks-based measure approach. Omega 42, 124–131. doi: 10.1016/j.omega.2013.04.002
Wang, C., Ibrahim, H., Wu, F., and Chang, W. (2025). Spatial and temporal evolution patterns and spatial spillover effects of carbon emissions in China in the context of digital economy. J. Environ. Manag. 373:123811. doi: 10.1016/j.jenvman.2024.123811
West, T. O., and Marland, G. (2002). A synthesis of carbon sequestration, carbon emissions, and net carbon flux in agriculture: comparing tillage practices in the United States. Agric. Ecosyst. Environ. 91, 217–232. doi: 10.1016/S0167-8809(01)00233-X
Xu, X., Huang, X., Huang, J., Gao, X., and Chen, L. (2019). Spatial-temporal characteristics of agriculture green total factor productivity in China, 1998–2016: based on more sophisticated calculations of carbon emissions. Int. J. Environ. Res. Public Health 16:3932. doi: 10.3390/ijerph16203932
Yin, J. Y., Cao, Y. F., and Tang, B. J. (2019). Fairness of China’s provincial energy environment efficiency evaluation: empirical analysis using a three-stage data envelopment analysis model. Nat. Hazards 95, 343–362. doi: 10.1007/s11069-018-3399-4
Zhang, J., Li, H., Xia, B., and Skitmore, M. (2018). Impact of environment regulation on the efficiency of regional construction industry: a 3-stage data envelopment analysis (DEA). J. Clean. Prod. 200, 770–780. doi: 10.1016/j.jclepro.2018.07.189
Zhang, J., Liu, Y., Chang, Y., and Zhang, L. (2017). Industrial eco-efficiency in China: a provincial quantification using three-stage data envelopment analysis. J. Clean. Prod. 143, 238–249. doi: 10.1016/j.jclepro.2016.12.123
Zhang, R., and Lu, J. (2022). Spatial–temporal pattern and convergence characteristics of provincial urban land use efficiency under environmental constraints in China. Int. J. Environ. Res. Public Health 19:10729. doi: 10.3390/ijerph191710729
Zhang, X., Sun, S., and Yao, S. (2024). Spatiotemporal distribution and dynamic evolution of grain productivity efficiency in the Yellow River Basin of China. Environ. Dev. Sustain. 26, 12005–12030. doi: 10.1007/s10668-023-03619-w
Zhang, Y., Yin, Y., Li, F., Duan, W., Xu, K., and Yin, C. (2023). Can the outsourcing improve the technical efficiency of wheat production with fertilization and pesticide application? Evidence from China. J. Clean. Prod. 422:138587. doi: 10.1016/j.jclepro.2023.138587
Zhang, Q., Zhang, F., Wu, G., and Mai, Q. (2021). Spatial spillover effects of grain production efficiency in China: measurement and scope. J. Clean. Prod. 278:121062. doi: 10.1016/j.jclepro.2020.121062
Zhao, H., Guo, S., and Zhao, H. (2019). Provincial energy efficiency of China quantified by three-stage data envelopment analysis. Energy 166, 96–107. doi: 10.1016/j.energy.2018.10.063
Keywords: wheat, green total factor productivity, three-stage DEA-GML, spatial pattern evolution, kernel density estimation
Citation: Liu L, Zheng B, Zhao J and Hao S (2025) Measurement and spatial evolution of green total factor productivity in China’s wheat production based on the three-stage DEA-GML model. Front. Sustain. Food Syst. 9:1615861. doi: 10.3389/fsufs.2025.1615861
Edited by:
Juan Lu, Nanjing Agricultural University, ChinaReviewed by:
Xuetao Sun, Ocean University of China, ChinaShuai Liu, Chinese Academy of Social Sciences (CASS), China
Copyright © 2025 Liu, Zheng, Zhao and Hao. This is an open-access article distributed under the terms of the Creative Commons Attribution License (CC BY). The use, distribution or reproduction in other forums is permitted, provided the original author(s) and the copyright owner(s) are credited and that the original publication in this journal is cited, in accordance with accepted academic practice. No use, distribution or reproduction is permitted which does not comply with these terms.
*Correspondence: Junye Zhao, emhhb2p1bnllQGNhYXMuY24=
†These authors have contributed equally to this work