 Luciana B. Malbos1,2Magdalena L. Iglesias-Montes1,2
 Irene T. Seoane1,2
 Viviana P. Cyras1,2
 Liliana B. Manfredi1,2*
- 1Facultad de Ingeniería, Instituto de Investigaciones en Ciencia y Tecnología de Materiales (INTEMA), Universidad Nacional de Mar del Plata—Consejo Nacional de Investigaciones Científicas y Técnicas (CONICET), Mar del Plata, Argentina
- 2Departamento de Ingeniería Química y en Alimentos, Facultad de Ingeniería, Universidad Nacional de Mar del Plata, Mar del Plata, Argentina
This study aims to analyze the effects of accelerated weathering on the properties of films based on plasticized polylactic acid (PLA) and its blends with thermoplastic starch (TPS). The samples were collected and characterized at nine specific time intervals from 24 to 996 h. Changes in thermal and chemical properties were assessed by means of differential scanning calorimetry (DSC), thermogravimetry (TGA), Fourier transform infrared spectroscopy (FTIR), and X-ray diffraction (XRD). Moreover, variations in flexural mechanical properties, morphology, color, and transparency due to the accelerated weathering test were also investigated. It was observed that the molecular weight progressively decreased with increasing exposure time for all the samples and it was related to the deterioration of the mechanical and other physical properties of the weathered materials. PLA films showed a significant increase in crystallinity during the first 48 h of exposure in the chamber, which was consistent with the observed decrease in both transparency and ductility of the samples. The PLA/TPS films exhibited a higher susceptibility to degradation, resulting in their complete disintegration just 24 h after the weathering test began. All the samples were also placed under outdoor conditions and were collected for characterization up to 324 days of exposure. The neat and plasticized PLA films both exhibited an increase in crystallinity and opacity after 50 days of outdoor exposure, reaching levels comparable to those observed after 24–48 h in the more severe conditions generated by the combined variables of the accelerated weathering. Meanwhile, the neat TPS showed significant deterioration under environmental conditions, which directly contributed to the degradation seen in the PLA/TPS films. Therefore, PLA/TPS blends appear to be a promising material for single-use packaging applications, offering enhanced degradability and reduced costs compared to pure PLA-based films.
1 Introduction
Today, the plastics industry plays a fundamental role in the global economy, as its production has increased exponentially, reaching ~400 million tons annually (Plastics Europe AISBL, 2023). Polymers are unique and versatile materials, capable of meeting countless functional and aesthetic demands, more than 40% of which are used in the manufacture of packaging. The growing global concern over fossil fuel depletion and the environmental impact of petroleum-derived compounds in recent decades has driven the development of more sustainable polymeric materials (Dhall and Alam, 2020; Marturano et al., 2023). An alternative to mitigate these disadvantages is the use of biodegradable and biobased polymers, which not only offer ecological benefits through their final disposal but also help extend the shelf life of food. Bio-based materials can be derived wholly or partially from biological sources, such as plants, animals, or even fungi (Shogren et al., 2019), and can also be obtained from the valorization of bio-waste. The majority of the biobased polymers used in food packaging are aliphatic polyesters (polylactic acid), proteins (gelatin) and polysaccharides (chitosan, starch, and cellulose; Parente et al., 2023). However, biobased systems represent a relatively small portion of the current packaging market, as it is not easy to provide benefits comparable to those provided by the traditionally used materials they seek to replace. Particularly, polylactic acid (PLA) is a thermoplastic polyester obtained from renewable resources such as corn, sugar beets, and potatoes. The US Food and Drug Administration (FDA) considers it safe for food packaging applications (Ahmed and Varshney, 2011). PLA's strength and stiffness are comparable to those of conventional plastics, and it also has good transparency, biocompatibility, and non-toxicity. However, PLA's disadvantages, such as fragility, low thermal stability, and poor gas and UV barrier properties, limit its application as a packaging material. To improve these properties, plasticizers, nanofillers, and other additives, are often added to the biodegradable polymer (Enumo et al., 2020). However, to maintain the characteristics of a sustainable and eco-friendly material, it is important that the additives selected for incorporation into the formulation should be at least biobased. Moreover, the low cost of starch as well as its abundance, renewability, biodegradability and non-toxicity make it a good candidate for use in food packaging market (Muthuraj et al., 2018). Thermoplastic starch (TPS) can be produced by processing starch in the presence of plasticizers, such as glycerol, using conventional melt-processing techniques like extrusion, injection molding, and film blowing. These methods make TPS suitable for various applications, including packaging and the biomedical field. However, several drawbacks hinder its widespread application. The primary limitations of starch based materials include poor mechanical performance and high water vapor permeability (Eslami et al., 2022).
In this context, blending PLA with TPS has been proposed as a strategy to overcome their respective drawbacks while also reducing production costs, resulting in films with improved functional properties. Additionally, natural plasticizers were incorporated into the blends to enhance processability. Glyceryl tributyrate (TB) and triethyl citrate (TEC) were selected, both of which are biodegradable and non-toxic. TB is sourced from fats and oils, whereas TEC, an ester of citric acid, is widely used as a food additive. Therefore, the aim of this work is not only to reduce costs by incorporating an inexpensive, biodegradable polymer into PLA, but also to mitigate environmental pollution by addressing the slower degradation rate of PLA compared to that of starch.
Given the growing demand for sustainable materials and the urgent need to reduce environmental impact, understanding the degradation behavior of biodegradable polymers is critical, particularly for their application in food packaging. This work aims to evaluate the influence of PLA/TPS blend formulations, including the incorporation of additives, on their degradation behavior under accelerated weathering conditions. Special attention was paid to how these modifications affect the structural, mechanical, and properties over time. Furthermore, the study extends the evaluation to outdoor exposure tests, aiming to establish a correlation between real-time environmental degradation and artificial aging protocols, providing insights into the long-term performance and stability of these materials in real-life conditions.
2 Experimental
2.1 Materials
Polylactic acid (PLA) 3D850 was provided by Ingeo®, NatureWorks (USA). Glyceryl tributyrate (TB) obtained from Fluka Analytical, Sigma-Aldrich (≥98.5%) and triethyl citrate (TEC) from Aldrich (≥98.0%) were the plasticizers used for PLA. Figure 1 shows the chemical formula of both plasticizers. Native potato starch was kindly provided by Avebe, Argentina S.A.® (Argentina). Glycerol provided by Anedra® (≥99.5%) was used as plasticizer to obtain the thermoplastic starch.
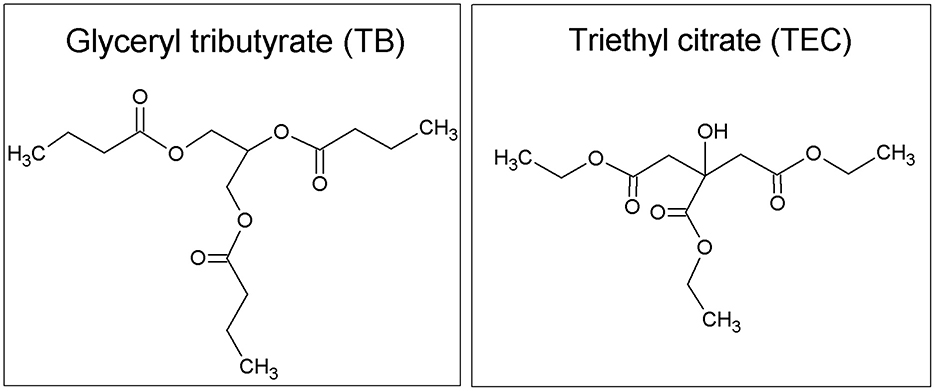
Figure 1. Chemical formula of the plasticizers TB and TEC.
2.2 Processing procedure
2.2.1 Preparation of thermoplastic starch (TPS)
Starch powder (60 g/100 g of system) was dispersed in a mixture of glycerol (20 g/100 g of system) and water (20 g/100 g of system). The suspension was manually mixed until complete absorption of the liquid phase into the starch. The mixture was processed by extrusion technique using a twin screw extruder ThermoScientific® process 11, using the following temperature profile: 100–110–120–130–130–130–120–100°C, and a screw speed of 25 rpm. Then, the filaments were pelletized in a cryogenic mill IKA® A11 BASIC, and subsequently used to prepare the blends.
2.2.2 Preparation of PLA based films
Before being processed, PLA pellets were dried in a Cole Parmer vacuum oven for 24 h in order to prevent PLA hydrolysis during processing. Then, extruded samples of neat and plasticized PLA were obtained. PLA pellets were mixed with one of the plasticizer manually and then introduced in the same twin screw extruder previously described, using the following temperature profile: 195–198–195–198–198–198–198–200°C and a screw speed of 20 rpm. The proportions of plasticizers (TB or TEC) used was 12.5 wt.% of the final mixture weight. Neat PLA pellets were also processed following the same procedure than for the plasticized samples.
Additionally, PLA/TPS blends were extruded following the last temperature profile and screw speed described previously. Neat PLA (or plasticized PLA) was manually mixed with TPS pellets prior to be introduced in the extruder hopper, maintaining the proportion of 30 wt.% TPS of the final mixture weight.
Films of all the extruded samples were obtained by compression molding in a hydraulic press at 195°C following the procedure: they were kept between the two hot plates at atmospheric pressure for 5 min until melting and then under a pressure of 70 kgf cm−2 for another 5 min. Finally, the films were fast-cooled to room temperature.
The processing conditions, temperature and screw speed, were selected considering the thermal properties of the polymers and in order to obtain a homogeneous extruded product. These processing conditions contribute to partial degradation of PLA leading to chain scission, plasticizer volatilization, and initial crystallization (Velghe et al., 2023). This effect was quantified by measuring the molecular weight of the PLA pellets using GPC, and the results are = 159,684 and = 196,087, which yielded values that were clearly higher than those measured after processing (shown in Section 3.1.1).
2.3 Methods
2.3.1 Accelerated weathering test and outdoor exposure
Accelerated weathering tests were carried out in the test chamber QUV Accelerated Weathering Tester Q-Lab equipped with 4 UVA-340 lamps (wavelength from 365 to 295 nm), irradiance of 0.77 W/m2 at up to 60°C temperature and 100% relative humidity. The weathering conditions were determined in accordance with the ASTM D G154 Operating Fluorescent Light Apparatus for UV AcExposure of Nonmetallic Materials, cycle 1. The samples were exposed to 8 h of UV irradiance at 60°C followed by 4 h of condensation without irradiation at 50°C for 996 h (41.5 days). Samples were removed from the weathering chamber for characterization at 24, 48, 120, 168, 228, 360, 528, 864, and 996 h.
Outdoor exposure of the neat and plasticized PLA, TPS, and PLA/TPS samples was carried out in the city of Mar de Cobo, Buenos Aires, Argentina (Latitude 37°46′00′ S, Longitude 57°26′00′ W). The samples were mounted on a support and directly exposed to the natural environmental conditions between the months of April to December 2024 and January 2025. Summary of the relevant values of the weathering conditions, obtained from National Meteorological sources corresponding to the location and time period of the outdoor test, is showed in Table 1 to provide the relevant context where the degradation occurred. Samples were collected for characterization at 15, 50, 162, 239, and 324 days.
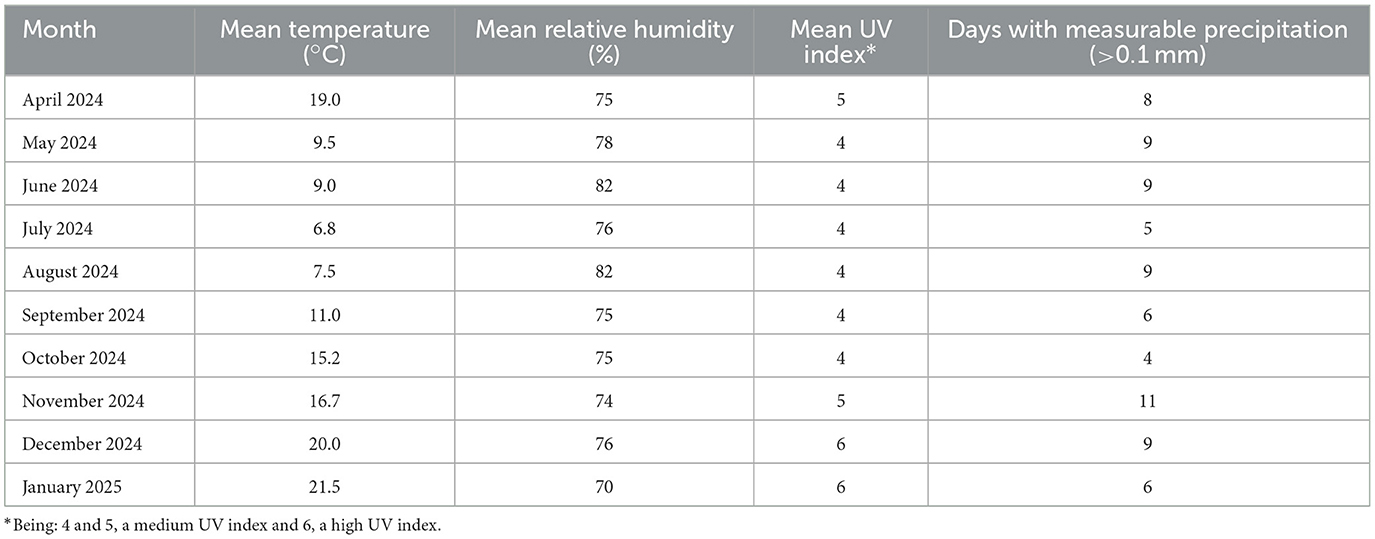
Table 1. Summary of the relevant average values of the natural weathering conditions during the period of the outdoor test.
2.3.2 Gel permeation cromatography (GPC)
The molecular weight of PLA in the samples before and after exposed in weathering conditions were evaluated with a Shimadzu system with a series of Shim-Pack columns and equipped with a refractive index detector. The eluent used was tetrahydrofuran (THF) at a flow rate of 1 mL/min at 25°C. Sample solutions were dissolved in THF at 3 mg/mL at 40°C and filtered through a 0.5 μm polytetrafluoroethylene membrane prior to injection. Calibration was performed using polystyrene standards.
The average number of chain scissions per macromolecule was determined by Equation 1 following the methodology described by Sadi et al. (2010):
where and are the number-average molecular weight of unweathered and weathered samples for a given time t, respectively.
2.3.3 Differential scanning calorimetry (DSC)
Thermal characterization of the films was performed with a Pyris 1 (Perkin Elmer) under nitrogen atmosphere, with a heating rate of 10°C/min from −50 to 220°C. The following thermal properties of the samples were calculated from the DSC scans: the glass transition temperature (Tg), the crystallization temperature (Tc) and the melting temperature (Tm). The Tg was measured at the half-height of the heat capacity increase from the DSC curve. The degree of crystallinity (Xc) was calculated by means of Equation 2:
where the ϕ is the mass fraction of the PLA in the blend, ΔHm is the melting enthalpy, ΔHc is the enthalpy of crystallization and is the melting enthalpy of PLA 100% crystalline (93 J/g; Avérous, 2008).
2.3.4 Fourier transform infrared spectroscopy (FTIR)
FTIR spectra of the films were obtained using a FTIR Nicolet 6,700 spectrometer (Thermo Scientific Instrument) in ATR mode in the 4,000–400 cm−1 range. The measurements were averaged over 64 scans. The C–H stretching band at 2,988 cm−1 were chosen as internal standard (Kaplan et al., 2019).
2.3.5 X-ray diffraction (XRD)
The crystalline structure of the samples was evaluated on an PANalytical X'PERT PRO diffractometer (Netherlands) with CuKα radiation (λ = 1.5406 Å). The X-ray tube was operated at 40 kV and 40 mA. The diffractograms were acquired at a scanning speed of 2°/min in the range from 5 to 60°.
The overall crystallinity degree (Xc) was calculated by means of Equation 3, that relates amorphous and crystalline areas assessed from the spectra (Seoane et al., 2017):
The crystallite size was calculated using the Scherrer Equation (Giełdowska et al., 2022):
where L(hkl) is the average sizes of the crystalline areas orthogonal to lattice planes (hkl), K is the Scherrer constant (K = 0.89), λ = 0.15406 is the X-ray wavelength, B is the half-peak width of the XRD peak, and θ is the Bragg angle for planes (hkl). Equation 4 was applied to the main diffraction peaks at 2θ values of 16.5 and 19°, corresponding to the (110)/(200) and (203) crystallographic planes, respectively.
2.3.6 Thermogravimetric analysis (TGA)
Thermal degradation analyses of the films were carried out under nitrogen atmosphere (50 mL/min flow rate) at a heating rate of 10°C/min in the 25–700°C range, using a TGA-50 SHIMADZU thermogravimetric analyzer (Japan).
2.3.7 Uniaxial tensile test
An INSTRON Emic 23–50 universal testing machine operated at a speed of 1 mm/min was used to measure the uniaxial tensile properties of the films according to ASTM D 638–03. The tested samples were cut from the films using a scalpel, measuring 25 mm in length and 5 mm in width. The Young's modulus, tensile strength and strain at break were determined from the assays as the average value of five samples for each system. The standard deviation was calculated as a measure of dispersion.
2.3.8 Field emission scanning electron microscopy (FESEM)
The morphology of the samples were examined by means of field emission scanning electron microscopy (FESEM) in a ZEISS Crossbeam 350. The samples were previously subjected to brittle fracture by immersion in liquid nitrogen, placed on a support and then covered with a thin layer of gold.
2.3.9 UV-visible absorption
The light transmission of the films was determined in by quantifying the absorption of light at wavelengths between 300 and 1,000 nm using an UV–visible spectrophotometer Agilent 8453.
2.3.10 Colorimetric properties
A CIELab color space by means of a Lovibond Colorimeter RT500 (Amesbury, United Kingdom) was used to analyze the color properties of the films. It was calibrated against white standard tile and the evaluated area was 8 mm in diameter. Color coordinates, L* (lightness), a* (green–red), and b* (blue–yellow) and percent opacity (%Op) were measured. The average of three measurements at random positions over the film surfaces were reported. Total color difference (ΔE) was evaluated with respect to the white control according to Equation 5:
where , and ; being 1.38 and .
3 Results and discussion
3.1 Evaluation of chemical and thermal properties
3.1.1 Gel permeation chromatography
Accelerated weathering is expected to cause polymer chain scission due to photolysis and hydrolysis reactions, leading to a reduction in molecular weight. To corroborate this, the variation in PLA molecular weight with exposure time in the chamber was determined by means of GPC tests. Table 2 shows the values of , the weight-average molecular weight () and Polydispersity Index (PDI) measured for the films of neat and plasticized PLA. As predicted, the molecular weight progressively decreased with increasing exposure time for all the samples (Zhang et al., 2021). However, the value dropped dramatically at 528 h for the plasticized samples, while for the pure PLA films, this occurred at longer times. This may be because the presence of the plasticizer reduces the interaction between the polymer chains, facilitating the entry of water and subsequent hydrolysis and chain rupture. Chain scission is also reflected in the increase in the PDI with increasing exposure time, indicating the formation of low molecular weight chains and a greater heterogeneity in polymer chain sizes (Rebelo et al., 2022). This was further confirmed by assessing the number of chain scissions by means of Equation 1, which is directly related to the extent of PLA chain degradation after weathering (Lv et al., 2018). As shown in Table 2, this number increased with exposure time for all the samples, with a more pronounced effect observed in the plasticized samples. The decrease in and , along with the increase in PDI and number of chain scissions, indicates significant polymer degradation, which likely contributes to the deterioration of the mechanical and physical properties of the weathered materials, as discussed below.
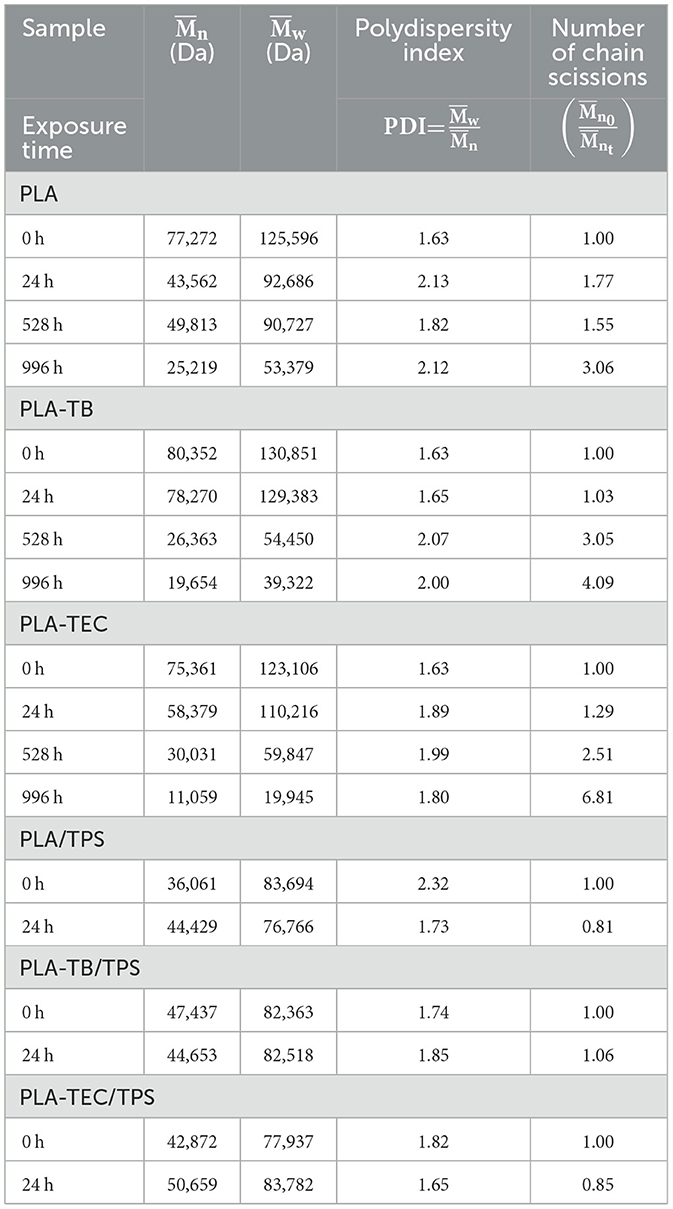
Table 2. Values of , , and PDI measured for the films of neat and plasticized PLA, and the blends with TPS, at different exposure times.
The samples containing TPS degraded quickly under the chamber conditions, disintegrating within 24 h of exposure, which made further characterization impossible. This suggests that starch degrades more readily than PLA under high humidity and temperature conditions due to its hydrophilic character (Lv et al., 2018). Moreover, the molecular weight of PLA is lower when blended with TPS (Table 2), likely as a result of hydrolytic degradation triggered by the presence of hydrophilic components.
3.1.2 Thermal analysis
DSC tests were carried out on the films at different exposure times in the chamber and the curves obtained for the heating scan are shown in Figure 2. The disappearance of the crystallization peak at short exposure times suggests a rapid increase in the crystallinity of the samples. The percentage of crystallinity (Xc) of the different samples was calculated using Equation 2 and the values are reported in Table 3. It was observed that the plasticized samples exhibited a faster increase in crystallinity compared to neat PLA. The plasticized samples achieved a remarkable 150% increase in Xc within just 48 h of exposure, whereas the neat PLA films required 120 h to reach a comparable Xc value of 130%. Furthermore, the crystallinity of the plasticized films remained higher than that of neat PLA at 996 h, the final point of the test, regardless of the type of plasticizer used. This occurs because the chamber's humidity promotes the hydrolysis of PLA chains, facilitating their breakage and movement, which in turn enhances crystallization. This process is further accelerated in the presence of plasticizers, as they increase the free volume, allowing for greater mobility and rearrangement of the polymer chains (Iglesias Montes et al., 2019). The crystallization temperature (Tc) of neat PLA gradually shifted to lower values with increasing weathering time, likely due to the reduction in molecular weight, as shorter polymer chains tend to crystallize more easily at lower temperatures. In parallel, a slight decrease in the melting temperature (Tm) was also observed at longer exposure times, which can be attributed to the formation of less perfect crystals under the prevailing humidity and temperature conditions.
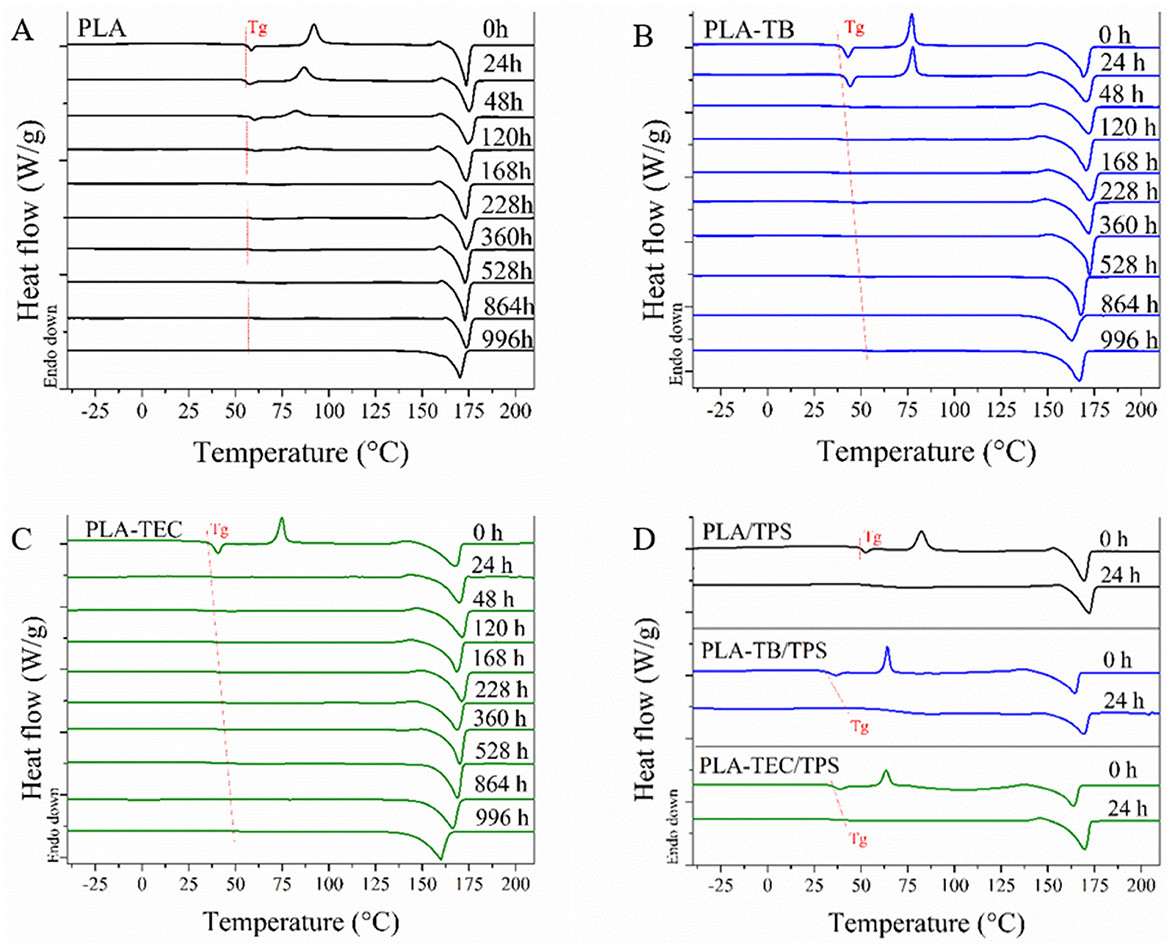
Figure 2. DSC curves of neat (A), plasticized PLA films (B, C) and their blends with TPS (D), weathered at different exposure times.
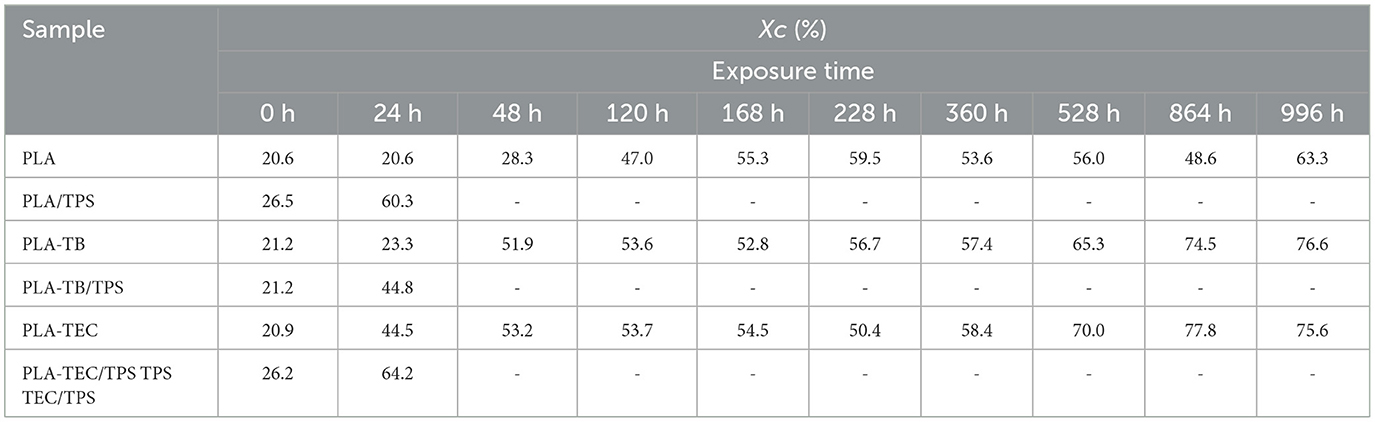
Table 3. Percentage of crystallinity calculated from DSC data (Xc), for films subjected to different exposure times.
The plasticizing effect of TB and TEC was also reflected in the diminution of the glass transition temperature (Tg) of PLA, which has already been corroborated in previous studies (Malbos et al., 2024). Initially, the Tg of the plasticized films was lower than that of pure PLA (55.45°C), with values of 38.1°C for PLA-TB and 35.1°C for PLA-TEC. The difference in Tg values measured for samples plasticized with TB and TEC can be attributed to the structural differences between the two plasticizers and their interactions with PLA. This is consistent with previous studies, which have shown that the thermal properties of PLA are influenced by the type of plasticizer used, depending on its molecular structure and compatibility with the polymer, as was also related below with the tensile test results (Maiza et al., 2016; Ruiz et al., 2021). Then, under accelerated weathering conditions, the Tg of neat PLA remains almost unchanged throughout the test (Figure 2), a finding consistent with the results reported by Zhou and Xanthos (2008) who studied the hydrolytic degradation of PLLA subjected to accelerated hydrolytic degradation over a temperature range of 50–70°C. However, the Tg of PLA in the plasticized samples increased over the course of the test (Figure 2), which can be attributed to the loss of plasticizer under the applied conditions, as further confirmed by the TGA results discussed below. Additionally, the glass transition became progressively less pronounced in the DSC analyses as weathering progressed, likely due to a reduction in the amorphous phase content of PLA associated with the increase in crystallinity (Xc).
Figure 2 also displays the thermal test results for the samples containing TPS up to 24 h of exposure because these samples degraded completely after this time.
It is evident that TPS acts as a nucleating agent when added to PLA. This observation aligns with findings reported by other authors, who analyzed the crystallization kinetics of PLA and concluded that the presence of TPS enhances both the crystallization rate and the degree of crystallinity in the samples (Cai et al., 2011; Li and Huneault, 2008; Li et al., 2013). They found that the interfacial area within the PLA/TPS blend can influence the nucleation and crystallization process of the material. The blends showed a behavior comparable to that of neat and plasticized PLA films after 24 h of exposure, marked by an increase in both glass transition temperature (Tg) and PLA crystallinity. However, the presence of TPS also promotes PLA crystallization under these conditions, as the increase in crystallinity observed in the blends after 24 h is comparable to that reached by the plasticized samples at 48 h and by neat PLA at 120 h.
Samples of neat and plasticized PLA were analyzed using thermogravimetric analysis, providing valuable insights into the thermal degradation behavior of the materials. Figure 3 shows the curves of percentage of mass loss and its derivative with respect to temperature for all the films before to be exposed to accelerated weathering in the chamber. Moreover, the thermal degradation profiles of plasticizers TB and TEC were also reported in Figure 3. PLA was observed to degrade in a single-step process, with a maximum degradation temperature of 353°C, and complete mass loss at the end of the test. The decomposition of PLA has been found to occur via a non-radical mechanism, specifically through a back-biting ester interchange reaction, which produces acetaldehyde, carbon dioxide, carbon monoxide, cyclic oligomers, and lactide (Chen et al., 2012; Kervran et al., 2022; Mofokeng and Luyt, 2015). On the other hand, both TB and TEC degrade at lower temperature than the PLA samples, with a maximum degradation temperature around 200°C, exhibiting similar thermal degradation behavior due to their comparable chemical structures. It is possible to observe in Figure 3 both the peaks corresponding to the degradation of PLA and TB or TEC in the plasticized samples. The peak at lower temperature appeared in the region corresponding to the decomposition of the plasticizers, while the second one at higher temperature was attributed to the degradation of PLA. Then, the addition of plasticizers did not significantly affect the maximum degradation temperature of PLA, which remained higher than the temperature chosen for the processing conditions of the samples. For thermoplastic processability, an essential characteristic is the material's thermal stability at the processing temperature. This temperature must be significantly higher than the melting temperature (Tm) and lower than the degradation temperature (Td) to prevent polymer degradation during processing.
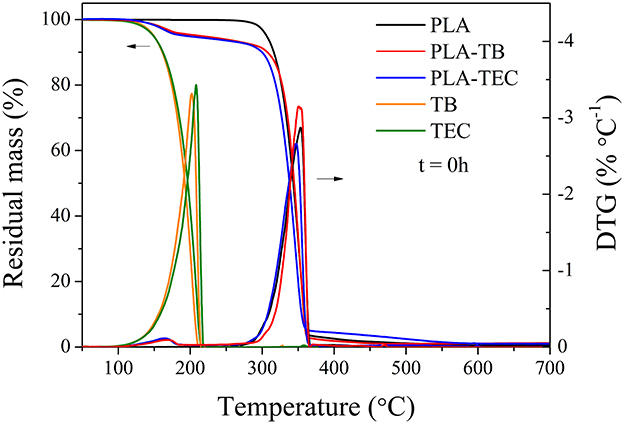
Figure 3. Residual mass and DTG curves of neat PLA, PLA-TB, PLA-TEC, and plasticizers TB and TEC, before being exposed to accelerated aging.
Figure 4 shows the curves of percentage of mass loss for the plasticized PLA samples exposed to different accelerated aging times in the range between 100 and 300°C. A progressive loss of plasticizer was observed as the material undergoes degradation. In the case of the PLA-TEC sample, at 996 h of exposure, practically no loss of mass was detected due to the plasticizer, and this drop was minimal for PLA-TB at the same exposure time. These results suggest that nearly all of the plasticizer was eliminated by the end of the exposure period. Additionally, they align with the progressive increase in Tg over time for these samples, previously observed.
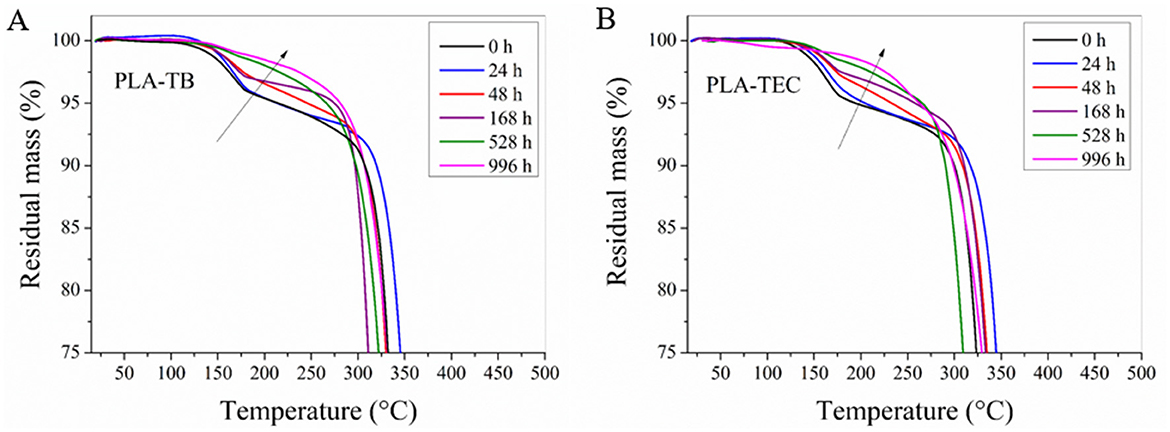
Figure 4. Residual mass vs. temperature curves of the plasticized samples with TB (A) and TEC (B) at different exposure times to accelerated weathering.
From the DTG curves of the neat and plasticized PLA films (Figures 5A–C), it was observed that the temperature corresponding to the maximum degradation rate of PLA initially increased slightly after 24 h of exposure, then gradually decreased, and later increased again at longer exposure times. This behavior can be correlated with the initial rise in crystallinity after 24 h, which was subsequently counteracted by degradation effects and, ultimately, by the loss of plasticizer as the exposure time progressed (Figure 4).
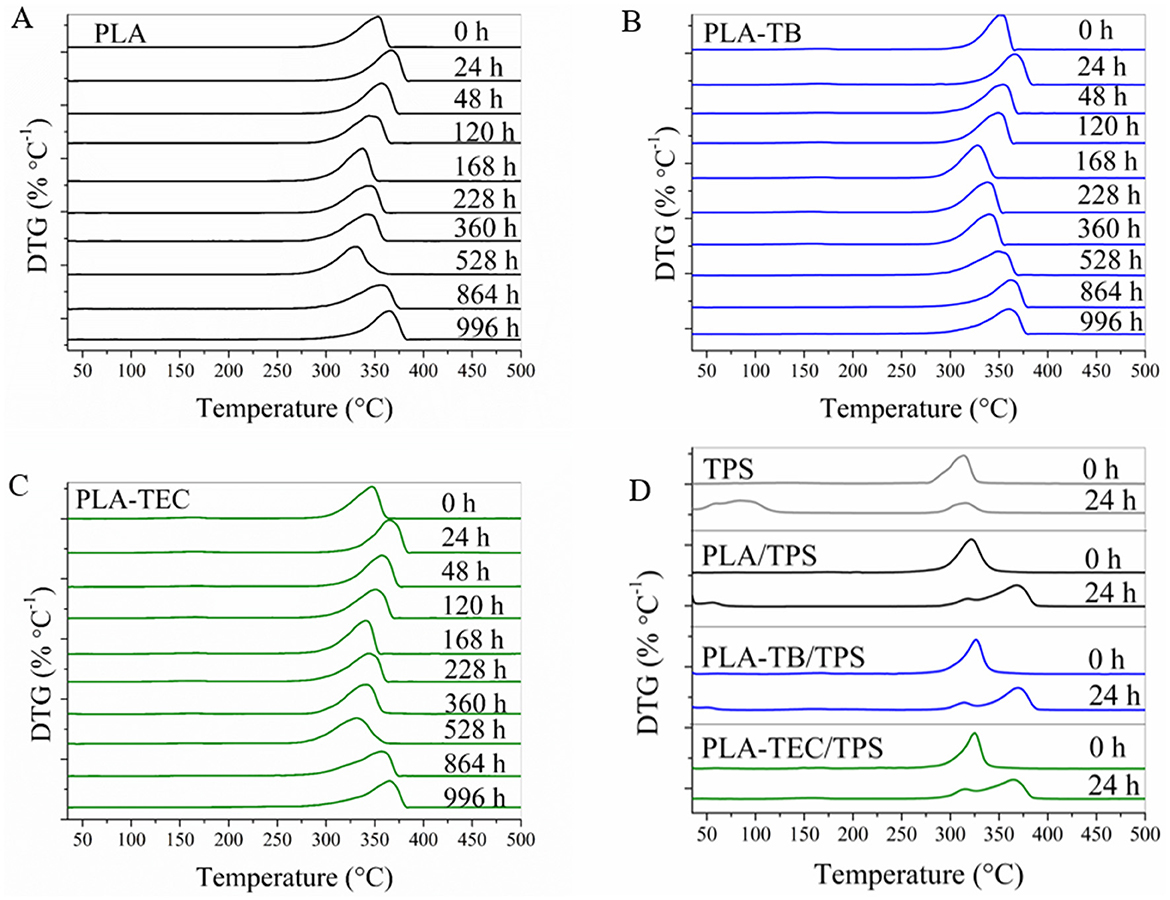
Figure 5. DTG curves at different weathering times of: (A) neat PLA; (B) PLA-TB; (C) PLA-TEC; (D) TPS, PLA/TPS, PLA-TB/TPS, and PLA-TEC/TPS films.
On the other hand, Figure 6 shows that neat TPS thermally degraded in two steps. It was reported that the first step, with a DTG peak at ~130°C, corresponds to water evaporation, while the second step is associated with the thermal decomposition of starch (Ojogbo et al., 2018). As expected, the percentage of the weight loss in the first step is directly related to the moisture content of the starch. Liu et al. (2008) found that the initial water content of the sample had no impact on the onset of decomposition temperature of starch, as these are two distinct processes. The second step involves the breakdown of chemical bonds in the starch chain, as well as oxidation and dextrinization (Winkler et al., 2014). Thermal reactions for starch began around 300°C, involving condensation between the hydroxyl groups of starch chains, leading to the formation of ether segments and the release of water molecules and other small species. The structure of starch disintegrates at 400°C, and beyond this point, forms a highly cross-linked system. Carbonization reactions occur in the system at temperatures above 500°C, leading to the formation of relatively large conjugated aromatic structures at around 600°C. With further heating, these structures transform into amorphous carbon (Ojogbo et al., 2018; Zhang et al., 2002). The TPS film, after being exposed in the chamber under accelerated aging conditions for 24 h, showed an increase in the height of the first peak at a lower temperature, due to the loss of the water absorbed by the sample during that period (Figure 5D).
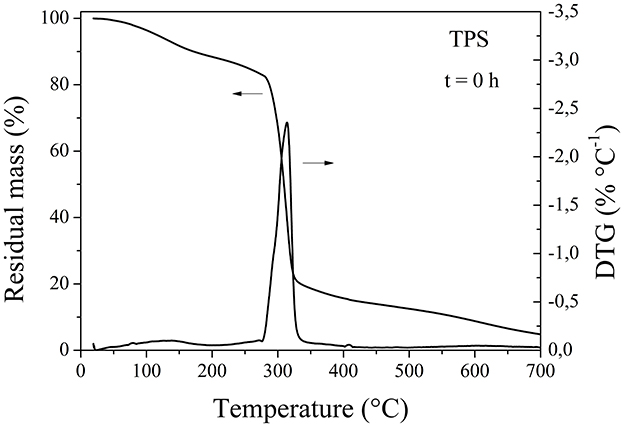
Figure 6. Residual mass and DTG curves of neat TPS, before being exposed to accelerated weathering.
For the PLA/TPS samples prior to exposure in the chamber, the DTG curve in Figure 5D revealed a single intermediate peak located between the characteristic peaks of each individual polymer. However, after 24 h of exposure, the peaks corresponding to each polymer became distinguishable due to the increase in the degradation temperature of PLA, as illustrated in Figure 5A. The DTG curves of the plasticized PLA/TPS samples (also shown in Figure 5D) exhibited a similar evolution, indicating that plasticization did not significantly alter the phase separation behavior upon weathering.
This is consistent with the analogous shift of the PLA peak observed after the addition of both plasticizers, as previously explained. These results suggest that PLA and TPS are immiscible, forming two separate phases.
3.1.3 XRD and FTIR spectrometry
From the diffractograms obtained by XRD (Figure 7), an increase in the crystallinity of the samples was observed with the exposure time in the chamber. It was clearly evidenced by the progressive increase in the intensity of the peaks in the 2θ = 16.5 and 19° corresponding to the lattice planes (110/200) and (203) of the PLA crystals (Hsieh et al., 2020) and others of lower intensity in 2θ = 24.3, 28.6, and 32.2°. In the case of neat PLA, these peaks began to be more noticeable after 48 h of exposure, while for plasticized samples and blends with TPS, they could already be clearly identified after 24 h. To better visualize the changes in the diffractograms over the exposure period, the spectra of both neat and plasticized PLA samples at the initial and final test times are plotted in Figure 8. The percentage of overall crystallinity of the different samples was calculated from the XRD spectra using Equation 3, and the results are shown in Table 4. It was observed that the values follow the same trend as the results obtained by DSC (Table 3). The combination of UV irradiation cycles at 60°C, humidity and the decrease in the molecular weight of PLA favor the crystallization of the polymer chains (Kaynak and Sari, 2016). The Xc values calculated from XRD do not exactly match those calculated from DSC, due to the different technique used. In addition, there is a greater inaccuracy in the calculation at low exposure times, where the peaks are less defined in the spectra (Kaavessina et al., 2013).
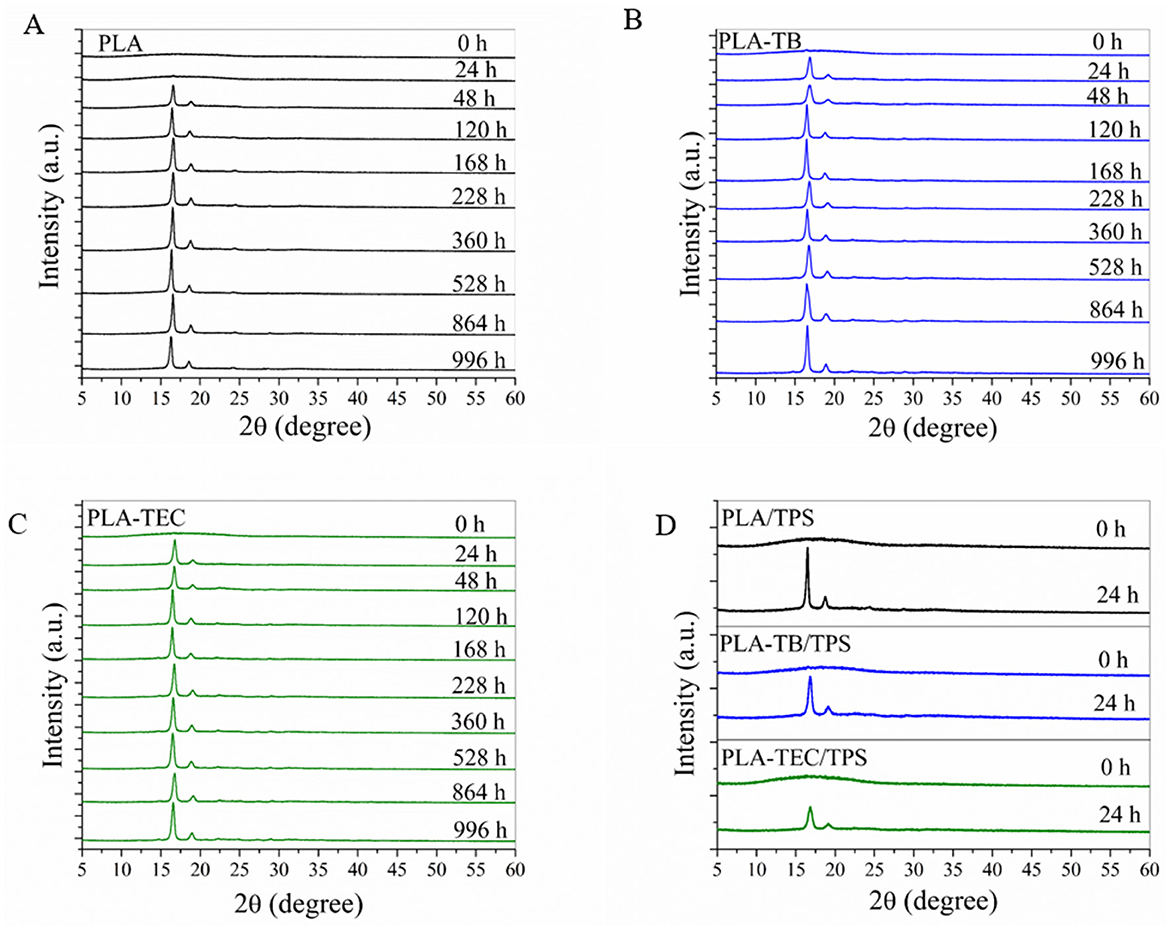
Figure 7. XRD diffractograms at different weathering times of: (A) neat PLA; (B) PLA-TB; (C) PLA-TEC; (D) TPS, PLA/TPS, PLA-TB/TPS, and PLA-TEC/TPS films.
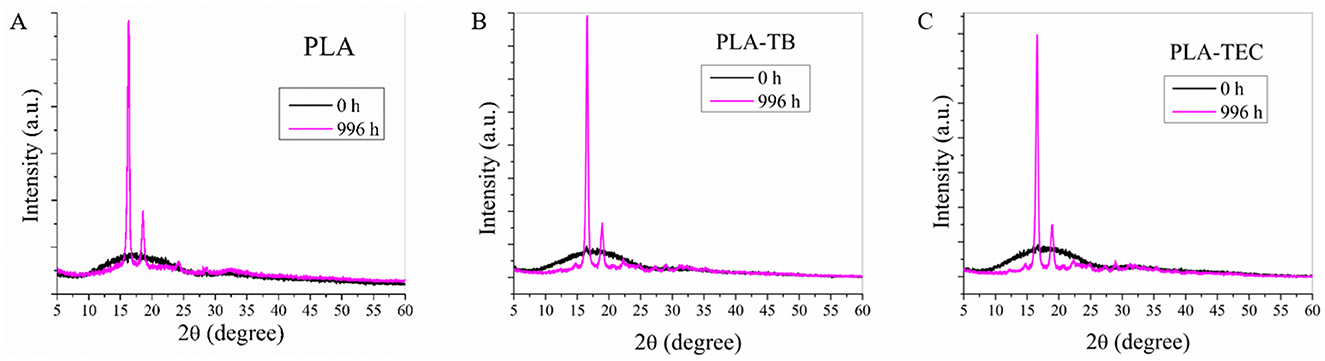
Figure 8. XRD diffractograms of the neat (A) and plasticized PLA films with TB (B) and TEC (C), at initial and final time of the weathering test.
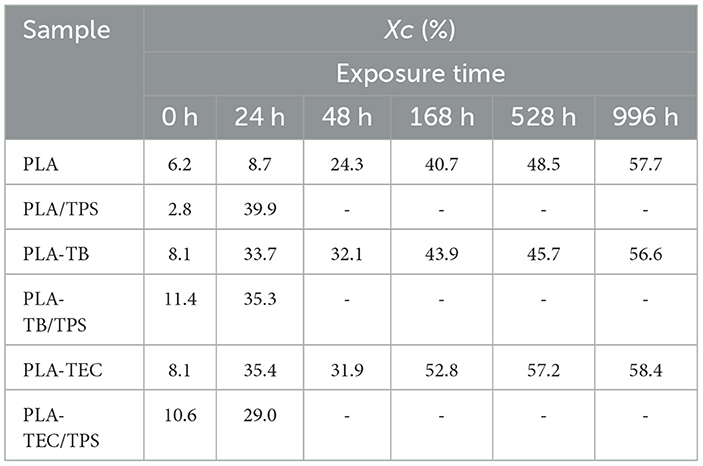
Table 4. Percentage of crystallinity (Xc) obtained from the XRD spectra, at different exposure times of the films studied.
The crystallite size of PLA after 996 h of exposure in the chamber was estimated using the Scherrer (Equation 4), considering the two main diffraction peaks at 2θ = 16.5 and 19°, which correspond to the (110)/(200) and (203) crystallographic planes, respectively. As shown in Table 5, the crystallites in the plasticized samples were smaller compared to those in the neat PLA films. This observation aligns with the lower molecular weight measured by GPC for the films containing TB and TEC at the end of the weathering test. Moreover, the melting temperature (Tm) also decreased accordingly (Table 5).
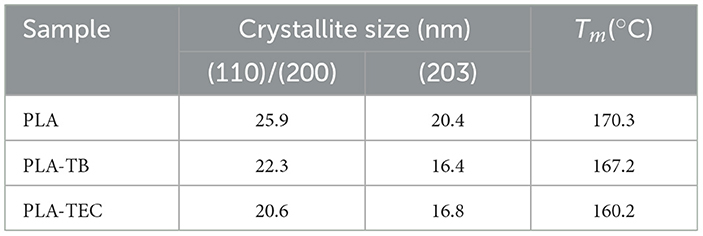
Table 5. Size of the crystals obtained from the XRD spectra using Scherrer formula, at 996 h of exposure times of the PLA films studied.
The FTIR spectra in the 400–4,000 cm−1 region obtained for neat PLA before being exposed in the chamber showed the characteristic peaks of the polymer in Figure 9. The main characteristic bands of PLA are the following: –C=O ester stretching bands at 1,752 cm−1 (crystalline) and 1,744 cm−1 (amorphous); –C–O–C– stretching in the range 1,265–1,080 cm−1; C–H deformation and stretching at 1,356 and 2,996–2,946 cm−1, respectively; C–CH3 stretching at 1,044 cm−1; CH3 asymmetric and symmetric deformation at 1,450 and 1,380 cm−1, respectively; and the –C–C– stretching was observed at 865 cm−1 (Furukawa et al., 2005; Kaplan et al., 2019). No significant differences were found between the spectra of the plasticized films and the neat PLA, indicating that all samples have a similar chemical structure initially.
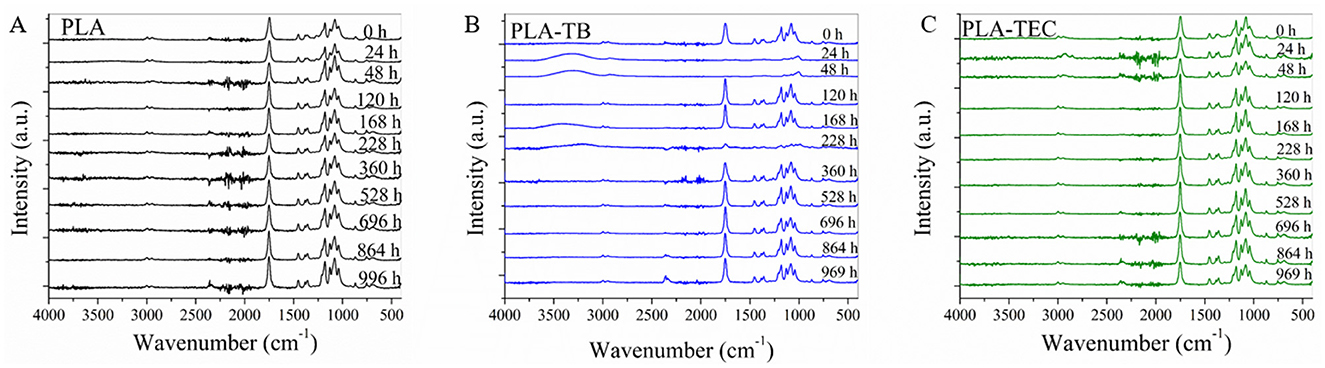
Figure 9. FTIR spectra of the neat (A) and plasticized PLA films with TB (B) and TEC (C), at different times of the weathering test.
It was reported that photodegradation of PLA results in random chain scission via the Norrish II type photocleavage reaction, which involves the ester group and ethylidene group next to the ester oxygen, leading to the formation of C=C double bonds and carboxylic acid groups on the formed chains (Kaynak and Sari, 2016). Photolysis and/or photooxidation are found to be the mechanisms that occur during UV irradiation of PLA. During the photolysis takes place especially the C–O bonds scission of the PLA ester backbone structure. While photooxidation of PLA leads to the formation of hydroperoxide derivative and its subsequent degradation into carboxylic acid and diketone end groups (Bocchini et al., 2010; Man et al., 2012; Zhang et al., 2011). Moreover, hydrolysis due to moisture reduces the molecular weight of PLA chains by cleaving the ester bonds and also leads to the formation of carboxylic acid and ketone end groups. This process also causes swelling and plasticization (Deroiné et al., 2014; Shinzawa et al., 2012).
FTIR analysis of the neat and plasticized PLA revealed some spectral variations as weathering time in the chamber progressed, as illustrated in Figure 9. The observed changes are in accordance with the variation in the chemical groups mentioned previously, and they are described below. It was observed an increase of the band at 1,752 cm−1 consistent with the formation of C=O groups due to photo-oxidation and hydrolysis as well as to the increment in the percentage of crystallinity of PLA during the test. The increase in the band at 865 cm−1, attributed to C-C stretching, provides further evidence of the increase in crystallinity of the samples with the exposure time (Kaplan et al., 2019). Additionally, the band at 1,264 cm−1 decreased, which can be attributed to the cleavage of the C-O bond in the ester backbone due to photolysis. Finally, a broad band appeared in the 3,500–3,000 cm−1 region of some spectra, which could be attributed to moisture retained in the films after their removal from the chamber.
3.2 Effects on mechanical properties and fracture surface morphology
The Young's modulus (E), tensile strength (σy), and elongation at break (εb) values of the films subjected to different accelerated weathering times were determined by the uniaxial tensile tests in order to evaluate the influence of the polymer deterioration in its mechanical performance. The main values of the mechanical properties are reported in Tables 6, 7.
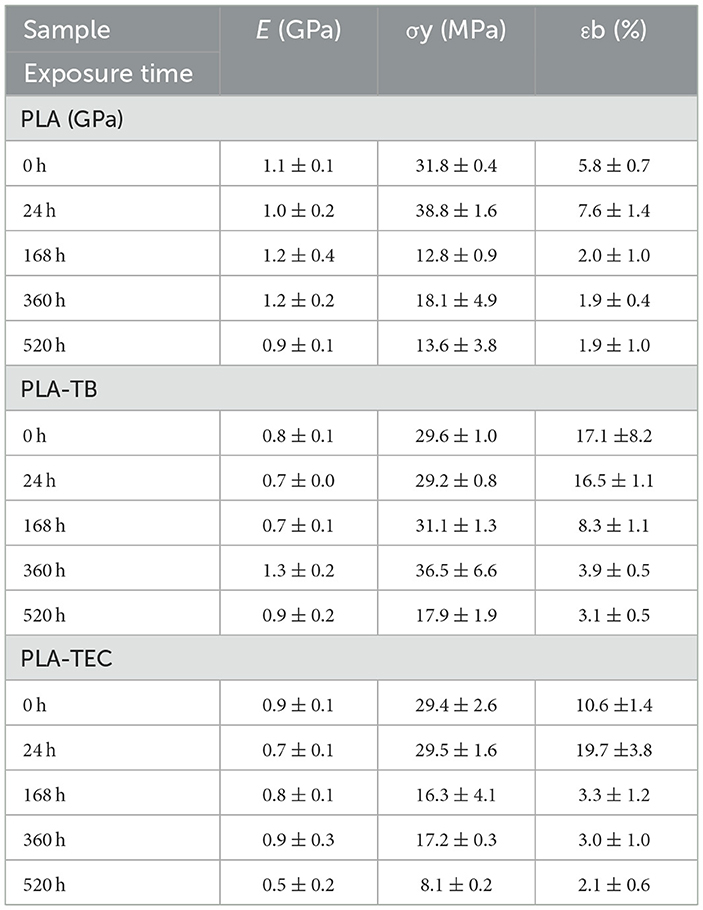
Table 6. Mean values of mechanical properties determined by tensile tests for neat and plasticized PLA, at different accelerated weathering times.
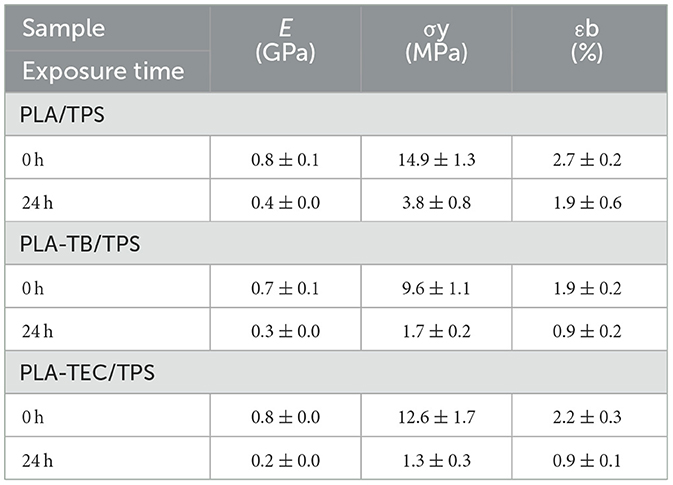
Table 7. Results of tensile tests for films containing TPS, initial and 24 h of accelerated weathering.
The Young's modulus and tensile strength of neat PLA were observed to be 1.1 GPa and 31.8 MPa, respectively, with an elongation at break of ~6% prior to the accelerated weathering test. The mechanical properties of PLA changed when it was plasticized with TB and TEC following a similar behavior regardless of the plasticizer used. The tensile modulus and strength decreased while the elongation at break increased with the addition of the plasticizer. This typical behavior was expected because of the reduction in the intermolecular forces between the polymer chains due to the molecules of plasticizer, and thus enhancing the flexibility of the films (Nur Hanani et al., 2013). These results are in accordance with the reduction in Tg values measured in the DSC scans of the plasticized films with TB or TEC, compared to those of neat PLA. Moreover, the elongation at break was slightly higher in PLA-TB than in PLA-TEC, despite the similar crystallinity observed by DSC and XRD. However, this could be further elucidated by considering factors such as the different affinities between PLA and the plasticizers. Ruiz et al. (2021) reported that the structure of the plasticizer influences the overall crystallization rate of PLA by altering polymer chain diffusion, thereby affecting its plasticizing efficiency. Furthermore, studies have shown that the chemical interaction between PLA and TEC plays a crucial role in determining the polymer's properties (Maiza et al., 2016). As a result, these findings indicate that the differences in the mechanical properties of PLA-TB and PLA-TEC samples may arise from variations in the chemical structure, chain topology of TB and TEC, and their respective interactions with PLA.
The modulus of the neat and plasticized PLA films remained rather constant at increasing the exposure time because the effect of the increase in crystallinity is counteracted by hydrolysis, photodegradation and photolysis, which produce chain breaking and a decrease in molecular weight. The elongation and maximum strength decreased significantly at 520 h, as the reduction in molecular weight became more dominant than the increase in crystallinity (Table 7). A significant decrease in and , measured by GPC analysis and reported in Table 2, was observed for that exposure time in both neat and plasticized PLA films. Besides, the reduction in elongation reached ~32% for neat PLA and 22% for the plasticized films. This molecular degradation correlated well with the observed decrease in mechanical performance, particularly the significant drop in elongation at break and the reduction in tensile strength.
Similarly, in PLA/TPS films, the presence of thermoplastic starch promoted an earlier decrease in molecular weight (as confirmed by GPC after only 24 h of exposure), which also aligned with an earlier reduction in mechanical properties (Table 7). Even before exposure, the lower mechanical strength and elongation at break of the TPS blends reflected their lower initial molecular weight compared to neat PLA.
Overall, the results demonstrate a clear correlation between molecular weight decrease and mechanical deterioration, consistent with previous studies on PLA-based systems (Kaynak and Sari, 2016; Spiridon et al., 2015).
Further morphological analyses were carried out by FESEM to determine the effect of the temperature, moisture and UV light on the integrity of the films. Photographs of the fracture surfaces of the pure and plasticized PLA films removed at different times from the chamber under accelerated aging conditions were showed in Table 8. All the films show signs of changes with exposure time: the surface appears rougher and the appearance of whitish formations is noted, which could have originated from the scission of chains, the formation of degradation products and/or the exudation of plasticizer in the samples with TB and TEC, as well as by the increase in the crystallinity of the films during exposure to the chamber conditions. The appearance of voids or cracks was not observed in any of the films. It was not possible to take photos of the samples with TPS due to the small size of the remains recovered after 24 h. Under the chamber conditions, water molecules were expected to penetrate the amorphous regions more easily, accelerating the hydrolytic scission of PLA chains. Moreover, the fastest degradation of the PLA/TPS samples is likely attributed to the degradation initiating at the interface between PLA and TPS, as these samples exhibit two distinct phases, as evidenced by the TGA results (Zhou and Xanthos, 2008).
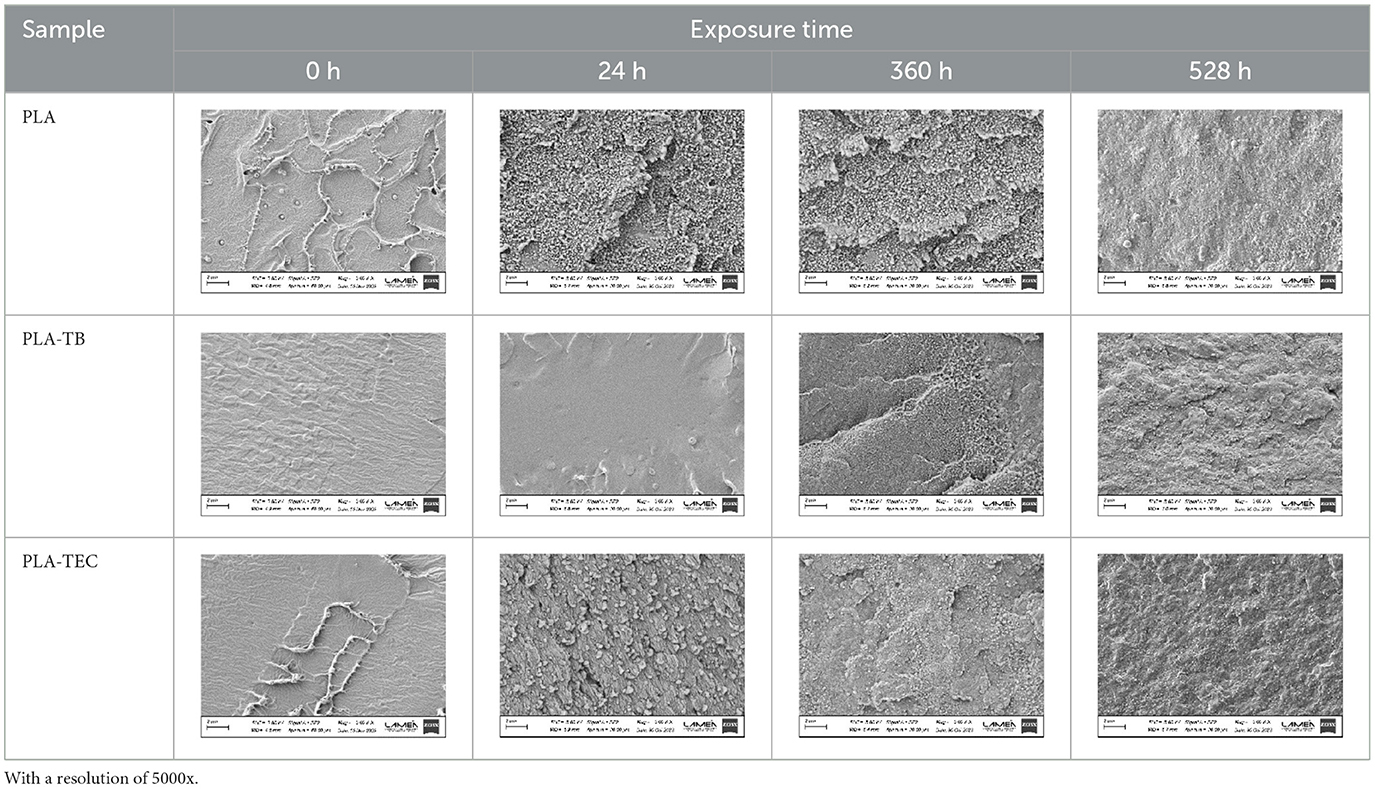
Table 8. FESEM micrographs of the pure and plasticized PLA films, exposed to accelerated aging for different times.
3.3 Changes in color and transparency
The change in the color of the samples was examined during the exposure time with a colorimeter and the color parameters CIE L*, a*, b*, ΔE, and the opacity (Op) were listed in Table 9. The films containing TPS could not be tested using this technique, because the recovered area after 24 h of exposure was not sufficient to carry out the measurement.
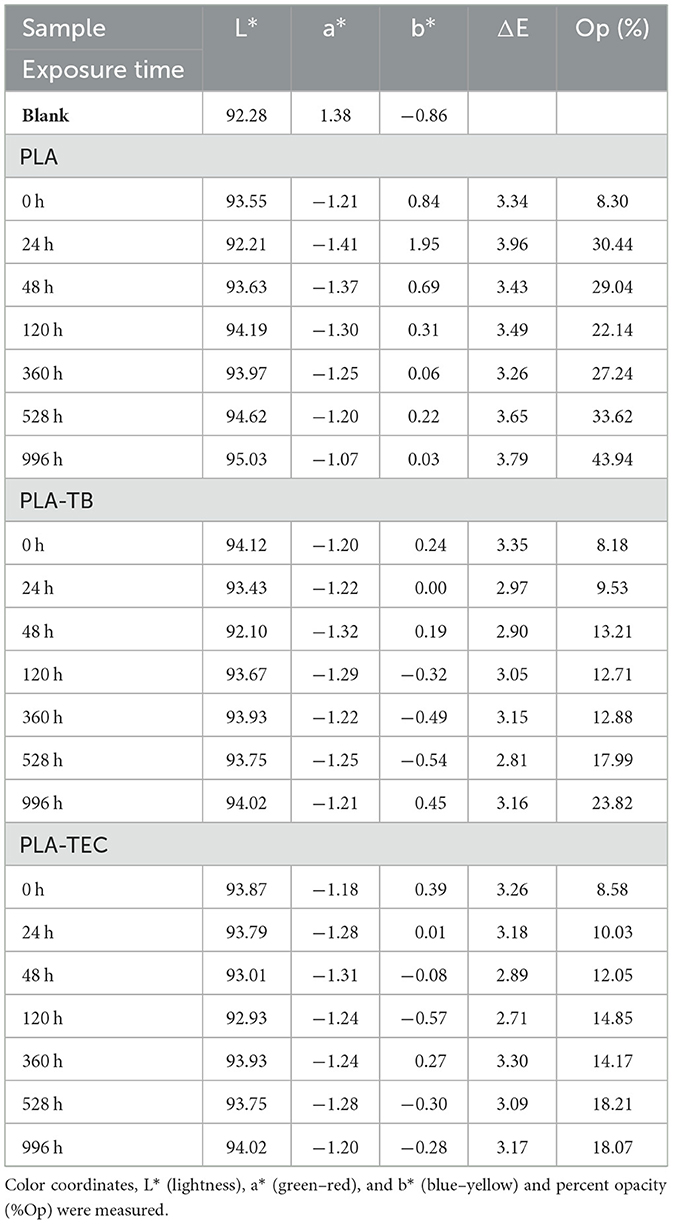
Table 9. Color parameters, total color and opacity of films weathered at different times.
The luminosity of all the samples was high, exceeding a value of 92 in all cases. In all cases, the a* values were negative, indicating an inclination toward greenish tones. Regarding the b* values, in the PLA film they were positive, denoting a slightly yellowish hue and close to 0. On the other hand, in the PLA-TB and PLA-TEC films, the b* values varied between positive and negative throughout the test, but also close to 0. The ΔE value near to 3 indicate that there is no appreciable color difference among the films over the exposure time, neither for the neat PLA nor for the plasticized films. However, a significant increase in opacity was observed for all samples from the beginning to the end of the test, as can also be seen in the photographs in Table 10, which illustrate the visual appearance of the films at different exposure times. The PLA film exhibited a marked increase in opacity during the initial 24 h of aging, followed by oscillations around 30%, reaching a value of 44% at the end of the test. As for PLA-TB, the opacity increased in the first 48 h and then oscillated, but with an increasing trend until reaching a value of 24% at 996 h. The opacity of PLA-TEC follows a similar evolution, but resulted in a less opaque film, with 18% opacity. The higher opacity observed in the neat PLA film compared to the plasticized ones may be attributed to differences in crystallite size, as reported in Table 5. Additionally, the slight variations in opacity between the PLA/TB and PLA/TEC samples could also be related to differences in crystallite size, as reported in Table 5.
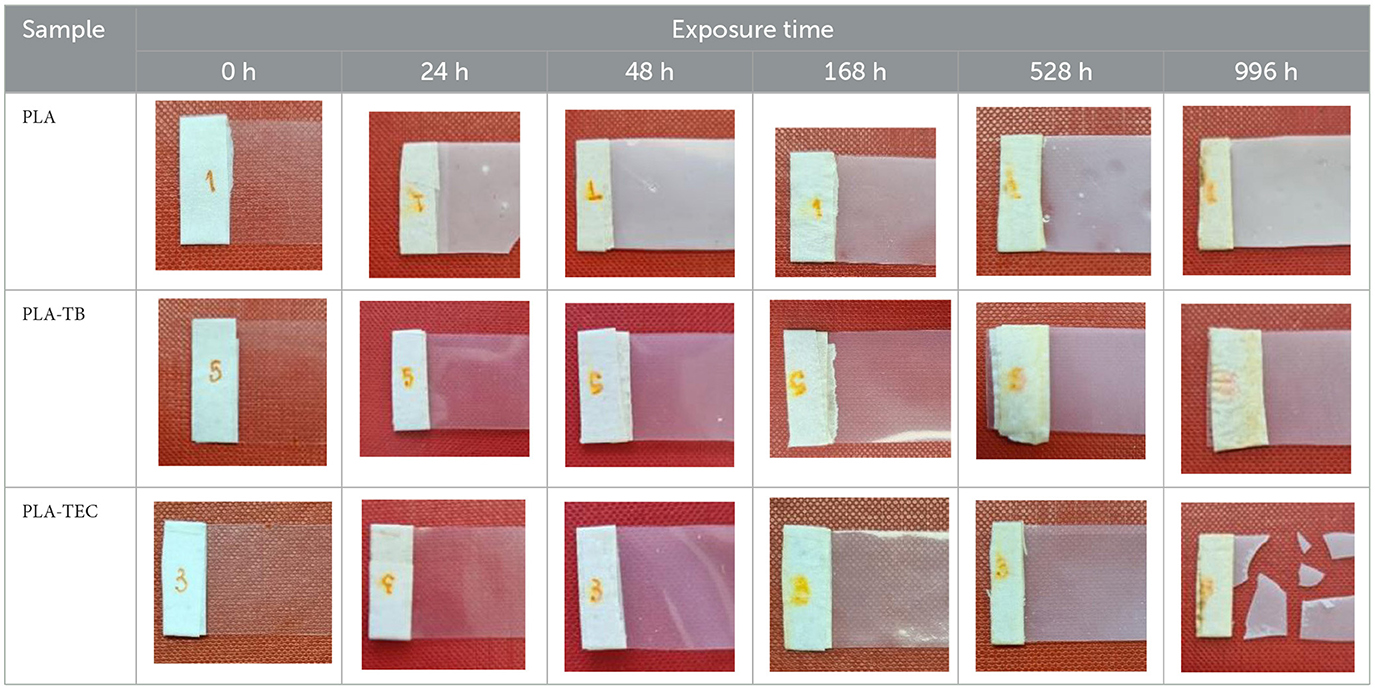
Table 10. Photographs of the pure and plasticized PLA films, exposed to accelerated aging for different times.
The results regarding the opacity were corroborated by means of UV-visible spectroscopy and reported in Figure 10. It was observed a decrease in the transmittance of the samples as the hours of accelerated weathering pass. This result became more pronounced for the neat PLA films compared to the plasticized ones. The PLA/TPS samples exhibited a substantial decrease in light transmission across the whole measured range compared to the PLA films, both at the initial state and after 24 h of accelerated weathering, where transmission dropped to below 5%. The UV-vis spectrum of the PLA-TEC/TPS film could not be recorded since there was not enough sample available at 24 h, but that of PLA-TB/TPS showed a similar behavior than the blend without plasticizer. These results can be directly related to the increase in the crystallinity of the samples with increasing exposure time, calculated by DSC and XRD as mentioned above. Furthermore, in the case of the blends with TPS, the decrease in transmittance may also be related to the presence of a second phase due to the immiscibility between PLA and TPS. It is important to highlight that all the films studied showed a negligible percentage of transmittance in the UV-C region, which reveals that these samples can be used for the production of UV-sensitive packaging materials.
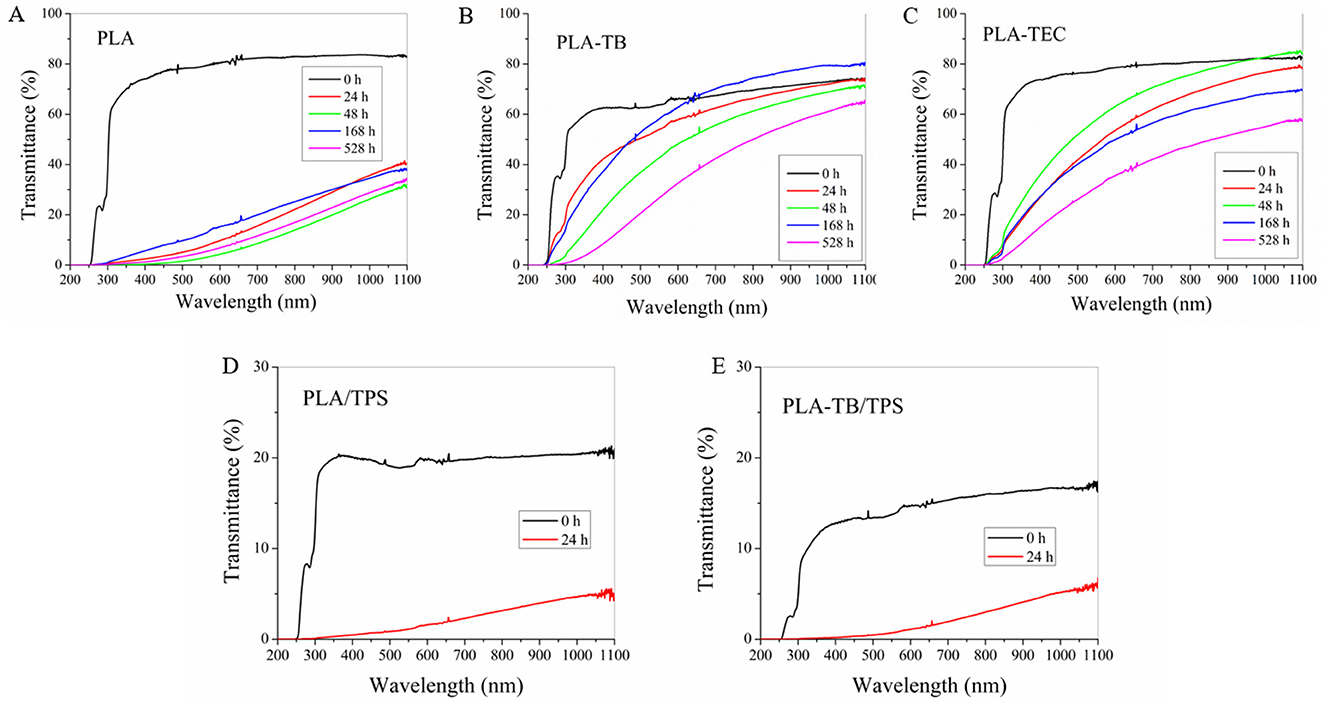
Figure 10. UV-visible spectra at different weathering times of neat PLA (A), PLA-TB (B), PLA-TEC (C), PLA/TPS (D), and PLA-TB/TPS (E) films.
3.4 Outdoor test
To attempt a correlation between the accelerated weathering time in the chamber and actual outdoor exposure, neat and plasticized PLA, TPS, and PLA/TPS samples were characterized after being exposed outdoor in the city of Mar de Cobo, Argentina, between April and January.
The samples were analyzed by means of thermal analysis techniques. Table 11 shows the percentage of crystallinity (Xc) values calculated from the DSC runs for the samples at different days of outdoor exposure. The crystallinity of the neat PLA films did not show noticeable changes throughout the days of exposure, while a significant increase in crystallinity of the plasticized samples was observed at 50 days of exposure, after which the values remained without significant variations. These values are comparable to those obtained after 24–48 h of exposure in the accelerated aging chamber. Furthermore, the increase in crystallinity is also reflected in the rise in opacity of the samples, which became more noticeable after 50 days of exposure, as illustrated by the photographs presented in Table 12.
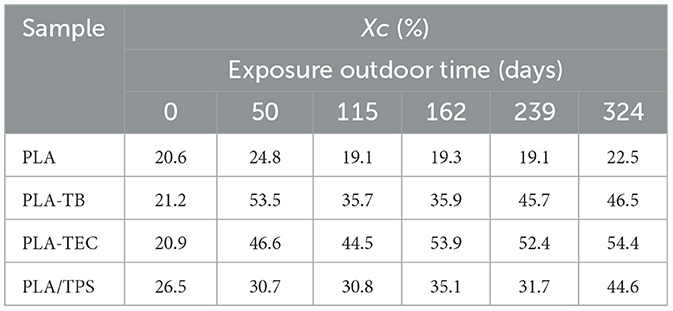
Table 11. Percentage of crystallinity (Xc) calculated from DSC data, for films subjected to different exposure times outdoor.
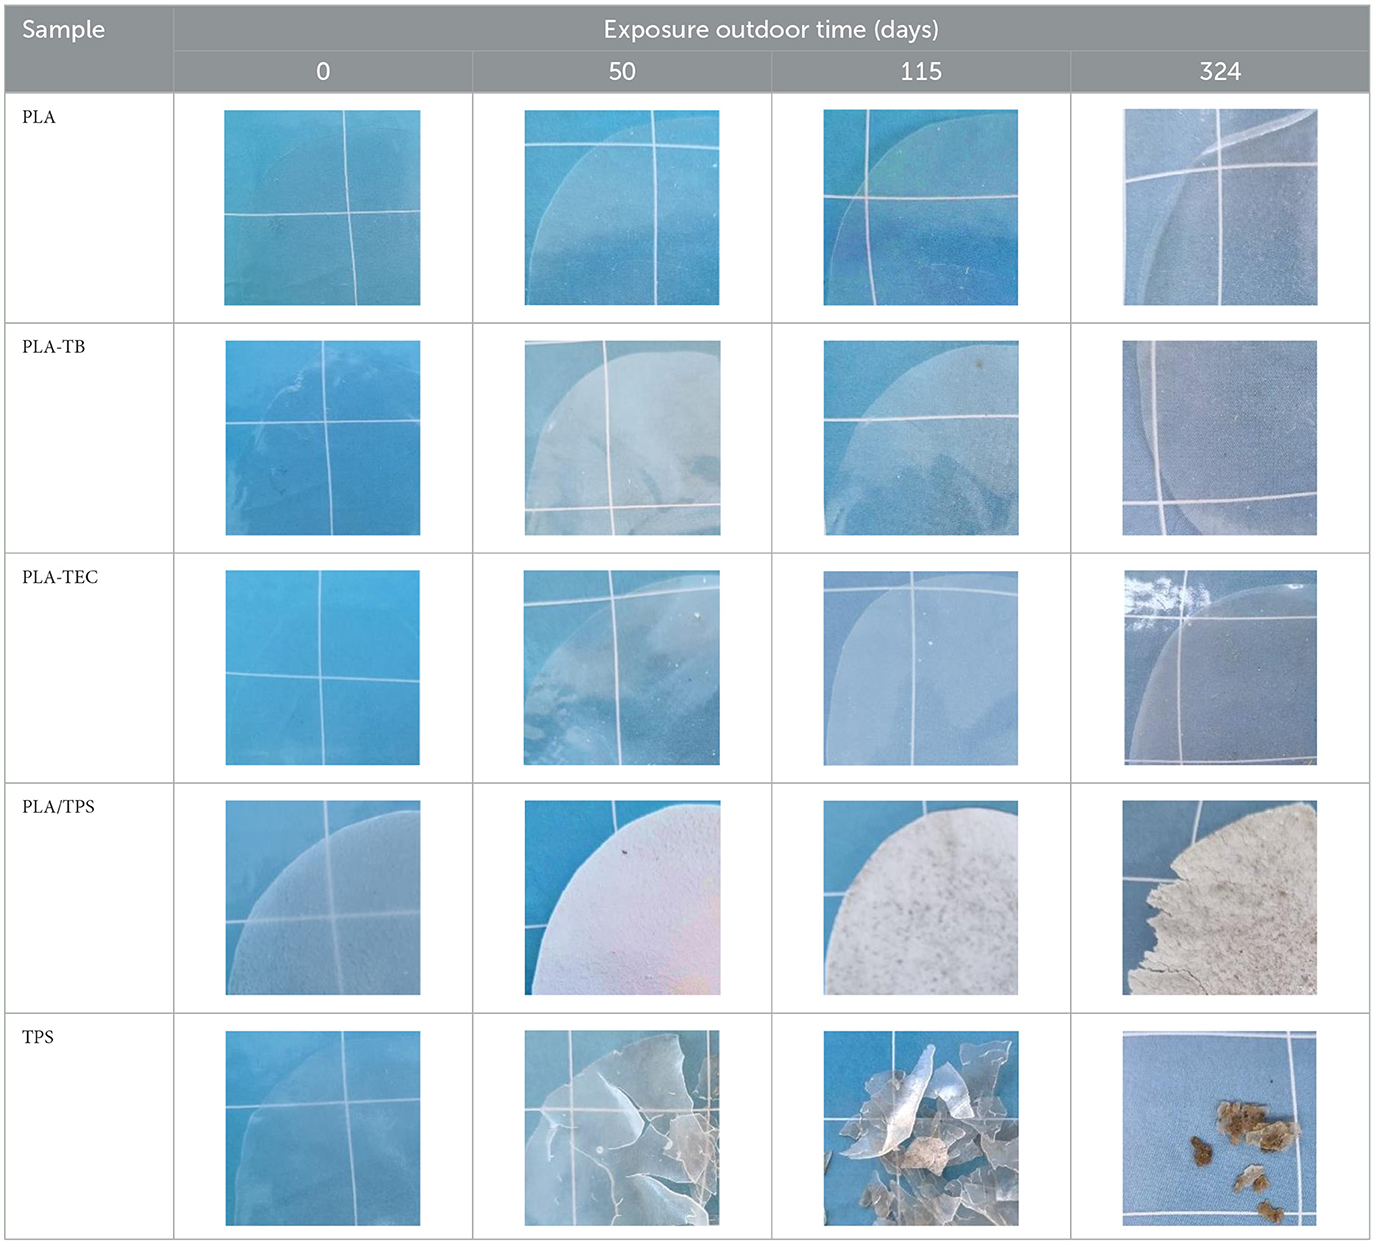
Table 12. Photographs of films subjected to different exposure times outdoor.
The TGA curves of the plasticized samples (Figure 11) show no significant loss of TB during outdoor exposure. In contrast, a noticeable loss of TEC is detected after 162 days, which is comparable to the loss observed after 48 h under accelerated aging conditions. This could be attributed to the higher vapor pressure and hydrophilic character of TEC compared to TB, which results in greater affinity for moisture of the environment.
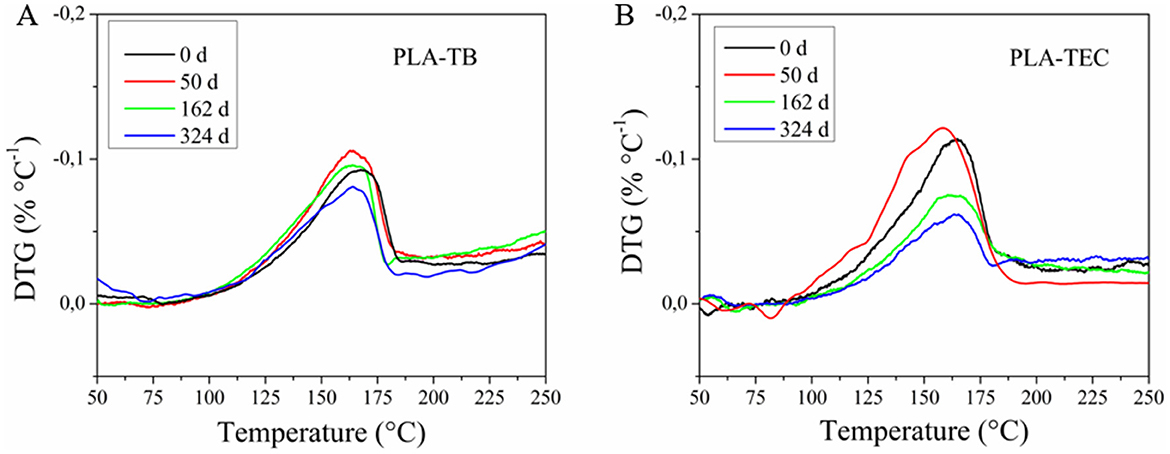
Figure 11. DTG curves of the plasticized samples at different outdoor exposure days of PLA-TB (A) and PLA-TEC (B), in the range of 50–250°C.
The TPS film degraded rapidly under outdoor conditions, becoming brittle, losing transparency, and showing clear signs of significant disintegration after 50 days of exposure. This was attributed to its hydrophilic nature, which increases its affinity for water molecules and ambient humidity. However, no visible signs of film deterioration were observed until 324 days of outdoor exposure when TPS was blended with PLA. Nonetheless, a notable increase in opacity was evident as early as 50 days, as shown in the photograph presented in Table 12. This change was attributed to the increase in crystallinity measured by DSC (Table 11), which progressed more gradually than in samples under accelerated weathering. Moreover, the PLA/TPS film exposed outdoors for 324 days did not reach the crystallinity levels observed after just 24 h in the aging chamber.
4 Conclusions
According to the characterization tests carried out on the films subjected to different exposure times in the accelerated weathering chamber, it was noted a decrease in the molecular weight of PLA alongside an increase in the crystallinity of the films. The chain scissions by photolysis and hydrolysis were corroborated by changes in the FTIR spectra. These findings result in increased opacity and a reduction in both tensile strength and elongation at break. TGA analysis also reveals a progressive loss of plasticizer with exposure, consistent with the observed rise in Tg values. Additionally, despite the molecular weight reduction, the temperature corresponding to the maximum thermal degradation rate increases, suggesting that the predominant factor influencing thermal stability is the higher degree of crystallinity. Both plasticizers exhibit a comparable influence on the variation of PLA properties, both prior to and during exposure in the weathering chamber. However, samples containing TB demonstrate slightly higher ductility, which may be attributed to the different affinities of the plasticizers for PLA, as previously reported in the literature.
Regarding the PLA/TPS blends, they exhibited a rapid degradation process under chamber conditions, with complete disintegration occurring after just 24 h. Within this short period, it was observed that TPS acts as nucleating agent promoting PLA crystallization. Additionally, the presence of thermoplastic starch promoted a decrease in the molecular weight of PLA, which is consistent with the previously observed reduction in elongation at break. Moreover, the incorporation of TPS significantly reduced the transparency of the films, likely due to the immiscibility between PLA and TPS, which leads to the formation of distinct phases within the material, as evidenced by the TGA results. The fastest degradation of the PLA/TPS samples is likely attributed to the degradation initiating at the interface between PLA and TPS.
Based on the observed variations in the evaluated properties, it can be concluded that 50 days of outdoor exposure led to an increase in crystallinity and an opacity level equivalent to that observed after 24–48 h of accelerated weathering, for both neat and plasticized PLA films. However, noticeable plasticizer loss was only detected for TEC after 162 days of outdoor exposure. On the other hand, PLA/TPS films showed a faster deterioration under environmental conditions than PLA based samples, mainly due to the lower stability of the TPS component. This was attributed to the high affinity of TPS for the ambient humidity, owing to its hydrophilic nature, which caused the material to become brittle and opaque.
Therefore, blending PLA with TPS enables the development of biodegradable materials with an accelerated degradation profile compared to neat PLA films, making them attractive candidates for single-use packaging applications. This strategy not only broadens the range of properties achievable for packaging, but also contributes to lowering material costs and supports the reduction of fossil resource consumption.
Data availability statement
The raw data supporting the conclusions of this article will be made available by the authors, without undue reservation.
Author contributions
LMal: Data curation, Formal analysis, Investigation, Methodology, Writing – original draft. MI-M: Conceptualization, Formal analysis, Investigation, Methodology, Writing – review & editing. IS: Conceptualization, Formal analysis, Methodology, Writing – review & editing. VC: Conceptualization, Data curation, Formal analysis, Methodology, Supervision, Validation, Writing – original draft, Writing – review & editing, Project administration, Resources. LMan: Conceptualization, Data curation, Formal analysis, Methodology, Supervision, Validation, Writing – original draft, Writing – review & editing, Project administration, Resources.
Funding
The author(s) declare that financial support was received for the research and/or publication of this article. The authors gratefully acknowledge the financial support provided by Consejo Nacional de Investigaciones Científicas y Técnicas (PIP 0991), Agencia Nacional de Promoción de la Investigación, el Desarrollo Tecnológico y la Innovación (PICT 2677), and Universidad Nacional de Mar del Plata (15/G671-ING675/23, 800 202405 00104 MP).
Conflict of interest
The authors declare that the research was conducted in the absence of any commercial or financial relationships that could be construed as a potential conflict of interest.
Generative AI statement
The author(s) declare that no Gen AI was used in the creation of this manuscript.
Publisher's note
All claims expressed in this article are solely those of the authors and do not necessarily represent those of their affiliated organizations, or those of the publisher, the editors and the reviewers. Any product that may be evaluated in this article, or claim that may be made by its manufacturer, is not guaranteed or endorsed by the publisher.
References
Ahmed, J., and Varshney, S. K. (2011). Polylactides—chemistry, properties and green packaging technology: a review. Int. J. Food Prop. 14, 37–58. doi: 10.1080/10942910903125284
Avérous, L. (2008). “Chapter 21—polylactic acid: synthesis, properties and applications,” in Monomers, Polymers and Composites from Renewable Resources, eds. M. N. Belgacem and A. Gandini (Amsterdam: Elsevier), 433–450.
Bocchini, S., Fukushima, K., Blasio, A. D., Fina, A., Frache, A., and Geobaldo, F. (2010). Polylactic acid and polylactic acid-based nanocomposite photooxidation. Biomacromolecules 11, 2919–2926. doi: 10.1021/bm1006773
Cai, J., Liu, M., Wang, L., Yao, K., Li, S., and Xiong, H. (2011). Isothermal crystallization kinetics of thermoplastic starch/poly(lactic acid) composites. Carbohyd. Polym. 86, 941–947. doi: 10.1016/j.carbpol.2011.05.044
Chen, X., Zhuo, J., and Jiao, C. (2012). Thermal degradation characteristics of flame retardant polylactide using TG-IR. Polymer Degrad. Stabil. 97, 2143–2147. doi: 10.1016/j.polymdegradstab.2012.08.016
Deroiné, M., Le Duigou, A., Corre, Y. M., Le Gac, P. Y., Davies, P., César, G., et al. (2014). Accelerated ageing of polylactide in aqueous environments: comparative study between distilled water and seawater. Polym. Degrad. Stabil. 108, 319–329. doi: 10.1016/j.polymdegradstab.2014.01.020
Dhall, R. K., and Alam, M. S. (2020). “Biodegradable packaging,” in Encyclopedia of Renewable and Sustainable Materials, eds. S. Hashmi, and I. A. Choudhury (Oxford: Elsevier), 26–43.
Enumo, A., Gross, I. P., Saatkamp, R. H., Pires, A. T., and Parize, A. L. (2020). Evaluation of mechanical, thermal and morphological properties of PLA films plasticized with maleic acid and its propyl ester derivatives. Polym. Test. 88:106552. doi: 10.1016/j.polymertesting.2020.106552
Eslami, H., Grady, M., and Mekonnen, T. H. (2022). Biobased and compostable trilayer thermoplastic films based on poly(3-hydroxybutyrate-co-3-hydroxyvalerate) (PHBV) and thermoplastic starch (TPS). Int. J. Biol. Macromol. 220, 385–394. doi: 10.1016/j.ijbiomac.2022.08.079
Furukawa, T., Sato, H., Murakami, R., Zhang, J., Duan, Y. X., Noda, I., et al. (2005). Structure, dispersibility, and crystallinity of poly(hydroxybutyrate)/poly(l-lactic acid) blends studied by FT-IR microspectroscopy and differential scanning calorimetry. Macromolecules 38, 6445–6454. doi: 10.1021/ma0504668
Giełdowska, M., Puchalski, M., Sztajnowski, S., and Krucinska, I. (2022). Evolution of the molecular and supramolecular structures of PLA during the thermally supported hydrolytic degradation of wet spinning fibers. Macromolecules 55, 10100–10112. doi: 10.1021/acs.macromol.2c01778
Hsieh, Y. T., Nozaki, S., Kido, M., Kamitani, K., Kojio, K., and Takahara, A. (2020). Crystal polymorphism of polylactide and its composites by X-ray diffraction study. .er J. 52, 755–763. doi: 10.1038/s41428-020-0343-8
Iglesias Montes, M. L., D'amico, D. A., Manfredi, L. B., and Cyras, V. P. (2019). Effect of natural glyceryl tributyrate as plasticizer and compatibilizer on the performance of bio-based polylactic acid/poly(3-hydroxybutyrate) blends. J. Polym. Environ. 27, 1429–1438. doi: 10.1007/s10924-019-01425-y
Kaavessina, M., Ali, I., Elleithy, R., and Al-Zahrani, S. M. (2013). Preparation and characterization of poly(lactic acid)/elastomer blends prepared by melt blending technique. J. Elastom. Plast. 46, 253–268. doi: 10.1177/0095244312468364
Kaplan, Z., Böke, H., Sofuoglu, A., and Ipekoglu, B. (2019). Long term stability of biodegradable polymers on building limestone. Prog. Organ. Coat. 131, 378–388. doi: 10.1016/j.porgcoat.2019.03.004
Kaynak, C., and Sari, B. (2016). Accelerated weathering performance of polylactide and its montmorillonite nanocomposite. Appl. Clay Sci. 121–122, 86–94. doi: 10.1016/j.clay.2015.12.025
Kervran, M., Vagner, C., Cochez, M., Ponçot, M., Saeb, M. R., and Vahabi, H. (2022). Thermal degradation of polylactic acid (PLA)/polyhydroxybutyrate (PHB) blends: a systematic review. Polym. Degrad. Stabil. 201:109995. doi: 10.1016/j.polymdegradstab.2022.109995
Li, H., and Huneault, M. A. (2008). Crystallization of PLA/thermoplastic starch blends. Int. Polym. Proces. 23, 412–418. doi: 10.3139/217.2185
Li, S., Xiong, Z., Fei, P., Cai, J., Xiong, H., Tan, J., et al. (2013). Parameters characterizing the kinetics of the nonisothermal crystallization of thermoplastic starch/poly(lactic acid) composites as determined by differential scanning calorimetry. J. Appl. Polym. Sci. 129, 3566–3573. doi: 10.1002/app.38587
Liu, X., Yu, L., Liu, H., Chen, L., and Li, L. (2008). In situ thermal decomposition of starch with constant moisture in a sealed system. Polym. Degrad. Stabil. 93, 260–262. doi: 10.1016/j.polymdegradstab.2007.09.004
Lv, S., Gu, J., Tan, H., and Zhang, Y. (2018). Enhanced durability of sustainable poly (lactic acid)-based composites with renewable starch and wood flour. J. Clean. Prod. 203, 328–339. doi: 10.1016/j.jclepro.2018.08.266
Maiza, M., Benaniba, M. T., and Massardier-Nageotte, V. (2016). Plasticizing effects of citrate esters on properties of poly(lactic acid). J. Polym. Eng. 36, 371–380. doi: 10.1515/polyeng-2015-0140
Malbos, L. B., Iglesias-Montes, M. L., Seoane, I. T., Cyras, V. P., and Manfredi, L. B. (2024). Biobased ternary composites for food packaging: influence of natural plasticizers and starch on polylactic acid performance. J. Mater. Sci. 59, 20304–20324. doi: 10.1007/s10853-024-10375-3
Man, C., Zhang, C., Liu, Y., Wang, W., Ren, W., Jiang, L., et al. (2012). Poly (lactic acid)/titanium dioxide composites: preparation and performance under ultraviolet irradiation. Polym. Degrad. Stabil. 97, 856–862. doi: 10.1016/j.polymdegradstab.2012.03.039
Marturano, V., Marotta, A., Salazar, S. A., Ambrogi, V., and Cerruti, P. (2023). Recent advances in bio-based functional additives for polymers. Prog. Mater. Sci. 139:101186. doi: 10.1016/j.pmatsci.2023.101186
Mofokeng, J. P., and Luyt, A. S. (2015). Morphology and thermal degradation studies of melt-mixed poly(lactic acid) (PLA)/poly(ε-caprolactone) (PCL) biodegradable polymer blend nanocomposites with TiO2 as filler. Polym. Test. 45, 93–100. doi: 10.1016/j.polymertesting.2015.05.007
Muthuraj, R., Misra, M., and Mohanty, A. K. (2018). Biodegradable compatibilized polymer blends for packaging applications: a literature review. J. Appl. Polym. Sci. 135:45726. doi: 10.1002/app.45726
Nur Hanani, Z. A., McNamara, J., Roos, Y. H., and Kerry, J. P. (2013). Effect of plasticizer content on the functional properties of extruded gelatin-based composite films. Food Hydrocoll. 31, 264–269. doi: 10.1016/j.foodhyd.2012.10.009
Ojogbo, E., Blanchard, R., and Mekonnen, T. (2018). Hydrophobic and melt processable starch-laurate esters: synthesis, structure–property correlations. J. Polym. Sci. A Polym. Chem. 56, 2611–2622. doi: 10.1002/pola.29237
Parente, A. G., de Oliveira, H. P., Cabrera, M. P., and de Morais Neri, D. F. (2023). Bio-based polymer films with potential for packaging applications: a systematic review of the main types tested on food. Polym. Bull. 80, 4689–4717. doi: 10.1007/s00289-022-04332-w
Plastics Europe AISBL (2023). Plastics—The Fast Facts 2023. Available online at: https://plasticseurope.org/knowledge-hub/plastics-the-fast-facts-2023/ (Accessed April 15, 2025).
Rebelo, R. C., Gonçalves, L. P., Fonseca, A. C., Fonseca, J., Rola, M., Coelho, J. F., et al. (2022). Increased degradation of PLA/PBAT blends with organic acids and derivatives in outdoor weathering and marine environment. Polymer 256:125223. doi: 10.1016/j.polymer.2022.125223
Ruiz, M. B., Pérez-Camargo, R. A., López, J. V., Penott-Chang, E., Múgica, A., Coulembier, O., et al. (2021). Accelerating the crystallization kinetics of linear polylactides by adding cyclic poly (-lactide): nucleation, plasticization and topological effects. Int. J. Biol. Macromol. 186, 255–267. doi: 10.1016/j.ijbiomac.2021.07.028
Sadi, R., Fechine, G. J. M., and Demarquette, N. (2010). Photodegradation of poly(3-hydroxybutyrate). Polym. Degrad. Stabil. 95, 2318–2327. doi: 10.1016/j.polymdegradstab.2010.09.003
Seoane, I. T., Cerrutti, P., Vazquez, A., Manfredi, L. B., and Cyras, V. P. (2017). Polyhydroxybutyrate-based nanocomposites with cellulose nanocrystals and bacterial cellulose. J. Polym. Environ. 25, 586–598. doi: 10.1007/s10924-016-0838-8
Shinzawa, H., Nishida, M., Tanaka, T., and Kanematsu, W. (2012). Accelerated weathering-induced degradation of poly(lactic acid) fiber studied by near-infrared (NIR) hyperspectral imaging. Appl. Spectrosc. 66, 470–474. doi: 10.1366/11-06540
Shogren, R., Wood, D., Orts, W., and Glenn, G. (2019). Plant-based materials and transitioning to a circular economy. Sustain. Prod. Consump. 19, 194–215. doi: 10.1016/j.spc.2019.04.007
Spiridon, I., Leluk, K., Resmerita, A. M., and Darie, R. N. (2015). Evaluation of PLA–lignin bioplastics properties before and after accelerated weathering. Compos. B Eng. 69, 342–349. doi: 10.1016/j.compositesb.2014.10.006
Velghe, I., Buffel, B., Vandeginste, V., Thielemans, W., and Desplentere, F. (2023). Review on the degradation of poly(lactic acid) during melt processing. Polymers 15:2047. doi: 10.3390/polym15092047
Winkler, H., Vorwerg, W., and Rihm, R. (2014). Thermal and mechanical properties of fatty acid starch esters. Carbohyd. Polym. 102, 941–949. doi: 10.1016/j.carbpol.2013.10.040
Zhang, C., Man, C., Wang, W., Jiang, L., and Dan, Y. (2011). Degradation of poly(L-lactide) films under ultraviolet irradiation and water bath. Polym. Plast. Technol. Eng. 50, 810–817. doi: 10.1080/03602559.2011.551970
Zhang, T., Han, W., Zhang, C., and Weng, Y. (2021). Effect of chain extender and light stabilizer on the weathering resistance of PBAT/PLA blend films prepared by extrusion blowing. Polym. Degrad. Stabil. 183:109455. doi: 10.1016/j.polymdegradstab.2020.109455
Zhang, X., Golding, J., and Burgar, I. (2002). Thermal decomposition chemistry of starch studied by 13C high-resolution solid-state NMR spectroscopy. Polymer 43, 5791–5796. doi: 10.1016/S0032-3861(02)00546-3
Keywords: polylactic acid, starch, biodegradable polymers, renewable resources, accelerated weathering
Citation: Malbos LB, Iglesias-Montes ML, Seoane IT, Cyras VP and Manfredi LB (2025) Sustainable materials for food packaging: influence of accelerated weathering exposure time on the properties of films based on polylactic acid and thermoplastic starch. Front. Sustain. Food Syst. 9:1620653. doi: 10.3389/fsufs.2025.1620653
Received: 30 April 2025; Accepted: 09 June 2025;
Published: 02 July 2025.
Edited by:
Barbara Tomadoni, Sevilla University, SpainReviewed by:
Devi Sri Rajendran, SRM Institute of Science and Technology, IndiaLuis Val, University of Sonora, Mexico
Copyright © 2025 Malbos, Iglesias-Montes, Seoane, Cyras and Manfredi. This is an open-access article distributed under the terms of the Creative Commons Attribution License (CC BY). The use, distribution or reproduction in other forums is permitted, provided the original author(s) and the copyright owner(s) are credited and that the original publication in this journal is cited, in accordance with accepted academic practice. No use, distribution or reproduction is permitted which does not comply with these terms.
*Correspondence: Liliana B. Manfredi, bGJtYW5mcmVAZmkubWRwLmVkdS5hcg==