 Mingwen Li1†
 Ubair Nisar
 Zainab Khalid
- 1School of Economics, Shandong University of Technology, Zibo, China
- 2Jiyang College, Zhejiang Agriculture and Forestry University, Zhuji, China
- 3Institute of Business and Policy Research, Sher-e-Kashmir University of Agricultural Sciences and Technology of Kashmir, Srinagar, India
- 4School of Economics and Management, Southeast University, Nanjing, China
Introduction: Sustainable agricultural productivity is a key priority for China as it navigates environmental challenges and growing food demand. Understanding the impact of agricultural structural adjustments, including crop-livestock integration, service-based agriculture, and digital transformation, on Green Total Factor Productivity (GTFP) is essential for formulating effective agricultural policies.
Methods: This study analyzes data from 1,743 counties in China spanning from 2003 to 2022. Using econometric models, we examine the relationship between agricultural structural adjustments and GTFP growth, focusing on the roles of technological progress, structural changes, and digitalization. The study accounts for regional variations in agricultural productivity.
Results: Our analysis finds that technological progress is the primary driver of GTFP growth. Agricultural structural changes, particularly crop-livestock integration and service-based models, contribute a “structural dividend,” enhancing sectoral efficiency and advancement. Interestingly, service-oriented models initially slow productivity but yield long-term benefits. Digital transformation significantly amplifies these positive effects. Regional analysis reveals that eastern and western regions benefit more from structural upgrades than central regions.
Discussion: These findings highlight the importance of designing policies tailored to local contexts, especially considering regional differences in agricultural productivity. The integration of digital technologies and service-oriented models plays a crucial role in advancing GTFP. Policy-makers should focus on promoting inclusive, sustainable, and technologically-driven agricultural development to meet China’s future food security needs.
1 Introduction
In the pursuit of high-quality and sustainable agricultural development, China’s food production has historically relied on input-intensive strategies, where the expansion of production scale primarily drove growth (Liu et al., 2023). However, this approach—characterized by the excessive use of land, water, and chemical inputs—has resulted in diminishing marginal returns and significant ecological degradation, rendering it ecologically and economically unsustainable in the long term (He and Shen, 2018). Such unsustainability reflects broader risks observed in other sectors, where unbalanced expansion without adequate safeguards can lead to systemic collapse (Duan and Li, 2023). This situation poses a pressing challenge: how to shift from scale-driven growth to a more sustainable and efficient model that balances productivity with environmental stewardship. Amid growing concerns over environmental degradation and the imperative to build an ecological civilization, there is an urgent need to reorient agricultural systems toward practices that emphasize resource efficiency, ecological protection, and long-term resilience (Zhang et al., 2025). Aligning agricultural transformation with broader sustainable development spillovers can strengthen the synergy between economic, environmental, and social outcomes (Cai et al., 2025).
Within this context, enhancing GTFP has become a strategic priority for achieving sustainable food production and consumption. A central concept in this transformation is the “structural dividend”—the productivity gains realized when resources are reallocated from less efficient to more efficient sectors or activities within the economy (Xu et al., 2025; Wang et al., 2019). Evidence from policy experiments suggests that financial and institutional reforms, such as green finance, can accelerate inclusive green growth, which supports these structural adjustments (Xu et al., 2025). In agriculture, such structural adjustments include crop–livestock integration, mechanization, and the adoption of digital and smart farming practices, all of which contribute to improved resource use efficiency and environmental sustainability. The integration of digital intelligence into agricultural resource management can further enhance collaborative mechanisms and market-based coordination (Li et al., 2025).
Another key transformation is agricultural “servitization,” which refers to the transition from traditional, production-centric farming toward service-oriented agricultural models. These services—ranging from machinery leasing and soil testing to technical advisory support—are increasingly recognized as vital for raising productivity and reducing environmental burdens (Qin et al., 2017). Adaptive policy adjustments in other resource-dependent contexts have shown that flexible governance approaches can yield co-benefits for ecosystems, agriculture, and local economies (Jiang et al., 2023). Similarly, agricultural transformation must also account for land-use change patterns, which are influenced by both local drivers and broader geopolitical or socio-economic dynamics (Sulieman, 2024).
Nonetheless, the productivity impacts of servitization are often non-linear and highly region-specific, presenting an analytical challenge for policy development. This complexity parallels findings from advanced econometric analyses, where heterogeneous responses emerge across different groups and contexts (Yang et al., 2024). Green innovation, such as that driven by green bond financing, can also interact with structural transformation by enhancing environmentally friendly production practices (Dong and Yu, 2024). Additionally, hidden yet persistent disparities in rural capabilities—similar to the “long tail” phenomenon in rural education—can limit the equal distribution of productivity gains and must be addressed for truly inclusive agricultural transformation (Dong and Yu, 2024).
Despite growing interest in structural transformation, several critical gaps remain in the existing literature. Most studies focus on macro-level impacts at the provincial or national scale, providing limited insights into how structural adjustments operate at the local level. Additionally, the evidence on the effectiveness of agricultural production services remains inconclusive, largely due to the failure to capture regional heterogeneity and non-linear relationships (Qin et al., 2017). Another overlooked area is the mediating role of digitalization, which has become increasingly important in enabling structural transitions but is seldom integrated into empirical analyses. These limitations hinder the formulation of context-sensitive, spatially differentiated strategies for green productivity enhancement.
To address these challenges, this study makes three key contributions. First, it conducts a fine-grained, county-level analysis of agricultural structural adjustment and its impact on GTFP across 1,743 counties in China from 2003 to 2022, capturing spatial heterogeneity and local dynamics often overlooked in aggregated studies. Second, it examines potential non-linear effects—specifically, a U-shaped relationship between agricultural servitization and GTFP—to identify thresholds where servitization shifts from inhibiting to promoting productivity. Third, it incorporates digitalization as a mediating mechanism, shedding light on how digital infrastructure and technologies strengthen the productivity gains from structural adjustments.
This research investigates whether structural adjustments produce productivity-enhancing “structural dividends” and how these effects differ across regions. GTFP is measured using the DEA–Malmquist index, which captures changes in dynamic efficiency over time. A Spatial Autoregressive model with Autoregressive Disturbances (SARAR) model is employed to examine inter-regional spillovers and reveal the mechanisms through which structural transformation influences GTFP, guided by the structural dividend hypothesis. By integrating spatial heterogeneity and digital mediation, this study provides policy-relevant insights into how region-specific structural shifts can contribute to more sustainable and resilient agricultural systems in China.
The remainder of this paper is structured as follows. Section 2 develops the theoretical framework and presents the research hypotheses. Section 3 describes the data sources, measurement of key variables, and empirical methodology, including the spatial econometric model. Section 4 reports the empirical findings, including baseline results, robustness checks, and regional heterogeneity analyses. Section 5 investigates the underlying mechanisms through mediation analysis. Finally, Section 6 concludes the paper and offers policy implications based on the study’s findings. Building on this outline, the next section develops the theoretical framework underpinning the study and formulates the research hypotheses.
2 Theoretical background
2.1 Direct effect
The concept of the “structural dividend” was originally developed within the context of national industrial restructuring but is equally applicable to the agricultural sector. When structural adjustments occur in agriculture, and production factors such as labor, land, or capital shift from lower-productivity activities to higher-productivity ones, GTFP increases. This improvement is referred to as a structural dividend. Conversely, if production factors are reallocated from high-productivity to low-productivity sectors, it leads to a decline in GTFP, resulting in what is known as a structural negative benefit.
The relationship between agricultural structural adjustment and GTFP is strongly influenced by the alignment between the evolving agricultural structure and local factor endowments. When structural adjustments are consistent with regional comparative advantages—reflecting the optimal use of land, labor, and other inputs—resource allocation becomes more efficient, releasing structural dividends that enhance GTFP. However, when agricultural restructuring deviates from the regional factor endowment or proceeds in an excessive or imbalanced manner, it can create structural distortions. In such cases, the adjustments may weaken the positive effects on productivity or even act as a constraint on GTFP improvement.
A key dimension of this transformation is the servitization of agriculture. When agriculture becomes excessively service-oriented or when the transition toward service-based activities outpaces local capacity and ecological balance, the original structure may be destabilized, resulting in negative consequences for productivity. Nonetheless, a rational and moderate degree of servitization can significantly benefit GTFP. By allowing agricultural producers to concentrate on their core strengths while outsourcing non-core activities to specialized service providers, transaction costs are reduced, and farmers’ incomes increase—both of which positively influence productivity. Furthermore, collaboration between agricultural service industries and producers encourages a coordinated division of labor that leverages the comparative advantages of both parties. This synergy enhances production efficiency and drives further gains in GTFP. A theoretical framework of the study is given in Figure 1.
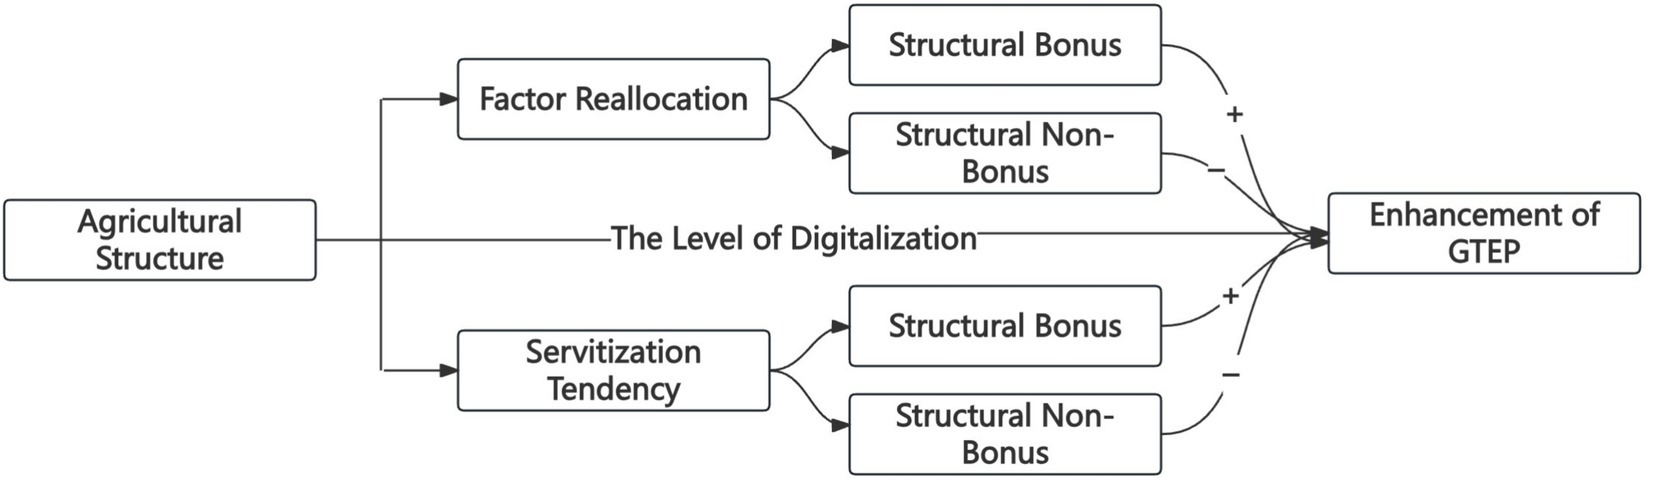
Figure 1. Theoretical analysis framework.
Based on this theoretical rationale, this study proposes the following hypothesis:
H1: Moderate adjustment of the agricultural structure facilitates improvements in agricultural green total factor productivity.
2.2 Indirect effect
The adjustment of the agricultural structure contributes to the improvement of green total factor productivity (GTFP) through the enhancement of digitalization. Structural upgrading in agriculture incentivizes all segments of the sector to adopt digital technologies more actively, leading to a general rise in the level of digitalization. This increased digital integration impacts GTFP through several pathways: it improves production efficiency, optimizes the allocation of resources, broadens market access, and raises the added value of agricultural products. As a result, a clear transmission mechanism emerges agricultural structure upgrading leads to higher levels of digitalization, which in turn promotes an increase in GTFP.
Digitalization thus functions as a mediating factor that transforms the benefits of structural upgrading—such as industrial transformation and the optimization of agricultural business models—into tangible improvements in productivity. By enabling more precise, data-driven use of production inputs across different stages of industrial expansion, product refinement, and enterprise scaling, digitalization allows for better responsiveness to market demands and the generation of greater economic value. This digital transformation ultimately enhances the efficiency and sustainability of agricultural production systems, contributing to the growth of GTFP.
Based on this rationale, the study proposes the following hypothesis:
H2: Moderate adjustment of the agricultural structure can promote improvements in agricultural green total factor productivity through the enhancement of digitalization levels.
Having established the hypotheses, the following section outlines the selection of the empirical model and variables used to test them.
3 Materials and methods
3.1 Selection of model
Considering the potential spatial correlation among macroeconomic variables and the impact of spatial distance on regional GTFP (Zhang, 2012), this study employs a spatial econometric model to test the proposed hypotheses. In terms of model selection, given that both spatial lag and error terms may coexist in spatial models, we introduce the SARAR model with a spatial autoregressive error term for analysis (Sun et al., 2017). The specific form of the SARAR model is as in Equation 1:
where Y represents the dependent variable, X denotes the independent variables, W is the spatial weight matrix, β is the vector of coefficients, ε is the random disturbance term, ε ~ N (0,σ2In). λ is the autoregressive coefficient for the residuals, and ρ is the spatial autoregressive coefficient.
3.2 Source of data
A substantial share of China’s agricultural production is concentrated in county-level regions, making counties an ideal unit of analysis for agricultural research. Utilizing county-level data not only improves the representativeness of the study but also significantly expands the sample size compared to analyses conducted at the provincial or municipal level. In this study, county-level administrative divisions, as defined in 2022, serve as the basis for sample selection. Following a rigorous screening process, the final dataset includes 1,743 counties observed over a 19-year period, yielding a total of 33,117 panel observations. The primary data sources comprise the China County Statistical Yearbook (County and City Volume) (2014–2018), as well as provincial and municipal statistical yearbooks spanning 2014–2023. The analysis begins in 2003, the year China adopted a revised national industrial classification standard, which integrated the output value of agricultural, forestry, animal husbandry, and fishery services into the overall output value of the agriculture, forestry, animal husbandry, and fishery sector. With the model framework established, the next step is to define the dependent variable and its associated measurement indicators.
3.3 Selection of the dependent variable
In this study, agricultural green total factor productivity (GTFP) is selected as the dependent variable. Before calculating GTFP, it is necessary to define appropriate output and input indicators. The output indicators are categorized into expected and non-expected outputs. The expected output is measured using the gross output value of agriculture, forestry, animal husbandry, and fishery at the county level. To ensure consistency over time, this value is adjusted to constant prices using the 2003 base year and deflated with the corresponding year’s gross national product (GNP) deflator. The non-expected output is captured by agricultural carbon emissions, which account for CO2 emissions generated through key agricultural activities, including the use of fertilizers, pesticides, and irrigation. Detailed descriptions of these indicators are provided in Table 1.
Table 1. Indicators for the measurement of agricultural GTFP index.
This study adopts physical agricultural inputs as the input indicators for measuring agricultural green total factor productivity (GTFP). Specifically, labor input is measured by the number of individuals employed in agriculture, forestry, animal husbandry, and fishery within each county across the study period. Capital inputs are captured through four indicators: the total power of agricultural mechanization, the net amount of fertilizer applied, the quantity of pesticide used, and the effective irrigated area—all of which reflect key dimensions of capital utilization in agricultural production. Land input is represented by the total sown area of crops in each county over the years. To estimate GTFP, the Malmquist index approach is employed. The defined input and output indicators are entered into DEAP 2.1 software, which calculates county-level GTFP values. Due to the structure of the DEA–Malmquist index method—where the first year serves as the base period and calculations begin from the second year—the resulting GTFP measurements span the period from 2004 to 2022.
Figure 2 presents the trends in China’s agricultural green total factor productivity (GTFP) and its decomposition indices from 2004 to 2022. Overall, agricultural GTFP displays a pattern of initial decline followed by a gradual recovery, accompanied by fluctuations throughout the period. Despite these fluctuations, the GTFP growth rate remained positive in all years. The highest recorded growth occurred in 2004, reaching 18.80%, while the lowest was observed in 2017 at 0.80%. The period from 2009 to 2017 was marked by a gradual decline in GTFP, which may be linked to the broader economic transition from a phase of “structural acceleration” during industrialization to a phase of “structural deceleration” during urbanization (Sun et al., 2017). From 2017 to 2022, GTFP showed a steady upward trend, likely driven by the deepening of ecological civilization initiatives and a shift in agricultural production models from extensive, input-heavy practices to more intensive and environmentally sustainable approaches.
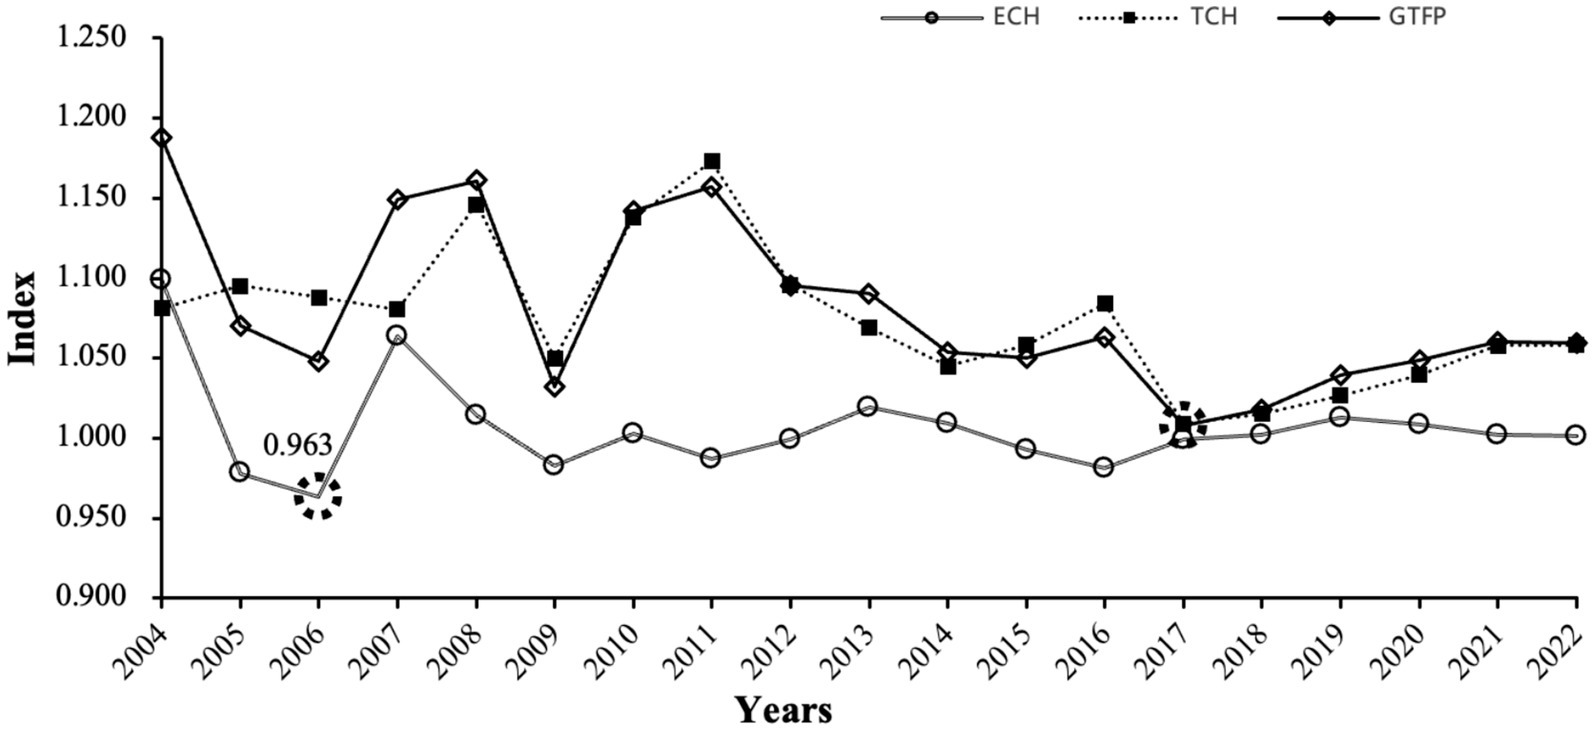
Figure 2. Trends in GTFP and its decomposition into technical efficiency and technological progress across Chinese counties.
The decomposition of the GTFP index reveals that technological progress maintained a consistent pattern of positive growth across the entire study period. In contrast, technical efficiency fluctuated within a relatively narrow range and registered negative growth in several years. Notably, the trajectory of overall GTFP growth closely aligns with that of technological progress. On average, technological progress accounted for 93.5% of the annual GTFP growth, while technical efficiency contributed only 6.5%. These findings indicate that technological progress has been the principal engine driving improvements in agricultural GTFP in China. Consequently, the gains in GTFP over this period were largely propelled by what can be characterized as a “single-track drive” centered on technological advancement. Building on the assessment of GTFP trends, the subsequent step is to define the core explanatory variables, focusing on agricultural structure adjustment.
3.4 Selection of explanatory variables
In this study, agricultural structure adjustment is quantified using three key indices: rationalization, sophistication, and service orientation. The rationalization index is adapted from established methodologies used to evaluate industrial structure upgrading, capturing the degree of integration, coordination, and efficiency in resource allocation across various agricultural sub-sectors (Liu and Zhang, 2008). To operationalize this, the agricultural system is divided into three structural tiers: the primary sector, comprising the planting industry; the secondary sector, which includes forestry, animal husbandry, and fishery; and the tertiary sector, consisting of services related to agriculture, forestry, animal husbandry, and fishery. This classification allows for a comprehensive assessment of how balanced and efficient the structural distribution of agricultural activities is across different functional domains. The specific formula used to calculate these indices is given in Equation 2.
where his represents the rationalization index of the agricultural structure in county. Yj and Lj denote the output value and the number of employees, respectively, in the j agricultural sector within the county. Y and L represent the total output value and the total number of employees across all agricultural sectors (agriculture, forestry, animal husbandry, and fishery) in the county. According to the definitions provided by scholars such as and Yu (2015), the rationalization index operates inversely to the level of rationalization. Specifically, a higher rationalization index indicates a lower degree of rationalization in the agricultural structure, while a lower index suggests a higher degree of rationalization. When his = 0, the agricultural economic system is in equilibrium. A larger rationalization index implies greater deviation from this equilibrium state.
Due to the unavailability of employee data for each sector of the agricultural industry in macro-level datasets, it is necessary to process and estimate the relevant indicators pertaining to the number of employees in each agricultural sector. A weighting coefficient approach is applied to disaggregate labor input across the various sectors within the broader agricultural domain. The formula for the weighting coefficient can be written in Equation 3.
where A represents the weight coefficient for labor input in each agricultural sector within the county. Specifically, a denotes the sown area of crops, b indicates the area of commonly used cultivated land, Yj represents the output value of the j agricultural sector, and Y signifies the total output value of agriculture, forestry, animal husbandry, and fishery in the county. The labor input indicator for each agricultural sector is calculated by multiplying the annual number of employees engaged in agriculture, forestry, animal husbandry, and fishery in the county by the weight coefficient A.
The index for the advancement of agricultural structure is quantified using a methodology analogous to that employed for measuring industrial structure advancement. Specifically, within the broader agricultural sector, crop farming is classified as the primary industry, while forestry, animal husbandry, and fishery are collectively categorized as the secondary industry. The tertiary industry encompasses services related to agriculture, forestry, animal husbandry, and fishery. The specific formula can be written in Equation 4.
where gis represents the index of agricultural structural advancement for the county. Specifically, Y1t, Y2t and Y3t denote the output values of the planting industry, the combined forestry, animal husbandry, and fishery sector, and the service sector related to agriculture, forestry, animal husbandry, and fishery in the county during year t, respectively. A higher gis value indicates a more advanced agricultural structure in the region, while a lower value suggests a less advanced structure.
The indicator for the servitization of agricultural structure is constructed to reflect the scale and development level of the agricultural service sector. It is measured as the ratio of the output value of the agricultural, forestry, animal husbandry, and fishery service industries to the total output value of the entire agricultural sector. For the selection of control variables, detailed explanations are not provided here, as they are summarized in Table 2.
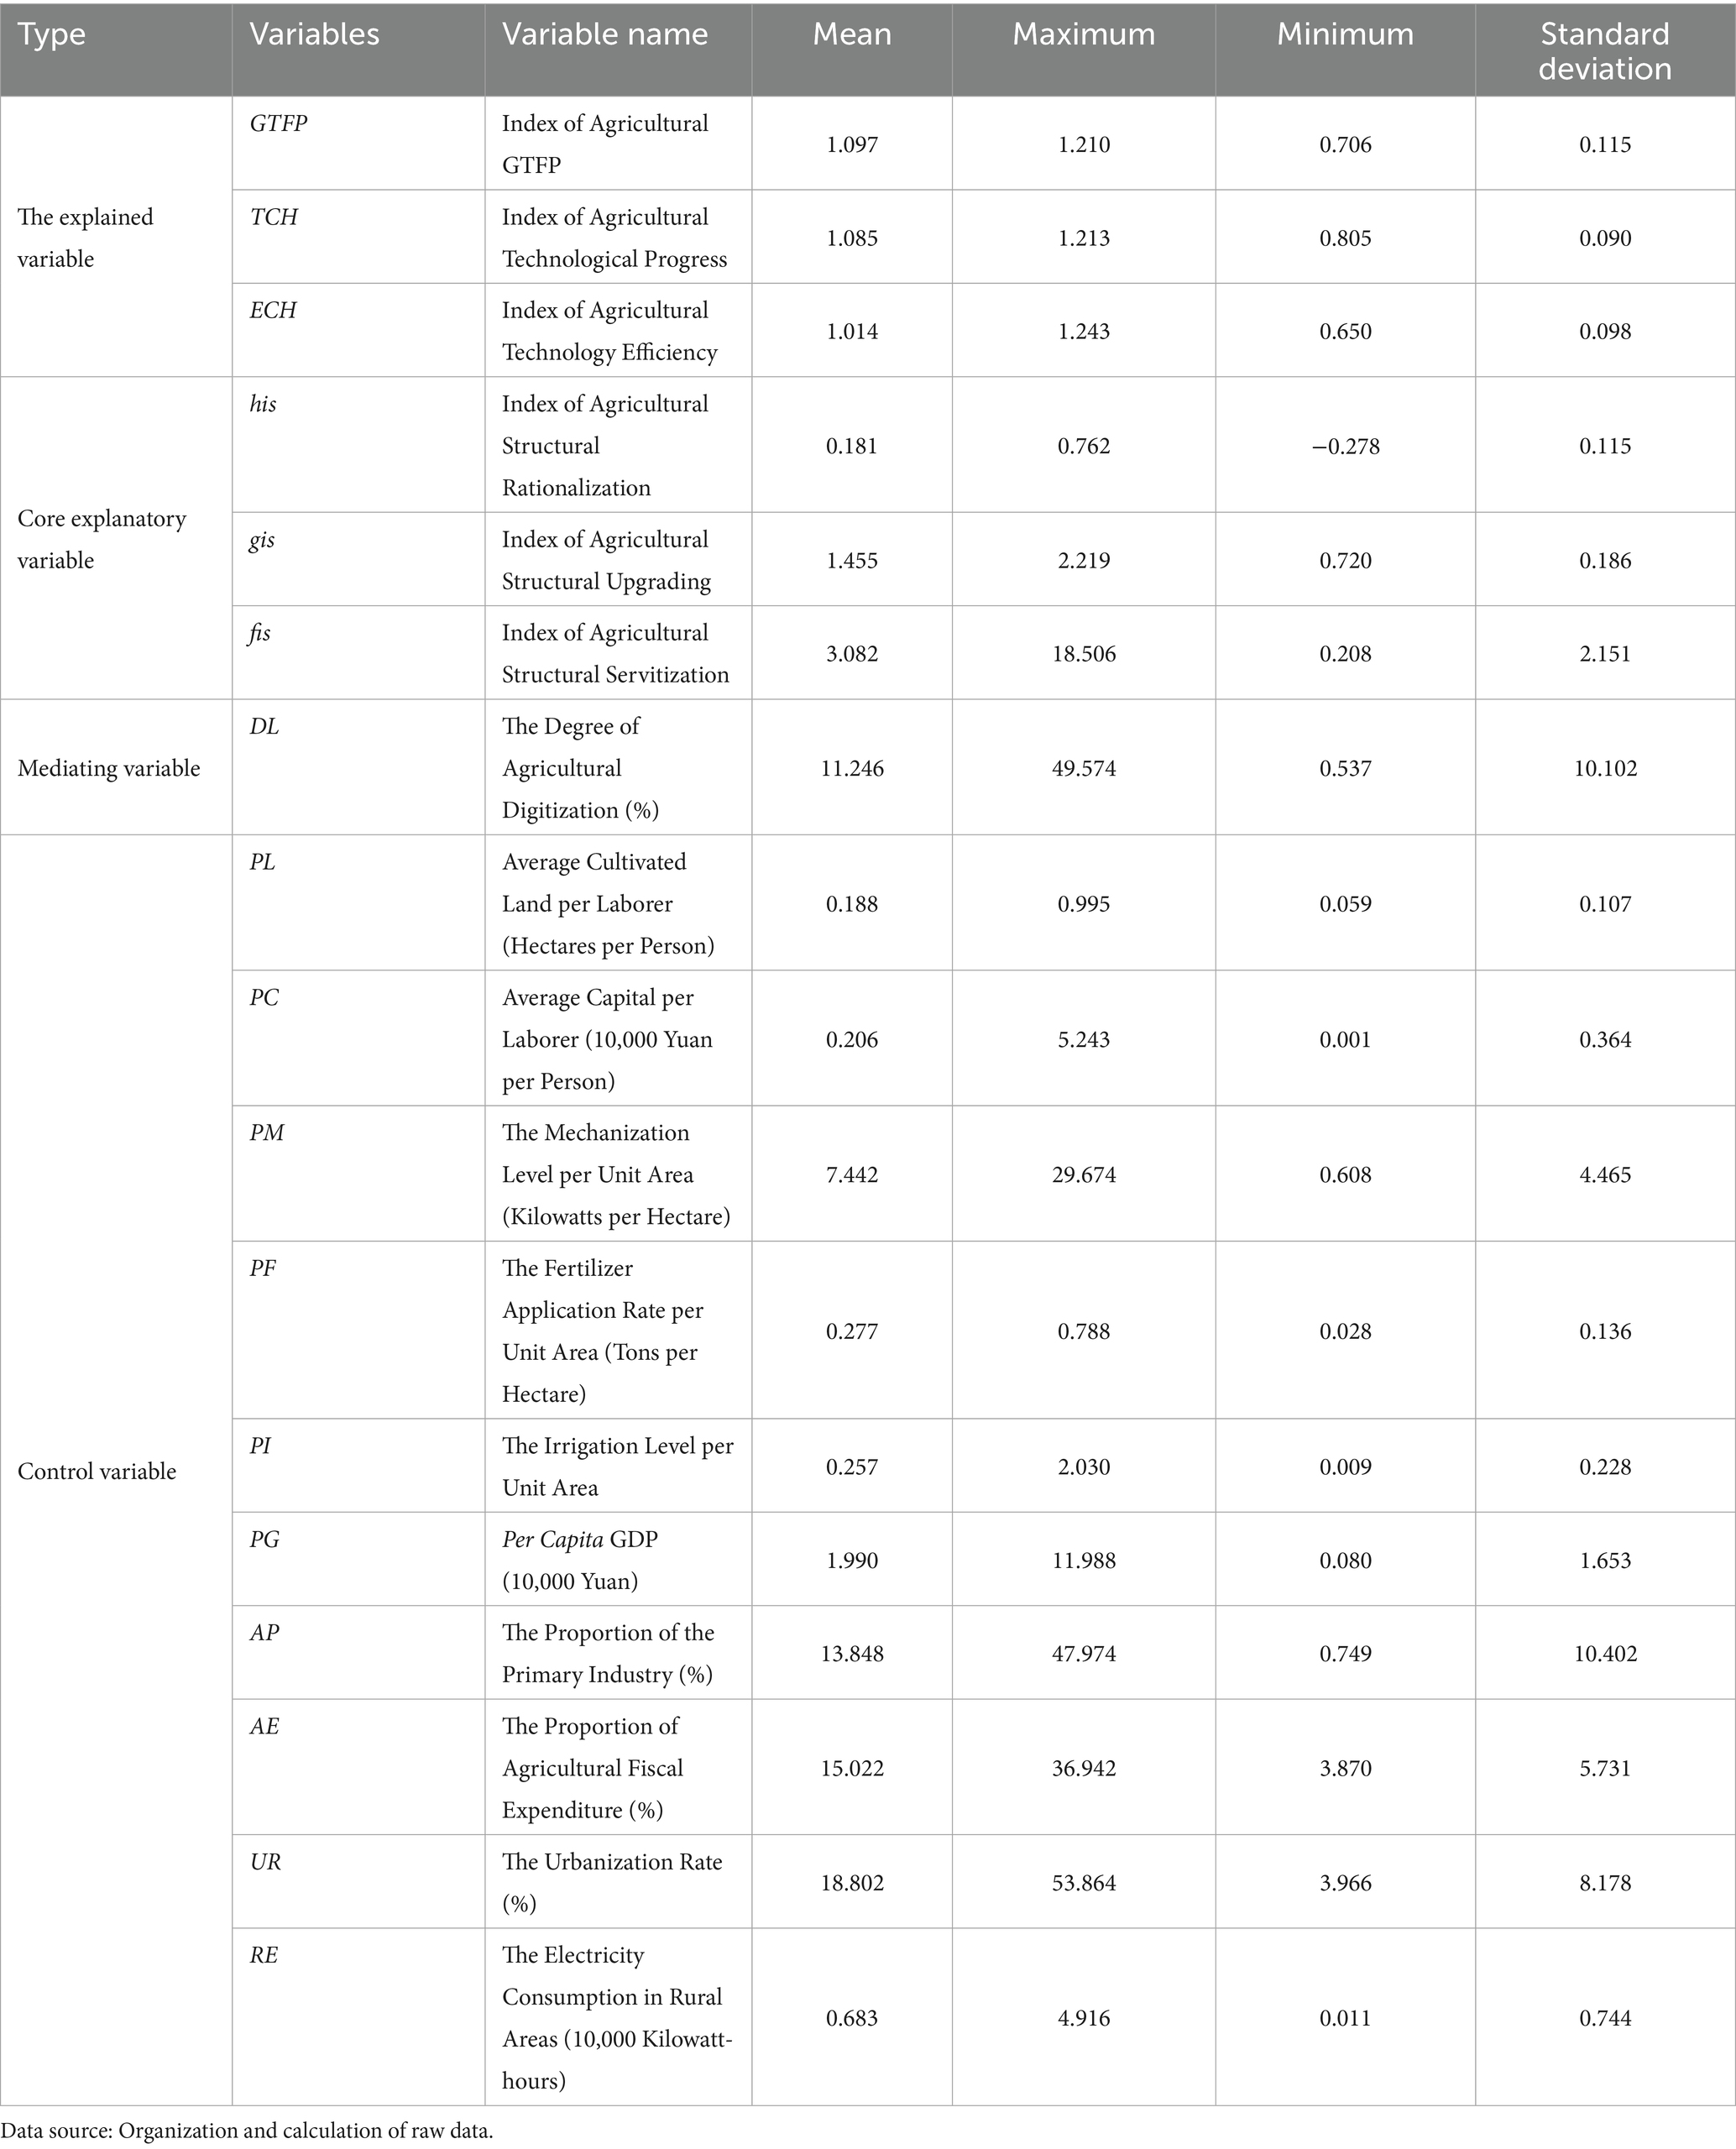
Table 2. Descriptive statistics of variables.
To ensure the robustness of our empirical findings, we adopt two widely recognized approaches based on authoritative literature. One such approach involves replacing the core explanatory variable with an alternative indicator. Furthermore, we utilize the degree of industrial structure deviation as a proxy for the rationalization of the agricultural structure. This index captures the mismatch between the distribution of agricultural output and labor across subsectors, providing a measure of resource allocation efficiency. A lower value indicates a more balanced and rational structure, while a higher value reflects structural imbalances. The degree of deviation is calculated using a given Equation 5,
where Yj denotes the output value of the j agricultural sector within the county, while Y represents the total output value of agriculture, forestry, animal husbandry, and fishery in the county. Lj indicates the number of employees in the j agricultural sector within the county, and L represents the total number of employees across these sectors in the county. The ratio Y/L signifies labor productivity. According to classical economic theory, when the economy is in equilibrium, the productivity levels across different industrial sectors are equal. Therefore, under equilibrium conditions, Yi/Li = Y/L, and at this point, the deviation degree of the industrial structure E = 0. This index reflects the coupling between the output structure and the input structure. A larger E value indicates a greater deviation from the equilibrium state, suggesting a more unreasonable agricultural structure.
3.5 Selection of mediating variables
Broadband access is a critical indicator of network infrastructure in rural areas and serves as a foundational prerequisite for advancing agricultural digitalization. Reliable broadband coverage enables the deployment of a wide range of digital applications and services in agriculture, including online training in agricultural technologies, precision farming tools, and e-commerce platforms for agricultural product transactions. Agricultural digitalization is measured using the ratio of rural households with broadband access to the total number of rural households in each county, reflecting the extent of digital infrastructure penetration in rural areas. A higher ratio indicates a more developed state of digital infrastructure and, by extension, a more advanced level of digitalization in agriculture.
4 Results and discussion
4.1 Relevant statistical tests
4.1.1 Spatial correlation analysis
Before constructing the spatial econometric model, it is necessary to test whether the dependent variable exhibits spatial correlation. To this end, this study employs Moran’s I index to assess the degree of spatial autocorrelation in agricultural GTFP across counties. The results of this analysis are presented in Table 3.
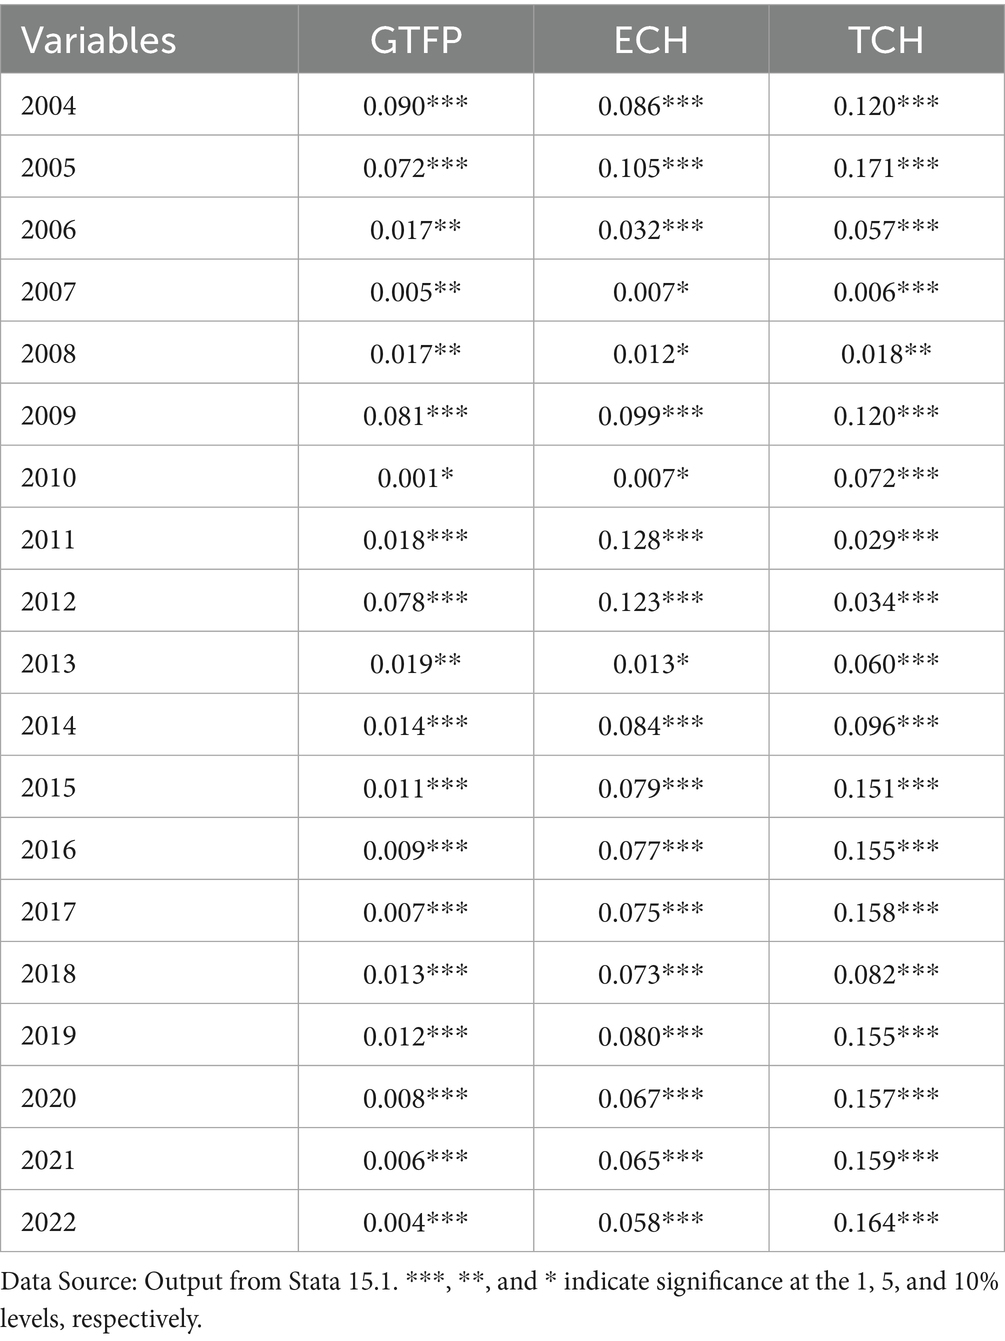
Table 3. Moran’s I index statistical test.
Based on Moran’s I index test results, it is evident that there exists a significant spatial correlation in the agricultural GTFP among counties. The formation of this spatial correlation can be attributed to two primary factors: First, adjacent counties share similar resource endowment characteristics, which may lead to correlated agricultural GTFP levels. Second, the proximity of neighboring counties facilitates more frequent and efficient economic interactions, promoting the flow of production factors and technology spillovers, thereby generating spatial spillover effects. Moreover, the positive value of Moran’s I index indicates that this spatial correlation manifests as a positive spatial spillover effect. Given the presence of spatial spillover effects, it is essential to conduct diagnostic tests to verify the model’s reliability before proceeding with estimation.
4.1.2 Multicollinearity, BP, and Hausman tests
Before model estimation, a series of diagnostic tests was conducted to ensure the robustness and reliability of the analysis. The first step involved assessing multicollinearity among the explanatory variables. A preliminary correlation coefficient test revealed that the highest pairwise correlation coefficient was 0.4423, indicating relatively weak correlations among the variables. To further verify these results, a variance inflation factor (VIF) test was performed. As shown in Table 4, the maximum VIF value is 3.64, and the average VIF is 2.17. These values fall well below the commonly accepted threshold of 10, suggesting that multicollinearity is not a concern. Therefore, based on the combined results of the correlation and VIF analyses, it can be concluded that the dataset does not exhibit significant multicollinearity among the selected variables (Table 4).
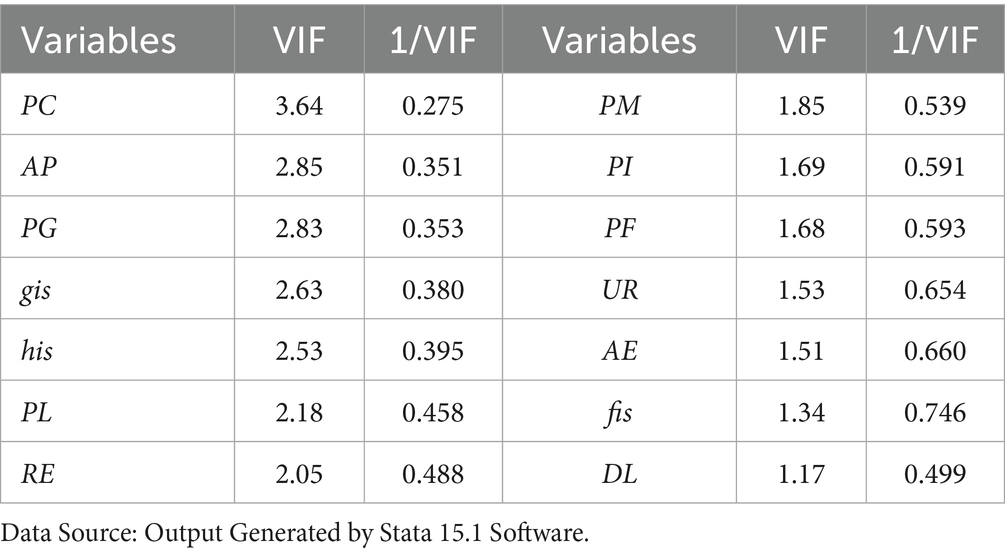
Table 4. Results of the VIF test.
The Breusch–Pagan (BP) test results show that all p-values are 0.0000, leading to the rejection of the null hypothesis that supports the pooled regression model. This indicates that the random effects model is statistically superior to the pooled model. Following this, the Hausman test produces p-values of 0.0000, 0.0029, and 0.0000, which also lead to the rejection of the null hypothesis favoring the random effects model. These findings demonstrate that the fixed effects model provides a better fit for the data than the random effects model. Therefore, based on these diagnostic tests, the fixed effects model is determined to be the most appropriate specification for this analysis (Table 5).
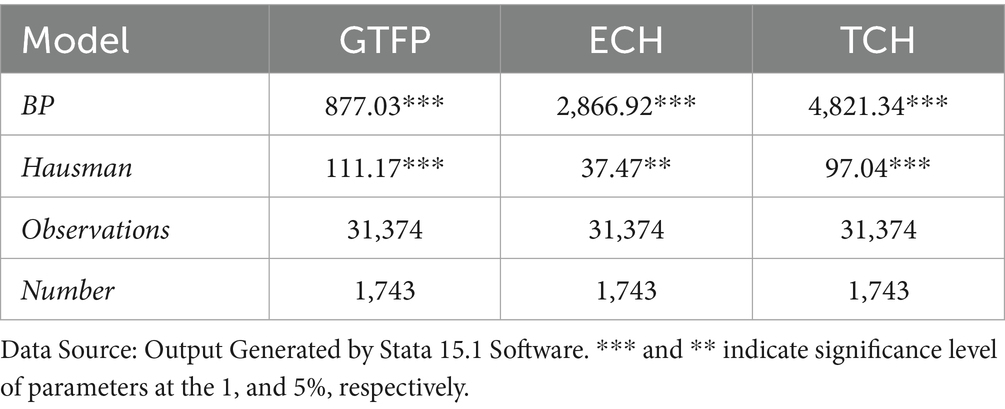
Table 5. Results of the BP and Hausman tests.
4.2 Estimation of the benchmark model
The estimation results of the spatial econometric model indicate that both the spatial autoregressive coefficient (ρ) and the spatial error term coefficient (λ) are statistically significant. This finding corroborates the Moran’s I test results, thereby justifying the necessity of employing a spatial econometric model in this analysis. The benchmark model utilized in this study is the SARAR model, which yields results consistent with those of SDM. Subsequent analysis will be conducted based on the SARAR model (Table 6).
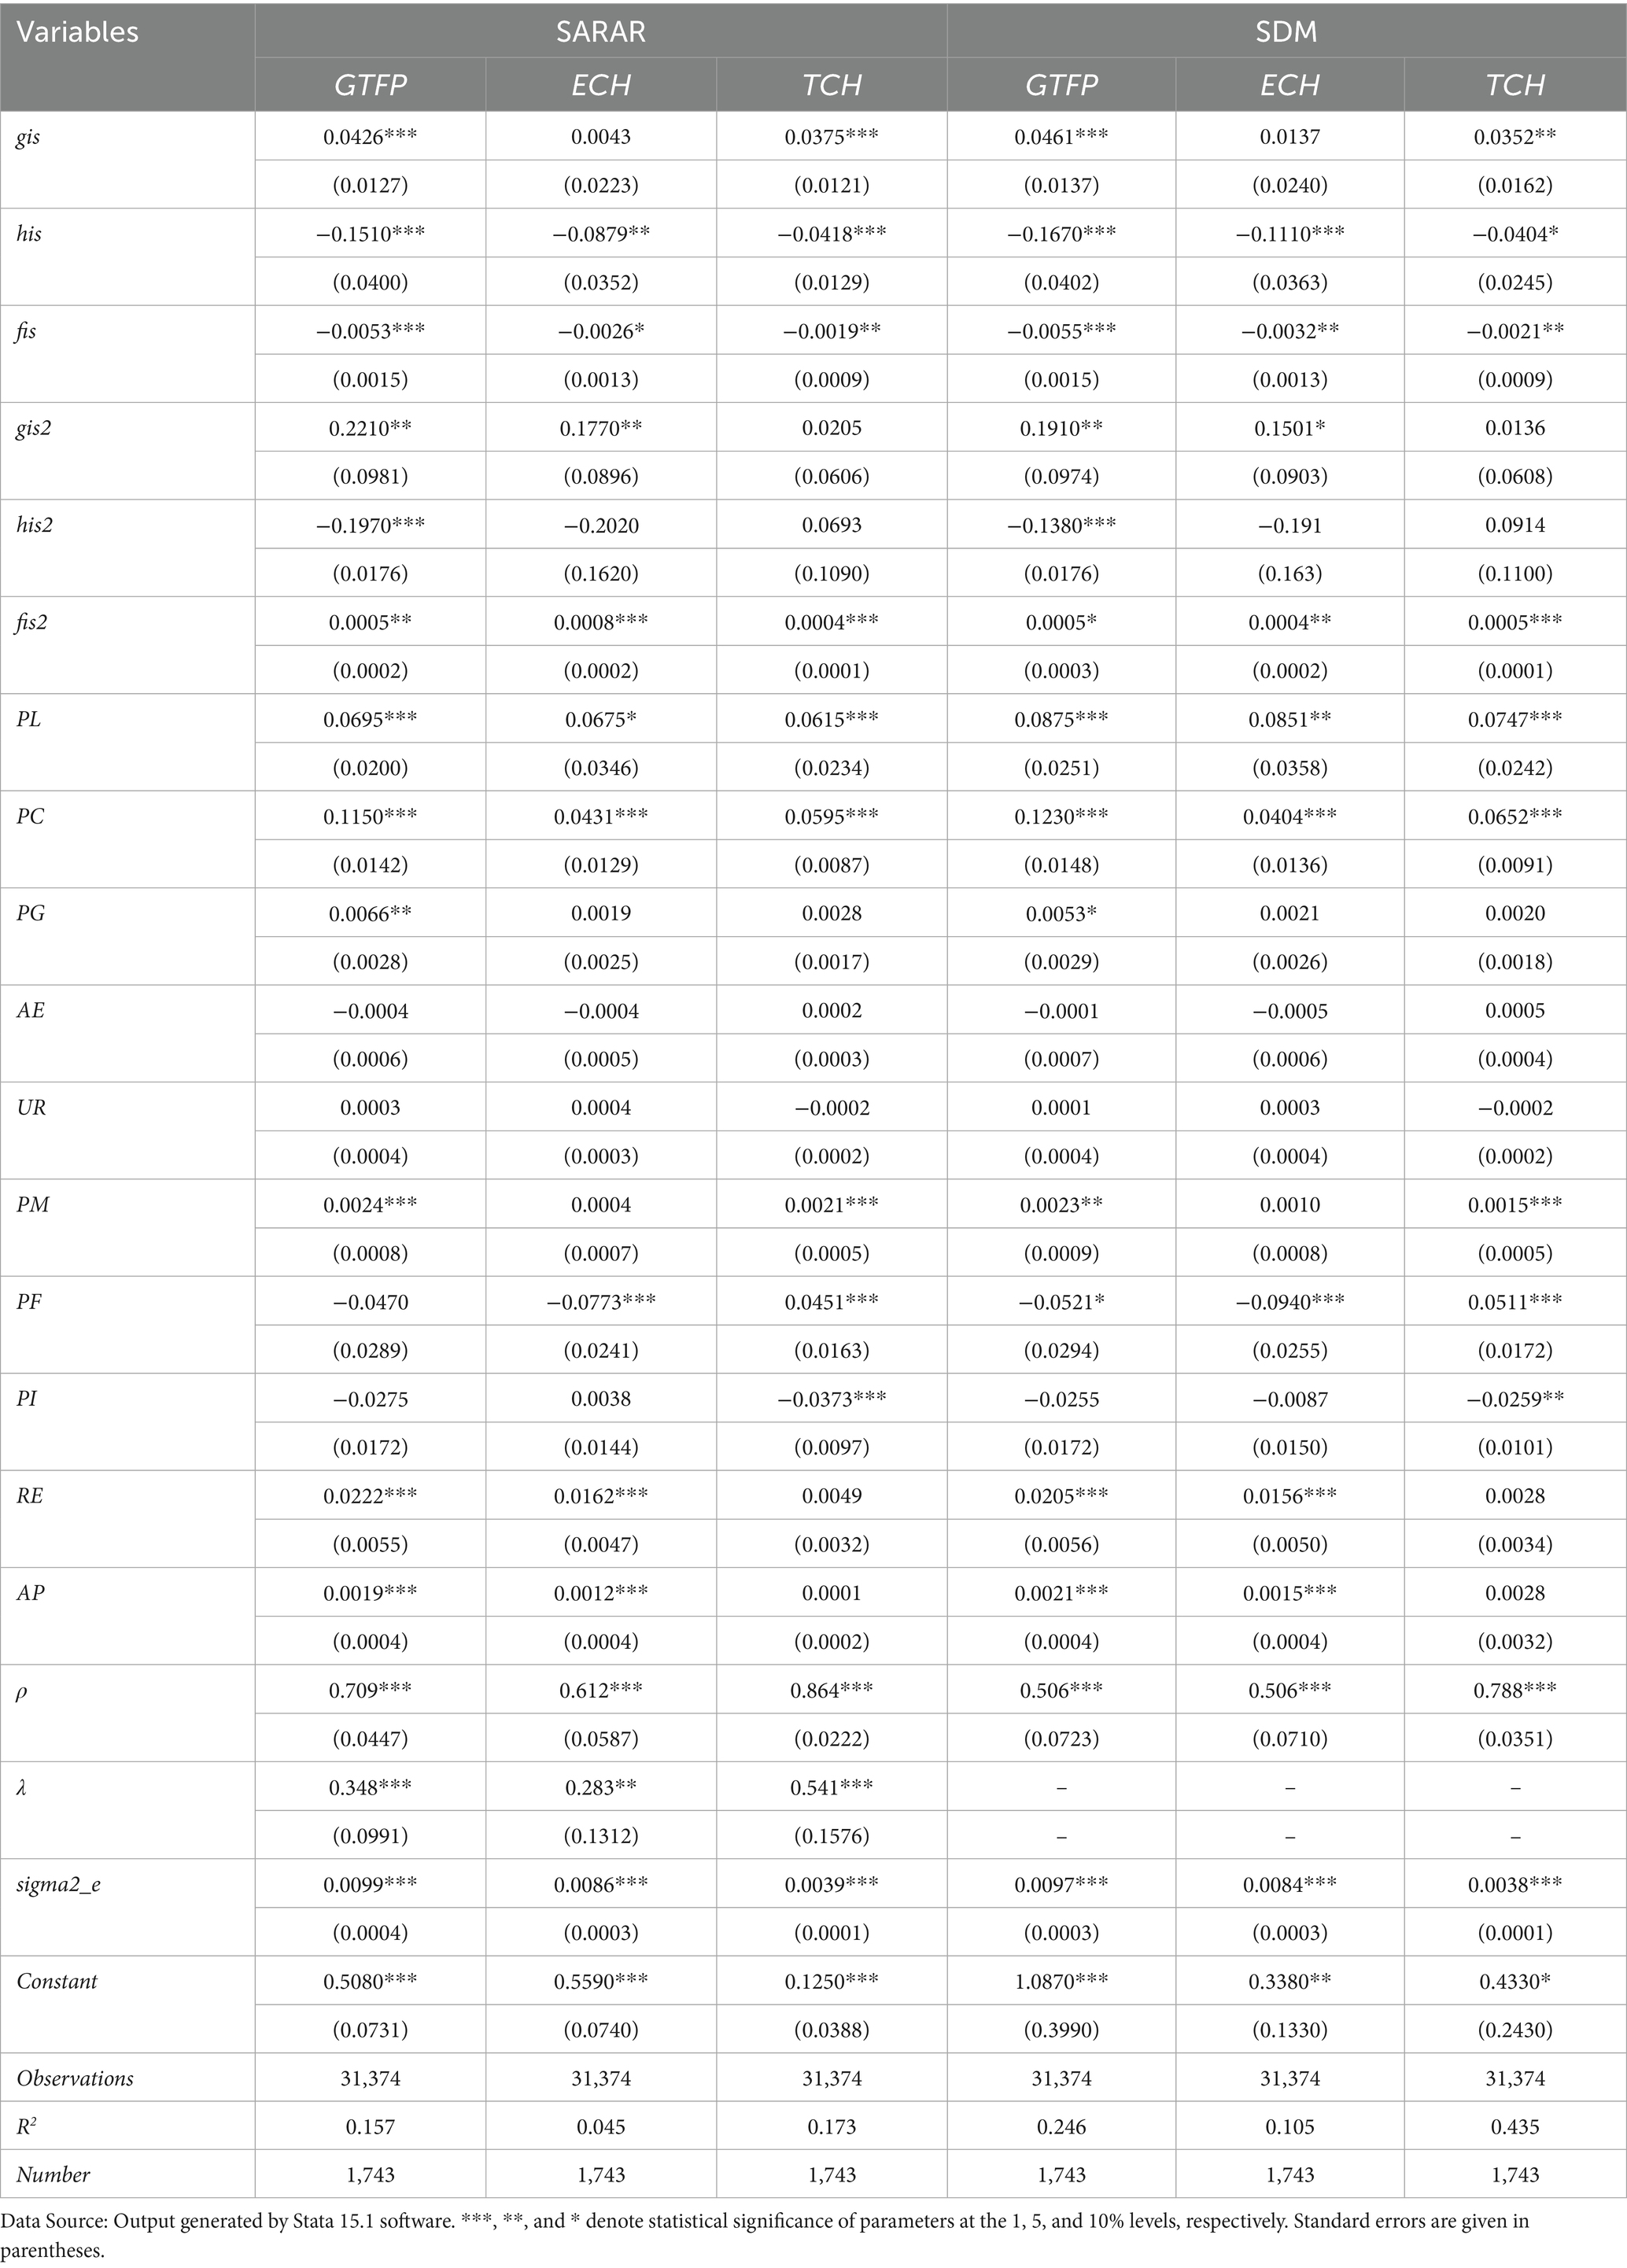
Table 6. Estimation of spatial econometric models.
This study first examines the impact of the agricultural structure advancement index (GIS) on green total factor productivity (GTFP). The estimation results indicate that agricultural structure advancement has a significantly positive effect on GTFP, suggesting the presence of a notable “scale effect.” As the agricultural structure evolves toward higher levels, it disrupts the traditional, siloed growth pattern of crop farming, alters the input–output configuration of production factors, and thereby enhances productivity. Additionally, the rapid growth of the agricultural service sector facilitates more efficient allocation of resources across sub-sectors, raising the marginal productivity of agricultural inputs.
Next, the study evaluates the effect of the agricultural structure rationalization index (HIS) on GTFP. The estimation results show a significantly negative coefficient for HIS. Since HIS is inversely related to the level of structural rationalization, this finding implies that improved rationalization promotes GTFP. One explanation is that, under the ecological civilization strategy, there has been a shift in agricultural inputs from traditional to greener factors, optimizing resource allocation and boosting GTFP. Another contributing factor is the reallocation of rural labor—either to non-agricultural sectors or within agriculture itself—which creates a substitution effect where capital replaces labor. This reconfiguration enhances the rationalization of the agricultural structure, and the resulting alignment with regional factor endowments contributes to improved productivity.
The analysis also explores the impact of the agricultural structure servitization index (FIS) on GTFP. The results show that FIS has a significantly negative effect on GTFP, indicating that a higher proportion of output from the agricultural service sector currently hinders productivity improvements. This suggests that, at present, servitization does not exhibit a scale effect conducive to GTFP growth—contrary to some previous findings (Sheng, 2014). Furthermore, the coefficient of the linear term for FIS is negative, while that of the quadratic term is positive, revealing a U-shaped relationship between servitization and GTFP. Specifically, at low levels of servitization, the transformation hampers productivity; however, once the level of servitization surpasses a certain threshold, its effect shifts from negative to positive. This may be due to the relatively small size and limited development of the agricultural service sector in China, which has not yet reached the scale required to significantly enhance GTFP. As the sector matures and expands, its positive contribution to productivity is expected to become more pronounced.
Finally, the study investigates the transmission mechanisms through which structural adjustment affects GTFP. Results indicate that the GIS index has a significant positive effect on technological progress, but not on technical efficiency, implying that structural advancement primarily enhances GTFP through the promotion of innovation and technology adoption. In contrast, the HIS index positively influences both technological progress and technical efficiency, suggesting a dual pathway through which rationalization boosts productivity. Conversely, the FIS index exerts a negative effect on both components, indicating that the observed hindrance to GTFP stems from simultaneous declines in both technical efficiency and technological progress. Taken together, these findings empirically validate Hypothesis H1, confirming that moderate adjustment of the agricultural structure—particularly when aligned with factor endowments and technological advancement—can enhance agricultural green total factor productivity.
The estimation results also reveal important insights regarding the influence of control variables on GTFP. Per capita GDP (PC) demonstrates a significantly positive effect across most model specifications, suggesting that higher levels of economic development create favorable conditions for green productivity growth in agriculture. This effect likely reflects the ability of wealthier counties to invest in advanced technologies, infrastructure, and environmental protection measures, thereby enhancing GTFP. Similarly, the urbanization rate (UR), though not always statistically significant, shows a generally positive relationship with GTFP in some models. This indicates that moderate urbanization can facilitate the diffusion of innovations, strengthen market linkages between rural and urban areas, and promote efficient allocation of agricultural resources. However, the marginal effects of urbanization appear limited, possibly due to diminishing returns or challenges in integrating rural agricultural systems into rapidly urbanizing economies. To validate the consistency of these empirical results, the following section implements robustness checks using two complementary approaches.
4.3 Robustness test
To ensure the robustness of our findings, we summarize and adopt two primary methods for robustness testing based on existing authoritative literature. The first approach involves variable substitution, wherein the core explanatory variable is replaced to assess the stability of the estimated relationships.
4.3.1 Replace the core explanatory variable
As part of the robustness checks, we replace the original core explanatory variable with the degree of industrial structure deviation to re-estimate the model. This variable effectively captures the extent of imbalance between agricultural output and labor distributions, thus serving as a reliable proxy for structural rationalization. Consistent with theoretical expectations, we observe that regions with lower deviation values—indicative of more rational agricultural structures—exhibit statistically significant improvements in the dependent variable. The empirical results remain robust and consistent, thereby validating the credibility of our main findings even under alternative variable specifications. Building on the theoretical framework of Clark’s Theorem, scholars such as Yu (2015) and Song and Zheng (2017) have employed the ratio of non-agricultural output value to the total output value of agriculture, forestry, animal husbandry, and fishery as a proxy variable to measure the advancement of the agricultural structure. Similarly, following the work of Yu et al. (2016), this study adopts the ratio of agricultural service industry output to total agricultural output as a proxy for the servitization of the agricultural structure. All other variables and methodological procedures remain consistent with the main specification of the study. Details of these proxy variables are presented in Table 7.
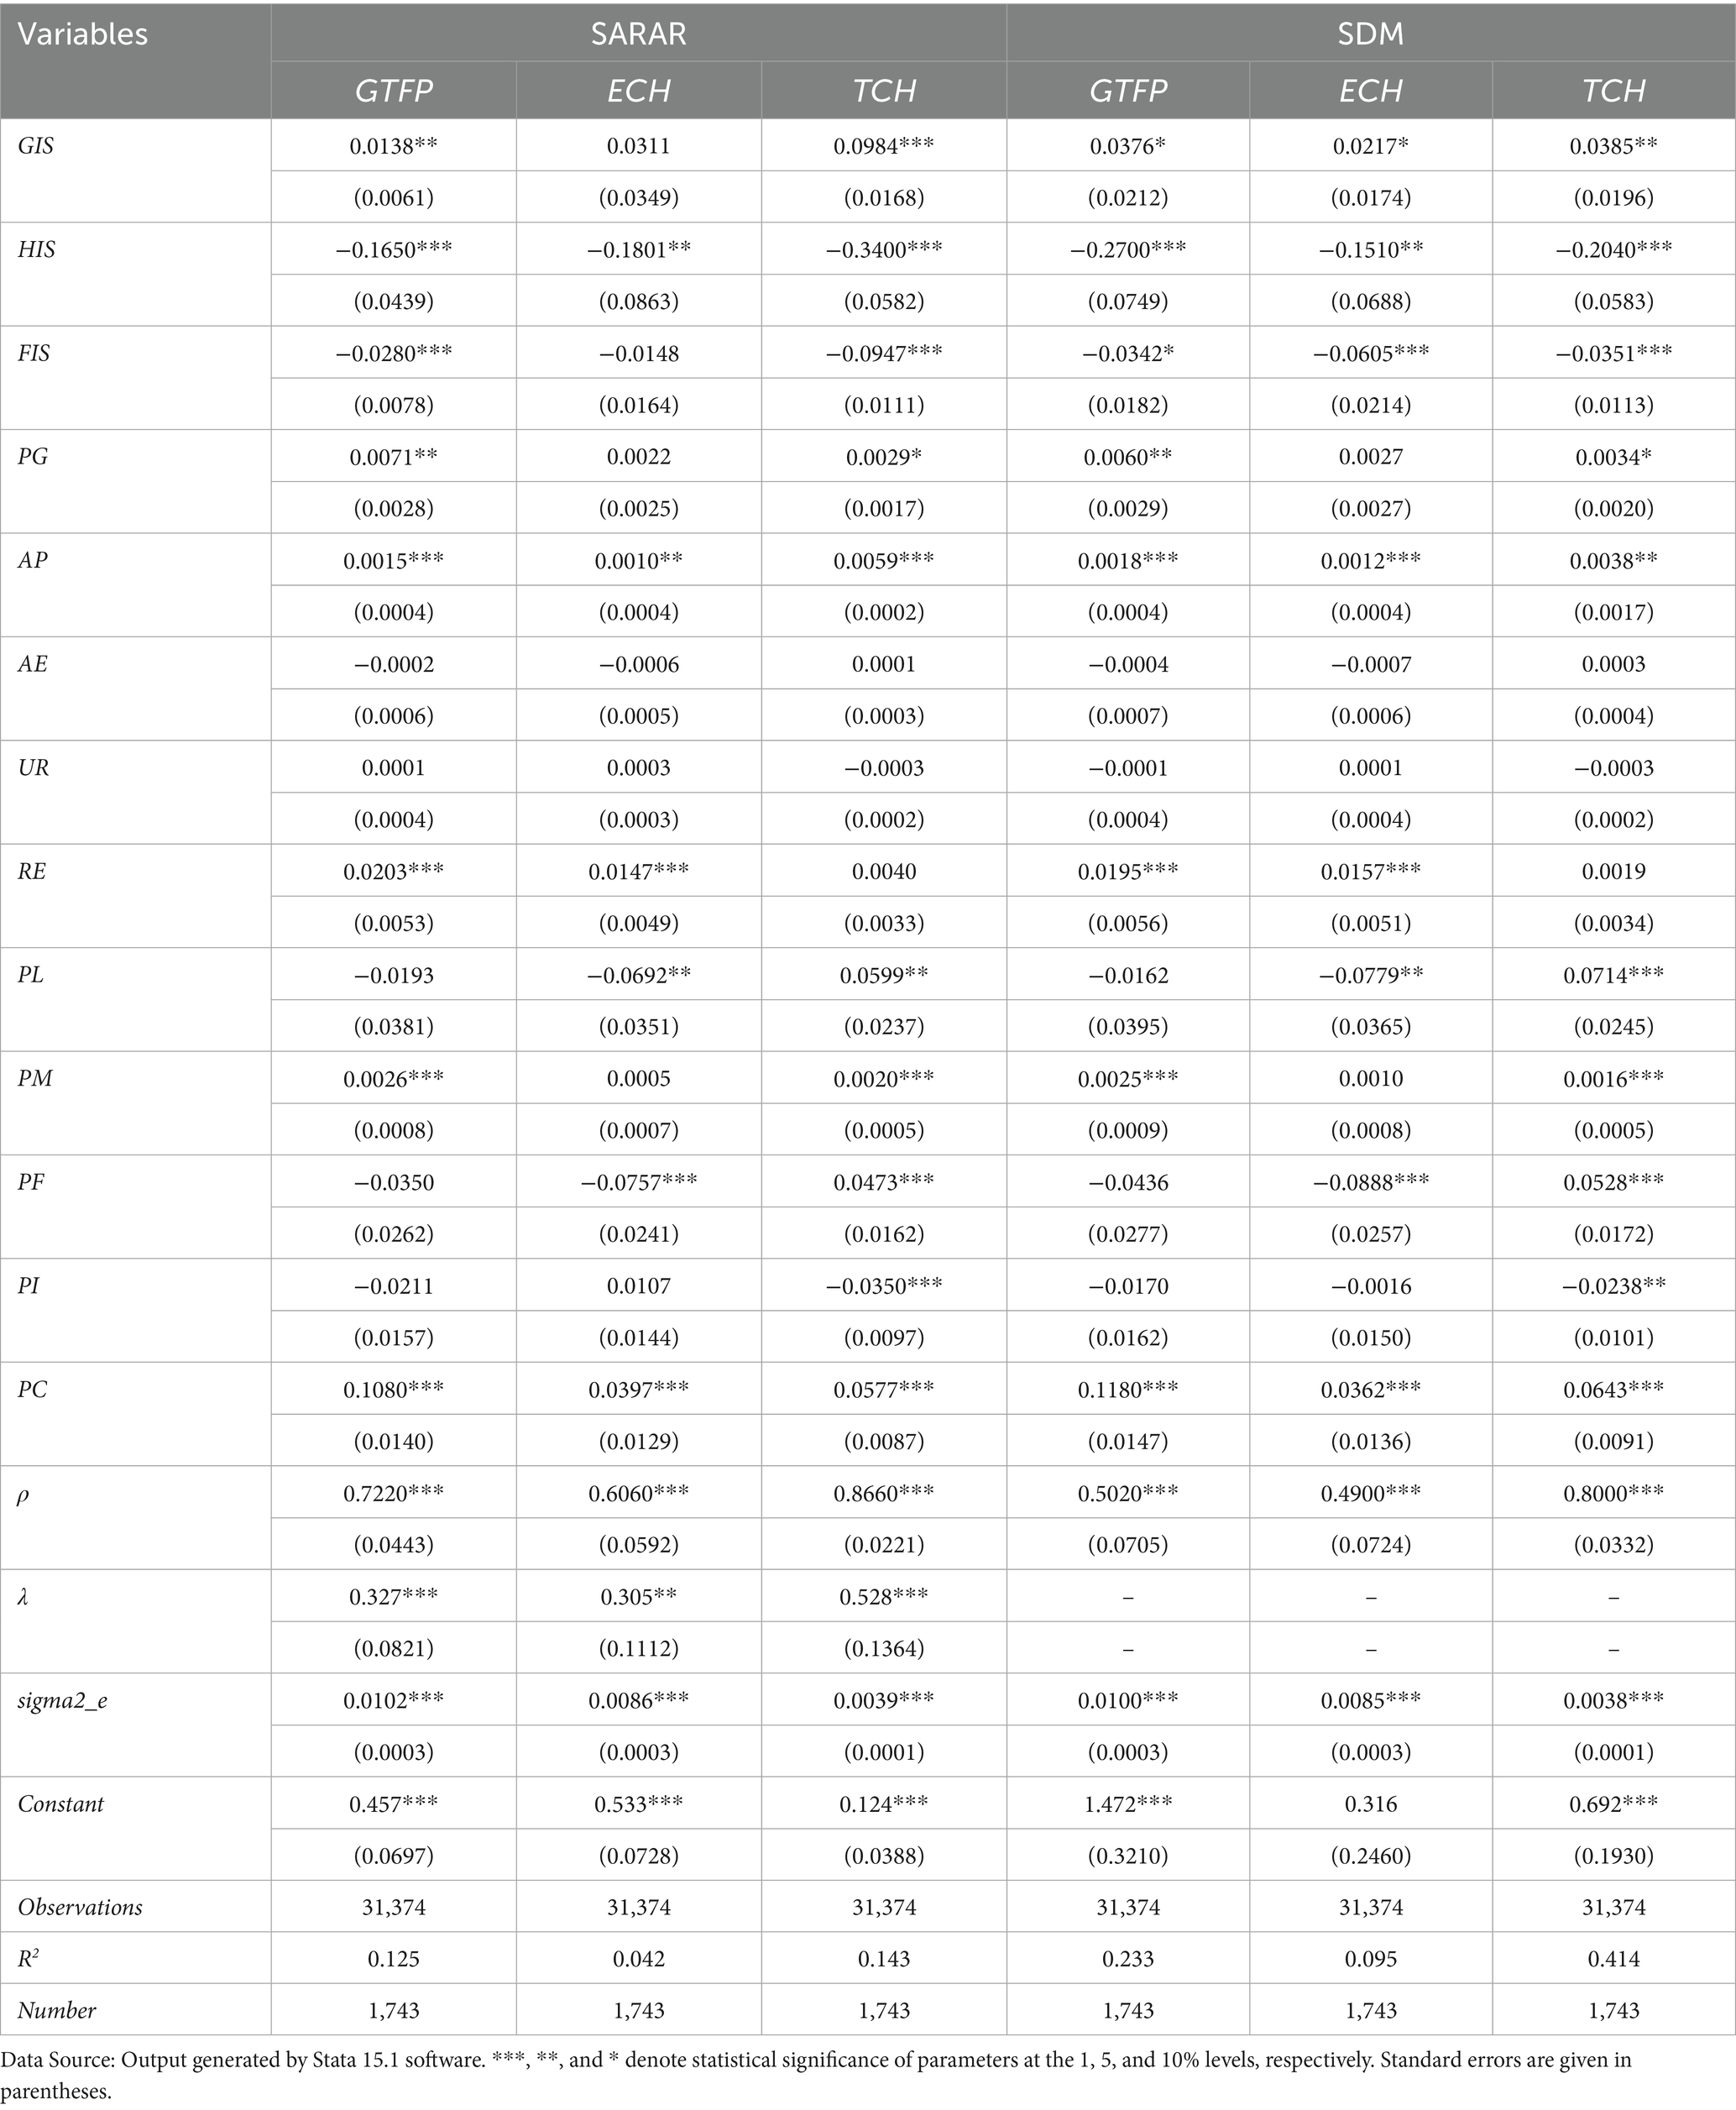
Table 7. Estimation of the spatial econometric model with replaced core explanatory variables.
Based on the spatial SARAR model analysis, the results demonstrate that the surrogate variable for agricultural structural upgrading has a significantly positive impact on agricultural GTFP. Conversely, the surrogate variables for agricultural structural rationalization and servitization have significantly negative effects on GTFP, with both passing the 1% significance level test. These findings are consistent with the estimation results of the benchmark model. Additionally, the estimated impacts of the three surrogate variables on technological progress and technological efficiency remain largely consistent with those of the benchmark model. Therefore, it can be concluded that the model’s results remain robust after replacing the core explanatory variables. The second robustness approach modifies the spatial weight matrix to evaluate whether the results are sensitive to alternative specifications of spatial dependence.
4.3.2 Modification of the spatial weight matrix
This study conducts robustness checks by substituting alternative forms of the spatial weight matrix to ensure the reliability of the results. Specifically, a spatial adjacency matrix is constructed based on the contiguity relationship between county-level units, where a value of 1 is assigned if two counties share a common border, and 0 otherwise. To ensure the robustness of the baseline results, estimations are conducted using both the spatial SARAR model and the spatial Durbin model (SDM). The estimation outcomes are reported in Table 8.
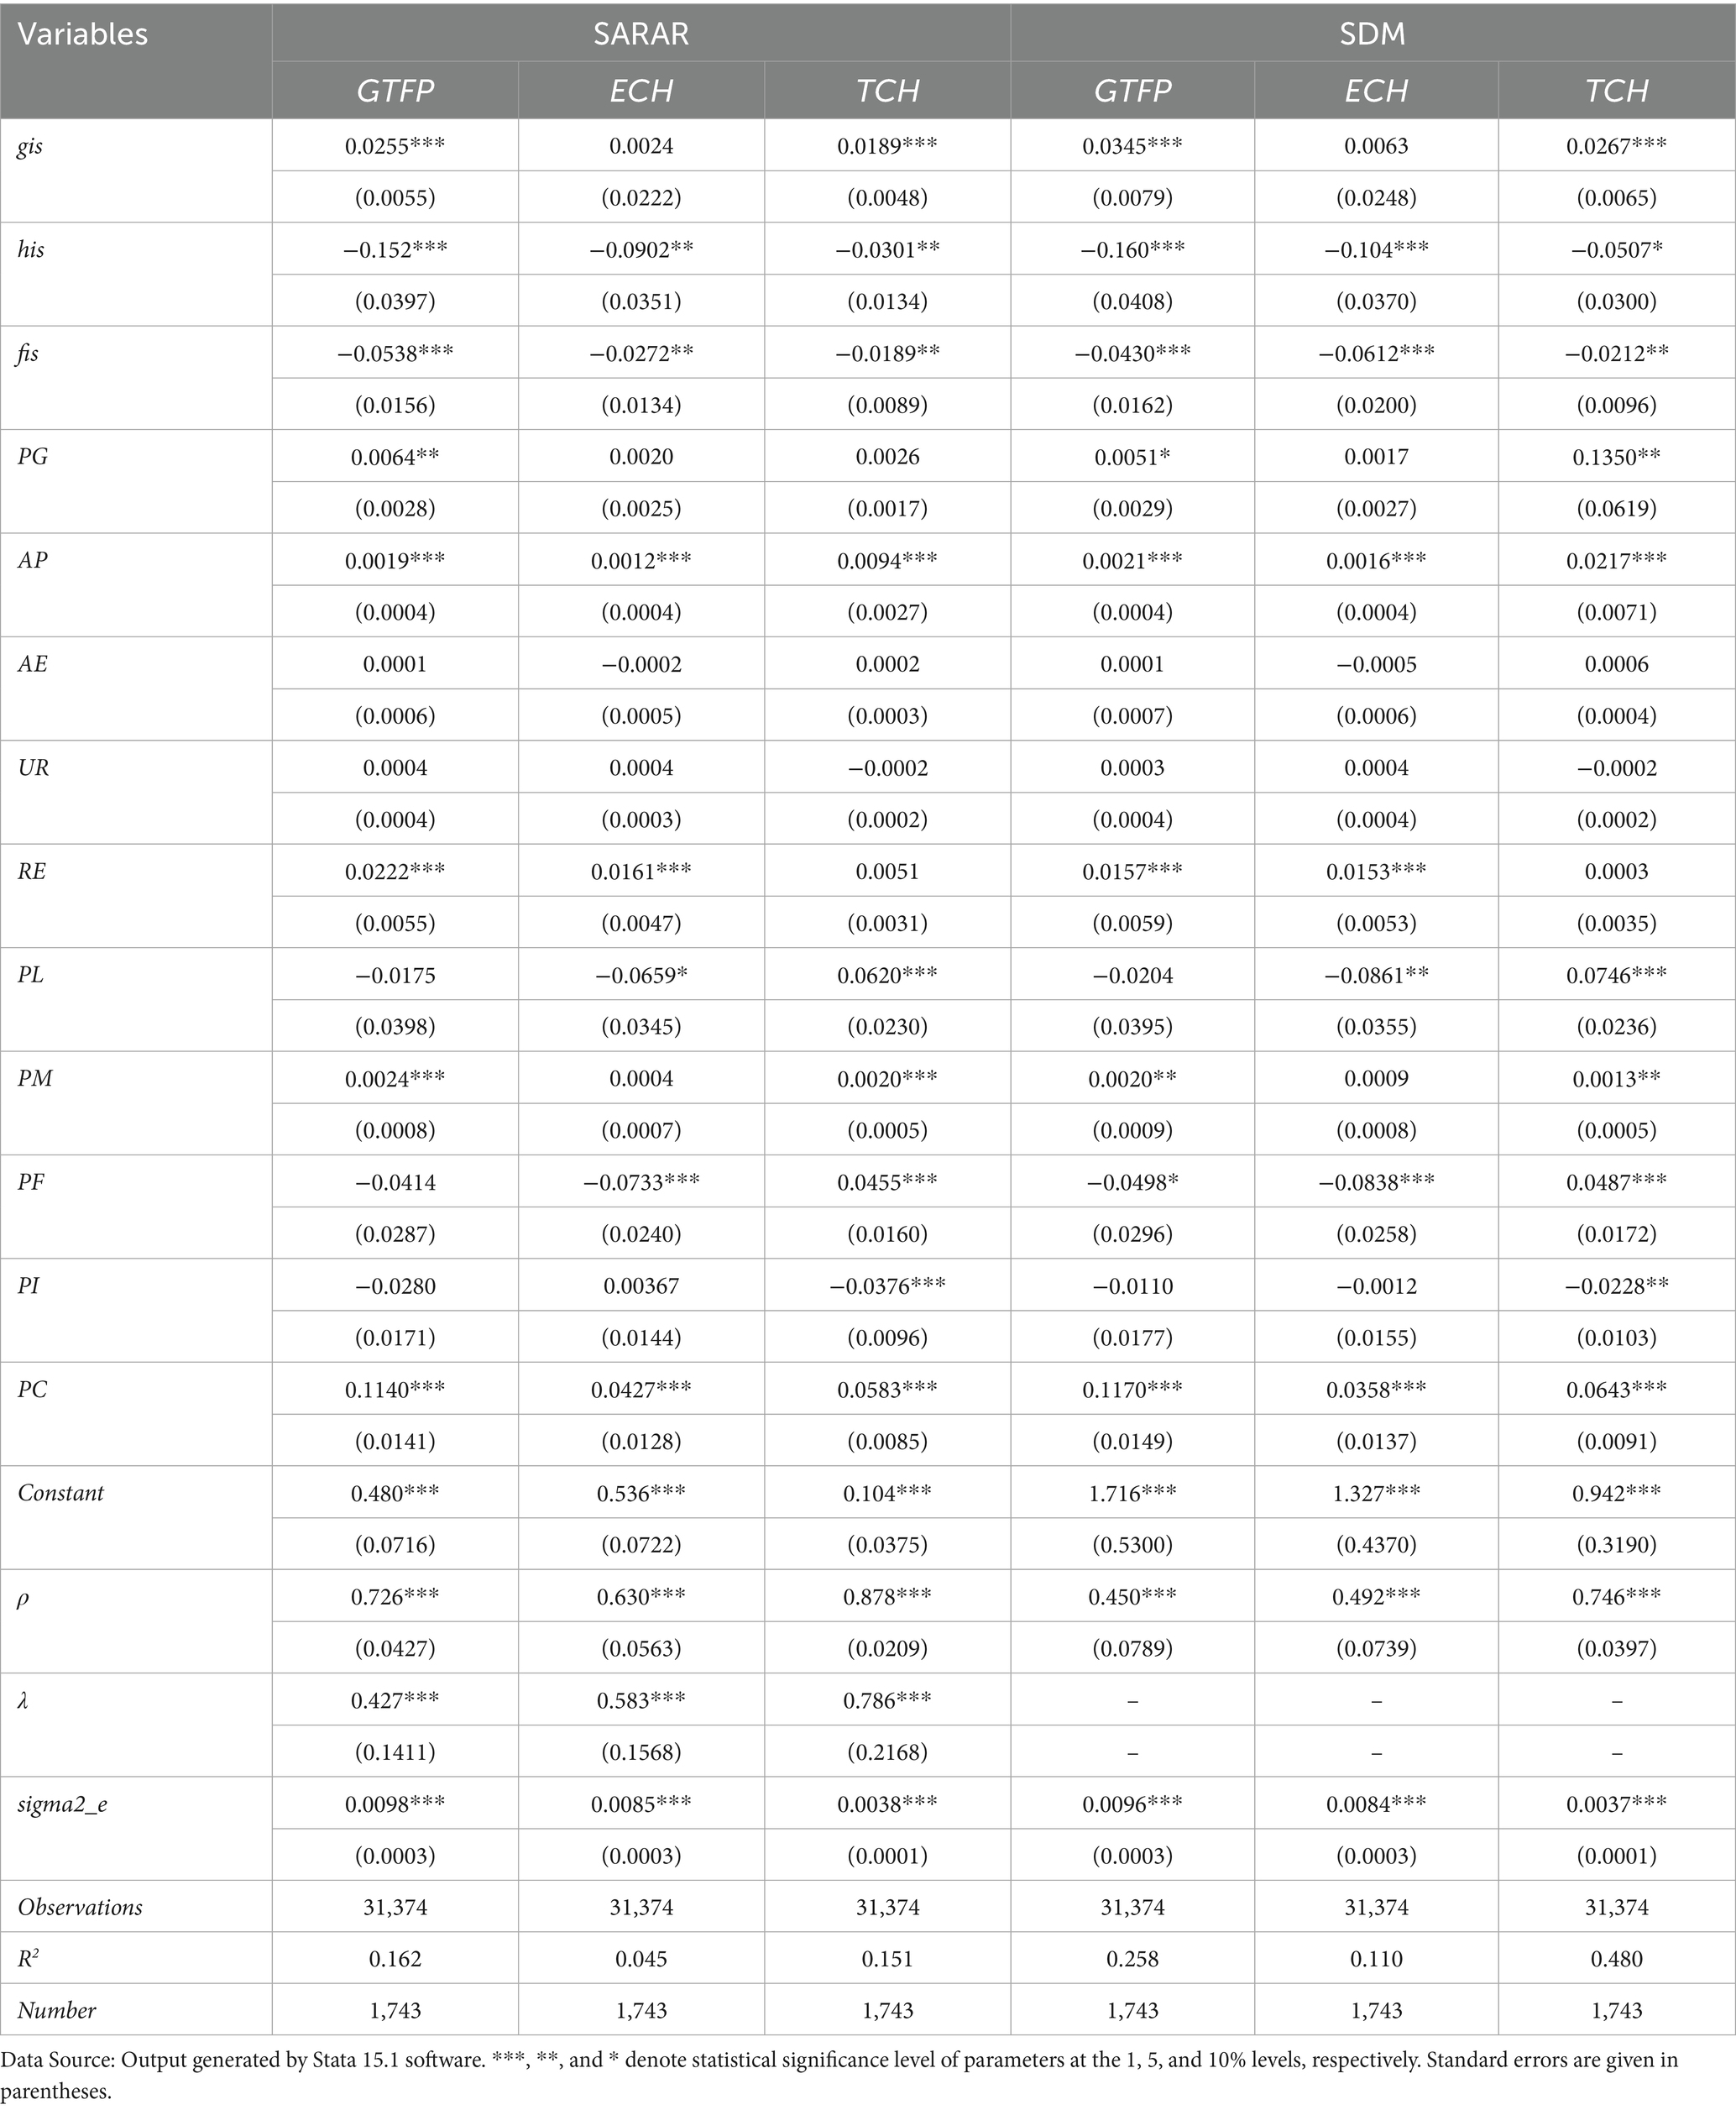
Table 8. Estimation of the model with modified spatial weight matrices.
The empirical results demonstrate that the advancement of agricultural structure exerts a significant positive effect on GTFP and technological progress, but does not significantly influence agricultural technical efficiency, findings which are consistent with the benchmark model. The rationalization of agricultural structure positively impacts GTFP, with all effects passing the 1% significance level test. It also has a positive influence on both agricultural technical efficiency and technological progress, aligning closely with the benchmark model. Conversely, the servitization of agricultural structure has a significant negative impact on GTFP, as well as on agricultural technical efficiency and technological progress, results that are largely in line with the benchmark model. Therefore, the estimation results remain robust after altering the spatial adjacency matrix, confirming the consistency with the benchmark model. With the robustness of the results confirmed, the analysis now turns to examining potential mechanisms and regional heterogeneity in the observed relationships.
5 Examination of the influence mechanism
5.1 Analysis of heterogeneity
Table 9 displays the estimation results for counties in the eastern, central, and western regions. The findings reveal that both the spatial error term coefficient (λ) and the spatial autoregressive term coefficient (ρ) are statistically significant, thereby corroborating the results of the Moran’s I test. This underscores the necessity of employing a spatial econometric model in this analysis. The subsequent section provides a comparative analysis across these regions.
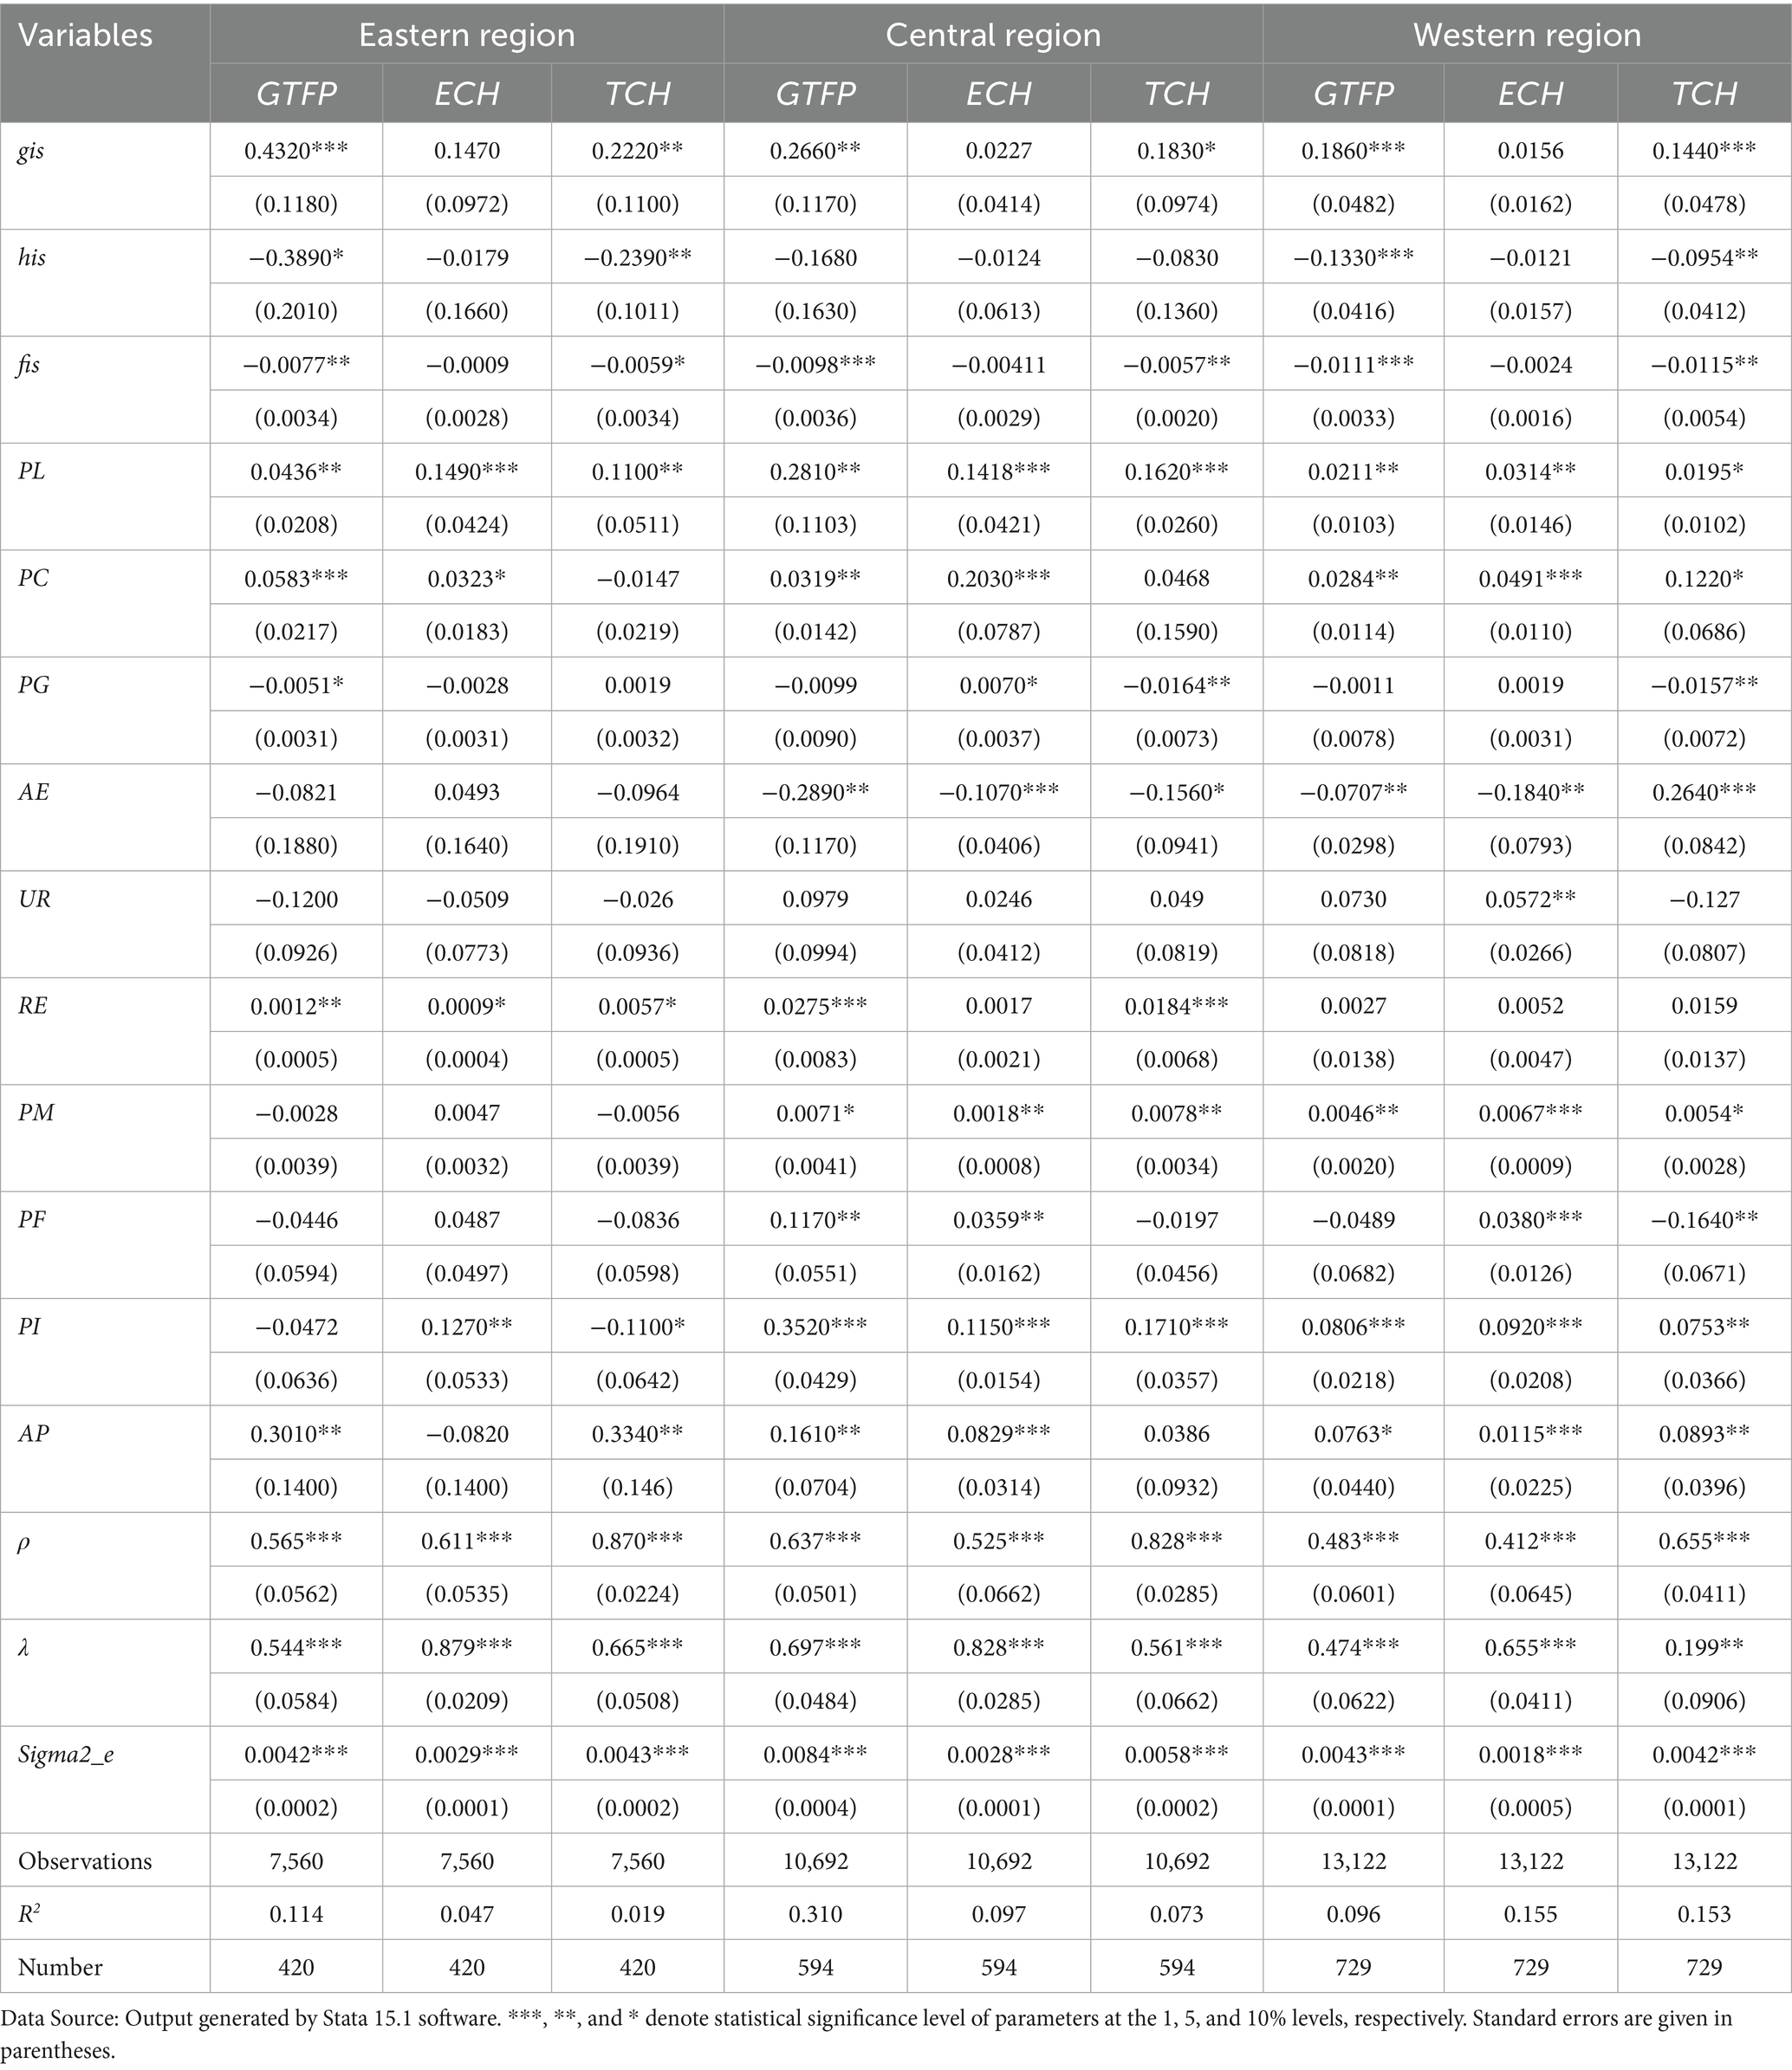
Table 9. Estimation of spatial econometric models across different regions.
This study first analyzes the impact of agricultural structure on green total factor productivity (GTFP) across different regions. The results show that the advancement of agricultural structure has a significantly positive effect on GTFP in counties located in the eastern, central, and western regions. However, the magnitude of this effect decreases progressively from east to west. This pattern may be explained by regional disparities in development: eastern counties have achieved higher levels of structural advancement earlier, allowing for more effective reallocation of resources and integration of modern technologies, thus producing a stronger impact on GTFP. In contrast, western counties remain in earlier stages of structural transformation, limiting the extent of productivity gains. The rationalization of the agricultural structure has a significantly negative impact on GTFP in both eastern and western counties, but shows no statistically significant effect in central counties. This implies that improvements in structural rationalization contribute positively to GTFP in the eastern and western regions, whereas in the central region, this relationship is less evident. The servitization of agricultural structure exerts a significantly negative effect on GTFP across all regions, with the strongest inhibitory effect observed in western counties. This finding suggests that an underdeveloped or poorly integrated service sector may currently hinder productivity improvements, particularly in less developed areas.
Second, the analysis examines the pathways through which agricultural structure affects GTFP. The results indicate that the advancement of agricultural structure significantly promotes technological progress in all three regions—eastern, central, and western—but does not have a statistically significant effect on technical efficiency. This suggests that GTFP improvements resulting from agricultural structural advancement are primarily achieved through innovation and technology adoption, rather than gains in resource use efficiency. In the case of structural rationalization, a significantly negative impact on technological progress is observed in the eastern and western regions, while its effect on technical efficiency is not statistically significant. These findings indicate that the influence of rationalization on GTFP in these regions operates mainly through the pathway of technological progress, with limited evidence supporting technical efficiency as a transmission channel.
Finally, the servitization of the agricultural structure is found to significantly inhibit technological progress in all three regions, while having no significant effect on technical efficiency. This suggests that the negative impact of servitization on GTFP stems predominantly from its dampening effect on technological progress, potentially due to inadequate development, insufficient scale, or poor integration of the agricultural service sector with core production activities.
These findings suggest region-specific considerations for policy design. In the eastern region, where structural advancement has already reached higher levels and significantly enhances GTFP, policies should focus on consolidating these gains through advanced digital technologies, precision farming, and sustainable intensification practices. For the central region, where structural rationalization shows limited effects, interventions should prioritize optimizing resource allocation and strengthening market-oriented reforms to unlock latent productivity potential. In contrast, the western region requires targeted efforts to overcome the underdevelopment of the agricultural service sector and accelerate structural transformation. Investments in basic digital infrastructure, coupled with initiatives to scale up agricultural service provision and improve connectivity between counties, could help mitigate the strong inhibitory effect of servitization and create conditions for a shift toward positive productivity impacts. Building on the heterogeneity analysis, the next step examines the mediation pathways through which agricultural structure adjustment influences GTFP via digitalization.
5.2 Analysis of mediation effects
Table 10 presents the estimation results of the mediation effect model. All regression coefficients, including the constant term, are statistically significant at the 1% level, indicating strong explanatory power of the included variables. The R2 value further confirms that the model accounts for a substantial proportion of the variation in the dependent variable, suggesting a satisfactory overall fit. Based on these initial results, a stepwise regression analysis is conducted to further investigate and interpret the mediation pathways underlying the relationship between agricultural structure adjustment, digitalization, and green total factor productivity (GTFP).
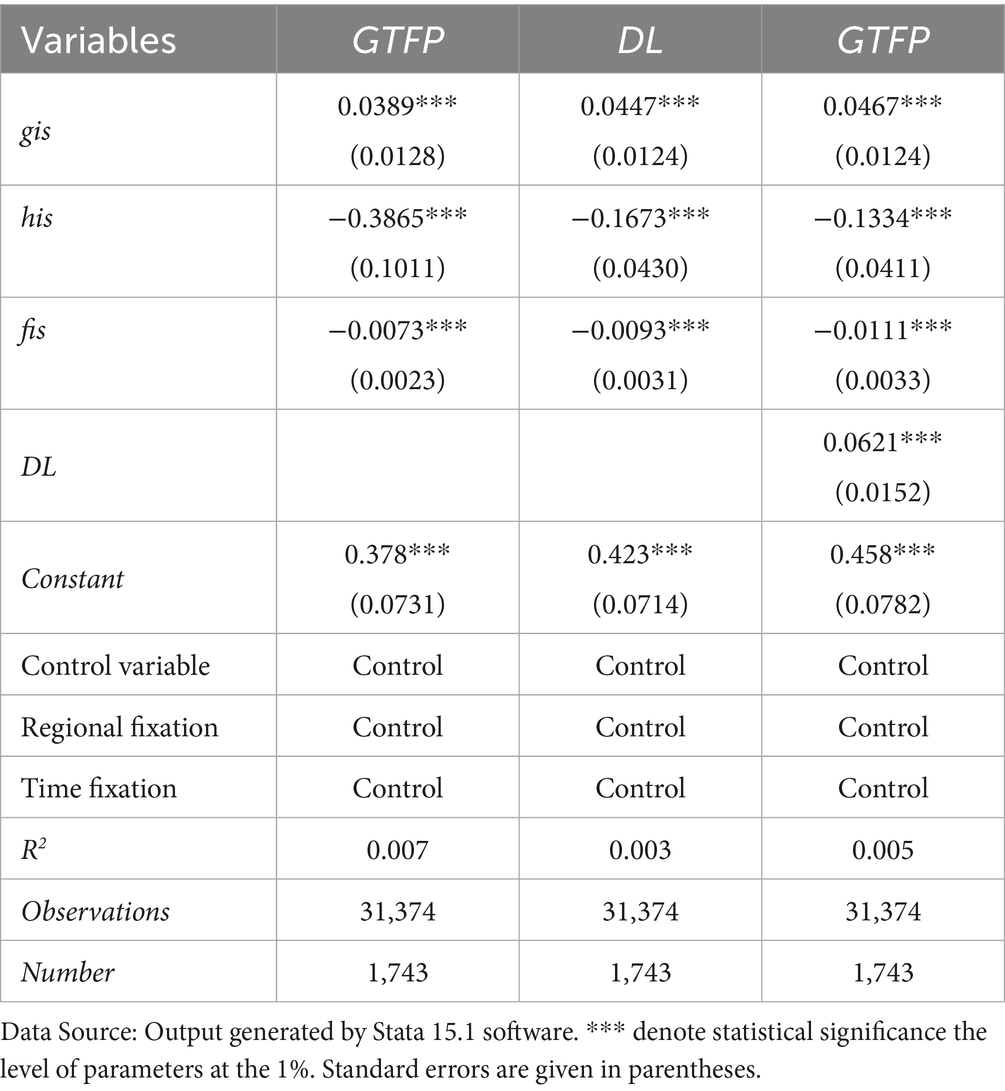
Table 10. Estimation of the mediation effect model.
The results demonstrate that the three core explanatory variables of agricultural structure—namely, structural advancement, rationalization, and service index—all influence agricultural GTFP through the mediating variable of DL. In the first stage, the model in Column 1 presents the baseline results without incorporating the mediating variable. The findings indicate that structural advancement has a significantly positive effect on GTFP, while rationalization and service index have significantly negative effects, consistent with the benchmark model. In the second stage, the model in Column 2 incorporates the mediating variable DL, revealing that structural advancement, rationalization, and service index all have significant impacts on agricultural digitalization, with all effects passing the 1% significance level test. Finally, in the third stage, the model in Column 3 shows that both the core explanatory variables and the mediating variable DL remain significant at the 1% level, confirming that structural advancement, rationalization, and service level influence GTFP through the intermediary mechanism of digitalization. This supports the hypothesis H2 that digitalization level plays a significant mediating role.
6 Conclusion and policy implications
This study investigates how agricultural structural adjustments—encompassing advancement, rationalization, and servitization—shape green total factor productivity (GTFP) across 1,743 Chinese counties from 2003 to 2022, while integrating digitalization as a mediating mechanism. By moving beyond national or provincial scales, the analysis provides fine-grained, county-level evidence that captures spatial heterogeneity, non-linear effects, and inter-regional spillovers often overlooked in prior research. The findings reveal three core insights that advance existing knowledge. First, structural advancement and rationalization consistently enhance GTFP, confirming the “structural dividend” hypothesis in the agricultural context. Second, the relationship between servitization and GTFP follows a U-shaped pattern, with productivity benefits materializing only after surpassing a development threshold—offering new empirical evidence on the nuanced role of service-oriented agriculture. Third, digitalization significantly amplifies the productivity gains from structural transformation, underscoring its role as a critical enabler of sustainable intensification.
These contributions extend the literature by clarifying the mechanisms and conditions under which structural adjustments yield sustainable productivity growth, and by empirically demonstrating the mediating role of digital infrastructure in agriculture. In the broader context of sustainable agriculture, the results highlight that structural transformation, when coupled with digital innovations, can balance productivity enhancement with ecological stewardship. This alignment is essential for achieving both food security and environmental goals.
Policy-wise, the findings call for differentiated regional strategies. In the eastern region, where structural advancement is more mature, efforts should focus on consolidating gains through precision agriculture, smart farming, and eco-friendly intensification. The central region would benefit from targeted measures to improve resource allocation efficiency and market integration, while the western region requires investment in digital and service infrastructure to overcome the current productivity-inhibiting stage of servitization. More broadly, policies should promote integrated planning of structural reforms and digital transformation to maximize “structural dividends” and foster long-term resilience in agricultural systems.
While this study fills key empirical and conceptual gaps, limitations remain—particularly the reliance on proxy measures for digitalization and the exclusion of institutional and behavioral dimensions. Future research should employ richer, multidimensional datasets, extend the analysis to cross-country comparisons, and explore causal pathways using mixed methods. By addressing these gaps and offering spatially sensitive policy guidance, this work strengthens the evidence base for designing agricultural strategies that are economically viable, environmentally sound, and technologically forward-looking.
Data availability statement
The raw data supporting the conclusions of this article will be made available by the authors without undue reservation.
Author contributions
ML: Formal analysis, Methodology, Software, Writing – review & editing. FF: Methodology, Writing – review & editing, Data curation, Validation, Visualization. UN: Resources, Writing – original draft. ZK: Resources, Writing – original draft, Conceptualization, Validation.
Funding
The author(s) declare that financial support was received for the research and/or publication of this article. The study is financially supported by the National Social Science Foundation Project (24BJY171).
Conflict of interest
The authors declare that the research was conducted in the absence of any commercial or financial relationships that could be construed as a potential conflict of interest.
Generative AI statement
The authors declare that no Gen AI was used in the creation of this manuscript.
Any alternative text (alt text) provided alongside figures in this article has been generated by Frontiers with the support of artificial intelligence and reasonable efforts have been made to ensure accuracy, including review by the authors wherever possible. If you identify any issues, please contact us.
Publisher’s note
All claims expressed in this article are solely those of the authors and do not necessarily represent those of their affiliated organizations, or those of the publisher, the editors and the reviewers. Any product that may be evaluated in this article, or claim that may be made by its manufacturer, is not guaranteed or endorsed by the publisher.
References
Cai, X., Xiang, H., and Akbari, F. (2025). Integrated sustainability perspective to interconnect circular economy, environmental development, and social status: designation of sustainable development spillovers. Socio Econ. Plan. Sci. 101:102253. doi: 10.1016/j.seps.2025.102253
Dong, X., and Yu, M. (2024). Green bond issuance and green innovation: evidence from China's energy industry. Int. Rev. Financ. Anal. 94:103281. doi: 10.1016/j.irfa.2024.103281
Duan, W., and Li, C. (2023). Be alert to dangers: collapse and avoidance strategies of platform ecosystems. J. Bus. Res. 162:113869. doi: 10.1016/j.jbusres.2023.113869
He, X. Y., and Shen, K. R. (2018). Modernized economic system, total factor productivity, and high-quality development. Shanghai Econ. Res. 6, 25–34.
Jia, J. Q., and Yin, L. S. (2015). Research on the spatial effects of fiscal expenditure on industrial structure upgrading. J. Financ. Econ. 41, 18–28.
Jiang, C., Wang, Y., Yang, Z., and Zhao, Y. (2023). Do adaptive policy adjustments deliver ecosystem-agriculture-economy co-benefits in land degradation neutrality efforts? Evidence from southeast coast of China. Environ. Monit. Assess. 195:1215. doi: 10.1007/s10661-023-11821-6
Li, Y., Li, G., Xu, A., and Yao, F. (2025). Research on the collaborative mechanism of a data trading market based on a four-party evolutionary game in the context of digital intelligence. Socio Econ. Plan. Sci. 100:102238. doi: 10.1016/j.seps.2025.102238
Liu, Q., Wu, T. Y., Tu, W., and Pu, L. (2023). Analysis on the changes of fertilization intensity and efficiency in China's grain production from 1980 to 2019. J. Sci. Food Agric. 103, 908–916. doi: 10.1002/jsfa.12202
Liu, W., and Zhang, H. (2008). Industrial structure changes and technological progress in China's economic growth. Econ. Res. J. 43, 4–15. doi: 10.3969/j.issn.1009-2781.2014.05.009
Qin, T., Peng, J., and Deng, Z. B. (2017). Development of productive service industry and growth of agricultural total factor productivity. Modern Econ. Res. 12, 93–101. doi: 10.13891/j.cnki.mer.2017.12.012
Sheng, F. (2014). Agglomeration of productive service industries and manufacturing upgrading: mechanism and experience - a spatial econometric analysis based on data from 230 cities. Ind. Econ. Res. 2, 32–39. doi: 10.13269/j.cnki.ier.2014.02.004
Song, J., and Zheng, J. H. (2017). Industrial structure, economic growth, and service cost disease: empirical evidence from China. Ind. Econ. Res. 2, 1–13. doi: 10.13269/j.cnki.ier.2017.02.001
Sulieman, H. M. (2024). Agricultural land use change and its drivers in the Sudanese Ethiopian borderland: the case of Al-Fashaga region. Geol. Ecol. Landscapes, 1–11. doi: 10.1080/24749508.2024.2430038
Sun, X. T., Wang, Z. H., and Zhang, G. S. (2017). Does structural dividend exist in the enhancement of county-level total factor productivity? A panel data analysis based on 1869 counties in China. J. South-Central Univ. Finance Econ. 6, 73–82. doi: 10.3969/j.issn.1003-5230.2017.06.008
Wang, Z. H., Sun, X. T., Li, M. M., and Jiang, J. Q. (2019). High-quality development of county-level economy in China: a structural dividend perspective. Soft Sci. 33, 68–72.
Xu, A., Dai, Y., Hu, Z., and Qiu, K. (2025). Can green finance policy promote inclusive green growth?-based on the quasi-natural experiment of China's green finance reform and innovation pilot zone. Int. Rev. Econ. Finance 100:104090. doi: 10.1016/j.iref.2025.104090
Yang, X., Chen, J., Li, D., and Li, R. (2024). Functional-coefficient quantile regression for panel data with latent group structure. J. Bus. Econ. Stat. 42, 1026–1040. doi: 10.1080/07350015.2023.2277172
Yin, Z. J., Li, G. C., and Ge, J. F. (2016). Food security: climate change and agricultural productivity growth - an empirical analysis based on HP filtering and sequential DEA method. Resour Sci 38, 665–675.
Yu, B. B. (2015). The economic growth effects of industrial structure adjustment and productivity enhancement: an analysis based on dynamic spatial panel data of Chinese cities. China Ind. Econ. 12, 83–98. doi: 10.19581/j.cnki.ciejournal.2015.12.007
Yu, Y. Z., Liu, R., and Yang, X. Z. (2016). Research on the impact of industrial structure upgrading on total factor productivity in China. J. Ind. Econ. Trade 7, 45–58.
Zhang, H. R. (2012). Geographical distance, agglomeration externalities, and labor productivity: a spatial panel econometric analysis based on urban data. South. Econ. J. 2, 15–26. doi: 10.14007/j.cnki.cjpl.2016.04.004
Keywords: green total factor productivity, agricultural structural adjustment, sustainable food systems, digital agriculture, spatial spillover effects
Citation: Li M, Feng F, Nisar U and Khalid Z (2025) Advancing sustainable agricultural productivity through structural adjustment and digitalization in China. Front. Sustain. Food Syst. 9:1639062. doi: 10.3389/fsufs.2025.1639062
Edited by:
Muhammad Asad Ur Rehman Naseer, Bahauddin Zakariya University, PakistanReviewed by:
Irfan Ullah, Nanjing University of Information Science and Technology, ChinaMaratab Ali, University of Management and Technology, Pakistan
Copyright © 2025 Li, Feng, Nisar and Khalid. This is an open-access article distributed under the terms of the Creative Commons Attribution License (CC BY). The use, distribution or reproduction in other forums is permitted, provided the original author(s) and the copyright owner(s) are credited and that the original publication in this journal is cited, in accordance with accepted academic practice. No use, distribution or reproduction is permitted which does not comply with these terms.
*Correspondence: Fengcun Feng, ZmVuZ2ZjMjAyNEAxNjMuY29t; Ubair Nisar, dWJhaXIubmlzYXJAZ21haWwuY29t; Zainab Khalid, emFpbmFia2hhbGlkQHNldS5lZHUuY24=
†These authors have contributed equally to this work