 Ghada A. Khdery
 Mohamed S. Shokr
 Nazih Y. Rebouh
 Mohammed Hewidy
- 1National Authority for Remote Sensing and Space Sciences, Cairo, Egypt
- 2Soil and Water Department, Faculty of Agriculture, Tanta University, Tanta, Egypt
- 3Department of Environmental Management, Institute of Environmental Engineering, RUDN University, Moscow, Russia
- 4Horticulture Department, Faculty of Agriculture, Ain Shams University, Cairo, Egypt
Introduction: Hyperspectral remote sensing provides a powerful platform for identifying plant species with pharmacological relevance by capturing subtle variations in pigment content, physiological traits, and leaf structure.
Methods: This study employed spectral indices to evaluate and differentiate 10 Ficus and two Moringa spp. based on their reflectance characteristics and morphological features. Spectral data were collected using an ASD FieldSpec spectroradiometer, and vegetation indices such as NDVI, SR, PRI, ARI2, NDRE, and MCARI were calculated to infer photosynthetic performance and secondary metabolite potential. Descriptive morphological traits were recorded to aid in species-level discrimination.
Results and Discussion: Statistical analyses, including one-way ANOVA and Linear Discriminant Analysis (LDA), identified specific bands in the NIR and SWIR II regions as particularly effective for distinguishing among the studied taxa. Notably, Ficus benghalensis, Ficus racemosa, and Moringa oleifera exhibited superior spectral profiles, reflecting high pigment density and physiological vigor, which correspond with their well-documented pharmacological roles. Conversely, species like F. religiosa and M. peregrina showed relatively subdued spectral signatures. Statistical analyses (ANOVA and LDA) confirmed the discriminatory power of NIR and SWIR II regions across species. Morphological traits provided taxonomic support but were less distinctive than spectral indices. These findings demonstrate the value of hyperspectral indices as rapid, non-destructive tools to identify and prioritize medicinally potent species within Ficus and Moringa spp., offering insights for pharmacognosy, conservation, and phytochemical prospecting. Moreover, by enabling efficient identification of underutilized species with confirmed medical value, this approach may support efforts to sustainably manage native plant resources, particularly in regions where such species contribute to traditional healthcare systems, nutritional supplementation, and the resilience of local livelihoods.
1 Introduction
Botanical gardens play an increasingly important role in supporting the Sustainable Development Goals by linking plant diversity with broader themes of sustainability across terrestrial ecosystems (Smith et al., 2018). Orman Botanical Garden, established in 1875, is among the most prominent and historically significant botanical gardens in Egypt, covering an area of approximately 11.76 hectares (Diwan et al., 2004). Due to its ecological characteristics and social functions, it is also considered an urban forest. Urban forests, as noted by Nowak and Dwyer (Nowak and Dwyer, 2007), contribute to biodiversity conservation, provide recreational and social spaces, improve air quality, and enhance the visual appeal of urban settings. Among the six botanical gardens assessed in Egypt, Orman Garden demonstrated the highest levels of species richness and diversity (Hamdy et al., 2007). Detailed knowledge of the composition and structural characteristics of tree species in such gardens provides essential insights for biodiversity conservation. Understanding these ecological aspects is crucial for evaluating the long-term sustainability of conservation efforts and informing the management of urban forest ecosystems (Kacholi, 2014).
Secondary metabolites are a diverse group of bioactive organic compounds produced by plants that are not directly involved in primary metabolic processes such as growth and reproduction. Instead, they play crucial ecological and physiological roles, including defense against herbivores and pathogens, attraction of pollinators, and adaptation to abiotic stresses (Yang et al., 2018; Isah, 2019). These metabolites include alkaloids, flavonoids, terpenoids, phenolics, tannins, and glycosides, many of which are well-documented for their pharmacological relevance. Several of these compounds exhibit strong antioxidant, antimicrobial, anti-inflammatory, anticancer, and hepatoprotective activities, making them of significant interest in pharmaceutical and nutraceutical research (Akula and Ravishankar, 2011; Isah, 2019). Understanding the diversity and physiological basis of these compounds is therefore essential for identifying and prioritizing medicinally important plants, especially when applying non-destructive techniques such as hyperspectral remote sensing to screen for bioactive potential.
About 800 species of woody plants, including trees, shrubs, and vines, that are members of the Moraceae family, are found in the genus Ficus. About 100 of these species are native to Africa and the adjacent islands, and they are spread throughout different tropical ecosystems (Aweke, 1979). Multipurpose plants like ficus are commonly employed in rural development (Mohamed et al., 2018; Sandhu et al., 2023). They can provide food, fuel, timber, medication, and raw materials for some chemical companies. Additionally, they are visually pleasing enough to be employed as ornamental plants, with each species designated for its appropriate role in the landscape, such as screen, structure, group, specimen, avenue, shelter, shade, and hedge (Brickell, 2019). There are about 800 species of woody plants in the genus Ficus, including trees, shrubs, and vines, pertaining to the family Moraceae. About 100 species are native to Africa and neighboring islands, and the rest are spread throughout other tropical ecosystems. During the reign of Mohamed Ali Pasha, numerous Ficus spp. were introduced to Egyptian territory (Hamdy et al., 2007). They were positioned next to palaces, water canals, and the Nile River. They are extensively used for adornment in gardens, roadways, and indoor spaces for some species that have adapted well to Egyptian conditions.
Ficus spp., including F. religiosa, F. racemosa, and F. benghalensis, are essential in a lot of traditional and Ayurvedic medicine formulas. These species are recognized for their carminative, astringent, anti-inflammatory, antioxidant, and anticancer properties. Their bark, leaves, fruits, and latex are also thought to be very effective in treating a variety of organic molecules produced via metabolic pathways. These organic molecules are classified into primary metabolites (Joseph and Raj, 2010; Rasool et al., 2023).
The family Moringaceae comprises fast-growing, drought-tolerant flowering plants that have been highly valued since ancient times by civilizations such as the Egyptians, Greeks, and Romans for their nutritional and medicinal benefits. Within this family, Moringa stands as the sole genus, encompassing approximately 33 species, with four species widely recognized: M. oleifera, M. ovalifolia, M. peregrina, and M. stenopetala (Mabberley, 1987). These species predominantly thrive in semi-arid, tropical, and subtropical regions, including the Horn of Africa, Madagascar, southwestern parts of Africa, tropical Asia, and extending westward into Egypt. They are found across nearly all phytogeographical zones, as reported by National Research Council et al. (1996) and Mridha (2015).
Moringa spp. play a significant medico-socioeconomic role, functioning as natural bioreactors that generate a variety of organic molecules through metabolic pathways. These metabolites are classified into primary metabolites—such as proteins, carbohydrates, and lipids—and secondary metabolites, including alkaloids, carotenoids, moringine, moringinine, phytoestrogens, caffeoylquinic acids, tannins, phytosterols, terpenoids, glycosides, flavonoids, and phenolic compounds (Anwar et al., 2007).
Hyperspectral remote sensing technology is an essential instrument that allows the collection of detailed data over a wide range of electromagnetic frequencies. The goal of the work under evaluation is to uncover small differences between Ficus species based on their spectral characteristics by utilizing hyperspectral remote sensing. Simultaneously, this study examines these species’ morphological characteristics, which are crucial elements that impact their methods of adaptation and interactions with their environments (Wang et al., 2023).
Plant species’ physiology, morphology, and anatomical structure are among the elements that influence their spectral properties (Kycko et al., 2014; Jarocińska et al., 2016). The visible-infrared (VNIR) and shortwave infrared (SWIR) spectral profiles of leaves show differences that are linked to pigments such as carotenoids and chlorophyll as well as water content and dry matter content (Feret et al., 2008). Even closely related species differ in the reflectance characteristics of their vegetation due to differences in pigment and water content, as well as structural changes in their canopies and leaves. Accordingly, species identification is made easier by the uniqueness of these spectral characteristics (Thenkabail et al., 2000). Monitoring changes in ecosystems depends heavily on how plants interact with the electromagnetic spectrum through absorption, transmission, and reflection.
The spectral reflectance of plant tissues is largely governed by biochemical and structural components, particularly pigments such as chlorophylls, carotenoids, and anthocyanins. These pigments are often involved in the biosynthesis of secondary metabolites, which play a central role in plant defence, stress response, and pharmacological potential (Gitelson et al., 2001; Isah, 2019). Reflectance in specific spectral regions—especially the visible, red-edge, and NIR—can therefore serve as an indirect indicator of the physiological state and biochemical richness of plants, making hyperspectral indices a useful tool in medicinal plant screening (Sims and Gamon, 2002; Colovic et al., 2022).
The similarity in reflectance patterns in the visible region among species likely reflects shared chlorophyll absorption at approximately 650 nm (red) and in the blue range. In contrast, variation in NIR and SWIR may reflect differences in leaf structure, water content, or physiological status. The distinctive spectral behavior of species such as F. microcarpa and F. benghalensis demonstrates the strength of hyperspectral indices in species-level discrimination.
Remote sensing, particularly hyperspectral sensing, captures the reflectance of electromagnetic radiation from plant surfaces, which is strongly influenced by morphological and physiological characteristics of vegetation. Leaf pigments such as chlorophylls and carotenoids absorb light in the blue and red regions, while cellular structure and internal water content affect reflectance in the near-infrared (NIR) and shortwave infrared (SWIR) regions (Ustin et al., 2004; Clevers et al., 2011). Variations in leaf thickness, surface texture, and internal mesophyll structure produce distinct spectral signatures that can be used to assess plant health, species identity, and biochemical composition (Asner and Martin, 2008; Homolová et al., 2013). Thus, remote sensing provides a non-destructive, rapid method to evaluate vegetation traits related to both structure and function.
In order to evaluate vegetation health, classify land cover, examine phenology, identify changes in climate and land use, and track drought conditions, vegetation indices were developed (Padilla et al., 2011). In remote sensing, different vegetation indices have been developed. The Normalized Difference Vegetation Index (NDVI) is a prominent and widely used index in international environmental and climatic change research (Bhandari et al., 2012). The ratio difference between the recorded vegetation reflectance values in the red and near-infrared bands is what gives rise to the NDVI.
Given the medicinal importance of Ficus spp. and Moringa spp. and the potential of hyperspectral techniques in plant characterization, this study aims to explore how spectral indices can support species discrimination and health assessment. Additionally, the study aims to enhance taxonomic understanding of selected Ficus spp. and Moringa spp. by combining detailed morphological observations with hyperspectral reflectance measurements. It explores the extent to which spectral profiles correspond with observable physical traits across the studied taxa and assesses their relevance to species differentiation. The analysis focuses on identifying distinct spectral signatures and informative wavelength regions that contribute to species discrimination. Moreover, by linking spectral indices to physiological parameters, the study examines the potential of hyperspectral data as a proxy for evaluating plant health and inferring medicinal relevance. This integrated approach supports the non-destructive classification and prioritization of medicinally important plant species.
2 Materials and methods
To achieve the outlined objectives, a multi-step methodology was adopted combining field-based morphological measurements with hyperspectral reflectance analysis.
2.1 Study area
The study was conducted at Orman Garden, Giza, Egypt, which houses a wide diversity of tropical and subtropical plant species. The study area encompasses a total surface of approximately 11.09 hectares and is geographically positioned at 30°01′45.12″N and 31°12′47.16″E (Figure 1). The region experiences an arid climate, characterized by minimal annual rainfall averaging around 1.2 mm. The hot season extends from April to October, while a brief, mild wet season occurs between November and March. July is typically the hottest month, whereas January is the coldest. The average annual maximum and minimum temperatures are 27.0 °C and 15.0 °C, respectively. The soil in the study area is predominantly clay in texture.
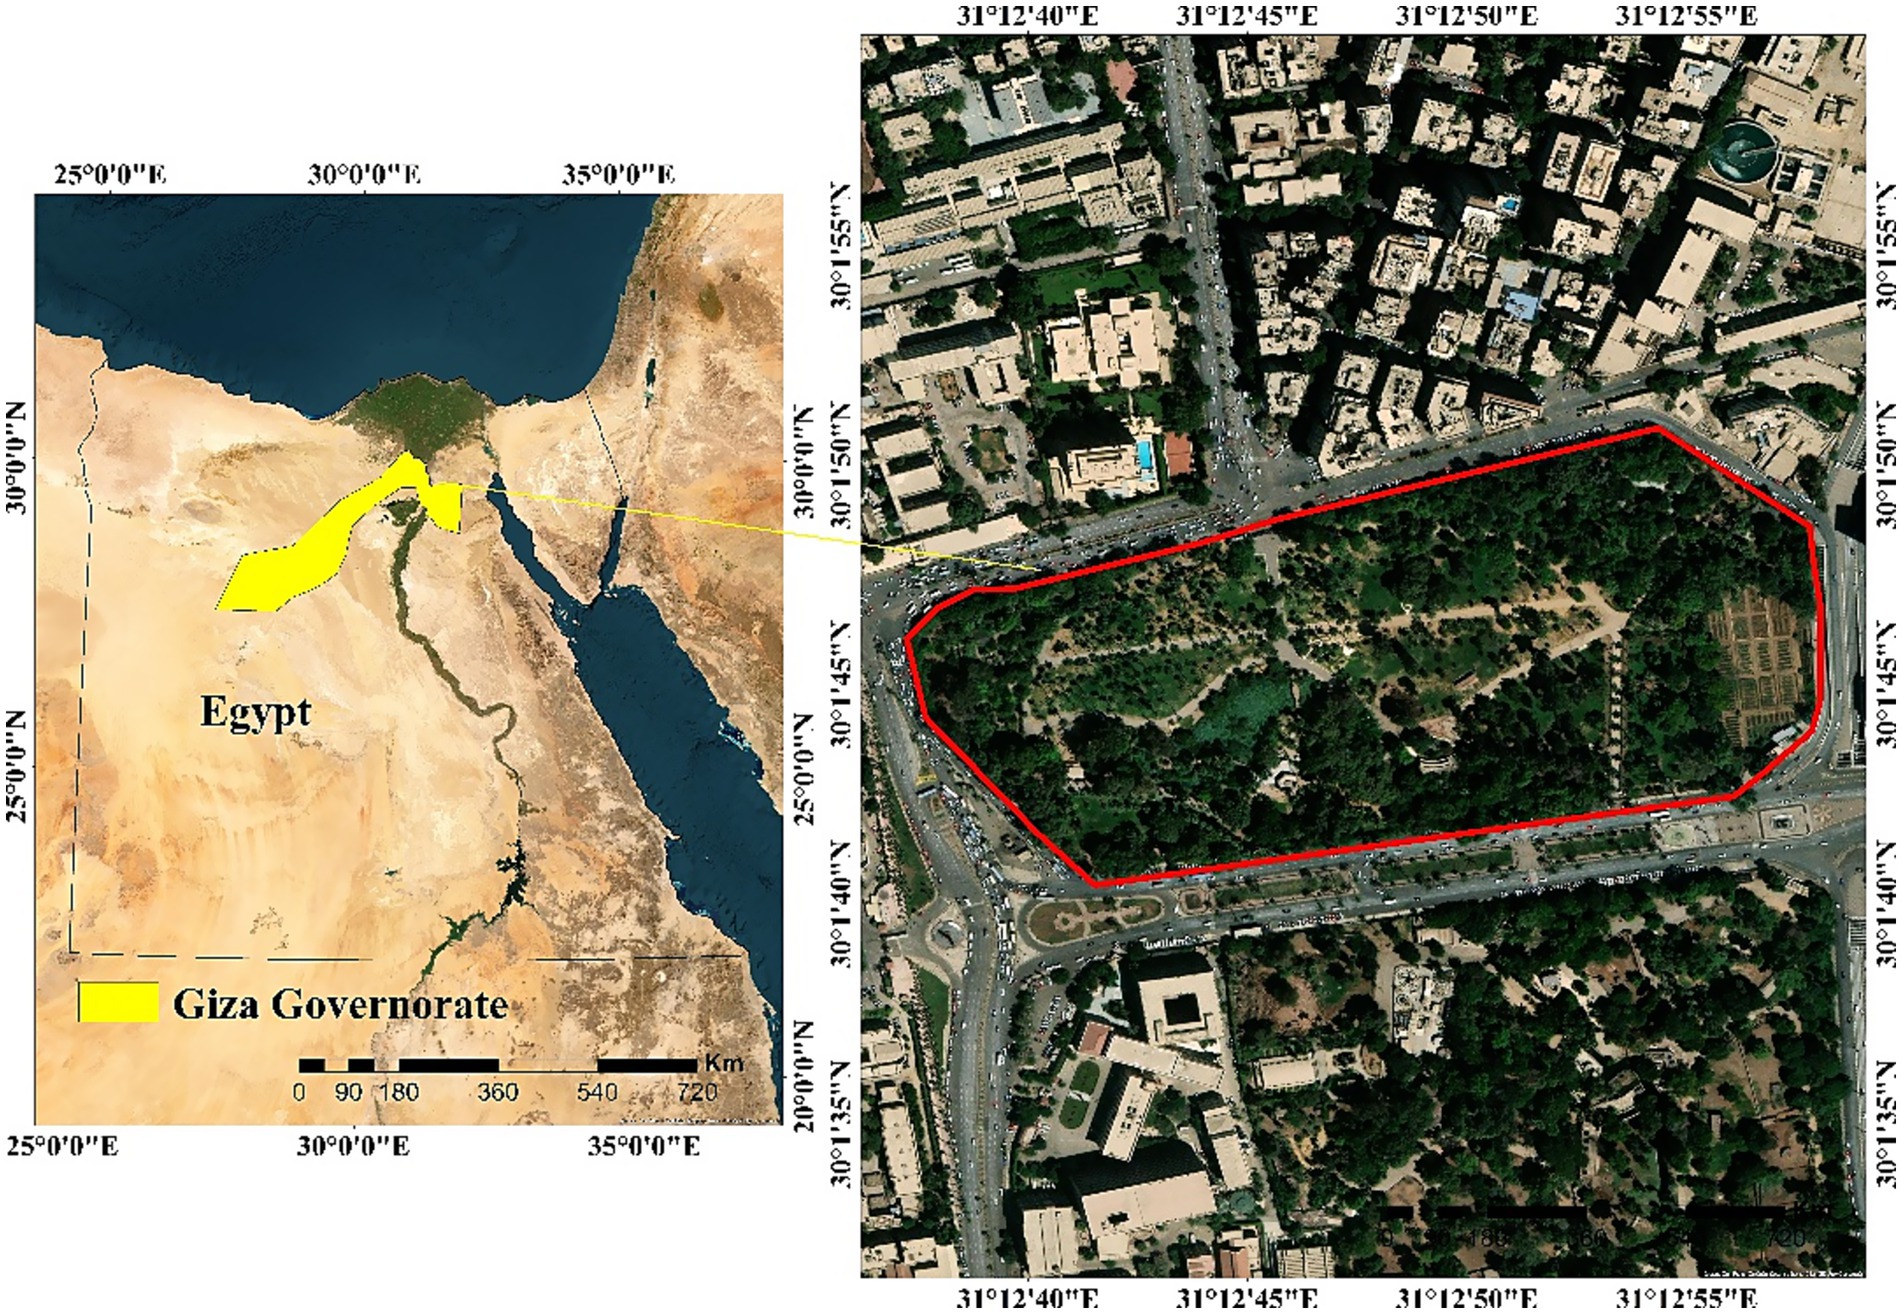
Figure 1. Location map of study area.
Leaf samples were collected from large, mature trees of 10 species belonging to the genus Ficus (Family: Moraceae) and two species from the genus Moringa (Moringa oleifera and Moringa peregrina) belong to (Family: Moringaceae).
All specimens were sampled from healthy, well-established trees growing within the garden to ensure consistency and reliability of morphological and spectral measurements. The first abstract of the research was published in the proceedings of the IST–ICRSSA Conference, organized by the National Authority for Remote Sensing and Space Sciences (NARSS), held from 8 to 11 December 2022.
2.2 Plant sampling
Mature and healthy individuals of Ficus and Moringa spp. were selected for this study to ensure accurate assessment of their spectral and morphological traits. For Ficus spp., samples were collected from the Orman Botanical Garden in Cairo, Egypt. Based on garden records and morphological evaluation (e.g., trunk diameter, canopy size), the age of the selected Ficus individuals was estimated to range between 15 and 40 years. Although older historical specimens exist, only actively growing and physiologically stable trees were included in the measurements.
M. oleifera and M. peregrina specimens were sourced from cultivated plots in botanical garden. These trees are known for their fast growth and were estimated to be between 3 and 6 years old, representing mature, flowering individuals suitable for reliable spectral analysis. All samples were free from visible disease, pest infestation, or recent pruning to ensure data consistency. To ensure that the leaves sampled were appropriately representative of each species, mature trees were used to gather samples of leaves. Out of every species, one tree was chosen. A random sample of four leaves was taken from each tree’s crown, and one leaf was chosen from each orientation at each of the four crown directions. Randomly chosen samples of leaves from the upper part of the crown that had been fully exposed to the sun were then cleaned and ready for spectral reflectance measurements.
Morphological traits were assessed in the field for each of the 12 studied species (10 Ficus and two Moringa) during the same sampling period as spectral measurements. For each species, three mature and healthy individuals were selected randomly. The following descriptive traits were recorded:
• Leaf shape (e.g., ovate, elliptic, lanceolate)
• Leaf margin (e.g., entire, lobed, dentate)
• Leaf base and apex shape
• Leaf arrangement on the stem (e.g., alternate, opposite)
• Leaf texture (e.g., leathery, smooth, pubescent)
• Petiole length and leaf length × width
Measurements were taken using a ruler (±1 mm precision) for dimensions and by visual inspection for qualitative features, based on standard botanical identification guides. Observations were cross-verified by two trained botanists to minimize observer bias. All data were documented on-site and supported by photographs for later confirmation.
2.3 Spectroscopic measurements
Spectral reflectance data were collected in the field on a single clear-sky day using an ASD FieldSpec 4 spectroradiometer. To ensure environmental consistency during spectral measurements, all data were collected under similar atmospheric and lighting conditions. Measurements were taken between 10:00 AM and 2:00 PM under stable sunlight conditions to minimize variations in solar angle and irradiance. Fully expanded, mature leaves from three healthy individuals per species were measured in situ. A Spectralon white reference panel was used for instrument calibration before each set of measurements. A leaf clip equipped with an internal light source was employed to ensure consistent measurement geometry and minimize shading effects. Each leaf sample was scanned three times, and the mean reflectance value was used for spectral index calculation.
The white panel reflectance calculation approach was applied during the data collection process to guarantee accurate results. By affixing a probe to the fiber-optic cable of the equipment, environmental consistency. Environmental consistency refers here to maintaining uniform weather conditions (i.e., no cloud cover, wind, or precipitation), stable light intensity, and constant observer-sensor geometry throughout the measurement process, was preserved during reflectance measurements. A 25-degree lens was used for outside measurements, providing a 3 cm (90°) circular field of view over the object of interest. Tukey’s approach was used to determine the best waveband zones based on the traits of each type of plant.
The core of the study methodology is the statistical analysis of spectroscopic performance data combined with spectral measurements. By choosing the best wavelengths within each spectral zone to aid in differentiation, this method seeks to determine the optimal spectral regions for differentiating between different plant species. Under field conditions, the ASD Field Spec equipment was used to evaluate plant leaves. Thirty-six plant leaves were measured for reflectance, and the results were then converted to an ASCII file using the statistical analysis program ASD View Pro. Spectrum reflectance curves were visually examined in order to confirm the vegetation’s spectrum reflectance characteristics.
To improve the capacity for distinction, a statistical analysis was conducted to determine which spectral bands provide the best discrimination between the plants under study. One-way ANOVA was performed to assess significant differences among species for spectral and morphological variables. When ANOVA results were significant (p ≤ 0.05), Tukey’s Honestly Significant Difference (HSD) post hoc test was applied to identify pairwise differences between species means. This method controls the type I error rate across multiple comparisons and is commonly used in ecological and spectral data analysis (Abdi and Williams, 2010). During this stage, Clark et al. (2005) used linear discriminant analysis (LDA) to choose the bands, and the methodology of analyzing variance (ANOVA) was used to determine how well the chosen wavelengths and bands distinguished different plant species. Furthermore, 12 different plant species were included in the spectrum reflectance investigation, with three replicates of each species being assessed. Six distinct spectral bands were covered by observations, which were made using the Analytical Field Spectroradiometer (ASD Field Spec): Blue, Green, Red, Near Infrared, SWIR I, and SWIR II.
Spectral reflectance was measured using the ASD FieldSpec® spectroradiometer, which operates over a spectral range of 350–2,500 nm. The following spectral regions were used to compute vegetation indices and assess reflectance characteristics:
• Blue: 450–495 nm
• Green: 495–570 nm
• Red: 620–700 nm
• Red-edge: 700–740 nm
• Near-Infrared (NIR): 740–1,300 nm
• Short-Wave Infrared I (SWIR I): 1,300–1,900 nm
• Short-Wave Infrared II (SWIR II): 1,900–2,500 nm
These bands were selected based on their relevance to pigment absorption (chlorophyll, carotenoids, anthocyanins), water content, and structural properties of the leaves.
2.4 Hyperspectral indices
Based on spectroscopy measurements for each field plant, the values of the soil and vegetation indices were calculated. These values were based on the contrast between the maximum absorption of pigments and chlorophyll in the red spectrum, as well as the maximum reflectance of the leaf’s cell structure in the near-infrared spectrum (Table 1). Mathematical correlations were used to depict the observed relationship between several soil and vegetation indices (Zagajewski et al., 2017).
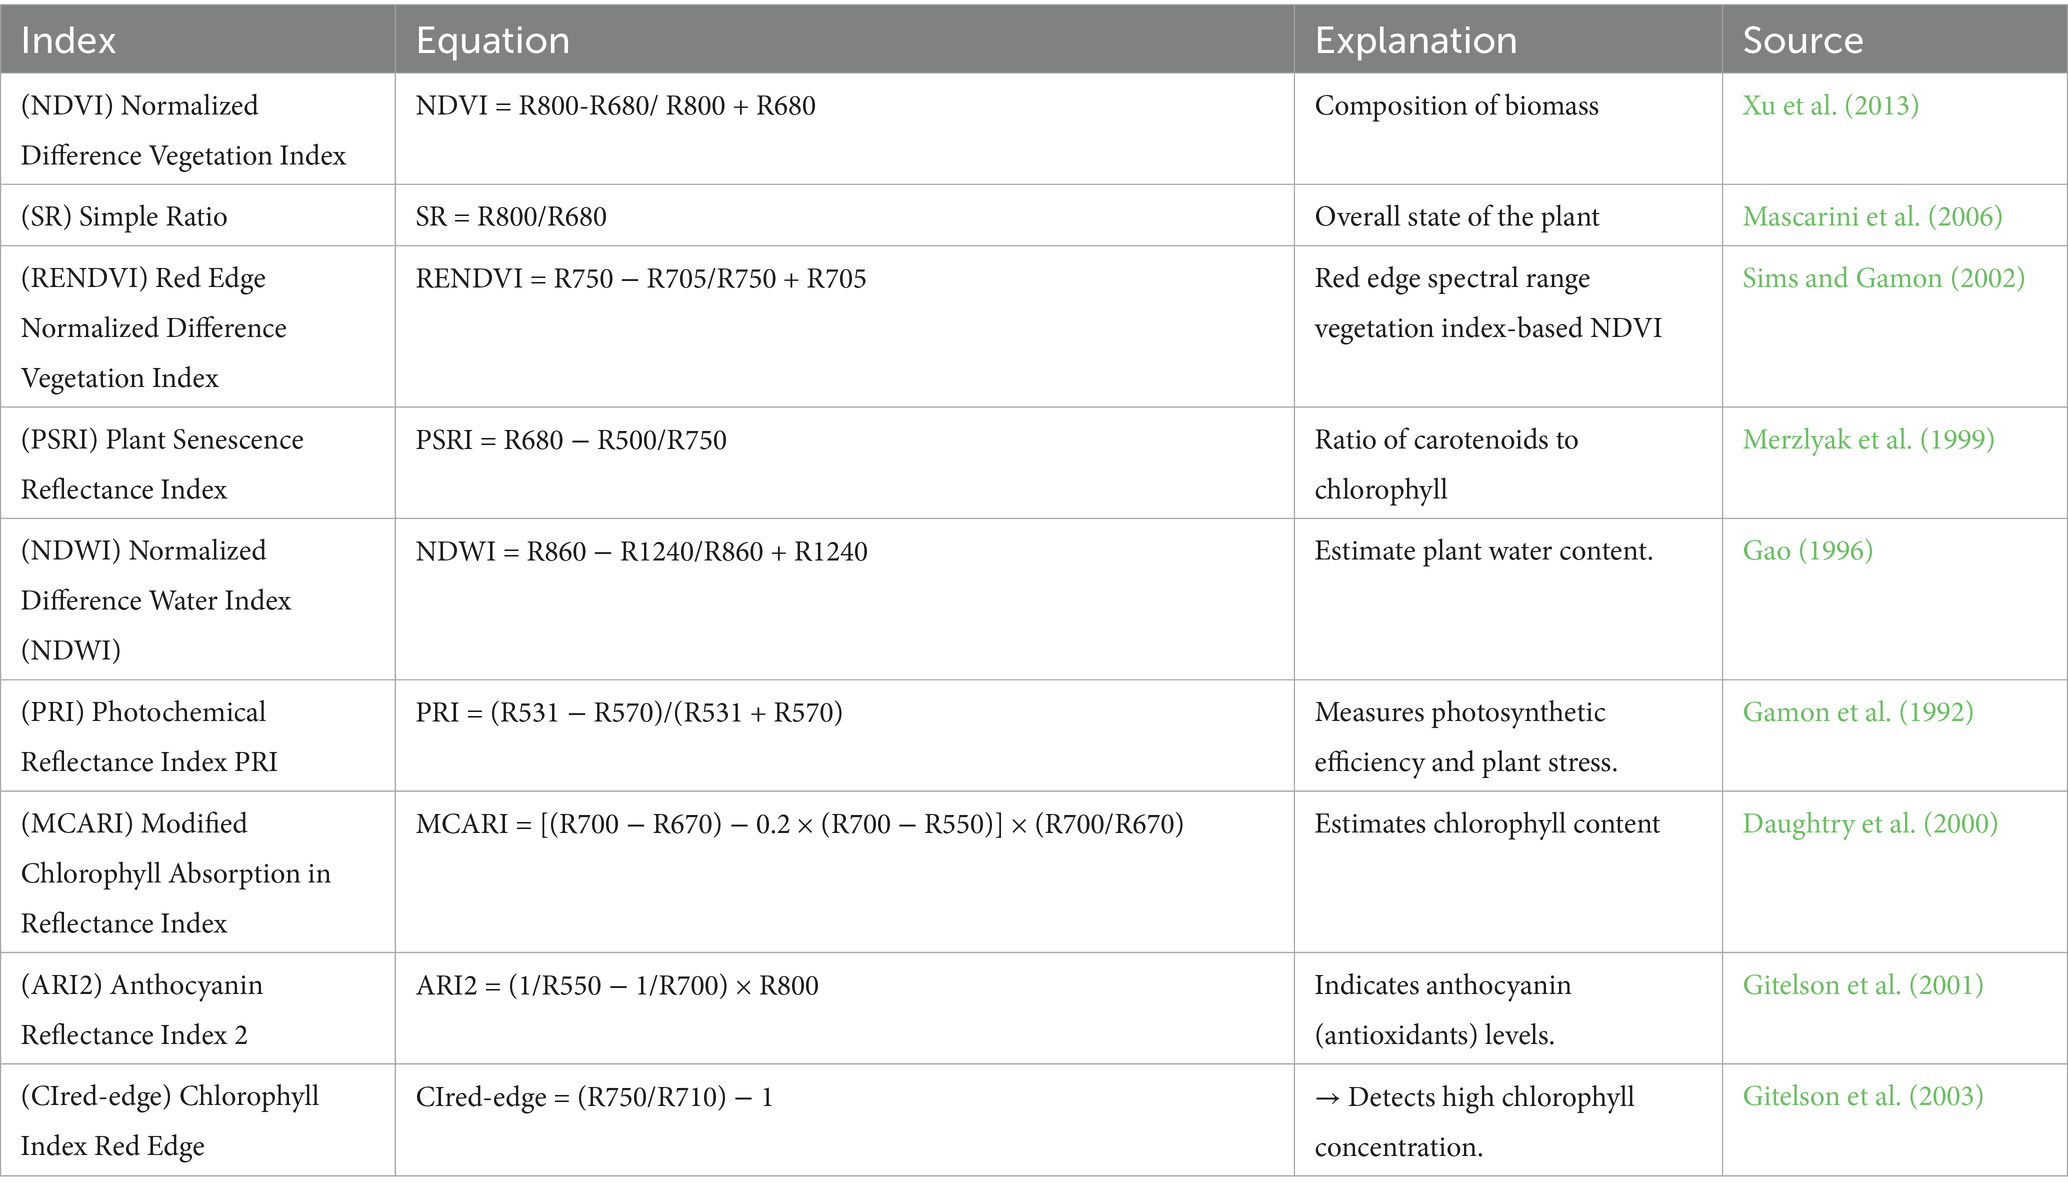
Table 1. Synopsis of vegetation indices, vegetation index sources, and methods.
The following spectral indices were calculated to evaluate photosynthetic efficiency, pigment content, and stress response:
• NDVI (Normalized Difference Vegetation Index): ranges from −1 to +1; values > 0.5 typically indicate healthy, green vegetation with strong photosynthetic activity, while values near 0 or negative suggest sparse or stressed vegetation.
• SR (Simple Ratio): ranges from ~1 to >10; higher values indicate greater chlorophyll content and biomass.
• PRI (Photochemical Reflectance Index): typically ranges from −0.1 to +0.1; sensitive to xanthophyll cycle activity and photosynthetic light-use efficiency.
• PSRI (Plant Senescence Reflectance Index): values increase with chlorophyll degradation and carotenoid dominance, indicating leaf senescence.
• CRI (Carotenoid Reflectance Index): higher values indicate higher carotenoid content, often associated with stress response or protective mechanisms.
• MCARI (Modified Chlorophyll Absorption Ratio Index): values typically range from 0 to 2; sensitive to chlorophyll concentration.
• ARI2 (Anthocyanin Reflectance Index): detects anthocyanin accumulation; higher values indicate anthocyanin-rich tissues, often under stress.
• NDRE (Normalized Difference Red Edge Index): typically ranges from 0 to 0.6; useful for detecting moderate-to-high chlorophyll content, especially in dense canopies.
• Clred-Edge: similar to NDRE but uses a different combination of red-edge wavelengths; higher values reflect increased chlorophyll density.
2.5 Medicinal score calculation
To provide a comparative indicator of the medicinal importance of each species, a medicinal score was computed based on a literature-derived scoring framework. For each species, we reviewed published pharmacological studies and ethnobotanical sources and assigned points to the following categories:
• Number of pharmacological activities reported (e.g., antioxidant, anti-inflammatory, antimicrobial, antidiabetic)
• Number of plant parts used (e.g., leaves, bark, latex, seeds)
• Frequency of use in traditional medicine (based on literature mentions)
Each positive attribute contributed one point. The total score for each species was then normalized to a 0–1 scale using min-max normalization to allow comparison across species. This score served as a semi-quantitative proxy for medicinal relevance and was used in correlation analyses with spectral indices.
2.6 Statistical analysis
Statistical analyses were performed using JMP Pro version 16.2.0 (SAS Institute Inc., Cary, NC, USA). One-way ANOVA was used to detect significant differences in spectral indices and morphological traits across species. Linear Discriminant Analysis (LDA) was conducted to assess species discrimination. Pearson correlation analysis was used to explore relationships between vegetation indices and the medicinal score.
To visualize the correlation matrix, a heatmap was generated using Python (version 3.9) with the Seaborn (version 0.11.2) and Matplotlib (version 3.4.3) libraries. Statistical significance was annotated as follows: *p < 0.05, **p < 0.01, ***p < 0.001. An alpha level of 0.05 was used as the threshold for statistical significance in all analyses, including ANOVA, LDA, and Pearson correlation.
To evaluate the relationships between hyperspectral vegetation indices and the medicinal score, a Pearson correlation matrix was computed using Python (pandas and seaborn packages). This method quantifies linear associations between variables, yielding correlation coefficients (r-values) ranging from −1 to +1. Values closer to ±1 indicate strong correlations. No regression models or variance partitioning were performed at this stage.
3 Results
The following section presents the variation in spectral indices and morphological features across the examined taxa, highlighting statistically significant patterns related to their physiological and medicinal characteristics.
3.1 Morphological description
Morphological characteristics (e.g., leaf shape, margin, venation patterns) supported the spectral findings, with clear differences observed among the selected species. A combined analysis improved discrimination accuracy. The morphological traits of the taxa under investigation are shown in Table 2 to make it easier to determine which diagnostic features are most crucial.
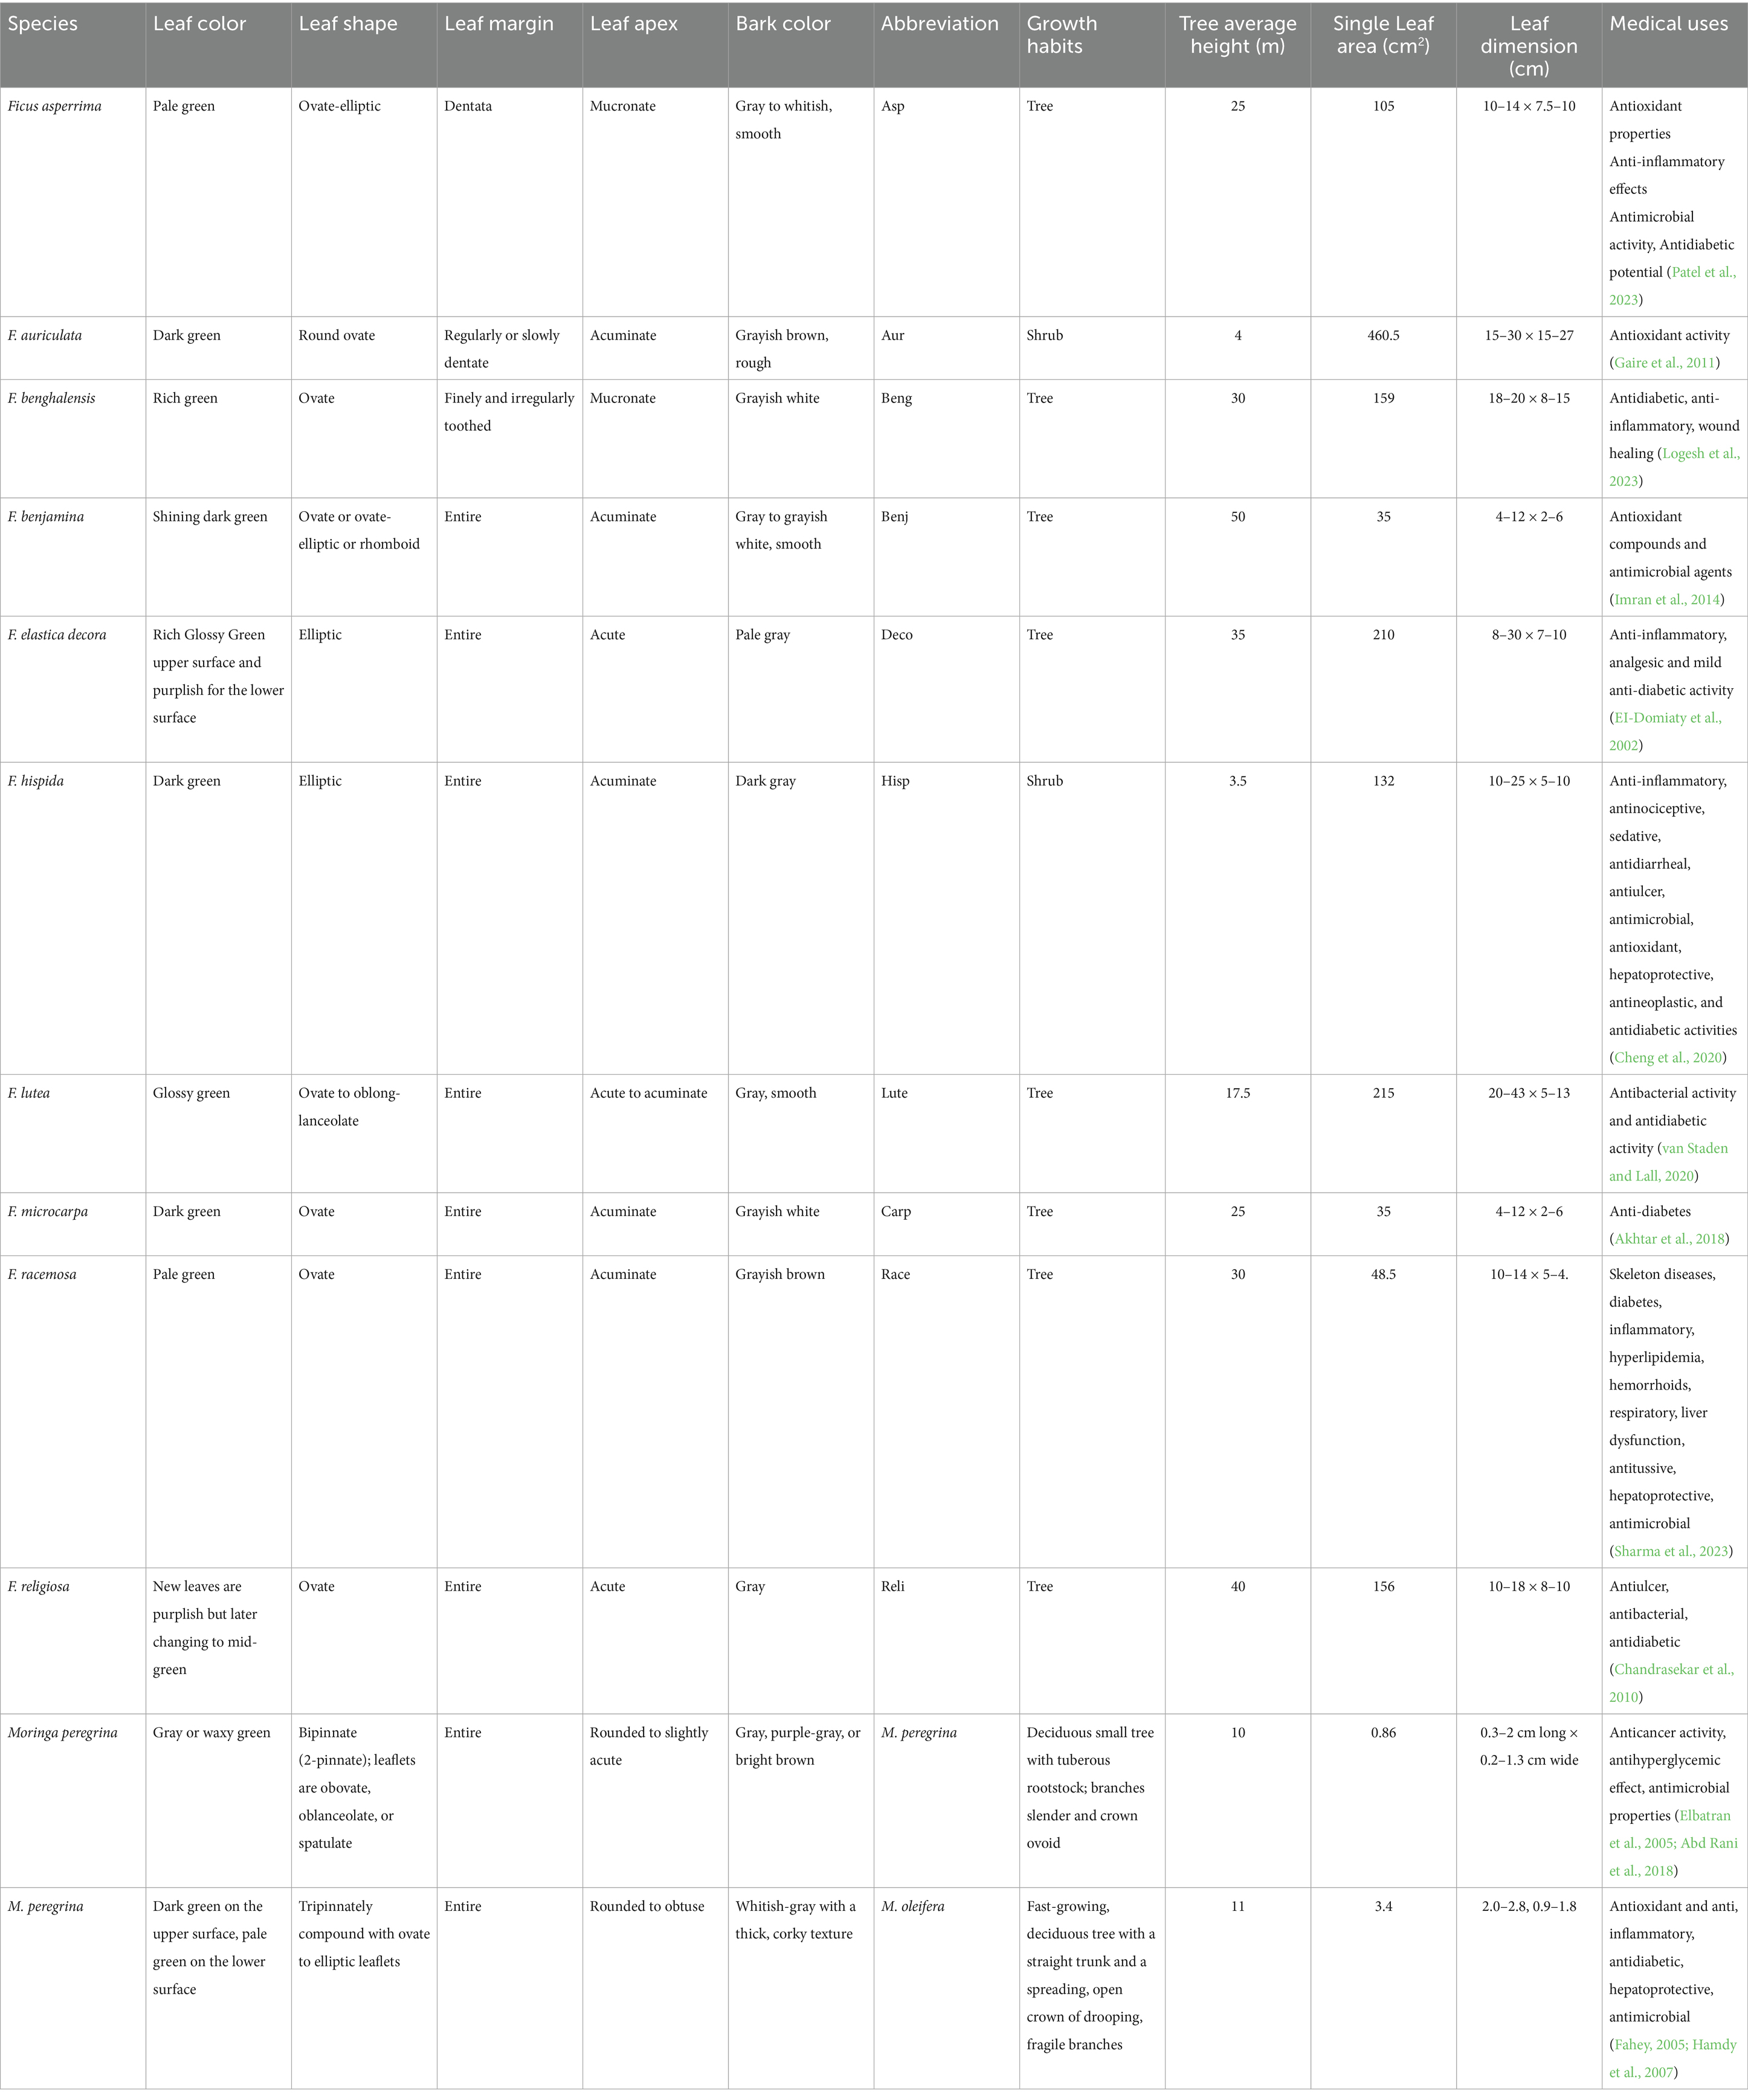
Table 2. Morphological characteristics and color of Ficus and Moringa spp., leaves and bark.
Descriptive statistics for tree height and single leaf area across the 12 studied species are presented in Table 2. The average tree height was 23.42 ± 14.62 m, while the average single leaf area was 130.02 ± 128.77 cm2, reflecting substantial interspecific variation.
The morphological characteristics of M. peregrina and M. oleifera, particularly leaf shape, margin, and apex, reveal distinct differences that support their taxonomic classification and assist in spectral discrimination. For instance, Moringa peregrina exhibits bipinnate leaves with obovate to spatulate leaflets, whereas M. oleifera has tripinnate leaves with ovate to elliptic leaflets. These variations in leaf structure, along with differences in leaf size (ranging from 0.3 to 2 cm for M. peregrina and 2.0–2.8 cm for M. oleifera), highlight the species’ morphological distinctiveness.
Additionally, the bark color and texture further distinguish the two species. M. peregrina has a gray or waxy green color with a corky, whitish-gray texture, while M. oleifera has a pale green underside and a whitish-gray bark.
3.2 Spectral analyses
3.2.1 Ficus species
All taxa exhibited a similar spectral trend across the 400–2,500 nm range, with a characteristic dip in the red region and a peak in the near-infrared region, as shown in Figure 2.
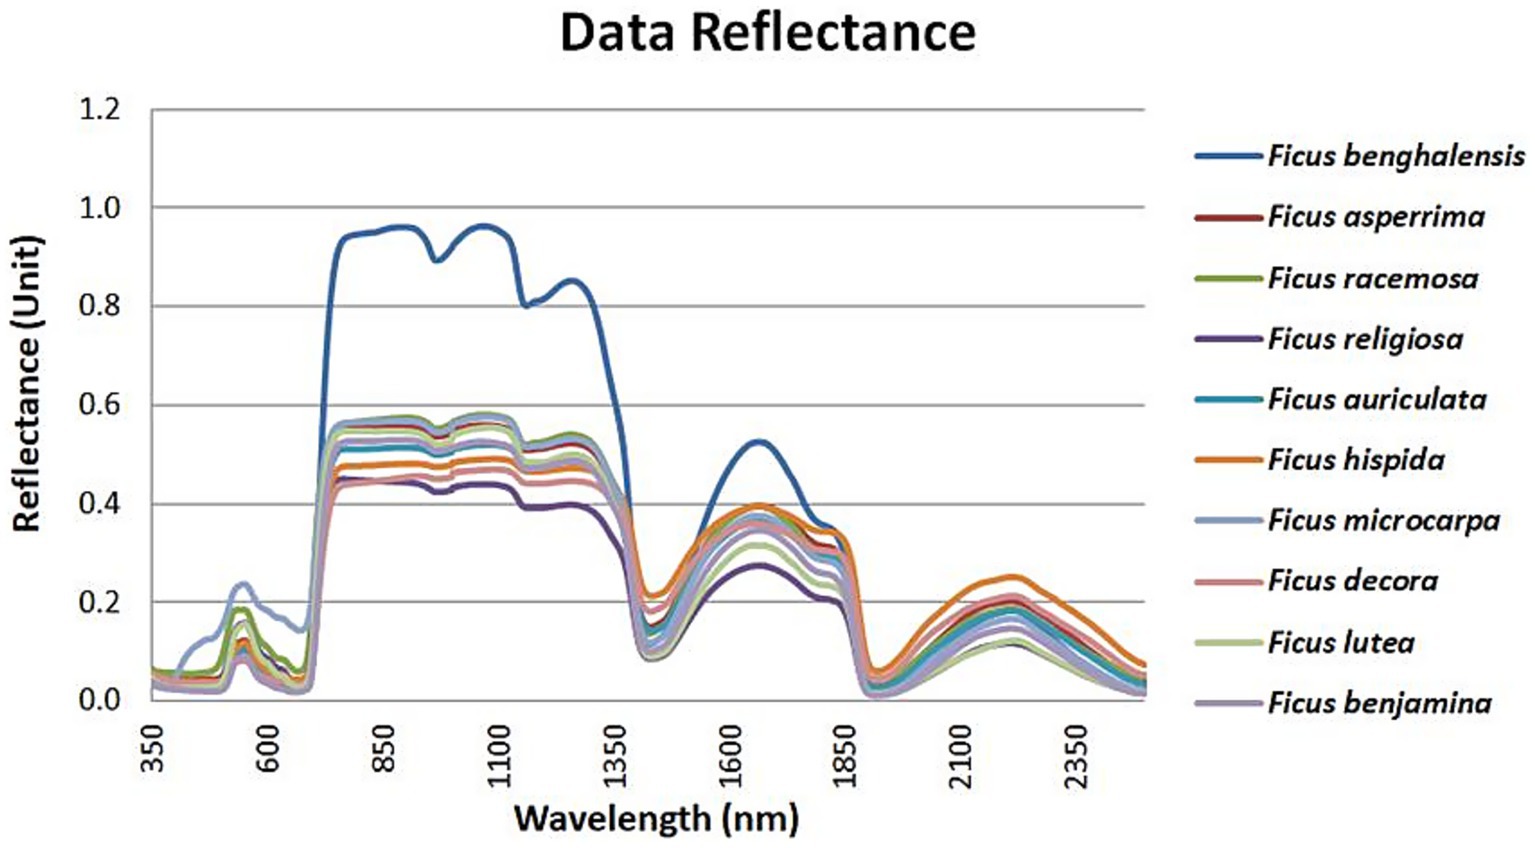
Figure 2. Spectral characteristics pattern for Ficus spp.
F. lutea showed lower reflectance values in the SWIR I region, while F. religiosa had reduced reflectance in the NIR zone (Figure 2). Among all species, F. benghalensis showed higher spectral reflectance across most regions, with the exception of SWIR II.
The ANOVA and post hoc Tukey tests (Figure 3) identified statistically significant differences in spectral reflectance across species. Reflectance values in the blue region showed limited variance between species, while greater variation was observed in the SWIR II region.
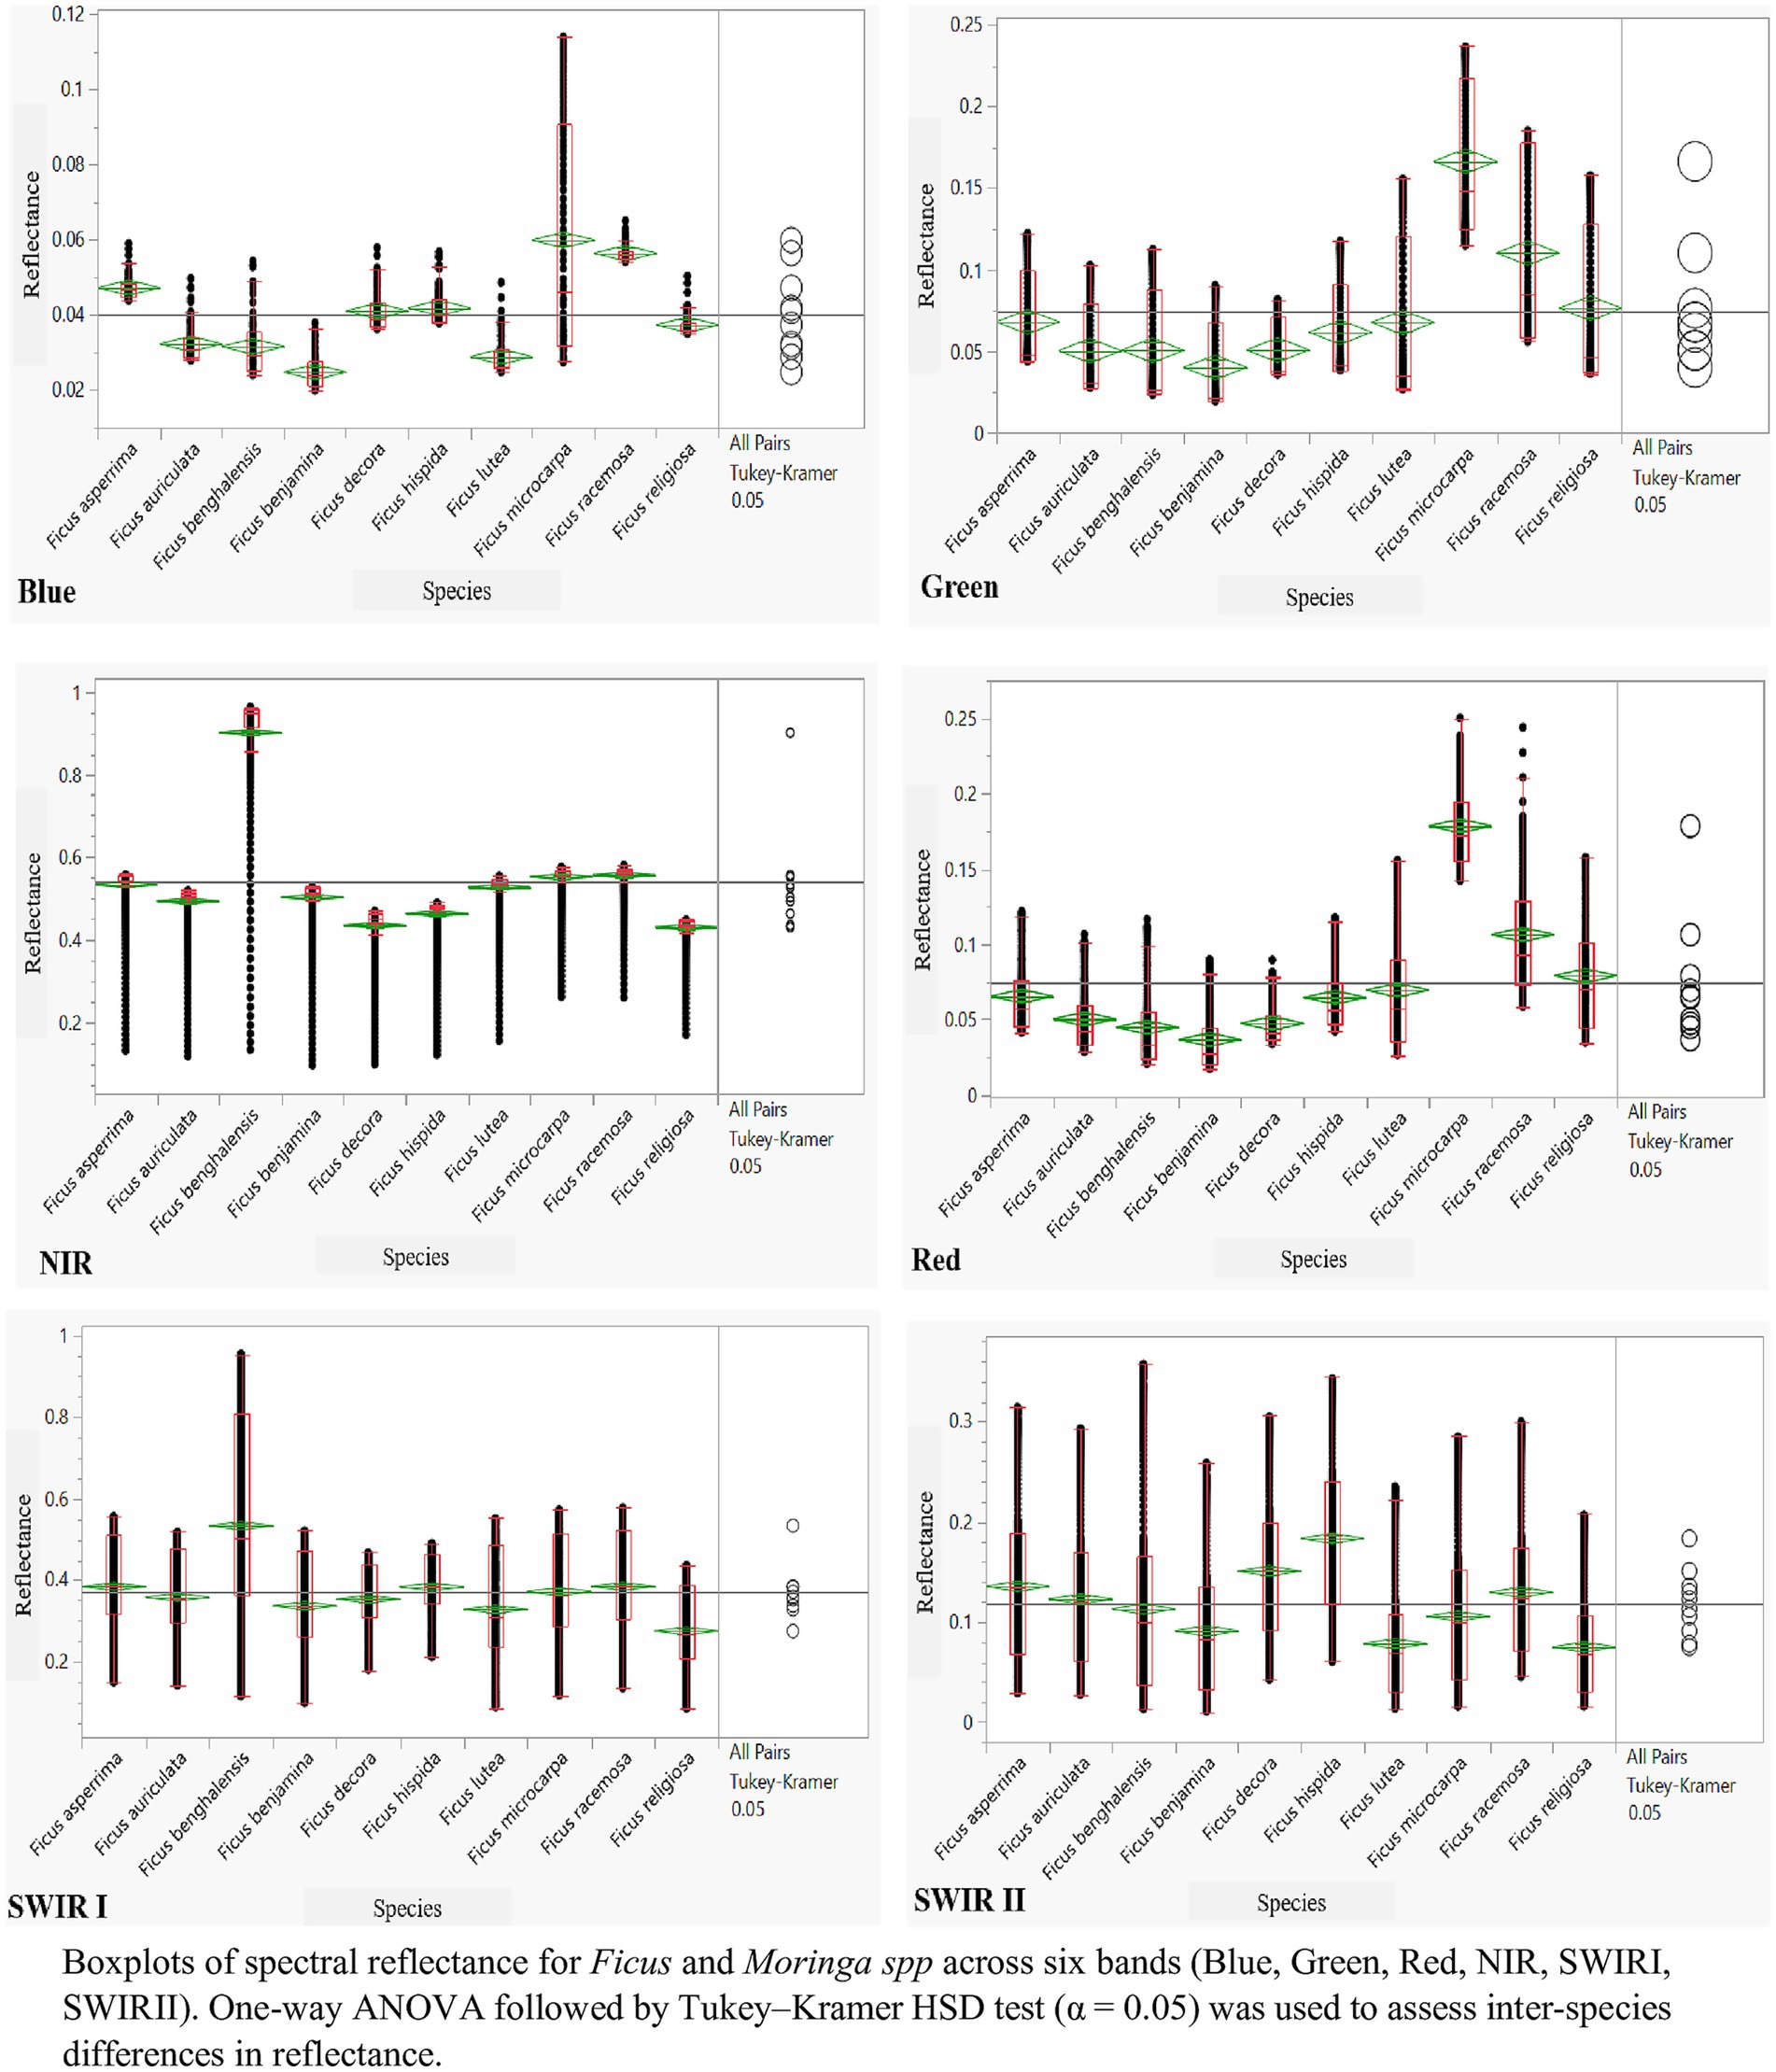
Figure 3. ANOVA and Tukey’s analyses to differentiation among Ficus spp. within the Blue, Green, and NIR Red, SWIRI, and SWIR II Zones.
Linear Discriminant Analysis (LDA) conducted on the spectral data of Ficus spp. revealed that the first discriminant function (DF1) explained 84.7% of the total variance, and the second function (DF2) accounted for an additional 10.5%. The spectral regions that contributed most significantly to class separation were found in the near-infrared (700–1,300 nm) and SWIR1 (1,500–1,750 nm) regions. The model achieved a cross-validated classification accuracy of 91.3%. Statistical testing using Wilks’ Lambda confirmed the significance of the model (p < 0.001), indicating robust discriminatory capability among Ficus species.
Spectral reflectance analysis showed that most species exhibited similar responses in the visible spectrum. However, interspecific differences were observed in the near-infrared (NIR) and shortwave infrared (SWIR) regions.
F. benghalensis exhibited high reflectance across most regions except SWIR II, while F. religiosa showed reduced reflectance in the NIR range. Ficus lutea had lower reflectance in SWIR I, and F. microcarpa was differentiated by its reflectance in the visible band.
The ANOVA and Tukey’s post hoc tests identified green, red, NIR, and SWIR II as the spectral regions with the greatest ability to discriminate among species, whereas the blue band showed minimal variance across taxa.
As shown in Table 3, the results indicate that Linear Discriminate Analysis (LDA) was successful in determining ideal wavelengths and wavebands for a range of plants under investigation. This analytical method successfully identified the unique wavelength connected to every wild plant.
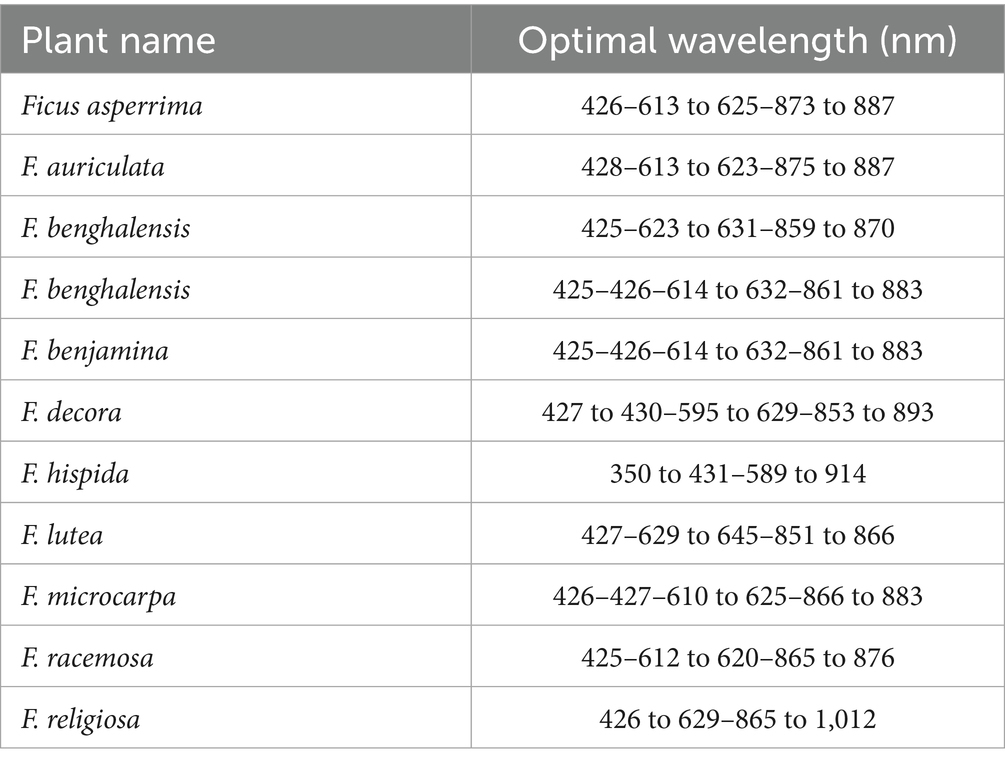
Table 3. The optimal wavelength for discerning between the various plant species under investigation.
3.2.2 Moringa species
The reflectance spectra for M. peregrina and M. oleifera were measured across the 350–2,500 nm wavelength range (Figure 4). The data reveal that both species exhibit similar overall spectral patterns, with noticeable differences in reflectance values across certain wavelength regions. M. oleifera consistently showed higher reflectance values than Moringa peregrina, particularly in the near-infrared region (700–1,350 nm).
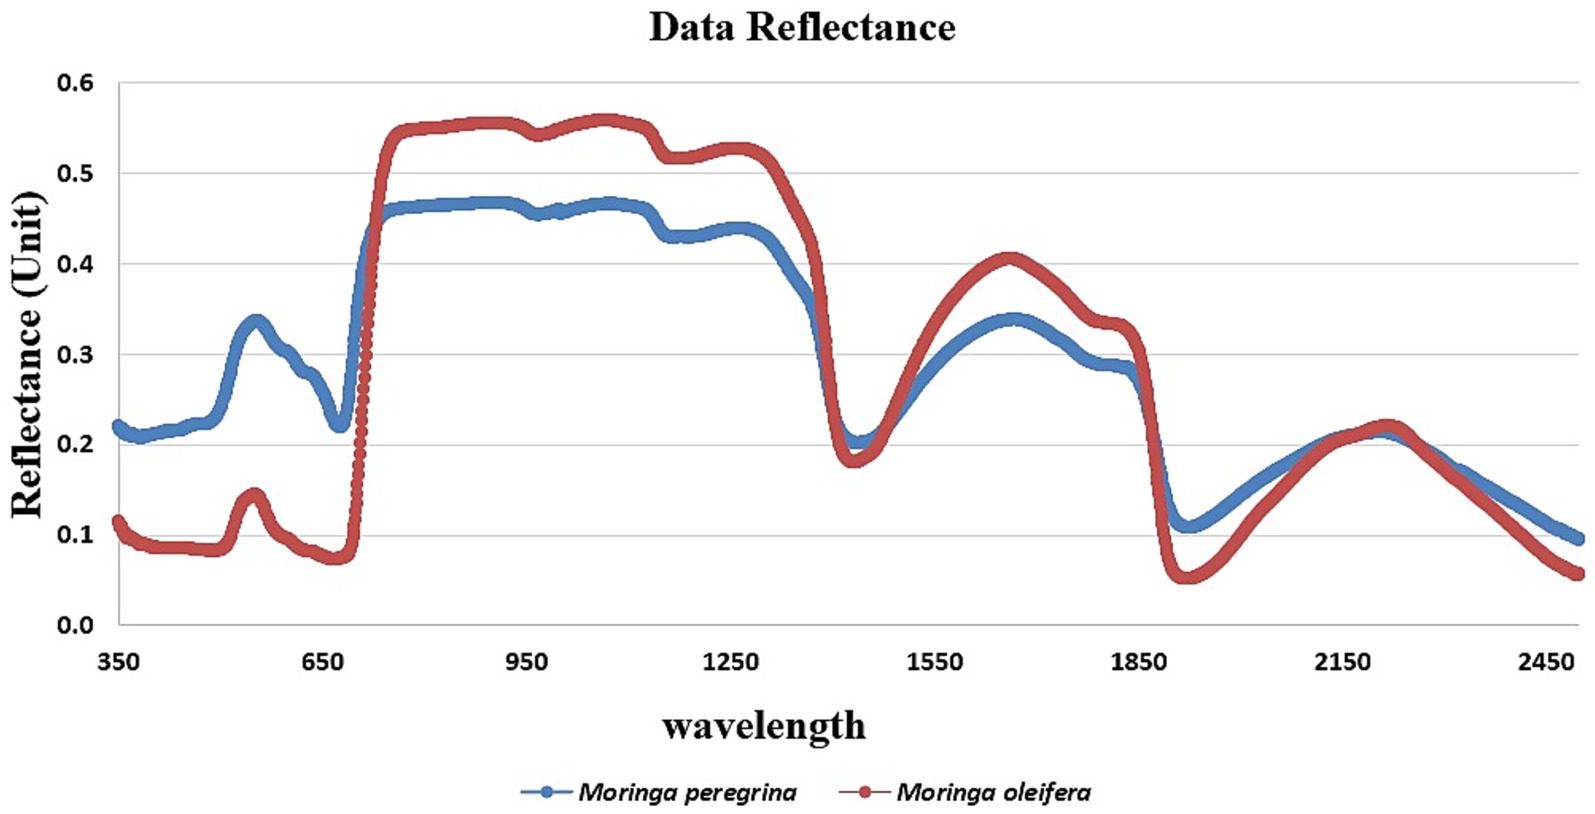
Figure 4. Spectral characteristics pattern for Moringa spp.
For the Moringa spp., LDA results showed that DF1 and DF2 explained 89.2 and 7.1% of the variance, respectively. The key wavelengths contributing to species separation were also located in the NIR and SWIR 1 regions. The classification accuracy reached 93.2%, highlighting the effectiveness of hyperspectral features in differentiating Moringa oleifera and Moringa peregrina. The model was statistically significant (Wilks’ Lambda, p < 0.001), confirming its robustness for spectral classification.
3.3 Vegetation indices
3.3.1 Ficus spp.
The analysis of hyperspectral vegetation indices across 10 Ficus spp. revealed significant interspecific variations that reflect their physiological status. These variations, when interpreted alongside known phytochemical profiles from the literature, may provide preliminary insights into potential medicinal relevance. Table 4 summarizes the computed values for 10 spectral indices, including NDVI, SR, PSRI, CRI, RENDVI, PRI, MCARI, ARI2, NDRE, and CIred-edge.
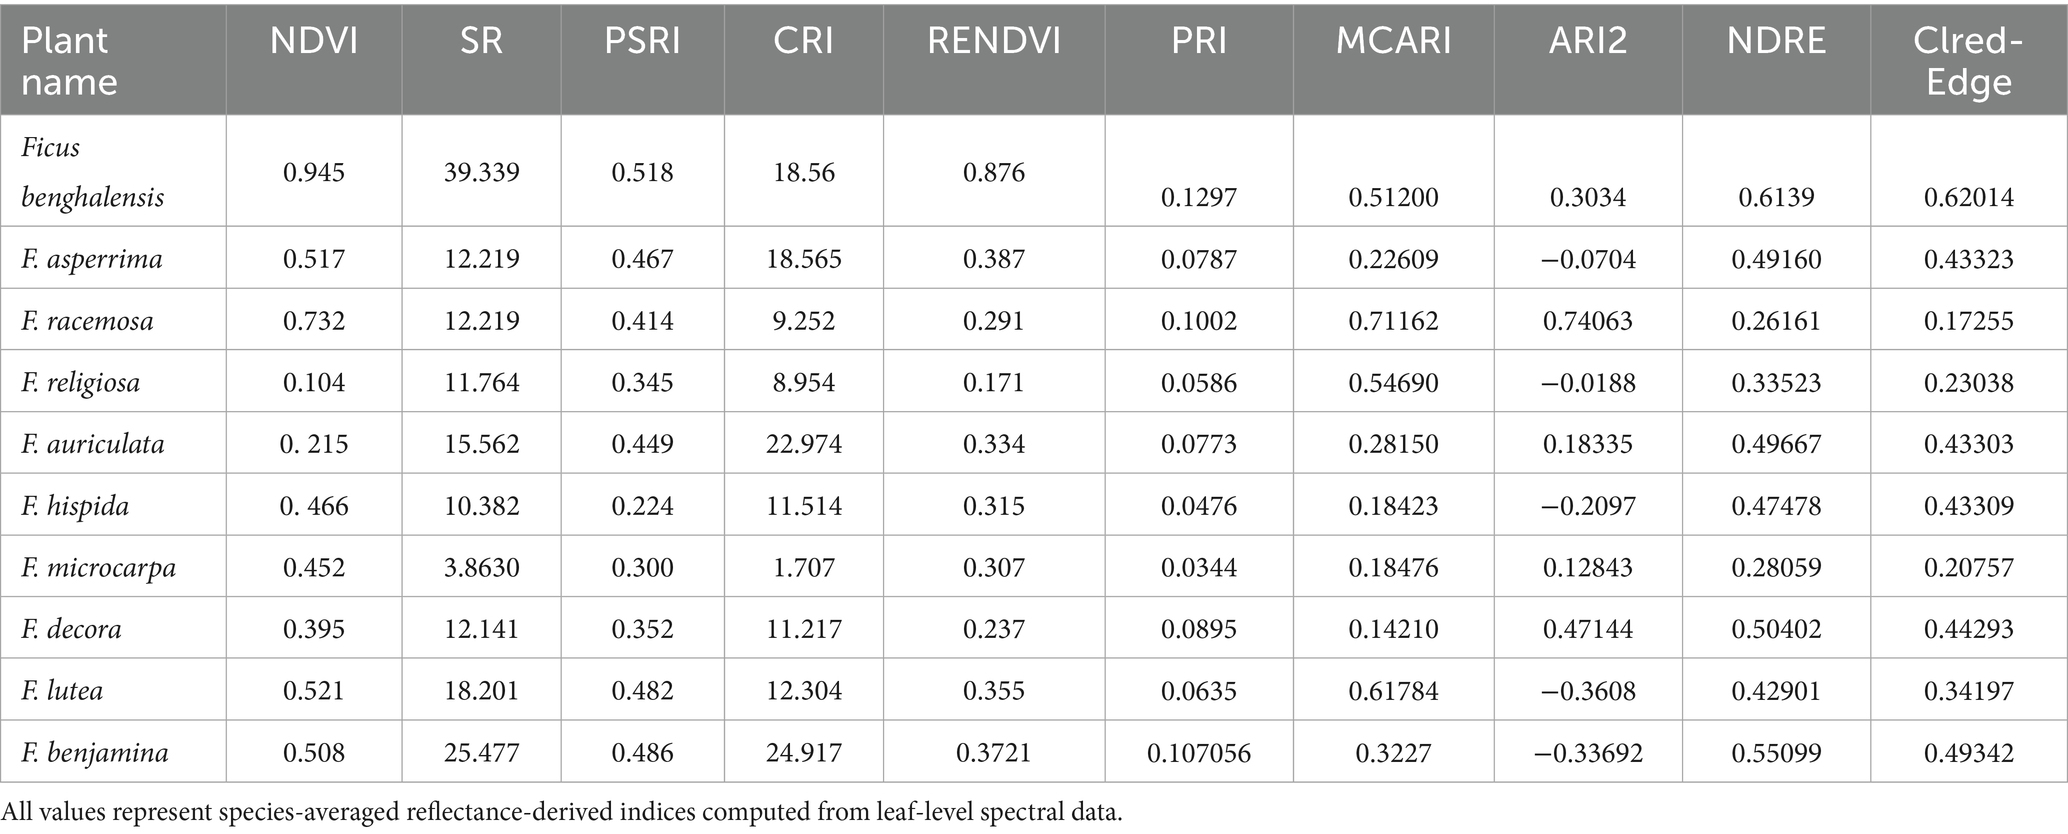
Table 4. Mean vegetation index values across 10 Ficus spp.
Results for F. benghalensis demonstrated the highest NDVI (0.945), SR (39.3), and RENDVI (0.876) values, indicating high leaf-level chlorophyll content and strong physiological activity. It also showed high CRI (18.56), ARI2 (0.303), and MCARI (0.512), indicating rich carotenoid and anthocyanin content. PRI (0.129) and NDRE (0.614) were elevated, reflecting strong photosynthetic efficiency and nitrogen status. PSRI (0.518) and CIred-edge (0.620) also supported robust plant health as revealed by spectral analysis in this study. The known medicinal applications of F. benghalensis, including treatment of diabetes, inflammation, and microbial infections, have been previously documented (Murugesu et al., 2021) although not based on spectral data.
F. asperrima showed NDVI of 0.517 and SR of 12.2. CRI was relatively high (18.56), while ARI2 had a negative value (−0.070). MCARI (0.226), PRI (0.078), RENDVI (0.387), NDRE (0.492), and CIred-edge (0.433) were moderate.
F. racemosa exhibited high MCARI (0.711) and ARI2 (0.741). NDVI (0.732) and SR (12.2) were also relatively high. PRI (0.100), NDRE (0.262), and RENDVI (0.291) showed intermediate values. CRI (9.25) and PSRI (0.414) were within mid-range.
F. religiosa recorded the lowest NDVI (0.104) and RENDVI (0.171). SR (11.76), CRI (8.95), and PSRI (0.345) were low to moderate. MCARI (0.547) was relatively high, while PRI (0.058), ARI2 (−0.019), and NDRE (0.335) were comparatively low.
F. auriculata showed high CRI (22.97), SR (15.56), and PSRI (0.449). NDVI (0.215) and MCARI (0.282) were moderate, while ARI2 (0.183), NDRE (0.497), PRI (0.077), RENDVI (0.334), and CIred-edge (0.433) were within intermediate ranges.
F. hispida showed NDVI of 0.466, SR of 10.38, and CRI of 11.51. MCARI was 0.184, and ARI2 had a negative value (−0.210).
PRI (0.048), RENDVI (0.315), and CIred-edge (0.433) were also relatively low. These values point to limited photosynthetic and pigment activity. The species is traditionally used for laxative and skin treatments, though its spectral profile suggests modest phytochemical output.
F. microcarpa recorded the lowest SR (3.86), CRI (1.71), and PRI (0.034), suggesting low pigment activity and limited stress adaptation. NDVI (0.452) and PSRI (0.300) were moderate, while MCARI (0.185), ARI2 (0.128), and NDRE (0.281) reflected limited photosynthetic activity. CIred-edge (0.208) and RENDVI (0.307) values also confirmed weak chlorophyll performance.
F. decora presented moderate NDVI (0.395), SR (12.14), and CRI (11.22). It showed high ARI2 (0.471), moderate MCARI (0.142), and NDRE (0.504). RENDVI (0.237) and PRI (0.089) indicated stable physiological status. The pigment reflectance and anthocyanin presence suggest a moderate medicinal potential, possibly linked to antioxidant properties.
F. lutea showed a strong SR (18.20), PSRI (0.482), and CRI (12.30), indicating high carotenoid and senescence activity. NDVI (0.521), MCARI (0.618), and ARI2 (−0.360) revealed photosynthetic capacity and pigment variation. Although NDRE (0.429) and CIred-edge (0.342) were moderate, the negative ARI2 suggests limited anthocyanin content. Overall, this species holds potential for moderate medicinal value.
F. benjamina displayed high SR (25.48), CRI (24.91), and NDRE (0.551), along with moderate NDVI (0.508), PSRI (0.486), and MCARI (0.323). ARI2 (−0.337) and PRI (0.107) reflected mixed pigment activity. RENDVI (0.372) and CIred-edge (0.493) supported its healthy physiological profile. These indices support its use in treating infections and inflammation, particularly related to its antioxidant potential.
3.3.2 Moringa spp.
Table 5 presents the calculated vegetation indices for M. peregrina and M. oleifera.
Table 5. Mean vegetation index values for M. peregrina and M. oleifera species.
M. oleifera exhibited the highest NDVI (0.487), SR (7.36). PSRI (−0.016) and NDWI (0.025) were relatively low. PRI (0.042), MCARI (0.096), and ARI2 (−0.569) showed variable values. NDRE (0.498), RENDVI (0.498), and CIred-edge (0.490) were among the highest recorded across species.
M. peregrina presented lower NDVI (0.355), SR (2.10). PSRI (−0.039) and NDWI (0.032) were also low. PRI (−0.010), MCARI (0.161), ARI2 (−0.023), NDRE (0.116), RENDVI (0.116), and CIred-edge (0.080) were consistently lower than those observed in M. oleifera.
3.4 Correlation analysis between spectral indices and medicinal score
The correlation matrix (Figure 5) illustrates the relationships between selected hyperspectral vegetation indices and the computed medicinal score for various plant species. Among the indices analyzed, NDVI showed a moderately strong positive correlation (r = 0.50) with medicinal score, indicating that vegetation vigor is associated with medicinal potential. Similarly, MCARI and RENDVI exhibited notable correlations with medicinal score (r = 0.44 and 0.40, respectively).
Figure 5. Correlation showing relationships between spectral indices and the calculated medicinal value across all plant species.
Other indices such as PRI (r = 0.31), SR (r = 0.29), and Clred-Edge (r = −0.10) displayed lower correlations, while ARI2 and NDRE were weakly and negatively correlated (r = −0.20 and −0.15, respectively), suggesting limited diagnostic relevance in predicting medicinal potential. These results identify NDVI, MCARI, and RENDVI as the most reliable spectral indicators of medicinal importance among the tested indices.
4 Discussion
While the previous section detailed the quantitative spectral differences among taxa, this section interprets those patterns in the context of plant structure and known medicinal attributes. Morphological characteristics, particularly leaf shape, margin, and apex, demonstrated marked differences among the species, supporting their taxonomic distinctiveness and aiding in spectral discrimination. For example, F. auriculata exhibited large, round-ovate leaves with a high single leaf area (460.5 cm2), contrasting sharply with the smaller, ovate leaves of F. microcarpa (35 cm2). These physical differences, alongside variations in bark color and growth form (tree vs. shrub), are important taxonomic tools.
Spectral reflectance of plant leaves is the absorption occurring at 650 nm in the visible red range. This absorption is mostly caused by chlorophyll pigments found in the green-leaf chloroplasts, which are found in the Palisade leaf’s outer layers. Furthermore, these spectra differ from white ones by having a similar degree of absorption in the blue band. As such, the majority of visible wavelength reflectance is found in the green area of the spectrum. According to Gamal et al. (2020), Khdery et al. (2021), Khdery et al. (2023), and Yones et al. (2024), given that all the samples are vegetative samples, the spectral reflectance pattern of the taxa under investigation, as depicted in Figure 2, revealed the same trend in spectrum reflectance.
The results show that every single plant species is highly compatible with the overall spectral signature, especially in different spectral regions like the visible and infrared light. Interestingly, it was found that, in comparison to the SWIR1 region, the SWIR II region had less reflectance (Aboelghar and Khdery, 2017).
The findings suggest that SWIR II wavelengths are particularly effective in discriminating among Ficus species, aligning with previous studies (Aboelghar et al., 2017). The visible region, especially the blue band, offered limited discriminatory power. Notably, species such as F. hispida and F. benjamina demonstrated characteristic high reflectance in the NIR region, which may reflect structural or biochemical traits.
Both Moringa spp. exhibited typical spectral behavior associated with healthy green vegetation, including low reflectance in the visible region (400–700 nm), a pronounced red edge near 700 nm, and strong reflectance in the NIR range.
Notably, distinct water absorption features were observed around 1,450 nm, 1,950 nm, and 2,500 nm, consistent with known water-related absorption bands. These differences between M. oleifera and M. peregrina in the NIR and SWIR regions may reflect variations in internal leaf structure, water content, or pigment concentration.
The spectral characteristics of plant species are influenced by their physiological, morphological, and anatomical traits (Gitelson et al., 2024). Species with large, thick, and dark leaves, such as F. benghalensis, exhibited higher NDVI and chlorophyll content, consistent with strong vegetative health and photosynthetic capacity. These findings align with previous work by Apan et al. (2003) and Uto and Kosugi (2012), who demonstrated the significant role of structural and pigment properties in shaping vegetation spectra.
The moderate NDVI and SR values recorded for F. asperrima may reflect average chlorophyll content and light absorption efficiency at the leaf level, suggesting moderate physiological performance relative to other Ficus species examined. Low PRI and MCARI, may indicate limited photosynthetic performance and average vegetation density. The negative ARI2 value suggests minimal anthocyanin presence, which could correlate with its relatively lower traditional medicinal use, such as in wound healing.
In contrast, F. racemosa displayed high MCARI and ARI2 values, indicating strong pigment concentration and photosynthetic activity. The moderate PRI and NDRE values suggest a balanced nitrogen status and moderate physiological stress. These spectral traits are in line with its well-documented anti-inflammatory and astringent properties in ethno medicine (Bhivasane et al., 2024). These spectral features are consistent with the species’ known pharmacological relevance; however, no direct link between these indices and specific medicinal functions is implied (Patel et al., 2023).
Our findings revealed significant correlations between spectral indices such as NDVI, MCARI, and ARI2 and the estimated medicinal score. These indices are known to reflect chlorophyll content, anthocyanin levels, and overall metabolic activity, which are closely tied to the presence of bioactive secondary metabolites (Gamon et al., 1992; Delegido et al., 2013). This supports previous studies suggesting that hyperspectral features can be used as non-destructive proxies for estimating the pharmacological relevance of plant species.
Notably, F. benghalensis demonstrated exceptional NDVI (0.945) and SR (39.3), along with high ARI2 (0.30), MCARI (0.51), and NDRE (0.61), indicative of robust pigment accumulation—including anthocyanins, chlorophyll, and nitrogen-associated pigments—suggesting strong physiological performance (Mascarini et al., 2006). These reflect its medicinal value in wound healing, antimicrobial, and antidiabetic applications.
F. benjamina exhibited high SR (25.47), CRI (24.91), and NDRE (0.55), indicating elevated structural and pigment-related reflectance features. Conversely, F. religiosa presented lower NDVI (0.104) and PRI (0.058), possibly suggesting environmental stress or reduced chlorophyll content. This trend was mirrored in its spectral indices, including weaker PSRI and CRI, making it less potent from a spectral and medicinal perspective (Khdery, 2020; Khdery et al., 2021; Khdery et al., 2023; Yones et al., 2019). The low NDVI and RENDVI values observed in F. religiosa may reflect poor chlorophyll content and possible physiological stress. Despite this, the species continues to be valued in herbal medicine, potentially due to the presence of non-photosynthetic phytochemicals (Dmitriev et al., 2023).
In F. auriculata, elevated CRI and PSRI values suggest strong carotenoid activity and potential onset of senescence. Moderate ARI2 and NDRE levels may indicate some antioxidant potential and nitrogen assimilation.
The low MCARI and negative ARI2 in F. hispida point to limited chlorophyll and anthocyanin content, possibly reflecting lower metabolic or photosynthetic activity in this species.
The red-edge indices (RENDVI and Clred-edge) further supported this differentiation, with healthier species showing higher values. This is in line with the red-edge’s established sensitivity to chlorophyll concentration and stress levels (Maxwell and Johnson, 2000; Zarco-Tejada et al., 2003).
Linear Discriminant Analysis (LDA) identified unique wavelength ranges specific to several Ficus species—especially F. hispida, F. racemosa, and F. religiosa—reinforcing the potential for hyperspectral separation of species with both taxonomic and pharmacological importance. These findings confirm that hyperspectral indices, when integrated with morphological features, provide a powerful tool for assessing medicinal plant potential among Ficus species (Khdery et al., 2021; Khdery et al., 2023). The differences observed in the reflectance spectra between M. peregrina and M. oleifera can be attributed to variations in leaf structure, water content, and pigment concentration. The higher reflectance values of M. oleifera in the NIR region suggest a denser or more scattering internal leaf structure compared to M. peregrina. This is consistent with the known characteristics of M. oleifera, which generally has thicker leaves and a higher water retention capacity.
Distinct absorption features around 1,450 nm, 1,950 nm, and 2,500 nm correspond to water absorption bands, and the depth of these features suggests slightly lower water content in M. peregrina. In the visible region, both species show low reflectance due to chlorophyll absorption, but M. oleifera reflects slightly more in the green (~550 nm), indicating higher chlorophyll content, consistent with its antioxidant and anti-inflammatory properties (AbdAlla et al., 2023; Tshabalala et al., 2021; Rébufa et al., 2017).
The spectral profile of M. oleifera, characterized by high NDVI, SR, reflects strong vegetative vigor and carotenoid presence. Moderate MCARI and high NDRE/RENDVI values may indicate robust chlorophyll expression and nitrogen content, supporting the species’ efficiency in photosynthesis and metabolism. These traits are consistent with its documented pharmacological applications in antioxidant defence and metabolic regulation.
In contrast, M. peregrina exhibited lower spectral index values across most parameters. Despite this, the negative PSRI and modest NDWI suggest healthy and hydrated foliage. Although the overall spectral intensity is lower than that of M. oleifera, M. peregrina still retains significance in specific traditional uses such as dermatological and anti-inflammatory treatments.
Morphologically, M. oleifera has darker, tripinnate leaves and a broader vegetation, contributing to stronger NIR reflectance, while M. peregrina has smaller, bipinnate, waxy leaves that may reduce internal scattering. This structure aligns with its adaptation to arid environments, as supported by the shallower water absorption features and higher NDWI (Taha, 2016).
Vegetation indices further confirm these differences: M. oleifera shows high NDVI, and NDRE values, consistent with superior pigment content and photosynthetic capacity, aligning with its broad therapeutic uses including hepatoprotection and metabolic regulation. M. peregrina, though lower in most indices, shows decent water retention and pigment signals, which support its application in dermatological and traditional remedies (Cheng et al., 2020). Spectral analysis of M. oleifera and M. peregrina indicated marked physiological divergence. M. oleifera exhibited high NDVI (0.487), SR (7.36) and NDRE (0.498), which are known to correlate with increased chlorophyll, carotenoid, and nitrogen content, respectively (Peñuelas et al., 1993; Gitelson et al., 2003; Zarco-Tejada et al., 2003; Peñuelas et al., 1995), as also outlined in Table 4. These parameters are consistent with its well-documented roles in antioxidant, hepatoprotective, and antidiabetic therapies (Dung et al., 2023).
These findings demonstrate that hyperspectral indices effectively distinguish Moringa spp. based on their physiological and structural features. While spectral traits showed potential associations with literature-based medicinal relevance, further targeted biochemical analyses are needed to establish direct pharmacological links. Overall, the vegetation indices corroborate the spectral reflectance results, highlighting that M. oleifera exhibits superior photosynthetic activity, pigment content, and structural health compared to Moringa peregrina, while M. peregrina may possess slight advantages in water retention under dry conditions.
The observed correlations between spectral indices and medicinal scores suggest preliminary associations between physiological activity and traditional medicinal relevance. While the correlation coefficients were moderate, they indicate that certain hyperspectral traits may reflect underlying biochemical or pharmacological properties, supporting their utility in exploratory screening applications. NDVI, which reflects chlorophyll density and biomass, showed a clear positive correlation with medicinal potential, supporting findings by Kizilgeci et al. (2021) that associate high NDVI with metabolic activity and secondary metabolite synthesis. MCARI, which emphasizes chlorophyll absorption in the red region, also correlated well with medicinal score, reinforcing its usefulness for detecting physiologically active plants (Gitelson et al., 2003). The strong association of RENDVI, which is sensitive to vegetation structure and red-edge changes, further validates its application in identifying medicinally significant species (Delegido et al., 2013; Colovic et al., 2022).
On the other hand, ARI2 and NDRE did not correlate strongly with medicinal value. These indices, although effective in assessing stress-related pigments and nitrogen status, may not reflect the specific biochemical profiles responsible for pharmacological effects. Similarly, PSRI’s negative correlation may be due to its association with senescence, which often reduces the biosynthesis of active compounds. These findings highlight the importance of selecting spectral indices aligned with physiological markers of medicinal relevance. NDVI, MCARI, and RENDVI emerge as priority tools for remote sensing-based medicinal plant screening.
It is worth noting that the current sampling strategy prioritized interspecific variation under controlled conditions. Future work with broader replication per species will allow intra-species variability assessments.
Also, to further enhance the interpretation of spectral–medicinal relationships, future work is encouraged to include direct phytochemical quantification and bioactivity assays. These analyses would complement the current literature-based scoring framework and provide stronger empirical validation for the use of hyperspectral indices in assessing medicinal potential.
Findings are reinforced by recent studies demonstrating the utility of hyperspectral remote sensing as a proxy for detecting plant biochemical traits relevant to medicinal potential. Boonrat et al. (2025) applied hyperspectral imaging combined with machine learning to dynamically map total phenolic and flavonoid contents in sunflower microgreens, achieving R2 values up to 0.97 for flavonoids—highlighting strong spectral correlations with secondary metabolite levels. Song and Wang (2022) developed a hyperspectral index that effectively tracks seasonal changes in the chlorophyll-to-carotenoid ratio in deciduous forests, showing strong relationships with field-measured pigment ratios. This study contributes to the growing body of literature advocating for non-destructive, spectral-based approaches to screen and prioritize medicinal plants for conservation and pharmacological research.
Spectral variation among species may reflect ecological adaptations, such as differences in leaf structure, water use, or stress tolerance. High NIR and red-edge reflectance often indicate traits linked to resilience and productivity. Such traits can guide conservation priorities, especially for species adapted to harsh or shifting environments (Corbin et al., 2025).
Also, Spectral variation among the studied species revealed insights into their ecological adaptations. For example, differences in NDWI and PRI values suggest varying water use strategies and photoprotective mechanisms, respectively. Such traits are particularly relevant in arid and semi-arid regions where physiological resilience is key to survival. These variations can serve as functional indicators for prioritizing species in conservation planning or selecting candidates for climate-resilient agriculture. Recent research confirms that hyperspectral data can effectively capture such traits and predict species responses to environmental stressors, thereby supporting their use in ecological monitoring and conservation strategies (Asner et al., 2015; Schneider et al., 2017).
5 Conclusion
This study demonstrates the utility of hyperspectral indices for taxonomic discrimination of plant species. While spectral traits were analyzed in relation to literature-derived medicinal relevance scores, further pharmacological and biochemical assays are required to substantiate any medicinal claims. This study demonstrated the effectiveness of integrating hyperspectral remote sensing with morphological analysis as a non-invasive approach for identifying medicinally relevant Ficus spp. and Moringa spp. based on their physiological Vigor and phytochemical potential. The reflectance spectra across the 350–2,500 nm range revealed species-specific spectral patterns, with the Near-Infrared (NIR) and Short-Wave Infrared (SWIR) regions being the most informative for spectral discrimination.
Among the Ficus spp., F. benghalensis and F. racemosa exhibited high NDVI, SR, and ARI2 values, indicating strong photosynthetic activity and accumulation of key pigments such as chlorophylls, carotenoids, and anthocyanins. These pigment profiles are consistent with physiological vigor and may be indirectly associated with the species’ reported medicinal properties, such as antimicrobial, wound healing, and anti-diabetic applications. F. benjamina also showed high reflectance in chlorophyll-and nitrogen-sensitive indices, supporting its documented antioxidant and anti-inflammatory roles. In contrast, F. religiosa displayed the lowest NDVI and NIR reflectance, suggesting reduced physiological vitality and possible environmental stress, consistent with its relatively limited pigment-based medicinal value. For the Moringa spp., M. oleifera consistently demonstrated higher NIR reflectance, NDVI, SR, and NDRE values compared to M. peregrina, reflecting greater leaf density, chlorophyll and carotenoid content, and nitrogen assimilation. These spectral traits are related strongly with its well-established pharmacological functions including antioxidant, hepatoprotective, and metabolic regulation. Conversely, M. peregrina, although spectrally less vigorous, showed spectral signals consistent with its drought tolerance and niche medicinal uses in dermatological and anti-inflammatory treatments. Morphologically, species with broader, darker leaves—such as F. benghalensis and M. oleifera—exhibited stronger spectral signatures, while species with narrower or waxy leaves—such as F. microcarpa and M. peregrina—reflected weaker signals. Absorption features near 1,450 nm, 1,950 nm, and 2,500 nm further revealed interspecific differences in leaf water content, particularly between the Moringa spp.
Vegetation indices such as NDVI, PSRI, MCARI, and RE-NDVI were significantly correlated with morphological traits like leaf area, apex shape, and pigmentation across all species. These findings reinforce the utility of hyperspectral imaging, combined with morphological observation, as a non-destructive and precise approach for identifying medicinally relevant plant species and prioritizing them for further pharmacological investigation.
Data availability statement
The original contributions presented in the study are included in the article/supplementary material, further inquiries can be directed to the corresponding author.
Author contributions
GK: Conceptualization, Data curation, Formal analysis, Investigation, Supervision, Methodology, Project administration, Resources, Software, Validation, Visualization, Writing – original draft, Writing – review & editing. MS: Conceptualization, Data curation, Writing – original draft. NR: Conceptualization, Data curation, Methodology, Writing – original draft. MH: Conceptualization, Data curation, Visualization, Writing – original draft.
Funding
The author(s) declare that financial support was received for the research and/or publication of this article. This publication has been supported by the RUDN University Scientific Projects Grant System, project No. 202786-2-000.
Acknowledgments
The authors would like to acknowledge the National Authority of Remote Sensing and Space Science (NARSS) in Cairo, Egypt. The authors would thank RUDN University as this publication has been supported by the RUDN University Scientific Projects Grant System, project No. 202786-2-000.
Conflict of interest
The authors declare that the research was conducted in the absence of any commercial or financial relationships that could be construed as a potential conflict of interest.
Generative AI statement
The authors declare that no Gen AI was used in the creation of this manuscript.
Any alternative text (alt text) provided alongside figures in this article has been generated by Frontiers with the support of artificial intelligence and reasonable efforts have been made to ensure accuracy, including review by the authors wherever possible. If you identify any issues, please contact us.
Publisher’s note
All claims expressed in this article are solely those of the authors and do not necessarily represent those of their affiliated organizations, or those of the publisher, the editors and the reviewers. Any product that may be evaluated in this article, or claim that may be made by its manufacturer, is not guaranteed or endorsed by the publisher.
References
Abd Rani, N. Z., Husain, K., and Kumolosasi, E. (2018). Moringa genus: a review of phytochemistry and pharmacology. Front. Pharmacol. 9:108. doi: 10.3389/fphar.2018.00108
AbdAlla, H. A., Wanga, V. O., Mkala, E. M., Amenu, S. G., Amar, M. H., Chen, L., et al. (2023). Comparative genomics analysis of endangered wild Egyptian Moringa peregrina (Forssk.) Fiori plastome, with implications for the evolution of Brassicales order. Front. Genet. 14:1131644. doi: 10.3389/fgene.2023.1131644
Abdi, H., and Williams, L. J. (2010). Principal component analysis. Wiley Interdisciplinary Reviews: Computational Statistics, 2, 433–459. doi: 10.1002/wics.101
Aboelghar, M. A., and Khdery, G. A. (2017). Spectroscopic and morphological characteristics of genus Jatropha (Euphorbiaceae) and genus jojoba (Simmondsiaceae). Asian J. Agric. Biol. 5, 280–290.Biol
Akhtar, N., Jafri, L., Green, B. D., Kalsoom, S., and Mirza, B. (2018). A multi-mode bioactive agent isolated from Ficus microcarpa L. Fill. with therapeutic potential for type 2 diabetes mellitus. Front. Pharmacol. 9:1376. doi: 10.3389/fphar.2018.01376
Akula, R., and Ravishankar, G. A. (2011). Influence of abiotic stress signals on secondary metabolites in plants. Plant Signal. Behav. 6, 1720–1731. doi: 10.4161/psb.6.11.17613
Anwar, F., Latif, S., Ashraf, M., and Gilani, A. H. (2007). Moringa oleifera: a food plant with multiple medicinal uses. Phytother. Res. 21, 17–25. doi: 10.1002/ptr.2023
Apan, A., Held, A., Phinn, S., and Markley, J. (2003). “Formulation and assessment of narrow-band vegetation indices from EO-1 Hyperion imagery for discriminating sugarcane disease” in Proceedings of the spatial sciences institute biennial conference (SSC 2003): spatial knowledge without boundaries. Canberra, Australia: Spatial Sciences Institute of Australia.
Asner, G. P., and Martin, R. E. (2008). Spectral and chemical analysis of tropical forests: scaling from leaf to canopy levels. Remote Sens. Environ. 112, 3958–3970. doi: 10.1016/j.rse.2008.07.003
Asner, G. P., Martin, R. E., Anderson, C. B., and Knapp, D. E. (2015). Quantifying forest canopy traits: imaging spectroscopy versus field survey. Remote Sens. Environ. 158, 15–27. doi: 10.1016/j.rse.2014.11.011
Aweke, G. (1979). Revision of the genus Ficus L.(Moraceae) in Ethiopia. Wageningen, Netherlands: Landbouwhogeschool (Wageningen Agricultural University).
Bhandari, A., Kumar, A., and Singh, G. (2012). Feature extraction using normalized difference vegetation index (NDVI): a case study of Jabalpur city. Proc. Technol. 6, 612–621. doi: 10.1016/j.protcy.2012.10.074
Bhivasane, S. R., Ahmad, S., More, H. S., Asatkar, D. S., Rathod, K. B., and Chavan, K. M. (2024). A Comprehensive Review on the Medicinal Properties and Pharmacological Potential of Ficus racemosa Linn. International Journal of Innovative Research & Technology, 11, 1945–1950. Available at: https://ijirt.org/article?manuscript=171036
Boonrat, P., Patel, M., Pengphorm, P., Detarun, P., and Daengngam, C. (2025). Hyperspectral imaging for the dynamic mapping of total phenolic and flavonoid contents in microgreens. Agri Eng. 7:107. doi: 10.3390/agriengineering7040107
Brickell, C. (2019). RHS encyclopedia of plants and flowers. London, United Kingdom: Dorling Kindersley Ltd.
Chandrasekar, S., Bhanumathy, M., Pawar, A., and Somasundaram, T. (2010). Phytopharmacology of Ficus religiosa. Phcog. Rev. 4, 195–199. doi: 10.4103/0973-7847.70918
Cheng, J.-X., Zhang, B.-D., Zhu, W.-F., Zhang, C.-F., Qin, Y.-M., Abe, M., et al. (2020). Traditional uses, phytochemistry, and pharmacology of Ficus hispida Lf: a review. J. Ethnopharmacol. 248:112204. doi: 10.1016/j.jep.2019.112204
Clark, M. L., Roberts, D. A., and Clark, D. B. (2005). Hyperspectral discrimination of tropical rain forest tree species at leaf to crown scales. Remote Sens. Environ. 96, 375–398. doi: 10.1016/j.rse.2005.03.009
Clevers, J. G., and Kooistra, L. (2011). Using hyperspectral remote sensing data for retrieving canopy chlorophyll and nitrogen content. IEEE J. Sel. Top. Appl. Earth Obs. Remote Sens. 5, 574–583. doi: 10.1109/JSTARS.2011.2176468
Colovic, M., Yu, K., Todorovic, M., Cantore, V., Hamze, M., Albrizio, R., et al. (2022). Hyperspectral vegetation indices to assess water and nitrogen status of sweet maize crop. Agronomy 12:2181. doi: 10.3390/agronomy12092181
Corbin, J. P., Best, R. J., Garthwaite, I. J., Cooper, H. F., Doughty, C. E., Gehring, C. A., et al. (2025). Hyperspectral leaf reflectance detects interactive genetic and environmental effects on tree phenotypes, enabling large-scale monitoring and restoration planning under climate change. Plant Cell Environ. 48, 1842–1857. doi: 10.1111/pce.15263
Daughtry, C. S., Walthall, C., Kim, M., De Colstoun, E. B., and McMurtrey Iii, J. (2000). Estimating corn leaf chlorophyll concentration from leaf and canopy reflectance. Remote Sens. Environ. 74, 229–239. doi: 10.1016/S0034-4257(00)00113-9
Delegido, J., Verrelst, J., Meza, C., Rivera, J., Alonso, L., and Moreno, J. (2013). A red-edge spectral index for remote sensing estimation of green LAI over agroecosystems. Eur. J. Agron. 46, 42–52. doi: 10.1016/j.eja.2012.12.001
Diwan, B., Youssef, T., Magid, A., and Khalifa, S. (2004). Plant atlas of botanical gardens in Cairo and Giza, vol. 588. Cairo: General Egyptian Organization for Books.
Dmitriev, P. A., Kozlovsky, B. L., Dmitrieva, A. A., Lysenko, V. S., Chokheli, V. A., and Varduni, T. V. (2023). Indication of light stress in Ficus elastica using hyperspectral imaging. AgriEngineering 5, 2253–2265. doi: 10.3390/agriengineering5040138
Dung, C. D., Trueman, S. J., Wallace, H. M., Farrar, M. B., Gama, T., Tahmasbian, I., et al. (2023). Hyperspectral imaging for estimating leaf, flower, and fruit macronutrient concentrations and predicting strawberry yields. Environ. Sci. Pollut. Res. 30, 114166–114182. doi: 10.1007/s11356-023-30344-8
EI-Domiaty, M., Abdel-Aal, M., Abou-Hashem, M., and Abd-Alla, R. (2002). Phytochemical and biological study of Ficus elastica roxb. var. decora growing in Egypt. Zagazig J. Pharm. Sci. 11, 34–45. doi: 10.21608/zjps.2002.178962
Elbatran, S. A., Abdel-Salam, O. M., Abdelshfeek, K. A., Nazif, N. M., Ismail, S. I., and Hammouda, F. M. (2005). Phytochemical and pharmacological investigations on Moringa peregrina (Forssk) Fiori. Nat. Prod. Sci. 11, 199–206.
Fahey, J. W. (2005). Moringa oleifera: a review of the medical evidence for its nutritional, therapeutic, and prophylactic properties. Part 1. Trees Life J. 1, 1–15.
Feret, J.-B., François, C., Asner, G. P., Gitelson, A. A., Martin, R. E., Bidel, L. P., et al. (2008). PROSPECT-4 and 5: advances in the leaf optical properties model separating photosynthetic pigments. Remote Sens. Environ. 112, 3030–3043. doi: 10.1016/j.rse.2008.02.012
Gaire, B. P., Lamichhane, R., Sunar, C. B., Shilpakar, A., Neupane, S., and Panta, S. (2011). Phytochemical screening and analysis of antibacterial and antioxidant activity of Ficus auriculata (lour.) stem bark. Pharm. J. 3, 49–55. doi: 10.5530/pj.2011.21.8
Gamal, E., Khdery, G., Morsy, A., Ali, M., Hashim, A., and Saleh, H. (2020). GIS based modelling to aid conservation of two endangered plant species (Ebenus armitagei and Periploca angustifolia) at Wadi Al-Afreet, Egypt. Remote Sens. Appl. Soc. Environ. 19:100336. doi: 10.1016/J.RSASE.2020.100336
Gamon, J., Penuelas, J., and Field, C. (1992). A narrow-waveband spectral index that tracks diurnal changes in photosynthetic efficiency. Remote Sens. Environ. 41, 35–44. doi: 10.1016/0034-4257(92)90059-S
Gao, B.-C. (1996). “Normalized difference water index for remote sensing of vegetation liquid water from space” in Imaging spectrometry (Bellingham, Washington, United States: SPIE (The International Society for Optical Engineering)), 257–266.
Gitelson, A. A., Gritz, Y., and Merzlyak, M. N. (2003). Relationships between leaf chlorophyll content and spectral reflectance and algorithms for non-destructive chlorophyll assessment in higher plant leaves. J. Plant Physiol. 160, 271–282. doi: 10.1078/0176-1617-00887
Gitelson, A. A., Merzlyak, M. N., and Chivkunova, O. B. (2001). Optical properties and nondestructive estimation of anthocyanin content in plant leaves. Photochem. Photobiol. 74, 38–45. doi: 10.1562/0031-8655(2001)074<0038:opaneo>2.0.co;2 photobiology
Gitelson, A. A., Zygielbaum, A. I., Arkebauer, T. J., Walter-Shea, E. A., and Solovchenko, A. (2024). Stress detection in vegetation based on remotely sensed light absorption coefficient. Int. J. Remote Sens. 45, 259–277. doi: 10.1080/01431161.2023.2295837
Hamdy, R. S., Abd El-Ghani, M., Youssef, T., and El-Sayed, M. (2007). The floristic composition of some historical botanical gardens in the metropolitan of Cairo, Egypt. Afr. J. Agric. Res. 2, 610–648.
Homolová, L., Malenovský, Z., Clevers, J. G., García-Santos, G., and Schaepman, M. E. (2013). Review of optical-based remote sensing for plant trait mapping. Ecol. Complex. 15, 1–16. doi: 10.1016/j.ecocom.2013.06.003
Imran, M., Rasool, N., Rizwan, K., Zubair, M., Riaz, M., Zia-Ul-Haq, M., et al. (2014). Chemical composition and biological studies of Ficus benjamina. Chem. Cent. J. 8, 1–10. doi: 10.1186/1752-153X-8-12
Isah, T. (2019). Stress and defense responses in plant secondary metabolites production. Biol. Res. 52:39. doi: 10.1186/s40659-019-0246-3
Jarocińska, A. M., Kacprzyk, M., Marcinkowska-Ochtyra, A., Ochtyra, A., Zagajewski, B., and Meuleman, K. (2016). The application of APEX images in the assessment of the state of non-forest vegetation in the Karkonosze Mountains. Reg. Stud. Dev. 20, 21–27. doi: 10.1515/mgrsd-2016-0009
Joseph, B., and Raj, S. J. (2010). Phytopharmacological and phytochemical properties of three Ficus species-an overview. J. Pharma Bio. Sci. 1, 246–253.
Kacholi, D. S. (2014). Analysis of structure and diversity of the Kilengwe Forest in the Morogoro region, Tanzania. Biodivers. J. 2014:516840. doi: 10.1155/2014/516840
Khdery, G. A. (2020). “Remote sensing technology and its applications in pathology” in Emerging trends in plant pathology. eds. K. P. Singh, S. Jahagirdar, and B. K. Sarma (Singapore: Springer).
Khdery, G. A., Helal, N., and Saleh, H. (2023). Using hyperspectral indices for investigation polluted plants and soil in Abu Zabaal area, Egypt. Acta Ecol. Sin. 43, 776–784. doi: 10.1016/j.chnaes.2022.10.006
Khdery, G., Yones, M., and Science, S. (2021). Innovative spectral library for identification common wild plants using hyperspectral technology in Northwestern coast, Egypt. Egypt. J. Remote Sens. Space Sci. 24, 485–491. doi: 10.1016/j.ejrs.2020.08.002
Kizilgeci, F., Yildirim, M., Islam, M. S., Ratnasekera, D., Iqbal, M. A., and Sabagh, A. E. (2021). Normalized difference vegetation index and chlorophyll content for precision nitrogen management in durum wheat cultivars under semi-arid conditions. Sustainability 13:3725. doi: 10.3390/su13073725
Kycko, M., Zagajewski, B., and Kozłowska, A. (2014). Variability in spectral characteristics of trampled high-mountain grasslands. Misc. Geogr. Reg. Stud. Dev. 18, 10–14. doi: 10.2478/mgrsd-2014-0003
Logesh, R., Sathasivampillai, S. V., Varatharasan, S., Rajan, S., Das, N., Pandey, J., et al. (2023). Ficus benghalensis L.(Moraceae): a review on ethnomedicinal uses, phytochemistry and pharmacological activities. Curr. Res. Biotechnol. 6:100134. doi: 10.1016/j.crbiot.2023.100134
Mabberley, D. J. (1987). The plant‑book: A portable dictionary of the vascular plants. Cambridge University Press.
Mascarini, L., Lorenzo, G. A., and Vilella, F. J. (2006). Leaf area index, water index, and red: far red ratio calculated by spectral reflectance and its relation to plant architecture and cut rose production. J. Am. Soc. Hortic. Sci. 131, 313–319. doi: 10.21273/JASHS.131.3.313
Maxwell, K., and Johnson, G. N. (2000). Chlorophyll fluorescence—a practical guide. J. Exp. Bot. 51, 659–668. doi: 10.1093/jxb/51.345.659
Merzlyak, M. N., Gitelson, A. A., Chivkunova, O. B., and Rakitin, V. Y. (1999). Non-destructive optical detection of pigment changes during leaf senescence and fruit ripening. Physiol. Plant. 106, 135–141. doi: 10.1034/j.1399-3054.1999.106119.x
Mohamed, N. H., El-Shanhorey, N. A., and Elsayed, S. E. (2018). Remotely identification and differentiation of Ficus species in Alexandria City using spectral reflectance measurements. Alex. Sci. Exch. J 39, 629–641. doi: 10.21608/asejaiqjsae.2018.19584
Mridha, M. J. (2015). Prospects of moringa cultivation in Saudi Arabia. J. Appl. Environ. Biol. Sci. 5, 39–46.
Murugesu, S., Selamat, J., and Perumal, V. (2021). Phytochemistry, pharmacological properties, and recent applications of Ficus benghalensis and Ficus religiosa. Plants 10:2749. doi: 10.3390/plants10122749
National Research Council, Global Affairs, Office of International Affairs, Board on Science, and Technology for International Development (1996). Lost crops of Africa: volume I: grains : National Academies Press.
Nowak, D. J., and Dwyer, J. F. (2007). “Understanding the benefits and costs of urban forest ecosystems” in Urban and community forestry in the northeast (Dordrecht: Springer Netherlands), 25–46.
Padilla, F., González-Dugo, M., Gavilán, P., Domínguez, J. J. H., and Sciences, E. S. (2011). Integration of vegetation indices into a water balance model to estimate evapotranspiration of wheat and corn. Hydrol. Earth Syst. Sci. 15, 1213–1225. doi: 10.5194/hess-15-1213-2011
Patel, M. H., Malek, S., Patel, V., Desai, B., Jha, S., and Patel, D. (2023). Chemical composition and tannin content in leaves of Ficus spp. as top feed for ruminants from the Dang forest of South Gujarat Province, India. Int. J. Vet. Sci. Animal Husband. 8, 225–228. doi: 10.22271/veterinary.2023.v8.i3d.548
Peñuelas, J., Filella, I., Biel, C., Serrano, L., and Save, R. (1993). The reflectance at the 950–970 nm region as an indicator of plant water status. Int. J. Remote Sens. 14, 1887–1905. doi: 10.1080/01431169308954010
Peñuelas, J., Baret, F., and Filella, I. (1995). Semi‑empirical indices to assess carotenoids/chlorophyll‑a ratio from leaf spectral reflectance.. Photosynthetica 31, 221–230.
Rasool, I. F. U., Aziz, A., Khalid, W., Koraqi, H., Siddiqui, S. A., Al-Farga, A., et al. (2023). Industrial application and health prospective of fig (Ficus carica) by-products. Molecules 28:960. doi: 10.3390/molecules28030960
Rébufa, C., Pany, I., Dupuy, N., and Bombarda, I. (2017). “Infrared spectroscopy for the characterization and quality control of Moringa oleifera: a multivariate approach” in I international symposium on Moringa. Leuven, Belgium: International Society for Horticultural Science (ISHS). 1158, 397–404.
Sandhu, A. K., Islam, M., Edirisinghe, I., and Burton-Freeman, B. (2023). Phytochemical composition and health benefits of figs (fresh and dried): a review of literature from 2000 to 2022. Nutrients 15:2623. doi: 10.3390/nu15112623
Schneider, F. D., Morsdorf, F., Schmid, B., Petchey, O. L., Hueni, A., Schimel, D. S., et al. (2017). Mapping functional diversity from remotely sensed morphological and physiological forest traits. Nat. Commun. 8:1441. doi: 10.1038/s41467-017-01530-3
Sharma, H., Pathak, R., Jain, S., Bhandari, M., Mishra, R., Reena, K., et al. (2023). Ficus racemosa L: a review on its important medicinal uses, phytochemicals and biological activities. J. Popul. Ther. Clin. Pharmacol. 30, 213–227.
Sims, D. A., and Gamon, J. A. (2002). Relationships between leaf pigment content and spectral reflectance across a wide range of species, leaf structures and developmental stages. Remote Sens. Environ. 81, 337–354. doi: 10.1016/S0034-4257(02)00010-X
Smith, P., Price, J., Molotoks, A., Warren, R., and Malhi, Y. (2018). Impacts on terrestrial biodiversity of moving from a 2 C to a 1.5 C target. Philos. Trans. R. Soc. A Math. Phys. Eng. Sci. 376:20160456. doi: 10.1098/rsta.2016.0456 Physical, and Sciences, E
Song, G., and Wang, Q. (2022). Developing hyperspectral indices for assessing seasonal variations in the ratio of chlorophyll to carotenoid in deciduous forests. Remote Sens 14:1324. doi: 10.3390/rs14061324
Taha, R. (2016). Improving salt tolerance of Helianthus annuus (L.) plants by Moringa oleifera leaf extract. Egypt J. Agron. 38, 117–140. doi: 10.21608/agro.2016.301
Thenkabail, P. S., Smith, R. B., and De Pauw, E. (2000). Hyperspectral vegetation indices and their relationships with agricultural crop characteristics. Remote Sens. Environ. 71, 158–182. doi: 10.1016/S0034-4257(99)00067-X
Tshabalala, T., Abdel-Rahman, E. M., Masemola, C., Ncube, B., Ndhlala, A. R., and Mutanga, O. (2021). Predicting medicinal phytochemicals of Moringa oleifera using hyperspectral reflectance of tree canopies. Int. J. Remote Sens. 42, 3955–3980.
Ustin, S. L., Roberts, D. A., Gamon, J. A., Asner, G. P., and Green, R. O. (2004). Using imaging spectroscopy to study ecosystem processes and properties. Bio Sci. 54, 523–534.
Uto, K., and Kosugi, Y. (2012). Hyperspectral manipulation for the water stress evaluation of plants. Contemp. Mater. 3, 18–25. doi: 10.7251/COM1201018U
van Staden, A. B., and Lall, N. (2020). “Ficus lutea” in Underexplored medicinal plants from sub-Saharan Africa (London, United Kingdom: Elsevier, Academic Press), 133–138.
Wang, X., Wang, X., Song, R., Zhao, X., and Zhao, K. (2023). MCT-net: multi-hierarchical cross transformer for hyperspectral and multispectral image fusion. Knowl.-Based Syst. 264:110362. doi: 10.1016/j.knosys.2023.110362
Xu, L., Myneni, R., Chapin Iii, F., Callaghan, T. V., Pinzon, J., Tucker, C. J., et al. (2013). Temperature and vegetation seasonality diminishment over northern lands. Nat. Clim. Chang. 3, 581–586. doi: 10.1038/nclimate1836
Yang, L., Wen, K.-S., Ruan, X., Zhao, Y.-X., Wei, F., and Wang, Q. (2018). Response of plant secondary metabolites to environmental factors. Molecules 23:762. doi: 10.3390/molecules23040762
Yones, M., Aboelghar, M., Khdery, G., Farag, E., Ali, A., Salem, N., et al. (2019). Spectral measurements for monitoring of sugar beet infestation and its relation with production. Asian J. Agric. Biol. 7, 386–395. doi: 10.1117/12.2528300
Yones, M., Khdery, G. A., Aboelghar, M., Kadah, T., and Ma'moun, S. A. M. (2024). Early detection of the Mediterranean fruit Fly, Ceratitis capitata (Wied.) in oranges using different aspects of remote sensing applications. Egypt. J. Remote Sens. Space Sci. 9, 798–806.
Zagajewski, B., Tømmervik, H., Bjerke, J. W., Raczko, E., Bochenek, Z., Kłos, A., et al. (2017). Intraspecific differences in spectral reflectance curves as indicators of reduced vitality in high-arctic plants. Remote Sens 9:1289. doi: 10.3390/rs9121289
Keywords: remote sensing, hyperspectral indices, Ficus spp., Moringa spp., medicinal plants, plant morphology
Citation: Khdery GA, Shokr MS, Rebouh NY and Hewidy M (2025) Spectral and morphological discrimination of Ficus and Moringa species with medical and nutritional relevance: toward sustainable plant utilization. Front. Sustain. Food Syst. 9:1652332. doi: 10.3389/fsufs.2025.1652332
Edited by:
Danijel Jug, Josip Juraj Strossmayer University of Osijek, CroatiaReviewed by:
Okon Godwin Okon, Akwa Ibom State University, NigeriaEbrahim Jahanshiri, Crops for the Future UK, United Kingdom
Alfredo Esparza Orozco, Autonomous University of Zacatecas, Mexico
Abha Shukla, Gurukul Kangri (Deemed to be University) – Kanya Gurukul Campus Haridwar, India
Copyright © 2025 Khdery, Shokr, Rebouh and Hewidy. This is an open-access article distributed under the terms of the Creative Commons Attribution License (CC BY). The use, distribution or reproduction in other forums is permitted, provided the original author(s) and the copyright owner(s) are credited and that the original publication in this journal is cited, in accordance with accepted academic practice. No use, distribution or reproduction is permitted which does not comply with these terms.
*Correspondence: Ghada A. Khdery, Z2hhZGEuYWxpQG5hcnNzLnNjaS5lZw==; Mohamed S. Shokr, bW9oYW1lZF9zaG9rckBhZ3IudGFudGEuZWR1LmVn