 Panpan Guo
 Zhuangzhuang Qiu
- School of Public Health, Jining Medical University, Jining, China
Introduction: This study aimed to investigate the effect of antioxidant activities of lotus leaf powder (LLP) with different particle sizes on the shelf-life of green wheat leaf beverage (GWLB), so as to provide a theoretical basis for improving the quality and extending the shelf-life of GWLB This study aimed to investigate the effect of antioxidant activities of lotus leaf powder (LLP) with different particle sizes on the shelf-life of green wheat leaf beverage (GWLB), so as to provide a theoretical basis for improving the quality and extending the shelf-life of GWLB.
Methods: Oven-dried LLP was used as the experimental material, and different concentrations (0%, 0.25%, 0.5%, and 1%) of LLP were added to GWLB respectively. The total phenolic compounds (TPCs), 1,1-diphenyl-2-picrylhydrazyl (DPPH) radical scavenging activity, ferrous iron chelating activity (FICA), and ferric reducing power ability (FRPA) of LLP dried at 60 °C were determined. Meanwhile, the pH value, total bacterial count, color indicators (lightness, yellowness, redness), soluble solids content, suspension stability, and antioxidant activity of GWLB with different LLP additions were monitored during storage.
Results: Among all LLP treatments, the LLP dried at 60 °C had the highest levels of TPCs (7.57 g/100 g), DPPH radical scavenging activity (18.76–44.69%), FICA (57.26–79.03%), and FRPA (0.76–1.33 O.D.). After adding LLP to GWLB, the antioxidant capacity of GWLB was enhanced, the pH value was lower, and the number of microorganisms was reduced. Specifically, the pH value of GWLB with 1% T1LLPS (a type of LLP) added was 7.26, while that of GWLB without T1LLPS added was 7.69. On the third day of storage, the total bacterial count of GWLB without T1LLPS added was 2.11 Log CFU/mL, whereas that of GWLB with 1% T1LLPS added was less than 2.00 Log CFU/mL. In addition, the lightness, yellowness values, and soluble solids contents of GWLB increased after LLP addition, while the redness values and suspension stability decreased. During storage, the GWLB with 1% LLP added showed the highest antioxidant activity among all treatment groups.
Discussion: The addition of LLP can effectively improve the antioxidant capacity of GWLB, inhibit the growth of microorganisms, and adjust the physical and chemical properties of GWLB (such as pH value, color, and soluble solids content). Among all concentrations, 1% LLP addition exhibited the best effect, which not only had the highest antioxidant activity during storage but also significantly extended the shelf-life of GWLB. This indicates that LLP has good application potential in the processing and preservation of GWLB.
1 Introduction
There is an increasing interest in substituting synthetic food antioxidants with natural materials. Plant contains numerous compounds with antioxidant activity, which has spurred the research on plant sources and the screening of raw materials to identify novel antioxidants (Moure et al., 2001; Miao et al., 2025). A large number of low-molecular-weight and high-molecular-weight plant polyphenols with antioxidant properties have been studied, and it has been suggested that they can prevent lipid oxidation (Hagerman et al., 1998; Liu et al., 2024). The lotus leaf, whose scientific name is also called Nelumbo nucifera, which is rich in alkaloids, flavonoids, and polyphenolic compounds (Kuzmishyna, 2024). Lotus leaf exhibits a wide range of pharmacological and physiological activities (Chen et al., 2020; Hao et al., 2024). In addition, lotus leaf extract exhibits scavenging activities against free radicals and hydroxyl radicals, metal-binding ability, and reducing capacity. This may partly explain the mechanism underlying the ability of the extract to protect cells from oxidative damage (Wu et al., 2003).
Previous studies have not investigated the combined effects of lotus leaf particle size and drying temperature on the shelf-life of green wheat beverages. At the same time, green wheat leaves are rich in dietary fiber, combining lotus leaf powder (LLP) with GWLB in beverage formulations can complement each other’s advantages. The rich bioactive compounds of lotus leaves made up for the nutritional limitations of GWLB, which not only enhanced the sensory profile, but also improved functional properties of blood pressure regulation, weight management, and lipid-lowering effects (Zhou et al., 2021; Zheng et al., 2024).
Hot air drying is simple and convenient to operate, energy efficiency, and wide applicability and it has a great impact on the quality of dried products (Lewicki, 2006; Onwude et al., 2016). The retention of polyphenols in fruits and vegetables is closely related to the processing temperature and particle size (Cao et al., 2021). Therefore, selecting an appropriate drying temperature and particle size is crucial for maintaining the quality of fruit and vegetable powders (Karam et al., 2016).
The objective of this study was to investigate the effects of differently processed LLP on the functional properties of GWLB and to determine its optimal incorporation level. The results demonstrated that small-particle LLP dried at 60 °C significantly enhanced the antioxidant activity and antimicrobial properties of the beverage.
2 Materials and methods
2.1 Preparation of various lotus leaf powder (LLP)
300 g of fresh lotus leaves were hot-air dried at 60 °C, 80 °C and 100 °C, respectively, (DHG-9070A, Shanghai Yiheng Scientific Instruments Co., Ltd), with the drying endpoint determined when a 10 g sample maintained constant mass after 5 min at room temperature. The drying durations were 6.55 h at 60 °C, 3.85 h at 80 °C, and 2.12 h at 100 °C. The final moisture content measured by oven-drying gravimetric method was 3.80%, with an average sample loading rate of 12.30%. Then a grinder (1180B, Annos Electric Factory in Dongfeng Town, Zhongshan City) was used to grind. Furthermore, LLP was sieved to three particle sizes: large particle sizes: >500 μm, medium particle sizes: 150–500 μm and small particle sizes: <150 μm and stored in the refrigerator (YC-330, Aucma) at −18 °C.
2.2 Preparation of green wheat leaf beverages cooperated with different concentrations of small particle sizes LLP dried at 60 °C (T1LLPSGWLB)
Green wheat leaf powder (1%, w/v), sodium benzoate (0.02%, w/v), sodium bicarbonate (0.02%, w/v), xanthan gum (0.05%, w/v), and D-sodium ascorbate (0.05%, w/v) were put into four tea bags based on the total volume of the beverage (1,000 mL). Then 0, 0.25, 0.5 and 1.0% (w/v) of LLP (<150 μm) dried at 60 °C (T1) were mixed into each tea bags, respectively. Four tea bags were individually placed in bottles containing 1,000 mL of drinking water and placed in a 75 °C water bath (HH-420, Licheng Technology) for 30 min. Then, each supernatant was bottled after centrifuging (TDL-40B, Bai Ou) at 3,000 rpm for 2 min. Each bottled T1LLPSGWLB was refrigerated at 4 °C before using.
2.3 Antioxidant activities of LLP
The method of total phenolic compounds (TPCs), DPPH free radical scavenging rate (DPPH), ferrous iron chelating ability (FICA) and ferric reducing power ability (FRPA) were determined by Kim and Chin (2016) and modified slightly.
The determination of TPCs for LLP was conducted as follows. 0.1 g of each LLP was weighed and placed in 10 mL of deionized distilled water (dd-water). After thorough mixing, it was centrifuged. The supernatant was then diluted to prepare 1, 0.5, 0.25, and 0.1% (w/v) sample solutions.
Then, 100 μL of the sample supernatant was pipetted and added with 2.8 mL of dd-water, 2 mL of 2% sodium carbonate, and 100 μL of 50% Folin–Ciocalteu reagent. After standing for 30 min, the absorbance was measured at a wavelength of 750 nm, dd-water was used instead of the sample as the blank control. The experiment was repeated in triplicate, and absorbance values were recorded. Gallic acid was used as the standard (with a concentration range of 0–200 mg/L). The standard curve equation was y = 0.001134x + 0.008350, with an R2 = 0.9969.
The determination of DPPH was conducted with ascorbic acid (AA) as a reference. 1 mL of the diluted LLP solution was taken and added with 2 mL of DPPH (0.1 mmol/L). The sample was placed in the dark for 30 min, and then the absorbance was measured at a wavelength of 517 nm. Meanwhile, 0.5 mL of methanol was used to substitute the sample and added to 2 mL of DPPH, with the absorbance measured under the same conditions and repeated three times in parallel. The scavenging ability (%) of the LLP extract against DPPH was calculated according to the following Equation (1):
• ΔAcontrol: Absorbance difference of samples between the control group and the blank group.
• ΔAsample: Absorbance difference of samples between the experimental group and the blank group.
For the study of FICA, 0.5 mL of the above diluted solution was taken, and then added 0.5 mL of dd-water, 100 μL of ferrous chloride (0.6 mmol/mL), 0.9 mL of methanol, and 100 μL of ferrozine (5 mmol L−1 in methanol). Standing for 10 min, the absorbance was measured at a wavelength of 562 nm. Ethylenediaminetetraacetic acid (EDTA) was used as the reference. In the control group, the ferrozine was replaced with methanol, and the absorbance value was measured under the same conditions. All the operations were carried out in parallel three times, and a blank group without the sample was set up. The calculation method of the chelating activity (%) was as follows, according to Equation (2):
• ΔAcontrol: Absorbance difference of samples between the control group and the blank group.
• ΔAsample: Absorbance difference of samples between the experimental group and the blank group.
For the determination of FRPA for LLP, similarly, 2.5 mL of the sample diluted solution (with AA as the reference) was put into test tube. Then 2.5 mL of 200 mmol/L phosphate buffer (pH = 6.6) was added and mixed well, followed by 2.5 mL of 10% potassium ferricyanide. The mixture was incubated in a constant temperature incubator at 50 °C for 20 min, then centrifuged at 2,000 rpm for 10 min. 2.5 mL of each supernatant was taken into a test tube. In the experimental group, 2.5 mL of dd-water and 0.5 mL of ferric chloride (1 mg mL−1) were added, while in the control group, 3 mL of dd-water was added. After 10 min, the absorbance was measured at 700 nm. The reducing capacity of the LLP was calculated by the following Equation (3):
• Acontrol: Absorbance of control group.
• Asample: Absorbance of the experimental group.
2.4 Antioxidant activities for T1LLPSGWLB
For the detection of the T1LLPSGWLB, the method in 2.1 was referred to. 10 mL of T1LLPSGWLB was taken, centrifuged at 3,000 rpm for 2 min, and the supernatant was collected as a sample. Subsequently, it was diluted with dd-water to prepare solutions with concentrations of 1, 0.5, 0.25, and 0.1% (v/v) and the experimental procedures were carried out according to the above-mentioned methods for determining TPCs, DPPH, FICA, and FRPA. And all measured values must be subtracted by the values of the blank group.
2.5 pH, and color values for T1LLPSGWLB
The pH values of the T1LLPSGWLB were randomly measured using a pH meter (pHS-3C, Owike), repeated 5 times and recorded. The color values consisting of the lightness (L*), redness (a*) and yellowness (b*) was measured by color reader (CR-10plus) and repeated six times. The changes in pH and color values of the T1LLPSGWLB on days 0, 3, 7, 14, 21, 28, and 35 were also recorded. Seven sets of separate samples representing different storage periods were prepared on day 0 and measured on their respective designated storage days.
2.6 Soluble solids contents (SSC) and suspension stability (SS) for T1LLPSGWLB
The SSC of the T1LLPSGWLB on days 0, 3, 7, 14, 21, 28, and 35 were determined and recorded with a handheld refractometer, referring to the method of Ranganna (1986).
According to the SS measurement procedure of Muhammad et al. (2021) with slight modifications, the prepared T1LLPSGWLB of different formulations were diluted 5 times. Their absorbance values M0 were measured at 550 nm. After centrifuging at 3,000 rpm for 2 min, they were diluted by the same multiple, and their absorbance values were measured under the same conditions, recorded as M1. The results were calculated according to the following Equation (4):
2.7 Microbial counts for T1LLPSGWLB
According to the method of Qiu and Chin (2022) and modify it slightly. The 10 mL sample was mixed with 90 mL of dd-water, and then 0.1 mL of the mixed sample was evenly spread on total bacterial counts (TBCs) and enterobacteriaceae counts (EBCs) plates, respectively, the total number of bacteria and the number of EBCs was determined. The TBCs were prepared using plate count agar medium (AOBOXING, Beijing), while the EBCs were prepared using violet red bile agar (AOBOXING, Beijing). The TBCs and EBCs were determined after cultivation at 37 °C for 24 h, and the colony count unit is Log CFU/mL.
2.8 Sensory evaluation for T1LLPSGWLB
Referring to the method of Ozarda et al. (2015) and slightly modifying it. Sensory evaluation was conducted on GWLB samples supplemented with 0, 0.25, 0.5, and 1% T1LLPS, respectively. The appearance, color, palate, taste, smell and overall acceptability were used as the evaluation criteria, with a total score of 9 points (9—Excellent, 8—Extremely good, 7—Very good, 6—Moderately good, 5—Good, 4—Fair, 3—Very fair, 2—Poor, 1—Very poor). A sensory evaluation team consisting of 60 food students (30 men and 30 women) with experience in tasting will conduct sensory evaluations. The panelists consisted exclusively of food science students with no sensory impairments, all of whom underwent professional taste and olfactory training. Samples were presented in identical containers with a fully randomized serving order. Each sample was evaluated in triplicate, and the mean values were calculated for statistical analysis.
2.9 Statistical analysis
The variance analysis of the experimental data was used the SPSS 27.0 software package. Among them, the one-way analysis of variance (ANOVA) was used for the analysis of the TPCs of the LLP and the T1LLPSGWLB, with the different treatments of LLP as the main factor. The two-way ANOVA was applied to the analysis of DPPH, FICA and FRPA of LLP and T1LLPSGWLB, taking the treatments and concentrations as the main factors. In addition, the two-way ANOVA was also adopted for the analysis of pH, color, SS, SSC, TBCs and EBCs of T1LLPSGWLB, with the addition of T1LLPS and storage as the main factors. The Duncan’s multiple range test was used to determine the significance of differences at the 5% significance level.
3 Results and discussion
3.1 TPCs for lotus leaf powder (LLP)
As can be seen from Figure 1, The TPCs of LLP dried at 60 °C were significantly higher than those at 80 °C and 100 °C (p < 0.05), under the condition of consistent small particle size (SPS), the TPCs of LLP dried with 60 °C hot air was (7.57 ± 0.12 g/100 g), while that dried at 80 °C was (6.79 ± 0.13 g/100 g), and that dried at 100 °C was (5.80 ± 0.18 g/100 g). The observed result was primarily linked to the Maillard reaction under high temperatures. Elevated temperatures promoted the generation of Maillard reaction products, which likely modified the composition and concentration of extracted polyphenols (Antony and Farid, 2022). In this study, the highest TPCs were recorded in the 60 °C drying group, as the Maillard reaction was minimized at this temperature, resulting in less alteration to the polyphenolic profile and greater retention of phenolic compounds. The effect of heat treatment on the leaching of polyphenols in apple parenchyma, too high temperature will lead to the destruction of polyphenol components in apple parenchyma and reduce the phenolic content (Kebe et al., 2015). At the same drying temperature, the TPCs increased with the decrease of LLP particles. Pairwise comparisons among all particle size showed statistically significant differences, with the SPS exhibiting higher TPCs than both the medium particle size (MPS) and large particle size (LPS) (p < 0.05). Under the same 60 °C hot-air drying temperature, the TPCs of LLP with LPS was (4.64 ± 0.19 g/100 g), that of MPS was (6.13 ± 0.13 g/100 g), and that of SPS was (7.57 ± 0.12 g/100 g). The SPS exhibited the highest values, likely due to the increased surface area for molecular transport, which facilitates more extensive diffusion of solutes (Norra et al., 2016). Compared to LLP with LPS dried at 100 °C, the TPCs of SPS dried at 60 °C increased by 23.38%. Furthermore, the TPCs of 60 °C-dried SPS were 38.71% higher than those of 60 °C-dried LPS. These results demonstrate an economically efficient method to enhance the functional value of the product without increasing raw material usage.
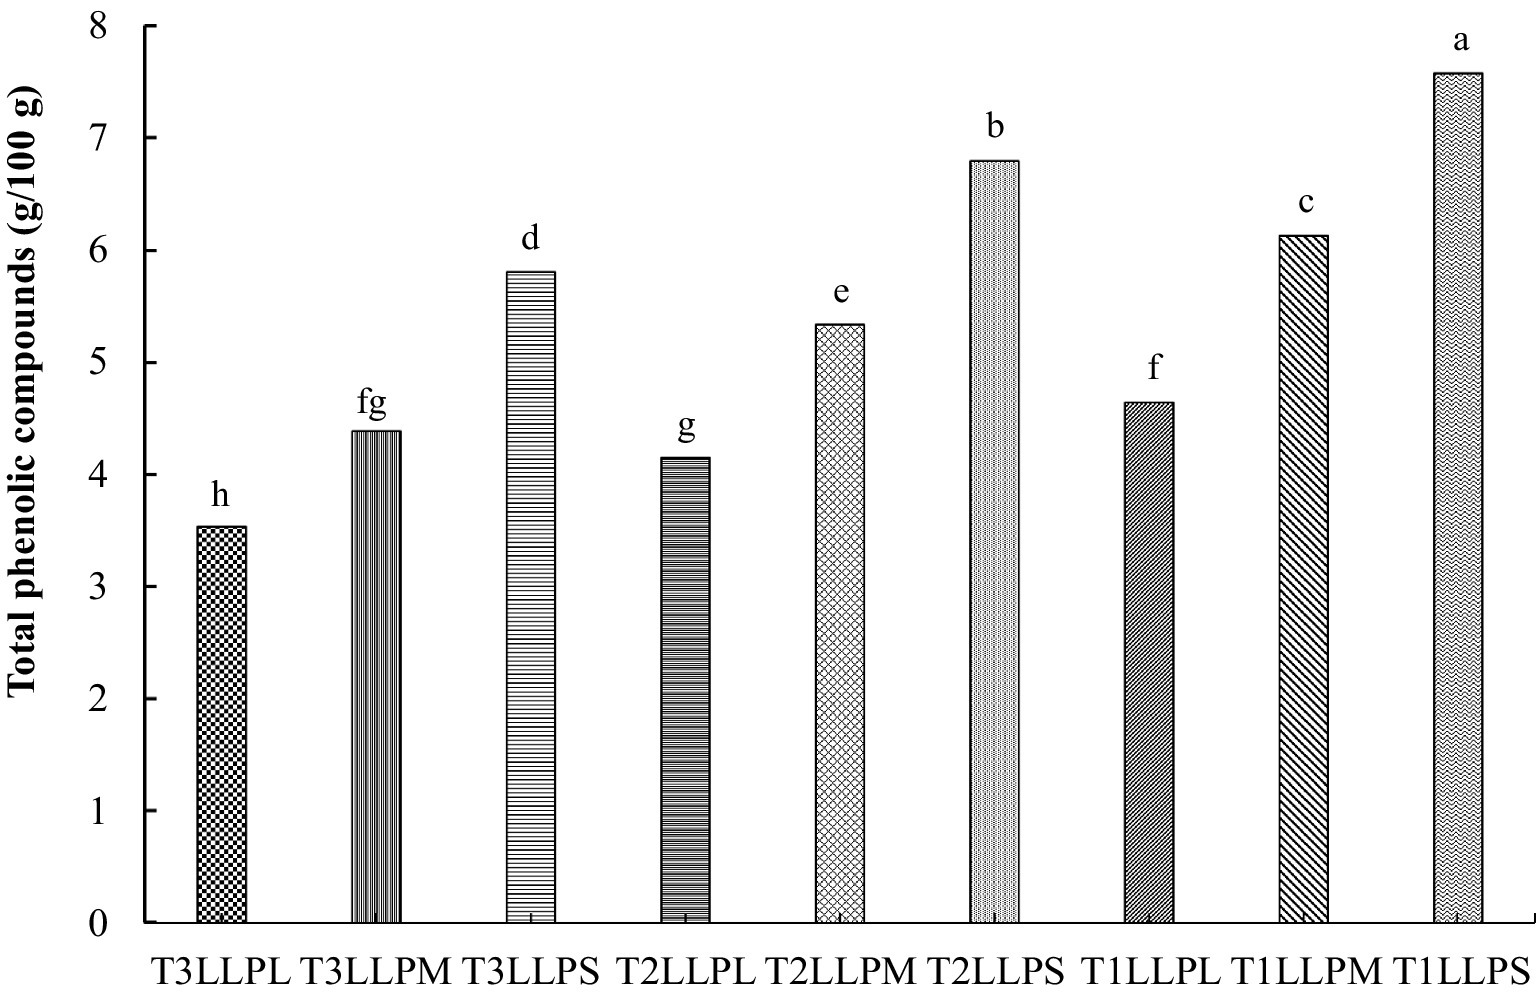
Figure 1. TPCs of different LLP. (a–h) Means with a different superscript in the same treatment are different (p < 0.05), TPCs: Total phenolic compounds. LLP = Lotus leaf powder; T1 = 60 °C; T2 = 80 °C; T3 = 100 °C; S = Small particle size (<150 μm); M = Medium particle size (150–500 μm); L = Large particle size (>500 μm). Treatments: T1LLPS = LLP with small particle size (<150 μm) dried at 60 °C; T2LLPS = LLP with small particle size (<150 μm) dried at 80 °C; T3LRRPS = LLP with small particle size (<150 μm) dried at 100 °C; T1LLPM = LLP with medium particle size (150–500 μm) dried at 60 °C; T2LLPM = LLP with medium particle size (150–500 μm) dried at 80 °C; T3LLPM = LLP with medium particle size (150–500 μm) dried at 100 °C; T1LLPL = LLP with large particle size (>500 μm) dried at 60 °C; T2LLPL = LLP with large particle size (150–500 μm) dried at 80 °C; T3LLPL = LLP with large particle size (>500 μm) dried at 100 °C.
3.2 DPPH, FICA and FRPA for LLP
DPPH of LLP also tended to increase with increasing concentrations and decreasing particle sizes (Figure 2A). Moreover, statistically significant differences were observed across different temperatures and particle sizes. For instance, the 1% concentration of 60 °C hot-air-dried LLP exhibited a DPPH of 21.99 ± 3.39% for large particles, 29.69 ± 2.84% for medium particles, and 44.29 ± 3.28% for small particles (p < 0.05). For the same small particle size at 1% concentration, the DPPH value of the 100 °C was 25.12 ± 2.96%, representing a reduction of 43.28% compared to the 60 °C. At the concentration of 0.1%, the DPPH of each treatment was 7.30% ± 2.88% to 18.76 ± 3.62%. At 1% concentration, the DPPH reached 11.28 ± 3.48% to 44.29 ± 3.28%, increased 74.53%. The particle size can be effectively reduced and the specific surface area increased after ultra-fine grinding treatment. When evaluating the DPPH of black kidney bean powder using 2,2-diphenyl-1-picrylhydrazyl as the radical, the scavenging ability of the black kidney bean powder was enhanced as the particle size decreased (Sun et al., 2019). In addition, TPCs and DPPH showed a consistent trend. Due to the synergistic effect between phenolic compounds and the high hydrogen atom donating capacity, a higher TPCs may lead to an increased DPPH radical scavenging activity (Das et al., 2012).
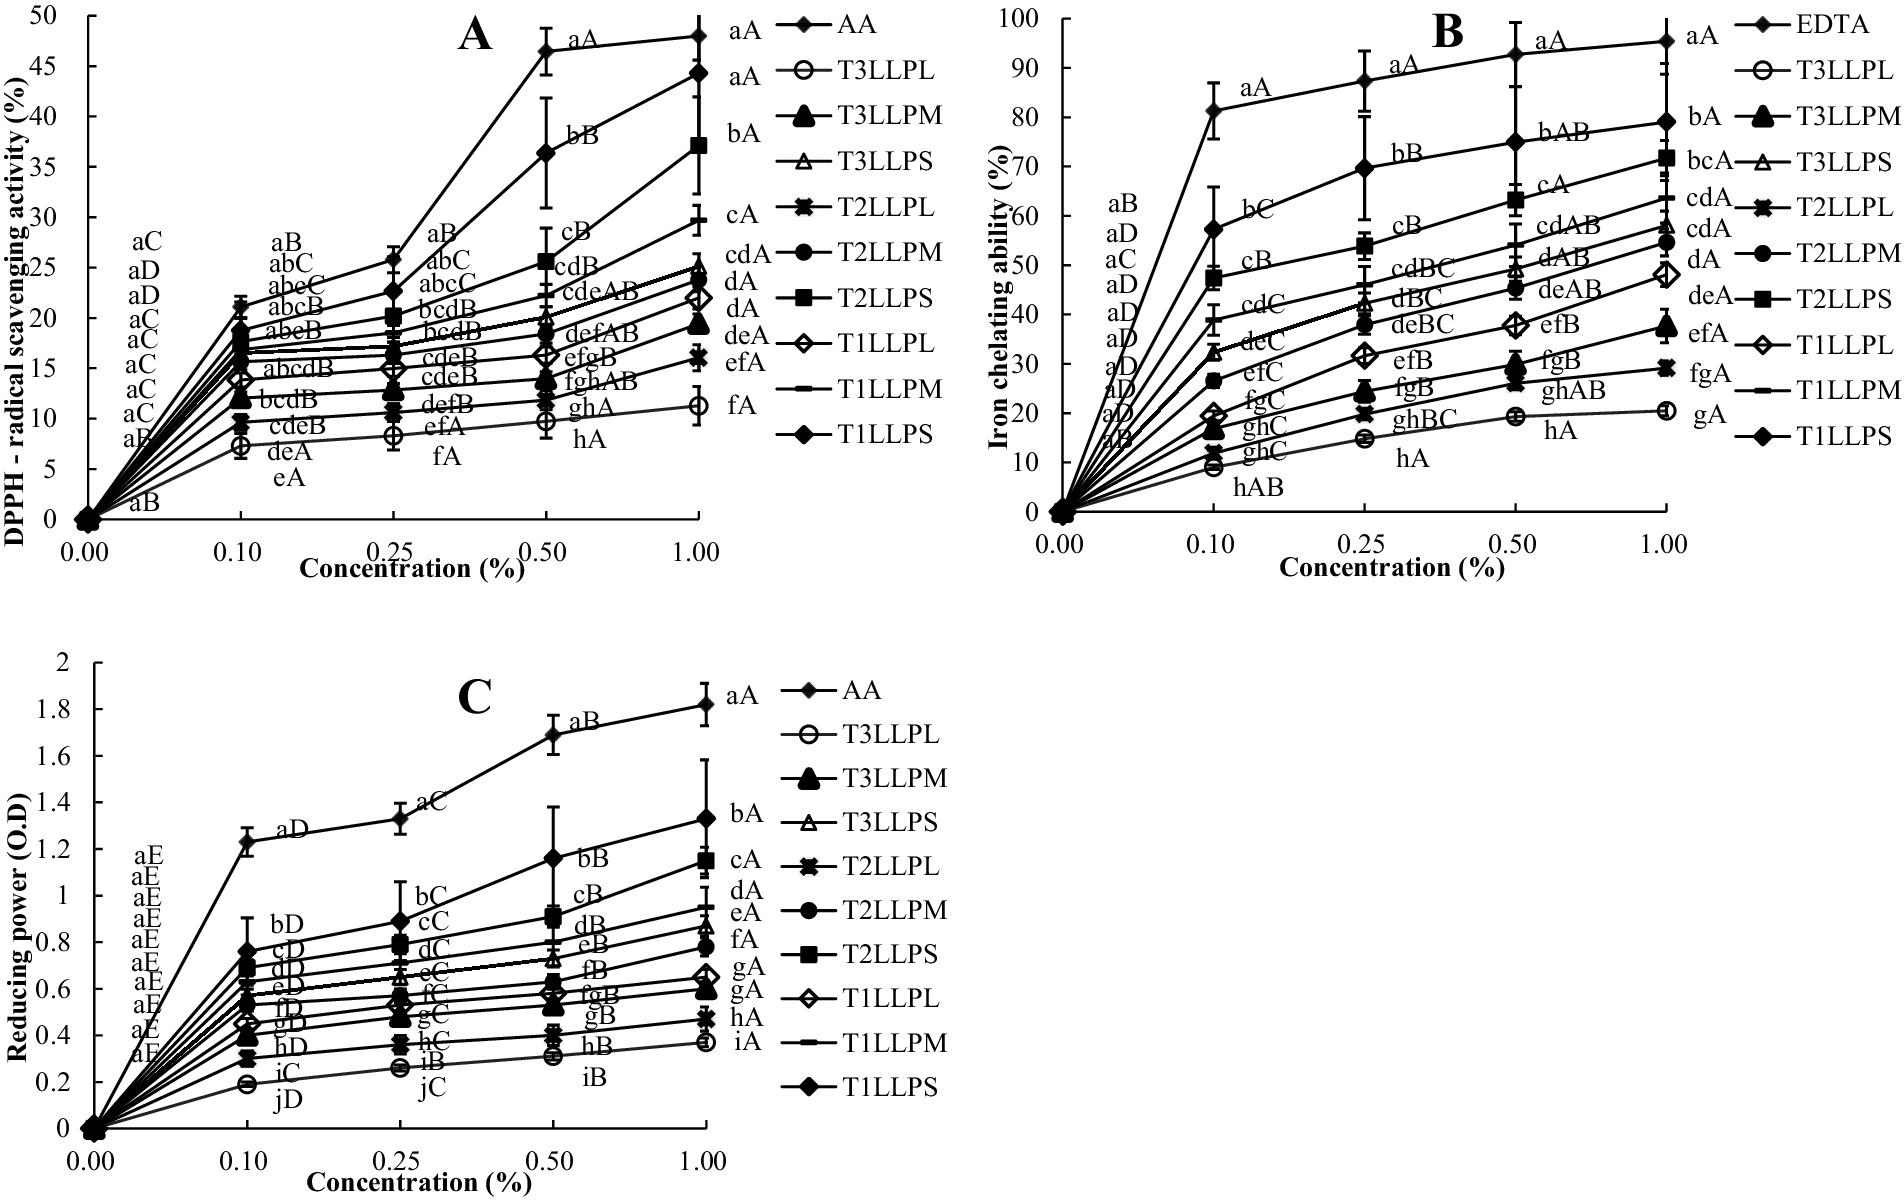
Figure 2. DPPH (A), FICA (B) and FRPA (C) of different LLP. (a–j) Means with a different superscript in the same column (concentration) are different (p < 0.05), (A–E) Means with a different superscript in the same column (treatment) are different (p < 0.05). DPPH = DPPH free radical scavenging capacity; FICA = Ferrous iron chelating ability; FRPA = Ferric reducing power ability; Treatments: AA = Ascorbic acid; EDTA = Ethylenediaminetetraacetic acid; LLP = Lotus leaf powder; T1LLPS = LLP with small particle size (<150 μm) dried at 60 °C; T2LLPS = LLP with small particle size (<150 μm) dried at 80 °C; T3LLPS = LLP with small particle size (<150 μm) dried at 100 °C; T1LLPM = LLP with medium particle size (150–500 μm) dried at 60 °C; T2LLPM = LLP with medium particle size (150–500 μm) dried at 80 °C; T3LLPM = LLP with medium particle size (150–500 μm) dried at 100 °C; T1LLPL = LLP with large particle size (>500 μm) dried at 60 °C; T2LLPL = LLP with large particle size (150–500 μm) dried at 80 °C; T3LLPL = LLP with large particle size (>500 μm) dried at 100 °C.
In Figure 2B, as the concentration increased from 0.1 to 1%, the FICA of all treatments was observed to increase with the rise in concentration. FICA also tended to increase with decreasing temperature and particle size. Among all particles, the small particle size (<150 μm) dried at 60 °C exhibited the best FICA, with a value of 57.26 ± 4.85% to 79.03 ± 4.62%. Phenolic compounds possessed metal-binding sites, which could prevent the redox cycling of metals through metal chelation, thereby delaying oxidative activity (Andjelković et al., 2006). Consequently, the FICA of LLP (<150 μm) at 60 °C was the highest among treatments. In the study of the effect of particle size on the antioxidant properties of cactus powder, the highest contents of polyphenols and flavonoids were found in the particle size grade of 80–100 μm and antioxidant activities were significantly enhanced with the decrease of particle size (Nabil et al., 2020).
As shown in Figure 2C, the FRPA values were influenced by particle size and oven drying temperature. Except for the reference control (AA), the 1% concentration of T1LLPS still exhibited the highest FRAP value, which was 1.33 ± 0.00 O.D. It increased by 34.59% compared to T3LLPS at the same concentration. As the concentration increased from 0.0 to 1%, the FRPA of all treatments was observed to increase. FRPA serves as a potential marker for antioxidant activity by converting the iron/ferricyanide complex into its ferrous state. All extracts from date plum persimmon exhibited dose-dependent DPPH, FICA and FRPA capabilities, and they showed a good correlation with total phenolic compounds and total flavonoid contents, indicating that phenolic compounds directly contribute to these activities (Gao et al., 2014). In the present manuscript, the FRPA of LLP with SPS was greater than MPS and LPS. In a previous study, the contents of total phenols, total flavonoids and total carotenoids were higher in the red chili powder with smaller particle sizes (Gao et al., 2014).
In present study, when the temperature was decreased from 100 °C to 60 °C and the particle size was reduced from >500 μm to <150 μm, the magnitude of improvement in antioxidant activity was significantly enhanced. The DPPH, FICA, and FRPA of LLP with small particle size (<150 μm) dried at 60 °C (T1LLPS) were the highest among all treatments, and were all influenced by temperature and particle size.
3.3 TPCs for T1LLPSGWLB
Figure 3 shows the differences in TPCs among GWLB with different concentrations of T1LLPS added. The TPCs of GWLB increased with the increased addition of T1LLPS (p < 0.05). According to Section 3.1, the TPCs of T1LLPS was (7.57 ± 0.12 g/100 g), while the TPCs in GWLB with 1% T1LLPS was (3.19 ± 0.23 g/100 g), resulting in a retention rate of 42.14%. In a previous study, it was found that adding date flour to wheat flour increased the amounts of polyphenols and flavonoids in sponge cakes, as well as antioxidant potential (Najjaa et al., 2020). And Kolonas et al. (2023) mentioned that the antioxidant activity of phenols may be due to their ability to act as reducing agents and hydrogen donors.
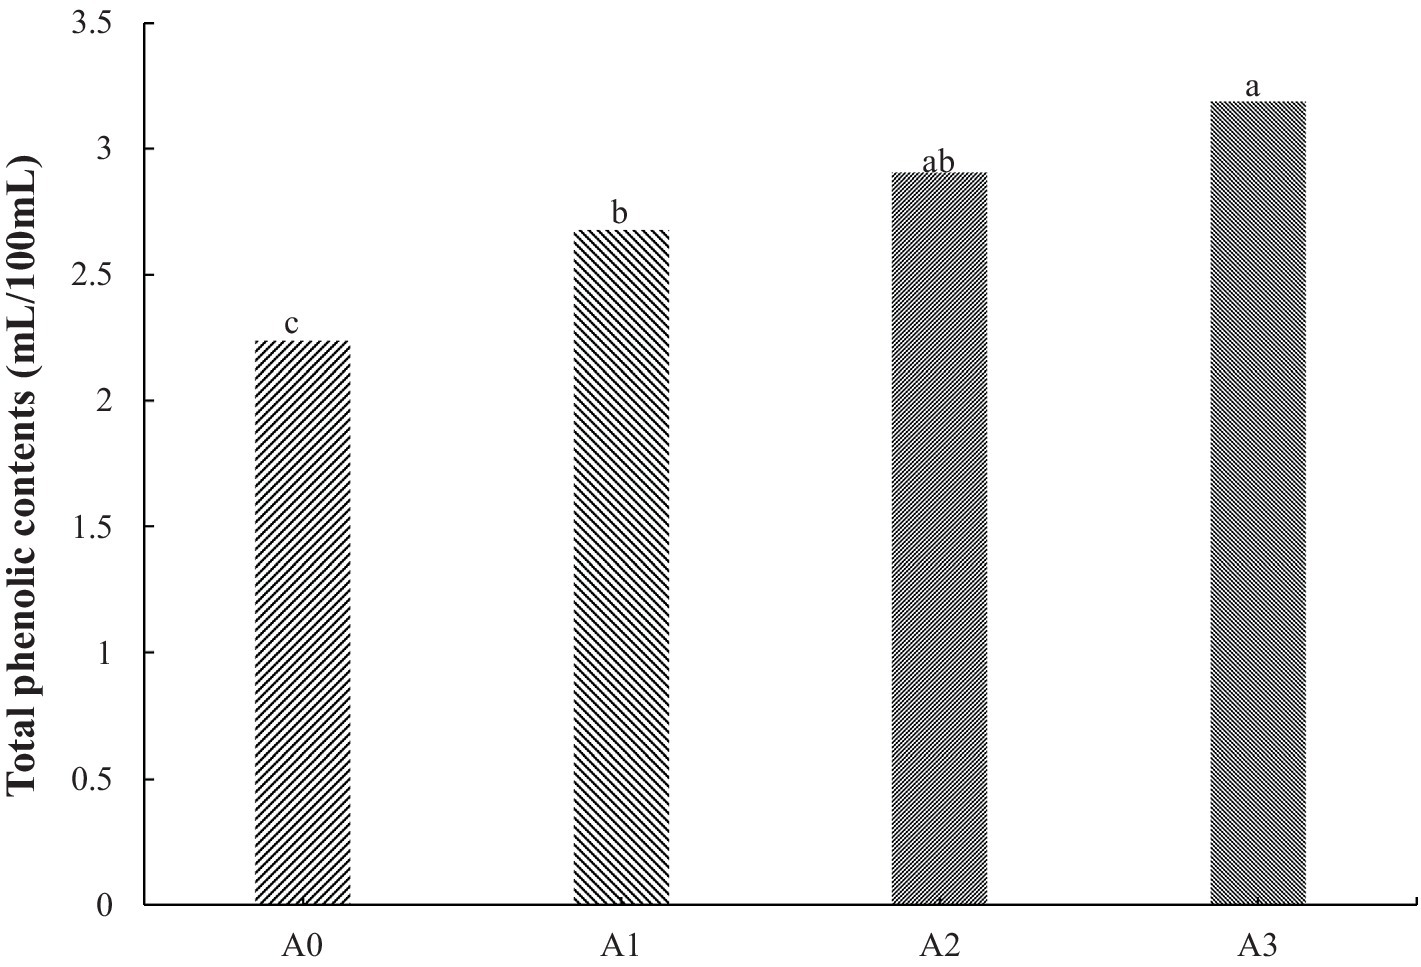
Figure 3. TPCs of GWLB cooperated with different LLP. (a–c) Means with a different superscript in the same treatment are different (p < 0.05), Treatments: A0 = GWLB added without T1LLPS; A1 = GWLB added with 0.25% T1LLPS; A2 = GWLB added with 0.5% T1LLPS; A3 = GWLB added with 1.0% T1LLPS.
3.4 DPPH, FICA and FRPA for T1LLPSGWLB
From Figure 4, the values of DPPH, FICA and FRPA were found to decrease with the increase in the dilution gradient of T1LLPS. The GWLB with 1% T1LLPS exhibited a DPPH range of 55.69 ± 3.70% to 66.72 ± 1.88%, a FICA range of 61.10 ± 1.97% to 75.05 ± 0.99%, and a FRPA range of 0.41 ± 0.00 O.D to 0.69 ± 0.00 OD. In contrast, without T1LLPS showed a DPPH range of 42.01 ± 1.13% to 46.09 ± 1.20%, a FICA range of 28.19 ± 3.35% to 50.74 ± 2.70%, and a FRPA range of 0.12 ± 0.00 O.D to 0.45 ± 0.01 O.D. A previous study found that adding LLP to bread led to a notable rise in its DPPH and total polyphenol levels (Park, 2017). A strong positive correlation was found between the TPCs and the antioxidant activity as assessed by DPPH and FRPA tests (Feng et al., 2016). In addition to the standard sample group AA, the GWLB with the addition of 1% concentration of T1LLPS still exhibits the highest values of DPPH, FICA and FRPA, which was consistent with the trend observed in the TPCs of GWLB with different concentrations of T1LLPS added. It can be seen from this that the addition of 1% T1LLPS significantly improved the antioxidant activity of GWLB, which provides a specific reference for the formula optimization of functional beverages.
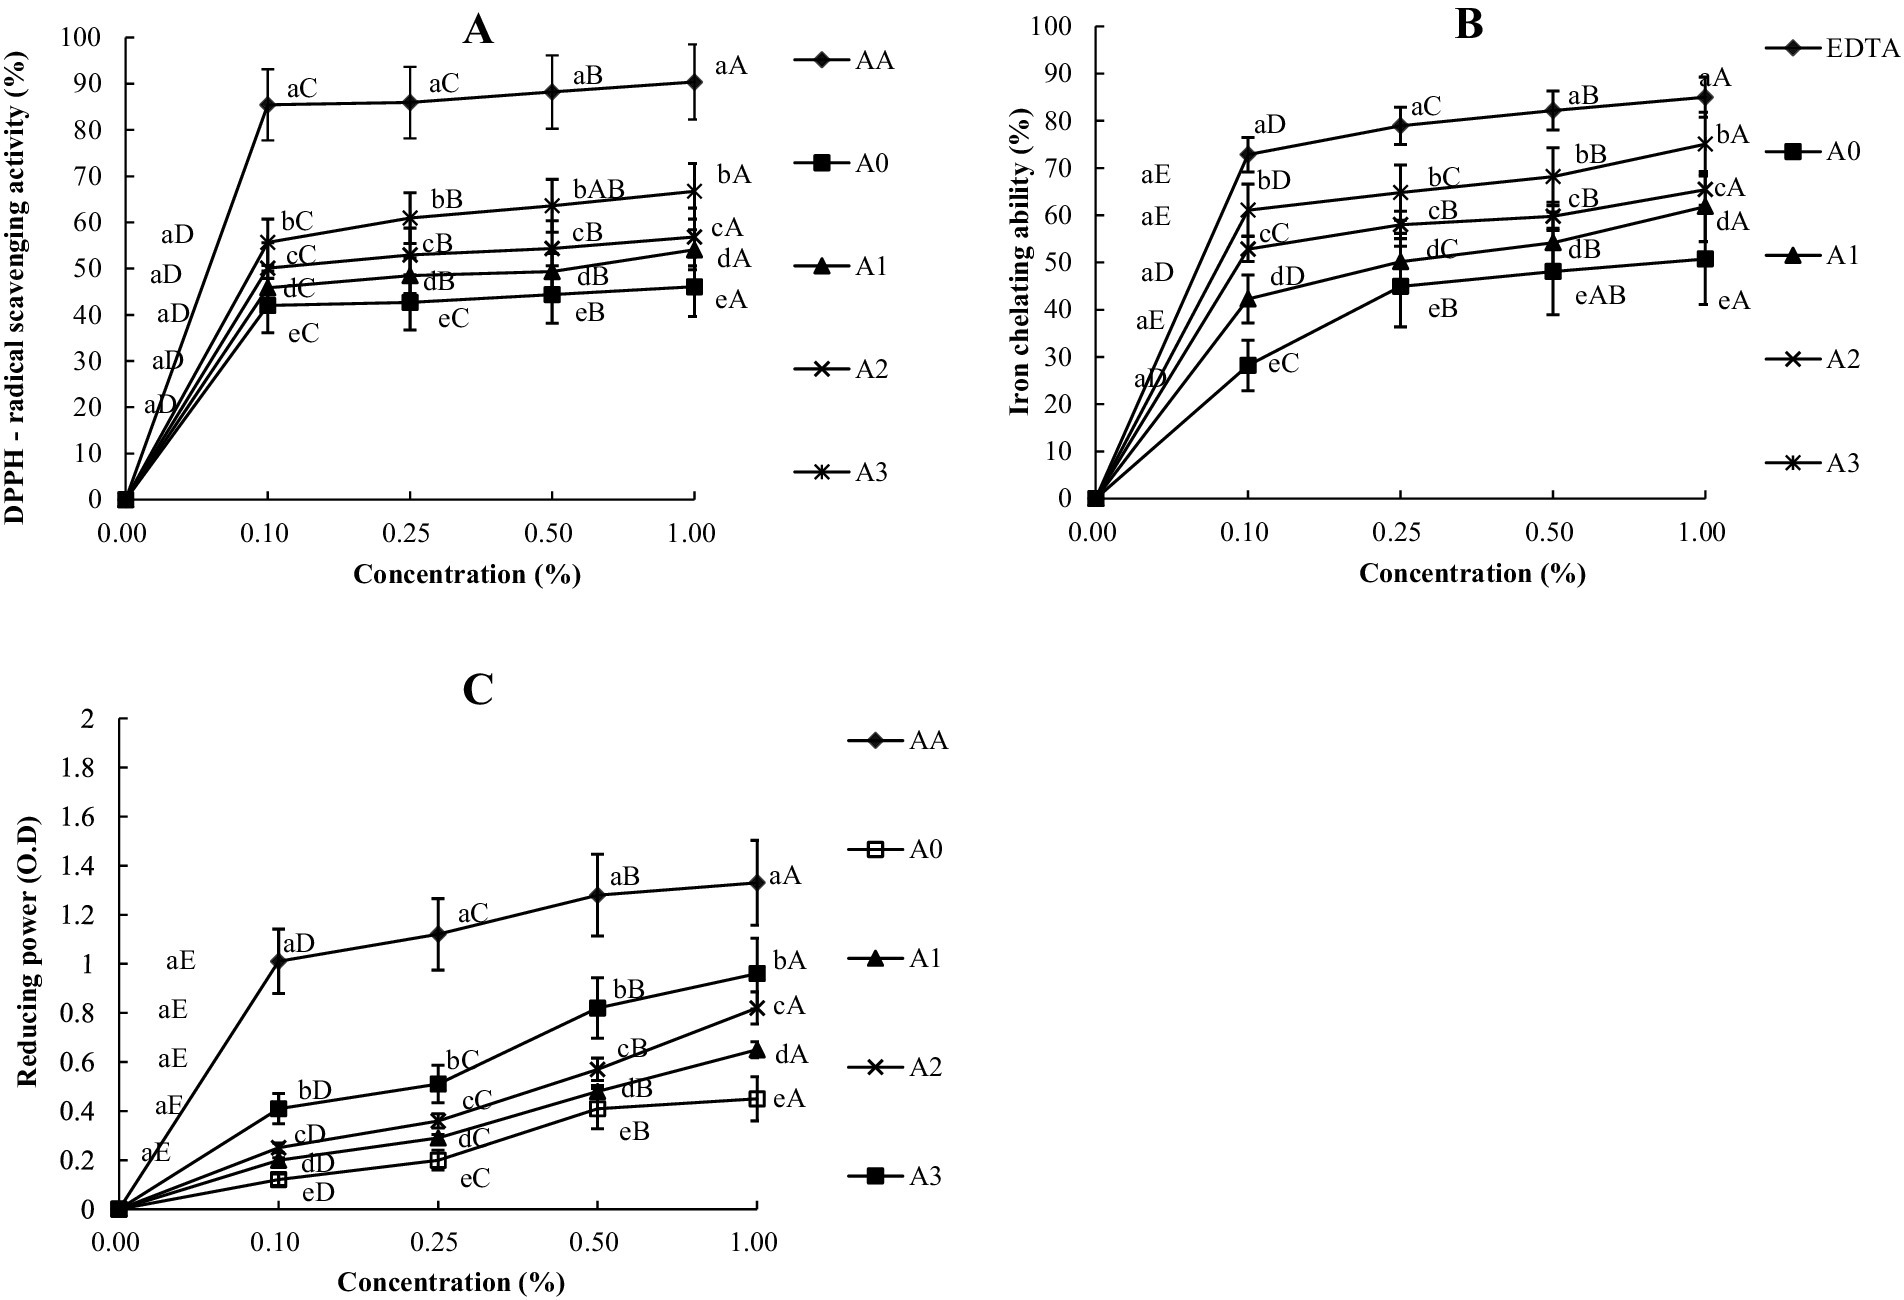
Figure 4. DPPH (A), FICA (B) and FRPA (C) of GWLB cooperated with different LLP. (a–e) Means with a different superscript in the same column (concentration) are different (p < 0.05), (A–D) Means with a different superscript in the same column (treatment) are different (p < 0.05). DPPH = DPPH free radical scavenging capacity; FICA = Ferrous iron chelating ability; FRPA = Ferric reducing power ability; Treatments: AA = Ascorbic acid; EDTA = Ethylenediaminetetraacetic acid; A0 = GWLB added without T1LLPS; A1 = GWLB added with 0.25% T1LLPS; A2 = GWLB added with 0.5% T1LLPS; A3 = GWLB added with 1.0% T1LLPS.
3.5 pH and color values for T1LLPSGWLB
Table 1 illustrates the changes in pH value and color of the GWLB, supplemented with varying concentrations of T1LLPS, over a 35-day storage period. The pH of all treatments decreased over storage time (p < 0.05). Additionally, during the same storage period, the pH of the GWLB decreased with an increase of T1LLPS added (p < 0.05). During day 0 to day 35, the pH of GWLB added with 1% T1LLPS decreased from 7.23 ± 0.01 to 7.11 ± 0.02, representing a change of 1.08%. In contrast, without T1LLPS declined from 7.69 ± 0.02 to 7.52 ± 0.02, corresponding to a change of 2.21%. Both ranges of pH variation were within acceptable limits. In another study, it was proven that with the increase of storage time, some ingredients in the beverages may undergo oxidation or decomposition reactions to generate acidic substances such as oxidation of vitamin C producing acidic products that lower pH (Nicolas et al., 1994). Studies have shown that this may be due to the fermentation of organic acids (such as lactic acid, acetic acid, etc.) due to microbial activity (Kelbore et al., 2022). A study examining the influence of LLP on the quality of chicken patties under refrigeration conditions discovered that the pH values were lower in the samples with LLP than in the control group. The present research has shown that the organic acids in lotus leaves have an influence on the acidity of LLP (Mukherjee et al., 2009).
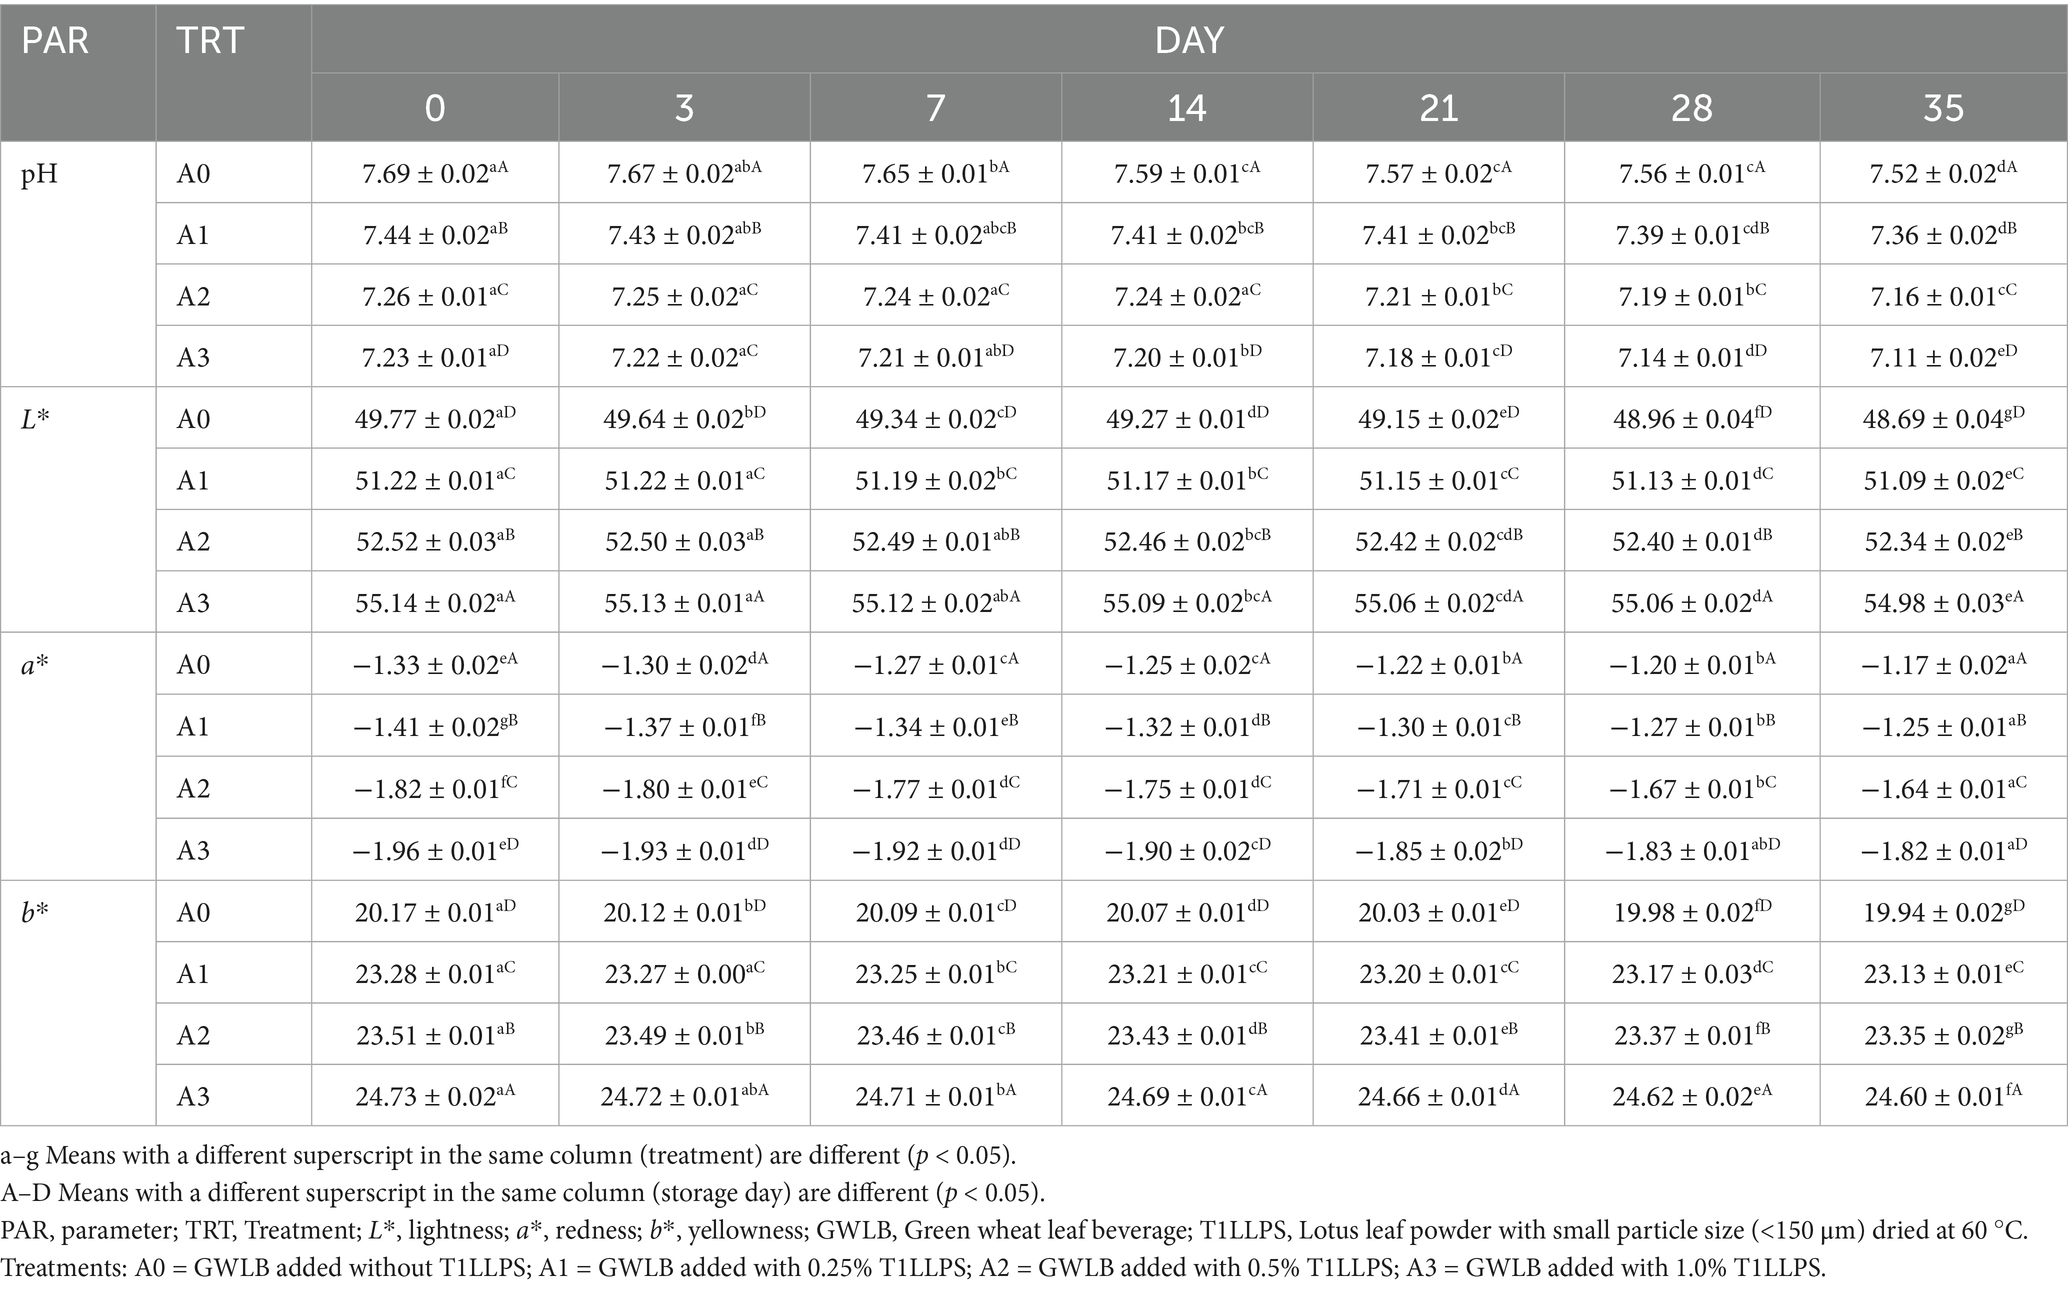
Table 1. pH values and colors values (L* a* b*) of GWLB cooperated with different concentrations of T1LLPS.
Due to the significant interaction between treatments and storage days (p < 0.05), it could be demonstrated that the more T1LLPS added to the GWLB, the greater L* values, and as the storage period increased, the L* values of all groups were decreased. From day 0 to day 35, the L* value of GWLB with 1% T1LLPS decreased from 55.14 ± 0.02 to 54.98 ± 0.03, representing a reduction of 0.29%, while that of the control group declined from 49.77 ± 0.02 to 48.69 ± 0.04, corresponding to a decrease of 2.17%. Polyphenolic compounds were contained in lotus leaves, which may influence the absorption and reflection of light, thereby further enhancing lightness (Manach et al., 2004). The longer the beverages were stored, the lower its lightness becomes (Septiyani et al., 2024). Under the same storage period, the higher the content of T1LLPS added, the more a* showed a decreasing trend, while b* exhibited an increasing trend. On day 0, the a* value of GWLB added with 1% T1LLPS was −1.96 ± 0.01, and the b* value was 24.73 ± 0.02, while the a* and b* values of the control group were −1.33 ± 0.02 and 20.17 ± 0.01, respectively and all observed variations fell within sensorially acceptable ranges. During the preservation of yogurt, it was observed that significant changes occurred in the a* and b* values of yogurt supplemented with LLP, which may be attributed to the degradation and oxidation of lotus leaf pigments (Kim et al., 2019). Meanwhile, the presence of chlorophyll would also lead to an increase in the b* value of the beverage (Vebrianty et al., 2021).
3.6 Soluble solids contents (SSC) and suspension stability (SS) for T1LLPSGWLB
It can be seen from Table 2 that under the same storage period, SSC increased with the increase of the concentration of T1LLPS in GWLB, and SS decreased with the increase of the concentration of T1LLPS in GWLB (p < 0.05). On day 0, the SSC and SS of without T1LLPS were 2.16 ± 0.02 and 85.47 ± 0.02, respectively, while those of the GWLB added with 1% T1LLPS were 3.48 ± 0.01 and 81.59 ± 0.06, respectively. Substances rich in minerals and bioactive compounds can enhance the SSC of fruit juices and were shown to possess high antioxidant potential (Prakash et al., 2021). In present study, we found T1LLPS with high antioxidant activity and high amount of TPCs, which might improve the SSC of T1LLPSGWLB. Furthermore, different components in the T1LLPSGWLB (such as polysaccharides and proteins) may underwent phase separation, leading to uneven distribution of suspended particles and a decrease in stability (Norton et al., 2010). The SSC of all groups increased with the increase of storage period, while the SS decreased (p < 0.05). The SSC of GWLB added with 1% T1LLPS increased from 3.48 ± 0.01 on day 0 to 3.57 ± 0.01 on day 35. Conversely, the SS decreased from 81.59 ± 0.06 on day 0 to 80.12 ± 0.02 on day 35. Milk beverages with insufficient pectin content may undergo clumping during storage, leading to the evaporation of their water content (Lucey et al., 1999). As storage time increases, the evaporation of water in the T1LLPSGWLB may result in an increase in sedimentation. Throughout the duration of storage, the T1LLPSGWLB may undergo reactions such as oxidation and hydrolysis, which can alter the surface properties of the particles and weaken their stability (Chanamai and McClements, 2001). Therefore, in present research, the GWLB with the addition of 1% T1LLPS exhibited the highest SSC but the lowest SS among T1LLPSGWLB.
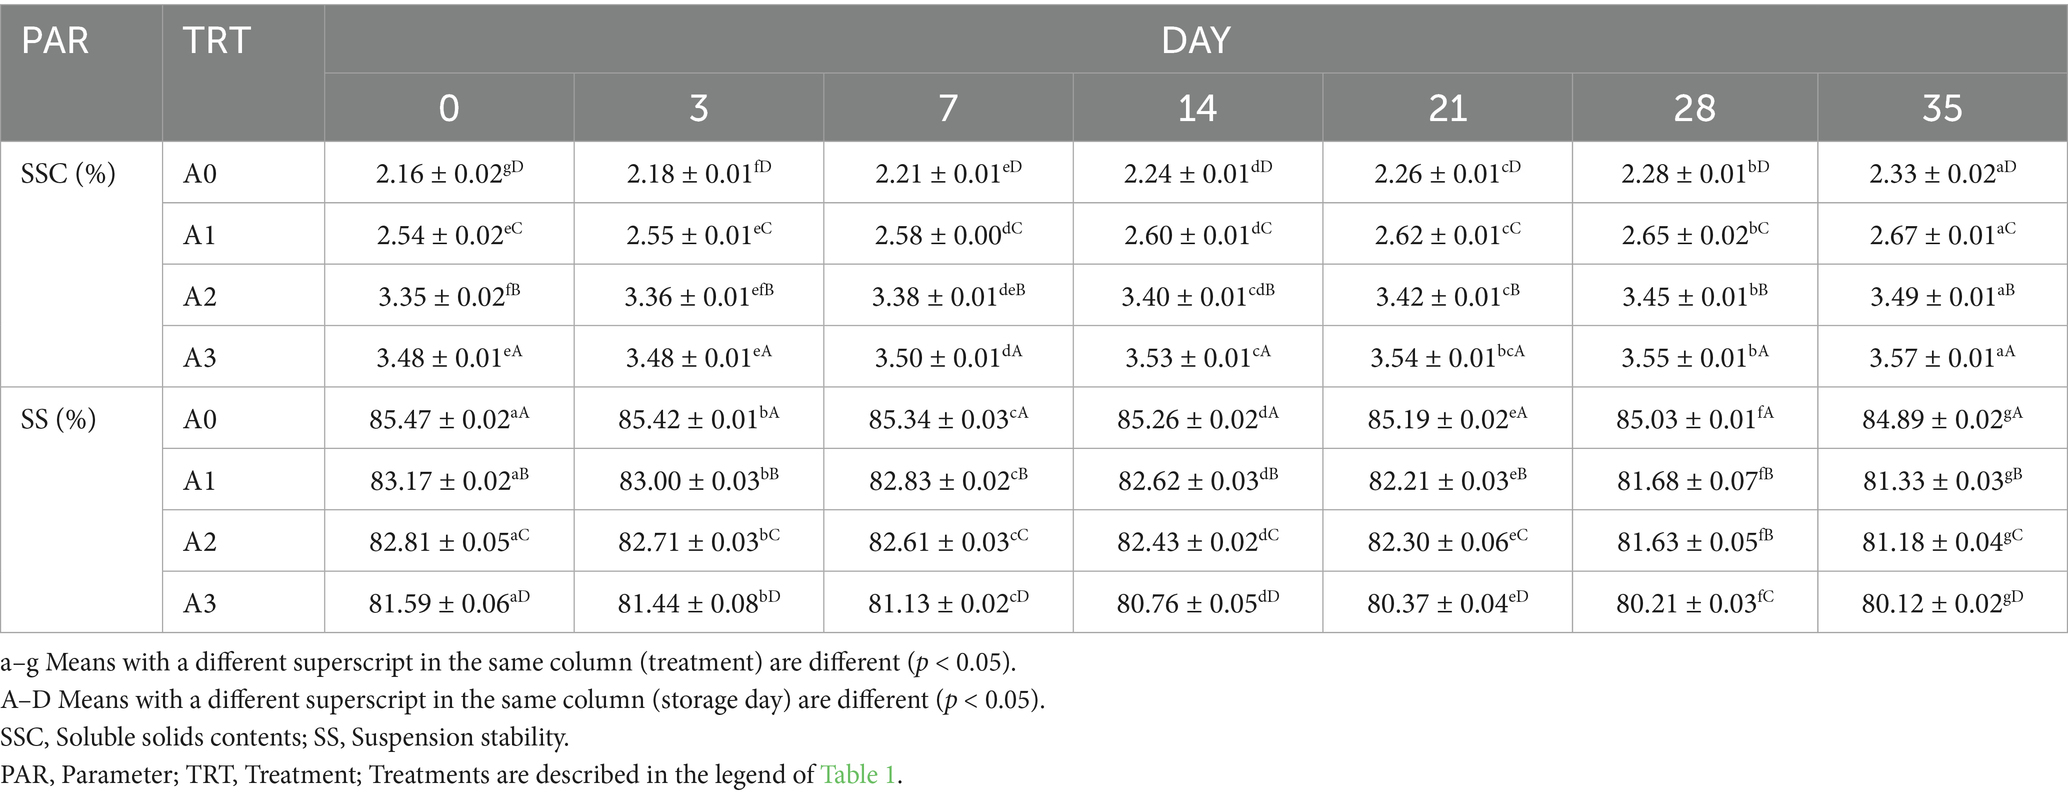
Table 2. SSC and SS of GWLB cooperated with different concentrations of T1LLPS.
3.7 Microbial counts for T1LLPSGWLB
The total bacterial counts (TBCs) and enterobacteriaceae counts (EBCs) of the GWLB with the addition of T1LLPS at different concentrations during the storage period are shown in Table 3. Both the TBCs and EBCs decreased with the addition of T1LLPS in the GWLB during the storage period. The GWLB with 1% T1LLPS added, no total bacteria (TB) were detected before day 3, and no enterobacteriaceae (EB) were detected before day 7. Moreover, on day 7, the GWLB added with 1% T1LLPS exhibited reductions of 0.63 Log CFU/mL in TBCs and 0.47 Log CFU/mL in EBCs compared to the control group. This might be related to the antibacterial components such as tannins, alkaloids and terpenoids contained in T1LLPS (Benslama et al., 2017). Some research has demonstrated that the composite coating containing lotus leaf extract can inhibit the growth of microorganisms in wolfberries during storage and reduce their weight loss, making it an effective natural preservative (Fan et al., 2019). Therefore, adding T1LLPS to GWLB has a certain inhibitory effect on the growth of microorganisms, and among them, adding 1% T1LLPS shows the best effect.
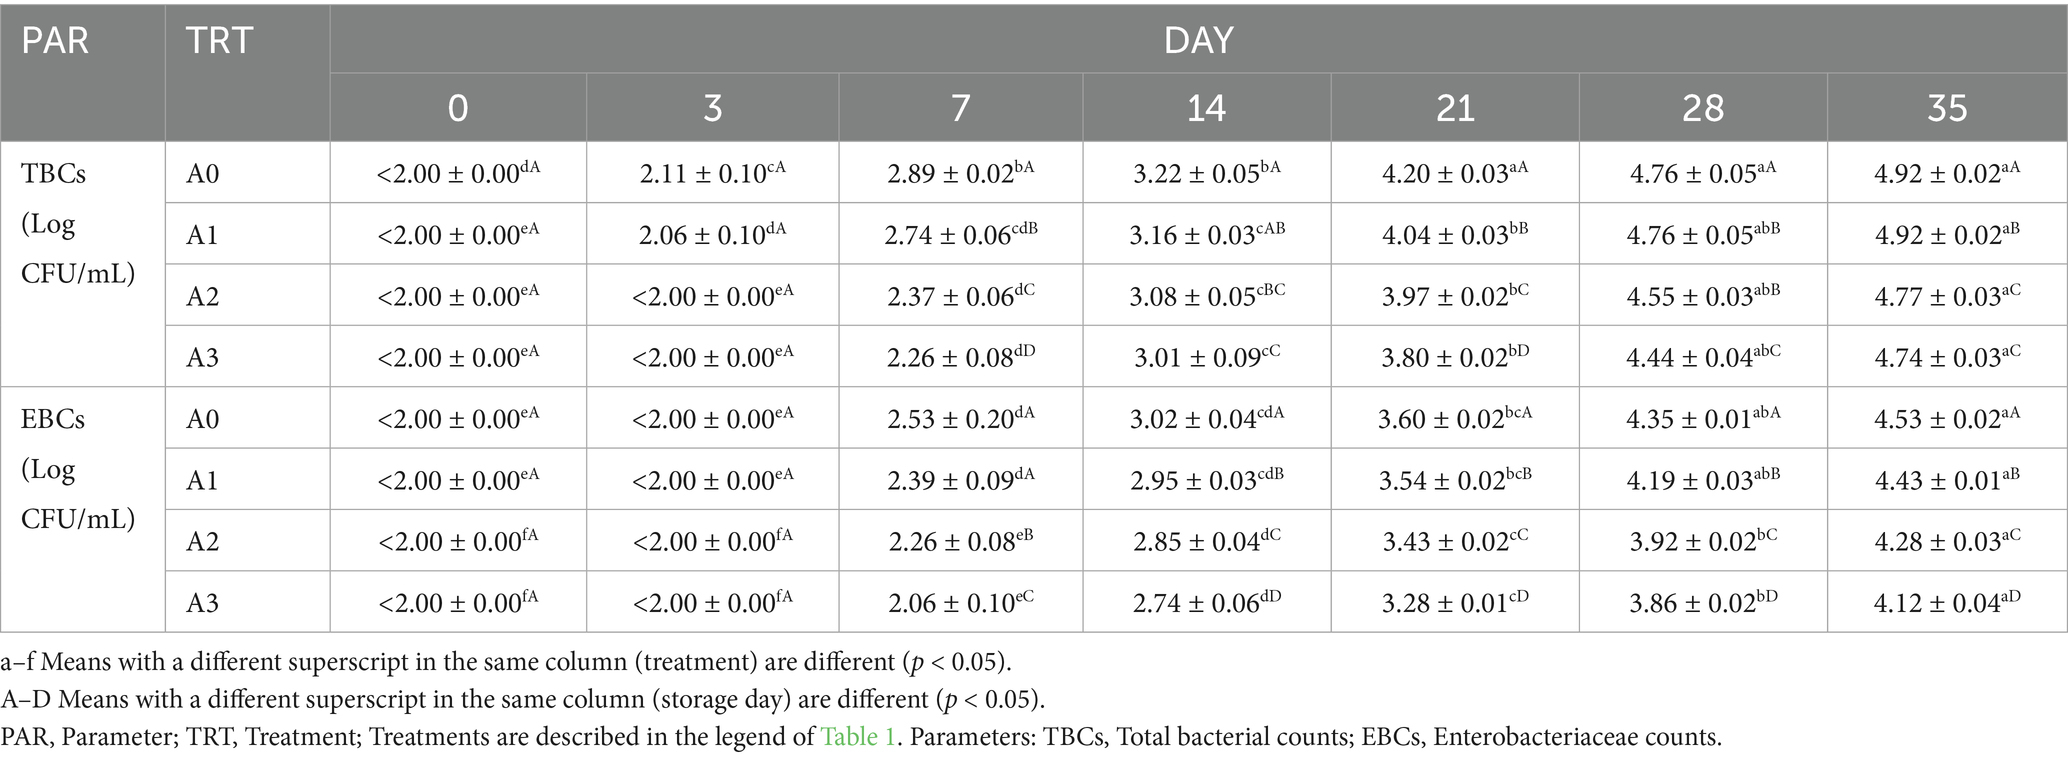
Table 3. TBCs and EBCs of GWLB cooperated with different concentrations of T1LLPS.
3.8 Sensory evaluation of T1LLPSGWLB
The sensory evaluations for the four types of GWLB with different concentrations of T1LLPS are presented in Table 4. The sensory evaluation results were the best for the GWLB with 0.5% T1LLPS added. However, the sensory evaluation results were not ideal for the GWLB with 1% T1LLPS added. The overall acceptability scores of GWLB added with 0.25 and 0.5% T1LLPS were both 8.4, which were higher than that of the control group as 7.6. In contrast, the score for GWLB with 1% T1LLPS was 7.2. This phenomenon may be attributed to the concentration-dependent effects of specific bioactive compounds present in T1LLPS (Shahrajabian et al., 2022; Zheng et al., 2022).
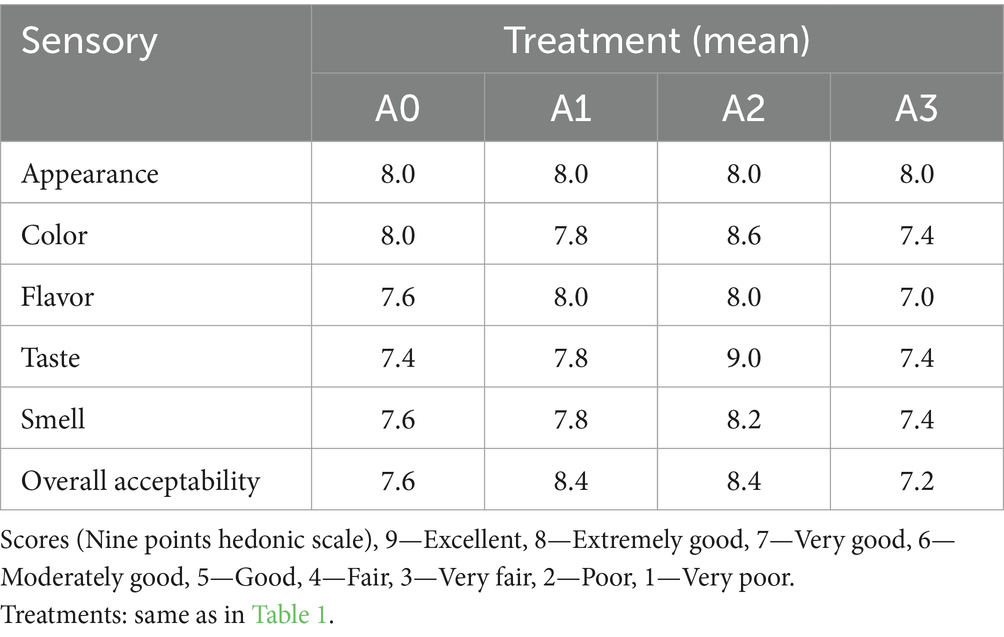
Table 4. Sensory evaluation of GWLB cooperated with different concentrations of T1LLPS.
4 Conclusion
The TPCs, DPPH, FICA and FRPA of LLP increased with the decrease of particle size and drying temperature. The antioxidant activity with small particle size (<150 μm) dried at 60 °C showed the highest antioxidant activities for all LLP treatments. Compared to the large particle size (>500 μm) dried at 100 °C, the small particle size (<150 μm) dried at 60 °C demonstrated a 53.41% increase in TPCs, a 74.53% enhancement in DPPH, and 74.10 and 72.18% rises in FICA and FRPA, respectively. The addition of T1LLPS improved the physicochemical properties of GWLB and also enhanced the antioxidant and antimicrobial activities. The GWLB cooperated with 1% T1LLPS exhibited the highest soluble solids contents, as well as the highest antioxidant and antimicrobial activities in beverages. The GWLB with 1% T1LLPS showed a 37.93% increase in SSC, a 36.17% enhancement in DPPH, a 32.39% rise in FICA value, and a 53.13% improvement in FRPA value compared to GWLB without T1LLPS. Additionally, on day 7, the GWLB added with 1% T1LLPS showed reductions of 0.63 Log CFU/mL in TBCs and 0.47 Log CFU/mL in EBCs compared to control, the shelf-life was extended by at least 3 days. However, the sensory evaluation results were best for the GWLB with 1% T1LLPS. Therefore, future study would focus on the addition range of T1LLPS from 0.5 to 1% to not only extend the shelf-life of GWLB but also improve the physicochemical properties.
Data availability statement
The original contributions presented in the study are included in the article/supplementary material, further inquiries can be directed to the corresponding author.
Ethics statement
All kinds of GWLB added with LLP used for sensory evaluation have been verified to be safe for consumption. Since this product has passed professional food quality inspections (although the reports are in Chinese), ethical permission is no longer required.
Author contributions
PG: Methodology, Software, Data curation, Formal analysis, Writing – original draft, Conceptualization. ZQ: Writing – review & editing, Funding acquisition, Investigation, Supervision, Writing – original draft, Data curation, Software, Project administration, Conceptualization, Resources, Methodology, Validation, Formal analysis, Visualization.
Funding
The author(s) declare that financial support was received for the research and/or publication of this article. The funding for this study primarily came from the principal investigator’s startup funding, which was mainly used for purchasing reagents and consumables, as well as covering the publication costs of the paper.
Conflict of interest
The authors declare that the research was conducted in the absence of any commercial or financial relationships that could be construed as a potential conflict of interest.
Generative AI statement
The authors declare that no Gen AI was used in the creation of this manuscript.
Any alternative text (alt text) provided alongside figures in this article has been generated by Frontiers with the support of artificial intelligence and reasonable efforts have been made to ensure accuracy, including review by the authors wherever possible. If you identify any issues, please contact us.
Publisher’s note
All claims expressed in this article are solely those of the authors and do not necessarily represent those of their affiliated organizations, or those of the publisher, the editors and the reviewers. Any product that may be evaluated in this article, or claim that may be made by its manufacturer, is not guaranteed or endorsed by the publisher.
References
Andjelković, M., Van Camp, J., De Meulenaer, B., Depaemelaere, G., Socaciu, C., Verloo, M., et al. (2006). Iron-chelation properties of phenolic acids bearing catechol and galloyl groups. Food Chem. 98, 23–31. doi: 10.1016/j.foodchem.2005.05.044
Antony, A., and Farid, M. (2022). Effect of temperatures on polyphenols during extraction. Appl. Sci. 12:2107. doi: 10.3390/app12042107
Benslama, A., Harrar, A., Gul, F., and Demirtas, I. (2017). Phenolic compounds, antioxidant and antibacterial activities of Zizyphus lotus L. leaves extracts. Nat. Prod. J. 7, 316–322. doi: 10.2174/2210315507666170530090957
Cao, H., Saroglu, O., Karadag, A., Diaconeasa, Z., Zoccatelli, G., Conte-Junior, C. A., et al. (2021). Available technologies on improving the stability of polyphenols in food processing. Food Front. 2, 109–139. doi: 10.1002/fft2.65
Chanamai, R., and McClements, D. J. (2001). Depletion flocculation of beverage emulsions by gum Arabic and modified starch. J. Food Sci. 66, 457–463. doi: 10.1111/j.1365-2621.2001.tb16129.x
Chen, Y., Chen, Q., Wang, X., Sun, F., Fan, Y., Liu, X., et al. (2020). Hemostatic action of lotus leaf charcoal is probably due to transformation of flavonol aglycons from flavonol glycosides in traditional chinses medicine. J. Ethnopharmacol. 249:112364. doi: 10.1016/j.jep.2019.112364
Das, A., Raychaudhuri, U., and Chakraborty, R. (2012). Effect of freeze drying and oven drying on antioxidant properties of fresh wheatgrass. Int. J. Food Sci. Nutr. 63, 718–721. doi: 10.3109/09637486.2011.644769
Fan, X. J., Zhang, B., Yan, H., Feng, J. T., Ma, Z. Q., and Zhang, X. (2019). Effect of lotus leaf extract incorporated composite coating on the postharvest quality of fresh goji (Lycium barbarum L.) fruit. Postharvest Biol. Technol. 148, 132–140. doi: 10.1016/j.postharvbio.2018.10.020
Feng, C. Y., Li, S. S., Yin, D. D., Zhang, H. J., Tian, D. K., Wu, Q., et al. (2016). Rapid determination of flavonoids in plumules of sacred lotus cultivars and assessment of their antioxidant activities. Ind. Crop. Prod. 87, 96–104. doi: 10.1016/j.indcrop.2016.04.030
Gao, H., Cheng, N., Zhou, J., Wang, B., Deng, J., and Cao, W. (2014). Antioxidant activities and phenolic compounds of date plum persimmon (Diospyros lotus L.) fruits. J. Food Sci. Technol. 51, 950–956. doi: 10.1007/s13197-011-0591-x
Hagerman, A. E., Riedl, K. M., Jones, G. A., Sovik, K. N., Ritchard, N. T., Hartzfeld, P. W., et al. (1998). High molecular weight plant polyphenolics (tannins) as biological antioxidants. J. Agric. Food Chem. 46, 1887–1892. doi: 10.1021/jf970975b
Hao, X.-T., Peng, R., Guan, M., Zhang, H.-J., Guo, Y., Shalapy, N. M., et al. (2024). The food and medicinal homological resources benefiting patients with hyperlipidemia: categories, functional components, and mechanisms. Food Med. Homol. 1:9420003. doi: 10.26599/FMH.2024.9420003
Karam, M. C., Petit, J., Zimmer, D., Djantou, E. B., and Scher, J. (2016). Effects of drying and grinding in production of fruit and vegetable powders: a review. J. Food Eng. 188, 32–49. doi: 10.1016/j.jfoodeng.2016.05.001
Kebe, M., Renard, C. M. C. G., El Maâtaoui, M., Amani, G. N. G., and Maingonnat, J. F. (2015). Leaching of polyphenols from apple parenchyma tissue as influenced by thermal treatments. J. Food Eng. 166, 237–246. doi: 10.1016/j.jfoodeng.2015.05.037
Kelbore, T., Yilma, B., and Srinivasan, B. (2022). Value addition of Cissus quadrangularis stem powder in Ethiopian flat bread: Injera and its effect on nutritional composition, sensory attributes and microbial load. J. Food Sci. Technol. 59, 1450–1459. doi: 10.1007/s13197-021-05154-w
Kim, H. S., and Chin, K. B. (2016). Evaluation of different drying temperatures on physico-chemical and antioxidant properties of water-soluble tomato powders and on their use in pork patties. J. Sci. Food Agric. 96, 742–750. doi: 10.1002/jsfa.7141
Kim, D. H., Cho, W. Y., Yeon, S. J., Choi, S. H., and Lee, C. H. (2019). Effects of lotus (Nelumbo nucifera) leaf on quality and antioxidant activity of yogurt during refrigerated storage. Food Sci. Anim. Resour. 39:792. doi: 10.5851/kosfa.2019.e69
Kolonas, A., Vareltzis, P., Kiroglou, S., Goutzourelas, N., Stagos, D., Trachana, V., et al. (2023). Antioxidant and antibacterial properties of a functional sports beverage formulation. Int. J. Mol. Sci. 24:3558. doi: 10.3390/ijms24043558
Kuzmishyna, I. I. (2024). Medicinal plants and medicinal raw materials: theory and practice. Available online at: https://evnuir.vnu.edu.ua/handle/123456789/23772 (Accessed March 12, 2024).
Lewicki, P. P. (2006). Design of hot air drying for better foods. Trends Food Sci. Technol. 17, 153–163. doi: 10.1016/j.tifs.2005.10.012
Liu, Y.-F., Ling, N., Zhang, B., Chen, C., Mo, X.-N., Cai, J.-Y., et al. (2024). Flavonoid-rich mulberry leaf extract modulate lipid metabolism, antioxidant capacity, and gut microbiota in high-fat diet-induced obesity: potential roles of FGF21 and SOCS2. Food Med. Homol. 1:9420016. doi: 10.26599/FMH.2024.9420016
Lucey, J. A., Tamehana, M., Singh, H., and Munro, P. A. (1999). Stability of model acid milk beverage: effect of pectin concentration, storage temperature and milk heat treatment. J. Texture Stud. 30, 305–318. doi: 10.1111/j.17745-4603.1999.tb00219.x
Manach, C., Scalbert, A., Morand, C., Rémésy, C., and Jiménez, L. (2004). Polyphenols: food sources and bioavailability. Am. J. Clin. Nutr. 79, 727–747. doi: 10.1093/ajcn/79.5.727
Miao, Y.-H., Wang, X., Zhao, X.-M., Hu, Y.-W., Liu, X., and Deng, D.-W. (2025). Co-assembly strategies of natural plant compounds for improving their bioavailability. Food Med. Homol. 2:9420022. doi: 10.26599/FMH.2025.9420022
Moure, A., Cruz, J. M., Franco, D., Domı́nguez, J. M., Sineiro, J., Domı́nguez, H., et al. (2001). Natural antioxidants from residual sources. Food Chem. 72, 145–171. doi: 10.1016/S0308-8146(00)00223-5
Muhammad, D. R. A., Kongor, J. E., and Dewettinck, K. (2021). Investigating the effect of different types of cocoa powder and stabilizers on suspension stability of cinnamon-cocoa drink. J. Food Sci. Technol. 58, 3933–3941. doi: 10.1007/s13197-020-04855-y
Mukherjee, P. K., Mukherjee, D., Maji, A. K., Rai, S., and Heinrich, M. (2009). The sacred lotus (Nelumbo nucifera)–phytochemical and therapeutic profile. J. Pharm. Pharmacol. 61, 407–422. doi: 10.1211/jpp.61.04.0001
Nabil, B., Ouaabou, R., Ouhammou, M., Saadouni, L., and Mahrouz, M. (2020). Impact of particle size on functional, physicochemical properties and antioxidant activity of cladode powder (Opuntia ficus-indica). J. Food Sci. Technol. 57, 943–954. doi: 10.1007/s13197-019-04127-4
Najjaa, H., Ben Arfa, A., Elfalleh, W., Zouari, N., and Neffati, M. (2020). Jujube (Zizyphus lotus L.): benefits and its effects on functional and sensory properties of sponge cake. PLoS One 15:e0227996. doi: 10.1371/journal.pone.0227996
Nicolas, J. J., Richard-Forget, F. C., Goupy, P. M., Amiot, M. J., and Aubert, S. Y. (1994). Enzymatic browning reactions in apple and apple products. Crit. Rev. Food Sci. Nutr. 34, 109–157. doi: 10.1080/10408399409527653
Norra, I., Aminah, A., and Suri, R. (2016). Effects of drying methods, solvent extraction and particle size of Malaysian brown seaweed, Sargassum sp. on the total phenolic and free radical scavenging activity. Int. Food Res. J. 23:1558. Available at: http://www.ifrj.upm.edu.my/23%20(04)%202016/(28).pdf
Norton, I. T., Spyropoulos, F., and Cox, P. (Eds.) (2010). Practical food rheology: an interpretive approach. London, UK: John Wiley & Sons.
Onwude, D. I., Hashim, N., and Chen, G. (2016). Recent advances of novel thermal combined hot air drying of agricultural crops. Trends Food Sci. Technol. 57, 132–145. doi: 10.1016/j.tifs.2016.09.012
Ozarda, O., Barla Demirkoz, A., and Özdemir, M. (2015). Sensory characteristics and antioxidant capacity of red raspberry extract as a preservative in fruity flavoured beverages. J. Food Sci. Technol. 52, 6687–6694. doi: 10.1007/s13197-015-1763-x
Park, L. Y. (2017). Effect of lotus leaf on the quality characteristics and antioxidant properties of bread. Korean J. Food Preserv. 24, 266–273. doi: 10.11002/kjfp.2017.24.2.266
Prakash, O., Chauhan, A. S., Maurya, A. K., and Kudachikar, V. B. (2021). Development and characterisation of kainth fruit beverage formulations: nutritional composition, analysis, and stability study during storage. Culture 5, 704–716. doi: 10.26855/ijfsa.2021.12.019
Qiu, Z. Z., and Chin, K. B. (2022). Evaluation of antioxidant activities of lotus rhizome root powder prepared by different drying conditions and its application to raw and cooked pork patties. Food Packag. Shelf Life 33:100917. doi: 10.1016/j.fpsl.2022.100917
Ranganna, S. (1986). Handbook of analysis and quality control for fruit and vegetable products. McGraw-Hill Incorporated, New Delhi: Tata McGraw-Hill Education.
Septiyani, R., Santoso, U., Raharjo, S., and Wikandari, R. (2024). “The effect of light and temperature in the traditional “Wedang Uwuh” ready-to-drink (RTD) beverages on color stability and brazilin content during storage” in BIO Web of Conferences, vol. 148 (Les Ulis Cedex A, France: EDP Sciences), 02008.
Shahrajabian, M. H., Sun, W., Cheng, Q., and Khoshkharam, M. (2022). “Exploring the quality of foods from ancient China based on traditional Chinese medicine” in Functional foods and nutraceuticals in metabolic and non-communicable diseases (Cambridge, MA, USA: Academic Press), 87–105.
Sun, X., Zhang, Y., Li, J., Aslam, N., Sun, H., Zhao, J., et al. (2019). Effects of particle size on physicochemical and functional properties of superfine black kidney bean (Phaseolus vulgaris L.) powder. PeerJ 7:e6369. doi: 10.7717/peerj.6369
Vebrianty, E., Hajrawati, H., Hatta, W., and Suharyanto, S. (2021). The effect of addition of water spinach (Ipomoea aquatica forsk) on physico-chemical characteristics and antioxidant activity of Bali beef meatballs. IOP Conf. Ser. Earth Environ. Sci. 788:012112. doi: 10.1088/1755-1315/788/1/012112
Wu, M. J., Wang, L., Weng, C. Y., and Yen, J. H. (2003). Antioxidant activity of methanol extract of the lotus leaf (Nelumbo nucifera Gertn.). Am. J. Chin. Med. 31, 687–698. doi: 10.1142/S0192415X03001429
Zheng, Z., Gao, W., Zhu, Z., Li, S., Chen, X., Cravotto, G., et al. (2024). Complexes of soluble dietary fiber and polyphenols from Lotus root regulate high-fat diet-induced hyperlipidemia in mice. Antioxidants 13:466. doi: 10.3390/antiox13040466
Zheng, H., Han, L., Shi, W., Fang, X., Hong, Y., and Cao, Y. (2022). Research advances in lotus leaf as Chinese dietary herbal medicine. Am. J. Chin. Med. 50, 1423–1445. doi: 10.1142/S0192415X22500616
Keywords: lotus leaf powder, green wheat leaf beverage, particle sizes, drying condition, shelf-life
Citation: Guo P and Qiu Z (2025) Effect of different particle-sized lotus leaf powder dried by different conditions on shelf-life of green wheat leaf beverage. Front. Sustain. Food Syst. 9:1653307. doi: 10.3389/fsufs.2025.1653307
Edited by:
Guihun Jiang, Jilin Medical University, ChinaReviewed by:
Sochannet Chheng, Chulalongkorn University, ThailandAnna Mardiana Handayani, State Polytechnic of Jember, Indonesia
Copyright © 2025 Guo and Qiu. This is an open-access article distributed under the terms of the Creative Commons Attribution License (CC BY). The use, distribution or reproduction in other forums is permitted, provided the original author(s) and the copyright owner(s) are credited and that the original publication in this journal is cited, in accordance with accepted academic practice. No use, distribution or reproduction is permitted which does not comply with these terms.
*Correspondence: Zhuangzhuang Qiu, cWl1emh1YW5nemh1YW5nMUBuYXZlci5jb20=