 Chris Macdonald
- University of Cambridge, Cambridge, United Kingdom
High global meat consumption presents significant environmental challenges. Interventions to reduce meat consumption, such as carbon labelling, have shown modest and inconsistent results, a phenomenon potentially explained by an “environmentalist bias.” This paper introduces and tests a consumer-centric “nudge by proxy” approach, which indirectly encourages choices that mitigate or obviate external costs by addressing consumers’ internal motivations. First, a consumer survey of 1,500 UK students identified “protein” as the most significant perceived barrier to adopting a meat-free diet. Subsequently, two choice experiments (N = 3,000) were conducted. Experiment 1 demonstrated that labelling the protein content significantly increased selection of the meat-free option over a meat-based counterpart when compared to both a control group (p < 0.001) and a carbon label group (p < 0.001). Experiment 2 confirmed the efficacy of the protein nudge, showing it had significantly increased the choice of a separate meat-free option by over 100% compared to a control group (p < 0.001). The paper concludes by discussing the importance of consumer engagement and addressing two illusions with future research: the “insufficiency illusion” whereby consumers falsely believe meat-free options to be lacking in a key area, and the “availability illusion,” when meat-free options are available but are genuinely lacking. The author advocates for a practical dual-pronged approach that both reveals and creates better options for the consumer.
Introduction
Global meat production has more than tripled since the 1960s (Godfray et al., 2010; Ritchie et al., 2017; Food and Agriculture Organization of the United Nations, 2022). The ever-increasing industrial-scale production creates a cascade of interconnected consequences for environmental stability, public health, and animal welfare (Benton et al., 2021). In short, the cost of meat extends far beyond the immediate financial cost to the consumer.
Environmental costs
The livestock sector contributes over 16% of all anthropogenic greenhouse gas emissions, a share comparable to the global transport sector (Koneswaran and Nierenberg, 2008; Harwatt and Scar-Harding, 2021). The climate impact is so significant that a global phase-out of animal agriculture could stabilize GHG levels for 30 years and offset over 60% of CO₂ emissions this century (Eisen and Brown, 2022).
Animal agriculture is the largest human use of land, occupying c.80% of all agricultural land (Benton et al., 2021; Hayek et al., 2021). Cattle grazing and the cultivation of feed crops are primary drivers of tropical deforestation due to the inherent inefficiency of converting plant protein into animal protein (Laurance et al., 2014; Broom, 2019; Benton et al., 2021). The sector also accounts for nearly a third of agriculture’s water footprint, largely for irrigating feed crops (Doreau et al., 2012; Hoekstra and Moonen, 2012; Wisser et al., 2024). Furthermore, manure runoff causes widespread water pollution, creating oxygen-depleted dead zones and contaminating water with pathogens—biological agents that cause disease (Burkholder et al., 2007; Koneswaran and Nierenberg, 2008; Won et al., 2017; Manyi-Loh et al., 2018; Pan et al., 2024).
Consequently, “livestock production is the single largest driver of habitat loss” (Machovina et al., 2015). Livestock now accounts for 60% of all mammalian biomass, displacing wild mammals and contributing to the planet’s sixth mass extinction (Laurance et al., 2014; Machovina et al., 2015).
Human health costs
Industrial farming is a primary driver of the antimicrobial resistance crisis due to the routine overuse of antibiotics for growth promotion and disease prevention (Manyi-Loh et al., 2018; Katz et al., 2024). These practices create resistant pathogens that can spread to humans (Manyi-Loh et al., 2018). Furthermore, the high-density confinement and low genetic diversity create a viral mixing bowl for zoonotic diseases, increasing the risk of pandemics (Jones et al., 2013; Subedi et al., 2025).
High consumption of animal products is also linked to non-communicable diseases (medical conditions or diseases that are not spread from person to person). Processed and red meats are associated with increased risk of cardiovascular disease, type 2 diabetes, colorectal cancer, pancreatic cancer, and prostate cancer—accordingly, the International Agency for Research on Cancer have classified processed meat as carcinogenic and non-processed red meat as likely carcinogenic (Pan et al., 2012; Abete et al., 2014; IARC, 2015; Wang et al., 2016; IARC, 2018; Shi et al., 2023).
It is also important to consider the profound opportunity costs. For example, what else could we be doing with all that land? It is estimated that if the world went vegan, our land use for agriculture would fall from over 4 billion hectares to 1 billion (Poore and Nemecek, 2018; Ritchie, 2021a). This 75% reduction would free up an area the size of the entire African continent—a size greater than three of the top five largest countries combined: USA, Canada, and Brazil (Poore and Nemecek, 2018; Ritchie, 2021a). Importantly, this estimate is based on reference diets that meet calorie and protein nutritional requirements (Poore and Nemecek, 2018; Ritchie, 2021a). Supposing we went vegan by 2050 and gave the land back to nature, it is estimated that we could sequester over 500 billion tonnes of CO2—for reference, every year, we emit less than 40 billion tonnes of CO2 from fossil fuels (Ritchie, 2021b; Hayek et al., 2021).
Beyond the more quantitative direct and indirect costs to humanity, animal agriculture raises profound ethical questions regarding the suffering of sentient beings. Standard practices—such as artificial insemination, systemic restrictions on natural behaviours, and stressful transport and slaughter conditions—inflict chronic fear, pain, and distress (Mench et al., 2008; Broom, 2010; Cockram, 2019). Egg-laying hens are often afforded less space than a single sheet of paper, and sows are often confined to crates so small they cannot turn around (Taverne and van der Meulen, 2014; Mench and Keeling, 2020). Such severe confinement in barren environments is commonplace; the majority of livestock is factory-farmed (Ritchie, 2023). Indeed, even if provided with additional space and legitimately held under the highest possible animal welfare standards, there are important ethical questions that arise from systematic mass killing; over 80 billion land animals are killed for meat production every year (Ritchie et al., 2017). Historian, Bregman (2025), offers a useful comparative to give a sense of the scale: “Over 200 million land animals worldwide are slaughtered every day. That’s 80 billion animals a year. To give you an idea, the number of people who have ever lived is estimated at 117 billion.”
In response to such devastating impacts, profound missed opportunities, and growing ethical concerns, researchers have been investigating interventions that seek to reduce meat consumption. A popular intervention involves displaying eco-labels such as carbon emissions data which, unfortunately, is showing to have mixed and modest results (Lacroix et al., 2024).
Eco and carbon labelling
The field of carbon labelling gained significant momentum following the introduction of the first major, systematic carbon labelling scheme by the UK’s Carbon Trust in 2006. Despite early concerns (Boardman, 2008), research in the field expanded rapidly thereafter; Liu et al. (2020) catalogued 175 academic articles on carbon labelling during the 2007–2019 period. More broadly, a wider range of varied eco-labels have been explored. However, such interventions are producing inconclusive and limited results (Lacroix et al., 2024; Ding et al., 2025).
The review by Potter et al. (2021), analysing a range of eco-labelling interventions for food and drink products, revealed that over 20% failed to produce any statistically significant change in consumer behaviour. Lacroix et al. (2024) explored a range of front-of-package food eco-labelling and concluded that results were mixed and that any impact is best observed with consumers who already show concern and knowledge of environmental impacts. This is echoed by Onwezen et al. (2021), who concluded that the results are mixed and that such labels are not always understood. Likewise, the UK Food Standards Agency (2021) concluded that food labelling for sustainable consumption has limited impact and that any measured impact rarely generalises to real-world purchase settings.
Several studies have specifically explored displaying carbon emissions for food choices in authentic settings such as a grocery store, a restaurant, and canteens (Vanclay et al., 2011; Spaargaren et al., 2013; Brunner et al., 2018; Lohmann et al., 2022; Casati et al., 2023). Such studies consistently report small, though occasionally statistically significant, impacts on consumer choices and associated emissions. A recent trial by Lohmann et al. (2024), explored carbon-footprint labelling in an interactive web setting that mimics online food-delivery platforms—in this study, carbon-footprint labelling was ineffective (meat dishes were chosen more frequently).
The mixed and modest results of carbon labelling are perhaps the result of such novel and complicated data being difficult to quickly interpret (Meyerding et al., 2019; Rondoni and Grasso, 2021). It has long been established in consumer psychology literature that effective labelling interventions are the result of first engaging with the end consumer, learning what is important to them, and then communicating that as simply and succinctly as possible (Ogilvy, 1963; Dichter, 1964; Kotler, 1967). Meal-choice settings can often make consumers feel time-pressured and there is often a wide range of options, which can cause the consumer to seek to reduce information via cognitive shortcuts. Furthermore, calculating product-specific emissions data and displaying it is well documented as posing multiple technical challenges (Finkbeiner et al., 2006; Soimakallio et al., 2011; Liu et al., 2023; Olanrewaju et al., 2024).
Therefore, given its impracticality, limited efficacy, and that it goes against much of what decades-old consumer psychology literature tells us, why is carbon labelling such a popular intervention?
The answer, I believe, is, in part, due to what I refer to as the “environmentalist bias” (Macdonald, 2024).
People often think that their own beliefs and values are more common than they actually are—known as the “false consensus effect” (Ross et al., 1977). Ross et al. uncovered that people have the tendency to “see one’s own behavioral choices and judgments as relatively common and appropriate to existing circumstances while viewing alternative responses as uncommon, deviant, or inappropriate” (p. 280). As noted by Choi and Cha (2019), this can result in blind spots and overconfidence in one’s decisions. This is neatly captured by Choi et al. (2024), “people will agree what I think.” After decades of subsequent research, the false consensus effect has been shown to be robust and prevalent in multiple settings (Marks and Miller, 1987; Mullen et al., 1985; Fabrigar and Krosnick, 1995; Welborn et al., 2017; Bunker and Varnum, 2021; Dohmen et al., 2023).
Accordingly, researchers who are also environmentalists (those who want to protect the environment) might tend towards interventions that highlight negative environmental impacts because this is what influences them personally, and they may assume that it will be equally persuasive to the average consumer. This environmentalist bias might help to explain the continued exploration of carbon labelling as an intervention (Macdonald, 2024). More broadly, there may be a “scientist bias,” where researchers may tend towards interventions that display some form of specialist scientific data, which is more meaningful to scientists with specialist skills and knowledge (Macdonald, 2024). It may also help to explain what I call the “anomaly of asking” whereby academic researchers who seek to influence behavioural change will often fail to first engage with those they are seeking to influence. By contrast, effective interventions that come out of the private sector are often the result of prior engagement with the consumer. For example, pioneering and highly successful marketers such as Ogilvy (1963) and Dichter (1964) implemented and strongly advocated for data-driven approaches such as prior consumer interviews, focus groups, and A/B testing.
Nudge by proxy
In an attempt to uncover a more effective nudge and mitigate various researcher biases, I decided to conduct a consumer-led approach that resulted in discussions with thousands of meat consumers (Macdonald, 2025). Like the early pioneers of consumer psychology, I organised workshops, focus groups, interviews, and surveys. I asked simple and direct questions such as “Why are you buying this?,” “Why are you not buying this?,” “What would convince you to buy this?,” “What would deter you from buying this?.” One of the goals was to ascertain which types of data may be more meaningful and persuasive to the average consumer. From the beginning, protein content was emerging as a key focal point (Macdonald, 2020). In subsequent years, this continued to emerge as a common theme (Macdonald, 2025). This led me to develop the concept of “situational myth-busting” (Macdonald, 2023), which involves displaying information that addresses common consumer misconceptions. In associated experiments, I found that protein labelling was able to outperform carbon labelling (Macdonald, 2023; Macdonald, 2024). The approach evolved into the broader concept of a “nudge by proxy”—indirect interventions that do not call attention to the external cost that one is seeking to address (Macdonald, 2024; Macdonald, 2025).
The research and experiments in this paper expand on this work. Firstly, it expands on the initial market research; my aforementioned 2020 paper, for example, is becoming out of date, it had a relatively small sample size, and the survey design could be improved. Secondly, much of my approach and results have been explorative and are unpublished; therefore, this paper formalises and documents my work in a manner that will better facilitate further research. Finally, across two experiments, I further explore the efficacy of protein labels as a nudge by proxy. In particular, to address gaps in the literature and build upon prior work, the two experiments explore the nudge by proxy with expanded participant demographics, larger sample sizes, and improved experiment designs.
Consumer survey
A consumer survey was distributed in an attempt to uncover the most frequently cited barrier that is preventing consumers from switching to a meat-free diet. If a clear most-frequent response is uncovered, it would then be used to inform the creation of a subsequent nudge intervention.
Note that this survey seeks to uncover barriers. Frequent, recent, and robust studies have explored why people have transitioned to a meat-free diet (Heiss et al., 2021; Białek-Dratwa et al., 2024; Veganuary, 2024; Dhont and Ioannidou, 2025; Veganuary, 2025). Such studies consistently reveal negative impacts on health and the environment, as well as animal welfare as top motivations. By contrast, my consumer survey explores why people are not transitioning to a meat-free diet. This framing is used to isolate a single precise barrier to subsequently inform an indirect, nudge by proxy approach that does not call attention to the external cost that one might be seeking to mitigate or obviate. This approach of engaging with the average consumer to uncover and address the most common barrier is in line with the consumer-centric strategy used by the early pioneers of consumer psychology (Ogilvy, 1963; Dichter, 1964; Kotler, 1967).
Survey questions
When designing the survey, it was important to acknowledge that questions can be a problematic tool to uncover truths. As noted by Choi and Pak (2005), “Bias may arise from the way individual questions are designed, the way the questionnaire as a whole is designed, and how the questionnaire is administered or completed.”
For example, framing bias and leading questions can result in responses that are inaccurate (Foddy, 1993; Aday, 1996; Erčulj and Šulc, 2025); order bias can significantly influence the responses (Perreault, 1975; Israel and Taylor, 1990; Thau et al., 2021); multiple-choice questions can steer the participant (Choi and Pak, 2005; Hyman and Sierra, 2016); lengthy questionnaires can bias results due to response fatigue (Smeds, 2022; Zimba and Gasparyan, 2023); and the presence of participants and researchers can result in conformity bias and experimenter demand effects (Asch, 1956; Burke et al., 2010; Campbell-Meiklejohn et al., 2010; Zizzo, 2010).
To remove order bias and response fatigue, only one question was provided to each participant. To mitigate steering the participant, the responses were to be given via an open text field rather than a multiple-choice format. To mitigate framing bias and wording bias, three versions of the question were created using different terminology. While removing multiple-choice response options and opting for an open text field can help to mitigate acquiescence, steering, and order bias, the scope of the open text field will introduce new influences. To mitigate this, the three questions contained different response options: (1) up to 3 words, (2) a single paragraph, (3) a list of 3.
The three questions were as follows:
Q1 = In up to three words, what is the main reason you would not stop eating meat?
Q2 = In a single paragraph, what is the most significant reason why you would not consider switching to a meat-free diet?
Q3 = Starting with the most significant, what are the top three reasons stopping you from adopting a diet that does not include meat?
Participants
There were 1,500 participants in total (50/50 male-to-female ratio). Country of residence and nationality were both confided to the United Kingdom. Each participant was also a student, aged 18–25, and was non-vegan and non-vegetarian.
Procedure
The questions were distributed via Prolific, the academic survey distribution service. 100% of the participants in the Prolific database are ID-checked and verified. Each question was distributed to 500 participants. Quota sampling was used to ensure a 50/50 male-to-female ratio. Each participant was only permitted to view and respond to one of the questions. As there were three questions in total, there were 1,500 participants. The questions were accessed via a private online portal. No identifying data was collected.
Results
Responses were read through line by line as an initial control check. It was noted that the results were simple, concise, and clear, with protein appearing frequently. For example, the response data contained the following entries, “need the protein,” “good protein source,” “protein and taste,” “protein for gym,” “protein needs,” “PROTEIN.” It was also observed that there were cases where the concept of meat and the concept of protein appeared to be inextricably linked (e.g., “Getting protein from meat feels vital to me,” “It is healthy to eat meat/protein,” “Meat is protein”).
Due to the narrow subject remit of the descriptive questions, the conciseness of the responses, and the repetition across participants, a frequency analysis was conducted (Bell, 2018; Saunders et al., 2019). A top 10 frequency detector approach was deemed optimal due to the goal of uncovering the most frequently cited barrier (Field, 2018; Tabachnick and Fidell, 2019).
Frequency analysis
An initial light cleaning process was conducted: first, a standardisation process was conducted that converted all letters to lowercase and corrected all typos (each typo correction was human-verified); next, non-relevant words were removed (e.g., “it,” “than,” “that”). After the cleaning process, word frequencies were calculated for each group and each question. The results can be seen in Table 1 with the frequency of each word in parentheses.
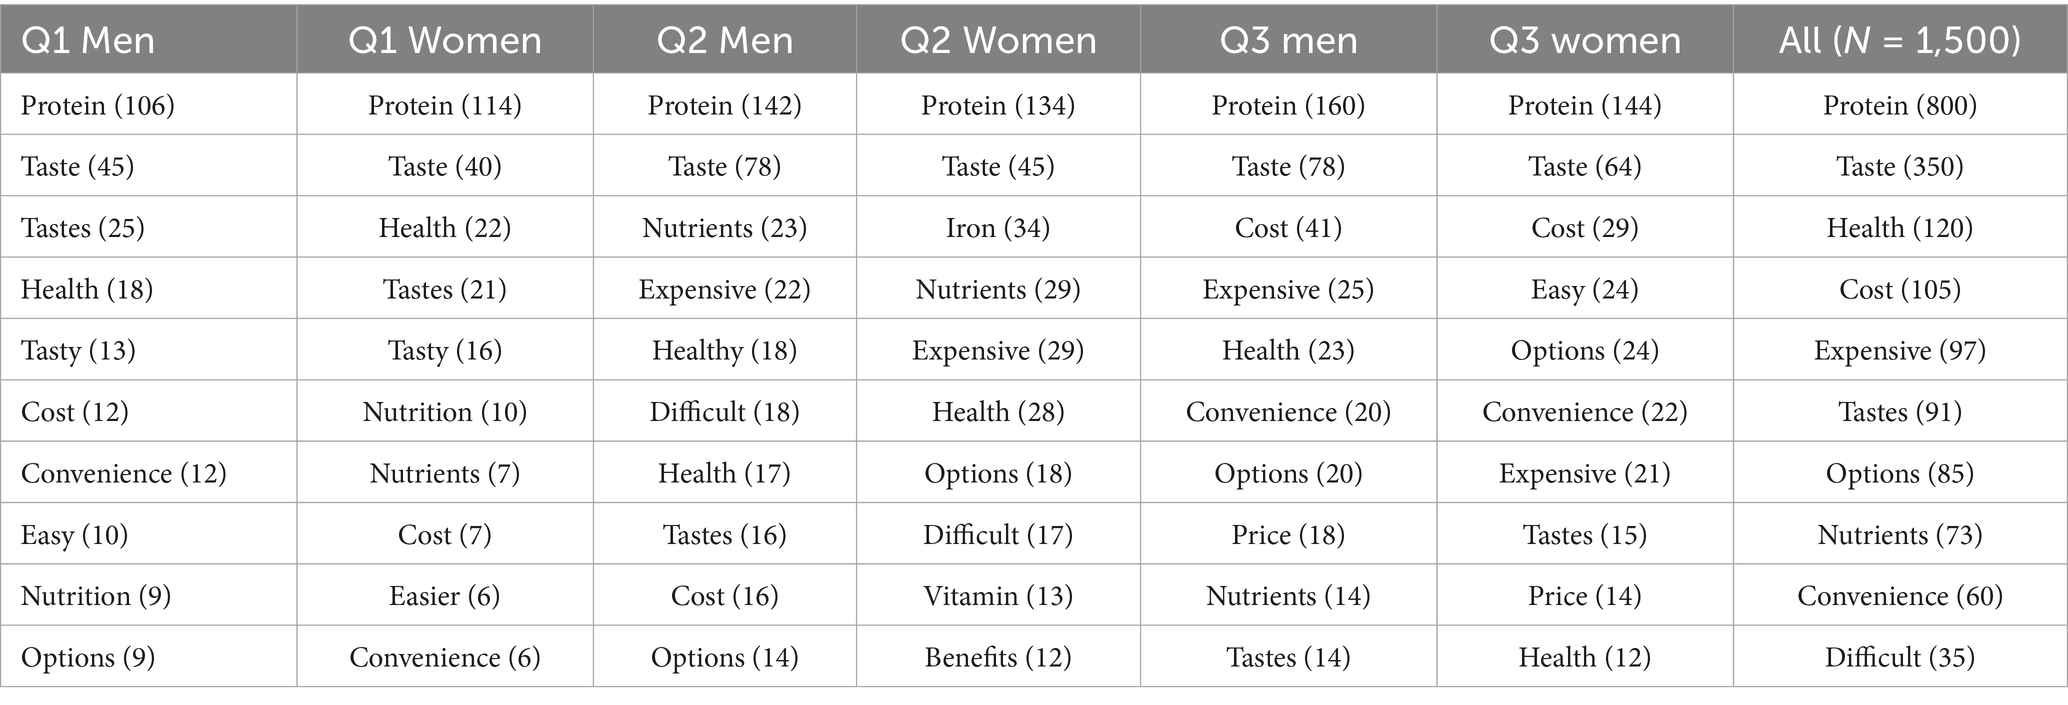
Table 1. A table showing word frequencies for the responses to questions 1, 2, and 3. The table shows the top ten most frequent words. The frequency of each word is provided in parentheses.
The top 10 lists contained sufficient depth as each column contained counts that differed by an order of magnitude—for example, with Q3 for Men, “tastes” was number 10 on the frequency list and “protein” was number 1 (14 vs. 160—an order of magnitude). The full results revealed that regardless of the question and regardless of gender, the most frequent word was “protein.” When looking at all 1,500 responses, “protein” appeared 2.29 times more than the second most frequent word, “taste”—evident in the graph in Figure 1. It is important to note that despite the already high frequency of “protein,” it is underreported as multiple indirect references were used throughout the survey with terms such as “health,” “nutrition,” “growth,” “macros,” “muscle,” and “amino acids”—e.g., “The health benefits,” “My nutritional needs,” “To build muscle and to be a healthy human you must eat meat,” “Scared I will lose muscle,” “I go to the gym and so meat is essential for my health,” “Meat is necessary for growth,” “Meat has essential amino acids that the body needs to function,” “Hard to hit macros.” Such examples reference or suggest “protein” without explicitly mentioning it.
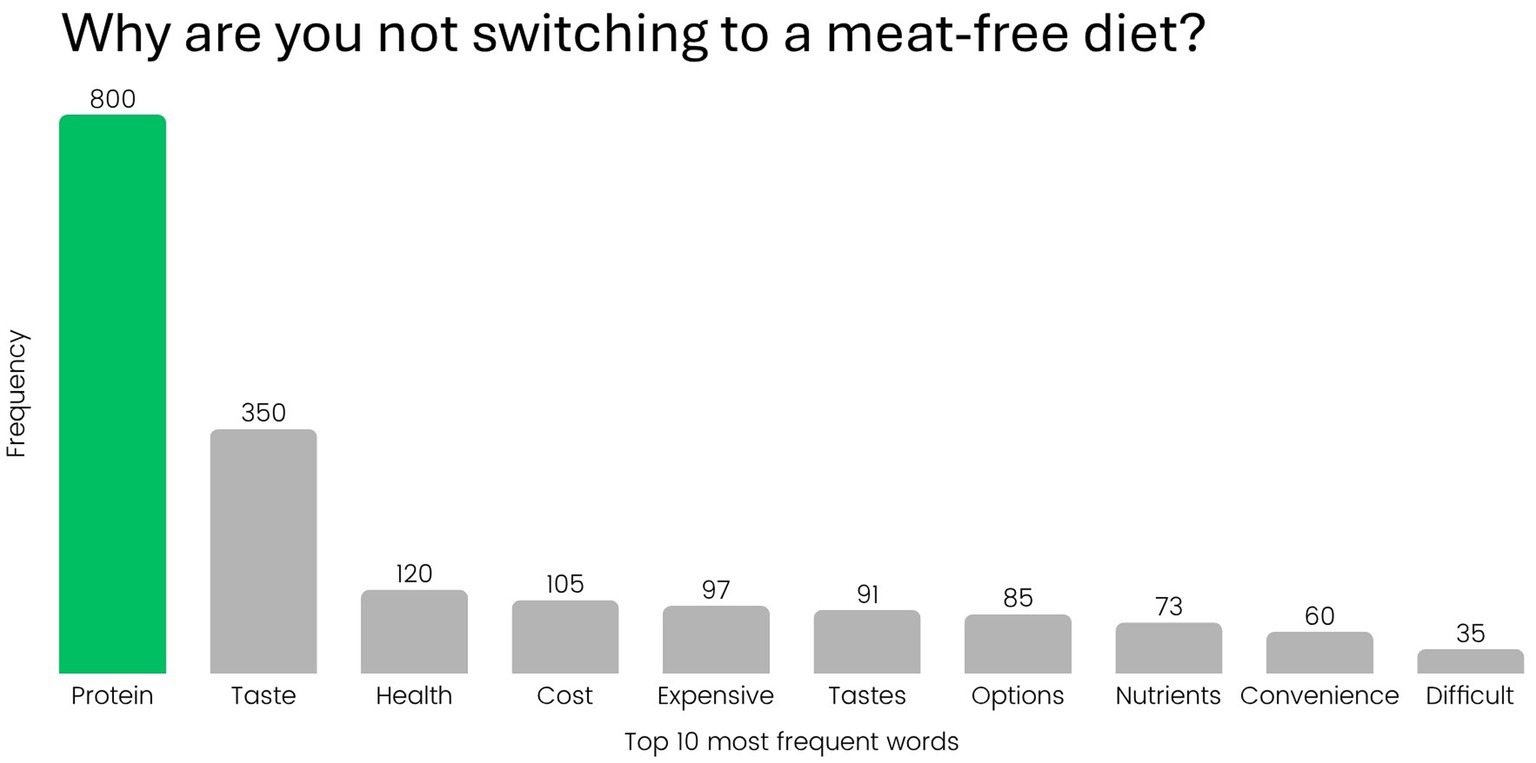
Figure 1. A bar graph showing word frequencies for the responses to questions 1, 2, and 3 combined. The graph shows the top ten most frequent words. The frequency of each word is written above each bar.
Exploratory thematic analysis
When looking at the most frequent words, clear groupings can be made. For example, “taste” could logically be grouped with “tastes.” Likewise, “cost” and “expensive” could be logically grouped together. When doing so, this does not uncover a new most-frequent response (“taste” + “tastes” = 441; “cost” + “expensive” = 202; “protein” = 800) but it does provide valuable insight. When including additional potential groupings (e.g., “convenience” and “difficult,” “health” and “nutrients”), a temporal theme (before, during, and after) emerged. In short, consumer thoughts around acquiring and preparing a food item (such as “cost”), thoughts around eating it (such as “taste”), and thoughts about how it will benefit them afterwards (such as the “nutrients” they will have acquired). This evolved into the Triple E Framework: Ease, Enjoyment, and Extraction.
Words such as “cost” and “convenience” could be thought of as the “ease” of acquiring the food, words such as “taste” could be thought of as the “enjoyment” of eating the food, and words such as “nutrients” and “protein” could be thought of as what the consumer expects/hopes to “extract” from food. The application of this framework via thematic colour coding, and stacking and grouping, can be seen in Table 2.
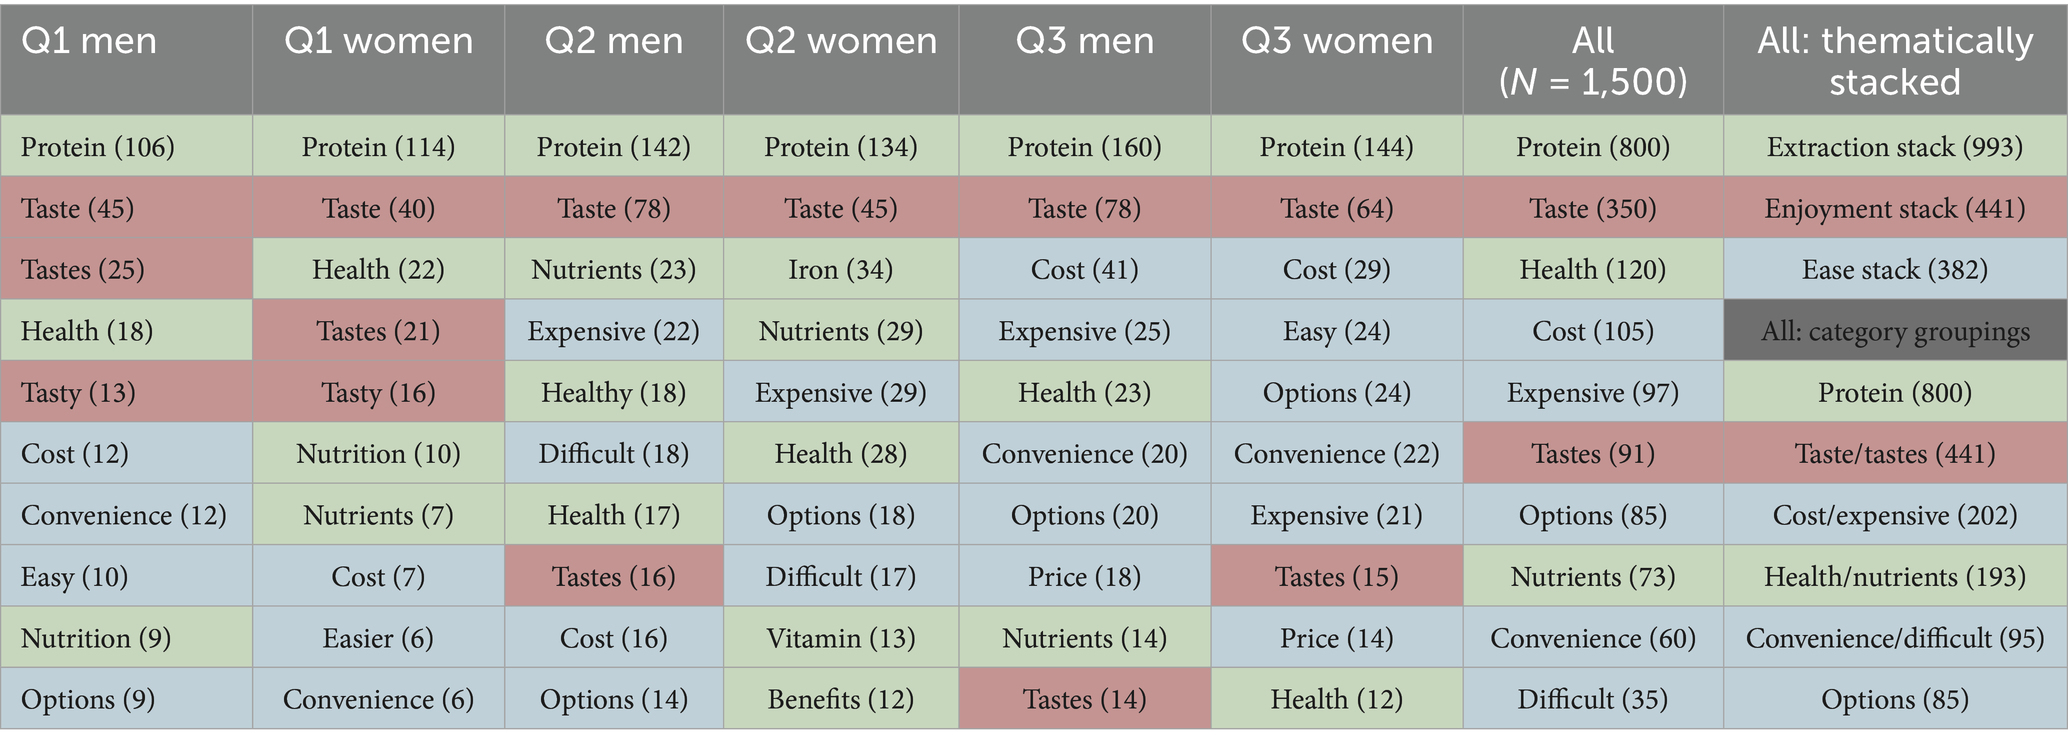
Table 2. A table showing word frequencies for the responses to questions 1, 2, and 3. The table shows the top ten most frequent words. The frequency of each word is provided in parentheses. A thematic colour coding has been applied: Green = words associated with “Extraction”, Red = words associated with “Enjoyment”, Blue = words associated with “Ease”.
The extraction stack (which contains “protein,” “nutrients,” and “health”) is the largest at 993 words—followed by the enjoyment stack at 441, and the ease stack at 382. Accordingly, words relating to the health and nutritional benefits that the consumer can personally extract from the food account for the majority of the words among the top 10 most frequently used words. This is aptly visualised in the treemap in Figure 2. It was noted that, as food is a very personal item as it enters the consumer’s body, it was logical that consumers may be focused on what their bodies will extract from the item, or what foregoing a food choice may deprive them of.

Figure 2. A treemap showing word frequencies for the responses to questions 1, 2, and 3 combined. The treemap shows the top ten most frequent words. A thematic colour coding has been applied: Green = words associated with “Extraction”, Red = words associated with “Enjoyment”, Blue = words associated with “Ease”.
Based on the responses, the subsequent two experiments explored the efficacy of nudges that include protein data, as well as protein data plus additional nutrient data. The latter could be described as a “polynudge” as it combines multiple motivations (Macdonald, 2024). Each experiment follows a conventional three-arm format (Control vs. Intervention 1 vs. Intervention 2).
Experiment 1
Experiment 1 compares a conventional green nudge intervention (carbon labelling) with a green nudge by proxy intervention (protein labelling). There are three hypotheses:
H1 = Participants will be more likely to purchase the meat-free food item when the label includes additional emissions data when compared to the control group (where the label only includes product name and cost).
H2 = Participants will be more likely to purchase the meat-free food item when the label includes additional protein data when compared to the control group.
H3 = Participants will be more likely to purchase the meat-free food item when the label includes additional protein data when compared to the label that includes additional emissions data.
These hypotheses are in line with prior experiments that found that carbon labelling outperforms control conditions (Lohmann et al., 2022; Macdonald, 2023) and protein labelling outperforms carbon labels (Macdonald, 2023; Macdonald, 2024). More broadly, the carbon labelling hypothesis is in line with the theory that individuals might be more likely to consume products that are openly flagged as more sustainable to signal prosocial values to others (Berger, 2017; Puska, 2018; McGuicken and Palomo-Vélez, 2021).
While the experiment shares similarities with my prior experiments (Macdonald, 2023; Macdonald, 2024), there are three significant improvements: (1) an experiment design that includes imagery and is therefore not merely text-based, (2) a significantly larger sample size (1,500 vs. up-to-600), and (3) the widening of the demographic remit to include women—prior experiments were focused on Men as, on average, Men are less likely to adopt a meat-free diet (Graça et al., 2015; Mensink et al., 2016; Rosenfeld and Tomiyama, 2021).
Participants
There were 1,500 participants in total (50/50 male-to-female ratio). Country of residence and nationality were both confided to the United Kingdom. Each participant was also a student, aged 18–25, and was non-vegan and non-vegetarian.
Procedure
In the experiment, participants were sent a link giving them access to a private online portal where they were asked to look at a menu and answer a single question: “Which one would you buy?” The participants were randomly assigned to one of three groups: Control Group, Carbon Group, and Protein Group. There were 500 participants in each group.
In all groups, the menu contained only two items from Greggs (a well-known British bakery chain): a sausage roll, and a vegan sausage roll. Non-fictional items from a well-known organisation with their up-to-date images, names, and costs were selected to more accurately reflect reality. The two items were selected due to their similarities in an attempt to reduce unintended variables; both items are the same price and are very similar in shape, colour, texture, and taste.
For the Control Group, the labelling included only the item names and the item costs; for the Carbon Group, the labelling included additional carbon footprint data in parentheses; and for the Protein Group, the labelling included additional protein data in parentheses.
Neither a weighted ingredient list nor carbon footprint data was available on the Greggs website. Therefore, carbon footprint values from non-branded similar products were used, which were provided by the Consumer Data Research Centre (Booth et al., 2023). Protein values were available from the Greggs website.
The images provided to each group can be seen in Figure 3.
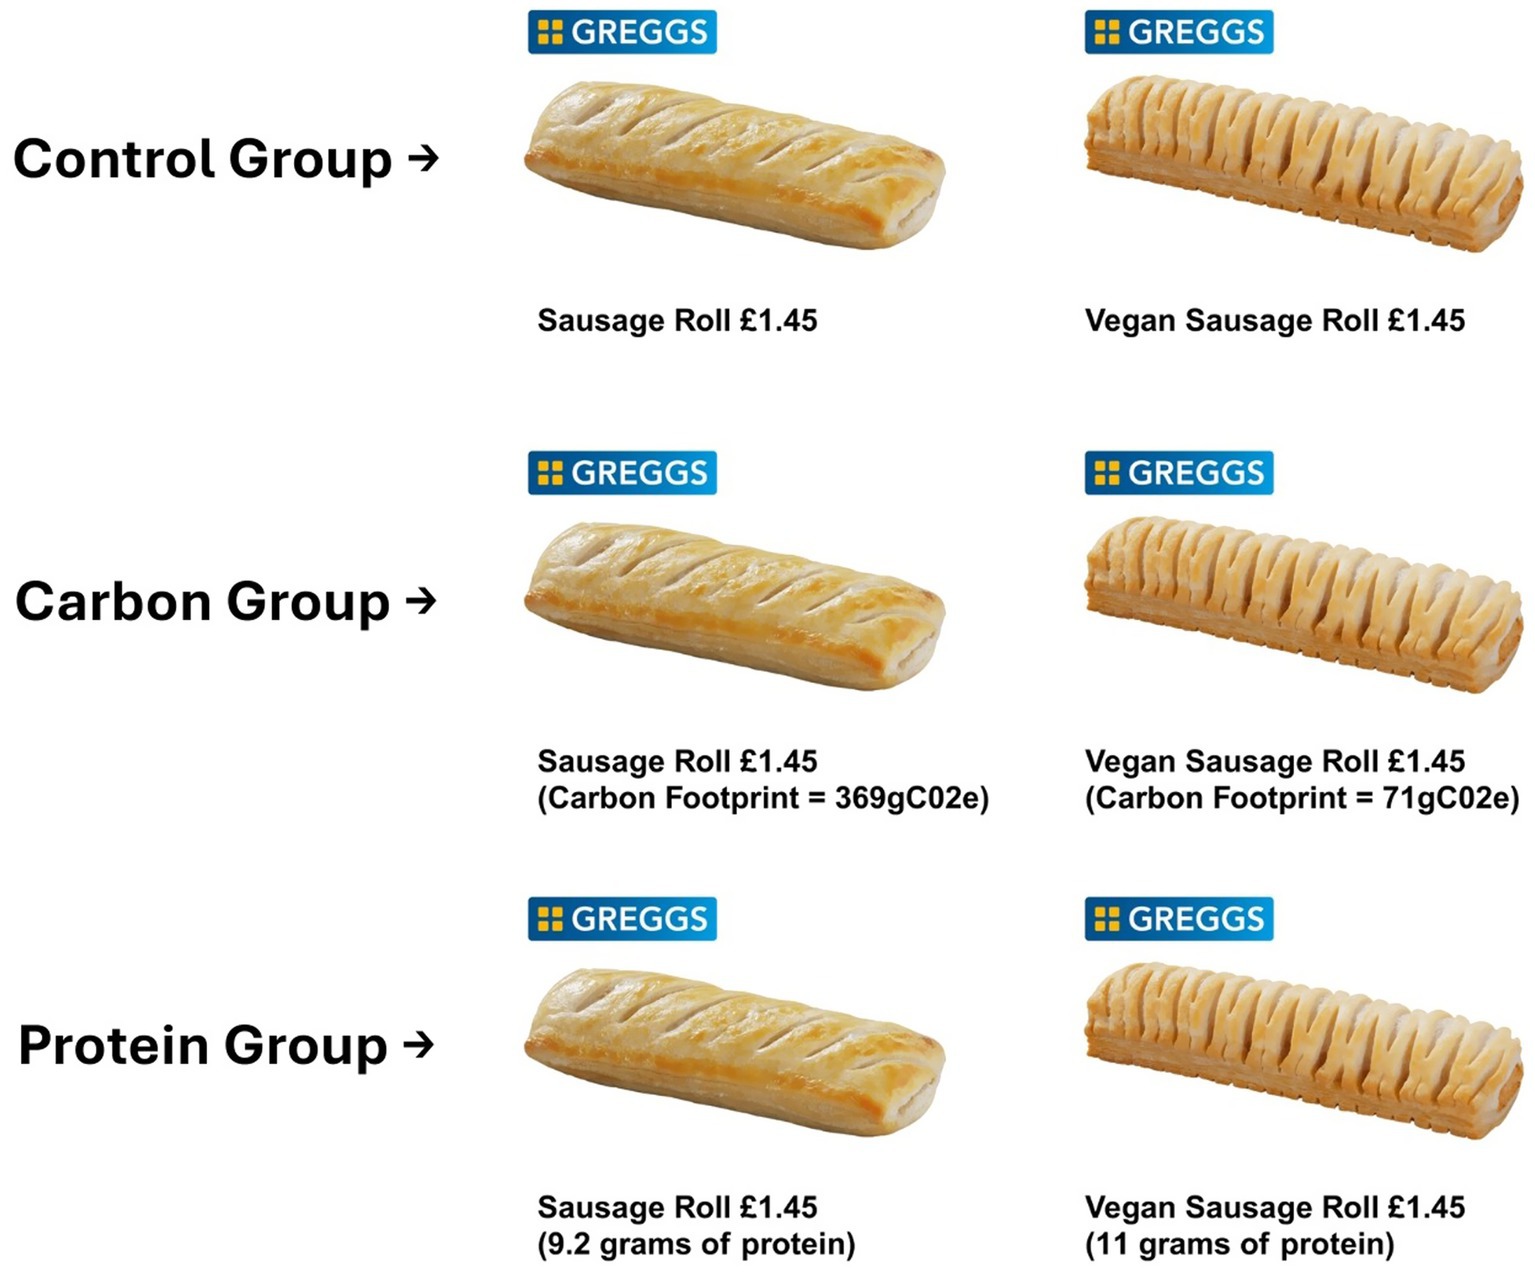
Figure 3. The images provided to each group in Experiment 1. For the Control Group, the labelling includes only the item names and the item costs; for the Carbon Group, the labelling includes additional carbon footprint data in parentheses; and for the Protein Group, the labelling includes additional protein data in parentheses.
Results
In the Control Group, 45 Men and 52 Women selected the meat-free option; in the Carbon Group, 57 Men and 68 Women selected the meat-free option; and in the Protein Group, 94 Men and 90 Women selected the meat-free option. Results displayed as a bar graph can be seen in Figure 4.
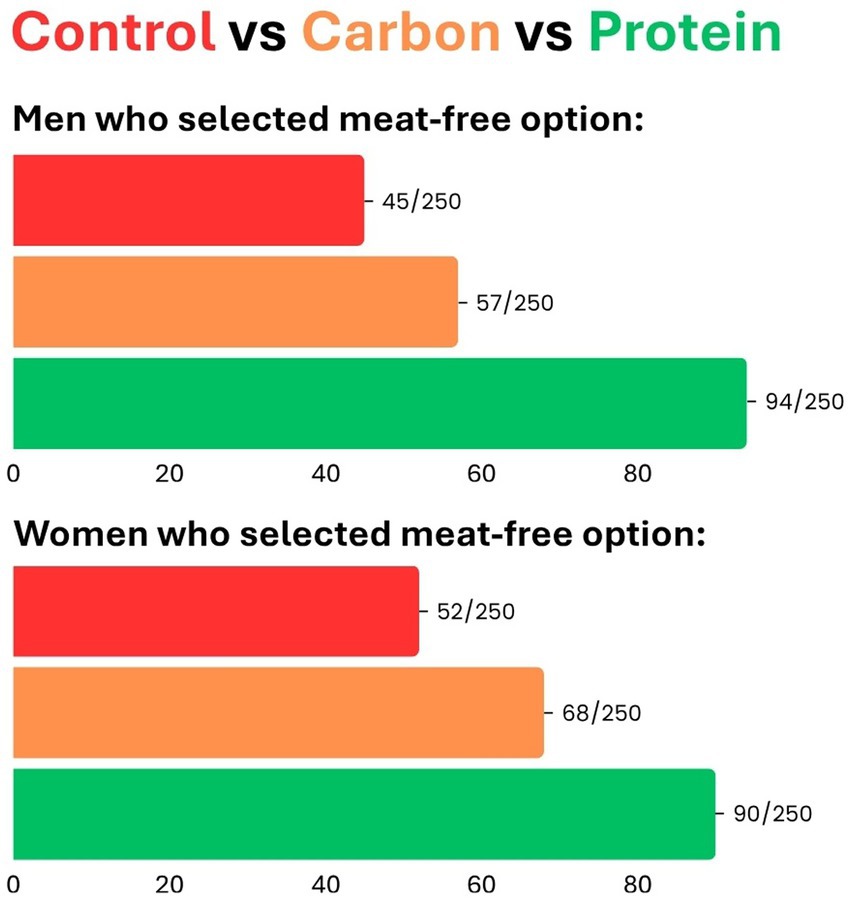
Figure 4. A bar graph showing the results from Experiment 1: Red = Control Group, Orange = Carbon Group, Green = Protein Group. The values depicted reflect the number of participants who selected the meat-free option.
H1
Hypothesis 1 was that more participants would purchase the meat-free option when the label included additional emissions data when compared to the control group. The descriptive data supports this hypothesis as in the Control Group, 18% of Men and 20.8% of Women selected the meat-free option whereas, in the Carbon Group, 22.8% of Men and 27.2% of Women selected the meat-free option.
The responses required to assess the hypotheses involve binary categorical variables: either the participants chose the meat-free food item, or they did not. Accordingly, to assess for statistical significance, I ran a two-sample test for equality of proportions (α = 0.05)—using Pearson’s chi-squared test.
The H1 test revealed that there was not a statistically significant difference between the Control Group and the Carbon Group for both Men [χ2 (1) = 1.49, p = 0.22] and Women [χ2 (1) = 2.46, p = 0.11]. Therefore, the null hypothesis cannot be rejected and H1 does not hold.
H2
Hypothesis 2 was that participants will be more likely to purchase the meat-free food item when the label includes additional protein data when compared to the control group. The descriptive data supports this hypothesis as in the Control Group, 18% of Men and 20.8% of Women selected the meat-free option, whereas in the Protein Group, 37.6% of Men and 36% of Women selected the meat-free option.
The H2 test revealed a statistically significant difference between the Protein Group and the Control Group [Men (χ2 (1) = 22.95, p < 0.001); Women (χ2 (1) = 13.46, p < 0.001)], with a small-to-medium effect size [Men (Cohen’s h = 0.44); Women (Cohen’s h = 0.33)]. Therefore, the null hypothesis is rejected and H2 holds.
H3
Hypothesis 3 was that more participants would purchase the meat-free option when the label included additional protein data when compared to additional carbon data. The descriptive data supports this hypothesis as in the Carbon Group, 22.8% of Men and 27.7% of Women selected the meat-free option, whereas in the Protein Group, 37.6% of Men and 36% of Women selected the meat-free option.
The H3 test revealed that there was a statistically significant difference between the Carbon Group and the Protein Group for both Men [χ2 (1) = 12.29, p < 0.001; Cohen’s h = 0.324] and Women [χ2 (1) = 4.08, p = 0.04; Cohen’s h = 0.178]. Therefore, the null hypothesis is rejected and H3 holds.
Experiment 2
Experiment 2 compares a nudge by proxy intervention (protein labelling) with a polynudge intervention (protein & fat labelling). There are three hypotheses:
H1 = Participants will be more likely to purchase the meat-free food item when the label includes additional protein data when compared to the control group.
H2 = Participants will be more likely to purchase the meat-free food item when the label includes additional protein and fat data when compared to the control group.
H3 = Participants will be more likely to purchase the meat-free food item when the label includes additional protein and fat data when compared to the label that includes additional protein data only.
H1 and H2 are in line with Experiment 1 and prior experiments (Macdonald, 2023; Macdonald, 2024) that found that protein labelling outperforms control conditions, H3 is in line with the thematical analysis conducted on the responses from the initial consumer survey, namely that health and nutrients (extractions) appear to be a key focus for the consumer.
Participants
There were 1,500 participants in total (50/50 male-to-female ratio). Country of residence and nationality were both confided to the United Kingdom. Each participant was also a student, aged 18–25, and was non-vegan and non-vegetarian.
Procedure
In the experiment, participants were sent a link giving them access to a private online portal where they were asked to look at a menu and answer a single question: “Which one would you buy?” The participants were randomly assigned to one of three groups: Control Group, Protein Group, and Protein and Fat Group. There were 500 participants in each group.
In all groups, the menu contained only two items from Greggs: a sausage breakfast roll, and a vegan sausage breakfast roll. For the Control Group, the labelling included only the item names and the item costs; for the Protein Group, the labelling included additional protein data; and for the Protein and Fat Group, the labelling included additional protein and fat data. Note that, in Experiment 2, a different item was used (the breakfast roll rather than the sausage roll) and a different method of displaying the additional data (as a stylised label rather than via plain text which was done to more accurately reflect real-world scenarios). These differences help to provide convergent evidence.
Carbon footprint values from non-branded similar products were provided by the Consumer Data Research Centre (Booth et al., 2023), and protein and fat values were available from the Greggs website.
The images provided to each group can be seen in Figure 5.
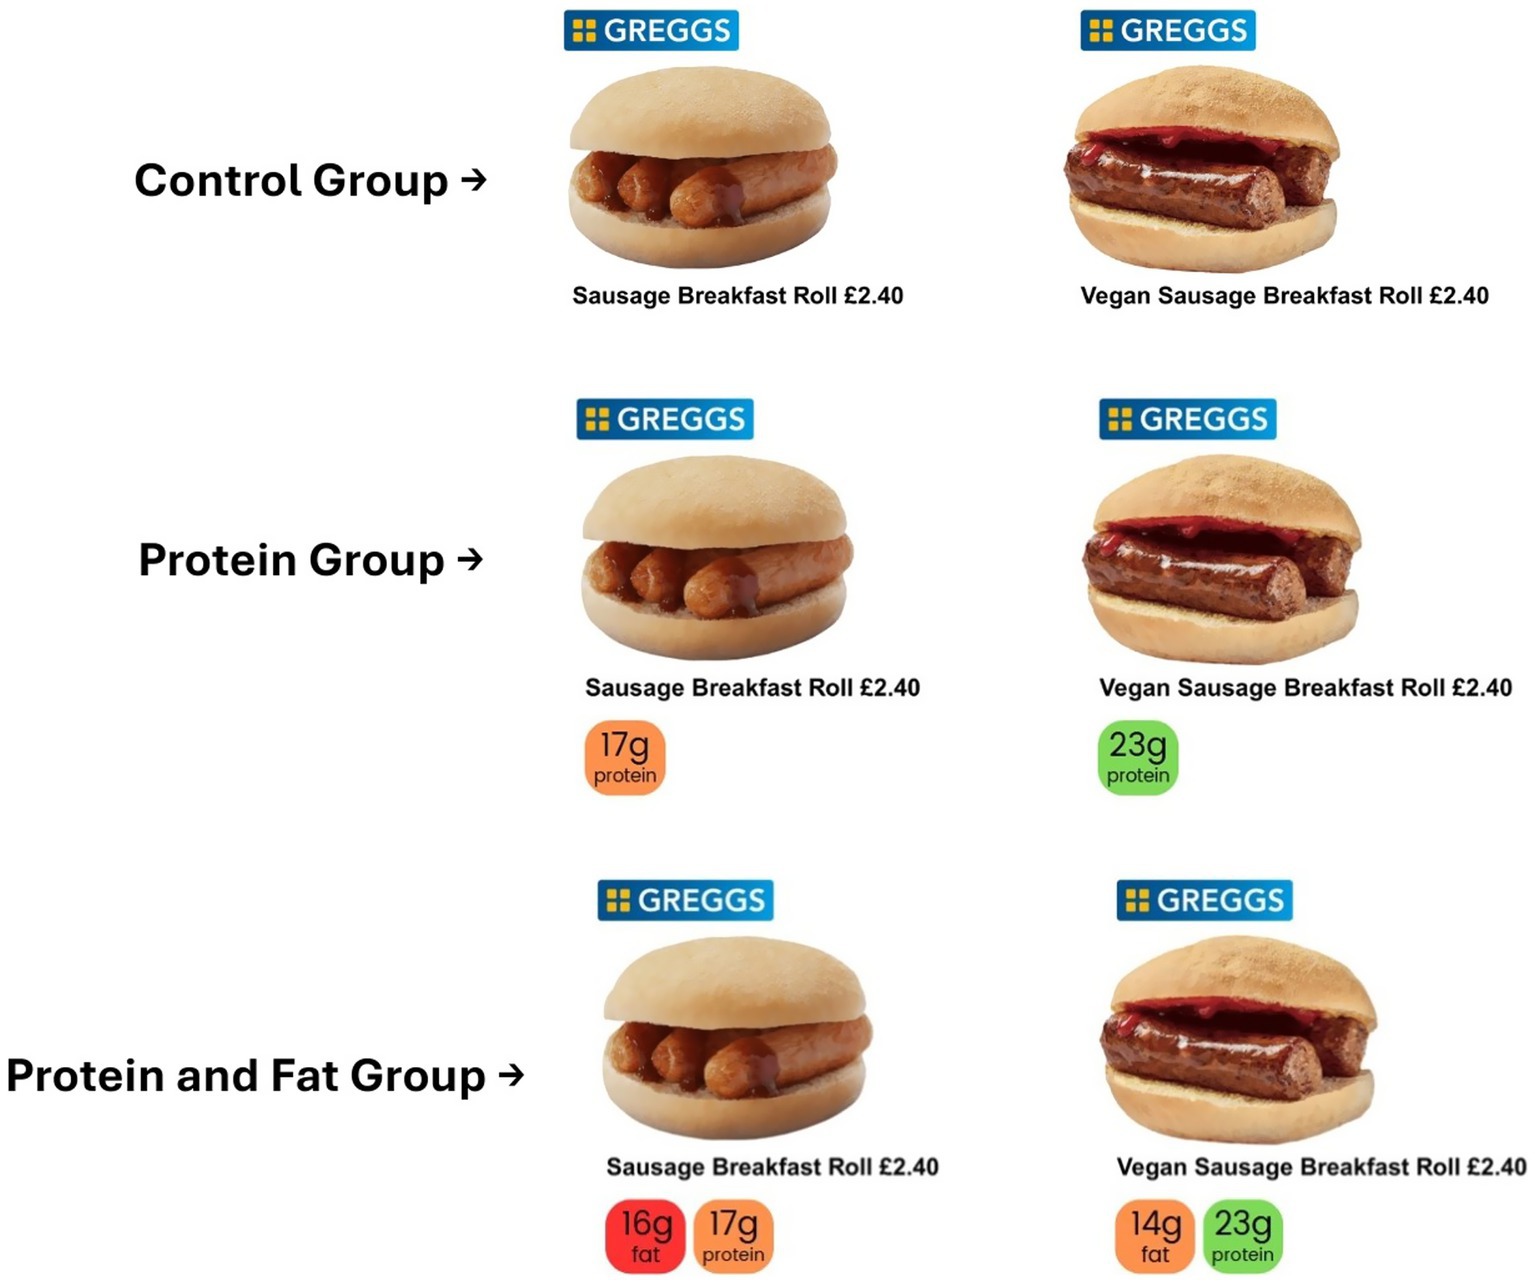
Figure 5. The images provided to each group in Experiment 2. For the Control Group, the labelling includes only the item names and the item costs; for the Protein Group, the labelling includes additional protein data via a stylised label; and for the Protein and Fat Group, the labelling includes additional protein and fat data via a stylised label.
Results
In the Control Group, 46 Men and 60 Women selected the meat-free option; in the Protein Group, 129 Men and 132 Women selected the meat-free option; and in the Protein and Fat Group, 120 Men and 134 Women selected the meat-free option. Results displayed as a bar graph can be viewed in Figure 6.
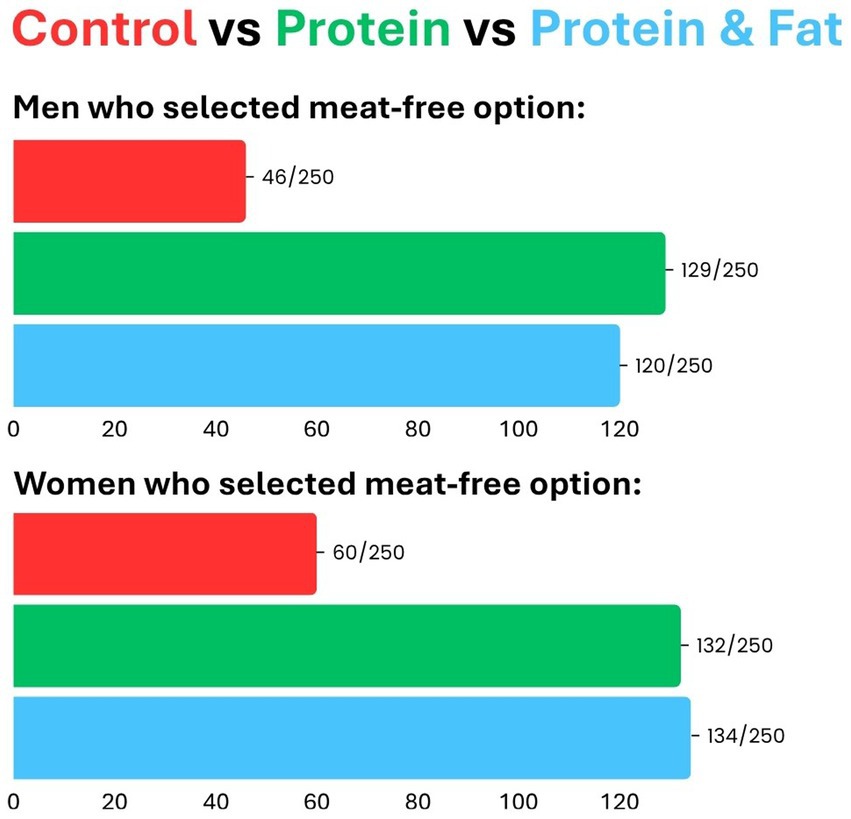
Figure 6. A bar graph showing the results from Experiment 2: Red = Control Group, Green = Protein Group, Blue = Protein and Fat. The values depicted reflect the number of participants who selected the meat-free option.
H1
Hypothesis 1 was that more participants would purchase the meat-free option when there was additional protein data when compared to the control group.
The descriptive data supports this hypothesis as in the Control Group, 18.4% of Men and 24% of Women selected the meat-free option whereas, in the Protein Group, 51.6% of Men and 52.8% of Women selected the meat-free option.
The H1 test revealed a statistically significant difference between the Protein Group and the Control Group [Men (χ2 (1) = 59.112, p < 0.001); Women (χ2 (1) = 42.622, p < 0.001)], with a medium-to-large effect size [Men (Cohen’s h = 0.72); Women (Cohen’s h = 0.60)]. Therefore, the null hypothesis is rejected and H2 holds.
H2
Hypothesis 2 was that participants will be more likely to purchase the meat-free food item when there was additional protein and fat data when compared to the control group. The descriptive data supports this hypothesis as in the Control Group, 18.4% of Men and 24% of Women selected the meat-free option, whereas in the Protein and Fat Group, 48% of Men and 53.6% of Women selected the meat-free option.
The H2 test revealed a statistically significant difference between the Protein and Fat Group and the Control Group [Men (χ2 (1) = 48.06, p < 0.001); Women (χ2 (1) = 44.88, p < 0.001)], with a medium-to-large effect size [Men (Cohen’s h = 0.64); Women (Cohen’s h = 0.62)]. Therefore, the null hypothesis is rejected and H2 holds.
H3
Hypothesis 3 was that more participants would purchase the meat-free option when there was additional protein and fat data when compared to additional protein data only. The descriptive data is inconclusive as in the Protein Group, 51.6% of Men and 52.8% of Women selected the meat-free option, whereas in the Protein and Fat Group, 48% of Men and 53.6% of Women selected the meat-free option.
The H3 test revealed that there was not a statistically significant difference between the Protein Group and the Protein and Fat Group for both Men [χ2 (1) = 0.512, p = 0.47] and Women [χ2 (1) = 0.008, p = 0.92]. Therefore, the null hypothesis cannot be rejected and H3 does not hold.
Discussion
The path to reducing global meat consumption is paved with consumer choices. The most effective way to influence these choices is not necessarily to educate consumers about complicated external costs but to understand and address their immediate, personal motivations. The popular focus on carbon labelling appears to be a manifestation of an “environmentalist bias,” leading to interventions that are more meaningful to their creators than to their target audience. Accordingly, in alignment with the early pioneers of consumer psychology, I began by asking consumers simple, direct questions to uncover the most frequently cited barrier (Ogilvy, 1963; Dichter, 1964; Kotler, 1967).
The consumer survey, designed to mitigate common biases, unequivocally identified protein as the primary stated barrier preventing the adoption of a meat-free diet for both men and women. This insight fed into the two subsequent choice experiments that included interventions that revealed high protein content in the meat-free options.
In line with my prior experiments (Macdonald, 2023; Macdonald, 2024), protein labelling outperformed both the control group and the carbon labelling group. The efficacy of the protein label was promising; in Experiment 2, the meat-free meal choice was selected by less than a quarter of the participants in the control group, and by over half of the participants in the protein group—a finding consistent for men and women. This increase of more than 100% made the selection of the meat-free item the majority decision and thus marked a significant step-change.
The promising results, now repeated over multiple experiments, open many opportunities for further experimentation. Furthermore, unlike carbon labelling, protein data is undisputed, readily available, and easy to display.
However, while the results are compelling, the study’s limitations must be acknowledged. The participant pool consisted exclusively of UK-based students aged 18–25. While this demographic is a key target for dietary change interventions, the findings may not be generalisable to other age groups, socioeconomic strata, or cultural contexts. It may well be the case that protein is only a key barrier among the reported demographics. In other words, there may be a UK Gen Z “protein hype.” For other demographics, taste, cost, or tradition might be stronger drivers of food choice. Furthermore, the experiments were conducted in a hypothetical online setting. Although designed for realism using real-world products and pricing, this cannot fully replicate the complex environmental and social cues of an actual purchasing situation. Future research should aim to address these limitations. Replicating these experiments in real-world environments would be a critical next step to validate the findings.
Future research could also explore the long-term effects of these nudges to see if the behavioural shift is sustained over time. It should also be noted that protein was revealed as a driving motivator using self-report measures. Accordingly, unconscious barriers may have been missed. Protein may be a proxy for a broader barrier, such as conformity to gender symbolism (Rothgerber, 2013; Camilleri et al., 2024; Velzeboer et al., 2024) or perceived value for money or social status (Hupkens et al., 2000; Chan and Zlatevska, 2019; Wiesli, 2025). These broader barriers would be in line with a known observation that resistance to dietary change is often associated with protecting one’s self-image (Onwezen et al., 2025). Even if protein were confirmed as the primary barrier across a broader audience, there would still be significant further work to be done to determine the optimal intervention strategy. Would a label-based intervention be sufficient, or would it need to be paired with a more comprehensive educational component to help counteract the known widespread misinformation and lobbying from large animal agriculture corporations? (Mialon and Mialon, 2017; Clare et al., 2022; Krattenmacher et al., 2024; Loy and Jacquet, 2025).
Moreover, the inconclusive result of the polynudge in Experiment 2 warrants further investigation. It may be the case that protein content is the dominant perceived nutritional benefit in a simple protein-rich breakfast item. Likewise, it may be the case that consumers are less concerned about fat content, as such breakfast items may be viewed as inherently high in fat. Accordingly, polynudge experiments with other items in different settings may yield more promising results. Likewise, perhaps a different data point would be more efficacious. For example, would combining protein information with calorie count or fibre yield different results? What about another category of data inspired by the Triple E Framework, such as interventions focusing on “Ease”—such as highlighting the quick cooking times for plant-based meals? What about combining a nutrient-based nudge with an ethical nudge? However, especially with regard to the latter, one needs to consider the quality of the data and potential consumer and vendor pushback. There also needs to be consideration with regard to the trade-off between the potential increased efficacy of product-specific interventions and the potential increased scalability of interventions that can be more widely applied. It may also be the case that a polynudge is inherently less effective than a single, more targeted motivator.
The experiments revealed in this paper address what I refer to as an “insufficiency illusion” whereby consumers falsely believe certain products to be lacking in a key area (e.g., protein content). However, it is important to acknowledge that this is not always a false belief. While the meat-free options in the reported studies were comparable to the meat options (and by some metrics better than the meat options), this was facilitated by the item choice; meat sausages are often higher in fat and lower in protein than other common meat-based products (Pérez et al., 2023; Leivers et al., 2025). There are many cases where meat-free options are genuinely lacking in a given area—including in key aspects frequently raised in the aforementioned consumer survey, such as affordability, taste, and nutrition. Accordingly, I encourage future researchers to also address what I refer to as “availability illusion.” This is a form of tokenism whereby meat-free options are available but are genuinely lacking in a key area—for example, if the meat option is a chicken burger but the meat-free option is a potato burger, then an authentic equivalent/alternative has not been provided to the consumer. In such scenarios, vendors and researchers who seek to reduce meat consumption must embrace inconvenient truths and improve the meat-free options. Accordingly, an honest audit of the meat-free offerings will form a key part of future interventions. It may be the case that prior experiments have yielded modest results or have limited potential because the meat-free options were not well considered and were legitimately poor quality. Furthermore, pushing consumers towards bad meat-free options can ultimately increase meat consumption in the long term. This is an inherent risk with nudge interventions; they may be the result of a short-sighted “stick a new label on it” approach that fails to critically review and evaluate products prior to seeking to increase their consumption. Ultimately, it is my belief that behavioural scientists should deeply engage with both consumers and the products prior to rolling out interventions. We should start from first principles (e.g., are the meat-free options good? If not, how can we make them good? If they are good, let us ask consumers why they aren’t choosing them).
In short, if we are to successfully decrease meat consumption, we must fix the negatives as well as better signpost positives, a multi-pronged approach that addresses the availability illusion as well as the insufficiency illusion—a practical data-driven approach that both creates and reveals better options for the consumer.
Data availability statement
The original contributions presented in the study are included in the article/supplementary material, further inquiries can be directed to the corresponding author.
Ethics statement
The studies involving humans were approved by University of Cambridge: Cambridge Psychology Research Ethics Committee. The studies were conducted in accordance with the local legislation and institutional requirements. The participants provided their written informed consent to participate in this study.
Author contributions
CM: Conceptualization, Investigation, Writing – review & editing, Writing – original draft.
Funding
The author declares that financial support was received for the research and/or publication of this article. This research was partly funded by Lucy Cavendish College, University of Cambridge.
Conflict of interest
The author declares that the research was conducted in the absence of any commercial or financial relationships that could be construed as a potential conflict of interest.
Generative AI statement
The author declares that no Gen AI was used in the creation of this manuscript.
Any alternative text (alt text) provided alongside figures in this article has been generated by Frontiers with the support of artificial intelligence and reasonable efforts have been made to ensure accuracy, including review by the authors wherever possible. If you identify any issues, please contact us.
Publisher’s note
All claims expressed in this article are solely those of the authors and do not necessarily represent those of their affiliated organizations, or those of the publisher, the editors and the reviewers. Any product that may be evaluated in this article, or claim that may be made by its manufacturer, is not guaranteed or endorsed by the publisher.
References
Abete, I., Romaguera, D., Vieira, A. R., Lopez de Munain, A., and Norat, T. (2014). Association between total, processed, red and white meat consumption and all-cause, CVD and IHD mortality: a meta-analysis of cohort studies. Br. J. Nutr. 112, 762–775. doi: 10.1017/S000711451400124X
Aday, L. A. (1996). Designing and conducting health surveys. 2nd Edn. San Francisco, CA: Jossey-Bass.
Asch, S. E. (1956). Studies of independence and conformity: I. A minority of one against a unanimous majority. Psychol. Monogr. Gen. Appl. 70, 1–70. doi: 10.1037/h0093718
Benton, T., Bieg, C., Harwatt, H., Wellesley, L., and Bodirsky, B. (2021). Food system impacts on biodiversity loss. London: Chatham House.
Berger, J. (2017). Are luxury brand labels and “green” labels costly signals of social status? An extended replication. PLoS One 12:e0170216. doi: 10.1371/journal.pone.0170216
Białek-Dratwa, A., Stoń, W., Staśkiewicz-Bartecka, W., Grajek, M., Krupa-Kotara, K., and Kowalski, O. (2024). The psychosocial aspects of vegetarian diets: a cross-sectional study of the motivations, risks, and limitations in daily life. Nutrients 16:2504. doi: 10.3390/nu16152504
Boardman, B. (2008). Carbon labelling: too complex or will it transform our buying? Significance 5, 168–171. doi: 10.1111/j.1740-9713.2008.00322.x
Booth, C., Pontin, F., James, W., Tong, J., Jordan, J., and Ogundeji, O. (2023). Carbon footprint of food at the University of Leeds. Leeds: Consumer Data Research Centre, University of Leeds.
Bregman, R. (2025). Moral ambition: stop wasting your talent and start making a difference. London: Bloomsbury Publishing.
Broom, D. (2010). Animal welfare: an aspect of care, sustainability, and food quality. J. Vet. Med. Educ. 37, 83–88. doi: 10.3138/jvme.37.1.83
Broom, D. (2019). Land and water usage in beef production systems. Animals 9:286. doi: 10.3390/ani9060286
Brunner, F., Kurz, V., Bryngelsson, D., and Hedenus, F. (2018). Carbon label at a university restaurant—label implementation and evaluation. Ecol. Econ. 146, 658–667. doi: 10.1016/j.ecolecon.2017.12.012
Bunker, C. J., and Varnum, M. E. W. (2021). How strong is the association between social media use and false consensus? Comput. Human Behav. 125:106947. doi: 10.1016/j.chb.2021.106947
Burke, C. J., Tobler, P. N., Schultz, W., and Baddeley, M. (2010). Striatal BOLD response reflects the impact of herd information on financial decisions. Front. Hum. Neurosci. 4:48. doi: 10.3389/fnhum.2010.00048
Burkholder, J. P., Libra, B., Weyer, P., Heathcote, S., Kolpin, D., Thorne, P. S., et al. (2007). Impacts of waste from concentrated animal feeding operations on water quality. Environ. Health Perspect. 115, 308–312. doi: 10.1289/ehp.8839
Camilleri, L., Kirkovski, M., Scarfo, J., Jago, A., and Gill, P. R. (2024). Understanding the meat-masculinity link: traditional and non-traditional masculine norms predicting men’s meat consumption. Ecol. Food Nutr. 63, 355–386. doi: 10.1080/03670244.2024.2361818
Campbell-Meiklejohn, D. K., Bach, D. R., Roepstorff, A., Dolan, R. J., and Frith, C. D. (2010). How the opinion of others affects our valuation of objects. Curr. Biol. 20, 1165–1170. doi: 10.1016/j.cub.2010.04.055
Casati, M., Soregaroli, C., Rommel, J., Luzzani, G., and Stranieri, S. (2023). Please keep ordering! A natural field experiment assessing a carbon label introduction. Food Policy 120, 102523–102517. doi: 10.1016/j.foodpol.2023.102523
Chan, E. Y., and Zlatevska, N. (2019). Jerkies, tacos, and burgers: subjective socioeconomic status and meat preference. Appetite 132, 257–266. doi: 10.1016/j.appet.2018.08.027
Choi, I., and Cha, O. (2019). Cross-cultural examination of the false consensus effect. Front. Psychol. 10:2747. doi: 10.3389/fpsyg.2019.02747
Choi, J., Hong, Y., and Kim, B. (2024). People will agree what i think: investigating LLM’s false consensus effect. arXiv. Available at: https://arxiv.org/abs/2407.12007. [Epub ahead of preprint]
Choi, B. C., and Pak, A. W. (2005). A catalog of biases in questionnaires. Prev. Chronic Dis. 2:A13. Available at: https://pubmed.ncbi.nlm.nih.gov/15670466/
Clare, K., Maani, N., and Milner, J. (2022). Meat, money and messaging: how the environmental and health harms of red and processed meat consumption are framed by the meat industry. Food Policy 109:102234. doi: 10.1016/j.foodpol.2022.102234
Cockram, M. (2019). Fitness of animals for transport to slaughter. Transl. Anim. Sci. 60, 423–429. doi: 10.1093/tas/txy057
Dhont, K., and Ioannidou, M. (2025). Health, environmental and animal rights motives for meat reduction, vegetarianism and veganism. Food Qual. Prefer. 118:105196. doi: 10.1016/j.foodqual.2024.105196
Dichter, E. (1964). Handbook of consumer motivations: the psychology of the world of objects. New York: McGraw-Hill.
Ding, J., Xia, Z., Geiger, N., Ye, J., Zhang, C., Constantino, S., et al. (2025). A meta-analysis of the real-world impact of sustainability labeling on consumer choices. Res. Sq. doi: 10.21203/rs.3.rs-6557928/v1
Dohmen, T., Quercia, S., and Willrodt, J. (2023). A note on salience of own preferences and the consensus effect. J. Econ. Behav. Organ. 209, 15–21. doi: 10.1016/j.jebo.2023.02.017
Doreau, M., Corson, M., and Wiedemann, S. (2012). Water use by livestock: a global perspective for a regional issue? Anim. Front. 2, 9–16. doi: 10.2527/af.2012-0036
Eisen, M., and Brown, P. (2022). Rapid global phaseout of animal agriculture has the potential to stabilize greenhouse gas levels for 30 years and offset 68 percent of CO2 emissions this century. PLoS Clim. 1:e0000010. doi: 10.1371/journal.pclm.0000010
Erčulj, V., and Šulc, A. (2025). Swayed by leading questions. Qual. Quant. 59, 191–209. doi: 10.1007/s11135-024-01934-6
Fabrigar, L. R., and Krosnick, J. A. (1995). Attitude importance and the false consensus effect. Personal. Soc. Psychol. Bull. 21, 468–479. doi: 10.1177/0146167295215005
Field, A. (2018). Discovering statistics using IBM SPSS statistics. 5th Edn. London: SAGE Publications.
Finkbeiner, M., Inaba, A., Tan, R., Christiansen, K., and Klüppel, H. J. (2006). The new international standards for life cycle assessment: ISO 14040 and ISO 14044. Int. J. Life Cycle Assess. 11, 80–85. doi: 10.1065/lca2006.02.002
Foddy, W. (1993). Constructing questions for interviews and questionnaires: theory and practice in social research. Cambridge: Cambridge University Press.
Food and Agriculture Organization of the United Nations (2022). FAOSTAT: livestock manure. Rome: FAO.
Godfray, H., Beddington, J., Crute, I., Haddad, L., Lawrence, D., Muir, J., et al. (2010). Food security: the challenge of feeding 9 billion people. Science 327, 812–818. doi: 10.1126/science.1185383
Graça, J., Calheiros, M. M., and Oliveira, A. (2015). Attached to meat? (un) willingness and intentions to adopt a more plant-based diet. Appetite 95, 113–125. doi: 10.1016/j.appet.2015.06.024
Harwatt, H., and Scar-Harding, A. (2021). Emissions from animal agriculture—16.5% is the new minimum figure. Sustainability 13:6276. doi: 10.3390/su13116276
Hayek, M., Harwatt, H., Ripple, W., and Mueller, N. (2021). The carbon opportunity cost of animal-sourced food production on land. Nat. Sustain. 4, 21–24. doi: 10.1038/s41893-020-00603-4
Heiss, R., Gordon, J. S., and Heneke, R. (2021). A qualitative examination of the motivations behind veganism. Appetite 166:105482. doi: 10.1016/j.appet.2021.105614
Hoekstra, A., and Mekonnen, M. (2012). The water footprint of humanity. Proc. Natl. Acad. Sci. U.S.A. 109, 3232–3237. doi: 10.1073/pnas.1109936109
Hupkens, C. L. H., Knibbe, R. A., and Drop, M. J. (2000). Social class differences in food consumption: the explanatory value of permissiveness and health and cost considerations. Eur. J. Pub. Health 10, 108–113. doi: 10.1093/eurpub/10.2.108
Hyman, M. R., and Sierra, J. J. (2016). Open-versus close-ended survey questions. Bus. Outlook 14:2. Available at: https://www.academia.edu/16266400/Open_versus_close_ended_survey_questions
IARC (2015). IARC monographs evaluate consumption of red meat and processed meat. Lyon: World Health Organization.
Israel, G. D., and Taylor, C. L. (1990). Can response order bias evaluations? Eval. Program Plann. 13, 365–371. doi: 10.1016/0149-7189(90)90021-N
Jones, B., Grace, D., Kock, R., Alonso, S., Rushton, J., Said, M., et al. (2013). Zoonosis emergence linked to agricultural intensification and environmental change. Proc. Natl. Acad. Sci. USA 110, 8399–8404. doi: 10.1073/pnas.1208059110
Katz, S., and Banerjee, R.Committee on Infectious DiseasesCouncil on Environmental Health and Climate Change (2024). Use of antibiotics in animal agriculture: implications for pediatrics: technical report. Pediatrics 154:e2024068467. doi: 10.1542/peds.2024-068467
Koneswaran, G., and Nierenberg, D. (2008). Global farm animal production and global warming: impacting and mitigating climate change. Environ. Health Perspect. 116, 578–582. doi: 10.1289/ehp.11034
Kotler, P. (1967). Marketing management: analysis, planning, and control. Englewood Cliffs, NJ: Prentice-Hall.
Krattenmacher, J., Espinosa, R., Sanders, E., Twine, R., and Ripple, W. J. (2024). The Dublin declaration: gain for the meat industry, loss for science. Environ. Sci. Policy 162, 103922–103913. doi: 10.1016/j.envsci.2024.103922
Lacroix, P., Blanchemanche, S., Gabillet, A., Guichard, M., Sirieix, L., and Gallen, C. (2024). Strengths and weaknesses of food eco-labeling: a review. Front. Nutr. 11:1381135. doi: 10.3389/fnut.2024.1381135
Laurance, W., Sayer, J., and Cassman, K. (2014). Agricultural expansion and its impacts on tropical nature. Trends Ecol. Evol. 29, 107–116. doi: 10.1016/j.tree.2013.12.001
Leivers, S., Nilsson, A., Haugen, J. E., Høst, V., Nersten, S., Wetterhus, E. M., et al. (2025). Impact on lipid profile and influence on sensory, texture and structural properties when replacing saturated fats with rapeseed oil in frankfurter-type sausages. Eur. Food Res. Technol. 251, 2211–2224. doi: 10.1007/s00217-025-04758-2
Liu, T. C., Wu, Y. C., and Chau, C. F. (2023). An overview of carbon emission mitigation in the food industry: efforts, challenges, and opportunities. Processes 11:1993. doi: 10.3390/pr11071993
Liu, J., Zhao, M., and Wang, Y. (2020). A bibliometric analysis of carbon labeling schemes in the period 2007–2019. Energies 13:4233. doi: 10.3390/en13164233
Lohmann, P. M., Gsottbauer, E., Doherty, A., and Kontoleon, A. (2022). Do carbon footprint labels promote climatarian diets? Evidence from a large-scale field experiment. J. Environ. Econ. Manag. 114:102693. doi: 10.1016/j.jeem.2022.102693
Lohmann, P. M., Gsottbauer, E., Farrington, J., Human, S., and Reisch, L. (2024). Choice architecture promotes sustainable choices in online food-delivery apps. PNAS Nexus 3:422. doi: 10.1093/pnasnexus/pgae422
Loy, L., and Jacquet, J. (2025). The animal agriculture industry’s obstruction of campaigns promoting individual climate action. Clim. Pol., 1–10. doi: 10.1080/14693062.2025.2460603
Macdonald, C. (2020). Climate psychology: what is preventing the uptake in lifestyle changes that would significantly reduce one's environmental impact? Open Sci. J. 5, 1–15. doi: 10.23954/osj.v5i3.2490
Macdonald, C. (2023). 'Plant-based' versus 'vegan' & 'high protein' versus 'low carbon': exploring situational myth-busting, product labels, and green nudges that increase sustainable meal choices. Res. Psychol. Behav. Sci. 11, 7–11. doi: 10.12691/rpbs-11-1-2
Macdonald, C. (2024). Increasing sustainable behaviour with new approaches to green nudging. Res. Psychol. Behav. Sci. 12, 1–6. doi: 10.12691/rpbs-12-1-1
Macdonald, C. (2025). From emissions to protein: using consumer insights to increase sustainable food consumption. iMPACT. Available at: https://www.theimpactmagazine.org/magazine/july-september-2025-issue/
Machovina, B., Feeley, K., and Ripple, W. (2015). Biodiversity conservation: the key is reducing meat consumption. Sci. Total Environ. 536, 419–431. doi: 10.1016/j.scitotenv.2015.07.022
Manyi-Loh, C., Mamphweli, S., Meyer, E., and Okoh, A. (2018). Antibiotic use in agriculture and its consequential resistance in environmental sources: potential public health implications. Molecules 23:795. doi: 10.3390/molecules23040795
Marks, G., and Miller, N. (1987). Ten years of research on the false-consensus effect: an empirical and theoretical review. Psychol. Bull. 102, 72–90. doi: 10.1037/0033-2909.102.1.72
McGuicken, T., and Palomo-Vélez, G. (2021). What do carbon labels signal? The role of biospheric values on perceptions of “green” food consumers. J. Food Prod. Market. 27, 340–364. doi: 10.1080/10454446.2021.2021119
Mench, J., James, H., Pajor, E., and Thompson, P. (2008). The welfare of animals in concentrated animal feeding operations. Report to the Pew Commission on Industrial Farm Animal Production. Available at: https://www.pewtrusts.org/~/media/legacy/uploadedfiles/phg/content_level_pages/reports/pcifapfinalpdf.pdf
Mench, J. A., and Keeling, L. J. (2020). “The welfare of laying hens” in Improving animal welfare: a practical approach. 3rd ed (Wallingford: CABI), 256–277.
Mensink, G. B. M., Lage Barbosa, C., and Brettschneider, A. K. (2016). Verbreitung der vegetarischen Ernährungsweise in Deutschland. J. Health Monit. 1, 2–15. doi: 10.17886/RKI-GBE-2016-039
Meyerding, S., Schaffmann, A., and Lehberger, M. (2019). Consumer preferences for different designs of carbon footprint labelling on tomatoes in Germany—does design matter? Sustainability 11:1587. doi: 10.3390/su11061587
Mialon, M., and Mialon, J. (2017). Corporate political activity of the dairy industry in France: an analysis of publicly available information. Public Health Nutr. 20, 2432–2439. doi: 10.1017/S1368980017001197
Mullen, B., Atkins, J. L., Champion, D. S., Edwards, C., Hardy, D., Story, J. E., et al. (1985). The false consensus effect: a meta-analysis of 155 hypothesis tests. J. Exp. Soc. Psychol. 21, 262–283. doi: 10.1016/0022-1031(85)90020-4
Olanrewaju, O. I., Enegbuma, W. I., and Donn, W. (2024). Challenges in life cycle assessment implementation for construction environmental product declaration development: a mixed approach and global perspective. Sustain. Prod. Consum. 49, 502–528. doi: 10.1016/j.spc.2024.06.021
Onwezen, M. C., Dwyer, L., Fox, T., and Snoek, H. M. (2021). Conditions for the effectiveness of labelling: a systematic literature review. Wageningen: Wageningen University & Research.
Onwezen, M. C., Nassar, G., and Bouma, J. A. (2025). Change meat resistance: systematic literature review on consumer resistance to the alternative protein transition. Annu. Rev. Food Sci. Technol. 16, 127–146. doi: 10.1146/annurev-food-111523-121744
Pan, F., Huang, F., Zhu, H., and Wang, Y. (2024). Temporal and spatial trends in livestock manure discharge and water pollution risk in Chaohu Lake basin. Sustainability 16:2396. doi: 10.3390/su16062396
Pan, A., Sun, Q., Bernstein, A., Schulze, M., Manson, J., Stampfer, M., et al. (2012). Red meat consumption and mortality: results from 2 prospective cohort studies. Arch. Intern. Med. 172, 555–563. doi: 10.1001/archinternmed.2011.2287
Pérez, L., Pincay, R., Salazar, D., Flores, N., and Escolastico, C. (2023). Evaluation of the quality and lipid content of artisan sausages produced in Tungurahua, Ecuador. Foods 12:4288. doi: 10.3390/foods12234288
Perreault, W. D. (1975). Controlling order-effect bias. Public Opin. Q. 39, 544–551. jstor.org/stable/2748507
Poore, J., and Nemecek, T. (2018). Reducing food’s environmental impacts through producers and consumers. Science 360, 987–992. doi: 10.1126/science.aaq0216
Potter, C., Bastounis, A., Hartmann-Boyce, J., Stewart, C., Frie, K., and Jebb, S. (2021). The effects of environmental sustainability labels on selection, purchase, and consumption of food and drink products: a systematic review. Environ. Behav. 53, 891–923. doi: 10.1177/0013916521995473
Puska, P. (2018). Does organic food consumption signal prosociality? An application of Schwartz’s value theory. J. Food Prod. Market. 25, 207–231. doi: 10.1080/10454446.2018.1522286
Ritchie, H. (2021a). If the world adopted a plant-based diet, we would reduce global agricultural land use from 4 to 1 billion hectares. Available at: https://ourworldindata.org/land-use-diets (Accessed June 20, 2025).
Ritchie, H. (2021b). What are the carbon opportunity costs of our food?. Available at: https://ourworldindata.org/carbon-opportunity-costs-food (Accessed June 20, 2025).
Ritchie, H. (2023). How many animals are factory-farmed?. Available at: https://ourworldindata.org/how-many-animals-are-factory-farmed (Accessed June 20, 2025).
Ritchie, H., Roser, M., and Rosado, P. (2017). Meat and dairy production. Available at: https://ourworldindata.org/meat-production (Accessed June 20, 2025).
Rondoni, A., and Grasso, S. (2021). Consumers behaviour towards carbon footprint labels on food: a review of the literature and discussion of industry implications. J. Clean. Prod. 301:127031. doi: 10.1016/j.jclepro.2021.127031
Rosenfeld, D. L., and Tomiyama, A. J. (2021). Gender differences in meat consumption and openness to vegetarianism. Appetite 166:105475. doi: 10.1016/j.appet.2021.105475
Ross, L., Greene, D., and House, P. (1977). The “false consensus effect”: an egocentric bias in social perception and attribution processes. J. Exp. Soc. Psychol. 13, 279–301. doi: 10.1016/0022-1031(77)90049-X
Rothgerber, H. (2013). Real men don’t eat (vegetable) quiche: masculinity and the justification of meat consumption. Psychol. Men Masculin. 14, 363–375. doi: 10.1037/a0030379
Saunders, M., Lewis, P., and Thornhill, A. (2019). Research methods for business students. 8th Edn. Harlow: Pearson.
Shi, W., Huang, X., Schooling, C. M., and Zhao, J. V. (2023). Red meat consumption, cardiovascular diseases, and diabetes: a systematic review and meta-analysis. Eur. Heart J. 44, 2626–2635. doi: 10.1093/eurheartj/ehad336
Smeds, M. R. (2022). A brief guide to survey methodology for vascular surgeons. Semin. Vasc. Surg. 35, 431–437. doi: 10.1053/j.semvascsurg.2022.09.006
Soimakallio, S., Kiviluoma, J., and Saikku, L. (2011). The complexity and challenges of determining GHG (greenhouse gas) emissions from grid electricity consumption and conservation in LCA (life cycle assessment)—a methodological review. Energy 36, 6705–6713. doi: 10.1016/j.energy.2011.10.028
Spaargaren, G., van den Heuvel, T., and Lahr, J. (2013). Consumer responses to the carbon labelling of food: a real life experiment in a canteen practice. Sociol. Ruralis 53, 432–453. doi: 10.1111/soru.12009
Subedi, D., Dhakal, A., Jyoti, S., Paudel, S., Ranabhat, G., Tiwari, A., et al. (2025). Zoonotic diseases awareness and food safety practices among livestock farmers in Nepal. Front. Vet. Sci. 11:1514953. doi: 10.3389/fvets.2024.1514953
Tabachnick, B. G., and Fidell, L. S. (2019). Using multivariate statistics. 7th Edn. Harlow: Pearson.
Taverne, F. J., and van der Meulen, J. (2014). “Welfare of pregnant sows in different housing systems” in Welfare of pigs: from birth to slaughter (Wageningen: Wageningen Academic Publishers).
Thau, M., Mikkelsen, M. F., Hjortskov, M., and Pedersen, M. J. (2021). Question order bias revisited: a split-ballot experiment on satisfaction with public services among experienced and professional users. Public Adm. 99, 189–204. doi: 10.1111/padm.12688
UK Food Standards Agency. (2021). Consumer responses to food labelling: a rapid evidence review. Available at: https://www.food.gov.uk/research/consumer-responses-to-food-labelling-a-rapid-evidence-review (Accessed June 20, 2025).
Vanclay, J., Shortiss, J., Aulsebrook, S., Gillespie, A., Howell, B., Johanni, R., et al. (2011). Customer response to carbon labelling of groceries. J. Consum. Policy 34, 153–160. doi: 10.1007/s10603-010-9140-7
Veganuary. (2024). The official Veganuary 2024 participant survey. Available at: https://veganuary.com/wp-content/uploads/2024/03/Official-Veganuary-2024-Participant-Survey-3.pdf (Accessed June 20, 2025).
Veganuary. (2025). The official Veganuary 2025 participant survey. Available at: https://veganuary.com/wp-content/uploads/2025/03/The-Official-Veganuary-2025-Participant-Survey.pdf (Accessed June 20, 2025).
Velzeboer, R., Li, E., Gao, N., Sharp, P., and Oliffe, J. L. (2024). Masculinity, meat, and veg*nism: a scoping review. Am. J. Mens Health 18:15579883241247173. doi: 10.1177/15579883241247173
Wang, X., Lin, X., Ouyang, Y. Y., Liu, J., Zhao, G., Pan, A., et al. (2016). Red and processed meat consumption and mortality: dose-response meta-analysis of prospective cohort studies. Public Health Nutr. 19, 893–905. doi: 10.1017/S1368980015002062
Welborn, B. L., Gunter, B. C., Vezich, I. S., and Lieberman, M. D. (2017). Neural correlates of the false consensus effect: evidence for motivated projection and regulatory restraint. J. Cogn. Neurosci. 29, 708–717. doi: 10.1162/jocn_a_01084
Wiesli, T. X. (2025). Meat consumption among different social groups and specific options for reducing it: a literature review of empirical research. Front. Sociol. 10:1547663. doi: 10.3389/fsoc.2025.1547663
Wisser, D., Grogan, D., Lanzoni, L., Tempio, G., Cinardi, G., Prusevich, A., et al. (2024). Water use in livestock agri-food systems and its contribution to local water scarcity: a spatially distributed global analysis. Water 16:1681. doi: 10.3390/w16121681
Won, S., Shim, S. M., You, B. G., Choi, Y. S., and Ra, C. (2017). Nutrient production from dairy cattle manure and loading on arable land. Asian Australas. J. Anim. Sci. 30, 125–132. doi: 10.5713/ajas.16.0441
Zimba, O., and Gasparyan, A. Y. (2023). Designing, conducting, and reporting survey studies: a primer for researchers. J. Korean Med. Sci. 38:e403. doi: 10.3346/jkms.2023.38.e403
Keywords: carbon labelling, sustainability, vegan, meat reduction, nudge, carbon footprint, meal choice, sustainable diet
Citation: Macdonald C (2025) Reducing meat consumption with consumer insights and the nudge by proxy: the anomaly of asking, the power of protein, and illusions of insufficiency and availability. Front. Sustain. Food Syst. 9:1656336. doi: 10.3389/fsufs.2025.1656336
Edited by:
Sanchayan Banerjee, King’s College London, United KingdomReviewed by:
Jetske Bouma, Netherlands Environmental Assessment Agency, NetherlandsTara McGuicken, University of Bath, United Kingdom
Copyright © 2025 Macdonald. This is an open-access article distributed under the terms of the Creative Commons Attribution License (CC BY). The use, distribution or reproduction in other forums is permitted, provided the original author(s) and the copyright owner(s) are credited and that the original publication in this journal is cited, in accordance with accepted academic practice. No use, distribution or reproduction is permitted which does not comply with these terms.
*Correspondence: Chris Macdonald, Y20yMTUwQGNhbS5hYy51aw==