 Kowit Patcharabudsarakumkul1Sirintat Liamlaem1
 Sukrichaya Hemathulin2
 Chutikarn Kapcum3
 Pimchada Itthivadhanapong4
 Yuphin Somkhumphee1
 Sumeth Piayura1*
- 1Faculty of Agricultural Technology, Department of Food Technology, Sakon Nakhon Rajabhat University, Sakon Nakhon, Thailand
- 2Faculty of Natural Resources, Department of Food Science and Technology, Rajamangala University of Technology Isan, Sakon Nakhon, Thailand
- 3Division of Food Technology, Kanchanaburi Campus, Mahidol University, Kanchanaburi, Thailand
- 4Department of Food Technology and Nutrition, Rajamangala University of Technology Krungthep, Bangkok, Thailand
This study aimed to optimize a fried snack formulation comprising Tubtim Chum Phae rice flour (RF; 60–79%), watermeal (Wolffia arrhiza, WM; 11–30%), and rice protein isolate (RP; 5–10%) to enhance protein content and functional properties, including total phenolic content (TPC), total flavonoid content (TFC), and antioxidant activity (AOA). Response Surface Methodology (RSM) with an I-optimal design was employed to predict the effects of ingredient ratios on all responses. The optimized formulation was validated through experiments, and its microstructure was analyzed using SEM. The amino acid profile was also determined. The RSM models accurately predicted the effects of ingredient ratios on all responses. Numerical optimization identified an optimal formulation consisting of 60.91% RF, 29.70% WM, and 8.39% RP, with validation experiments confirming strong agreement between predicted and actual values. The optimized snack exhibited 20.68% protein and improved functional properties. It showed a hardness of 14.04 N and a porous, non-uniform microstructure under SEM analysis. In addition, the amino acid profile, particularly in essential amino acids, was markedly enhanced compared to that of rice flour alone. These findings demonstrate that incorporating WM and RP using RSM is an effective strategy to improve the nutritional and antioxidant properties of rice-based snacks.
1 Introduction
Deep-fried rice snacks are highly popular and commonly consumed, especially in Asian countries. However, conventional rice-based snacks are typically low in essential nutrients such as protein and lack significant amounts of beneficial phytochemicals like phenolic compounds, which contribute to antioxidant activity (Bhattacharya and Narasimha, 2008). Therefore, numerous researchers have studied the potential of enriching rice-based snacks with various ingredients to enhance their nutritional and functional properties, including the incorporation of legumes (Annapure et al., 1998; Farah et al., 2023), herbs and spices (Sharma et al., 2024), turmeric powder (Oiveira et al., 2020), pulse seed coats (Bresciani et al., 2023), rice bran hydrolysates (Supawong et al., 2019), and cowpea paste (Apea-Bah et al., 2017). Although frying reduced some of these benefits, previous studies indicated that potential health benefits, such as significant levels of phenolic compounds and antioxidant capacity, could still be retained in the final product (Apea-Bah et al., 2017; Sharma et al., 2024). In addition, extruded snacks are increasingly acknowledged for their potential to combat malnutrition, particularly in developing countries (Shah et al., 2019). These snacks can be fortified with protein and carbohydrates, enhancing their nutritional profile and digestibility (Shafiq et al., 2024). Extrusion processing improves the bioactive and antioxidant properties of snacks, although it may lead to a reduction in total phenolic content (Dilrukshi et al., 2022; S. Wani and Kumar, 2016). Previous studies have shown that adding protein sources such as pea, soy, and fish into rice-based extrudates can significantly increase protein content and enhance amino acid composition (Omwamba and Mahungu, 2014; Philipp et al., 2017; Dileep et al., 2010).
Rice flour is commonly used as the main ingredient in deep-fried snack formulations. Therefore, selecting an appropriate type of rice flour presents an opportunity to enhance the intrinsic nutritional value of the snack. Thai pigmented rice varieties, particularly black and red rice, have been shown to possess high antioxidant activities and beneficial phytochemicals (Vichit and Saewan, 2015; Chinprahast et al., 2016). These rice varieties contain phenolic compounds, anthocyanins, and proanthocyanidins, which contribute to their antioxidant properties (Melini and Acquistucci, 2017).
Tubtim Chum Phae rice, a red-pigmented Thai hybrid from Surin, is known for its higher phytochemical content, antioxidant activity, and nutritional value compared to white rice (Kammapana, 2023; Muntana and Prasong, 2010). In addition to selecting a suitable base flour, incorporating nutrient-rich ingredients is a key strategy for enhancing the nutritional profile of snack products. Watermeal (Wolffia arrhiza (L.) Wimm.), recognized as the smallest flowering plant, has emerged as a promising superfood with significant nutritional advantages (Hu et al., 2022). It contains a high level of quality protein (typically 20–30% dry weight) encompassing essential amino acids that meet WHO standards for child nutrition (Bhanthumnavin and McGarry, 1971; Appenroth et al., 2018). Furthermore, watermeal is rich in polyunsaturated fatty acids, including omega-3 s, and possesses considerable antioxidant properties derived from its natural endowment of phenolics, flavonoids, and tocopherols (Boonarsa et al., 2024). Its rapid growth cycle and high nutrient yield also position it as a sustainable ingredient source (Hu et al., 2022). Its versatility allows for incorporation into various food products, such as noodles (Khemthong et al., 2021).
Adding a concentrated protein source is a choice used to enhance protein in fortified snacks. Rice protein isolates (RPI) has emerged as promising alternatives to traditional plant-based proteins. Previous studies show that RPI contains approximately 78–92% protein by weight, with essential amino acid profiles comparable to soy protein (Kalman, 2014). RPI has good functional properties, including water-binding capacity, foaming, and emulsification (Modupalli et al., 2024). Nutritionally, RPI has been found to lower cholesterol levels in rats more effectively than casein (Morita et al., 1996; Zawistowski et al., 2009), meets most essential amino acid requirements for children (Wang et al., 1999; Waksmanska et al., 2023). Moreover, rice protein is hypoallergenic due to its lack of gluten, making it suitable for infant formulas and gluten-sensitive individuals (Jayaprakash et al., 2022).
Response surface methodology (RSM) is widely used to optimize formulations and processing conditions for extruded snacks. Studies have employed RSM to develop snacks using various ingredients, including soy, sorghum, lupin, pumpkin, milk protein, barley, sweet potato, flaxseed, and peanut flours (Seth and Rajamanickam, 2012; Alefew et al., 2024; Yadav et al., 2021; Trevisan and Arêas, 2012; Suknark et al., 1997; Badwaik et al., 2014). RSM has been successful in developing snacks with improved nutritional profiles, such as increased protein, fiber, and β-glucan content (Yadav et al., 2021; Trevisan and Arêas, 2012). While D-optimal designs are commonly used, I-optimal designs may be more appropriate for response surface experiments as they focus on minimizing the average variance of prediction over the experimental region (Jones and Goos, 2012). This study aimed to optimize the formulation of a deep-fried rice-based snack using an I-optimal design, focusing on the incorporation of Tubtim Chum Phae rice flour (RF), watermeal (WM), and rice protein isolate (RP). The effects of these ingredients on the physicochemical and functional properties of the snack were investigated to identify the optimal formulation. Additionally, the study analyzed the amino acid profiles of RF, WM, RP, and the optimized snack prototype, and examined the microstructure of the snack.
2 Materials and methods
2.1 Raw materials
Tubtim Chum Phae rice flour (RF), watermeal (Wolffia arrhiza (L.) Wimm.) powder (WP), and rice protein isolate powder (RP) were the primary ingredients in this study. RF was obtained from Ka-Tip-To farm (Khon Kaen, Thailand), WP from Advanced Greenfram Co., Ltd. (Nakhon Pathom, Thailand), and RP from Billion Gifts of Nature Co., Ltd. (Bangkok, Thailand). Transglutaminase (TGase), used as a minor additive, was procured from Ajinomoto Co., Inc. (Nagoya, Japan).
2.2 I-optimal experimental design
An I-optimal experimental design was employed to determine the optimal proportions of major ingredients (RF, WP, and RP) for snacks production, aiming for efficiency by minimizing the number of experimental runs. The independent variables included RF (X1; 60–79%), RP (X2; 5–10%), and WP (X3; 11–30%), as shown in Table 1. This approach facilitated the determination of ingredient ratios where the combined proportion of RF, RP, and WP was constrained to 99% of the total mixture. The mixture design calculations treated the relative proportions of these three components as pseudo-components, summing to 100%. Subsequently, TGase was added at a fixed level of 1% to all formulations, resulting in a complete mixture of 100%. The experimental design consisted of 16 experimental runs, including six required model points, five replicate points, and five lack-of-fit points, as shown in Table 2. The response variables determined in this study included the physicochemical and functional properties of the snacks, including hardness (Y1), protein content (Y2), total phenolic content (Y3), flavonoid content (Y4), and antioxidant activity measured by DPPH radical scavenging activity (Y5).
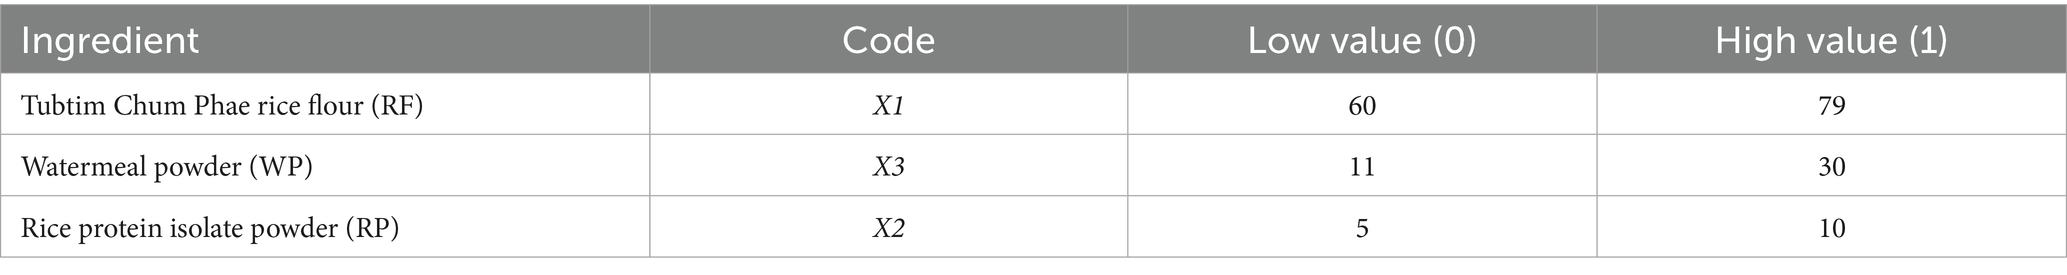
Table 1. Ingredient composition of the I-optimal mixture design for watermeal and rice protein-isolate fortified fried rice snacks.
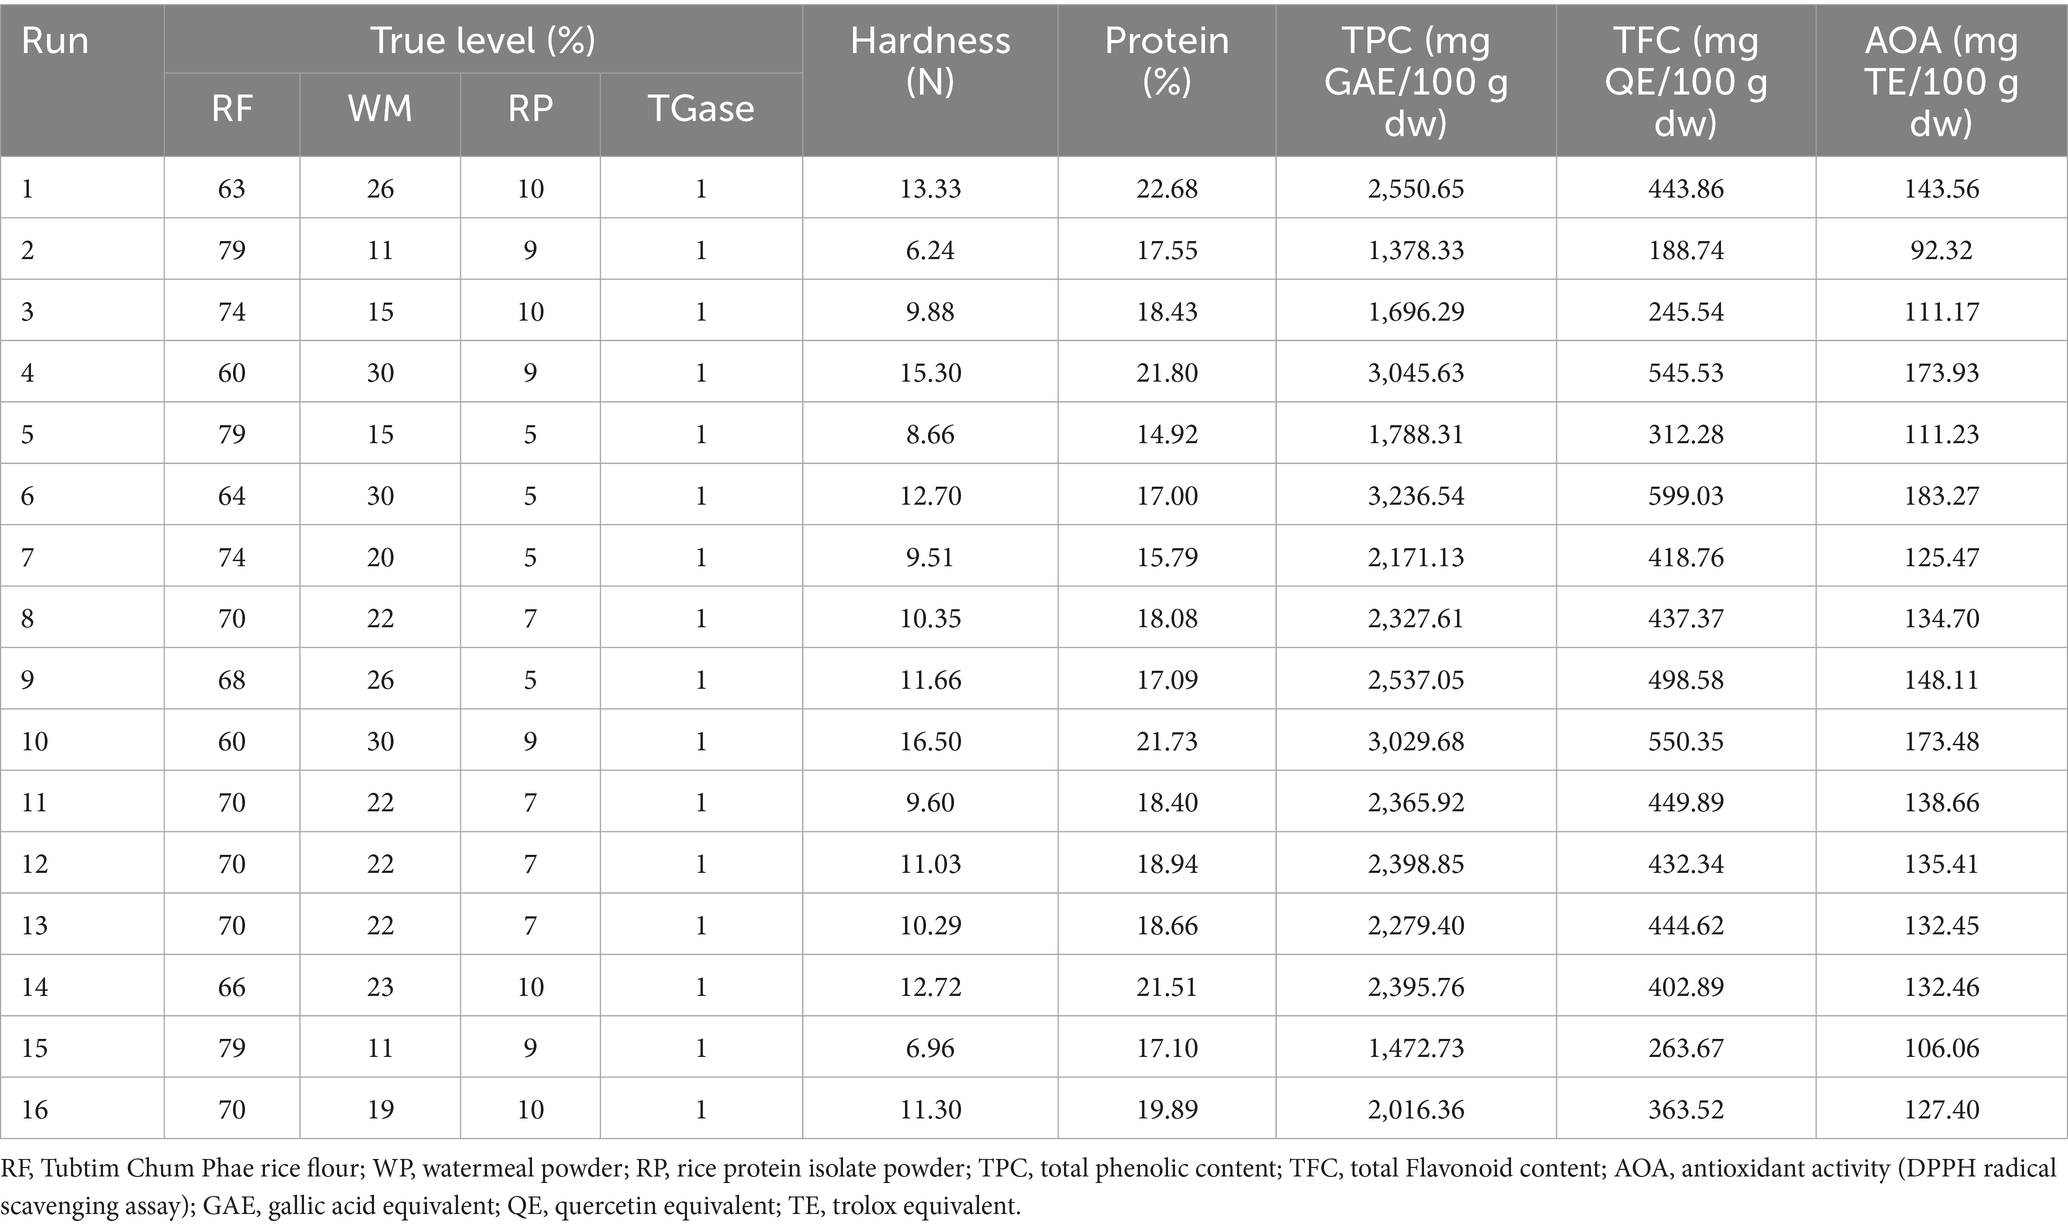
Table 2. Effects of ingredient composition on the physicochemical and functional properties of snacks.
2.3 Production of snack
The snack production process was adapted from Musika et al. (2024) with modifications. Ingredients were blended according to each experimental formulation, as shown in Table 3, and processed using a co-rotating intermeshing twin-screw extruder (Charoentat Co., Ltd., Samut Prakan, Thailand).
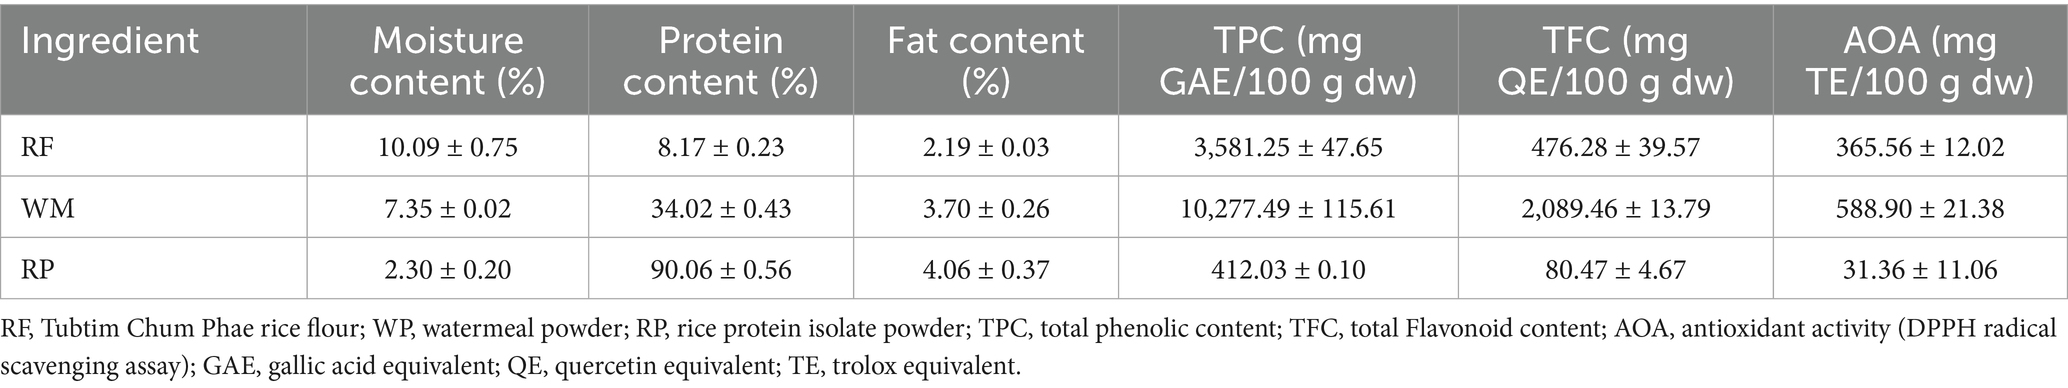
Table 3. Chemical and functional properties of the ingredients for the snack production.
The extruder was equipped with a hollow cylindrical barrel consisting of six heating zones, set at 40, 70, 90, 100, 100, and 70°C, respectively. The die temperature was maintained at 70°C throughout the extrusion process. Extrusion was performed through a die with a 5.0 mm diameter at a moisture feed rate of 30% and a screw speed of 100 rpm. The extrudates were then cut into 5 cm lengths and deep-fried in palm olein oil at 150°C for 1 min using a fryer (Union Science Trading Co., Ltd., Khon Kaen, Thailand). After frying, the samples were air-cooled at room temperature, packed in aluminum foil pouches, and stored at room temperature for further analysis.
2.4 Texture
The hardness of snack samples was measured using a CT3 Texture Analyzer (Brookfield, USA) equipped with a TA7 blade probe and a TA-TPB fixture. Measurements were performed in compression mode with a target displacement of 15 mm, a trigger force of 1 N, and a test speed of 1 mm/s.
2.5 Chemical analysis
Chemical analyses included the determination of moisture, fat, and protein. The moisture content of the ingredients was measured using the hot air oven method (AOAC, 2002), and the fat content was determined by Soxhlet extraction (AOAC, 2000). The protein content of the ingredients (RF, WM, RP) and the final snacks was determined using the Kjeldahl method (AOAC, 2000). Following digestion and distillation, automatic titration was performed with a TitroLine 7,000 (SI Analytics, Germany) using standardized 0.1 N HCl. Protein was calculated using conversion factors of 5.95 for RF and 6.25 for WM, RP, and snacks.
2.6 Functional properties
2.6.1 Extraction
The RF, WM, RP, and snack samples were extracted based on the method of (Piayura and Itthivadhanapong, 2023), with modifications. A 2 g portion of the ground sample was extracted with 20 mL of 70% aqueous methanol by shaking in a refrigerated shaking incubator (NB 2-5-VL, N-BIOTEK, Republic of Korea) at 200 rpm and 4°C for 3 h. The extract was then centrifuged at 3,000 × g and 4°C for 10 min using a centrifuge (2-16KL, Sigma, Germany). Before further analysis, the supernatant was collected and filtered through a 0.45 μm syringe filter.
2.6.2 Total phenolic content (TPC)
The TPC was determined using the Folin–Ciocalteu method (Piayura and Itthivadhanapong, 2023) with some modifications. A 125 μL sample extract was mixed with 3.0 mL of deionized (DI) water, then 250 μL of Folin–Ciocalteu reagent (1:1, Folin–Ciocalteu: absolute methanol) and mixed for 1 min. The mixture was then incubated in the dark at room temperature for 6 min. Subsequently, 2.50 mL of 7% Na₂CO₃ 7% was added and mixed for 1 min, followed by further incubation in the dark at room temperature for 90 min. Absorbance was measured at 760 nm using a double-beam spectrophotometer (Libra S70, Biochrom, UK). The TPC was calculated using a standard curve of gallic acid (0.025–0.400 μg/mL) and expressed as mg gallic acid equivalent (GAE)/100 g dry weight (mg GAE/100 g dw).
2.6.3 Total flavonoid content (TFC)
The total flavonoid content (TFC) was determined using the aluminum chloride colorimetric method described by Mala et al. (2024) with modifications. A 500 μL aliquot of extract was mixed with 3.0 mL of DI water and 150 μL of 5% NaNO₂ solution, mixed for 1 min, and incubated in the dark at room temperature for 6 min. Subsequently, 300 μL of 10% AlCl₃ solution was added and left to stand in the dark for 5 min. Afterward, 1.0 mL of 1 M NaOH was added and incubated for 30 min in the dark at room temperature. Absorbance was measured at 510 nm using a double-beam spectrophotometer. The TFC was calculated using a quercetin standard curve and expressed as mg quercetin equivalent per 100 g dry weight (mg QE/100 g dw).
2.6.4 Antioxidant activity (AOA)
The antioxidant activity was determined using the DPPH (1,1-diphenyl-2-picrylhydrazyl) radical scavenging assay described by Mala et al. (2024) with modifications. A 100 μL aliquot of extract was mixed with 3.90 mL of 1.0 mM DPPH solution in absolute methanol and vortexed for 1 min. The mixture was incubated in the dark at room temperature for 60 min, after which absorbance was measured at 517 nm using a double-beam spectrophotometer. The antioxidant activity was calculated using a Trolox standard curve (1.25–20.00 μg/mL) and expressed as mg Trolox equivalent per 100 g dry weight (mg TE/100 g dw).
2.7 Formulation optimization using response surface methodology (RSM)
The relationship between the independent variables and the response variables of snacks was analyzed using response surface methodology (RSM). The response variables, determined from 16 experimental runs, included hardness (Y1), protein content (Y2), total phenolic content (TPC, Y3), total flavonoid content (TFC, Y4), and DPPH radical scavenging activity (Y5). Different regression models (linear, quadratic, and special cubic) were compared to determine the best-fitting model.
Analysis of variance (ANOVA) was performed to evaluate the significance and adequacy of the models. Model selection was based on maximizing the adjusted coefficient of determination (Adjusted R2) while ensuring a non-significant lack-of-fit test (p > 0.05). Other statistical parameters, including the coefficient of determination (R2), predicted residual sum of squares (Predicted R2), F-value, and p-value, were also examined to assess model fit. The optimum formulation conditions and predicted response values were determined using Design-Expert software (version 13, Stat-Ease, Minneapolis, USA). Three-dimensional (3D) surface plots were generated to illustrate the interactions between the independent variables (TF, WP, and PP) and the response variables (Y1–Y5).
The prototype was produced using the extrusion process based on the optimized formulation obtained from RSM. The formulation consisted of RF, WM, RP at the optimal levels determined through the RSM analysis. The prototype was then analyzed for physicochemical and functional properties.
The selected model was validated by producing a prototype snack under the optimized conditions. The experimental results were compared with the predicted values to assess the accuracy of the optimization process and formulation. The percentage difference was calculated and expressed as percentage error.
2.8 Microstructure
The prototype samples were cut transversely into slices approximately 4–5 mm thick. The samples were sputter-coated with platinum using a JEC-3000 FC auto fine coater (JEOL, Tokyo, Japan) to enhance their thermoelectric conductivity. Subsequently, they were examined with a JSM-IT200 scanning electron microscope (JEOL, Tokyo, Japan) operated at an accelerating voltage of 20 kV to minimize beam-induced damage. Micrographs were captured at a magnification of 50 × for the surface and 30 × for the cross-section.
2.9 Amino acid profiles
The quantification of amino acid composition in WM, RF, RP, and prototype snack was conducted, employing a modified methodology derived from Ledbetter et al. (2024). Briefly, individual samples, each weighing 100 mg, underwent a two-stage hydrolysis process. Initially, samples were hydrolyzed with 3 mL of 6 M hydrochloric acid (HCl) at 110°C for 24 h, followed by a subsequent hydrolysis with 3 mL of 5 M sodium hydroxide (NaOH) at 110°C for 18 h. The resulting hydrolysates were then subjected to centrifugation at 16,100 g for 15 min at 4°C using a refrigerated microcentrifuge (Model 5415R, Eppendorf, Germany). The supernatants obtained were neutralized to a pH of 7.0 using 5 M NaOH and 6 M HCl, and subsequently filtered through 0.2 μm membrane filters prior to liquid chromatography-mass spectrometry (LC–MS) analysis.
Amino acid identification and quantification were performed using an LC–MS (model 8,030, Shimadzu Corporation, Japan) triple-quadrupole mass spectrometer in electrospray ionization (ESI) mode. Chromatographic separation was performed on a C18 column (2.1 mm × 150 mm, 3 μm, InertSustain, Japan), fitted with a guard cartridge of the same stationary phase, and maintained at 30°C. mobile phase A consisted of deionized water containing 0.1% formic acid. Mobile phase B was 50% methanol containing 0.1% formic acid. The gradient was 88% B at 0.5 mL/min for 3.5 min, reducing to 30% B over 5.5 min before re-equilibrating to initial conditions over 2 min. The MS was equipped with an electrospray ionization source and was operated in positive ionization mode. A sample volume of 1 μL was injected into the column. The mass spectrometer settings were as follows: spray voltage of 4.5 kV, capillary temperature at 200°C, nitrogen used as the nebulizer gas at a flow rate of 3 L/min, and drying gas at 15 L/min. Data acquisition and analysis were performed using LabSolutions software (Shimadzu Corporation, Japan).
The data were presented as a mean ± standard deviation (SD). An analysis of variance (ANOVA) was performed using SPSS Statistics 22 (IBM, USA). Significant differences between means were determined by Duncan’s Multiple Range Test.
3 Result and discussion
3.1 Ingredient properties for snack production
Table 3 summarizes the chemical and functional properties of RF, WM, and RP used in snack production. The different characteristics of each ingredient directly influence the formulation and functionality of the final product. The moisture content varied among the ingredients, with RP exhibiting the lowest (2.30%), followed by WM (7.35%) and RF (10.09%), affecting powder stability and shelf life (Barbosa-Cánovas et al., 2020). Additionally, RP presented an exceptionally high protein level at 90.06%, consistent with reported ranges for commercial isolates (78–92%) (Kalman, 2014). This confirms that RP significantly impacts the primary fortifying agent, which is intended to elevate protein concentration significantly in the final product. WM also contained substantial protein (34.02%), consistent with values reported for Wolffia species (Appenroth et al., 2018; Nitiwuttithorn et al., 2024; Boonarsa et al., 2024), highlighting its potential not only as a source of various bioactive compounds but also as a significant secondary contributor to the total protein of the snack and potentially its essential amino acid profile (On-Nom et al., 2023). In contrast, RF contained a relatively low protein content (8.17%), typical for rice flours, indicating its limited contribution to the overall protein enhancement compared to WM and especially RP. Therefore, combining the highly concentrated RP with the protein-rich WM appears well-suited to achieving the desired high-protein characteristic in the final snack, substantially improving the base RF matrix. Regarding fat content, RP showed the highest value (4.06%), followed by WM (3.70%), while RF had the lowest fat content (2.19%). While these percentages are not high, the lipid component, particularly in WM, possesses nutritional significance as Wolffia species are known to contain valuable polyunsaturated fatty acids (PUFAs), including the essential fatty acids α-linolenic acid (omega-3) and linoleic acid (omega-6) (Hu et al., 2022; Boonarsa et al., 2024).
The functional properties varied significantly among the ingredients. WM demonstrated exceptionally high levels of TPC (10,277.49 mg GAE/100 g dw), TFC (2,089.46 mg QE/100 g dw), and AOA (588.90 mg TE/100 g dw). These remarkably high values are consistent with previous studies that have identified Wolffia species as rich sources of phenolic and flavonoid compounds, which are known to be potent antioxidants (Appenroth et al., 2018; Hu et al., 2022; Nitiwuttithorn et al., 2024; Boonarsa et al., 2024). These findings position WM as the principal ingredient for enhancing the antioxidant capacity and overall functional profile of the snack. Furthermore, RF, consistent with its nature as a pigmented rice variety, exhibited intermediate functional properties (Table 3). These properties are attributable to the presence of phytochemicals within the red pericarp, as reported for Thai pigmented rice (Muntana and Prasong, 2010; Vichit and Saewan, 2015; Kammapana, 2023). In contrast, RP exhibited low TPC, TFC, and AOA, as expected for a highly purified protein ingredient where most non-protein components, including phytochemicals, have been largely removed during processing (Patsanguan et al., 2017). Therefore, a strategic combination of RF, WM, and RP could be highly effective in developing a snack that is both high in protein and rich in functional, health-promoting compounds.
3.2 Physicochemical properties of snack
3.2.1 Hardness
Hardness is a critical textural attribute influencing the consumer acceptance of snack products, often correlating with sensory attributes of firmness or crispness. In this study, hardness was selected as the primary instrumental measure for texture analysis, as it directly reflects the structural integrity and firmness of the snack, which are significantly influenced by our formulation changes. While fracture tests are highly appropriate for directly measuring crispness and crunchiness, the hardness measurement effectively captures the structural changes resulting from ingredient optimization, particularly the formation of a denser or more porous matrix (Salvador et al., 2009; Philipp et al., 2017).
The hardness of snacks varied considerably depending on the ingredient composition, ranging from 6.24 to 16.50 N across the 16 experimental runs (Table 2). The lowest hardness values were observed in runs with the highest proportion of RF and lowest WM (e.g., Run 2 and Run 15), while the highest hardness values were found in formulations with the lowest RF and highest WM (e.g., Run 10 and Run 4). This observed trend suggests that increasing the levels of WM and RP while decreasing RF contributes to a harder snack texture. The incorporation of higher protein content, derived from both the substantial amount in WM and RP, likely leads to the formation of a denser, more rigid matrix structure during the extrusion and frying processes, thereby increasing hardness (Chaiyakul et al., 2008; HewaNadungodage et al., 2021). Protein interactions can form networks that resist fracture, an effect potentially enhanced in this study by the inclusion of TGase, an enzyme known to promote protein cross-linking (dos Santos et al., 2023). Moreover, studies incorporating Wolffia into noodles have also reported increased hardness at higher inclusion levels (Khemthong et al., 2021), supporting its role in structure formation. The higher proportion of RF in the lower-hardness snacks likely contributes to a less dense texture due to the high starch content of RF. This may be explained by starch gelatinization and expansion during extrusion, which typically result in a more porous, less dense structure and, consequently, lower hardness values (Gat and Ananthanarayan, 2015; Sharma et al., 2015).
The relationship between ingredient levels (RF, WM, and RP) and snack hardness was effectively modeled using RSM, resulting in a significant linear model (p < 0.0001) with high coefficients of determination (R2 = 0.92, Adjusted R2 = 0.91), as shown in Table 4. The adequacy of the model was further confirmed by a non-significant lack-of-fit test (p > 0.05) and good predictive capability (Predicted R2 = 0.86), validating model suitability (Bakhaidar et al., 2022).
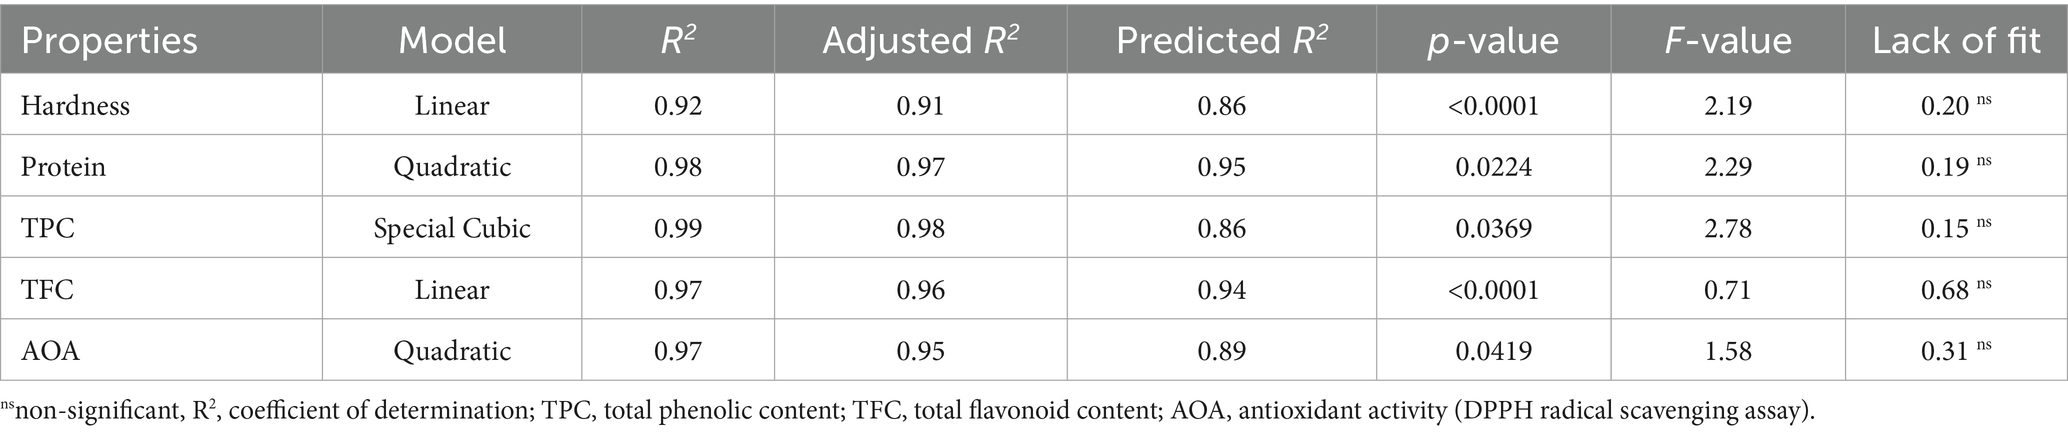
Table 4. Model fitting and ANOVA results for physicochemical and functional properties of snack.
A linear regression model was developed to predict the hardness of the snacks based on the percentage of X1, X2, and X3. The resulting equation was:
The model exhibited a strong correlation between the predicted and observed hardness values, with R2 of 0.92. The regression equation provides insights into the influence of each ingredient on the hardness of the snacks. The negative coefficient for RF suggests an inverse relationship, where increasing the proportion of RF may lead to decrease in hardness. However, the positive coefficients for both WM and RP indicate that increasing the percentage of these ingredients contributes to a more complex snack structure. The contour plot (Figure 1a) demonstrated that snack hardness decreased as the proportion of RF increased. This trend reflects the structure-forming contributions of protein from WM and RP, contrasting with the expansion effect of RF starch.
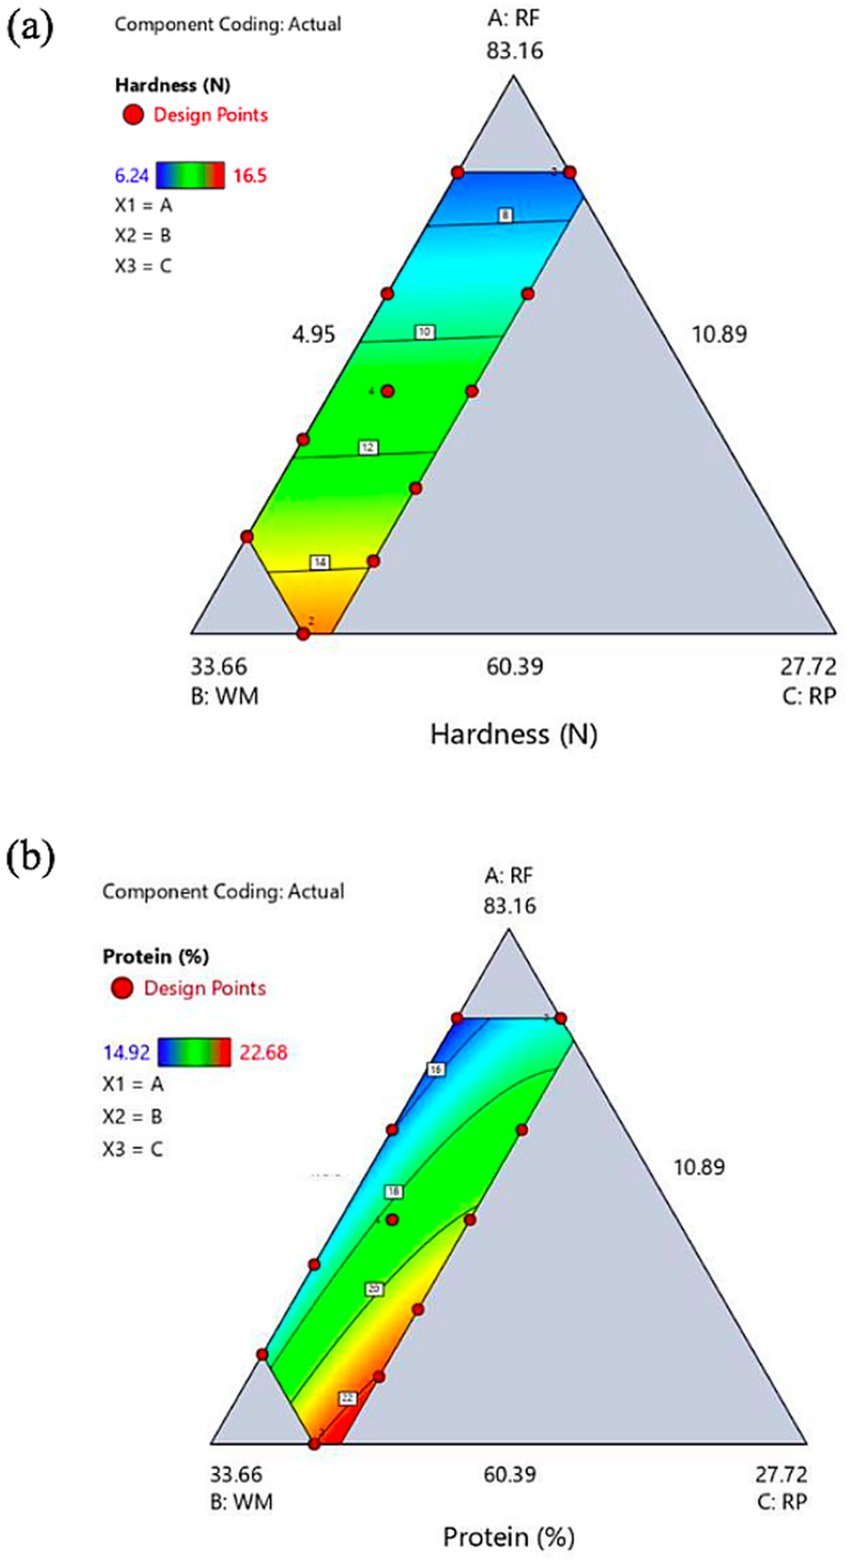
Figure 1. Contour plot showing the effects of RF (Tubtim Chum Phae rice flour), WM (watermeal powder), and RP (rice protein isolate powder) on the physicochemical properties of snacks. (a) hardness (N) and (b) protein content (%).
3.2.2 Protein content
Recognizing the common limitation of low protein content in traditional rice-based snacks, a primary objective of this study was to enhance the protein level in the fried rice snack formulation. The results show that protein content varied significantly among formulations, ranging from 14.92 to 22.68% (Table 2). Formulations with the lowest level of RP (5%) resulted in the lowest snack protein content (e.g., Runs 5, 6, 7, and 9). In contrast, the highest protein levels were observed in formulations with increased proportions of RP and WM and correspondingly reduced RF levels (e.g., Runs 1, 4, 10, and 14). The results demonstrated that incorporating high-protein ingredients like RP and WM effectively increased the overall protein content compared to the RF base. These protein enrichment strategies using protein isolates or protein-rich plant ingredients were commonly employed and had been proven effective in enhancing the nutritional value of extruded or snack products (Philipp et al., 2017; On-Nom et al., 2023).
Model fitting analysis indicated that a quadratic model provided the best fit for the protein data (Table 4). The ANOVA results showed that the quadratic model was statistically significant (p = 0.0224). The model exhibited an excellent lack of fit, as evidenced by the high coefficient of determination (R2 = 0.98) and adjusted R2 (0.97), indicating that the model explains approximately 97 to 98% of the variability in protein content. Furthermore, the high predicted R2 value (0.95), which is in close agreement with the adjusted R2, suggests strong predictive power (Bezerra et al., 2008). The adequacy of the quadratic model was further validated by the non-significant lack-of-fit test (p > 0.05), confirming that the quadratic terms significantly improved the model fit compared to simpler models and accurately captured the relationship within the experimental domain (Montgomery, 2017).
A quadratic regression model was developed to predict the protein content of the snacks based on the percentage of X1, X2, and X3. The resulting equation was:
Figure 1b illustrated the effect of varying proportions of RF, WM, and RP on the protein content of the fried snack. The highest protein content was observed in formulations containing low levels of RF and high levels of both WM and RP. An increase in RF led to a reduction in protein levels, as RF was relatively low in protein. Among all components, RP had the strongest positive effect on protein content; formulations with high RP and WM and low RF yielded the highest protein values. Increasing WM alone resulted in a moderate rise in protein content, but when WM was increased in combination with RP, the protein content increased more sharply. Conversely, the negative impact of RF on protein content became more affected when both WM and RP were present at low levels. These interactions suggested that the combined use of high-protein ingredients (WM and RP) led to significantly higher protein levels in the snack formulation. Overall, these findings underscored the importance of ingredient interactions in maximizing the protein content of the final product.
3.3 Functional properties
3.3.1 Total phenolic content (TPC)
The total phenolic content (TPC) in the snacks, indicating the level of a major group of antioxidant compounds, varied significantly depending on the formulation, ranging from 1,378.33 to 3,236.54 mg GAE/100 g dw (Table 2). Formulations with more WM had higher TPC values, while those with higher RF content showed lower TPC. This trend was due to the naturally high TPC found in WM, which was much higher than the moderate levels in RF and the very low amounts in RP (Table 3). This finding agrees with previous reports identifying Wolffia as rich sources of phenolic compounds (Hu et al., 2022; Boonarsa et al., 2024), as well as the contribution of pigmented rice to phenolic content (Kammapana, 2023).
RSM modeling identified a significant special cubic model as the best fit for predicting TPC (Table 4). The model demonstrated excellent validity with high R2 (0.99), adjusted R2 (0.98), adequate prediction (Predicted R2 = 0.86), and a non-significant lack-of-fit test. The requirement for a cubic model suggests that complex, non-linear interactions between the three ingredients significantly influence the final TPC. The resulting predictive equation was:
The contour plot (Figure 2a) illustrated the complex relationship between ingredient proportions and TPC, with the highest values found in formulations containing high levels of WM. This confirmed that WM played a major role in increasing TPC, even though the special cubic model indicated some interaction effects. Using a high proportion of WM was therefore considered the most effective strategy to enhance the phenolic content of the snack, despite possible partial degradation during processing (Sharma et al., 2024).
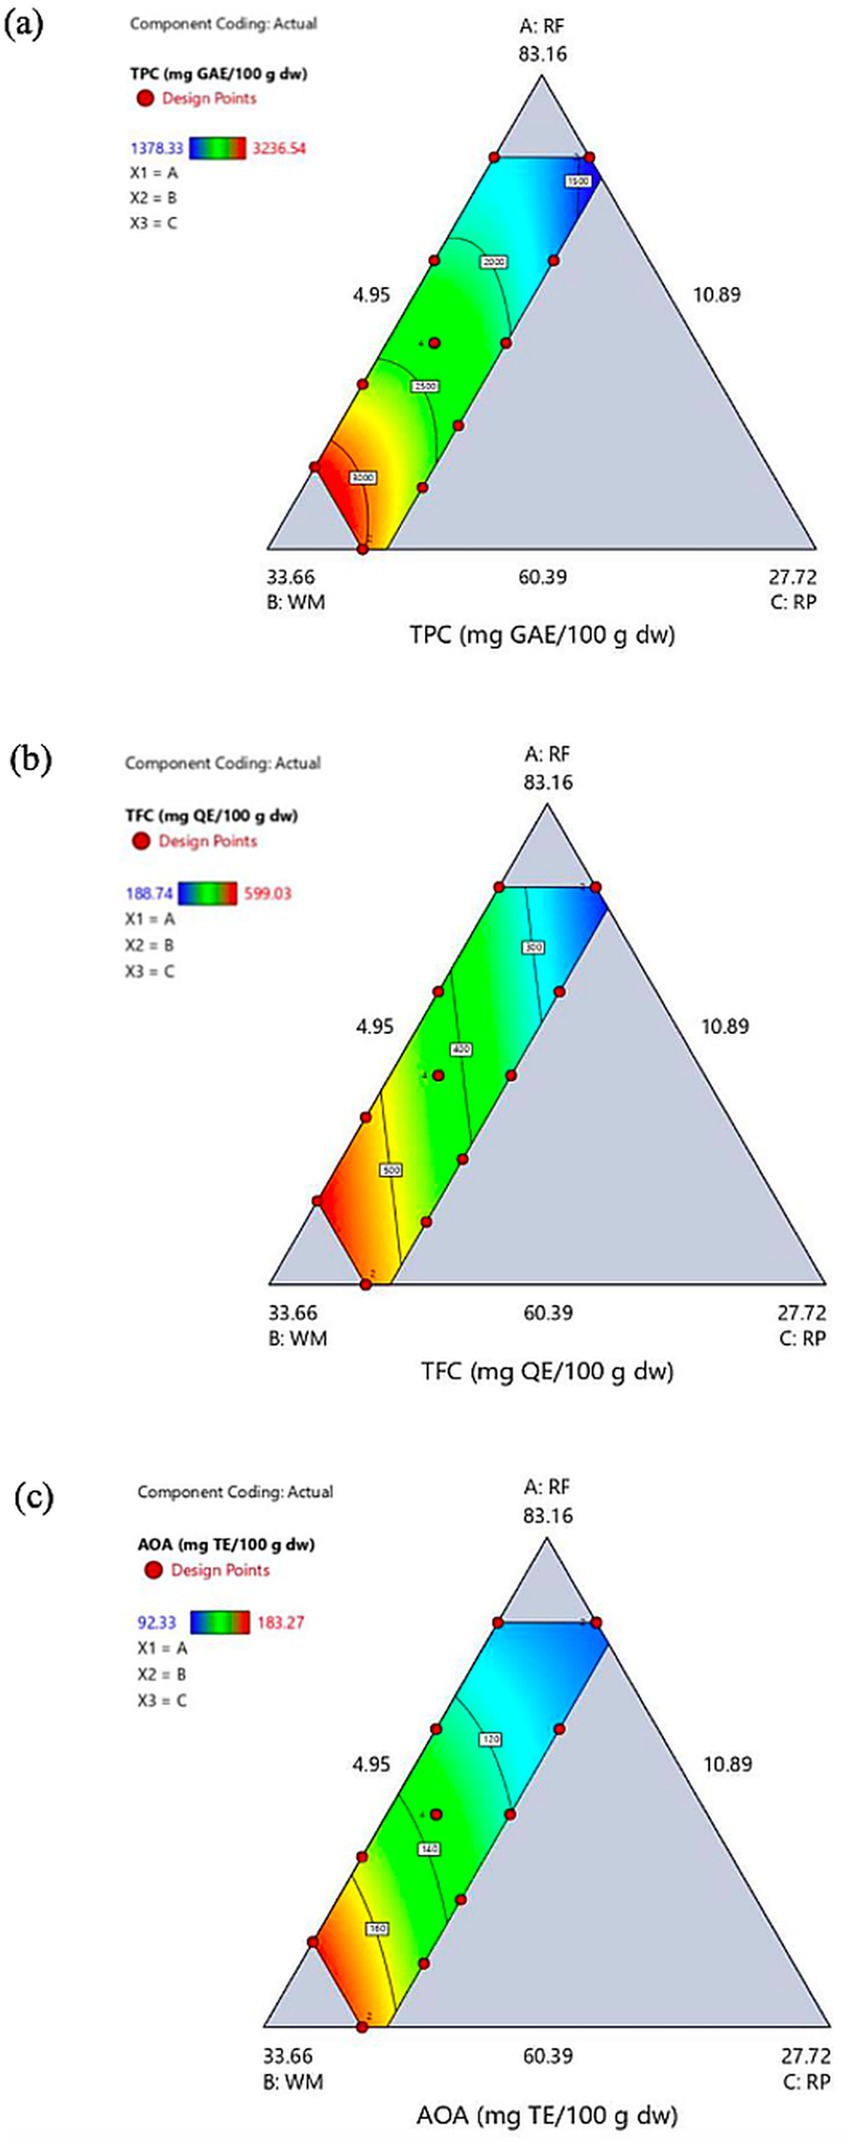
Figure 2. Contour plot showing the effects of F (Tubtim Chum Phae rice flour), WM (watermeal powder), and RP (rice protein isolate powder) on the functional properties of snacks. (a) total phenolic content (TPC), (b) total flavonoid content (TFC), and (c) antioxidant activity (AOA; DPPH radical scavenging assay).
3.3.2 Total flavonoid content (TFC)
Total flavonoid content (TFC), representing another important class of antioxidants, ranged from 188.74 to 599.03 mg QE/100 g dw across the experimental runs (Table 2). Similar to TPC, the highest TFC values were achieved in formulations rich in WM and low in RF, while the lowest values corresponded to high-RF, low-WM combinations. This result again reflects the ingredient properties, particularly the very high flavonoid levels inherent to WM (Hu et al., 2022; Boonarsa et al., 2024).
For TFC, RSM modeling indicated that a significant linear model provided an excellent and adequate fit (R2 = 0.97, Adj R2 = 0.96, Pred R2 = 0.94, and lack of fit: p = 0.68) (Table 4). The suitability of the linear model suggests predominantly additive effects of the ingredients on TFC within the experimental range. The predictive linear equation was:
The contour plot for TFC (Figure 2b) revealed that the highest total flavonoid content was predicted in the region with the highest proportion of WM. The nearly linear contour lines indicated a good fit with the linear model and visually confirmed a strong positive relationship between WM concentration and TFC levels. These findings suggest that WM is the principal ingredient contributing to the enhancement of flavonoid content in the snack formulation.
3.3.3 Antioxidant activity (AOA)
The antioxidant activity (AOA) content (DPPH radical scavenging assay) varied significantly among formulations, ranging from 92.32 to 183.27 mg TE/100 g dw (Table 2). Formulations with the highest level of WM (30%) resulted in the highest AOA content (e.g., Runs 4, 6, and 10). In contrast, the lowest AOA levels were observed in formulations with decreased proportions of WM (e.g., Runs 11 and 15). The trend closely followed that of TPC and TFC, with higher AOA values strongly associated with higher WM proportions and lower RF content. This correlation is expected, as AOA is largely dependent on the concentration and types of phenolic and flavonoid compounds present (Kammapana, 2023). The high AOA inherent to WM (Table 3) was the most significant contributor to the overall AOA of the snacks (Boonarsa et al., 2024).
A significant quadratic model was found to best describe the AOA response (Table 4). The model demonstrated excellent fit and predictive capability (R2 = 0.97, Adj R2 = 0.95, Pred R2 = 0.89) and was validated by a non-significant lack-of-fit test. The quadratic nature implies that interactions between the ingredients influence the overall AOA. The predictive quadratic equation was:
The contour plot of AOA (Figure 2c) illustrated that the highest AOA values were observed in the region corresponding to the highest proportion of WM and the lowest level of RF. In contrast, the lowest AOA was found in formulations with a high proportion of RF and low WM content. These results were consistent with previous findings indicating that WM is rich in phenolic and flavonoid compounds, which are known for their antioxidant properties (Boonarsa et al., 2024). Thus, WM was identified as a key functional ingredient responsible for enhancing the antioxidant capacity of the snack formulations.
3.4 Formulation optimization and model validation
The optimization of the snack formulation was performed using the numerical optimization feature of Design-Expert software (version 13), aiming to achieve a balance of desired physicochemical and functional properties. Specific goals were set for each response variable based on the experimental ranges and desired outcomes presented in Table 5. Protein content, TPC, TFC, and AOA were maximized. Hardness was set to be within its acceptable experimental range to ensure consumer appeal while maintaining structural integrity. For each response, an individual desirability function (ranging from 0 to 1) was generated. This function transforms the response into a dimensionless scale, where a value of 1 represents the most desirable outcome and 0 represents an undesirable outcome. These individual desirability functions were then combined into a single, overall composite desirability function. Design-Expert software used the stored regression models (Table 4) to estimate the predictor settings that optimize the values of all response variables simultaneously. The optimal formulation was identified by maximizing this overall desirability value, thereby finding the ingredient proportions that best met all predefined criteria (Ain et al., 2023; Sheibani et al., 2018).
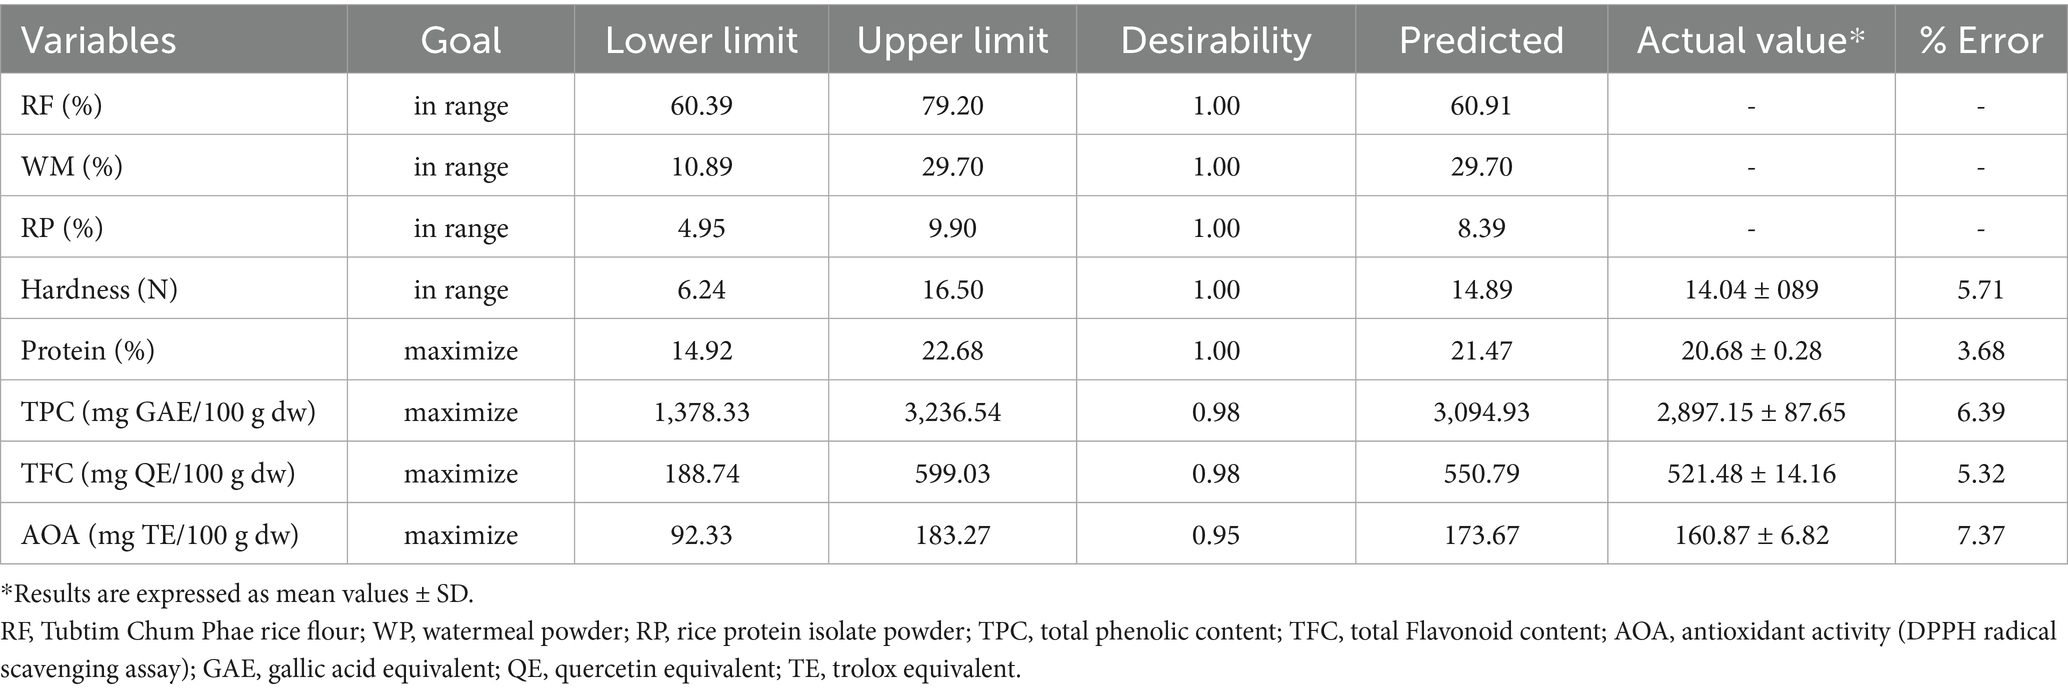
Table 5. Predicted and experimental values of independent variables and responses at optimal formulation of snacks.
The individual desirability values obtained for the optimal formulation of hardness and protein were 1.00; TPC, TFC, and AOA were 0.98, 0.98, and 0.95, respectively. The optimization procedure predicted a single optimal formulation of 60.91% RF, 29.70% WM, and 8.39% RP (Table 5). A verification experiment was conducted using this optimal formulation to validate the predictive accuracy of the developed RSM models. The experimentally determined values for hardness, protein content, TPC, TFC, and AOA were then compared against the values predicted by their respective models.
The comparison revealed a close agreement between the predicted and actual experimental values for all five responses. The percentage error (%Error), calculated as the absolute difference between predicted and actual values relative to the actual value, was found to be low for all properties: 5.71% for hardness, 3.68% for protein, 6.39% for TPC, 5.32% for TFC, and 7.37% for AOA (Table 5). This essential step of comparing model predictions against experimental data serves to validate the accuracy and reliability of the RSM models generated (Bezerra et al., 2008; Ain et al., 2023). The low percentage of errors observed, generally falling below the commonly accepted threshold of 10% for adequate model fit in food science applications (Lomauro et al., 1985; Zhang et al., 2022), strongly indicates that the developed models accurately represent the influence of ingredient proportions on the snack properties. This excellent agreement between predicted and experimental results confirms the suitability and reliability of the RSM approach for modeling the snack system and reliably predicting its characteristics within the investigated formulation space. Therefore, the identified optimal formulation (Table 5) can be confidently considered to produce snacks with the desired balance of physicochemical and functional properties.
3.5 Microstructure of prototype snack
The surface microstructure (Figure 3a, 50x magnification) appeared irregular and non-uniform, lacking a smooth, continuous film and some aggregated or particulate features. This surface morphology might result from the interaction of different components during extrusion, the rapid moisture loss and oil interaction during frying, or less fusible components like fiber or protein aggregates at the surface.
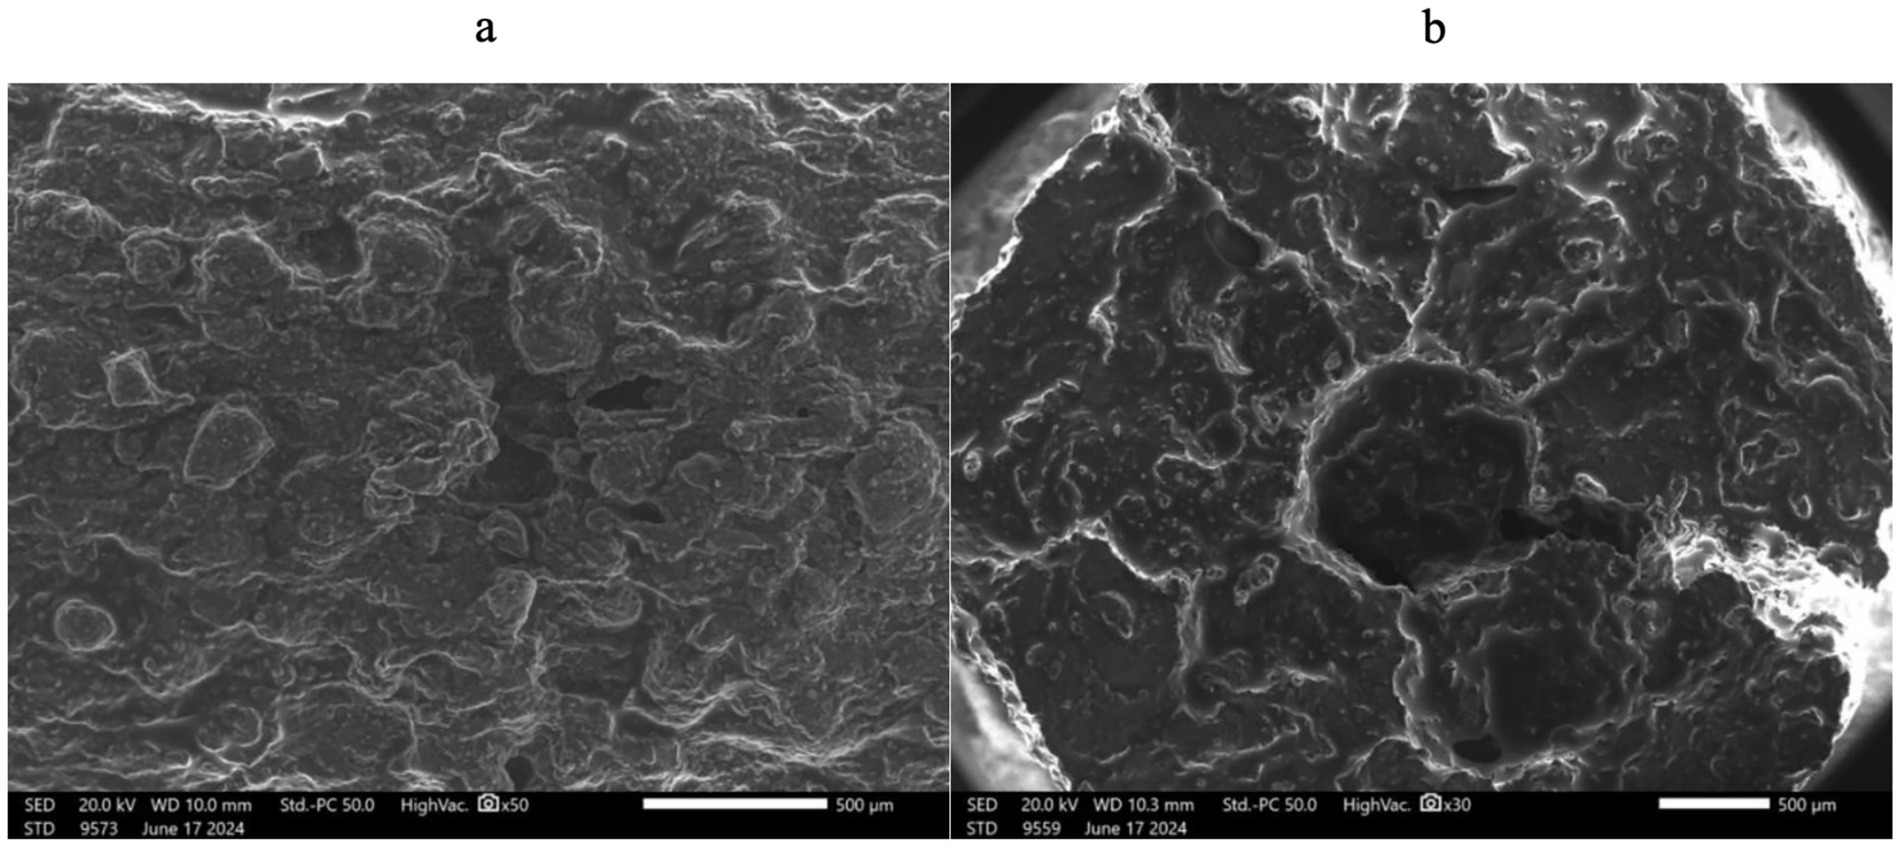
Figure 3. Microstructure of the prototype fried rice-based snack produced from Tubtim Chum Phae rice flour (RF) supplemented with watermeal (WM), rice protein isolate (RP), and Transglutaminase (Tgase) powders. (a) surface and (b) cross-section.
Examination of the cross-section (Figure 3b, 30x magnification) revealed a non-uniform, with relatively low porosity of extruded and fried snack products but with distinct features reflecting the composite nature of the formulation. In contrast to large, uniform, thin-walled air cells typical of highly expanded low-protein snacks, the snack exhibited a matrix with variable porosity. Some larger, irregular voids were distributed within a dense matrix containing smaller pores and thicker cell walls in many areas. This denser, less expanded structure is consistent with snacks formulated with significant levels of protein and fiber (HewaNadungodage et al., 2021; Adibah et al., 2024). The texture characteristics of extruded food product are closely linked to their expansion behavior and internal cell structure (Oliveira et al., 2018). For extruded snacks to be appealing to consumers, they should exhibit good expansion and an appropriate bulk density. The distribution of air spaces within the product matrix contributes to its overall porosity, which in turn enhances crispness, an attribute often associated with a greater degree of expansion. Hirunyophat et al. (2022) reported that breakfast cereals with uneven porosity distribution and thick, compact cell walls exhibited higher hardness and reduced crispness compared to products with more porous and uniformly expanded structures. In this study, the substantial protein content derived from both WM and RP likely formed extensive networks, potentially strengthened by TGase, which limited the degree of starch expansion from the RF base and contributed to the formation of thicker, more robust cell walls (Madhavan and Sreekantaiah, 2025; Liu et al., 2024). Furthermore, the dietary fiber contributed by WM may have interrupted the continuous starch matrix and limited puffing, contributing to the observed denser structure. While starch gelatinization and steam formation during extrusion and frying create porosity (Gat and Ananthanarayan, 2015), the presence of high levels of protein and fiber restricts this expansion compared to purely starch-based snacks.
3.6 Amino acid profiles
The amino acid composition, particularly the essential amino acid (EAA) profile, is a critical determinant of the overall nutritional quality of protein sources. Table 6 presents the amino acid profiles (g/100 g sample) of the raw materials (RF, WM, RP) and the final snack prototype. Significant differences (p < 0.05) were observed in the concentrations of most individual amino acids among the raw materials. RP generally exhibited the highest concentrations for several EAAs, including methionine, valine, and lysine. WM displayed a characteristic profile with an exceptionally high concentration of leucine and the highest level of histidine. Although individual EAA concentrations varied, the total EAA content was statistically similar and highest in RP and WM. In contrast, RF consistently showed significantly lower levels of most EAAs and the lowest total EAA content. For non-essential amino acids, WM had the highest total content, followed by RP, with RF again showing the lowest.
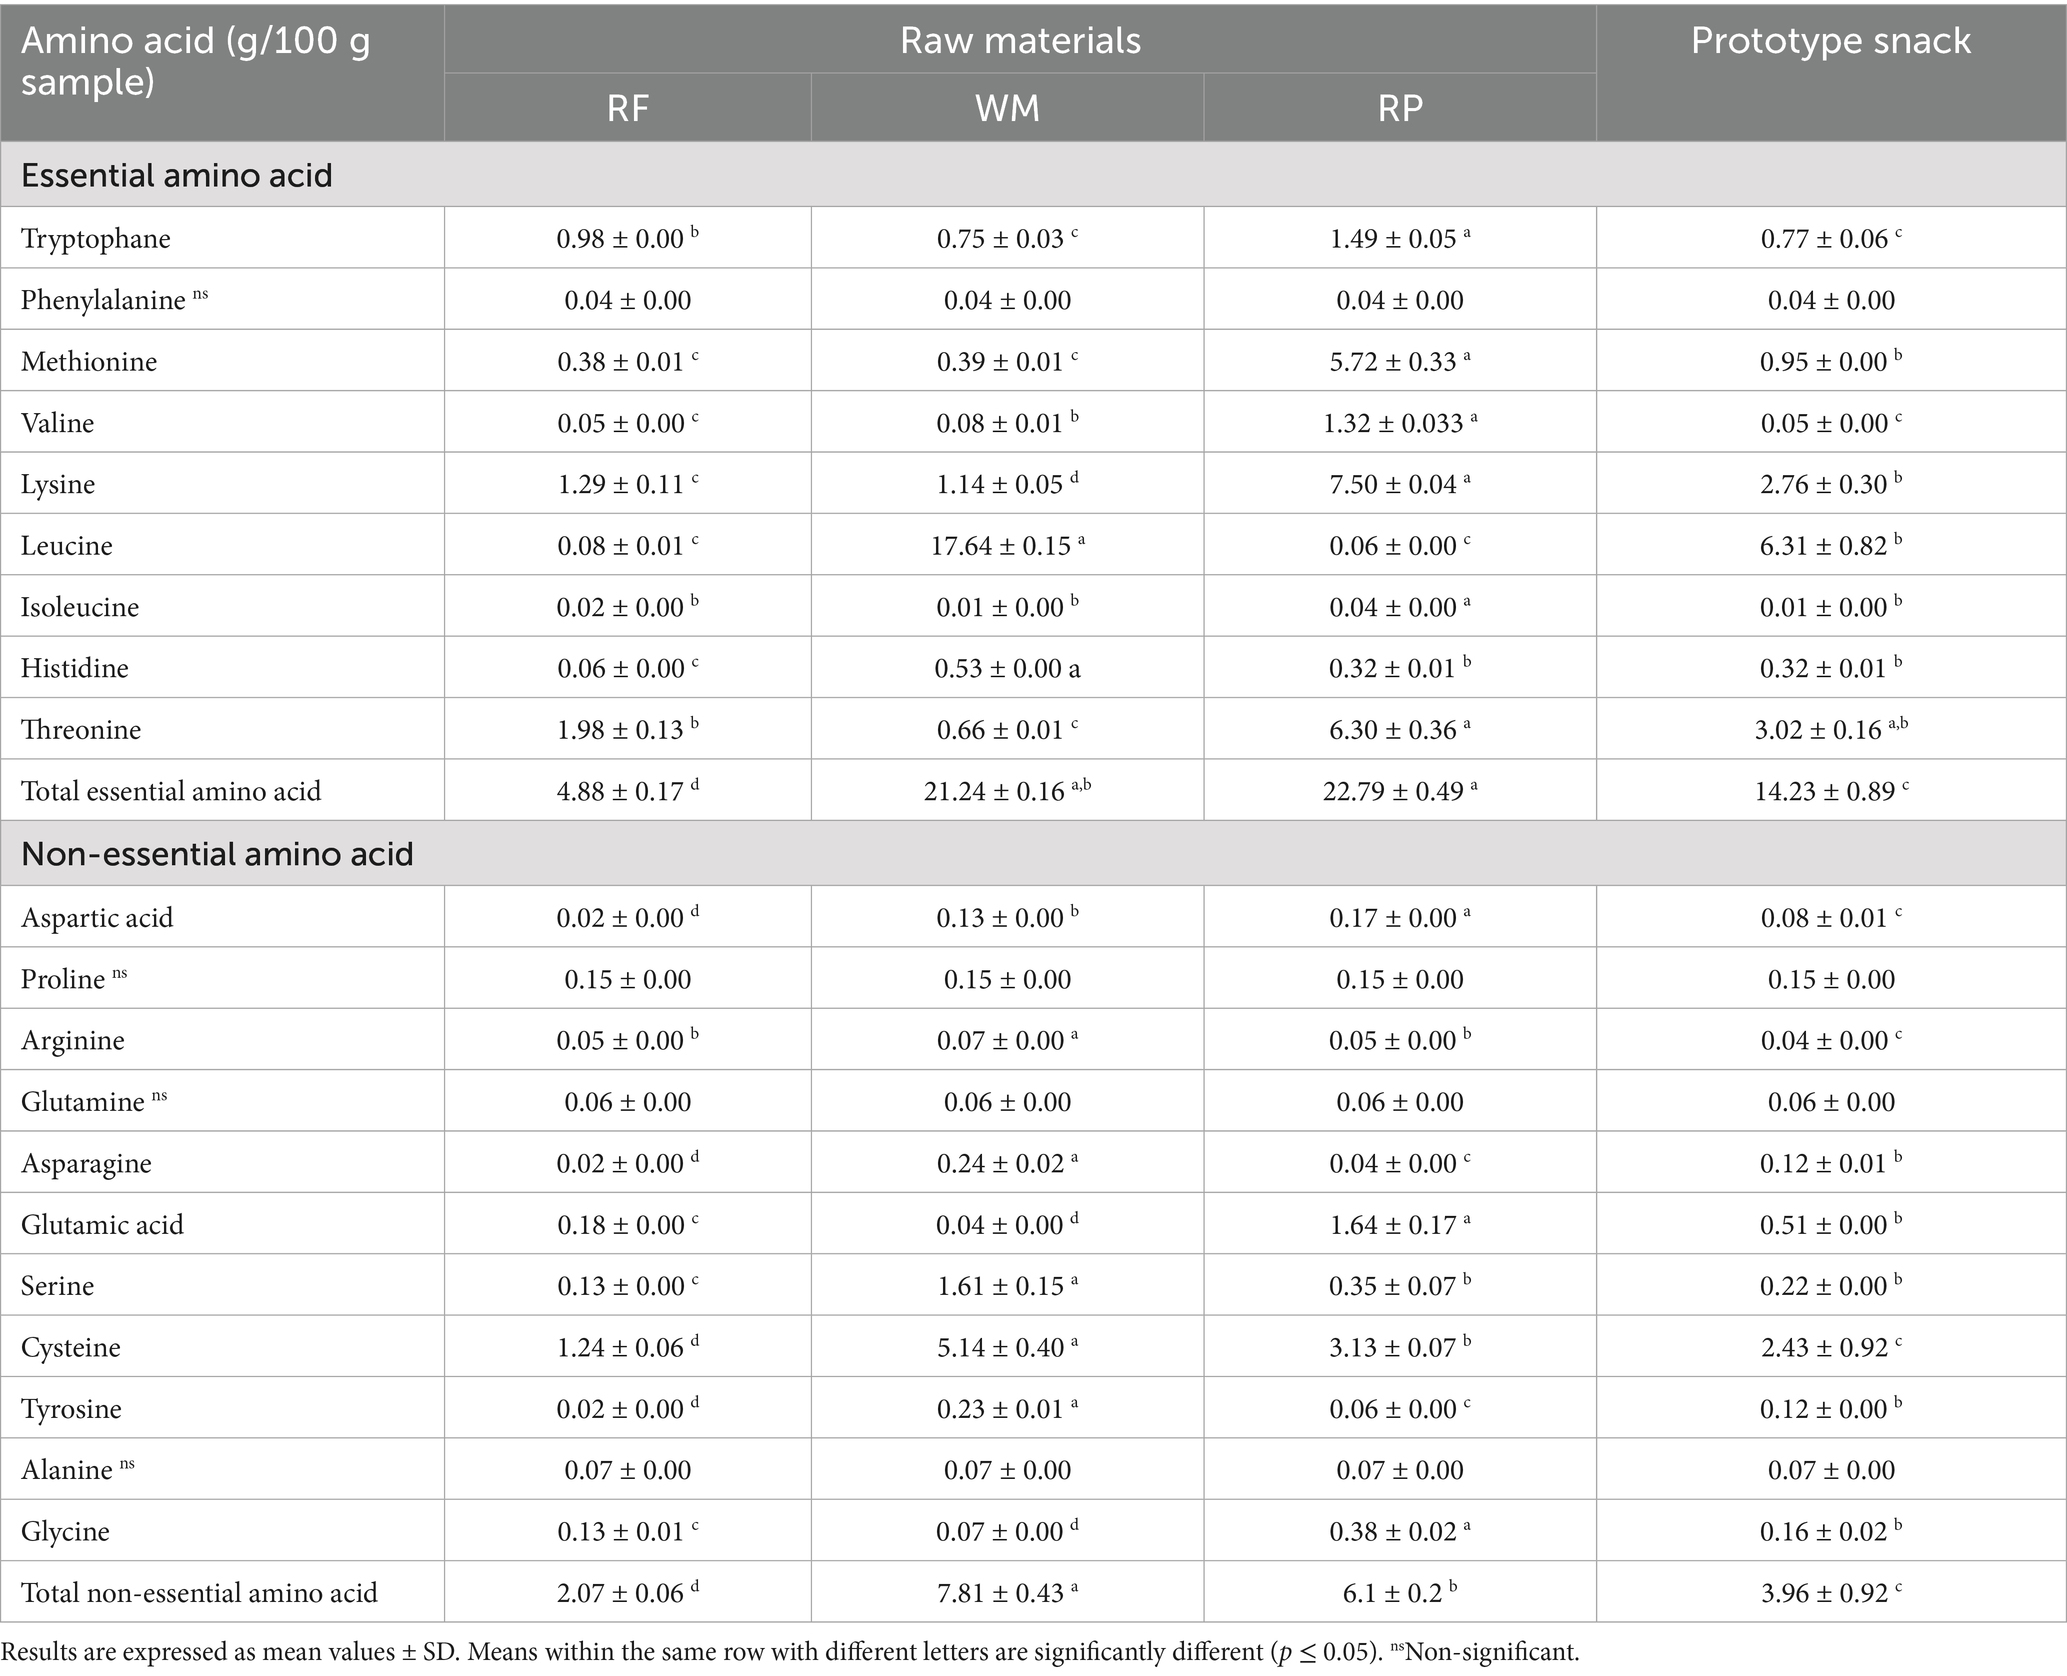
Table 6. Amino acid profiles of Tubtim Chum Phae rice flour (RF), watermeal powder (WM), rice protein isolate powder (RP), and prototype snack.
The amino acid profile of the snack prototype reflected the combined contributions of the ingredients. The total EAA content of prototype snack was significantly higher than that of RF alone, although lower than the concentrated sources WM and RP (Table 6). Specific EAA levels in the prototype were clearly influenced by the ingredients, such as leucine, which was substantially elevated due to the high contribution from WM, while lysine and methionine were significantly boosted compared to RF, primarily due to fortification with RP.
Improving the EAA profile is a key benefit of protein fortification, particularly for cereal-based products like rice snacks. Rice protein is essentially limited in lysine, which is often considered its first limiting essential amino acid (Lahiri et al., 2021). The results demonstrate that fortification with RP, rich in lysine (Table 6), successfully addressed this limitation in the snack prototype. Furthermore, including WM contributed significantly to the overall EAA content, which was comparable in total amount to RP and offered exceptionally high levels of leucine. The EAA profile of Wolffia species has been reported to be well-balanced and meet or exceed WHO/FAO requirements for specific age groups (Appenroth et al., 2018; Boonarsa et al., 2024). The synergistic amino acid profiles of RP and WM contributed to a final snack prototype with a significantly improved EAA profile compared to the RF base. This enhancement contributes considerably to the overall nutritional value, consistent with findings from other studies using protein isolates or plant-based fortifiers (HewaNadungodage et al., 2021; Sahoo et al., 2022).
4 Conclusion
This study demonstrated the optimization of a fried rice-based snack by incorporating watermeal (WM) and rice protein isolate (RP) into a Tubtim Chum Phae rice flour (RF) base, resulting in improved protein content and functional properties. Response Surface Methodology (RSM) effectively modeled the effects of ingredient proportions on snack hardness, protein, TPC, TFC, and AOA. The optimized snack contained ~20% protein, an enhanced essential amino acid profile, and significantly higher levels of TPC, TFC, and AOA compared to the RF. The SEM analysis revealed a relatively dense, non-uniformly porous structure. These results highlight the potential of WM and RP as functional ingredients for developing nutritious rice-based snacks with greater consumer appeal. Further studies should investigate the sensory acceptability, shelf life, and the bioactive compounds in the optimized product.
Data availability statement
The raw data supporting the conclusions of this article will be made available by the authors, without undue reservation.
Author contributions
KP: Validation, Conceptualization, Data curation, Methodology, Writing – review & editing, Visualization, Formal analysis, Writing – original draft. SL: Validation, Formal analysis, Methodology, Data curation, Writing – original draft. SH: Data curation, Validation, Writing – review & editing, Formal analysis, Methodology, Writing – original draft. CK: Writing – review & editing, Validation, Methodology, Formal analysis, Writing – original draft, Data curation. PI: Validation, Formal analysis, Methodology, Data curation, Writing – review & editing, Writing – original draft. YS: Methodology, Validation, Data curation, Writing – review & editing, Writing – original draft, Formal analysis. SP: Resources, Funding acquisition, Data curation, Project administration, Writing – original draft, Formal analysis, Visualization, Conceptualization, Writing – review & editing, Supervision, Investigation, Validation, Methodology.
Funding
The author(s) declare that financial support was received for the research and/or publication of this article. This research was funded by the Research and Development Institute (RDI), Sakon Nakhon Rajabhat University, under grant number 2/2567.
Conflict of interest
The authors declare that the research was conducted in the absence of any commercial or financial relationships that could be construed as a potential conflict of interest.
Generative AI statement
The authors declare that no Gen AI was used in the creation of this manuscript.
Any alternative text (alt text) provided alongside figures in this article has been generated by Frontiers with the support of artificial intelligence and reasonable efforts have been made to ensure accuracy, including review by the authors wherever possible. If you identify any issues, please contact us.
Publisher’s note
All claims expressed in this article are solely those of the authors and do not necessarily represent those of their affiliated organizations, or those of the publisher, the editors and the reviewers. Any product that may be evaluated in this article, or claim that may be made by its manufacturer, is not guaranteed or endorsed by the publisher.
Abbreviations
AOA, Antioxidant activity measured by the DPPH radical scavenging assay; GAE, Gallic acid equivalent; N, Newton; QE, Quercetin equivalent; RF, Tubtim Chum Phae rice flour; RP, Rice protein isolate powder; RSM, Response surface methodology; TE, Trolox equivalent; TFC, Total flavonoid content; TGase, Transglutaminase; TPC, Total phenolic content; WM, Watermeal (Wolffia arrhiza (L.) Wimm.) powder.
References
Adibah, L. N., Afizah, N., Wan Zunairah, W. I., and Syed Muhammad, S. K. (2024). Development of fibre-rich okara-based expanded snack via single screw extrusion. Food Res. 8, 48–56. doi: 10.26656/fr.2017.8(2).145
Ain, N., Aimi, S. S., Nurhazirah, A., Aishah, B., and Ab Mutalib, S. R. (2023). Response surface methodology (RSM) identifies the lowest amount of chicken plasma protein (CPP) in surimi-based products with optimum protein solubility, cohesiveness, and whiteness. CyTA J. Food. 21, 646–655. doi: 10.1080/19476337.2023.2272627
Alefew, Y. D., Tiruneh, A. T., and Yehuala, T. F. (2024). Optimization of extrusion conditions for development of high quality rice-lupin-pumpkin based extruded snack food. Heliyon. 10:e40913. doi: 10.1016/j.heliyon.2024.e40913
Annapure, U. S., Singhal, R. S., and Kulkarni, P. R. (1998). Studies on deep-fat fried snacks from some cereals and legumes. J. Sci. Food Agric. 76, 377–382. doi: 10.1002/(SICI)1097-0010(199803)76:3<377::AID-JSFA957>3.0.CO;2-R
AOAC (2000). Official methods of analysis. 17th Edn. Gaithersburg, MD: Association of Official Analytical Chemists.
AOAC (2002). Official methods of analysis, vol. 2. 17th Edn. Gaithersburg, MD: Association of Official Analytical Chemists.
Apea-Bah, F. B., Serem, J. C., Bester, M. J., and Duodu, K. G. (2017). Phenolic composition and antioxidant properties of koose, a deep-fat fried cowpea cake. Food Chem. 237, 247–256. doi: 10.1016/j.foodchem.2017.05.109
Appenroth, K. J., Sree, K. S., Bog, M., Ecker, J., Seeliger, C., Böhm, V., et al. (2018). Nutritional value of the duckweed species of the genus Wolffia (Lemnaceae) as human food. Front. Chem. 6:483. doi: 10.3389/fchem.2018.00483
Badwaik, L. S., Prasad, K., and Seth, D. (2014). Optimization of ingredient levels for the development of peanut based fiber rich pasta. J. Food Sci. Technol. 51, 2713–2719. doi: 10.1007/s13197-012-0779-8
Bakhaidar, R. B., Naveen, N. R., Basim, P., Murshid, S. S., Kurakula, M., Alamoudi, A. J., et al. (2022). Response surface methodology (RSM) powered formulation development, optimization and evaluation of thiolated-based mucoadhesive nanocrystals for local delivery of simvastatin. Polymers 14:5184. doi: 10.3390/polym14235184
Barbosa-Cánovas, G. V., Fontana, A. J. Jr., Schmidt, S. J., and Labuza, T. P. (Eds.) (2020). Water activity in foods: Fundamentals and applications. 2nd En. Edn. New Jersey: Wiley-Blackwell.
Bezerra, M. A., Santelli, R. E., Oliveira, E. P., Villar, L. S., and Escaleira, L. A. (2008). Response surface methodology (RSM) as a tool for optimization in analytical chemistry. Talanta 76, 965–977. doi: 10.1016/j.talanta.2008.05.019
Bhanthumnavin, K., and McGarry, M. G. (1971). Wolffia arrhiza as a possible source of inexpensive protein. Nature 232:495. doi: 10.1038/232495a0
Bhattacharya, S., and Narasimha, H. V. (2008). Effect of raw material characteristics on the properties of fried rice-blackgram dough. Int. J. Food Sci. Nutr. 59, 502–511. doi: 10.1080/09637480701554160
Boonarsa, P., Bunyatratchata, A., Chumroenphat, T., Thammapat, P., Chaikwang, T., Siripan, T., et al. (2024). Nutritional quality, functional properties, and biological characterization of watermeal (Wolffia globosa). Horticulturae 10:1171. doi: 10.3390/horticulturae10111171
Bresciani, A., Vanara, F., Pagliarini, E., Locatelli, M., Proserpio, C., Travaglia, F., et al. (2023). Effect of enrichment of rice snacks with pulse seed coats on phenolic compound content, product features and consumer hedonic response. Food Chem. 398:133936. doi: 10.1016/j.foodchem.2022.133936
Chaiyakul, S., Jangchud, K., Jangchud, A., Wuttijumnong, P., and Winger, R. (2008). Effect of protein content and extrusion process on sensory and physical properties of extruded high-protein, glutinous rice-based snack. Agr. Nat. Resour. 42, 182–190.
Chinprahast, N., Tungsomboon, T., and Nagao, P. (2016). Antioxidant activities of Thai pigmented rice cultivars and application in sunflower oil. IJFST. 51, 46–53. doi: 10.1016/j.afres.2023.100373
Dileep, A. O., Shamasundar, B. A., Binsi, P. K., and Howell, N. K. (2010). Composition and quality of rice flour-fish mince based extruded products with emphasis on thermal properties of rice flour. J. Texture Stud. 41, 190–207. doi: 10.1111/j.1745-4603.2010.00221.x
Dilrukshi, H. N. N., Torrico, D. D., Brennan, M. A., and Brennan, C. S. (2022). Effects of extrusion processing on the bioactive constituents, in vitro digestibility, amino acid composition, and antioxidant potential of novel gluten-free extruded snacks fortified with cowpea and whey protein concentrate. Food Chem. 389:133107. doi: 10.1016/j.foodchem.2022.133107
dos Santos, M., Ribeiro, W. O., Monteiro, J. d. S., dos Santos, B. A., Campagnol, P. C. B., and Pollonio, M. A. R. (2023). Effect of transglutaminase treatment on the structure and sensory properties of rice- or soy-based hybrid sausages. Foods. 12:4226. doi: 10.3390/foods12234226
Farah, S., Bailey, J., Mezzatesta, P., and Raimondo, E. (2023). Development of a grain-and-legume-based snack with amaranth, quinoa and chia seeds. Biol. Life Sci. Forum 25:16. doi: 10.3390/blsf2023025016
Gat, Y., and Ananthanarayan, L. (2015). Effect of extrusion process parameters and pregelatinized rice flour on physicochemical properties of ready-to-eat expanded snacks. J. Food Sci. Technol. 52, 2634–2645. doi: 10.1007/s13197-014-1378-7
HewaNadungodage, N. D., Torrico, D. D., Brennan, M. A., and Brennan, C. S. (2021). Nutritional, physicochemical, and textural properties of gluten-free extruded snacks containing cowpea and whey protein concentrate. IJFST 57, 3903–3913. doi: 10.1111/ijfs.15462
Hirunyophat, P., Chalermchaiwat, P., On-nom, N., and Prinyawiwatkul, W. (2022). Selected physicochemical properties and sensory acceptability as affected by addition of lecithin and calcium carbonate in extruded breakfast cereals made with silkworm pupae powder and rice flour. IJFST. 57, 631–642. doi: 10.1111/ijfs.15356
Hu, Z., Fang, Y., Yi, Z., Tian, X., Li, J., Jin, Y., et al. (2022). Determining the nutritional value and antioxidant capacity of duckweed (Wolffia arrhiza) under artificial conditions. LWT 153:112477. doi: 10.1016/j.lwt.2021.112477
Jayaprakash, G., Bains, A., Chawla, P., Fogarasi, M., and Fogarasi, S. (2022). A narrative review on rice proteins: current scenario and food industrial application. Polymers 14:3003. doi: 10.3390/polym14153003
Jones, B., and Goos, P. (2012). I-optimal versus D-optimal split-plot response surface designs. J. Qual. Technol. 44, 85–101. doi: 10.1080/00224065.2012.11917886
Kalman, D. S. (2014). Amino acid composition of an organic brown rice protein concentrate and isolate compared to soy and whey concentrates and isolates. Foods 3, 394–402. doi: 10.3390/foods3030394
Kammapana, L. (2023). Physical characteristics, phytochemical contents and antioxidant activity of ten organic-pigmented rice varieties from Surin Province. Trends Sci. 20:4566. doi: 10.48048/tis.2023.4566
Khemthong, S., Yuthachit, P., Oonmettaaree, J., Yamthonglang, L., Mungphuklang, K., and Toboonsung, B. (2021). Effects of watermeal (Wolffia arrhiza (L.) Wimm.) powder supplement to the quality of fresh noodles. JASET 20, 183–200. doi: 10.14416/j.appsci.2021.02.014
Lahiri, A., Rastogi, K., Datta, A., and Septiningsih, E. M. (2021). Bayesian network analysis of lysine biosynthesis pathway in rice. Inventions 6:37. doi: 10.3390/inventions6020037
Ledbetter, M., Wilkin, J. D., Mubaiwa, J., Manditsera, F. A., Macheka, L., Ruzengwe, F. M., et al. (2024). Development of a nutritious cereal-based instant porridge by the incorporation of protein-rich insect powder – an example from Zimbabwe. J. Funct. Foods 112:105957. doi: 10.1016/j.jff.2023.105957
Liu, X., Zhao, X., Ma, C., Wu, M., Fan, Q., Fu, Y., et al. (2024). Effects of extrusion technology on physicochemical properties and microstructure of rice starch added with soy protein isolate and whey protein isolate. Foods. 13:764. doi: 10.3390/foods13050764
Lomauro, C., Bakshi, A., and Labuza, T. (1985). Evaluation of food moisture sorption isotherm equations. Part I: fruit, vegetable and meat products. LWT. 18, 111–117.
Madhavan, S., and Sreekantaiah, H. M. (2025). Influence of high protein on the rheological properties, microstructure, and X-ray diffraction of cracker formulations. Curr. Res. Nutr. Food Sci. 13, 132–144. doi: 10.12944/crnfsj.13.1.8
Mala, T., Piayura, S., and Itthivadhanapong, P. (2024). Characterization of dried pineapple (Ananas comosus L.) peel powder and its application as a novel functional food ingredient in cracker product. Future Foods 9:100322. doi: 10.1016/j.fufo.2024.100322
Melini, V., and Acquistucci, R. (2017). Health-promoting compounds in pigmented Thai and wild rice. Foods. 6:9. doi: 10.3390/foods6010009
Modupalli, N., Galib, R. M., Sen, R., Lafontaine, S., and Rahman, M. M. (2024). Improving yield, functional properties, and aroma profile of rice bran protein through innovative extraction and precipitation methods. J. Cereal Sci. 120:104033. doi: 10.1016/j.jcs.2024.104033
Montgomery, D. C. (2017). Design and analysis of experiments. 9th Edn: New Jersey: John Wiley & Sons.
Morita, T., Oh-hashi, A., Kasaoka, S., Ikai, M., and Kiriyama, S. (1996). Rice protein isolates produced by the two different methods lower serum cholesterol concentration in rats compared with casein. J. Sci. Food Agric. 71, 415–424. doi: 10.1002/(SICI)1097-0010(199608)71:4<415::AID-JSFA599>3.0.CO;2-6
Muntana, N., and Prasong, S. (2010). Study on total phenolic contents and their antioxidant activities of Thai white, red and black rice bran extracts. Pak. J. Biol. Sci. 13, 170–174. doi: 10.3923/pjbs.2010.170.174
Musika, J., Kapcum, C., Itthivadhanapong, P., Musika, T., Hanmontree, P., and Piayura, S. (2024). Enhancing nutritional and functional properties of gluten-free Riceberry rice pasta supplemented with cricket powder using D-optimal mixture design. Front. Sustain. Food Syst. 8:1417045. doi: 10.3389/fsufs.2024.1417045
Nitiwuttithorn, C., Wongsasulak, S., Vongsawasdi, P., and Yongsawatdigul, J. (2024). Effects of alkaline and ultrasonication on duckweed (Wolffia arrhiza) protein extracts’ physicochemical and techno-functional properties. Front. Sustain. Food Syst. 8:1343615. doi: 10.3389/fsufs.2024.1343615
Oiveira, A. R., Ribeiro, A. E. C., Oliveira, É. R., Ribeiro, K. O., Garcia, M. C., Careli-Gondim, Í., et al. (2020). Physicochemical, microbiological and sensory characteristics of snacks developed from broken rice grains and turmeric powder. IJFST. 55, 2719–2729. doi: 10.1111/ijfs.14525
Oliveira, L. C., Alencar, N. M., and Steel, C. J. (2018). Improvement of sensorial and technological characteristics of extruded breakfast cereals enriched with whole grain wheat flour and jabuticaba (Myrciaria cauliflora) peel. LWT 90, 207–214. doi: 10.1016/j.lwt.2017.12.017
Omwamba, M., and Mahungu, S. M. (2014). Development of a protein-rich ready-to-eat extruded snack from a composite blend of rice, sorghum and soybean flour. FNS 5, 1309–1317. doi: 10.4236/fns.2014.514142
On-Nom, N., Promdang, P., Inthachat, W., Kanoongon, P., Sahasakul, Y., Chupeerach, C., et al. (2023). Wolffia globosa-based nutritious snack formulation with high protein and dietary fiber contents. Foods. 12:2647. doi: 10.3390/foods12142647
Patsanguan, S., Hisaranusorn, N., Phongthai, S., and Rawdkuen, S. (2017). Rice bran protein isolates: preparation and their physico-chemical and functional properties. FABJ. 2, 169–182. doi: 10.14456/fabj.2014.15
Philipp, C., Buckow, R., Silcock, P., and Oey, I. (2017). Instrumental and sensory properties of pea protein-fortified extruded rice snacks. Food Res. Int. 102, 658–665. doi: 10.1016/j.foodres.2017.09.048
Piayura, S., and Itthivadhanapong, P. (2023). The effects of feed moisture and dried coconut meal content on the physicochemical, functional, and sensory properties of gluten-free Riceberry rice flour-based extruded snacks. Front. Sustain. Food Syst. 7:1194594. doi: 10.3389/fsufs.2023.1194594
Sahoo, M. R., Kuna, A., Devi, M. P., Sowmya, M., and Dasgupta, M. (2022). Fortification of ready-to-eat extruded snacks with tree bean powder: nutritional, antioxidant, essential amino acids, and sensory properties. J. Food Sci. Technol. 59, 2351–2360. doi: 10.1007/s13197-021-05251-w
Salvador, A., Varela, P., Sanz, T., and Fiszman, S. M. (2009). Understanding potato chips crispy texture by simultaneous fracture and acoustic measurements, and sensory analysis. LWT 42, 763–767. doi: 10.1016/j.lwt.2008.09.016
Seth, D., and Rajamanickam, G. (2012). Development of extruded snacks using soy, sorghum, millet and rice blend – a response surface methodology approach. IJFST. 47, 1526–1531. doi: 10.1111/j.1365-2621.2012.03001.x
Shafiq, M., Waseem, M., Majeed, Y., Khalid, M. A., Nadeem, T., Rebezov, M., et al. (2024). Development and quality cum nutritional assessment based on physical properties for corn extruded snacks enriched with protein and carbohydrates: a remedy to malnutrition for society. Potr. S. J. F. Sci. 18, 633–653. doi: 10.5219/1942
Shah, F. H., Sharif, M., Bashir, S., and Ahsan, F. (2019). Role of healthy extruded snacks to mitigate malnutrition. Food Rev. Int. 35, 299–323. doi: 10.1080/87559129.2018.1542534
Sharma, R., Kumar, R., Srivastava, T., and Saxena, D. C. (2015). “Textural and microstructural properties of extruded snacks prepared from rice flour, corn flour, and deoiled rice bran by twin screw extrusion” in International conference on advancements in engineering and technology. (ICAET 2015) Incheon, South Korea: 8 (August 2015), Trans Tech Publications. 33–38.
Sharma, S., Sharma, R., Chakkaravarthi, S., Mani, S., Kumar, A., Mishra, S., et al. (2024). Effect of frying on physicochemical and nutritional qualities of herbs and spices incorporated rice cracker. Food Chemistry Advances 4:100690. doi: 10.1016/j.focha.2024.100690
Sheibani, E., Dabbagh Moghaddam, A., Sharifan, A., and Afshari, Z. (2018). Linear programming: an alternative approach for developing formulations for emergency food products. J. Sci. Food Agric. 98, 1444–1452. doi: 10.1002/jsfa.8612
Suknark, K., Phillips, R. D., and Chinnan, M. S. (1997). Physical properties of directly expanded extrudates formulated from partially defatted peanut flour and different types of starch. Food Res. Int. 30, 575–583. doi: 10.1016/S0963-9969(98)00016-7
Supawong, S., Park, J. W., and Thawornchinsombut, S. (2019). Effect of rice bran hydrolysates on physicochemical and antioxidative characteristics of fried fish cakes during repeated freeze-thaw cycles. Food Biosci. 32:100471. doi: 10.1016/j.fbio.2019.100471
Trevisan, A. J., and Arêas, J. A. (2012). Development of corn and flaxseed snacks with high-fibre content using response surface methodology (RSM). Int. J. Food Sci. Nutr. 63, 362–367. doi: 10.3109/09637486.2011.629179
Vichit, W., and Saewan, N. (2015). Antioxidant activities and cytotoxicity of Thai pigmented rice. Int. J. Pharm. Sci. 7, 329–334.
Waksmanska, W., Bobinski, R., Ilczak, T., and Pielesz, A. (2023). Essential amino acids in the diet of children and adolescents. J. Nutr. Sci. Vitaminol. (Tokyo) 69, 190–196. doi: 10.3177/jnsv.69.190
Wang, M., Hettiarachchy, N. S., Qi, M., Burks, W., and Siebenmorgen, T. (1999). Preparation and functional properties of rice bran protein isolate. J. Agric. Food Chem. 47, 411–416. doi: 10.1021/jf9806964
Wani, S. A., and Kumar, P. (2016). Effect of extrusion on the nutritional, antioxidant and microstructural characteristics of nutritionally enriched snacks. J. Food Process. Preserv. 40, 166–173. doi: 10.1111/jfpp.12593
Yadav, U., Singh, R. R. B., Chatterjee, A., Prakash, K., and Arora, S. (2021). Development of high protein extruded snack using composite flour and milk proteins through response surface methodology. J. Food Process. Preserv. 45:e15025. doi: 10.1111/jfpp.15025
Zawistowski, J., Kopec, A., and Kitts, D. D. (2009). Effects of a black rice extract (Oryza sativa L. indica) on cholesterol levels and plasma lipid parameters in Wistar Kyoto rats. J. Funct. Foods 1, 50–56. doi: 10.1016/j.jff.2008.09.008
Keywords: Wolffia arrhiza , Tubtim Chum Phae rice, rice protein isolate, fried rice snack, I-optimal, amino acid profile
Citation: Patcharabudsarakumkul K, Liamlaem S, Hemathulin S, Kapcum C, Itthivadhanapong P, Somkhumphee Y and Piayura S (2025) Optimizing formulation of fried rice-based snack supplemented with watermeal (Wolffia arrhiza (L.) Wimm.) and rice protein isolate powders using an I-optimal design: enhanced protein content and functional properties. Front. Sustain. Food Syst. 9:1661446. doi: 10.3389/fsufs.2025.1661446
Edited by:
Marco Montemurro, National Research Council (CNR), ItalyReviewed by:
Seydi Yıkmış, Namik Kemal University, TürkiyeAgung Wahyono, State Polytechnic of Jember, Indonesia
Copyright © 2025 Patcharabudsarakumkul, Liamlaem, Hemathulin, Kapcum, Itthivadhanapong, Somkhumphee and Piayura. This is an open-access article distributed under the terms of the Creative Commons Attribution License (CC BY). The use, distribution or reproduction in other forums is permitted, provided the original author(s) and the copyright owner(s) are credited and that the original publication in this journal is cited, in accordance with accepted academic practice. No use, distribution or reproduction is permitted which does not comply with these terms.
*Correspondence: Sumeth Piayura, c3BpYXl1cmFAc25ydS5hYy50aA==