 Henri Schmit
 Simon Pöllinger
- ZAE Bayern, Garching, Germany
Thermal energy storage based on adsorption and desorption of water on zeolites promises high energy storage densities. In the design of adsorption thermal energy storages, an application oriented material characterisation and simulation is necessary to choose an adsorbent that is a good match for the application conditions. Therefore, a method consisting of four steps is proposed. In the first step, potential adsorbents are compared to each other under application conditions using characteristic curves. The equilibrium data to determine the characteristic curves of commercially available CWK 13XBFK and NaYBFK is measured via a simultaneous thermal analysis (STA) device used in thermogravimetric analysis (TGA) mode and a coupled humidity generator. The characteristic curves of CWK 13XBFK and NaYBFK are successfully determined for adsorption potentials ΔF between 105 kJ kg-1 ≤ ΔF ≤ 3,495 kJ kg-1 and 106 kJ kg-1 ≤ ΔF ≤ 3,524 kJ kg-1, respectively. In both investigated scenarios of a mobile sorption storage and a industrial tumble dryer, CWK NaYBFK has a slightly higher volumetric water uptake than 13XBFK. In the second step, breakthrough curves are recorded for both zeolites under adsorption and desorption conditions for a mobile sorption storage. The results indicate that the desorption conditions are a better match for CWK NaYBFK while the adsorption conditions are a better match for CWK 13XBFK. In the third step, the experimental breakthrough curves serve to validate a fixed bed simulation that can be used to construct a sorption system for the investigated adsorption and desorption conditions. In the fourth and last step, both zeolites are cycled for 140 cycles between a temperature of 300 °C and dew point temperature of 60°C for desorption and a temperature of 42.5°C and 30 °C for adsorption. These conditions based on the integration of a sorption system into an industrial tumble dryer lead to a decrease of the water adsorption capacity of 36.5% for CWK 13XBFK and 3.3% for CWK NaYBFK.
1 Introduction
Thermal energy storage (TES) based on reversible adsorption and desorption of water vapour on adsorbents promises high energy storage densities (ca. 180 kWh m-3) (Lävemann et al., 2015). Therefore, it comes as no surprise that there has already been some commercial success of (open) adsorption systems as shown by the energy efficient dishwasher developed by Bosch Siemens Hausgeräte together with ZAE Bayern (Hauer and Fischer, 2011). However, Vasta et al. (2018) point out that adsorption thermal energy systems “are still in the early stages of development and are not yet completely commercialized”. In order to increase the commercialisation and to achieve the aforementioned high energy storage densities in actual applications, potential adsorbents have to be screened carefully and analysed on multiple levels.
Hauer (2007) points out that “the evaluation of solid adsorbents in open adsorption systems for heating, cooling and thermal energy storage (TES) applications is crucial for the ecological and economical performance of these systems”. The differential heat of adsorption is thereby identified as the crucial property. The following criteria are established for the evaluation of the adsorbents: breakthrough curves for the dynamics of the process, the possible temperature of the air, the thermal COP and the storage capacity. The differential heat of adsorption is the sum of the heat of evaporation (depending of the temperature) and the binding enthalpy. The latter is calculated using measured adsorption equilibria, which can be obtained through a characteristic curve of an adsorbent. In a later work, Hauer and Fischer (2011) employ this method for the incorporation of an adsorption system in an energy efficient dishwasher. However, only zeolite 13X is evaluated as adsorbent and there is no mention of how the equilibrium adsorption data of 13X was acquired. Additionally, no investigation of the hydrothermal stability of zeolite 13X under the application conditions is mentioned. The authors also do not mention if any simulation of the fixed bed or the whole system has been carried out. Santori et al. (2013) also investigated the feasibility of an adsorption dishwasher. They measure the adsorption isotherms of three adsorbents for different water vapour pressures at the adsorption and desorption temperatures: zeolite 13X, silica gel and a SAPO-34. Similar to Hauer and Fischer (2011), the authors determine the heat of adsorption of the three adsorbents. Additionally, the water uptake between adsorption and desorption is examined. Again, similar to Hauer and Fischer, the theoretical COP for each adsorbent option is determined. On an experimental level, the authors conduct a sensitivity analysis on the system and based on that analysis, an optimized prototype is conceived (Santori et al., 2013). No tests of the hydrothermal stability or simulation of the fixed bed are mentioned. A different approach is taken by El Fil and Garimella (2022) for the integration of an adsorption thermal storage to increase the efficiency of a gas-fired tumble dryer. It is mentioned that silica gel is selected as adsorbent without further analysis on a material level. A heat and mass transfer model of the gas-fired tumble dryer and the adsorbent bed is developed and validated experimentally (El Fil and Garimella, 2022). However, as in the aforementioned references, no hydrothermal stability of the silica gel is performed.
While in the works of Hauer characteristic curves play an important role (2002, 2007, 2011), Laurenz (2021) and Velte-Schäfer et al. (2023) have suggested the approach of the characteristic temperature difference more recently to investigate adsorbents under application conditions. However, both methods require experimental equilibrium data for their respective calculations. The equilibrium data thereby consists of the water uptake at equilibrium for a given set of temperature and dew point temperature (or relative humidity) conditions. If the required data cannot be found in literature, it has to be determined experimentally. Fischer (2018) indicates that volumetric and gravimetric measurements exist to determine the equilibrium data.
Even if one or more adsorbents seem to be a good match for the intended application after the first step, it has to be verified if the adsorbents are stable under the conditions encountered in the intended application. That is why, Hauer (2007) recommends that in the future, research activities should also focus on the adsorbent stability. One aspect of the stability is the hydrothermal stability of adsorbents especially at high temperatures coupled with high humidities during desorption (Hauer, 2007).
The focus in this work is on zeolites since they are commercially available and can also be cost-effective. Hence, zeolites with high water adsorption capacities such as X and Y (Schmit et al., 2024) are interesting in thermal thermal energy storage systems (e.g., Hauer and Fischer, 2011). Zeolites X and Y both have a faujasite structure and the same pore diameter of 0.74 nm (Fischer, 2018) but differ in the Si/Al ratio. According to Lutz (2014), it was originally suggested that the change from X to Y modification occurs at a Si/Al ratio of 1.5 (Breck, 1964). However, Lutz also mentions that a different ratio of 2.2 was more recently proposed (Salman et al., 2006).
In the following, different methods to assess the hydrothermal stability of zeolites are introduced. Storch et al. (2008) investigated the hydrothermal stability of different zeolite 13X samples of around 180 g in automated adsorption/desorption cycles in an open system. The ageing of the samples was thereby tested by measuring the adsorbed water mass at room temperature and a relative humidity of 55% before and after the cycling tests. Fischer and Lävemann (2015) used a different approach to overcome the lengthy procedure of repeated adsorption and desorption cycles. Therefore, a hydrothermal stability test setup was constructed that simultaneously ages 16 samples under 16 different conditions by setting four different temperatures and four different dew point temperatures. With this setup, it is thus possible to conduct the ageing of the samples over a period of only 10 days. With the results from the 16 samples of zeolite 13X powder, Fischer et al. (2018) are able to create a contour graph of the relative water uptake after ageing the samples for 240 h as a function of the temperature and water vapour pressure. One of the findings is that the strongest degradation was detected at the lowest investigated temperature of 200 °C and the highest water vapour pressure of 31.2 kPa, i.e., at the highest water vapour density at the sample. Auer and Rönsch (2022) investigated the ageing of binder-free zeolites 13X and NaY in a self-built test setup. Since the authors were aware of the work of Fischer et al. (2018) conducted on the hydrothermal stability of 13X, the ageing of 13X is tested at temperatures of 200°C and 250°C and a water bath temperature of 80°C. After 25 h at constant conditions, the relative water adsorption capacity for both conditions is around 50% of the water adsorption capacity of untreated 13X. Therefore, the authors do not perform additional tests on 13X (Auer and Rönsch, 2022). The same authors also investigated binder-free NaY at constant temperatures of 200°C and 250°C and a water bath temperature of 80°C. After 50 h at constant conditions, a decrease of the water adsorption capacity of 2.6% and 4.3% is found for the temperatures of 200°C and 250 °C, respectively. In order to increase the ageing effects on NaY, Auer and Rönsch (2022) changed the conditions every 5 min by switching between humidified and dehumidified air in further tests. The fixed bed thereby undergoes partial adsorption and desorption in rapid succession. For this investigation, the temperatures were set to 200°C and 265°C while the water bath temperature was kept at 80°C. For these fluctuating conditions, Auer and Rönsch (2022) find a similar decrease of the water adsorption capacity at 200°C of 2.3% than for the constant conditions. For the 265°C, however, the decrease in the water adsorption capacity is 5.9%, which is slightly higher than the 4.3% found for constant conditions at a lower temperature of 250°C. Auer and Rönsch therefore conclude, “that the fluctuations have no influence on the aging.”
Frazzica and Brancato (2019) present a protocol for the verification of the hydrothermal stability of adsorbent materials for low-temperature materials. They investigated a commercial silico-alumino-phosphate, AQSOA Z02, in a cycle test as well as in shelf tests. The cycle test ran for more than 1,500 cycles between 90°C and 40°C and a water vapour pressure of 7.3 kPa. The shelf test was carried out for 21 days at 90°C and a constant water vapour pressure of 7.3 kPa. In different characterization tests after the ageing procedure, the authors find that the investigated material is stable under the investigated conditions. Thus, no insights could be provided on the differences of both ageing methods. Lutz et al. (2010) used yet another method to test the hydrothermal stability of zeolite SAPO-11. The authors hydrothermally treated the sample in water in PTFE covered steel autoclaves at different temperatures for 72 h. However, in contrast to the previous articles, there was no assessment of the water adsorption capacity before and after the ageing process. The authors characterized the samples by different methods amongst others X-ray powder diffraction (XRD). From literature, it becomes obvious, that there is no standard method to determine the hydrothermal stability of adsorbents.
Sorption thermal energy storages with zeolites are usually constructed as fixed bed reactors (Hauer, 2002). Breakthrough curves describe the temporal evolution of the temperature and the concentration at the exit of the fixed bed reactor and are an important tool for the design and construction of the sorption heat storage (Storch, 2010). However, the experimentally determined breakthrough curves are only valid for the reactor, usually a column, as well as the set temperature and dew point temperature and the mass flow rate. To adapt the results to different column geometries and other parameters, a fixed bed simulation is necessary (Storch, 2010). The fixed bed simulation is validated with the experimentally determined breakthrough curves. The parameters can then be varied to optimise the fixed bed reactor to the actual circumstances in the intended application (Krönauer et al., 2015).
In this work, an application oriented material characterisation and fixed bed simulation is proposed. The method starts with the determination of the necessary equilibrium data to construct characteristic curves of the investigated adsorbents. The characteristic curves than allow to assess the volumetric water uptake under the adsorption and desorption conditions. In the next step, breakthrough curves are recorded. In the third step, the characteristic curves serve as input to a fixed bed simulation that is validated using the experimentally determined breakthrough curves. The fixed bed simulation can then be used to test different application scenarios thus allowing to refine the selection of the optimal adsorbent under the dynamic application conditions. In the fourth and final step of the method, the hydrothermal stability of the selected adsorbents is evaluated. Here, the method is introduced using exemplary application conditions.
2 Materials and methods
2.1 Materials
Two well-known zeolites were selected: 13XBFK and NaYBFK, both from Chemiewerk Bad Köstritz GmbH (CWK). The two zeolites, although pelletised, are so-called “binderless” or “binder-free”, since such materials are composed of 100% active adsorption matter (Schumann et al., 2012). While the 13XBFK beads had a diameter between 2.5 and 3.5 mm, the NaYBFK beads had a diameter between 1.6 and 2.5 mm.
2.2 Characteristic curves
The development of the theory behind the characteristic curve is commonly attributed to Dubinin (1967). It is described in detail in literature (e.g., Hauer, 2002). Here, the focus is on the equations used to calculate the adsorption potential ΔF and the adsorption volume Wads based on the measured equilibrium data via STA. The adsorption potential is defined in Equation 1 (e.g., Hauer, 2002)
where RH2O is the specific gas constant of water vapour. The adsorption potential corresponds to the isothermal change of the free energy between unbound water vapour at saturation pressure “ps” and the adsorbed water vapour at a pressure “p”.
The pore volume filled by the adsorbate is designated as adsorption volume Wads and is calculated from the uptake “Xads” and the density of adsorbed phase “ρads” as indicated in Equation 2:
The density of the adsorbed phase is calculated in this work as suggested by Hauer (2002):
Equation (3) is one of the adsorbate density models that was recently assessed by Lehmann et al. (2017) in the context of numerical simulations of zeolite-based heat storage applications. They recommend the simpler density models by Mugele (2005) and Hauer (2002) due to the low number of parameters needed.
One of the advantages of a characteristic curve is that the volumetric water uptake can be directly read from the curve with temperatures and dew point temperatures available for adsorption and desorption conditions in a potential application. Here, two different scenarios are compared: The original adsorption and desorption conditions for a mobile sorption storage (Lävemann et al., 2015) and the preliminary testing conditions for the incorporation of a sorption storage in an industrial tumble dryer (Schmit et al., 2023). The conditions for both application scenarios are listed in Table 1.
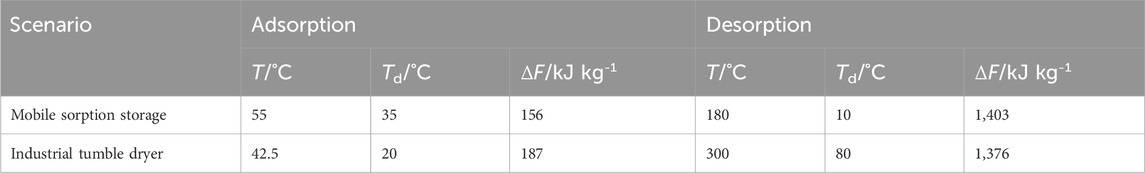
Table 1. Temperatures T, dew point temperatures Td and corresponding adsorption potentials ΔF for the adsorption and desorption of two scenarios, mobile sorption storage (Lävemann et al., 2015) and industrial tumble dryer (Schmit et al., 2023).
2.3 Simultaneous thermal analysis measurements
The measurements to acquire the equilibrium data consisting of a specific water adsorption for a given set of temperature and dew point temperature were carried out with a Simultaneous Thermal Analysis (STA) device from Netzsch, used in TGA mode. The STA 449 F1 Jupiter is equipped with a copper furnace from Netzsch and a humidity generator MHG-32 from proUmid. Additionally, a dew point meter 573HX from MBW was linked to the copper oven in order to calibrate the humidity generator and to provide highly accurate values for the dew point temperatures. MBW Calibration AG (2014) lists an accuracy for the dew point over the calibrated range of ≤ ±0.1°C. In the case of the model 573HX the calibrated range for the dew point is between −50°C and +95°C, and, thus, covers all of the investigated dew point temperatures in this work.
The temperature calibration of the STA was done with seven calibration standards: nitrotoluene, biphenyl, naphthalene, benzoic acid, indium, bismuth and lead. The onset temperatures were determined via c-DTA for multiple heat ranges and extrapolated to a heating rate of 0 K min-1, i.e., at equilibrium. A square calibration curve is then fitted through the differences between known melting temperatures of the calibration standards and the determined onset temperatures. As a consequence, all of the corrected temperature values of the calibration standards lie within ±0.1 K of the correct literature values. Assuming the ±0.1 K as standard measurement uncertainty and a nomal distribution of the values, a combined measurement uncertainty of ±0.2 K is indicated with a 95% confidence interval (Eurachem/Citac Guide CG 4, Ellison and Williams, 2012). This value coincides with the ±0.2°C provided by Praveen and Suresh (2019) for the similar Netzsch STA 449 F3 Jupiter, which, however was calibrated using only the two standards, indium and zinc.
In the data sheet of the Netzsch STA 449 F1 Jupiter, Netzsch indicates a resolution of the balance of 0.025 μg and a balance drift of <2 μg h-1 (Netzsch-Gerätebau GmbH, 2025). However, no other values like the linearity of the balance are indicated, rendering an assessment of the measurement uncertainty of the balance more difficult. Reichmuth et al. (2004) indicate that for electronic analytical balances, the relative uncertainty of weighing data is usually in a range bezween 10–5 to 10–4. In a conservative approach in this work, it is therefore assumed, that all measured weighing data has an uncertainty of ±0.1%, i.e., the upper limit indicated by Reichmuth et al. (2004).
Nitrogen was used as purge gas in all of the measurements. Furthermore, nitrogen was used with the humidity generator to create a water vapour atmosphere with the preset relative humidity.
All of the measurements were carried out in adsorption and desorption on samples of around 300 mg. The dry sample mass was measured for a temperature of 300°C and a relative humidity of close to 0% (the latter corresponding to dew point temperatures below −40°C). In the measurements, the sample temperatures were varied between 50°C and 300°C and the dew point temperatures between 20°C and 36.7°C (the latter corresponding to 50% relative humidity at 50°C, the standard settings used with the hydrothermal stability test setup to measure the water uptakes before and after the stability tests (Fischer et al., 2018)). The evolution of the temperature, the dew point temperature and the TG (Thermogravimetric) signal during the STA measurements in adsorption and desorption for CWK 13XBFK can be found in the supplementary material in Supplementary Figure S1–S4. The data for CWK NaYBFK is similar and, thus, is not shown in the supplementary material. The fit from Equation 4, proposed by Fischer (2018), was used to obtain the characteristic curves.
2.4 Breakthrough curves
The recording of breakthrough curves of sorbent fixed beds was conducted with the setup shown as simplified schematic in Figure 1.
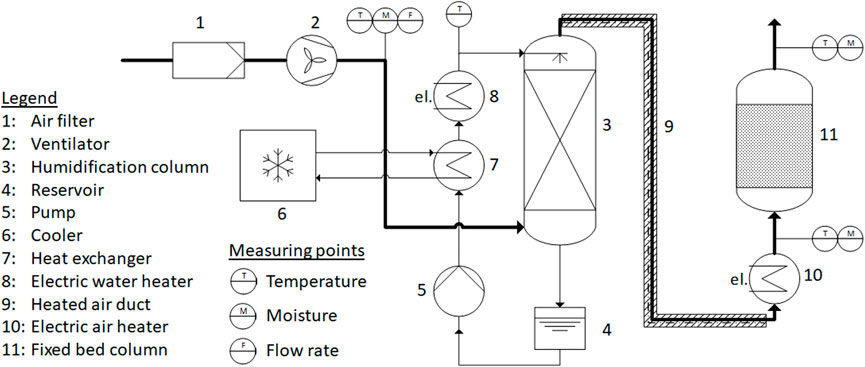
Figure 1. Simplified schematic of the setup to determine the breakthrough curves.
Ambient air is blown into the open circuit at a controlled volume flow rate. In a humidification column, the air is brought into contact with a countercurrent water flow. The design of the column and the water flow rate allow the air temperature and dew point temperature to almost reach the water inlet temperature. Therefore, the water content of the air flow can be controlled via the water temperature. By cooling the water with an external cooler, the dew point temperature of the air can also be reduced below the ambient air temperature. The power of the water heater of 13.5 kW makes it possible to increase the dew point of air with a volume flow rate of 30 m3 h-1 from 10 °C up to 80 °C, for example,. An open electric heater heats the air flow to the set bed inlet temperature. With a heating power of 4.4 kW, the air flow can be heated up to 350 °C. The light construction of the heater thereby allows quick changes in the air temperature. To prevent condensation und thus changes in the water content, the air duct between the humidification column and the air heater is well insulated and temperature-controlled with trace heating.
The airflow leaves the heater section vertically upwards. The sorbent fixed bed is placed directly above to keep heat loss to a minimum. The air temperature and dew point temperature are continuously measured and recorded immediately before and after the fixed bed. To obtain representative data points, the air is homogenised in static mixers installed in the air ducts. After short settling sections, small fractions of the air stream are diverted to two MBW 573HX dew point mirrors. The air temperatures are measured with Pt100 sensors. In addition, several type K thermocouples are installed approximately 10 mm below the surface of the fixed bed.
For the breakthrough curves presented in this work, zeolite pellets where filled in a column to form a fixed bed. The column has an inner diameter of 148 mm and can be filled up to a height of 300 mm. The maximum bed volume is therefore about 5.7 L. A CAD design drawing and a picture of the actual column are shown in Figure 2. The column and its lid are double-walled and the spaces between the walls are filled with perlite. Evacuation of these perlite beds creates a vacuum super insulation. This way, heat losses from the zeolite bed to the environment and temperature gradients in the bed cross-section are minimised.
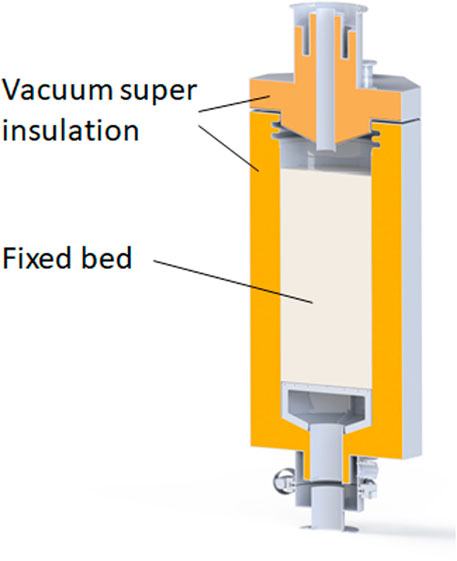
Figure 2. left: CAD design drawing of the column; right: actual picture of the finished column.
For the measurements on each, CWK 13XBFK and NaYBFK, a fixed bed with a height of 300 mm was filled into the column. Breakthrough curves were recorded for both zeolites for the conditions of the mobile sorption storage listed in Table 1. As set point for the volume flow rate of the unconditioned air 5 m3 h-1 were chosen. This value was estimated from the parameters indicated by Lävemann et al. (2015).
Before each desorption and adsorption run, the water in the humidification column was preconditioned to the respective dew point temperature set point values. Then the blower and the air heater were started. Due to dynamics in the humidification process, the inlet dew point temperature was slightly offset compared to the set point values and reached 11.7 °C for desorption and 34.5 °C for adsorption runs in the steady state.
All desorption and adsorption runs took between 8 and 9 h each. After reaching steady state conditions of the outlet temperature and dew point temperature, the runs were continued for several hours to achieve defined and reproducible conditions inside the fixed bed. For each zeolite two sets of adsorption and desorption were carried out. The first run was used to precondition the column for the defined starting conditions. Only the second run was used for evaluation.
2.5 Fixed bed simulation
In the fixed bed simulation, the distribution of the concentration and the temperature in a flowed fixed bed are simulated based on a mathematical model. The latter describes the heat and mass transfers between the sorbent and the fluid. The governing partial differential equations that describe the system are based on the mass and energy balances in an infinitesimal volume element (Storch, 2010). The derivation of the equations is described in detail by Storch (2010). Here, only the resulting partial differential equations are indicated.
First, the water mass balance in the carrier gas is considered. The temporal change of the water mass in the balance sheet volume is composed of the water mass flowing in and out of the volume as well as the water mass that is exchanged with the sorbent. The carrier gas is assumed to be constant, i.e., ṁg = constant for all times t and at all locations x of the fixed bed. Additionally, all terms that contain a time derivative of the gas density are neglected. The temporal change in the volume fraction of the carrier gas is given by Equation 5:
where εg is the share of the carrier gas in the balance volume, ρg is the density of the carrier gas, Xg is the water uptake of the carrier gas, ṁad is the mass flow rate from the gas phase to the sorbent, ṁg is the mass flow rate of the carrier gas. ṁad itself is described by Equation 6:
where βsg is the mass transfer coefficient and Xg,eq is the humidity ratio of gas in equilibrium with the sorbent. Only a mass transfer resistance of the gas boundary layer around the pellets is taken into account. The diffusion of water within the pellet is accounted for by a reduced mass transfer coefficient. This simplification causes a slight model error. The same assumption is also made later on for the heat transfer. There, the pellet is treated as isothermal, which should be a good approximation for typical pellets with a diameter around 2 mm.
The temporal change of the water mass in the sorbent is obtained analogously to that of the carrier gas. The difference is that the water mass in the sorbent can only change due to a transition of water to or from the carrier gas. The corresponding equation is described by Equation 7:
where εs is the share of the sorbent in the balance volume, ρs is the density of the sorbent, Xs is the water uptake of the sorbent.
The energy balance of the gas phase is influenced by two factors: In addition to the convective heat transport in the flowing gas phase there is the heat transfer between the gas phase and the sorbent. Heat transport through heat conduction/diffusion in the gas is neglected compared to convection. The corresponding equation is described by Equation 8:
where c*p,g is the effective specific heat capacity of the gas phase that depends on the water uptake, Tg is the temperature of the gas phase, αsg is the heat transfer coefficient, as is the specific surface of the sorbent, Ts is the temperature of the sorbent.
The energy balance of the sorbent is based on the heat exchange with the gas phase. Additionally, the adsorption enthalpy has to be considered. This leads to the Equation 9:
where c*p,s is the effective specific heat capacity of the sorbent and h*ad is the differential adsorption enthalpy.
The above four partial differential equations are the mathematical foundation of a one dimensional simulation that is run in Matlab using a solver. The spatial resolution for a column length of 30 cm is between 0.25 and 0.5 cm, i.e. 60 to 120 segments are considered. The temporal resolution is between 1 and 2 min, i.e., for a run time of 20 h, 600 to 1,200 time steps are considered.
To match the conditions of the experimental breakthrough curves, a temperature of 180 °C and a dew point temperature of 11.7 °C were set for desorption while a temperature of 55.1 °C and a dew point temperature of 34.5 °C were set for adsorption. The length of the fixed bed is 300 mm and the volume flow rate of the dry air is fixed to 5 m3 h-1. With a bead diameter of 2.4 mm for CWK 13XBFK and 2.1 mm for CWK NaYBFK the resulting masses are 3.383 kg and 3.424 kg, respectively.
2.6 Cycling stability
In order to assess the cycling stability of solid sorbents under application conditions, a cycling device was constructed and built at ZAE Bayern. Similar to the setup used to measure breakthrough curves, it consists of an air circuit with a humidifier and a suitable air heater to set the intended test conditions. The insulated column containing the eight sample containers is shown in Figure 3. The dry sample masses typically range from around 50 g–90 g.
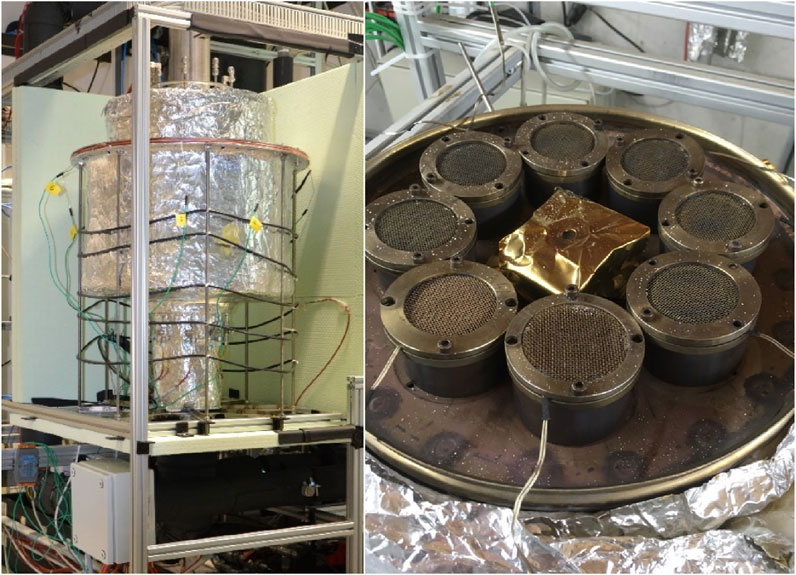
Figure 3. View of the insulated column of the cycling device containing eight sample containers.
It was previously shown that the incorporation of an open adsorption system into a commercial dishwasher profits from comparatively high dew point temperatures during desorption (Hauer and Fischer, 2011). The same holds true for the intended incorporation of an open adsorption system into an industrial tumble dryer (Schmit et al., 2023). The comparatively high dew point temperatures during the desorption cycle allow to use the condensation energy in the process (Hauer and Fischer, 2011). Therefore, it was decided to set the desorption conditions to 300°C and a reduced dew point temperature of 60°C, which are at the upper limit of technical feasibility of the cycling device. The adsorption conditions were a temperature of 42.5 °C and a dew point temperature of 30°C, which are representative temperatures in typical applications. These conditions correspond to those listed for the industrial tumble dryer scenario in Table 1. The cycling stability of both zeolites under the conditions for the mobile sorption storage were not tested in this work. The desorption conditions are less challenging for the zeolites and Buhl et al. (2004) have previously shown that there is no loss in water uptake for a zeolite 13X sample treated hydrothermally at 200 °C.
A whole cycle consisting of desorption and adsorption takes around 2 hours. 140 cycles were carried out on both zeolites, CWK 13XBFK and CWK NaYBFK. The ageing of the samples was regularly checked by running reference cycles. Therefore, a reference desorption with a temperature of 300 °C and a dew point temperature of 12 °C was performed for around 16 h. The reference adsorption takes place at a temperature of 40 °C and a dew point temperature of 24.8°C. After each reference adsorption and reference desorption run, the sample containers are removed from the cycling device, covered with lids, and weighted manually after cooling at room temperature.
3 Results and discussion
3.1 Characteristic curves
The equilibrium data for both CWK 13XBFK and NaYBFK was acquired with the STA. Based on that data, the adsorptions volumes Wads and adsorption potentials ΔF were calculated for both zeolites. The corresponding representation of Wads in function of ΔF in adsorption (blue squares) and desorption (red squares) are shown in Figure 4. The combined measurements uncertainties for ΔF and Wads are not visible in Figure 4 since they are relatively small compared to the large scale of the graph. For ΔF, the combined measurement uncertainties range between 3 kJ kg-1 for the lowest values of 104 and 105 kJ kg-1 and 8 kJ kg-1 for the highest values of 3,496 and 3,597 kJ kg-1. For Wads, the combined measurement uncertainties are around 0.001 cm3 g-1. All of the values for the combined measurement uncertainties for ΔF and Wads for CWK 13XBFK measured in adsorption and desorption are listed in Supplementary Table S1 in the Supplementary material.
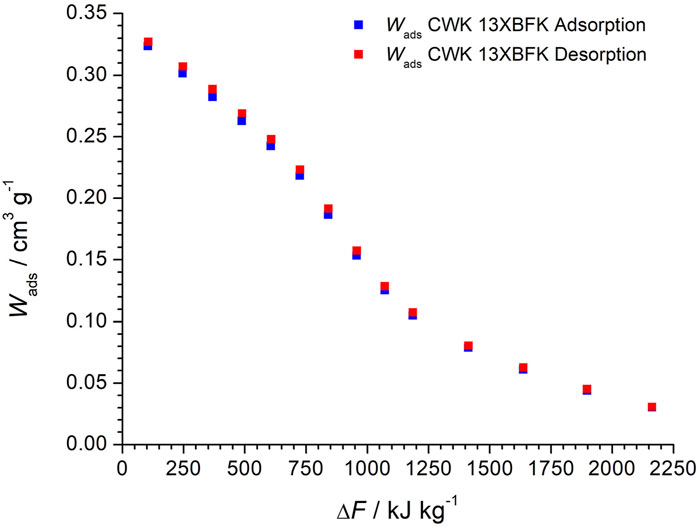
Figure 4. Adsorption volumes Wads of CWK 13XBFK in function of the adsorption potential ΔF determined in adsorption (blue squares) and desorption (red squares) via STA measurements.
From Figure 4 it can be seen, that Wads for adsorption and desorption coincide for the four highest values of ΔF. For the other values of Wads, there are only minimal differences between Wads measured in adsorption and desorption. Therefore, it can be stated, that there is virtually no hysteresis in the equilibrium measurements of CWK 13XBFK. This means that equilibrium conditions were reached throughout the measurements. That is why, in the following, only the resulting characteristic curve for the desorption case is compared to existing characteristic curves from literature.
The comparison of the characteristic curve of CWK 13XBFK based on the desorption measurements with the STA with existing characteristic curves from literature is shown in Figure 5.
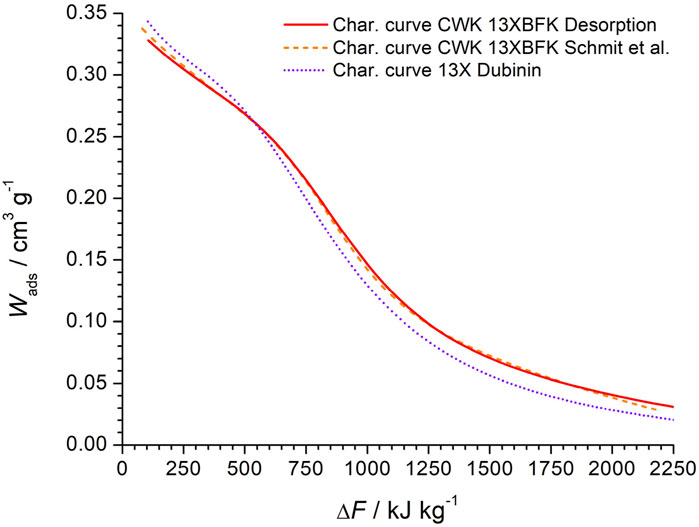
Figure 5. Comparison of the characteristic curve of CWK 13XBFK determined in desorption via STA measurements (red curve) with the characteristic curve of the same material (orange dashed line) from Schmit et al. (2024) and the characteristic curve of 13X (dotted purple line) from Dubinin (1967) and Fischer (2018).
The comparison of the characteristic curves in Figure 5 shows that the agreement between the characteristic curve determined for CWK 13XBFK based on the STA measurements (red line) and the characteristic curve of the same material (dashed orange line) from Schmit et al. (2024) is very high. The agreement with the characteristic curve of 13X powder (dotted purple line) from Dubinin (1967) and Fischer (2018) is good. Schumann et al. (2012) showed that the adsorption capacity of binderless 13XBFK zeolite is close to that of 13X powder with the same molar SiO2/Al2O3 ratio. However, the SiO2/Al2O3 ratio of 13XBFK is in the range of 2.2–2.45 (Schumann et al., 2012) while that of Dubinin (1967) is 2.96. The differences in the SiO2/Al2O3 ratio explain the differences of the characteristic curves in Figure 5.
The characteristic curve of CWK 13XBFK obtained via desorption with the STA is valid for an adsorption potential between 105 kJ kg-1 ≤ ΔF ≤ 3,495 kJ kg-1. The parameters with four significant digits, used to construct the characteristic curve of CWK 13XBFK in Figure 5, are listed in Table 2.
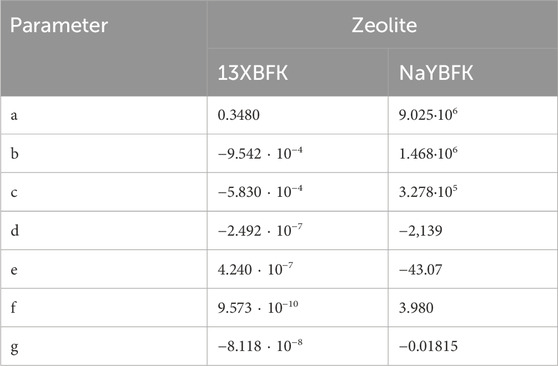
Table 2. Parameters with four significant digits for Equation 4 to obtain the characteristic curves of CWK 13XBFK and NaYBFK.
The adsorption volumes Wads in function of the adsorption potential ΔF of CWK NaYBFK measured in adsorption (blue circles) and desorption (red circles) via STA are shown in Figure 6. Again, the combined measurements uncertainties for ΔF and Wads are not visible in Figure 6 since they are relatively small compared to the large scale of the graph. For ΔF, the combined measurement uncertainties range between 3 kJ kg-1 for the lowest values of 104 and 106 kJ kg-1 and 8 kJ kg-1 for the highest values of 3,524 and 3,637 kJ kg-1. For Wads, the combined measurement uncertainties are around 0.001 cm3 g-1. All of the values for the combined measurement uncertainties for ΔF and Wads for CWK NaYBFK measured in adsorption and desorption are listed in Table S 2 in the Supplementary material.
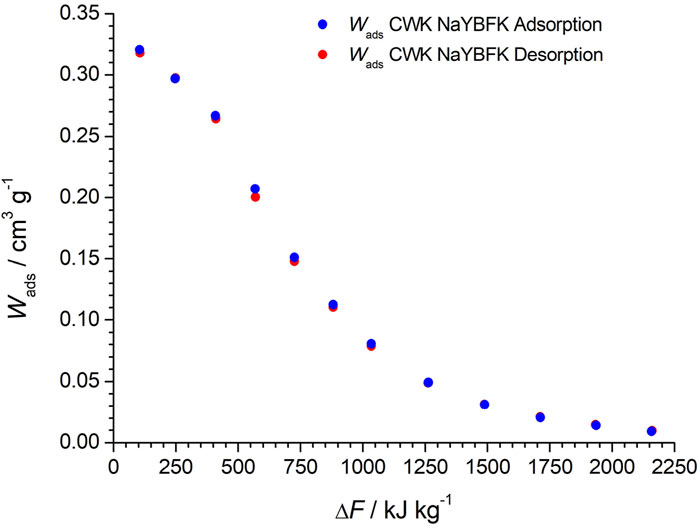
Figure 6. Adsorption volumes Wads of CWK NaYBFK in function of the adsorption potential ΔF determined in adsorption (blue circles) and desorption (red circles) via STA measurements.
From Figure 6 it can be seen that Wads measured in adsorption and desorption for CWK NaYBFK coincide for all but one point, which is around the steepest part of the characteristic curve. As in the case of CWK 13XBFK it can be stated, that there is virtually no hysteresis between adsorption and desorption for NaYBFK. This indicates that equilibrium was reached during the measurements. Therefore, only the characteristic curve based on the equilibrium data in desorption is shown in the following comparison.
The comparison of three characteristic curves of the same material CWK NaYBFK is shown in Figure 7.
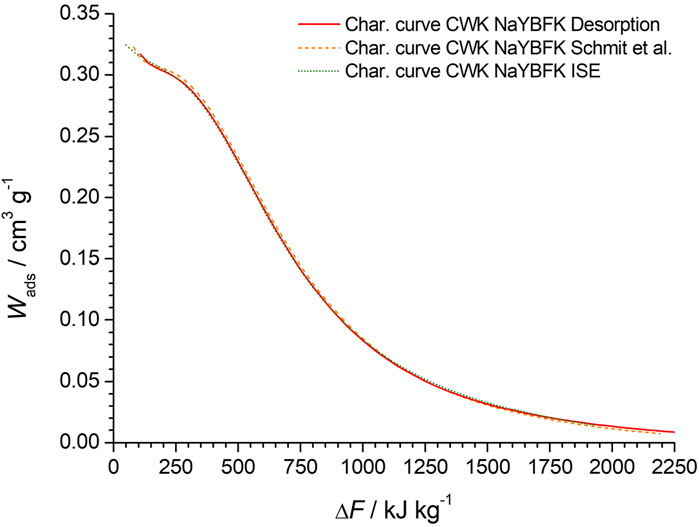
Figure 7. Comparison of the characteristic curve of CWK NaYBFK determined in desorption via STA measurements (red curve) with the characteristic curves of the same material from Schmit et al. (2024) (dashed orange line) and the Fraunhofer ISE (dotted green line) (Schmit et al., 2024).
The characteristic curve obtained from STA measurements in desorption is represented by the red curve in Figure 7. The agreement with the characteristic curve of the same material (dashed orange line) from Schmit et al. (2024) is very high. The same can be said for the agreement with the characteristic curve of the same material based on equilibrium data from the Fraunhofer ISE (Schmit et al., 2024).
From the above comparisons of the characteristic curves of CWK 13XBFK and NaYBFK with existing ones from literature, it can be stated that the equilibrium data of water adsorption on zeolites can be reliably measured with the STA. Furthermore, compared to the measurements with the hydrothermal test setup described by Schmit et al. (2024), the required sample mass is considerably lower, i.e., around 300 mg compared to nearly 50 g.
The characteristic curve of CWK NaYBFK obtained via desorption with the STA is valid for an adsorption potential between 106 kJ kg-1 ≤ ΔF ≤ 3,524 kJ kg-1. The parameters with four significant digits, used to construct the characteristic curve of CWK NaYBFK in Figure 7, are listed in Table 2.
With the adsorption and desorption conditions for the application scenarios listed in Table 1 and the characteristic curves for both zeolites, the volumetric water uptakes ΔWads can be determined. Thus, the maximum water turnover on a material level can be calculated for both scenarios. The results are listed in Table 3.
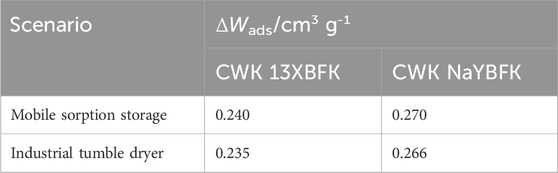
Table 3. Volumetric water uptakes ΔWads for CWK 13XBFK and NaYBFK for two different scenarios.
Based on the results listed in Table 3, it can be stated that CWK NaYBFK has a slight advantage in terms of volumetric water uptake over CWK 13XBFK in both scenarios. This advantage of CWK NaYBFK mainly originates from the evolution of the characteristic curve, which provides low volumetric water uptake for the desorption conditions, i.e. 0.038 cm3 g-1 and 0.040 cm3 g-1 for the mobile sorption storage and the industrial tumble dryer, respectively, compared to 13XBFK (0.079 cm3 g-1 and 0.082 cm3 g-1 for the mobile sorption storage and the industrial tumble dryer). However, for the adsorption conditions, the volumetric water uptakes for both zeolites are comparable. It remains to be seen, if the advantage of CWK NaYBFK persists in the actual applications. Additionally, the heats of adsorption of both zeolites could be calculated based on the characteristic curves as mentioned by Hauer (2007). For the determination of a COP, the specific heats of the dried zeolites would be additionally needed, as shown by Hauer and Fischer (2011) and Santori et al. (2013). Last but not least, the economics of both zeolites play a major role in the decision making process.
3.2 Breakthrough curves
The breakthrough curves for CWK 13XBFK and NaYBFK were recorded with the self-built setup for the adsorption and desorption conditions of the mobile sorption storage as indicated in Table 1. Figure 8 shows the acquired desorption breakthrough curves for CWK 13XBFK.

Figure 8. Desorption breakthrough curves for CWK 13XBFK: the inlet temperature Tin is indicated by a solid red line; the outlet temperature Tout is indicated by a dotted red line; the inlet dew point temperature Td,in is indicated by a solid blue line; the outlet dew point temperature Td,out is indicated by a dotted blue line; the simulated outlet temperature Tsim,out is indicated by a dashed bold red line; the simulated outlet dew point temperature Td,sim,out is indicated by a dashed blue line.
The measured outlet temperature starts at about 53°C and stays relatively constant for about 2.5 h. Then the breakthrough begins and the temperature rises with a slightly decreasing rate. At 6.2 h and 120°C, the rise becomes much steeper again. After 9 h the outlet temperature reaches a steady state temperature of 170 °C. Due to thermal losses, the 180°C are not reached. The outlet dew point temperature starts at 34°C, corresponding to the inlet dew point temperature of the previous conditioning adsorption. It begins to decrease at about 2.5 h, shows a bend to a steeper slope after around 6 h and reaches a steady state after 9 h.
The adsorption breakthrough curves for CWK 13XBFK are shown in Figure 9.
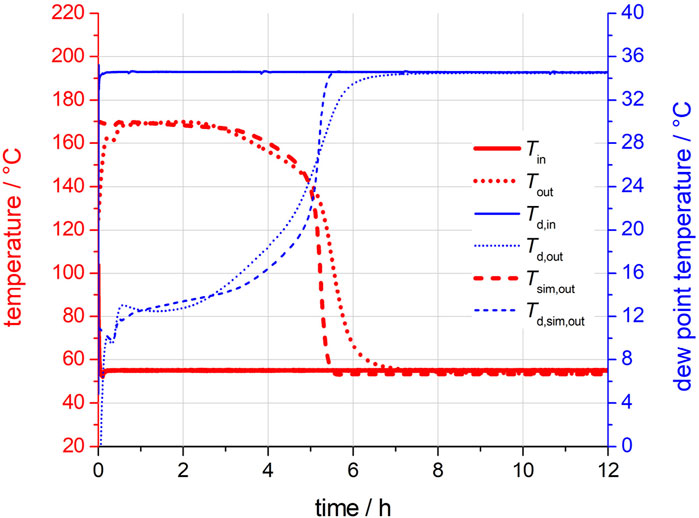
Figure 9. Adsorption breakthrough curves for CWK 13XBFK: the inlet temperature Tin is indicated by a solid red line; the outlet temperature Tout is indicated by a dotted red line; the inlet dew point temperature Td,in is indicated by a solid blue line; the outlet dew point temperature Td,out is indicated by a dotted blue line; the simulated outlet temperature Tsim,out is indicated by a dashed bold red line; the simulated outlet dew point temperature Td,sim,out is indicated by a dashed blue line.
Similar to the desorption run, the measured outlet temperature first stays at a starting plateau, here around 170°C for about 2.5 h. At that point a rather slow temperature decrease starts. At 5 h the temperature falls below 140°C and begins to drop rapidly. One hour later, it reaches already 66°C and at about 8 h it reaches a steady state corresponding to the inlet temperature. At the beginning of the adsorption, the outlet dew point temperature shows a transient phase, around 12.5°C, rather than a plateau. The rising phase shows a slight bend to a steeper slope at around 4.5 h. The outlet dew point temperature settles at the inlet dew point temperature after around 8 h.
From Figure 9 it becomes apparent, that both, the outlet temperature and the outlet dew point exhibit a transient behaviour in the first hour. This results primarily from the transient behaviour of the input variables, in particular the undershoot of the inlet temperature, at the beginning of the adsorption process. In addition, during this period the temperature and water content of the zeolite changes from the initial state (to an operating state resulting from the operating parameters). This process also contributes to a transient behaviour of the outlet variables.
In Figure 10 the desorption breakthrough curves for CWK NaYBFK are shown.
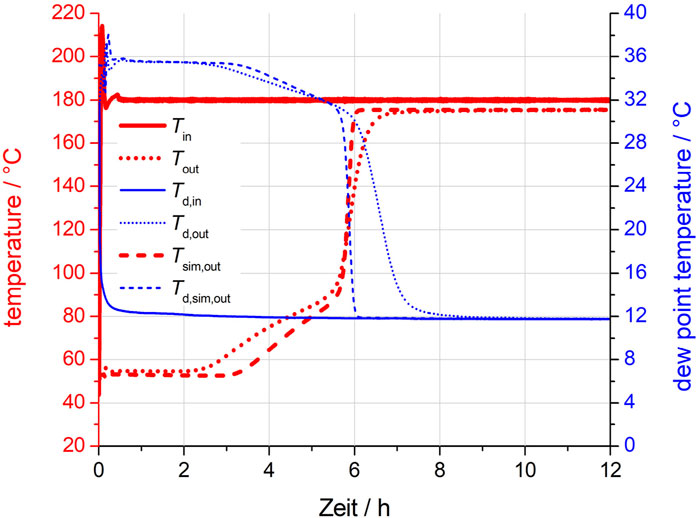
Figure 10. Desorption breakthrough curves for CWK NaYBFK: the inlet temperature Tin is indicated by a solid red line; the outlet temperature Tout is indicated by a dotted red line; the inlet dew point temperature Td,in is indicated by a solid blue line; the outlet dew point temperature Td,out is indicated by a dotted blue line; the simulated outlet temperature Tsim,out is indicated by a dashed bold red line; the simulated outlet dew point temperature Td,sim,out is indicated by a dashed blue line.
Again, the outlet temperature forms a starting plateau, here at 53°C. The first phase of the breakthrough curve shows only a moderate increase rate, leading to about 90°C at 5.6 h. At that point, the temperature begins to rise rapidly and already exceeds 170°C at 6.5 h. At about 8 h it reaches steady state at 175.5 °C. Again, thermal losses prevent the temperature from reaching 180°C. The outlet dew point temperature forms the initial plateau at 35.5 °C. Again, the breakthrough curve starts at 2.5 h and shows a moderately and a rapidly declining section. The transition between these parts occurs at about 6 h and 30°C. A steady state is reached around the inlet dew point temperature at about 9 h.
Figure 11 shows the adsorption breakthrough curves for CWK NaYBFK.
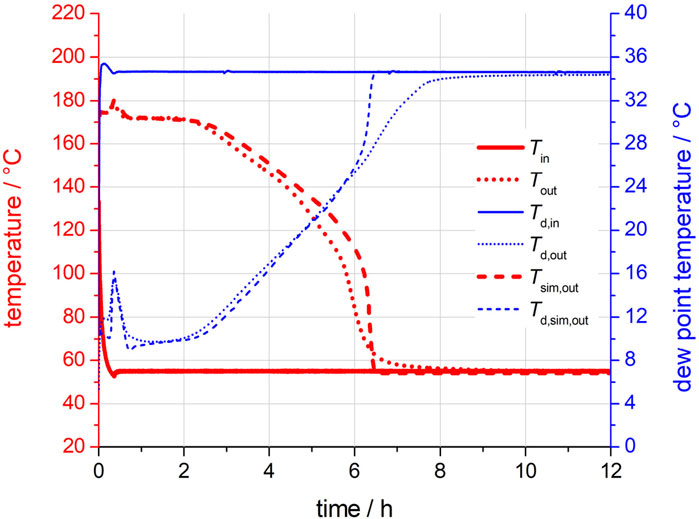
Figure 11. Breakthrough curves for CWK NaYBFK for adsorption: the inlet temperature Tin is indicated by a solid bold red line; the outlet temperature Tout is indicated by a dotted red line; the inlet dew point temperature Td,in is indicated by a solid blue line; the outlet dew point temperature Td,out is indicated by a dotted blue line; the simulated outlet temperature Tsim,out is indicated by a dashed bold red line; the simulated outlet dew point temperature Td,sim,out is indicated by a dashed blue line.
The measured outlet temperature forms a starting plateau of around 172 °C. As in adsorption with CWK 13XBFK, the two output variables also show significant peaks within the first hour for CWK NaYBFK in Figure 9. The peaks are much more pronounced than in the CWK 13XBFK measurement. This is mainly due to the increased undershoot of the inlet temperature and overshoot in the inlet dew point temperature. After the start of the breakthrough, the temperature decreases continuously with a bend to a faster decrease at 5.5 h. It reaches steady state at the inlet temperature at 9.5 h. The output dew point temperature also shows a peak going up to 16°C at the beginning of the run. The starting plateau lies at around 9.7°C and ends after 2.5 h. The dew point temperature increase is almost linear and shows only a very slight bend at 6.4 h. It reaches a steady state at 9.5 h about 0.2 K below the inlet dew point.
As in adsorption with CWK 13XBFK, the two output variables also show significant peaks within the first hour for CWK NaYBFK in Figure 9. The peaks are much more pronounced than in the CWK 13XBFK measurement. This is mainly due to the increased undershoot of the inlet temperature and overshoot in the inlet dew point temperature.
The comparison of the obtained breakthrough curves for the two zeolites shows some major differences. The desorption curves for CWK NaYBFK appear much sharper than those for CWK 13XBFK. In contrast to that, the adsorption temperature curve for CWK NaYBFK contains a long slope phase while the curve for CWK 13XBFK shows a rather rapid change from the plateau phase to the final steady state. Thereby, Hauer (2002) indicates that breakthrough curves with a sharp evolution and pronounced plateaus are generally better suited for applications. Therefore, neither of the investigated zeolites here has an advantage over the other one, since the breakthrough curves of CWK NaYBFK are sharper during desorption and the ones of CWK 13XBFK are sharper during adsorption. It must be considered whether a less sharp curve for adsorption or desorption can be accepted in the application.
Both desorption temperature breakthrough curves show a considerable deviation of the final steady state temperature from the inlet temperature. This indicates that non-negligible heat losses from inside the column to the ambient occur at higher temperature. During preliminary tests, a small leakage in the insulation of the column lid was detected. As a countermeasure, a vacuum pump was connected to the insulation and operated during the experiments. However, the pressure in the lid insulation could not be reduced to the value reached in the column shell. Reworking the cover would significantly improve the insulation and considerably reduce the difference between the inlet and outlet temperatures at high temperatures.
3.3 Simulation results
The measured inlet temperatures and dew point temperatures shown in Figures 8–11 were used to validate the numerical simulation of the breakthrough curves of CWK 13XBFK and NaYBFK. Furthermore, the numerical model was adapted to account for heat losses, so that the final steady state temperatures match the measured values.
In addition to the experimental results, the corresponding simulation results for the outlet temperature and dew point temperature are plotted in Figures 8–11. All simulated breakthrough curves show the same characteristics as their experimental counterparts. Temperature levels and time durations match very well. However, the transition behaviour differs somewhat. In general, transitions between different phases of the breakthrough curves are much sharper in the curves obtained from the simulation. For example, the end of the initial outlet temperature plateau for the desorption of CWK 13XBFK, shown in Figure 8, lies at about 2.5 h for the measured data and 3.5 h for the simulation results. The subsequent temperature rise is considerably steeper for the simulation results than for the measurement and ends abruptly at 6.6 h. The measured curve shows a more asymptotic behaviour and reaches steady state only at about 9 h. These deviations can be observed accordingly for the outlet dew point temperature.
The simulation results for the adsorption process of both CWK 13XBFK and NaYBFK reproduces the transient behaviour in the first hour of the experimental curves (cf. Figures 9, 11). Even the large peak of the dew point temperature in Figure 11 appears in almost the same form in the simulation and the experimental results. This indicates that this behaviour does not represent a measurement error, but a reproducible start-up behaviour.
The deviations in the transient behaviour can be attributed to multiple factors. First of all, the calculation model is simplified and there is some maldistribution of the airflow within the fixed bed. The maldistribution could be reduced by a longer fixed bed. Additionally, there are inhomogeneities due to heat losses and to thermal capacitances that are not covered by the numerical model. It should be noted that the boundary effects in the experimental setup and thus the deviations between simulation and experiment would be significantly greater if the dimensions of the column were smaller or if less effort had been made to thermally insulate the fixed bed. Conversely, increasing the diameter of the fixed bed and further improving the insulation should lead to even better agreement between simulation and experiment.
All in all, it can be concluded that with the validation through the experimental breakthrough curves, the fixed bed simulation can be used for the construction of a sorption system in an application with the presented desorption and adsorption conditions.
3.4 Cycling stability
The results obtained for the cycling stability of CWK 13XBFK and NaYBFK are visualised in Figure 12.
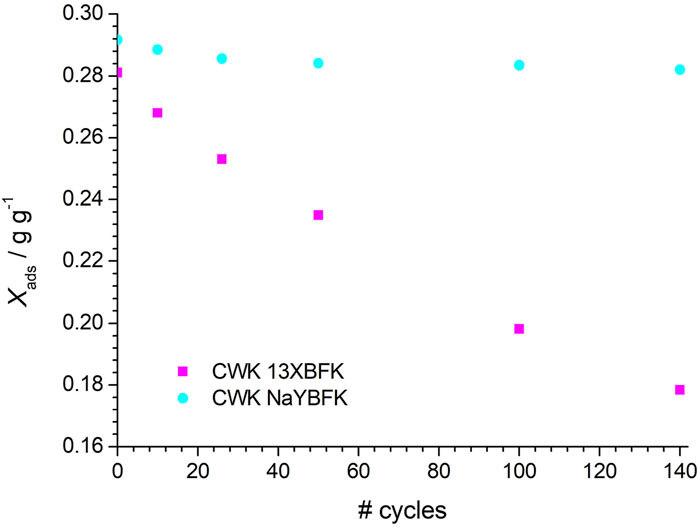
Figure 12. Trend of the absorbed water mass Xads for the reference adsorption of CWK 13XBFK (magenta squares) and CWK NaYBFK (cyan circles) in function of the number of cycles (# cycles).
For 13XBFK, an initially adsorbed water mass of 0.281 g g-1 (with regard to the dry mass of the zeolite) was determined. Already after 10 cycles, the adsorbed water mass decreased by 4.6%. With increasing number of cycles, a steady decrease in the adsorbed water mass can be seen in Figure 12. After cycle 140, the decrease was 36.5%. This result comes as no surprise, since it was shown by Fischer et al. (2018) that zeolite 13X powder suffers a reduction of nearly 50% of its water uptake after being kept at a temperature of 300 °C and a water vapour pressure of 19.9 kPa (corresponding to 60°C dew point temperature) for 240 h. Auer and Rönsch (2022) found a similar decrease of around 50% of the water adsorption capacity for binderless CWK 13X after 25 h at 250°C and a water bath temperature of 80°C (it is assumed, that the water bath temperature in their work represents the dew point temperature).
The second zeolite, CWK NaYBFK has an initial adsorbed water mass of 0.292 g g-1. After ten cycles, the adsorbed water mass decreased by 1.1%. The trend of the adsorbed water mass with the number of cycles in Figure 12 shows a decrease up to cycle 140. After 140 cycles, the decrease is 3.3% and thus considerably lower than in the case of CWK 13XBFK. Additionally, the slope of the decrease in the adsorbed water mass decreases with increasing number of cycles. Therefore, it remains to be seen, if after further cycles, the decrease stabilises itself, meaning that the ageing of NaYBFK has slowed down considerably. At this point it can be assumed that the material will remain usable for a long time. Auer and Rönsch (2022) found a decrease of 4.3% of the water adsorption capacity for binderless CWK NaY after 50 h at a lower temperature of 250 °C and a water bath temperature of 80°C. This underlines that CWK NaYBFK shows a higher hydrothermal stability than 13XBFK under the investigated conditions.
It has to be noted that for different conditions encountered in other applications, i.e., lower or higher temperature and/or dew point temperature, the hydrothermal stability of both zeolites has to investigated under the specific application conditions.
3.5 Discussion of the methodology
So far, the results for the different steps of the methodology have been shown and discussed. In the following, the methodology is discussed. In order to successfully built thermal energy storages based on the reversible adsorption and desorption of water vapour on adsorbents, an application oriented material characterisation and simulation for adsorption thermal energy storage is needed. An investigation at a material level using different techniques and the recording of breakthrough curves was already carried out, e.g., by Hauer and Fischer (2011) and Santori et al. (2013). The novelty of the method proposed here is twofold: Besides a fixed bed simulation that allows an improved integration of a sorption system into the application, hydrothermal stability tests are carried out. While some modelling has been carried out by other authors, e.g., El Fil and Garimella (2022), no similar publications were found that also incorporate the hydrothermal stability in the methodology to design a sorption system for an application. However, this step was recommended by Hauer as early as 2007. It is important to investigate the hydrothermal stability as the fourth and last step, since it is only after the fixed bed simulation, that the adsorption and desorption conditions are finalised. The investigation of the hydrothermal stability is a crucial part since it is only then, that the energy storage capacity of the sorption system can be assured over its lifetime. It is therefore recommended to perform this step, ideally with the projected number of adsorption and desorption cycles of the lifetime of the application.
While the experimental investigation in this work is very thorough and leads to a large dataset of the studied adsorbents, it is quite time-consuming and requires up to three different test setups or measurement devices. This fact is definetly a disadvantage of the presented methodology and could put off scientists from using it. It is, however, viewed as necessary in the design process of a sorption system for an application and therefore highly recommended.
4 Conclusion
In this work, application oriented material characterisation and simulation was demonstrated in several steps with two zeolites, the commercially available CWK 13XBFK and NaYBFK. In the design of adsorption thermal energy storages, an application oriented material characterisation and simulation is necessary to choose an adsorbent that is a good match for the application conditions. Therfore, a method consisting of four steps is proposed. The first step consisted in experimentally determining the equilibrium data consisting of water uptakes for given sets of temperature and dew point temperature. The goal is to determine the characteristic curves of both zeolites if the data is not available in literature. The equilibrium data is acquired via a simultaneous thermal analysis (STA) device used in thermogravimetric analysis (TGA) mode coupled with a humidity generator. The characteristic curves of CWK 13XBFK and NaYBFK were successfully determined for adsorption potentials ΔF between 105 kJ kg-1 ≤ ΔF ≤ 3,495 kJ kg-1 and 106 kJ kg-1 ≤ ΔF ≤ 3,524 kJ kg-1, respectively. For both zeolites, there is a high agreement with available characteristic curves from literature. Based on adsorption and desorption conditions from potential applications, the water uptakes of the zeolites are compared. For a mobile sorption storage application desorption is at a temperature of 180°C and a dew point temperature of 10°C and adsorption at a temperature of 55 °C and dew point temperature of 35°C. For these conditions, CWK NaYBFK achieves a volumetric water uptake of 0.27 cm3 g-1 while CWK 13XBFK achieves one of 0.24 cm3 g-1. The conditions based on an industrial tumble dryer are: desorption at a temperature of 300 °C and a dew point temperature of 80 °C and adsorption at a temperature of 42.5 °C and a dew point temperature of 30°C. For these conditions, CWK NaYBFK achieves a volumetric water uptake of 0.266 cm3 g-1 while CWK 13XBFK achieves one of 0.235 cm3 g-1. NaYBFK has a lower volumetric water uptake at the desorption conditions and a similar one at the adsorption conditions for both scenarios compared to CWK 13XBFK. This leads to an overall higher volumetric water uptake of NaYBFK compared to 13XBFK.
Breakthrough curves were successfully determined with a new vacuum super insulated column for the conditions of the mobile sorption storage for both zeolites. For the investigated conditions, the evolution of the breakthrough curves of CWK 13XBFK would be better suited in the adsorption cycle, while the evolution of the breakthrough curves of CWK NaYBFK would be better suited in the desorption cycle.
The determined breakthrough curves serve to validate a fixed bed simulation. This simulation is based on four partial differential equations describing mass and energy balances. The simulation results under the form of breakthrough curves show that the temperature levels and time durations have a high agreement with the experimental ones. However, the transition behaviour differs somewhat, which could be improved to a certain extend by a longer fixed bed and an even better thermal insulation. However, based on the results, it can be stated, that the fixed bed simulation can be used for the design of a sorption system with the investigated desorption and adsorption conditions.
Both zeolites were cycled under the tumble dryer based conditions for 140 cycles. For CWK NaYBFK a slight decrease of 3.3% of the adsorbed water mass was determined. However, for CWK 13XBFK, a decrease of 36.5% of the adsorbed water mass was determined, which shows, that this zeolite should not be used under the application conditions.
Data availability statement
The raw data supporting the conclusions of this article will be made available by the authors, without undue reservation.
Author contributions
HS: Conceptualization, Data curation, Formal Analysis, Investigation, Methodology, Validation, Visualization, Writing – original draft, Writing – review and editing. SP: Data curation, Investigation, Methodology, Resources, Validation, Writing – original draft, Writing – review and editing. TS: Writing – original draft, Writing – review and editing. EL: Conceptualization, Investigation, Methodology, Software, Writing – original draft, Writing – review and editing. SH: Conceptualization, Funding acquisition, Investigation, Methodology, Project administration, Software, Validation, Visualization, Writing – original draft, Writing – review and editing.
Funding
The author(s) declare that financial support was received for the research and/or publication of this article. The work of ZAE Bayern was part of the project AMThES and supported by the Federal Ministry for Economic Affairs and Climate Action under the project code 03EN6006.
Acknowledgments
The work of ZAE Bayern was part of the project AMThES and supported by the Federal Ministry for Economic Affairs and Climate Action under the project code 03EN6006. The responsibility for the content of this publication is with the authors.
Conflict of interest
The authors declare that the research was conducted in the absence of any commercial or financial relationships that could be construed as a potential conflict of interest.
Generative AI statement
The author(s) declare that no Generative AI was used in the creation of this manuscript.
Publisher’s note
All claims expressed in this article are solely those of the authors and do not necessarily represent those of their affiliated organizations, or those of the publisher, the editors and the reviewers. Any product that may be evaluated in this article, or claim that may be made by its manufacturer, is not guaranteed or endorsed by the publisher.
Supplementary material
The Supplementary Material for this article can be found online at: https://www.frontiersin.org/articles/10.3389/fther.2025.1513507/full#supplementary-material
References
Auer, A., and Rönsch, S. (2022). Rapid aging of binder-free zeolite NaY beads in thermal energy storage applications. Chem. Eng. Technol. 45 (9), 1598–1604. doi:10.1002/ceat.202200141
Breck, D. W. (1964). Crystalline molecular sieves. J. Chem. Educ. 41 (12), 678–689. doi:10.1021/ed041p678
Buhl, J.-C., Gerstmann, M., Lutz, W., and Ritzmann, A. (2004). Hydrothermal stability of the novel zeolite type LSX in comparison to the traditional 13X modification. Z. Anorg. Allg. Chem. 630 (4), 604–608. doi:10.1002/zaac.200300370
Dubinin, M. M. (1967). Adsorption in micropores. J. Colloid. Interface Sci. 23, 487–499. doi:10.1016/0021-9797(67)90195-6
El Fil, D., and Garimella, S. (2022). Energy-efficient gas-fired tumble dryer with adsorption thermal storage. Energy 239, 121708. doi:10.1016/j.energy.2021.121708
Ellison, S. L. R., and Williams, A. (2012). EURACHEM/CITAC Guide CG 4 - quantifying uncertainty in analytical measurement. Available online at: http://www.eurachem.org (Accessed March 19, 2025).
Fischer, F. (2018). Hydrothermale Stabilität von 13X-Zeolithen: Experimentelle Untersuchung und Modellierung (TU Munich). PhD thesis.
Fischer, F., and Lävemann, E. (2015). Multiple sample setup for testing the hydrothermal stability of adsorbents in thermal energy storage applications. Meas. Sci. Technol. 26, 065603. doi:10.1088/0957-0233/26/6/065603
Fischer, F., Lutz, W., Buhl, J.-C., and Lävemann, E. (2018). Insights into the hydrothermal stability of zeolite 13X. Microporous Mesoporous Mater 262, 258–268. doi:10.1016/j.micromeso.2017.11.053
Frazzica, A., and Brancato, V. (2019). Verification of hydrothermal stability of adsorbent materials for thermal energy storage. Int. J. Energy Res. 43, 6161–6170. doi:10.1002/er.4270
Hauer, A. (2002). Beurteilung fester Adsorbentien in offenen Soprtionssystemen für energetische Anwendungen (TU Berlin, Germany). PhD thesis.
Hauer, A. (2007). Evaluation of adsorbent materials for heat pump and thermal energy storage applications in open systems. Adsorption 13, 399–405. doi:10.1007/s10450-007-9054-0
Hauer, A., and Fischer, F. (2011). Open adsorption system for an energy efficient dishwasher. Chem. Ing. Tech. 83, 61–66. doi:10.1002/cite.201000197
Krönauer, A., Lävemann, E., Brückner, S., and Hauer, A. (2015). Mobile sorption heat storage in industrial waste heat recovery. Energy Procedia 73, 272–280. doi:10.1016/j.egypro.2015.07.688
Laurenz, E. (2021). Frequency response analysis of heat and mass transfer in adsorbent composites and simplified performance estimation for heat transformation applications (Hamburg: TU Hamburg). PhD thesis.
Lävemann, E., Bayer, A., Brückner, S., Fischer, F., Gaaß, M., Hauer, A., et al. (2015). Mobile Sorptionsspeicher zur industriellen Abwärmenutzung Grundlagen und Demonstrationsanlage – MobS II. FKZ 0327383B, TIB Hann. doi:10.2314/GBV:842226583
Lehmann, C., Beckert, S., Gläser, R., Kolditz, O., and Nagel, T. (2017). Assessment of adsorbate density models for numerical simulations of zeolite-based heat storage applications. Appl. Energy 185, 1965–1970. doi:10.1016/j.apenergy.2015.10.126
Lutz, W. (2014). Zeolite Y: synthesis, modification, and properties – a case revisited. Adv. Mater. Sci. Eng. 2014, 1–20. doi:10.1155/2014/724248
Lutz, W., Kurzhals, R., Sauerbeck, S., Toufar, H., Buhl, J.-C., Gesing, T., et al. (2010). Hydrothermal stability of zeolite SAPO-11. Microporous Mesoporous Mater 132 (1-2), 31–36. doi:10.1016/j.micromeso.2009.08.003
MBW Calibration AG (2014). Dew point mirror 573 – operation and maintenance manual, 1. Switzerland: Wettingen.
Mugele, J. (2005). Optimierung von Speichermaterialien für den Einsatz in geschlossenen thermochemischen Wärmespeichern für gebäudetechnische Anwendungen. VDI Verlag.
NETZSCH-Gerätebau GmbH (2025). Technical specifications STA 449 F1 jupiter. Available online at: http://analyzing-testing.netzsch.com/(Accessed March 19, 2025).
Praveen, B., and Suresh, S. (2019). Thermal performance of micro-encapsulated PCM with LMA thermal percolation in TES based heat sink application. Energy Convers. manage. 185, 75–86. doi:10.1016/j.enconman.2019.01.080
Reichmuth, A., Wunderli, S., Weber, M., and Meyer, V. R. (2004). The uncertainty of weighing data obtained with electronic analytical balances. Microchim. Acta 148, 133–141. doi:10.1007/s00604-004-0278-3
Salman, N., Rüscher, C. H., Buhl, J.-C., Lutz, W., Toufar, H., and Stöcker, M. (2006). Effect of temperature and time in the hydrothermal treatment of HY zeolite. Microporous Mesoporous Mater 90 (1-3), 339–346. doi:10.1016/j.micromeso.2005.09.032
Santori, A., Frazzica, A., Freni, A., Galieni, M., Bonaccorsi, L., Polonara, F., et al. (2013). Optimization and testing on an adsorption dishwasher. Energy 50, 170–176. doi:10.1016/j.energy.2012.11.031
Schmit, H., Schubert, T., Ristić, A., Velte-Schäfer, A., Hügenell, P., Füldner, G., et al. (2024). Experimental determination of characteristic curves of two commercial zeolites and the composite of γ-Al2O3 and CaCl2 for sorption heat storage. J. Energy Storage 97 (B), 113011. doi:10.1016/j.est.2024.113011
Schmit, H., Velte-Schäfer, A., Lävemann, E., Krönauer, A., Pöllinger, S., Schubert, T., et al. (2023). Preliminary testing and evaluation of two zeolites for integration of a sorption system into industrial tumble dryers. In: R. R. Riehl (editor). 10th heat powered cycles 2023: conference proceedings; 3 - 6 september; Edinburgh, Scotland. Edinburgh: The University of Edinburgh, p. 301–312.
Schumann, K., Unger, B., Brandt, A., and Scheffler, F. (2012). Investigation on the pore structure of binderless zeolite 13× shapes. Microporous Mesoporous Mater 154, 119–123. doi:10.1016/j.micromeso.2011.07.015
Storch, G. (2010). Materialwissenschaftliche Untersuchungen an zeolitischen Adsorbenzien für den Einsatz in offenen Sorptionssystem zur Wärmespeicherung. PhD thesis. Munich. TU Munich.
Storch, G., Reichenauer, G., Scheffler, F., and Hauer, A. (2008). Hydrothermal stability of pelletized zeolite 13X for energy storage applications. Adsorption 14, 275–281. doi:10.1007/s10450-007-9092-7
Vasta, S., Brancato, V., La Rosa, D., Palomba, V., Restuccia, G., Sapienza, A., et al. (2018). Adsorption heat storage: state-of-the-art and future perspectives. Nanomaterials 8 (7), 522. doi:10.3390/nano8070522
Velte-Schäfer, A., Laurenz, E., and Füldner, G. (2023). Basic adsorption heat exchanger theory for performance prediction of adsorption heat pumps. iScience 26 (12), 108432. doi:10.1016/j.isci.2023.108432
Glossary
CWK Chemiewerke Bad Köstritz
TES Thermal energy storage
TGA Thermogravimetric analysis
STA Simultaneous thermal analysis
as Specific surface area of the sorbent
c*p,g Effective specific heat capacity of the gas phase
c*p,s Effective specific heat capacity of the sorbent
h*ad Differential adsorption enthalpy
ṁad Mass flow rate from the gas phase to the sorbent
ṁg Mass flow rate of the carrier gas
p Pressure
ps Saturation pressure
RH2O Specific gas constant of water vapour
T Temperature
t Time
Td Dew point temperature
Td,in Inlet dew point temperature
Td,out Outlet dew point temperature
Td,sim,out Simulated outlet temperature
Tg Temperature of the gas phase
Tin Inlet temperature
Tout Outlet temperature
Ts Temperature of the sorbent
Tsim,out Simulated outlet temperature
Wads Adsorbed water volume
Xg Water uptake of the carrier gas
Xg,eq Humidity ratio of gas in equilibrium with the sorbent
Xs Water uptake of the sorbent
ΔF Adsorption potential
ΔWads Volumetric water uptake
αsg Heat transfer coefficient between sorbent and gas
βsg Mass transfer coefficient between sorbent and gas
εg Share of the carrier gas in the balance volume
εs Share of the sorbent in the balance volume
ρads Density of the adsorbed phase
ρg Density of the carrier gas
ρs Density of the sorbent
Keywords: thermochemical energy storage, characteristic curve, cycling stability, fixed bed simulation, binderless zeolite, mobile sorption storage, breakthrough curves
Citation: Schmit H, Pöllinger S, Schubert T, Lävemann E and Hiebler S (2025) Application oriented material characterisation and simulation for adsorption thermal energy storage. Front. Therm. Eng. 5:1513507. doi: 10.3389/fther.2025.1513507
Received: 18 October 2024; Accepted: 13 May 2025;
Published: 27 May 2025.
Edited by:
Bidyut Baran Saha, Kyushu University, JapanReviewed by:
Hongtao Xu, University of Shanghai for Science and Technology, ChinaFikret Alic, University of Tuzla, Bosnia and Herzegovina
Kutub Uddin, Jagannath University, Bangladesh
Copyright © 2025 Schmit, Pöllinger, Schubert, Lävemann and Hiebler. This is an open-access article distributed under the terms of the Creative Commons Attribution License (CC BY). The use, distribution or reproduction in other forums is permitted, provided the original author(s) and the copyright owner(s) are credited and that the original publication in this journal is cited, in accordance with accepted academic practice. No use, distribution or reproduction is permitted which does not comply with these terms.
*Correspondence: Henri Schmit, aGVucmkuc2NobWl0QHphZS1iYXllcm4uZGU=