 Munish Digra
 Jagdev Singh
- Department of Mechanical Engineering, Sardar Beant Singh State University, Gurdaspur, Punjab, India
Nanorefrigerants, which consist of base refrigerant enhanced with nanoscale particles, represent a promising advancement in thermal management systems. This study reports the successful synthesis, characterization, and experimental evaluation of a novel Al2O3/HFE-7000 nanorefrigerant intended for domestic refrigeration applications. Aluminum oxide (Al2O3) nanoparticles were synthesised via a citrate sol-gel method, followed by calcination at 800 °C, and characterised using Powder X-ray Diffraction (PXRD), Field Emission Scanning (FESEM), High Resolution Transmission Electron Microscopy (HRTEM), Energy-Dispersive X-ray Spectroscopy (EDX), and Brunauer-Emmett-Teller (BET) analyses. The nanoparticles exhibited high crystallinity, spherical morphology, an average size of ∼22.5 nm, and a surface area of 26.2 m2/g with mesoporous structure. The nanorefrigerant was prepared by dispersing Al2O3 nanoparticles in HFE-7000 using ultra sonication and magnetic stirring, aided by Tween-80 surfactant to ensure long-term dispersion stability. Five different nanoparticle concentrations (0.02%–1.5% wt) were tested. A custom-engineered vapour compression refrigeration system (VCRS) test rig was deployed to evaluate the thermophysical performance across five temperature conditions. Key findings revealed that the addition of Al2O3 significantly enhanced the Coefficient of Performance (COP), improved subcooling, and reduced the discharge pressure and compression ratio—without compromising system stability. The optimal concentration range was identified as 1.2–1.4 wt%, beyond which increases in viscosity and potential nanoparticle agglomeration could offset thermal benefits. These results highlight the potential of Al2O3/HFE-7000 nanorefrigerants as high-efficiency, environmentally friendly alternatives for domestic cooling applications.
1 Introduction
Nanotechnology has rapidly emerged as a transformative force in various fields, offering innovative solutions to longstanding challenges. One such application lies in the development of nanorefrigerants, which are advanced colloidal mixtures composed of a base fluid and nanoparticles at the nanoscale. These nanorefrigerants have garnered considerable interest within the scientific community due to their potential to significantly enhance the thermal properties of fluids, thereby improving the efficiency and performance of heat transfer systems (Mahbubul et al., 2015; Che et al., 2020; Jyothi Sankar, Venkatachalapathy, and Asirvatham, 2020; Feroskhan et al., 2022). Domestic refrigeration, a vital component of modern living, presents a unique opportunity to leverage the advantages of nanorefrigerants. Conventional refrigerants, while effective, often encounter limitations in terms of thermal conductivity and overall heat transfer efficiency (Ciconkov, 2018; Sharma et al., 2025). The integration of nanoparticles into base fluids represents a promising avenue for addressing these limitations by enhancing the thermal conductivity, specific heat, and viscosity of the fluids. Consequently, nanorefrigerants offer the potential to improve the energy efficiency of refrigeration systems, reduce environmental impact, and extend the lifespan of domestic appliances (Memet, 2023; Feroskhan et al., 2022; Gobane et al., 2023; Dilawar and Qayoum, 2022).
Among the various nanoparticles explored for their heat transfer capabilities, aluminium oxide (Al2O3) has emerged as a leading candidate due to its excellent thermal conductivity, chemical stability, and non-toxicity (Mahbubul et al., 2015; Nair, Parekh, and Tailor, 2020; Li and Jun, 2022). Additionally, the choice of base fluid plays a crucial role in determining the overall effectiveness of the nanorefrigerant. Hydrofluoroethers (HFEs), particularly HFE-7000, have gained attention as environmentally friendly alternatives to traditional refrigerants due to their low global warming potential (GWP) and zero ozone depletion potential (ODP) (Sikora, Bohdal, and Formela, 2021; Hu et al., 2015; Rausch et al., 2015; Touaibi and Koten, 2021; Anthony and Krishpersad, 2023). The combination of Al2O3 nanoparticles with HFE-7000 offers a novel and promising approach to the development of nanorefrigerants for domestic refrigeration applications. However, the synthesis of a homogeneous and stable nanorefrigerant poses significant challenges. Achieving a uniform dispersion of nanoparticles within the base fluid is essential to maintain the desired thermophysical properties and ensure long-term stability. Moreover, the interaction between nanoparticles and the base fluid must be carefully managed to prevent agglomeration and sedimentation, which could adversely affect the performance of the nanorefrigerant (Said et al., 2023; Ponticorvo et al., 2022; Yıldız, Ağbulut, and Gürel, 2021).
This study aims to address these challenges by presenting the synthesis and comprehensive characterization of Al2O3 nanoparticles, followed by their incorporation into HFE-7000 to create a novel Al2O3-HFE7000 nanorefrigerant. The synthesis process involved the use of ultrasonication and magnetic stirring techniques to achieve a stable dispersion of nanoparticles within the base fluid. Characterization techniques, including powder X-ray diffraction (PXRD), field emission scanning electron microscopy (FESEM), high resolution transmission electron microscopy (HRTEM), were employed to confirm the crystalline structure, morphology, particle size, optical properties, and surface functional groups of the synthesized Al2O3 nanoparticles.
By exploring the synthesis and characterization of Al2O3-HFE7000 nanorefrigerant, this research seeks to contribute to the growing body of knowledge on nanorefrigerants and their potential applications in domestic refrigeration. The findings of this study may pave the way for the development of more efficient, environmentally friendly, and sustainable refrigeration systems, ultimately enhancing the quality of life and reducing the environmental footprint of domestic cooling technologies.
2 Synthesis of nanorefrigerant
2.1 Synthesis of Al2O3 nanoparticles
The raw materials such as Citric acid (C6H8O7) and aluminum nitrate nonahydrate (Al (NO3)3.9H2O) were purchased from Sigma-Alrich. Aluminium nitrate and citric acid were employed as precursors for the synthesis of Al2O3 nanoparticles, each with a concentration of 0.6 M. The calculated quantities of aluminium nitrate nonahydrate (Al (NO3)3.9H2O) and citric acid (C6H8O7) were dissolved in 100 mL of distilled water in separate beakers. The solutions were thoroughly mixed to ensure complete dissolution of the salts. The beaker containing the (Al (NO3)3.9H2O) solution was placed on a hot plate with a magnetic stirrer, maintained at 80 °C. The citric acid solution was transferred to a burette and gradually added, drop by drop, to the (Al (NO3)3.9H2O) solution. The mixture was continuously stirred for 8 h at 80 °C, until it turned into a yellowish solution. The temperature was increased to 200 °C and maintained for 3 h until a fluffy, polymeric citrate precursor was formed. The precursor was then allowed to dry and ground into a fine powder. Finally, the contents were transferred to a porcelain dish and subjected to calcination in a muffle furnace at 800 °C for 3 h (Figure 1).
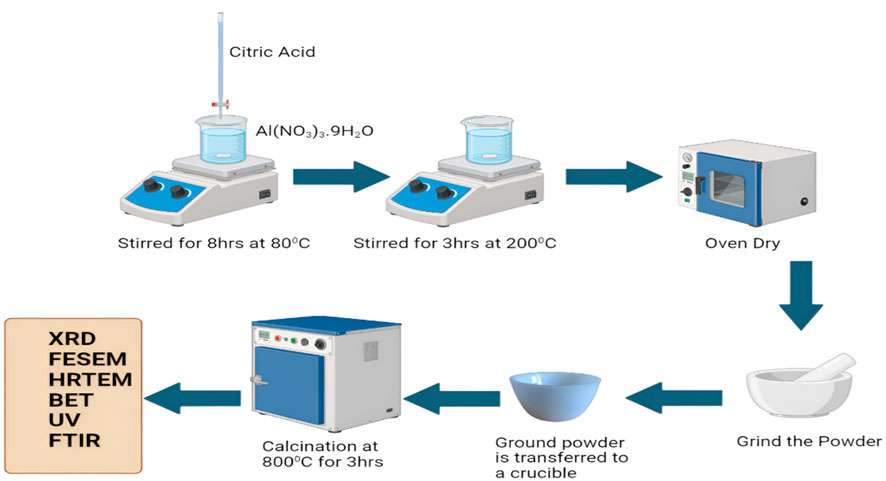
Figure 1. Synthetic process of Al2O3 nanoparticles
2.2 Preparation of HFE-7000/Al2O3 nanorefrigerant
The nanorefrigerant was prepared using HFE-7000 and Al2O3 nanoparticles synthesised in-house (Razak et al., 2018). HFE-7000 was selected as the base refrigerant due to its favourable physical properties. This fluid is odourless, non-explosive, non-flammable, with a low phase change enthalpy and a low boiling point. The low boiling temperature was specifically chosen for safety reasons, as it reduces heat losses by controlling the amount of heat required to induce boiling.
The Al2O3/HFE-7000 nanorefrigerant was prepared using specific concentrations of Al2O3 nanoparticles, combined with the surfactant Tween-80, to enhance dispersion and stability. The objective was to achieve a homogeneous suspension of Al2O3 nanoparticles in HFE-7000, employing ultrasonic agitation and varying concentrations of Tween-80. We prepared five different samples with concentrations of 0.02%, 0.05%, and 0.08%, 1.0% and 1.5% by weight of Al2O3 nanoparticles. For each sample, the appropriate quantity of Al2O3 nanoparticles was carefully weighed and added to a measured volume of HFE-7000 fluid. The mixture was then subjected to ultrasonic agitation using an ultrasonic bath, with each sample being sonicated for 60 min. This process was crucial in breaking down any nanoparticle agglomerates and ensuring an even distribution of the nanoparticles within the HFE-7000 fluid.
Following the ultrasonic agitation, Tween-80 surfactant was added to each sample to enhance stability and prevent the re-agglomeration of the nanoparticles. The concentration of Tween-80 was carefully adjusted based on the amount of Al2O3 nanoparticles in each sample, ensuring the surfactant was optimally proportioned to maintain a stable and homogeneous dispersion. Subsequently, the samples underwent a second round of ultrasonic agitation for 30 min to ensure the Tween-80 was uniformly distributed throughout the mixture, allowing the Al2O3 nanoparticles to remain well-dispersed in the HFE-7000 fluid. Finally, the prepared Al2O3/HFE-7000 nanorefrigerant samples were stored in sealed containers for further observation and thermo-physical characterization.
3 Characterisation of nanoparticles
3.1 Powder X-ray diffraction analysis
The Powder X-ray Diffraction (PXRD) characterisation was carried out to analyse the crystallographic structure of the synthesised material under standard ambient conditions. The data were recorded in ASCII-2Theta-Intensity (.ASC) format using a goniometric scan axis with a fixed divergence slit configuration. The scan commenced at 10.0280° 2θ and was continued up to 89.9780° 2θ, with a consistent step size of 0.0500° and a scan step time of 1.0 s per step. The measurement was performed at a controlled temperature of 25 °C, ensuring minimal thermal drift during data acquisition.
The setup utilised a copper (Cu) anode X-ray source, which is commonly preferred due to its characteristic Kα emission (∼1.5406 Å), suitable for inorganic and nanomaterial characterisation. The divergence slit was fixed at 1.0000°, and the receiving slit measured 0.1 mm, optimising beam collimation and resolution. The specimen length was standardised at 10 mm, and no specimen spinning was applied during the scan. The goniometer radius was maintained at 240 mm, with a focus-to-divergence slit distance of 91 mm.
The obtained PXRD graph is presented in (Figure 2), exhibiting sharp and well-defined peaks that are indicative of a highly crystalline nature of the material. The characteristic diffraction peaks were observed at 2θ values that closely match the standard JCPDS reference pattern for γ-Al2O3, confirming the successful formation of the targeted alumina phase. The PXRD pattern shows strong reflections at approximately 2θ ≈ 37.5°, 39.5°, 45.8°, 60.7°, and 66.7°, corresponding to the (311), (222), (400), (511), and (440) planes, respectively. These peak positions and intensities align well with the cubic spinel structure of γ-Al2O3, affirming phase purity. Minor peak broadening was observed, which is often associated with nanoscale crystallite dimensions and possible lattice strain. Debye-Scherrer formula = Kλ/Bcosθ can be used for calculating the crystallite size:
where:
• D is the crystallite size (nm)
• K is the shape factor (taken as 0.9)
• λ is the X-ray wavelength
• β is the full width at half maximum (FWHM) in radians, and
• θ is the Bragg angle in radians.
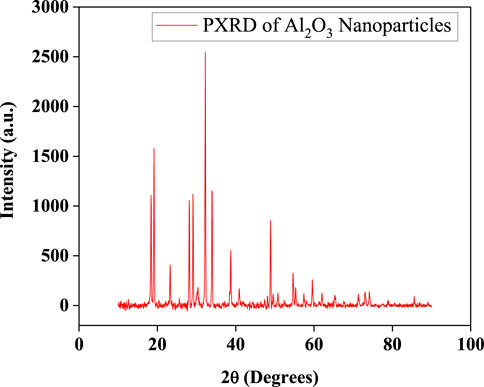
Figure 2. Powder XRD pattern of Al2O3 nanoparticles showing sharp, well-defined diffraction peaks indicative of high crystallinity.
The FWHM of the most intense peak was extracted, and the corresponding Bragg angle was used in the Scherrer equation. After conversion of β and θ to radians and performing the calculation, the average crystallite size of the Al2O3 nanoparticles was estimated to be approximately 22.5 nm. This value falls within the expected nanoscale range, indicating that the synthesis method effectively yields nanocrystalline alumina particles.
3.2 FESEM analysis
The (Figure 3) reveals that the Al2O3 nanoparticles exhibit predominantly spherical to near-spherical morphology, with relatively uniform particle shapes. Although slight deviations from ideal sphericity are noticeable, the overall geometric consistency suggests a well-controlled synthesis process. The particle surfaces appear smooth to mildly textured, with no visible cracks or voids, indicating a high degree of crystallinity and good structural integrity. A narrow size distribution was observed, with the majority of particles falling in the 20–30 nm diameter range. This size estimate is in excellent agreement with the crystallite size (∼22.5 nm) derived from the Scherrer equation applied to PXRD data, thus reinforcing the correlation between the physical morphology and the crystalline domain size.
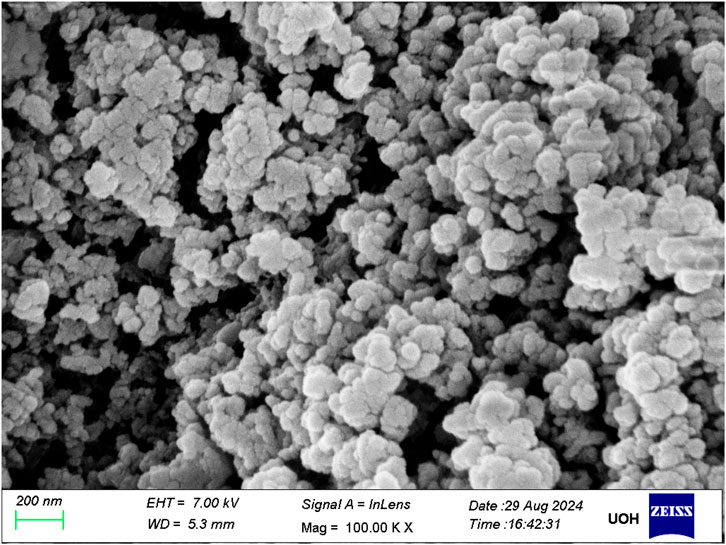
Figure 3. FESEM image of Al2O3 nanoparticles.
3.3 Energy-Dispersive X-ray spectroscopy (EDX)
To investigate the elemental composition and chemical purity of the synthesised aluminium oxide (Al2O3) nanoparticles, Energy Dispersive X-ray Spectroscopy (EDX) was performed in conjunction with FESEM imaging. The resulting EDX spectrum, as shown in (Figure 4), clearly identifies aluminium (Al) and oxygen (O) as the only detectable elements present in the sample. The spectrum exhibits two dominant peaks: a strong peak corresponding to aluminium (Al) at approximately 1.5 keV (Al Kα) and a prominent peak for oxygen (O) at around 0.5 keV (O Kα). These peaks confirm the stoichiometric composition of Al2O3. Notably, no signals from other elements such as carbon (C), sodium (Na), chlorine (Cl), silicon (Si), or any transition metals were detected, which implies a high level of purity and the absence of foreign impurities or unreacted precursors. Furthermore, the low background noise and clean spectral profile further affirm the successful synthesis of phase-pure Al2O3 nanoparticles.
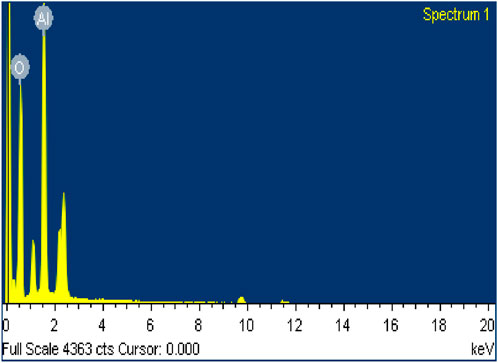
Figure 4. Energy-Dispersive X-ray spectroscopy of Al2O3.
3.4 High-resolution transmission electron microscopy (HRTEM)
The atomic-level resolution is essential for understanding structure–property relationships in nanoparticles, which directly influence their physical, chemical, and functional behaviors in various applications such as catalysis, electronics, and medicine (Figure 5). The clarity and sharpness of the lattice fringes visible in the images suggest a high degree of crystallinity within the nanoparticles. The presence of distinct lattice patterns further supports the conclusion of a well-defined crystalline structure. Moreover, the mesoporous nature and uniformity in particle size distribution indicate that these Al2O3 nanoparticles could offer enhanced surface area, which is advantageous for applications requiring high surface activity, such as catalysis or adsorption processes.
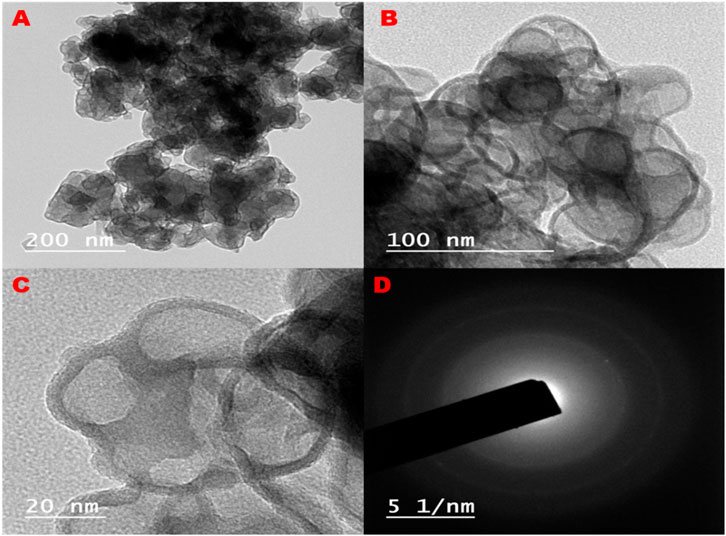
Figure 5. HRTEM images of Al2O3 nanoparticles (A–C), and SAED pattern (D) of Al2O3-NPs.
3.5 Brunauer–Emmett–Teller (BET) analysis
The BET analysis for Al2O3 nanoparticles, with a recorded weight of 0.1010 g, was conducted using the NOVA touch 4LX instrument (serial number 1050020628) with firmware version 1.12, operated by QUANTACHROME. The analysis took 308.1 min under ambient conditions, with an ambient temperature of 21.56 °C. The void volume was measured in helium mode, with cold and warm zone volumes recorded as 8.39355 mL and 3.69779 mL, respectively. A 9 mm cell with a rod was utilised, and a thermal delay of 600 s was applied. The nitrogen adsorbate used for the analysis had a molecular weight of 28.013 g/mol and a cross-sectional area of 16.2 Å2/mol. The bath temperature during the analysis was maintained at 77.35 K. Degassing of the sample occurred over a period of 3 h at a temperature of 200 °C. Data reduction was performed without applying thermal transpiration or temperature compensation. The deBoer method was employed for thickness calculation, ignoring P-tags below 0.35, and the data reduction model used was the N2 at 77K on silica (cylindrical pore) NLDFT Ads. model, covering the entire P/P0 range from 0 to 1, with a moving point average of 5.
The nitrogen adsorption isotherms revealed critical insights into the pore structure and adsorption characteristics of the material as visible in Figure 2. At low relative pressures (P/P0 ranging from approximately 0.05–0.2), a gradual increase in the volume adsorbed was observed, beginning at 5.73 cc/g and rising to 7.47 cc/g. This behaviour indicates the initial filling of the most accessible pores or adsorption sites within the material. As the relative pressure increased to the intermediate range (0.2–0.8), the volume adsorbed continued to rise steadily, reaching a value of 16.39 cc/g. This region is typically associated with multilayer adsorption and the filling of mesopores. At higher relative pressures, from 0.8 to near saturation (P/P0 ≈ 0.99), a significant increase in adsorption volume was noted, peaking at 153.21 cc/g. This marked rise is indicative of nitrogen condensation within larger pores or interparticle voids, a behaviour characteristic of porous materials (Figure 6). Furthermore, the adsorption-desorption isotherms exhibited a hysteresis loop, where the desorption path diverged from the adsorption path. This phenomenon is indicative of the material’s mesoporous nature and suggests the presence of specific pore structures that lead to different capillary condensation and evaporation pathways.
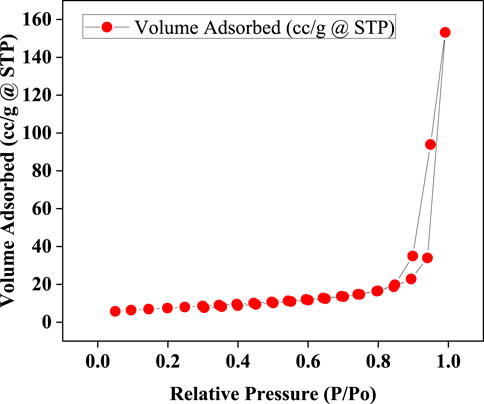
Figure 6. Isotherm shows the amount of gas adsorbed versus the relative pressure (P/P0) at a constant temperature.
The strong linearity in the 0.15–0.30
These observations strongly suggest that the material possesses a combination of micro and mesopores. The presence of a hysteresis loop, particularly of the H1 or H2 type, implies the existence of uniform mesopores or ink-bottle shaped pores. The low-pressure adsorption data is suitable for calculating the Brunauer–Emmett–Teller (BET) surface area, while the high-pressure data provides valuable information regarding the total pore volume. The steep increase in adsorption near saturation pressure underscores the significant pore volume, likely associated with larger pores or interstitial voids between particles.
The multi-point BET analysis as shown in (Figure 7), conducted over a relative pressure range, indicated a progressive increase in the volume adsorbed as the relative pressure rose from 0.145 to 0.299. Specifically, the volume adsorbed increased from 6.91 cc/g at a relative pressure of 0.145–8.51 cc/g at a relative pressure of 0.299. This trend is typical of porous materials and highlights the material’s capacity to adsorb nitrogen as the relative pressure increases. The BET plot derived from the adsorption branch of the isotherm yielded a slope of 132.624 and an intercept of 0.305161, with a correlation coefficient (r) of 0.999879, indicating an excellent fit to the BET model. The C constant, which is related to the energy of adsorption, was calculated to be 435.603, suggesting strong interactions between the nitrogen molecules and the material’s surface. The most critical result from this analysis is the determination of the specific surface area of the material, which was found to be 26.198 m2/g. This relatively high surface area indicates a substantial capacity for adsorption, which is consistent with the observed adsorption isotherm and further confirms the material’s suitability for applications requiring high surface area and adsorption capacity.
![Graph depicting a linear relationship between relative pressure and the inverse of [W/((Po/P) - 1)]. The x-axis represents relative pressure, ranging from 0.14 to 0.32, while the y-axis ranges from 20 to 40. Data points are marked in red, green, blue, and cyan.](https://www.frontiersin.org/files/Articles/1682295/fther-05-1682295-HTML/image_m/fther-05-1682295-g007.jpg)
Figure 7. Linearised BET plot of
4 Experimental procedure
The experimental investigation was carried out using a custom-engineered Vapour Compression Refrigeration System (VCRS) test rig, meticulously designed to assess the thermophysical performance of HFE-7000/Al2O3 nanorefrigerants. This setup replicates a conventional VCRS configuration but incorporates critical enhancements to accommodate the distinctive properties of HFE-7000 particularly its higher liquid density (1,610 kg/m3), lower latent heat of vaporisation (88 kJ/kg), and the integration of Al2O3 nanoparticles. High-precision instrumentation was deployed across the system to ensure accurate measurement and control of thermal, pressure, and flow parameters during multiple experimental cycles (Figure 8).
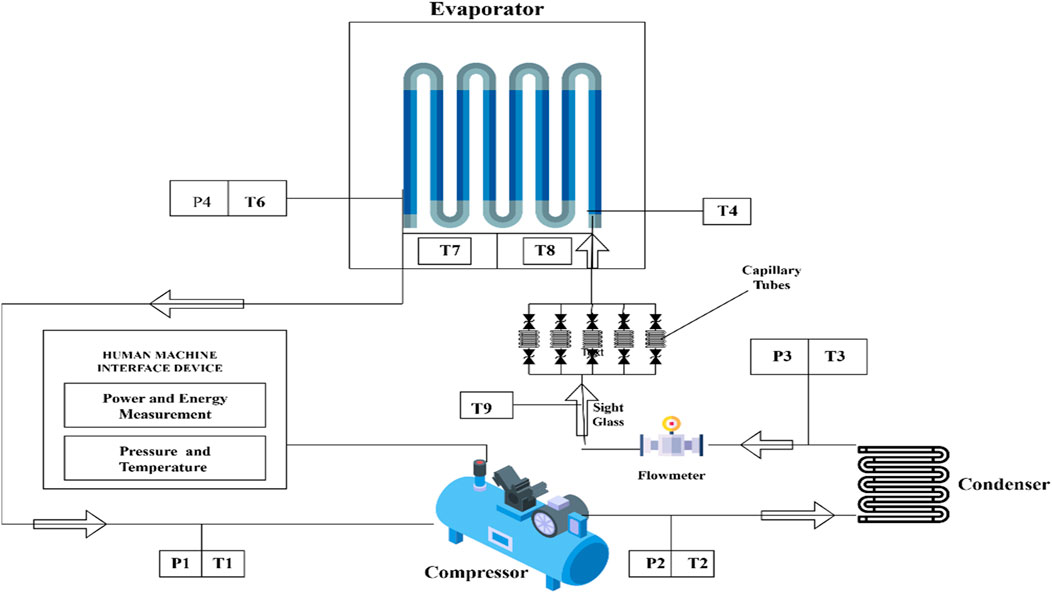
Figure 8. Schematic diagram of experimental setup.
The test rig includes four core components. First, a hermetically sealed, reciprocating compressor rated at 92 W was recalibrated to operate effectively at the low suction pressures associated with HFE-7000 (ranging from 0.15 to 0.3 bar at evaporator temperatures between −15 °C and −3 °C). This compressor uses POE (polyolester) oil, which is chemically idle with HFE-7000 and helps minimise nanoparticle agglomeration. Second, the condenser is a 2-L shell-and-tube unit equipped with micro-finned tubes to enhance heat rejection. It is tailored to manage the increased mass flow requirements due to the 440–450 g charge and compensate for the refrigerant’s relatively low latent heat. Third, the expansion device comprises a copper capillary tube that has been recalibrated to account for HFE-7000’s higher liquid density, optimising flow resistance and pressure drop to enable proper expansion within the operating range of 0.95–1.4 bar. Fourth, the evaporator features a 7.1 m-long copper coil thermally loaded with 300 W ribbon-type electric heaters to simulate heat absorption, and is coated with a corrosion-resistant layer to reduce wear caused by Al2O3 nanoparticles.
Instrumentation includes high-precision temperature sensors (T1–T9) and pressure transducers (P1–P4), which are strategically positioned at critical locations—such as the suction and discharge ports of the compressor, the outlet of the condenser, the inlet and outlet of the capillary, and the inlet and outlet of the evaporator. These instruments generate a comprehensive spatio-temporal map of refrigerant behaviour. A flowmeter calibrated for HFE-7000 and a high-visibility sight glass enable continuous monitoring of refrigerant state, phase transition, and subcooling—especially important when accounting for potential opacity introduced by nanoparticles. Additional sensors placed on evaporator and condenser surfaces allow for the early detection of heat transfer degradation due to nanoparticle deposition.
The experimental campaign was conducted under five representative test conditions. These conditions varied both evaporator and condenser temperatures within appropriate limits, ensuring meaningful performance evaluation while optimising time and resource efficiency (Table 1). In consideration of the refrigerant’s low operating pressure, the compressor’s pressure safety cutoff was limited to 5 bar to prevent overload and align with HFE-7000’s saturation pressure range. Data on temperature, pressure, power consumption, and flow rate were collected using a multi-channel data acquisition system interfaced with a Human-Machine Interface (HMI) panel. A digital energy meter recorded compressor power, enabling the calculation of the Coefficient of Performance (COP) and energy efficiency.
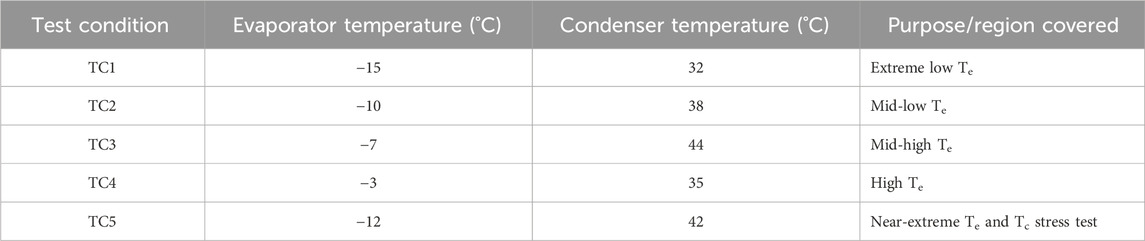
Table 1. Experimental test conditions.
To address challenges specific to nanoparticle-based refrigerants, several system modifications were implemented. A high-efficiency inline filter installed downstream of the compressor captures agglomerated Al2O3 particles, mitigating the risk of capillary tube blockage. A bypass loop facilitates periodic flushing to remove nanoparticle residues and maintain system stability. Additionally, enhanced monitoring of heat exchanger surfaces—via extra temperature sensors and regular visual inspections through the sight glass—enables early detection and mitigation of heat transfer degradation resulting from nanoparticle fouling.
4.1 Thermophysical properties analysis
As depicted in (Figure 9), the COP improved consistently with increasing Al2O3 concentration for all test cases. Notably, TC5 (Te = −12 °C, Tc = 42 °C) and TC4 (Te = −3 °C, Tc = 35 °C) exhibited the most pronounced enhancement, reaching a peak COP of approximately 2.0 and 1.85, respectively, at 1.4 Wt%. This can be attributed to improved thermal conductivity and enhanced nucleate boiling phenomena facilitated by the suspended nanoparticles, which increase evaporative heat transfer and delay the onset of vapour dryness. However, the marginal improvements taper off beyond 1.2 Wt%, suggesting a threshold concentration beyond which viscosity and fouling begin to counteract thermal benefits.
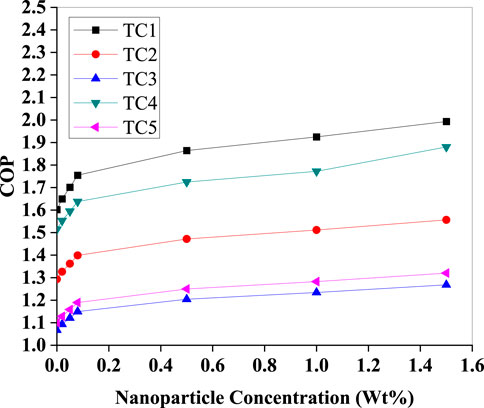
Figure 9. Variation of the coefficient of performance (COP) with Al2O3 nanoparticle concentration (Wt%) for five test conditions (TC1–TC5). All cases show COP improvement with increasing concentration, with TC1 delivering the highest performance and most pronounced gain.
In (Figure 10), a positive trend is observed in suction temperature (Tsuc) across all test conditions, with the steepest increases in TC4 and TC5. The nanoparticle suspension improves convective heat absorption at the evaporator, thereby reducing the degree of superheat at the compressor inlet. This behaviour is favourable as it reduces the thermal load on the compressor. However, a careful balance is required to prevent excessive rise in suction temperature, which could diminish the refrigerant’s cooling capacity.
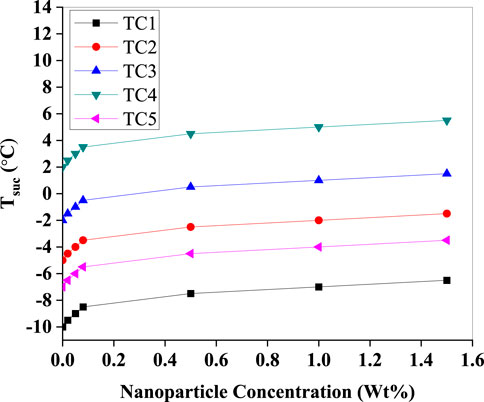
Figure 10. Suction temperature (Tsuc) as a function of Al2O3 nanoparticle concentration (Wt%) for test conditions TC1–TC5. All cases show an increase in T_suc with nanoparticle loading, with the largest absolute values for TC4 and the lowest for TC1.
In (Figure 11) indicates minimal fluctuation in discharge temperatures across most test cases, maintaining thermal stability within the compressor. A slight decrease in Tdis was observed in TC1 and TC3 with increasing concentration, likely due to enhanced latent heat transport, which shifts a portion of sensible heating away from the compressor outlet. This moderation in discharge temperature is beneficial for compressor longevity and oil stability.
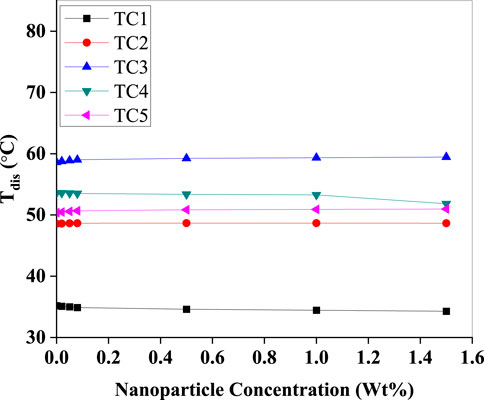
Figure 11. Discharge temperature (Tdis) versus Al2O3 nanoparticle concentration (Wt%) for test conditions TC1–TC5. Tdis remains nearly invariant with nanoparticle loading across all cases, indicating minimal net effect of the nanorefrigerant on condenser-side temperature under the given operating conditions.
As shown in (Figure 12), suction pressure remains largely unaffected across most test cases, except in TC3, where a significant jump is recorded at 1.4 Wt%. This could be due to localised nanoparticle agglomeration causing flow restriction, leading to a back-pressure effect. Overall, the suction pressures remain within safe operational limits, reinforcing the system’s adaptability to nanofluids under varying thermal loads.
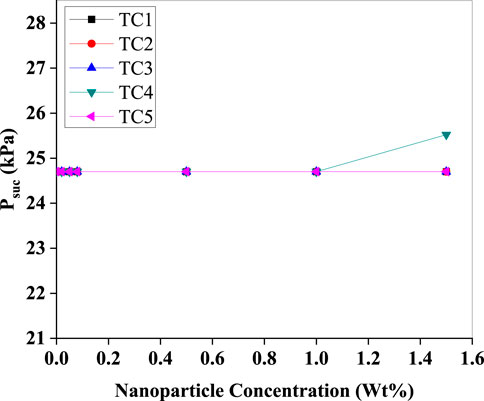
Figure 12. Suction pressure (Psuc) as a function of Al2O3 nanoparticle concentration (Wt%) for test conditions TC1–TC5. Psuc remains virtually constant across concentrations, with only a marginal rise for TC4 at the highest loading.
The (Figure 13) demonstrates a consistent decline in discharge pressure (Pdis) as nanoparticle concentration increases. This trend is attributed to the enhanced heat rejection in the condenser due to the Al2O3 nanoparticles' improved thermal conductivity. Efficient condensation results in reduced vapour superheat and consequently lowers compressor outlet pressure. Notably, the sharpest pressure drops are seen in TC1 and TC2, indicating stronger nanoparticle influence under lower evaporator temperatures. This phenomenon also contributes to improved energy efficiency by reducing compression work.
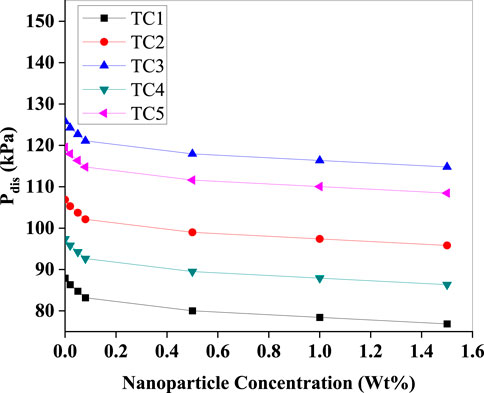
Figure 13. Discharge pressure (Pdis) as a function of Al2O3 nanoparticle concentration (Wt%) for test conditions TC1–TC5. All test cases show a reduction in discharge pressure with nanoparticle addition, most pronounced at low loadings, indicating improved condenser heat transfer and consequent lower condensing states.
As evident in (Figure 14), the superheat remains constant (5 K) across all nanoparticle concentrations for TC5. This controlled superheat profile suggests excellent system tuning and confirms that the addition of nanoparticles did not destabilise the evaporator outlet condition. The maintained superheat ensures safe compressor operation by preventing liquid refrigerant ingress while indicating uniform refrigerant evaporation, which is crucial for compressor health.
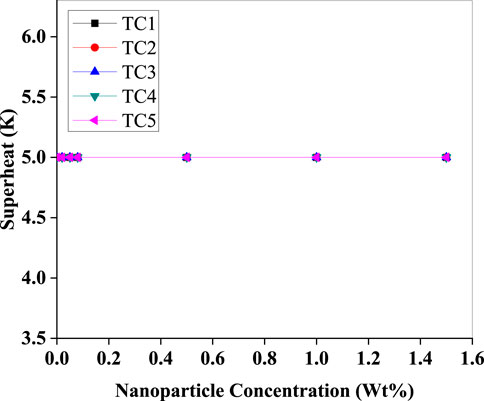
Figure 14. Evaporator superheat held constant at 5 K versus Al2O3 nanoparticle concentration (Wt%) for test conditions TC1–TC5.
In (Figure 15), the subcooling effect shows a strong positive correlation with increasing Al2O3 concentration. Subcooling increases from 2.0 K to 4.0 K across the concentration range, particularly in TC5. This behaviour suggests enhanced liquid phase stability and reduced flash gas formation at the capillary inlet, which contributes to improved refrigerant utilisation and COP. The increased subcooling also highlights better thermal contact between the condenser surface and the working fluid due to the dispersed nanoparticles.
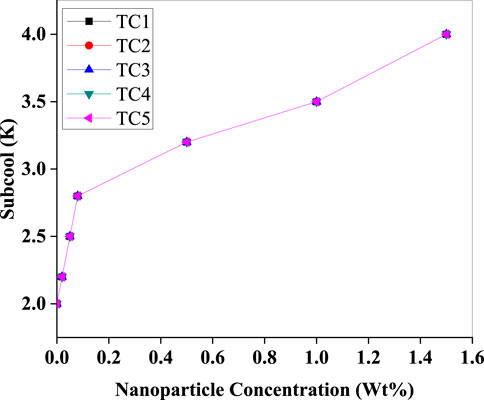
Figure 15. Subcooling (K) versus Al2O3 nanoparticle concentration (Wt%) showing a consistent rise from 2.0 K to 4.0 K as loading increases, with the largest marginal gain at very low concentrations and a steady, near-linear trend thereafter.
A declining trend is observed in (Figure 16) in the compression ratio across all test conditions as nanoparticle concentration increases. This drop is consistent with the observed decrease in discharge pressure and stability in suction pressure (Figure 12). A lower compression ratio translates to lower mechanical energy input per refrigeration cycle and thus improves compressor efficiency and system reliability. For instance, TC1 shows a drop from 3.8 to 3.2, which reflects substantial compressor load reduction.
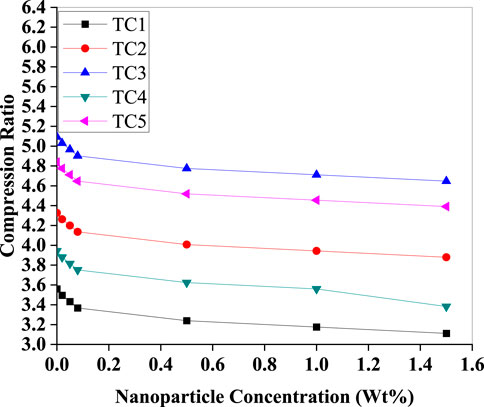
Figure 16. Compression ratio as a function of Al2O3 nanoparticle concentration (Wt%) for TC1–TC5. All cases show a declining trend—most pronounced at low concentrations—due to reduced discharge pressure from enhanced condenser performance, while suction pressure is held steady.
A linear increase in dynamic viscosity with rising nanoparticle concentration across all test cases is observed in (Figure 17). This rise is expected due to the solid–liquid interactions between Al2O3 particles and the HFE-7000 base fluid. While this could potentially hinder flow, the observed performance improvements in COP and subcooling suggest that up to 1.4 Wt% loading, the benefits outweigh the drawbacks. However, further increases in viscosity beyond this point may lead to higher pumping power requirements and flow instability.
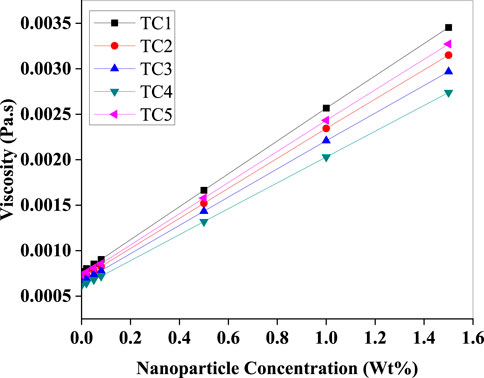
Figure 17. Variation of dynamic viscosity with Al2O3 nanoparticle concentration (Wt%) for TC1–TC5. Viscosity rises almost linearly with loading, with TC1 exhibiting the highest and TC4 the lowest values, indicating increased flow resistance due to nanoparticle suspension.
A uniform reduction in specific heat capacity with increasing nanoparticle concentration is observed in (Figure 18) dropping from 1200 J/kgK to 720 J/kgK. This decrease is due to the lower specific heat of solid Al2O3 compared to the base refrigerant. While this might appear detrimental, the trade-off is compensated by improved thermal conductivity and heat transfer rates, leading to higher system responsiveness and overall thermal efficiency, as confirmed by the rising COP trend (Figure 9).
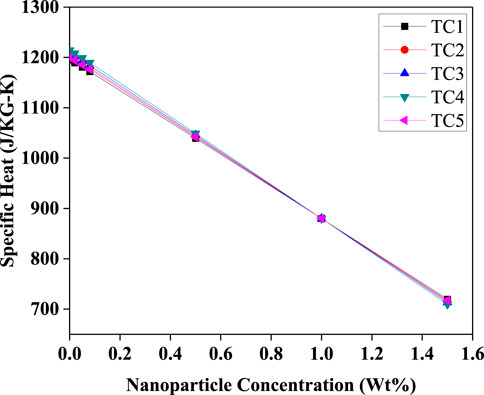
Figure 18. Effective specific heat capacity versus Al2O3 nanoparticle concentration (Wt%) for TC1–TC5. The specific heat decreases nearly linearly with increasing nanoparticle loading, with all test conditions overlapping, reflecting the dilution effect of lower-heat-capacity nanoparticles in the base fluid.
5 Conclusion
This research presents a comprehensive investigation into the synthesis, characterization, and performance evaluation of a novel Al2O3/HFE-7000 nanorefrigerant for domestic refrigeration systems. The successful synthesis of nanocrystalline aluminum oxide using a citrate sol-gel route yielded nanoparticles with desirable physical attributes such as spherical morphology, mesoporosity, and a nanoscale average crystallite size of approximately 22.5 nm. The use of HRTEM, FESEM, PXRD, and BET confirmed the structural integrity, dispersion, and surface area necessary for enhanced thermal interactions. The prepared nanorefrigerants, dispersed with Tween-80 for stability, demonstrated considerable improvements in thermophysical performance when tested in a custom VCRS setup under realistic operating conditions. Notably, the Coefficient of Performance (COP) showed a consistent increase with rising nanoparticle concentration, reaching a peak at 1.4 Wt%. Subcooling effects were also enhanced, discharge pressure and compression ratio were reduced, and the system maintained excellent thermal stability and superheat control. These gains are largely attributed to the increased thermal conductivity and nucleate boiling induced by the suspended Al2O3 particles.
However, the study also identified a performance plateau beyond 1.2–1.4 Wt% concentration due to increased viscosity and potential nanoparticle agglomeration. Hence, the optimal operating concentration must strike a balance between heat transfer enhancement and flow resistance. The overall findings underscore the viability of Al2O3/HFE-7000 nanorefrigerants as energy-efficient, low-GWP alternatives for next-generation domestic refrigeration systems. Further research is encouraged to explore long-term stability, fouling dynamics, and lifecycle environmental impact to facilitate their commercial deployment.
Data availability statement
The raw data supporting the conclusions of this article will be made available by the authors, without undue reservation.
Author contributions
MD: Methodology, Conceptualization, Writing – original draft, Writing – review and editing, Investigation. JS: Writing – review and editing, Supervision.
Funding
The author(s) declare that no financial support was received for the research and/or publication of this article.
Conflict of interest
The authors declare that the research was conducted in the absence of any commercial or financial relationships that could be construed as a potential conflict of interest.
Generative AI statement
The author(s) declare that no Generative AI was used in the creation of this manuscript.
Any alternative text (alt text) provided alongside figures in this article has been generated by Frontiers with the support of artificial intelligence and reasonable efforts have been made to ensure accuracy, including review by the authors wherever possible. If you identify any issues, please contact us.
Publisher’s note
All claims expressed in this article are solely those of the authors and do not necessarily represent those of their affiliated organizations, or those of the publisher, the editors and the reviewers. Any product that may be evaluated in this article, or claim that may be made by its manufacturer, is not guaranteed or endorsed by the publisher.
Abbreviations
VCRS, Vapour Compression Refrigeration System; PXRD, Powder X-ray Diffraction; FESEM, Field Emission Scanning; HRTEM, High Resolution Transmission Electron Microscopy; EDX, Energy-Dispersive X-ray Spectroscopy; BET, Brunauer-Emmett-Teller; COP -Coefficient of Performance; HFE-7000, 1-methoxyheptafluoropropane; HMI -Human-Machine Interface; TsucSuction Temperature (°C); Tdis, Discharge Temperature (°C); Psuc –, Suction Pressure (kPa); Pdis, Discharge Pressure (kPa); GWP –, Global Warming Potential; TXV –, Thermostatic Expansion Valve;
References
Anthony, A. A., and Krishpersad, M. (2023). Performance assessment of low global warming potential alternative refrigerants. J. Energy Res. Rev. 13 (3), 26–40. doi:10.9734/jenrr/2023/v13i3263
Che, S., Azwadi, N., and Halim, N. F. C. (2020). Nanorefrigerants: a review on thermophysical properties and their heat transfer performance. J. Adv. Res. Appl. Sci. Eng. Technol. 20 (1), 42–50. doi:10.37934/araset.20.1.4250
Ciconkov, R. (2018). Refrigerants: there is still no vision for sustainable solutions. Int. J. Refrig. 86 (February), 441–448. doi:10.1016/j.ijrefrig.2017.12.006
Dilawar, M., and Qayoum, A. (2022). Performance study of aluminium oxide based nanorefrigerant in an air-conditioning system. Res. Eng. Struct. Mater. doi:10.17515/resm2022.459ma0701
Feroskhan, M., Venugopal, T., Mana Almakayeel, N., Yunus Khan, T. M., Alghamdi, S., Ali, S. A., et al. (2022). “Fundamentals, thermophysical properties, and heat transfer characteristics of nanorefrigerants: a review. J. Nanomater. Editor S. J. S. Chelladurai 2022. 1 8618152. doi:10.1155/2022/8618152
Gobane, S., Dama, T., Hasan, N., and Yanmaz, E. (2023). Characterization of copper Oxide–jatropha oil nanofluid as a secondary refrigerant. J. Nanomater. 2023 (April), 1–7. doi:10.1155/2023/7612959
Hu, X., Meng, X., Wei, K., Li, W., and Wu, J. (2015). Compressed liquid viscosity measurements of HFE-7000, HFE-7100, HFE-7200, and HFE-7500 at temperatures from (253 to 373) K and pressures up to 30 MPa. J. Chem. and Eng. Data 60 (12), 3562–3570. doi:10.1021/acs.jced.5b00499
Jyothi Sankar, P. R., Venkatachalapathy, S., and Asirvatham, L. G. (2020). Thermal performance enhancement studies using graphite nanofluid for heat transfer applications. Heat. Transf. 49 (5), 3013–3029. doi:10.1002/htj.21758
Li, S., and Jun, L. (2022). A theoretical comparative study of vapor-compression refrigeration cycle using Al2O3 nanoparticle with Low-GWP refrigerants. Entropy 24 (12), 1820. doi:10.3390/e24121820
Mahbubul, I. M., Saadah, A., Saidur, R., Khairul, M. A., and Kamyar, A. (2015). Thermal performance analysis of Al2O3/R-134a nanorefrigerant. Int. J. Heat Mass Transf. 85 (June), 1034–1040. doi:10.1016/j.ijheatmasstransfer.2015.02.038
Memet, F. (2023). “Theoretical analysis of the performance improvement of a single stage vapour compression refrigeration system when using a nanorefrigerant instead of the pure refrigerant,” in Advanced Topics in Optoelectronics, Microelectronics, and Nanotechnologies XI. Editors M. Vladescu, I. Cristea, and R. D. Tamas, 5. 5. doi:10.1117/12.2642035
Nair, V., Parekh, A. D., and Tailor, P. R. (2020). Performance analysis of Al2O3–R718 nanorefrigerant turbulent flow through a flooded chiller tube: a numerical investigation. J. Braz. Soc. Mech. Sci. Eng. 42 (6), 350. doi:10.1007/s40430-020-02429-9
Ponticorvo, E., Iuliano, M., Cirillo, C., Maiorino, A., Aprea, C., and Sarno, M. (2022). Fouling behavior and dispersion stability of nanoparticle-based refrigeration fluid. Energies 15 (9), 3059. doi:10.3390/en15093059
Rausch, M. H., Lorenz, K., Will, S., Leipertz, A., and Fröba, A. P. (2015). Density, surface tension, and kinematic viscosity of hydrofluoroethers HFE-7000, HFE-7100, HFE-7200, HFE-7300, and HFE-7500. J. Chem. and Eng. Data 60 (12), 3759–3765. doi:10.1021/acs.jced.5b00691
Razak, S., Nawi, M. R. M., Rehim, M. Z. A., Sharif, M. Z., and Azmi, W. H. (2018). Preparation technique of SiO2/HFE-7000 nanorefrigerant. J. Mech. Eng. 5 (Specialissue5), 132–140.
Said, Z., Rahman, S. M. A., Sohail, M. A., Bahman, A. M., Alim, M. A., Shaik, S., et al. (2023). Nano-refrigerants and nano-lubricants in refrigeration: Synthesis, mechanisms, applications, and challenges. Appl. Therm. Eng. 233 (October), 121211. doi:10.1016/j.applthermaleng.2023.121211
Sharma, V., Fricke, B., Cheekatamarla, P., Omar, A., and Baxter, V. (2025). Refrigerants for a sustainable future. Encyclopedia 5 (1), 5. doi:10.3390/encyclopedia5010005
Sikora, M., Bohdal, T., and Formela, K. (2021). Experimental study of HFE 7000 refrigerant condensation in horizontal pipe minichannels. Materials 14 (22), 6886. doi:10.3390/ma14226886
Touaibi, R., and Koten, H. (2021). Energy analysis of vapor compression refrigeration cycle using a new generation refrigerants with low global warming potential. J. Adv. Res. Fluid Mech. Therm. Sci. 87 (2), 106–117. doi:10.37934/arfmts.87.2.106117
Keywords: nanorefrigerant, FESEM, HRTEM, vapour compression refrigeration system, coefficient of performance
Citation: Digra M and Singh J (2025) Synthesis, characterization, and performance evaluation of Al2O3 nanoparticles in HFE7000 refrigerant for domestic refrigeration. Front. Therm. Eng. 5:1682295. doi: 10.3389/fther.2025.1682295
Received: 08 August 2025; Accepted: 29 September 2025;
Published: 10 October 2025.
Edited by:
Ji Hwan Jeong, Pusan National University, Republic of KoreaReviewed by:
Haihui Tan, University of Electronic Science and Technology of China, ChinaHarishchandra Patel, Dr. B. R. Ambedkar National Institute of Technology Jalandhar, India
Copyright © 2025 Digra and Singh. This is an open-access article distributed under the terms of the Creative Commons Attribution License (CC BY). The use, distribution or reproduction in other forums is permitted, provided the original author(s) and the copyright owner(s) are credited and that the original publication in this journal is cited, in accordance with accepted academic practice. No use, distribution or reproduction is permitted which does not comply with these terms.
*Correspondence: Munish Digra, bXVuaXNoZGlncmFAZ21haWwuY29t