Abstract
Aims:
In silico methods provide a resourceful toolbox for new approach methodologies (NAMs). They can revolutionize chemical safety assessment by offering more efficient and human-relevant alternatives to traditional animal testing. In this study, we introduce two Liver Physiological Maps (PMs); comprehensive and machine-readable graphical representations of the intricate mechanisms governing two major liver functions.
Methods:
Two PMs were developed through manual literature curation, integrating data from established pathway resources and domain expert knowledge. Cell-type specificity was validated using Human Protein Atlas datasets. An interactive version is available online for exploration. Cross-comparison analysis with existing Adverse Outcome Pathway (AOP) networks was performed to benchmark physiological coverage and identify knowledge gaps.
Results:
The LiverLipidPM focuses on liver lipid metabolism, detailing pathways involved in fatty acid synthesis, triglycerides, cholesterol metabolism, and lipid catabolism in hepatocytes. And the LiverBilePM represents bile acid biosynthesis and secretion processes, detailing biosynthesis, transport, and secretion processes between hepatocytes and cholangiocytes. Both maps integrate metabolism with signaling pathways and regulatory networks. The interactive maps enable visualization of molecular pathways, linkage to external ontologies, and overlay of experimental data. Comparative analysis revealed unique mechanisms to each map and overlaps with existing AOP networks. Chemical-target queries identified new potential targets in both PMs, which might represent new molecular initiating events for AOP network extension.
Conclusion:
The developed liver PMs serve as valuable resources for hepatology research, with a special focus on hepatotoxicity, supporting the refinement of AOP networks and the development of human-oriented in vitro test batteries for chemical toxicity assessment. These maps provide a foundation for creating computational models and mode-of-action ontologies while potentially extending their utility to systems biology and drug discovery applications.
1 Introduction
The liver is a vital organ responsible for several essential functions in the human body, including metabolism, immunity, digestion, and detoxification of xenobiotics (Chiang, 2013; Boyer, 2013; Alves-Bezerra and Cohen, 2017; Verhoeven et al., 2024). Its unique dual blood supply from the portal vein and the hepatic artery allows it to interact with the endocrine and gastrointestinal systems, supporting several metabolic functions such as lipid metabolism. Additionally, the liver plays a crucial role in bile acid biosynthesis and secretion, which are vital for preserving the body’s homeostasis. Exposure to toxic substances can result in liver injury, including cholestasis, steatosis, fibrosis, and cancer (Gijbels and Vinken, 2017; Mellor, Steinmetz, and Cronin, 2016). Therefore, comprehensive understanding of the mechanisms that drive human liver functions is critical for advancing mechanistic-based risk assessment in toxicology. This knowledge can pave the way for developing more precise and human-centered approaches for identifying and evaluating chemical hazards and risks.
New approach methodologies (NAMs) for next generation risk assessment combine human-oriented in vitro and in silico methods, including artificial intelligence (AI) tools and mechanistic models, to unravel mechanisms of toxicity (Vinken et al., 2021). In this context, the Physiological Maps (PMs) framework provides the blueprint for molecular mechanistic understanding of toxicity processes, linking to specific disease mechanisms summarized into qualitative and quantitative adverse outcome pathway (AOP) networks, and serving as a biological foundation for the development of mode-of-action ontologies (Desprez et al., 2019). PMs are standardized and machine-readable graphical representations of molecular and cellular processes associated with specific cell and/or organ functions, including homeostatic processes (Staumont et al., 2025). Their development process is highly inspired by the Disease Maps (DMs) project (Mazein et al., 2018; Ostaszewski et al., 2019). While DMs mostly focus on representing disease mechanisms, PMs depict undisturbed physiology. They act as a knowledge repository that integrates relationships curated from a range of sources, including the literature and open access resources mapping pathways - such as Reactome (Milacic et al., 2024), KEGG (Kanehisa et al., 2023), Wikipathways (Agrawal et al., 2024) and DMs modules (Fujita et al., 2014; Ostaszewski et al., 2021; Serhan et al., 2020). Moreover, PMs are curated for cell- and/or organ-specific scenarios. Like DMs, PMs are dynamic tools where new knowledge is seamlessly integrated, resulting in the continuous generation of updated versions through a community-based effort. They are machine-readable, as they rely on a standardized Systems Biology Graphical Notation (SBGN) (Novère et al., 2009) and can therefore be stored in different systems biology file formats (e.g., SBML, GPML - explained in Box 1 - and others). Additionally, they are designed in a modular, interoperable, and reusable manner, making them adaptable for various cell-specific contexts, diseases, or physiological conditions and perturbations.
In the present article, we present the development of two PMs of human liver functions: the Liver Lipid Metabolism and the Liver Bile Secretion PMs (LiverLipidPM and LiverBilePM). We also include a reproducible method for AOP benchmarking against undisturbed physiological mechanisms and discuss their potential applications in toxicology and systems medicine.
2 Results and discussion
We developed two PMs, each covering an important liver function whose impairment can lead to the distinct clinical conditions of steatosis and cholestasis. Both liver pathologies can be caused by exogenous substances through various mechanisms.
The LiverLipidPM provides a detailed overview of the pathways involved in lipid metabolism (Figure 1). More specifically, the biological processes involved in the synthesis of fatty acids, triglycerides, and cholesterol, as well as their uptake and export mechanisms that facilitate access to the enzymes required for biotransformation processes. In addition, the map includes pathways related to lipid catabolism through mitochondrial and peroxisomal activities. A dedicated submap illustrates specific mitochondrial functions, such as reactive oxygen species scavenging and oxidative phosphorylation. The map also covers regulatory mechanisms that maintain lipid homeostasis through hormone signaling, transcription factor dynamics, and feedback loops. This PM depicts the complex network of biochemical reactions and molecular interactions occurring within a generic hepatocyte, represented by a single cellular compartment. To increase cell type specificity, the resource includes carefully curated proteins, genes, and ribonucleic acid (RNA) molecules known to be expressed in liver cells, validated against the Human Protein Atlas single cell datasets (Karlsson et al., 2021). This curation process ensures that the visualization accurately reflects the unique molecular landscape of hepatocytes, providing a comprehensive and tissue-specific representation of cellular processes in the liver.
FIGURE 1

The Liver Lipid Metabolism Physiological Map (LiverLipidPM) is focused on lipid metabolism, including transport across hepatocyte membranes, lipid and cholesterol biosynthesis, and fatty acid oxidation. The overview model includes a conceptual illustration of these processes in the hepatocyte, serving as a mini-map to the molecular map. In the figure, we linked the pathways and mechanisms listed in the pathway highlights to the respective regions in which they are represented in the detailed molecular map.
The LiverBilePM provides a detailed overview of the biological pathways involved in the biosynthesis, transport, and secretion of bile acids in the liver and considers the interactive interface between hepatocytes and cholangiocytes through the bile canaliculi (Figure 2). This map also depicts cholesterol biosynthesis and metabolism, leading to bile acid biosynthesis and their subsequent transport across cellular membranes into the canaliculi spaces. It also includes pathways for lipoprotein uptake and efflux, as well as bile acid influx and recycling mechanisms, including the cholehepatic shunt. Besides that, regulatory control mechanisms through hormonal signaling, gene regulatory networks and adaptive tuning are also included. Hepatocytes and cholangiocytes are represented as four main compartments, two for each cell type, and a delimited space between two hepatocytes and two cholangiocytes represents a bile duct and bile canaliculus, respectively. As with the LiverLipidPM, cellular specificity was also taken into consideration, and map entities were curated using the Human Protein Atlas resources for both cell types presented on the LiverBilePM.
FIGURE 2
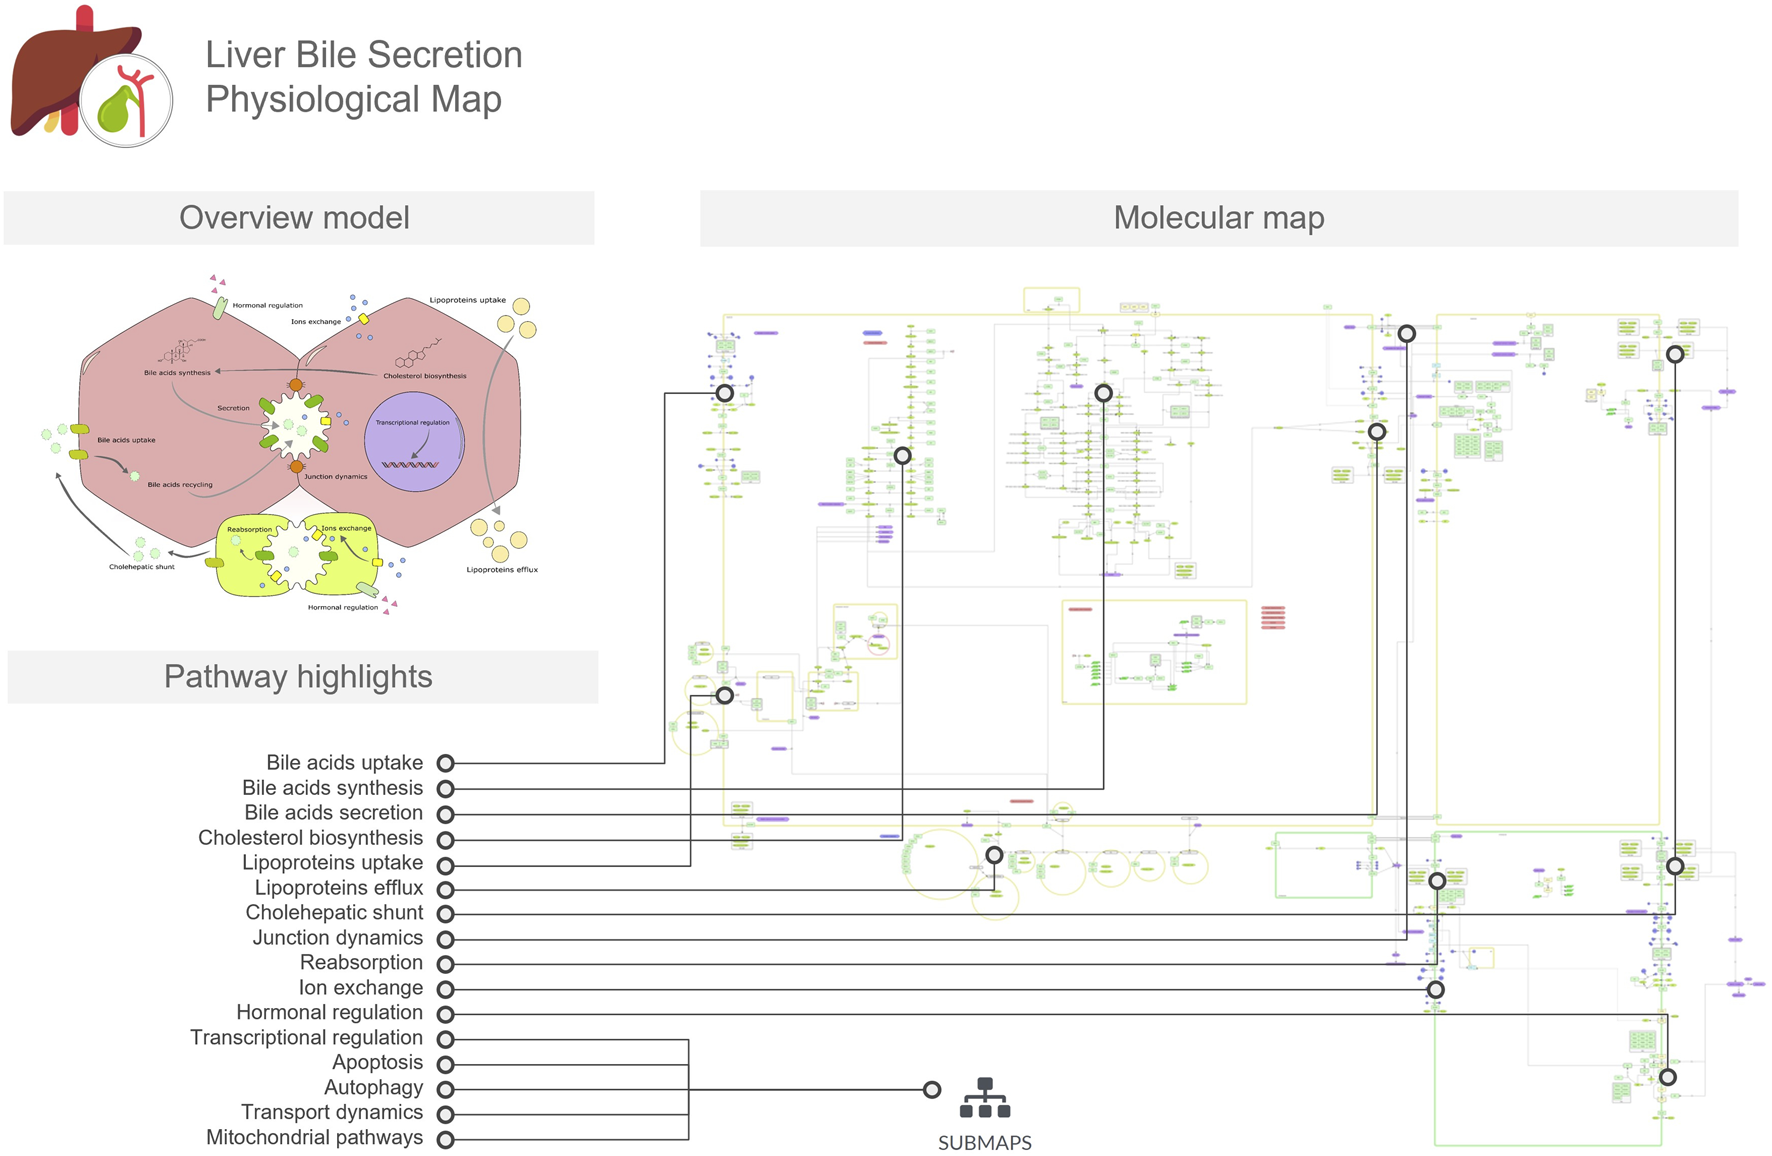
The Liver Bile Acids Secretion Physiological Map (LiverBileAcidsPM) focuses on bile acid biosynthesis in hepatocytes, transport across hepatocyte and cholangiocyte membranes, cholehepatic shunt, cell junction dynamics, and recycling processes. The overview model includes a conceptual illustration of these processes in the hepatocyte, serving as a mini-map to the molecular map. In the figure, we linked the pathways and mechanisms listed in the pathway highlights to the respective regions in which they are represented in the detailed molecular map.
Both maps integrate metabolism with signaling pathways and regulatory networks using a systems biology approach, as depicted in Figure 3A, and they were constructed utilizing manually curated human-relevant data. They both share 550 unique nodes identified by their HGNC approved symbols, which are mainly enriched for Reactome terms related to mitochondrial processes, such as aerobic respiration and respiratory electron transport, complex I biogenesis, and mitochondrial protein degradation, as well as metabolism of steroids and phase I metabolism of compounds. Supplementary Figure S1 shows each map entity frequency, their overlapping entities and the top 5 enriched Reactome terms for each resource. The Supplementary Material contains tables for each enrichment analysis (unique map terms and their overlapping processes). The PMs are designed to guide the development of mechanistic-based in vitro test batteries, in silico methods including AI approaches, and mode-of-action ontologies, all aimed at supporting the mechanistic prediction of chemical toxicities in humans (Vinken et al., 2021; Heusinkveld et al., 2021).
FIGURE 3
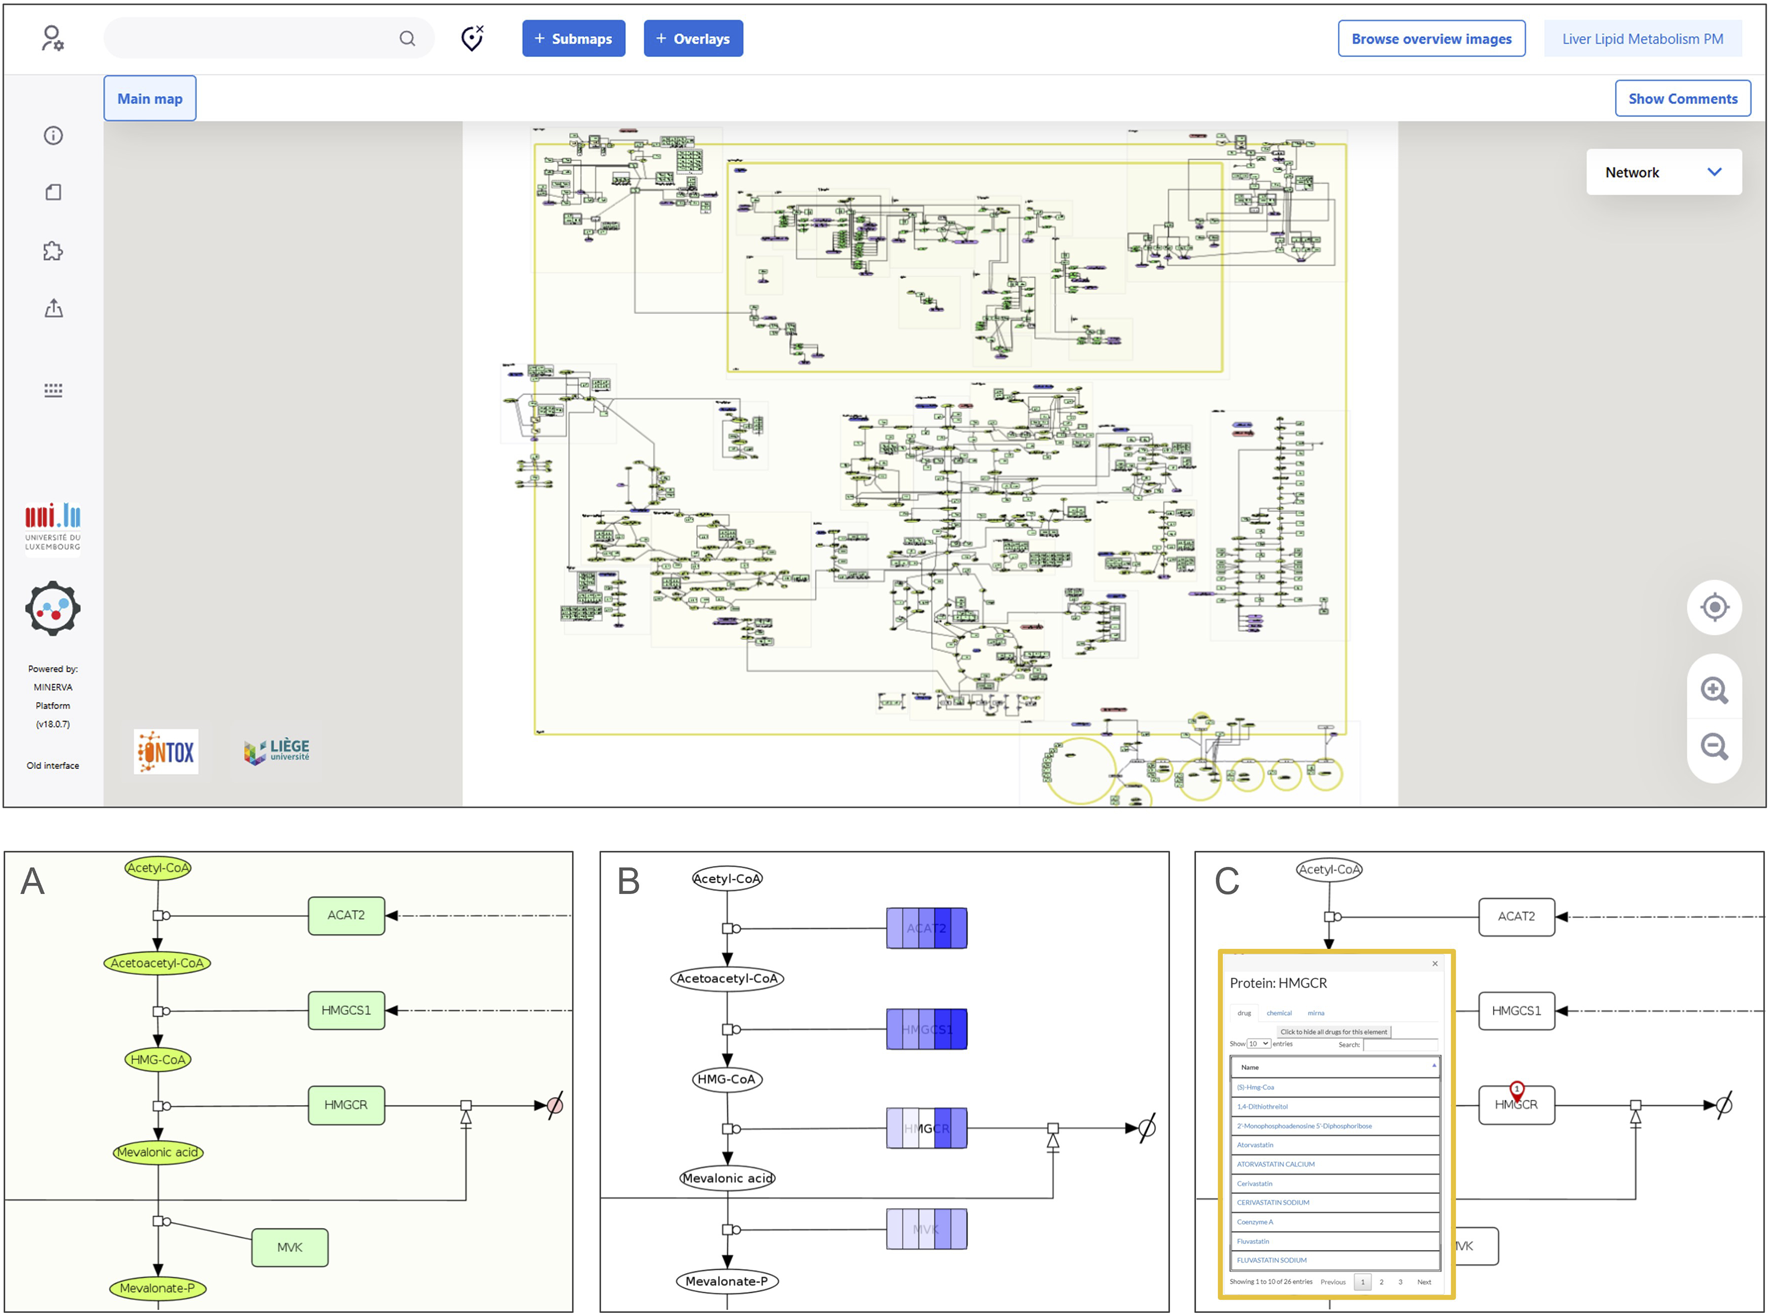
MINERVA platform visualization of a physiological map. The upper panel displays a full map visualization in the MINERVA platform interface. A zoom on a pathway (cholesterol biosynthesis) is depicted in (A), showing the graphical representation of the molecular interactions using the Systems Biology Graphical Notation. Panel (B) shows how data can be visualized: a color gradient is used to represent a range of numerical values associated with each map entity. In this particular example, the intensity of the blue color indicates the level of RNA amounts in hepatocytes (darker shades represent higher levels) from different single-cell data clusters using a dataset from the Human Protein Atlas (proteinatlas.org) (Karlsson et al., 2021). Panel (C) shows the output of a drug query for a specific protein target (HMGCR), which retrieves results from DrugBank (Knox et al., 2024) and ChEMBL (Zdrazil et al., 2024).
Additionally, the liver PMs can be applied to visually overlay omics data onto the pathways (Figure 3B) using, for example, the MINERVA (Molecular Interaction NEtwoRk VisuAlization) platform (Satagopam et al., 2016; Hoksza et al., 2020). This visualization resource allows for the exploration of variability in cell physiology by comparing different conditions side-by-side. For instance, Figure 3B illustrates five distinct clusters of hepatocytes from a Human Protein Atlas single-cell dataset, overlayed on a section of the cholesterol biosynthesis pathway. By leveraging the MINERVA platform features, it is possible to query external ontologies for chemicals and drugs that interact with molecular targets present in the maps (Figure 3C). The interactive version of both liver PMs can be accessed and explored on the following MINERVA platform weblink: https://ontox.elixir-luxembourg.org/minerva/.
Furthermore, PMs serve as repositories of existing biological knowledge, which can be used to support the development of AOPs. Two recent efforts to map AOP networks for steatosis and cholestasis highlight how toxicity mechanisms interact at a higher mechanistic level (Van Ertvelde et al., 2023; Verhoeven et al., 2024). By providing a high-resolution molecular description of these mechanisms, PMs are valuable for benchmarking AOP network coverage of biological processes and identifying new molecular initiating event targets that lead to pathway perturbations and downstream toxicological key events up to organ phenotypic alterations. The cross-comparison analysis between each AOP network with their related PM (Steatosis AOP network vs. LiverLipidPM and Cholestasis AOP network vs. LiverBilePM) revealed a small overlapping rate (10.1% and 9.5% respectively for each comparison). Reactome enrichment for each specific gene list (unique for PMs, unique for AOP networks and their overlaps) revealed their related mechanisms (Supplementary Material), which are mostly related to mitochondrial processes, highlighting the central role of this organelle in both steatosis and cholestasis. In addition, a chemical-target search by querying DrugBank (Knox et al., 2024) and ChEMBL (Zdrazil et al., 2024) databases via the MINERVA platform for targets present uniquely in the physiological maps, but not currently present in the AOP networks, found new 248 targets in the LiverLipidPM (with 898 interacting compounds) and 159 targets in the LiverBilePM (with 284 interacting compounds). These target lists are a starting point for exploration in order to increase the AOP network coverage for other possible molecular initiating events that could lead to both adverse outcomes. Moreover, this type of analysis facilitates hypothesis generation for new AOPs, by highlighting possible new mechanisms, AOP network – and PMs – gaps, and contributing to their refinement, expansion, and validation of AOPs, AOP networks and the maps. Finally, they can also be used as a basis for developing in silico models that address specific questions, as demonstrated by the DMs community (Niarakis et al., 2024).
PMs are aligned with the FAIR principles of Findability, Accessibility, Interoperability, and Reusability (Wilkinson et al., 2016) and present a unique identifier upon storage in BioStudies (Sarkans et al., 2018) for each released version (https://www.ebi.ac.uk/biostudies/studies?query=ontox+physiological+map). They are open-source, publicly accessible, and completely reusable, either in their entirety or as adaptable modules. The MIRIAM (Minimal Information Requested In the Annotation of biochemical Models) annotations (Juty, Le Novere, and Laibe, 2012) enhance the link between PMs and external databases for each node in the network. By incorporating annotated literature and pathway resources into the edges of the map, it enhances confidence and traceability in the information being presented. This ultimately increases the overall transparency of the data. The accessibility and reusability of these PMs promote collaboration and knowledge sharing within the scientific community, fostering advancements in curation efforts to expand these resources.
2.1 Challenges and future directions
The Liver PMs, while extensive, do not capture all known molecular processes related to the liver functions. This limitation stems from the manual curation process, which, despite expert involvement, is inherently constrained by time and resources. To enhance these maps, we plan to explore AI-assisted systematic review methods (Verhoeven et al., 2024; Van Ertvelde et al., 2023; Bozada et al., 2021) in the literature selection phase, and text mining and natural language processing techniques in the curation phase (Corradi et al., 2022; Bachman, Gyori, and Sorger, 2023). While AI-driven data extraction from text still faces challenges, such as avoiding AI-generated hallucinations, this level of automation can complement manual validation efforts.
By utilizing large-scale data analysis and machine learning techniques, we can discover novel molecular relationships and expand the resource’s detail and coverage, with the goal of more accurately describing human physiology. Examining differentially expressed genes across variations in standard physiological conditions (e.g., gender, age, populations, genotypic variations) can help to illuminate the mechanistic differences leading to diverse outcomes upon therapy administration or chemical exposure. Additionally, data-driven approaches for reconstructing mechanistic pathways (Miagoux et al., 2021) can help to address gaps in our understanding of human physiology.
To support research into chemical-induced toxicity endpoints, both PMs were specifically developed as tools fit for this purpose. However, the fact that they are modular and interoperable makes them valuable assets for the broader hepatology community, extending their usefulness beyond the scope of toxicology.
3 Conclusion
The Liver PMs were primarily designed to serve as a valuable resource for toxicology research. They were built to guide the refinement of AOP networks, enhance our understanding of human physiological mechanisms, and support the establishment of human-oriented in silico and in vitro test batteries for chemical toxicity assessment. Additionally, these maps were also intended to provide a rationale for creating dynamic computational models and to lay the groundwork for mode-of-action ontologies and mechanistic AI tools in toxicology. Beyond their initial focus, the Liver PMs may also be applicable to systems biology and drug discovery. As research progresses, these maps could become valuable in various aspects of pharmaceutical development, including drug repurposing efforts.
4 Methods
The establishment of the PMs involves several steps: literature selection and curation, overview model representation, pathway resource screening, extraction of molecular relationships, nomenclature standardization, cell type curation, network diagramming, and expert review. Figure 4 highlights the entire workflow, detailing the key resources used in each phase. Methods for the PMs and AOP network comparison and overlay preparation, as well as a detailed description for the PMs cross-comparison analysis can be found in the Supplementary Material.
FIGURE 4
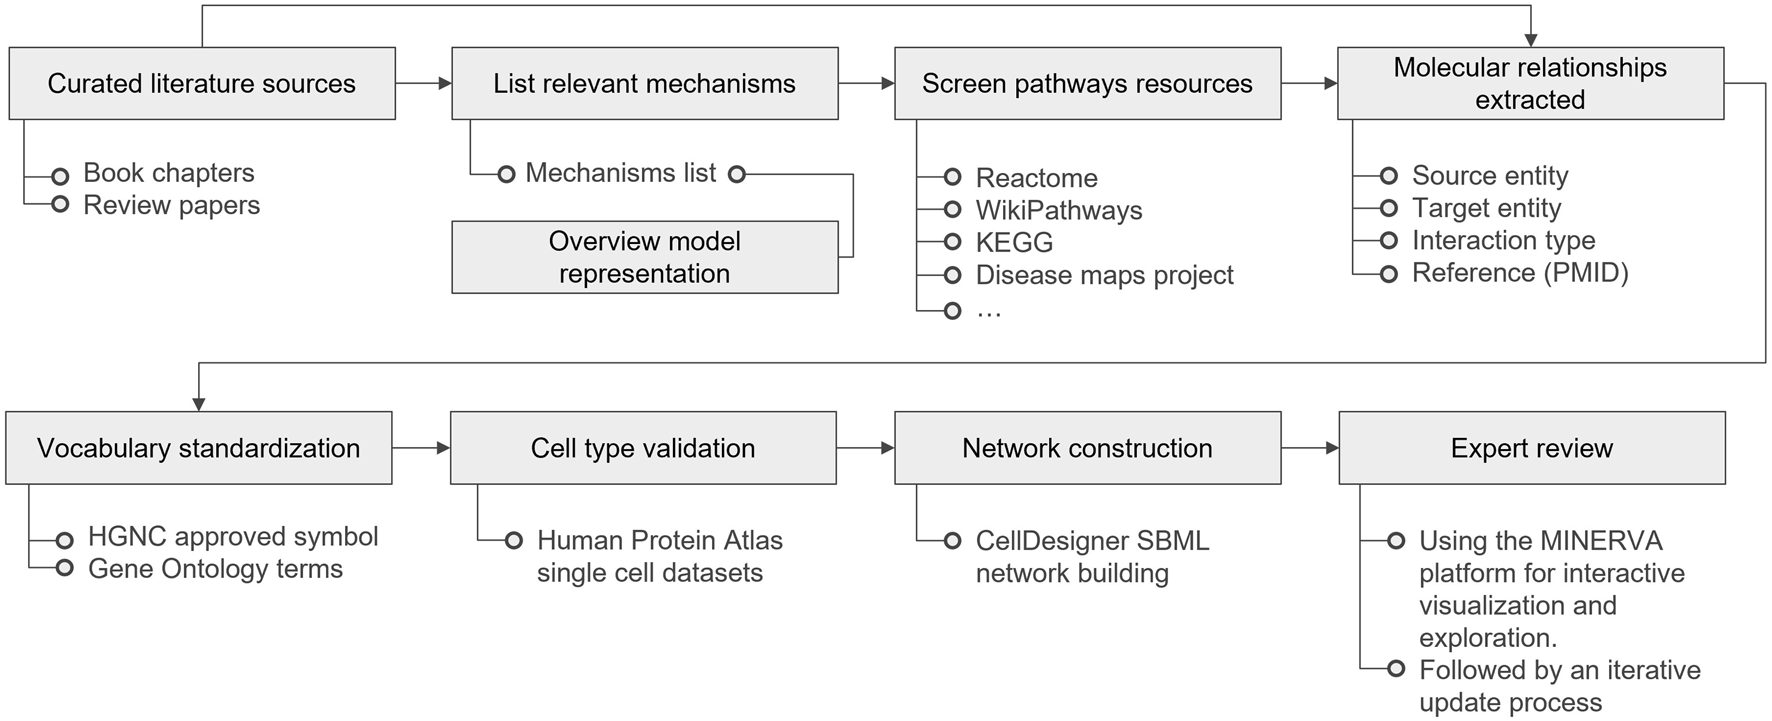
Physiological Maps curation workflow, from literature curation to expert review. KEGG stands for Kyoto Encyclopedia of Genes and Genomes; PMID for PubMed Identifier; HGNC for HUGO (Human Genome Organization) Gene Nomenclature Committee; SBML for Systems Biology Graphical Notation; and MINERVA for Molecular Interaction NEtwoRk VisuAlization.
4.1 Data curation
To build the PMs, domain experts reviewed relevant literature, encompassing review papers and book chapters. The initial list of selected literature is included in the references of the maps planning documents (Supplementary Material). Mechanisms identified in the selected literature were compiled into a list, and key terms from this list were incorporated into an overview model (Supplementary Material). Pathways from established resources such as Reactome (Gillespie et al., 2022), KEGG (Kanehisa et al., 2023), Wikipathways (Martens et al., 2021) and DMs reusable modules (Fujita et al., 2014; Ostaszewski et al., 2021; Serhan et al., 2020) were screened for relevance, and pertinent models were extracted for further refinement and inclusion in the PMs. Different sources for each mechanisms represented are listed in each map table of contents (Supplementary Material). These sources served as the foundation for constructing the molecular diagrams. The process involved identifying molecular interactions within normal physiological processes, followed by extracting and detailing the causal relationships among them. Vocabulary was standardized using symbols approved by the HUGO (Human Genome Organization) Gene Nomenclature Committee (HGNC) (Seal et al., 2023) for genes, RNAs, and proteins, and Gene Ontology (The Gene Ontology Consortium et al., 2023) Biological Function terms for phenotypes where relevant. For cell type validation of specific isoforms of proteins, we used a single cell transcriptomic consensus dataset from the Human Protein Atlas - proteinatlas.org (Karlsson et al., 2021) (downloaded from https://www.proteinatlas.org/download/tsv/normal_ihc_cell_types.tsv.zip) to curate pathways relevant to a specific cell-type.
4.2 Graphical representation
The SBGN (Novère et al., 2009) Process Description (PD) language (Rougny et al., 2019) was the first choice of standard for pathway representation due to its ability to provide a high level of granularity, mechanistic insights, and a clear sequence of events. In instances where available information was sparse or insufficiently detailed for a full PD representation, a pragmatic approach was adopted. This consisted of combining SBGN Activity Flow (Mi et al., 2015) modules into the PD representation. This allowed for maintaining a balance between human readability and the need for flexibility when applying different analysis pipelines. The pathways and processes derived from literature or other pathway databases were represented manually in CellDesigner. When CellDesigner .XML files were available from other mapping projects, the pathways were directly reused and curated for relevance to the liver cells context.
4.3 Diagram editor and visualization platform
The maps were created and edited using the CellDesigner pathway editor (Funahashi et al., 2008). Graphical representation and literature annotation was done manually. For node annotation, we relied on HGNC approved symbol naming of the nodes and automated annotations using the MINERVA platform (Gawron et al., 2016; Hoksza et al., 2020) HGNC annotator, which annotates nodes with their respective Ensembl, Entrez gene, HGNC, RefSeq, UniProt identifiers. For the domain expert review phase, the MINERVA platform was employed. MINERVA’s well-structured commenting system, along with its map visualization and exploration capacities powered by the Google Maps API, facilitated the review process. To facilitate the use of MINERVA and to help the users to take full advantage of the platform, we have also prepared a video tutorial available at https://www.youtube.com/watch?v=CKKpAvSq560. A comprehensive user’s manual can be found in the developer’s webpage via https://minerva.pages.uni.lu/doc/manuals/.
4.4 Validation and standardization
The liver PMs’ validation strategy extends beyond traditional data curation approaches by integrating multiple validation layers. Each molecular component underwent cell-type specificity validation of gene expression and protein isoforms using the Human Protein Atlas resources (proteinatlas.org) (Karlsson et al., 2021), ensuring the biological relevance of the represented pathways for both hepatocytes and cholangiocytes. The SBGN (Novère et al., 2009) Process Description notation was selectively applied to pathways with strong mechanistic evidence, while Activity Flow representation was chosen for emerging mechanisms where evidence is still accumulating and in strategic decisions to enhance graphical representation by reducing diagram overload. This dual notation approach provides clear confidence indicators for map users, as Process Description sections reflect higher confidence in the mechanistic details. Notably, the iterative expert review process through MINERVA enabled the identification and resolution of potential inconsistencies between different pathway resources, particularly in cases where the sources (e.g., literature, Reactome, KEGG, WikiPathways and others) presented varying mechanistic details. When such discrepancies were encountered, additional literature validation was performed to determine the most accurate representation.
4.5 Documentation
To harness the full potential of PMs, a collaborative effort between domain experts and the curation team was undertaken to annotate and document the maps. This process involved the development of curation guidelines (Ladeira et al., 2024), coupled with comprehensive planning documents, as well as detailed tables of contents (Supplementary Material, and also available via https://github.com/ontox-maps/guides_and_documentation). We followed a comprehensive guide from the DMs community (Mazein et al., 2023), reinforcing adherence to the FAIR principles (Wilkinson et al., 2016). Metadata, including literature references, pathway resource references, and identifiers, can be found annotated directly into the SBML files of the maps. This approach not only facilitates the use of PMs within the toxicology ecosystem but also ensures that other researchers can seamlessly integrate and utilize these resources.
4.6 Physiological maps cross-comparison
Comparative analysis of the LiverLipidPM and LiverBilePM was performed to characterize their molecular composition and functional relationships. Molecular components were extracted from both maps using the minervar R package (version 0.8.15) (Gawron et al., 2023). Gene, protein, and RNA entities (all named with their relative HGNC approved symbol) were filtered and curated to generate gene lists for comparative analysis.
Set operations were applied to identify shared and unique molecular components between maps, with results visualized using Venn diagrams. Functional enrichment analysis was conducted using ReactomePA (Yu and He, 2016) to determine pathway enrichment for shared genes and genes unique to each map. Enrichment analysis results were combined and visualized as comparative bubble plots showing the top 5 enriched pathways for each gene set.
A detailed description of this section can be found in the supplementary text (Supplementary Material) as well as the gene lists and reproducible R scripts.
Box 1
| Resource | Definition/comment |
| New Approach Methodologies (NAMs) | New approach methodologies (NAMs), are non-animal testing methods designed to reduce and replace existing traditional animal-based testing systems. Resource: https://www.oecd.org/chemicalsafety/testing/new-approach-methodologies-in-toxicology.htm |
| Disease Maps | Disease Maps are visual representations of disease mechanisms in a human- and machine-readable way. Each project in the Disease Maps community integrates molecular interactions and pathways involved in a particular pathological scenario. More recently, physiological maps and adverse outcome pathways have also been integrated into the Disease Maps project portfolio. Resource: https://disease-maps.org/ |
| Systems Biology Graphical Notation (SBGN) | Systems Biology Graphical Notation: a standardized graphical representation of biological mechanisms. SBGN is composed of three different types of representations: Activity Flow, Process Description and Entity Relationships. Resource: https://sbgn.github.io/ |
| SBGN Process Description | A type of SBGN representation in which a network is directed, sequential, and mechanistic. It allows an understanding of the temporal aspect of biochemical interactions. Resource: https://sbgn.github.io/specifications |
| SBGN Activity Flow | A type of SBGN representation in which a network is directed and sequential but not mechanistic at the molecular level. It shows the flow of information between biochemical entities, omitting information about how interactions occur, and is particularly convenient for representing the effects of perturbations. Resource: https://sbgn.github.io/specifications |
| HGNC approved symbol | HUGO (Human Genome Organization) Gene Nomenclature Committee: official gene names assigned by experts. Used for consistent gene identification. Resource: https://www.genenames.org/ |
| Gene Ontology (GO) Biological Function | Gene Ontology Biological Function: standardized terms describing gene roles in organisms. Part of a larger system for classifying gene functions. Resource: http://geneontology.org/ |
| Reactome | Reactome is a large database of expert-curated biological pathways and reactions. Provides visualization and analysis tools for these processes Resource: https://reactome.org/ |
| WikiPathways | WikiPathways is a community-curated biological pathway database. Allows researchers to contribute and edit pathway information. Resource: https://www.wikipathways.org/ |
| Kyoto Encyclopedia of Genes and Genomes (KEGG) | Kyoto Encyclopedia of Genes and Genomes is a database of genetic and molecular information, including pathway resources. Focuses on the systemic functions of genes and molecules. Resource: https://www.genome.jp/kegg/ |
| Systems Biology Markup Language (SBML) | Systems Biology Markup Language: standard format for representing biological models in a machine-readable manner. Facilitates the exchange of models between different software tools. Resource: http://sbml.org/ |
| Graphical Pathway Markup Language (GPML) | Graphical Pathway Markup Language: the WikiPathways standard format for representing biological models in a machine-readable manner. Facilitates the exchange of models between different software tools. Resource: https://pathvisio.org/documentation/GPML2021-doc.html |
Concepts and resource definitions.
Statements
Data availability statement
The datasets presented in this study can be found in online repositories. The names of the repository/repositories and accession number(s) can be found below: The dataset is available in the BioStudies database (http://www.ebi.ac.uk/biostudies) under accession numbers S-ONTX35 (LiverBilePM) & S-ONTX36 (LiverLipidPM). All the maps are available at our GitHub organization (https://github.com/ontox-maps) and at the ONTOX MINERVA platform (https://ontox.elixir-luxembourg.org/minerva/), under the license Creative Commons Attribution 4.0 International (CC BY 4.0) License (https://creativecommons.org/licenses/by/4.0/).
Author contributions
LL: Writing – original draft, Data curation, Methodology, Investigation, Conceptualization, Writing – review and editing, Visualization. AV: Writing – original draft, Data curation, Investigation, Visualization, Writing – review and editing. JE: Investigation, Visualization, Data curation, Writing – review and editing. JJ: Data curation, Investigation, Writing – review and editing. AG: Methodology, Data curation, Writing – review and editing. JS-S: Writing – review and editing, Data curation. TV: Data curation, Writing – review and editing. HH: Writing – review and editing, Methodology, Data curation. RJ: Investigation, Writing – review and editing, Data curation. MV: Conceptualization, Resources, Data Curation, Writing – Review and Editing, Supervision, Project administration, Funding acquisition. LG: Project administration, Writing – review and editing, Supervision, Writing – original draft, Funding acquisition, Data curation, Resources, Methodology, Conceptualization. BS: Writing – review and editing, Methodology, Supervision, Writing – original draft, Data curation, Resources, Conceptualization, Project administration.
Funding
The author(s) declare that financial support was received for the research and/or publication of this article. This work was performed in the context of the ONTOX project (https://ontox-project.eu/) which has received funding from the European Union’s Horizon 2020 Research and Innovation programme under grant agreement No 963845. ONTOX is part of the ASPIS project cluster (https://aspis-cluster.eu/). This work also received funding from the European Research Council under the European Union’s Horizon 2020 Framework Program (H2020/2014-2021)/ERC grant agreement No 772418 (INSITE).
Acknowledgments
The authors thank Dr. Marek Ostaszewski for the technical support with the MINERVA platform, the minervar package, and for the insights for map data management and analysis. The authors would also like to express their gratitude for the curation work done by many researchers and biocurators in all databases cited here. Online browsing is supported by the MINERVA team (https://minerva.pages.uni.lu/doc/) at the Bioinformatics Core of the Luxembourg Centre for Systems Biomedicine within the ELIXIR-LU framework (https://elixir-luxembourg.org). Figures were designed using resources from Flaticon.com.
Conflict of interest
The authors declare that the research was conducted in the absence of any commercial or financial relationships that could be construed as a potential conflict of interest.
Authors TV and RJ declared that they were an editorial board member of Frontiers, at the time of submission. This had no impact on the peer review process and the final decision.
Generative AI statement
The author(s) declare that no Generative AI was used in the creation of this manuscript.
Publisher’s note
All claims expressed in this article are solely those of the authors and do not necessarily represent those of their affiliated organizations, or those of the publisher, the editors and the reviewers. Any product that may be evaluated in this article, or claim that may be made by its manufacturer, is not guaranteed or endorsed by the publisher.
Supplementary material
The Supplementary Material for this article can be found online at: https://www.frontiersin.org/articles/10.3389/ftox.2025.1619651/full#supplementary-material
Abbreviations
AI, Artificial Intelligence; AOP, Adverse Outcome Pathway; DM, Disease Map; FAIR, Findable, Accessible, Interoperable, and Reusable; GO, Gene Ontology; GPML, Graphical Pathway Markup Language; HGNC, HUGO Gene Nomenclature Committee; HUGO, Human Genome Organization; KEGG, Kyoto Encyclopedia of Genes and Genomes; LiverBilePM, Liver Bile Secretion Physiological Map; LiverLipidPM, Liver Lipid Metabolism Physiological Map; MINERVA, Molecular Interaction NEtwoRk VisuAlization; MIRIAM, Minimal Information Requested In the Annotation of biochemical Models; NAM, New Approach Methodology; ONTOX, Ontology-driven and artificial intelligence-based repeated dose toxicity testing of chemicals for next generation risk assessment; PD, Process Description; PM, Physiological Map; PMID, PubMed Identifier; RNA, Ribonucleic Acid; SBGN, Systems Biology Graphical Notation; SBML, Systems Biology Markup Language.
References
1
Agrawal A. Balcı H. Hanspers K. Coort S. L. Martens M. Slenter D. N. et al (2024). WikiPathways 2024: next generation pathway database. Nucleic Acids Res.52 (D1), D679–D689. 10.1093/nar/gkad960
2
Alves-Bezerra M. Cohen D. E. (2017). Triglyceride metabolism in the liver. Compr. Physiol.8 (1), 1–8. 10.1002/cphy.c170012
3
Bachman J. A. Gyori B. M. Sorger P. K. (2023). Automated assembly of molecular mechanisms at scale from text mining and curated databases. Mol. Syst. Biol.19 (5), e11325. 10.15252/msb.202211325
4
Boyer J. L. (2013). “Bile Formation and secretion,” in Comprehensive physiology. Editor TerjungR.1st ed. (Wiley), 1035–1078. 10.1002/cphy.c120027
5
Bozada T. Borden J. Workman J. Del Cid M. Malinowski J. Luechtefeld T. (2021). Sysrev: a FAIR platform for data curation and systematic evidence review. Front. Artif. Intell.4 (August), 685298. 10.3389/frai.2021.685298
6
Chiang J. Y. L. (2013). “Bile acid metabolism and signaling,” in Comprehensive physiology. Editor TerjungR.1st ed. (Wiley), 1191–1212. 10.1002/cphy.c120023
7
Corradi M. P. F. De Haan A. M. Staumont B. Piersma A. H. Geris L. Pieters R. H. H. et al (2022). Natural Language processing in toxicology: delineating adverse outcome pathways and guiding the application of new approach methodologies. Biomaterials Biosyst.7 (August), 100061. 10.1016/j.bbiosy.2022.100061
8
Desprez B. Birk B. Blaauboer B. Boobis A. Carmichael P. Cronin M. T. D. et al (2019). A mode-of-action Ontology model for safety evaluation of chemicals: outcome of a series of workshops on repeated dose toxicity. Toxicol. In Vitro59 (September), 44–50. 10.1016/j.tiv.2019.04.005
9
Fujita K. A. Ostaszewski M. Matsuoka Y. Ghosh S. Glaab E. Trefois C. et al (2014). Integrating pathways of Parkinson’s disease in a molecular interaction map. Mol. Neurobiol.49 (1), 88–102. 10.1007/s12035-013-8489-4
10
Funahashi A. Matsuoka Y. Jouraku A. Morohashi M. Kikuchi N. Kitano H. (2008). CellDesigner 3.5: a versatile modeling tool for biochemical networks. Proc. IEEE96 (8), 1254–1265. 10.1109/JPROC.2008.925458
11
Gawron P. Ostaszewski M. Satagopam V. Gebel S. Mazein A. Kuzma M. et al (2016). MINERVA—a platform for visualization and curation of molecular interaction networks. Npj Syst. Biol. Appl.2 (1), 16020. 10.1038/npjsba.2016.20
12
Gawron P. Smula E. Schneider R. Ostaszewski M. (2023). “Exploration and comparison of molecular mechanisms across diseases using MINERVA Net.”Protein Science, 32 (2), e4565. 10.1002/pro.4565
13
Gijbels E. Vinken M. (2017). An update on adverse outcome pathways leading to liver injury. Appl. Vitro Toxicol.3 (4), 283–285. 10.1089/aivt.2017.0027
14
Gillespie M. Jassal B. Stephan R. Milacic M. Rothfels K. Senff-Ribeiro A. et al (2022). The reactome pathway knowledgebase 2022. Nucleic Acids Res.50 (D1), D687–D692. 10.1093/nar/gkab1028
15
Heusinkveld H. J. Staal Y. C. M. Baker N. C. George D. Knudsen T. B. Piersma A. (2021). An Ontology for developmental processes and toxicities of neural tube closure. Reprod. Toxicol.99 (January), 160–167. 10.1016/j.reprotox.2020.09.002
16
Hoksza D. Gawron P. Ostaszewski M. Hasenauer J. Schneider R. (2020). Closing the gap between formats for storing layout information in systems biology. Briefings Bioinforma.21 (4), 1249–1260. 10.1093/bib/bbz067
17
Juty N. Le Novere N. Laibe C. (2012). Identifiers.Org and MIRIAM registry: community resources to provide persistent identification. Nucleic Acids Res.40 (D1), D580–D586. 10.1093/nar/gkr1097
18
Kanehisa M. Furumichi M. Sato Y. Kawashima M. Ishiguro-Watanabe M. (2023). KEGG for taxonomy-based analysis of pathways and Genomes. Nucleic Acids Res.51 (D1), D587–D592. 10.1093/nar/gkac963
19
Karlsson M. Zhang C. Méar L. Wen Z. Digre A. Katona B. et al (2021). A single–cell type transcriptomics map of human tissues. Sci. Adv.7 (31), eabh2169. 10.1126/sciadv.abh2169
20
Knox C. Wilson M. Klinger C. M. Franklin M. Oler E. Wilson A. et al (2024). DrugBank 6.0: the DrugBank knowledgebase for 2024. Nucleic Acids Res.52 (D1), D1265–D1275. 10.1093/nar/gkad976
21
Ladeira L. Staumont B. Gamba A. Geris L. (2024). ONTOX’s physiological maps curation guidelines. Zenodo. 10.5281/zenodo.13239453
22
Martens M. Ammar A. Riutta A. Waagmeester A. Slenter D. N. Hanspers K. et al (2021). WikiPathways: connecting communities. Nucleic Acids Res.49 (D1), D613–D621. 10.1093/nar/gkaa1024
23
Mazein A. Acencio M. L. Balaur I. Rougny A. Welter D. Niarakis A. et al (2023). A guide for developing comprehensive systems biology maps of disease mechanisms: planning, construction and maintenance. Front. Bioinforma.3 (June), 1197310. 10.3389/fbinf.2023.1197310
24
Mazein A. Ostaszewski M. Kuperstein I. Watterson S. Le Novère N. Lefaudeux D. et al (2018). Systems medicine disease maps: community-driven comprehensive representation of disease mechanisms. Npj Syst. Biol. Appl.4 (1), 21. 10.1038/s41540-018-0059-y
25
Mellor C. L. Steinmetz F. P. Cronin M. T. D. (2016). The identification of nuclear receptors associated with hepatic steatosis to develop and extend adverse outcome pathways. Crit. Rev. Toxicol.46 (2), 138–152. 10.3109/10408444.2015.1089471
26
Mi H. Schreiber F. Moodie S. Czauderna T. Demir E. Haw R. et al (2015). Systems biology graphical notation: activity Flow language level 1 version 1.2. J. Integr. Bioinform.12, 265. 10.2390/BIECOLL-JIB-2015-265
27
Miagoux Q. Singh V. De Mézquita D. Chaudru V. Mohamed E. Petit-Teixeira E. et al (2021). Inference of an integrative, executable network for rheumatoid arthritis combining data-driven machine learning approaches and a state-of-the-art mechanistic disease map. J. Personalized Med.11 (8), 785. 10.3390/jpm11080785
28
Milacic M. Beavers D. Conley P. Gong C. Gillespie M. Griss J. et al (2024). The reactome pathway knowledgebase 2024. Nucleic Acids Res.52 (D1), D672–D678. 10.1093/nar/gkad1025
29
Niarakis A. Ostaszewski M. Mazein A. Kuperstein I. Kutmon M. Gillespie M. E. et al (2024). Drug-target identification in COVID-19 disease mechanisms using computational systems biology approaches. Front. Immunol.14 (February), 1282859. 10.3389/fimmu.2023.1282859
30
Novère N.L. Hucka M. Mi H. Moodie S. Schreiber F. Sorokin A. et al (2009). The systems biology graphical notation. Nat. Biotechnol.27 (8), 735–741. 10.1038/nbt.1558
31
Ostaszewski M. Gebel S. Kuperstein I. Mazein A. Zinovyev A. Dogrusoz U. et al (2019). Community-driven roadmap for integrated disease maps. Briefings Bioinforma.20 (2), 659–670. 10.1093/bib/bby024
32
Ostaszewski M. Niarakis A. Mazein A. Kuperstein I. Phair R. Orta-Resendiz A. et al (2021). COVID19 disease map, a computational knowledge repository of virus-host interaction mechanisms. Mol. Syst. Biol.17 (10), e10387. 10.15252/msb.202110387
33
Rougny A. Touré V. Moodie S. Balaur I. Czauderna T. Hanna B. et al (2019). Systems biology graphical notation: process description language level 1 version 2.0. J. Integr. Bioinforma.16 (2), 20190022. 10.1515/jib-2019-0022
34
Sarkans U. Gostev M. Athar A. Behrangi E. Melnichuk O. Ali A. et al (2018). The BioStudies database—one stop shop for all data supporting a life Sciences study. Nucleic Acids Res.46 (D1), D1266–D1270. 10.1093/nar/gkx965
35
Satagopam V. Gu W. Eifes S. Gawron P. Ostaszewski M. Gebel S. et al (2016). Integration and visualization of translational medicine data for better understanding of human diseases. Big Data4 (2), 97–108. 10.1089/big.2015.0057
36
Seal R. L. Braschi B. Gray K. Jones T. E. M. Tweedie S. Haim-Vilmovsky L. et al (2023). Genenames.Org: the HGNC resources in 2023. Nucleic Acids Res.51 (D1), D1003–D1009. 10.1093/nar/gkac888
37
Serhan C. N. Gupta S. K. Perretti M. Godson C. Brennan E. Li Y. et al (2020). The Atlas of inflammation resolution (AIR). Mol. Aspects Med.74 (August), 100894. 10.1016/j.mam.2020.100894
38
Staumont B. Ladeira L. Gamba A. Heusinkveld H. J. Piersma A. Masereeuw R. et al (2025). Mapping physiology: a systems biology approach for the development of alternative methods in toxicology. ALTEX42, 301–307. 10.14573/altex.2412241
39
The Gene Ontology Consortium Aleksander S. A. Balhoff J. Carbon S. Cherry J. M. Drabkin H. J. et al (2023). The gene Ontology knowledgebase in 2023. GENETICS, 224 (1). iyad031. 10.1093/genetics/iyad031
40
Van Ertvelde J. Verhoeven A. Maerten A. Cooreman A. Rodrigues B. D. S. Sanz-Serrano J. et al (2023). Optimization of an adverse outcome pathway network on chemical-induced cholestasis using an artificial intelligence-assisted data collection and confidence level quantification approach. J. Biomed. Inf.145 (September), 104465. 10.1016/j.jbi.2023.104465
41
Verhoeven A. Van Ertvelde J. Boeckmans J. Gatzios A. Jover R. Lindeman B. et al (2024). A quantitative weight-of-evidence method for confidence assessment of adverse outcome pathway networks: a case study on chemical-induced liver steatosis. Toxicology505 (June), 153814. 10.1016/j.tox.2024.153814
42
Vinken M. Benfenati E. Busquet F. Castell J. Clevert D.-A. de Kok T. M. et al (2021). Safer chemicals using less animals: kick-off of the European ONTOX project. Toxicology458 (June), 152846. 10.1016/j.tox.2021.152846
43
Wilkinson M. D. Dumontier M. Jan Aalbersberg I. J. Appleton G. Axton M. Baak A. et al (2016). The FAIR guiding principles for scientific data management and stewardship. Sci. Data3 (1), 160018. 10.1038/sdata.2016.18
44
Yu G. He Q.-Y. (2016). ReactomePA: an R/Bioconductor package for reactome pathway analysis and visualization. Mol. Biosyst.12 (2), 477–479. 10.1039/C5MB00663E
45
Zdrazil B. Felix E. Hunter F. Manners E. J. Blackshaw J. Corbett S. et al (2024). The ChEMBL database in 2023: a drug discovery platform spanning multiple bioactivity data types and time periods. Nucleic Acids Res.52 (D1), D1180–D1192. 10.1093/nar/gkad1004
Summary
Keywords
physiological maps, toxicology, systems biology, hepatology, new approach methodologies
Citation
Ladeira L, Verhoeven A, van Ertvelde J, Jiang J, Gamba A, Sanz-Serrano J, Vanhaecke T, Heusinkveld HJ, Jover R, Vinken M, Geris L and Staumont B (2025) Unlocking liver physiology: comprehensive pathway maps for mechanistic understanding. Front. Toxicol. 7:1619651. doi: 10.3389/ftox.2025.1619651
Received
28 April 2025
Accepted
18 June 2025
Published
07 July 2025
Volume
7 - 2025
Edited by
Scott Auerbach, National Institute of Environmental Health Sciences (NIH), United States
Reviewed by
Venkat R. P., Biotechnology HPC Software Applications Institute (BHSAI), United States
Stephen Ferguson, National Institute of Environmental Health Sciences (NIH), United States
Updates
Copyright
© 2025 Ladeira, Verhoeven, van Ertvelde, Jiang, Gamba, Sanz-Serrano, Vanhaecke, Heusinkveld, Jover, Vinken, Geris and Staumont.
This is an open-access article distributed under the terms of the Creative Commons Attribution License (CC BY). The use, distribution or reproduction in other forums is permitted, provided the original author(s) and the copyright owner(s) are credited and that the original publication in this journal is cited, in accordance with accepted academic practice. No use, distribution or reproduction is permitted which does not comply with these terms.
*Correspondence: Luiz Ladeira, lcladeira@uliege.be; Liesbet Geris, liesbet.geris@uliege.be; Bernard Staumont, b.staumont@uliege.be
†These authors share first authorship
‡These authors share senior authorship
Disclaimer
All claims expressed in this article are solely those of the authors and do not necessarily represent those of their affiliated organizations, or those of the publisher, the editors and the reviewers. Any product that may be evaluated in this article or claim that may be made by its manufacturer is not guaranteed or endorsed by the publisher.