 María Eugenia Ferrero
 Ricardo Villalba
- Instituto Argentino de Nivología, Glaciología y Ciencias Ambientales, Consejo Nacional de Investigaciones Científicas y Técnicas, Mendoza, Argentina
Recent studies documenting climate variability in South America have provided valuable information for understanding current and past dynamics of the climate system. Long meteorological records represent an essential tool to properly characterize climate fluctuations from decadal to multi-decadal scales. Unfortunately, the scarcity of continuous and homogeneous instrumental records is a major constraint to determine long-term variations in South America. Our knowledge of the forcings modulating the hydrological variability in mountains is still limited, despite their importance as freshwater sources for people living in the adjacent piedmonts and lowlands. The objective of this work is to determine the spatial–temporal variability of precipitation in the humid subtropical Andes and the Chaco region in North Western Argentina (NWA). Thirty-four rainfall records covering the common period 1934–1990, partially updated to 2016, were used to extend and identify the dominant patterns of seasonal to annual hydroclimatic variability based on principal components analysis. Intensity and frequency of droughts and pluvials (<5th and >95th percentiles, respectively) were determined for the dominant patterns of variability. Our results show a positive trend in precipitation since 1970s in all temporal patterns and sub-regions. In addition, precipitation variability (both positive and negative extremes) increases during these last decades. Correlation analysis with sea-surface temperatures and wind anomalies during summer, reveal Amazon moisture sources and large-scale oceanic controls on NWA precipitation. The extended precipitation series shows that the frequency of pluvials has increased since the 1970s interrupted by few extreme droughts. This record can be considered representative of precipitation variations across NWA, including different environments in the Chaco, sub-Andes, and Puna.
Introduction
During the last decades, studies focused on documenting the climate variability along South America have provided valuable information to understand current and past dynamics of the climatic system (i.e., Vera et al., 2006; Aceituno et al., 2009; Garreaud et al., 2009; Neukom et al., 2009, 2010; Vuille et al., 2012). In this context, extensive instrumental records represent an essential tool to properly characterize the climate fluctuations on interannual to multi-decadal scales. Nevertheless, the scarcity, and in some cases the total absence of meteorological records in montane environments has prevented a comprehensive view of long-term climate variability in subtropical South America. This feature contrasts with the fact that these subtropical areas, and particularly the northwestern Argentina (NWA hereafter), contains some of the most important palaeoclimatic records in South America derived from tree rings (Boninsegna et al., 2009; Ferrero, 2011), lake sediments (Piovano et al., 2014), and documentary data (Neukom et al., 2009).
The mountain ecosystems of the subtropical/tropical Andes in South America are highly sensitive to changes in rainfall patterns (Diaz et al., 2003; Vuille et al., 2008; La Sorte and Jetz, 2010; Carilla et al., 2013). Recent studies have been conducted to better understand the effects of the climate variations on montane ecosystems in South America (Báez et al., 2015; Fadrique et al., 2018). In South America, several rivers originate on upper-elevation mountain basins (Viviroli and Weingartner, 2004) and are vital to natural and human-cultivated ecosystems in the mountain valleys and adjacent lowlands. This is particularly the case in arid and semiarid regions along the Andes, where water from mountains contributes between 50 and 90% to total streamflow (Messerli et al., 2004). Sparse and topographically biased hydroclimatic records (Briggs and Cogley, 1996) showing large errors in measurements (Sevruk and Kirchhofer, 1992) fail to describe the high-spatial heterogeneity of climatological and hydrological patterns in the mountains. A detailed assessment of the variability affecting mountain hydrology is needed given the importance of mountain as sources of freshwater (Masiokas et al., 2013).
Familiar or extensive agricultural activities, hydropower production, and natural hazards (floods, landslides) are strongly linked to inter-annual or longer hydroclimatic variations. The Andes in NWA comprise a relatively narrow belt (100 km wide) of mountain ranges where the upper basins of major rivers (Pilcomayo, Bermejo, Salado) are located. Discharges from these rivers cross throughout 1,200 km the semiarid lands in the Chaco region to join the major tributaries in La Plata basin. The main rivers in La Plata basin (Paraguay, Paraná, Uruguay) as well as important tributaries (Bermejo, Salado, Iguazú) have increased their mean flows since the mid-1970s, as well as the frequency of extreme discharges events (Barros et al., 2015; Ferrero et al., 2015). This increase up to 20–35% in annual discharges continued during the 1990s with a reduction at the beginning of the 20th century; however, most current river discharges are well-above those recorded before the 1950s. During the 1970–2000 wet period, substantial land-use changes in the Paraná and Paraguay upper basins intensified the extreme discharges (Garcia et al., 2011; Nosetto et al., 2012). Synergistic events of heavy rains have led to landslides in the mountains and downstream inundations, some of which severely affected the cities in NWA (i.e., Tartagal, Salta province; i.e., La Nación, 2009; Página12, 2009). These events have led to severe damages in infrastructure with large societal and economic implications. For instance, natural hazards associated with intense rainfall events in early 2007s in the eastern Central Andes affected more than 133,000 households and resulted in estimated costs of 443 million dollars (Latrubesse and Brea, 2011; Boers et al., 2014).
Most meteorological records in NWA are short, not homogeneous and with many absent data. The longest records come from the most important cities. The National Meteorological Service (SMN) of Argentina has traditionally compiled these records. Unfortunately some of these stations were dismantled; others were affected by the growth of the cities and their subsequent relocation in the city respective airports. On the other hand, the complex mountainous topography in NWA introduces marked gradients in temperature and precipitation and reduces the similarities in climate patterns among relatively nearby stations.
In the present contribution, we compile and analyze the largest climatic databases for long-term precipitation records available for the subtropical Andes and Chaco in NWA. We identify the main spatio-temporal patterns of precipitation variability in the last 100 years, evaluate the most significant dry-moisture intervals, and establish the relationships between subtropical NWA hydroclimate and large-scale climatic forcings.
Materials and Methods
Study Region and Climate
The study area encompasses the South American subtropical region between 22 and 29° S and from 62.5° to 67° W. From east to west this region includes the western dry Chaco lowlands, the flanks of the sub-Andean and Andes ranges and the eastern sector of the Puna/Altiplano (Figure 1). The NWA includes the provinces of Jujuy, Salta, Tucumán, Catamarca, and Santiago del Estero. The population of the region is close to five million inhabitants and represents 11.6% of Argentina total population of Argentina (Instituto Nacional de Estadísticas y Censos República Argentina [INDEC], 2010).
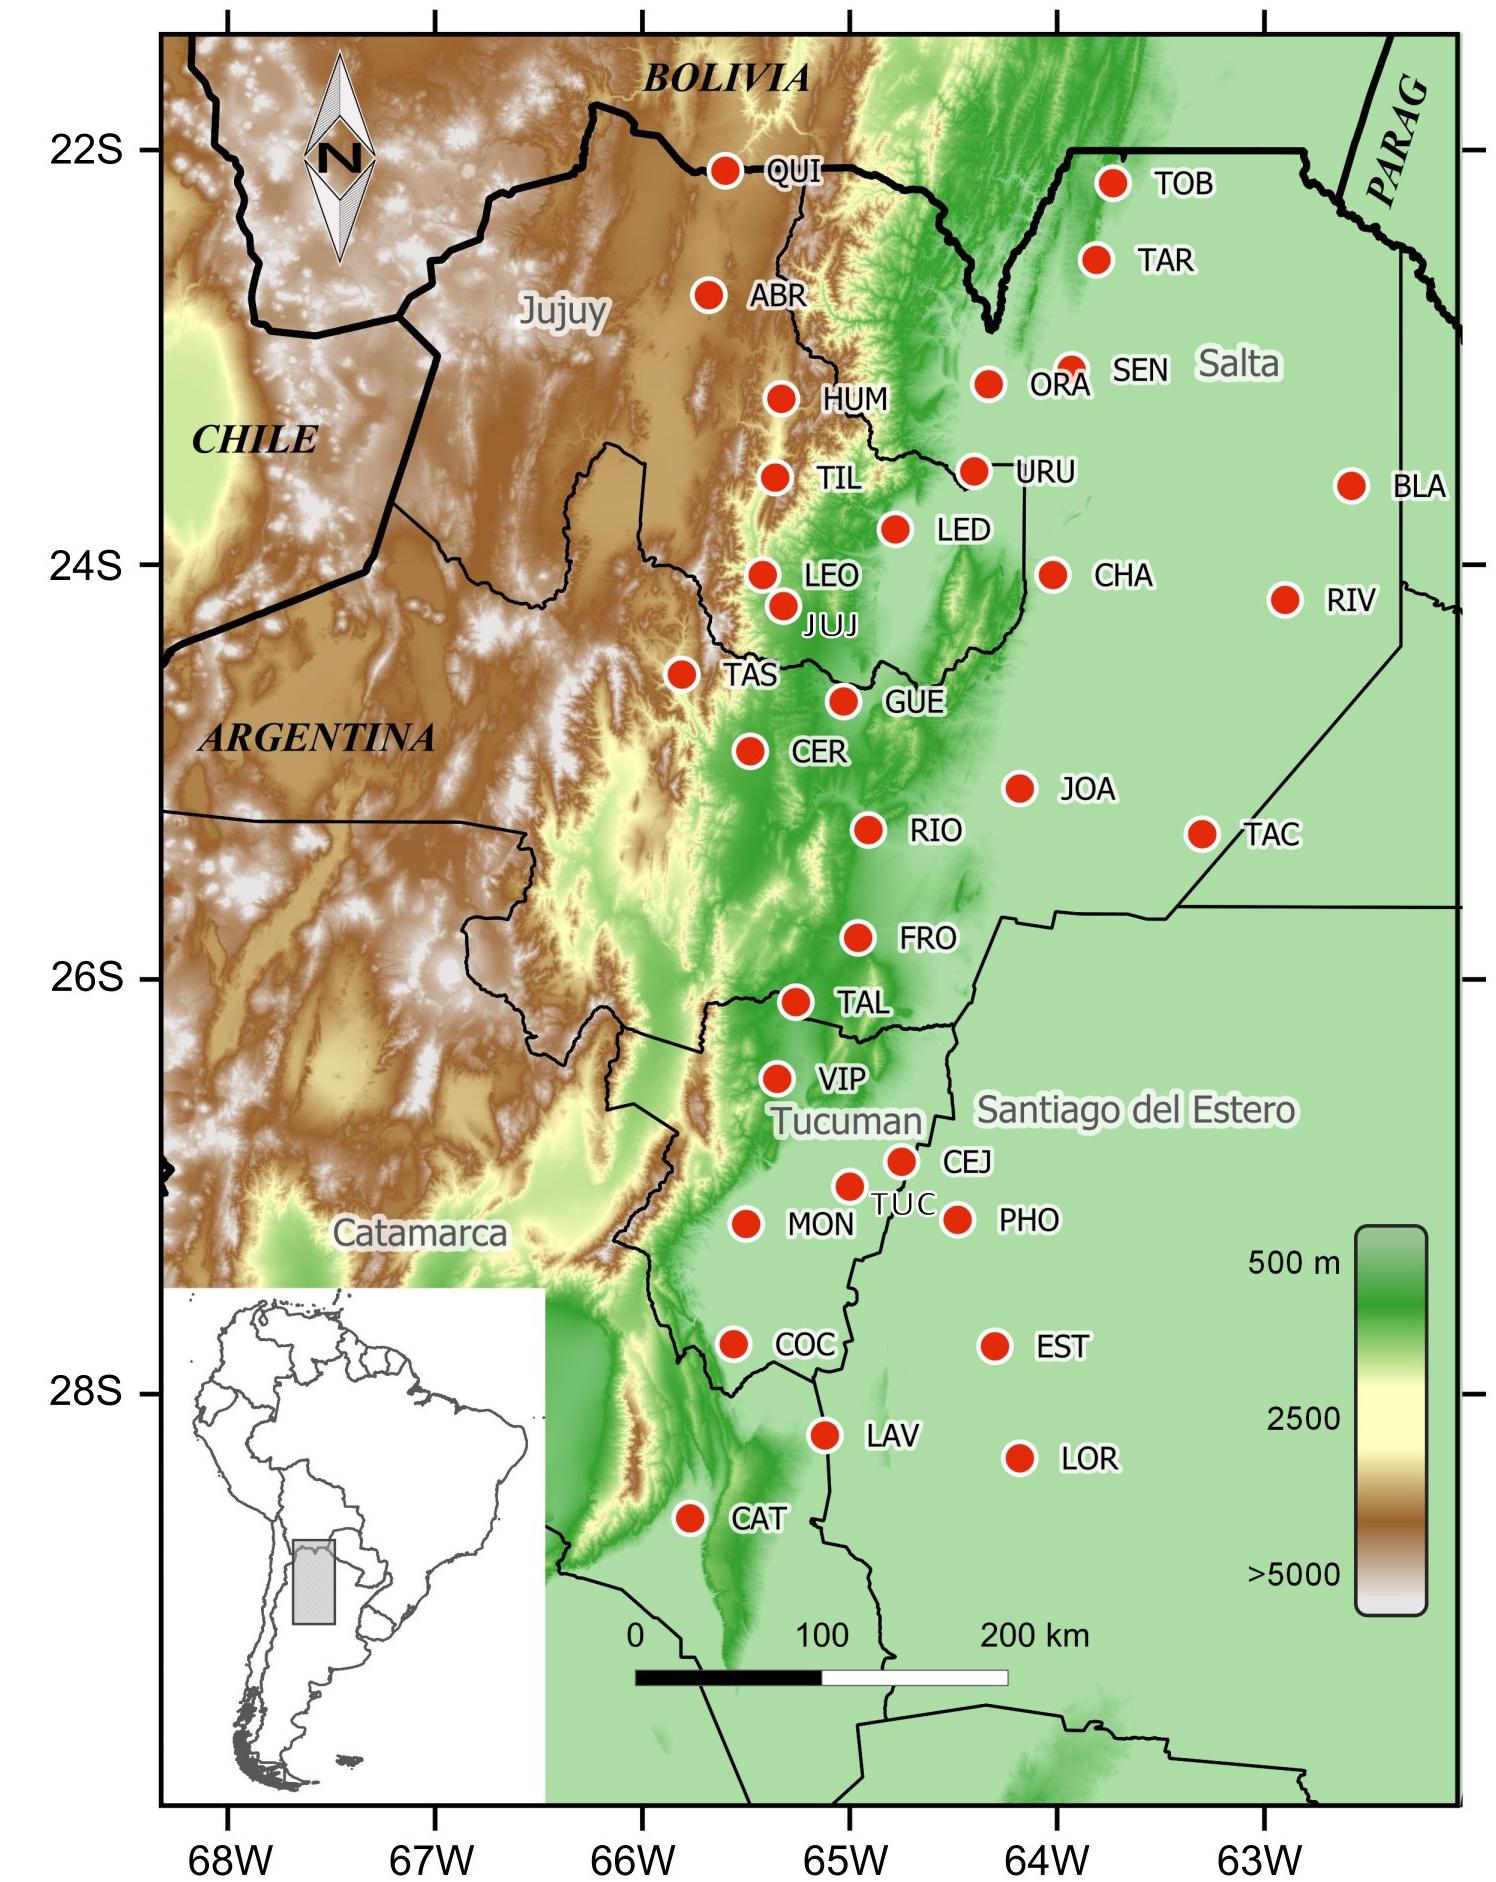
Figure 1. Study region and spatial distribution of the precipitation stations (red dots) across North Western Argentina (NWA). Thick (thin) black lines represent international (provincial) borders. The changes in elevation (right bar) separate the Chaco lowlands (<500 m) in the eastern sector from the sub-Andean ranges (900–2,000 m) and the Puna (>2,500 m) in the western sector of the study area.
Climate is of the monsoon type, with 80% of annual precipitation concentrated in summer season (from October to March), and hence with a marked dry winter season. The South America Summer Monsoon (SASM) is induced by low-latitude temperature differences between the continent and the oceans and modulates the atmospheric circulation over tropical–subtropical South America in summer (Vera et al., 2006; Garreaud et al., 2009). The onset of the wet season in central and southeastern Amazonia typically occurs between the end of September and early October and by late November deep convection covers most of the central South America from the equator to 20° S. As a regional response to the strong convective heating over the Amazon, an upper-level high-pressure cell, called the Bolivian High, is formed in summer. At low levels, a deep continental low is generated over the Chaco region (the Chaco Low). The interactions between circulation associated with the Chaco Low and the Andes reinforces the transport of moisture from tropical to subtropical South America. The regional intensification of the air circulation east of the Andes is due to the South American Low-Level Jet (SALLJ), which transports considerable moisture between the Amazon and La Plata basin over the subtropical plains as far as 35° S (Nogues-Paegle and Mo, 2002; Saulo et al., 2004). The SALLJ can be enhanced or restrained by the South America Convergence Zone (SACZ) which characterizes intraseasonal rainfall variability over South America: enhanced precipitation over the SACZ is accompanied by decreased rainfall in the subtropical plains while the opposite phase is associated with increased southward moisture flow from the Amazon region, and increased rainfall in the subtropical plains. Between March and May, the SASM decay phase begins, as regions of heavy precipitation over the southern Amazon and central Brazil decrease, and gradually migrates northwestward toward the Equator (Vera et al., 2006).
In NWA, humid air masses moving from northeastern to southwestern collide with the mountain ranges, forcing the air to rise and cool generating abundant orographic precipitation. The steep topography of the sub-Andean ranges influences total annual rainfall and its spatial distribution. Precipitation increases on the slopes with eastern exposure, which in turn produces “rain shadow” effect leeward, creating drier environments in the intermountain valleys. On the wetter slopes, rainfall varies from 800 to more than 2,000 mm/year. Mean annual temperature oscillates from 22°C in the Andes piedmont to less than 15°C above 2,000 m.
Datasets
We used the longest and most complete monthly precipitation records from a large network of stations compiled by Bianchi and Yáñez (1992) and the Argentinean Weather Service (SMN). Due to the marked orographic component, rainfall in NWA is unevenly distributed. Therefore, to capture most variations in spatial precipitation distribution is necessary to count with a numerous and dense net of observations covering different environments. The most important network of precipitation stations in the region was maintained by the General Belgrano Railway. Each railway station was equipped with a rain gauge, and the records taken by the operators. Bianchi (1981) published a first collection of climate data, including 378 stations located in NWA and the provinces of Formosa and Chaco. Most of the rainfall stations cover the period 1934–1978. A second compilation by Bianchi and Yáñez (1992) updated most stations to the year 1990. With the privatization of the state railway company, most of the stations were closed and definitely dismantled in 1990, losing in turn the most important rainfall network for subtropical NWA. From a total of 82 precipitation records, 34 were selected based on quality (homogeneity, less than 5% of missing data), temporal extent (period 1934–1990) and spatial distribution (Table 1 and see Supplementary Figure 1). These stations were retained and analyzed after a quality control and gap-filling procedures (Supplementary Material). Stations from SMN Argentina, Subsecretaría de Recursos Hídricos (SSRH), provincial webpages and KNMI Climate Explorer were also incorporated in our database. Data available for the same localities but from different sources were compared using visual inspection and correlation analyses, and when possible, updated to 2016. Nevertheless, the low number of updated records (nine) conditioned our spatial analysis to the period 1934–1990, when 34 records are available across the study region. Precipitation at the Rivadavia (RIV) station, located at the lowland Chaco was recorded from 1912 to 1990. Since RIV represents the earliest record in the Chaco, we updated it using Las Lomitas (LOM) precipitation record (period 1953–1990). Although separated by a relatively long distance (>250 km) LOM is the closer station to RIV and located at similar environmental conditions (common period 1953–1990; n = 37, r = 0.51, p > 0.05).
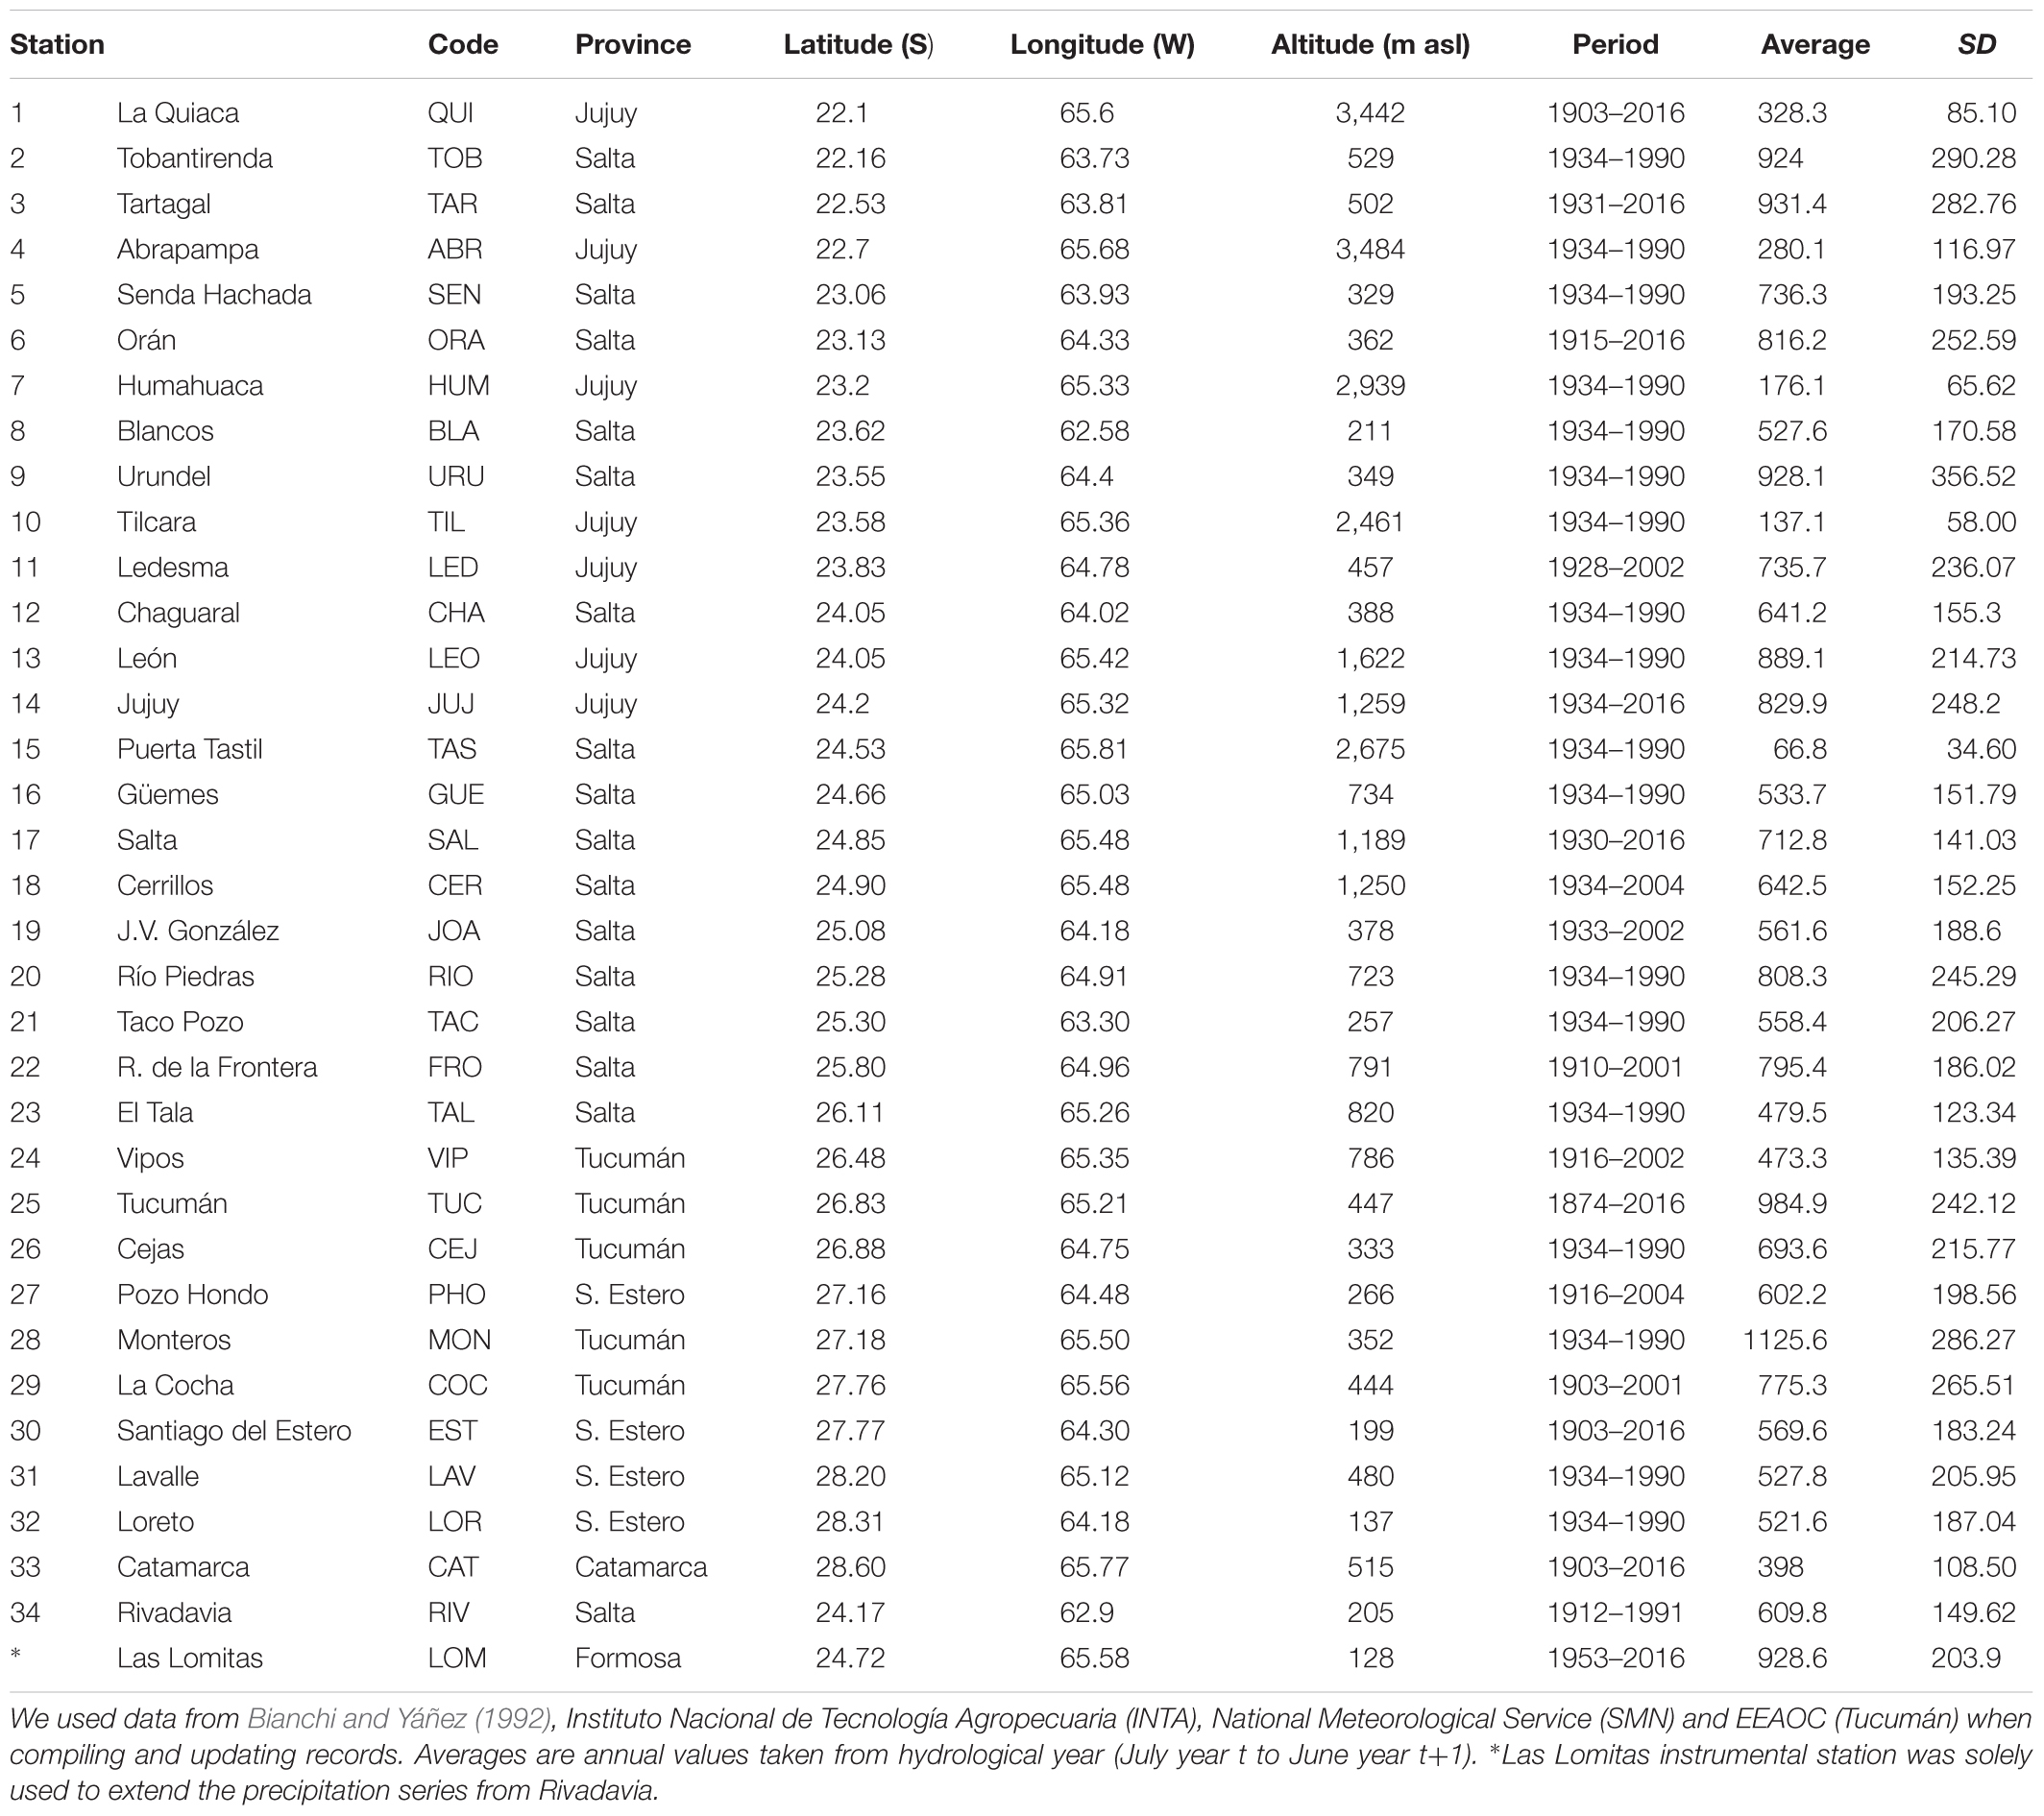
Table 1. Precipitation stations from NW Argentina used in the present study.
Statistical Approach to Variability Patterns
Patterns of spatial and temporal variability in NWA precipitation were identified by using principal component analysis (PCA; Wilks, 2011). PCA reduces the total variance in large data sets to fewer representative variables. To determine the main patterns of rainfall variability, monthly data for each precipitation series were annually and seasonally grouped. The annual pattern was based on total annual precipitation from July (year t) to June (year t+1) intended to include the summer maximum from October to March (Vera et al., 2006). To identify the precipitation variability at seasonal scales, monthly precipitation data was grouped into the wet (October–March) and dry (April–September) seasons. The main spatial modes of precipitation variability were determined by performing PCA without rotation to maintain the original structure of the data. The contribution (loadings) from each meteorological station to the PCs was plotted as maps using Kriging interpolation (Golden Software Inc., 1994). Moving standard deviations (21-year-period) lagged by 1 year were estimated for the wet and dry season first principal components to assess the precipitation variability through time.
Principal components analysis captures the dominant modes of variability but is temporarily reduced to the common period among series (i.e., in our case 1934–1990). In order to extend the temporal coverage of the dominant modes of precipitation variability, composite records were created based on those precipitation records showing the strongest relationships (>0.40) with each PC. We emphasize the analysis in the wet season given that October to March precipitation concentrates over the 80% of annual precipitation, and consequently, constitutes a good representation of the annual hydrological cycle. Since all stations contributed to PC1 with the same sign, a single composite record associated with PC1 was developed. In contrast, both PC2 and PC3, which represent opposite patterns of precipitation variability across the study area, have negative and positive contributions. In consequence, we built two independent composite series in relation to the negative and positive contributions to PC2 and PC3. The selected instrumental stations included in the composite records were transformed to Z-scores. As a consequence of using normalized standard deviations, each station, independent of its particular precipitation range, has the same weight in the composite record. The normalized precipitation series associated with each PC were averaged to develop the extended precipitation records representative of the dominant modes of variability in NWA. Most composite records start in the mid-1910s and extend to the year 2016. Finally, the extended composite records were reduced by mean of PCA to capture the century-long temporal hydroclimatic variability in NWA.
The long-term first principal component was transformed to percentiles to detect the intensity and distribution of droughts and pluvials (<5th and >95th percentiles, respectively) along the past 100 years (1912–2016). This procedure was conducted assuming that the 50th percentile corresponds to the mean value of PC1 of the composite series. Each value was then categorized within the following five categories: P20 (value between 0 -the minimum value of the series- and 20), P40 (value between 20 and 40), P50 (value between 40 and 60), P60 (value between 60 and 80), P80 (value between 80 and 100 -maximum value of the series). At the same time, we calculate the values within the 5th percentile (values that fall below 5% of the lowest data) and the 95th percentile (values that fall within 5% of the highest values in the series). The P5s were taken as extreme dry values or “droughts,” whereas the P95s were considered as extreme abundant rains or “pluvials.”
Abrupt changes in precipitation over time were assessed using the Rodionov shift detection test1 (Rodionov, 2004, 2006). The Rodionov’s technique identifies the most significant changes in mean conditions along the time series. This procedure is based on the calculation of a regime change index combined with the sequential application of Student t-statistic to determine the period and significance of possible changes in the mean values in the regimes.
To evaluate the spatial representativeness of the extended precipitation records and determine the major forcings of rainfall variability in NWA, the extended PC1 was compared upon with the precipitation gridded dataset from the Climate Research Unit (CRU TS v4.01) across South America. In addition, the spatial pattern of correlation between the extended PC1 and sea surface temperature (SST) across the South Atlantic Ocean were computed on the base of the HadISST 0.5° × 0.5° gridded data set. The monthly SST anomalies over the Atlantic Ocean embracing the area from 55 to 30° W and from 20 to 45° S were extracted to compare with our extended PC1. Finally, to determine moisture sources and transport toward our study area wind direction and velocity for the five wettest and driest years derived from the extended PC1 were determined over South America. The facilities at the KNMI Climate Explorer2 and the NCEP-NOAA webpages were used to build the spatial correlation patterns3 and establish the wind seasonal anomalies4.
Results
The selected 34 precipitation records in NWA (Table 1) cover the common 1934–1990 period, with only nine stations updated to 2016. Total precipitation at the individual stations is highly variable (Figure 2). At the Chaco lowlands (<200 m asl) rainfall decreases from east to west, reaching minimum values toward the base of the sub-Andean ranges (i.e., JOA; see Table 1). After that, precipitation increases on the slopes of the sub-Andean range until reaching a peak between 1,000 and 1,300 m elevations (i.e., 1,125.6 mm/year (MON). After that, gradual but persistent decreases follow with elevation to drastically drop at the Altiplano–Puna (TIL, HUM stations in Jujuy, or TAS in Salta province) above 2,500–3,000 m elevation.
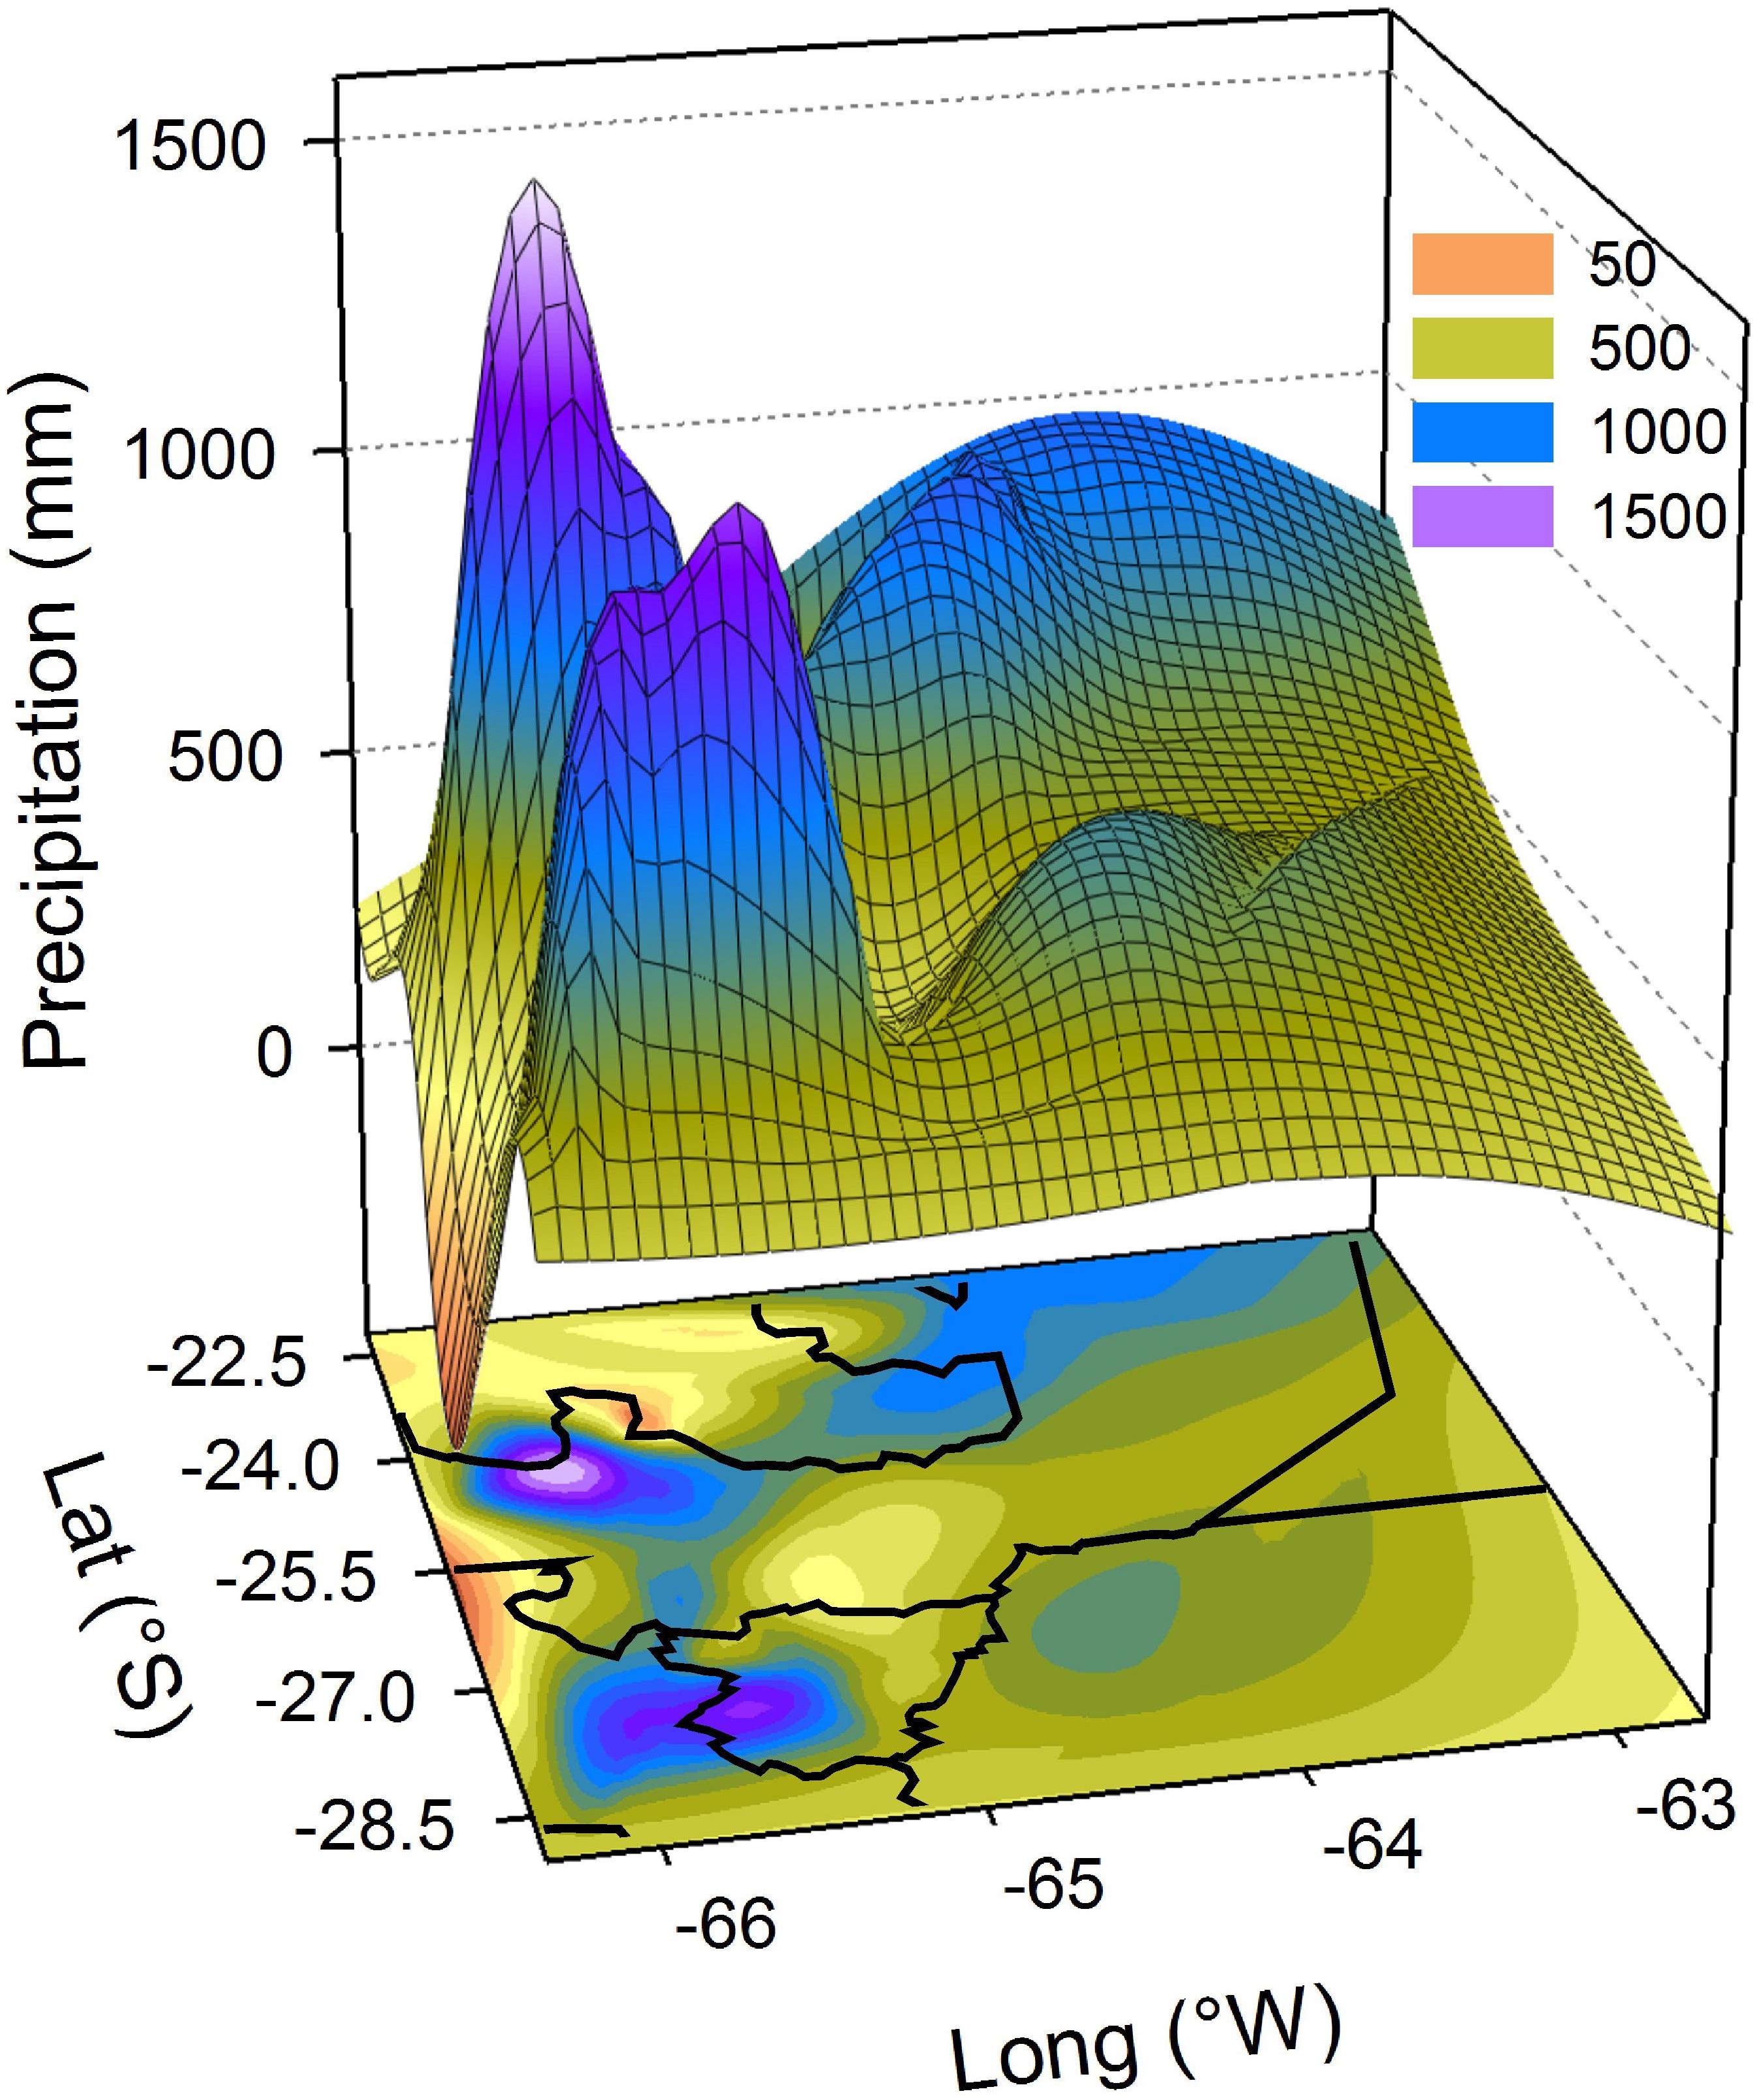
Figure 2. Spatial pattern of total annual precipitation in NWA based on 34 stations for the common period 1934–1990 (see Table 1). The changes in the upper color surface plot are related to variations in total precipitation at each of the 34 stations in the NWA network. The graph below shows the same precipitation data across provincial territories. Colors refer to total annual precipitation in mm.
Predominant temporal patterns for annual, wet- and dry-season precipitations were identified for the 1934–1990 common intervals (Figure 3). The PC1 for annual precipitation explains 34.4% of the total variability. Similar percentages are registered for precipitation in the wet (October–March, 33.2%) and dry (April–September, 35.4%) seasons. As expected, both annual and wet-season precipitation (Figure 3, top) show very similar temporal variations (r = 0.979, p > 0.05, n = 56) since as stated above, the wet months (October to March) concentrate between 80 and 90% of the annual precipitation. The PC1 for the dry season (Figure 3, mid) shows some similar patterns over time including more abundant precipitation after the year 1970. This increase is known as the “climatic jump” in precipitation for NWA (Minetti and Vargas, 1997). Standard deviations (21-year moving window) of wet and dry seasons (Figure 3, bottom) increase after 1970s, maintaining large values onward. The increase in variability for the dry season is even higher than for the wet season, suggesting larger interannual variability.
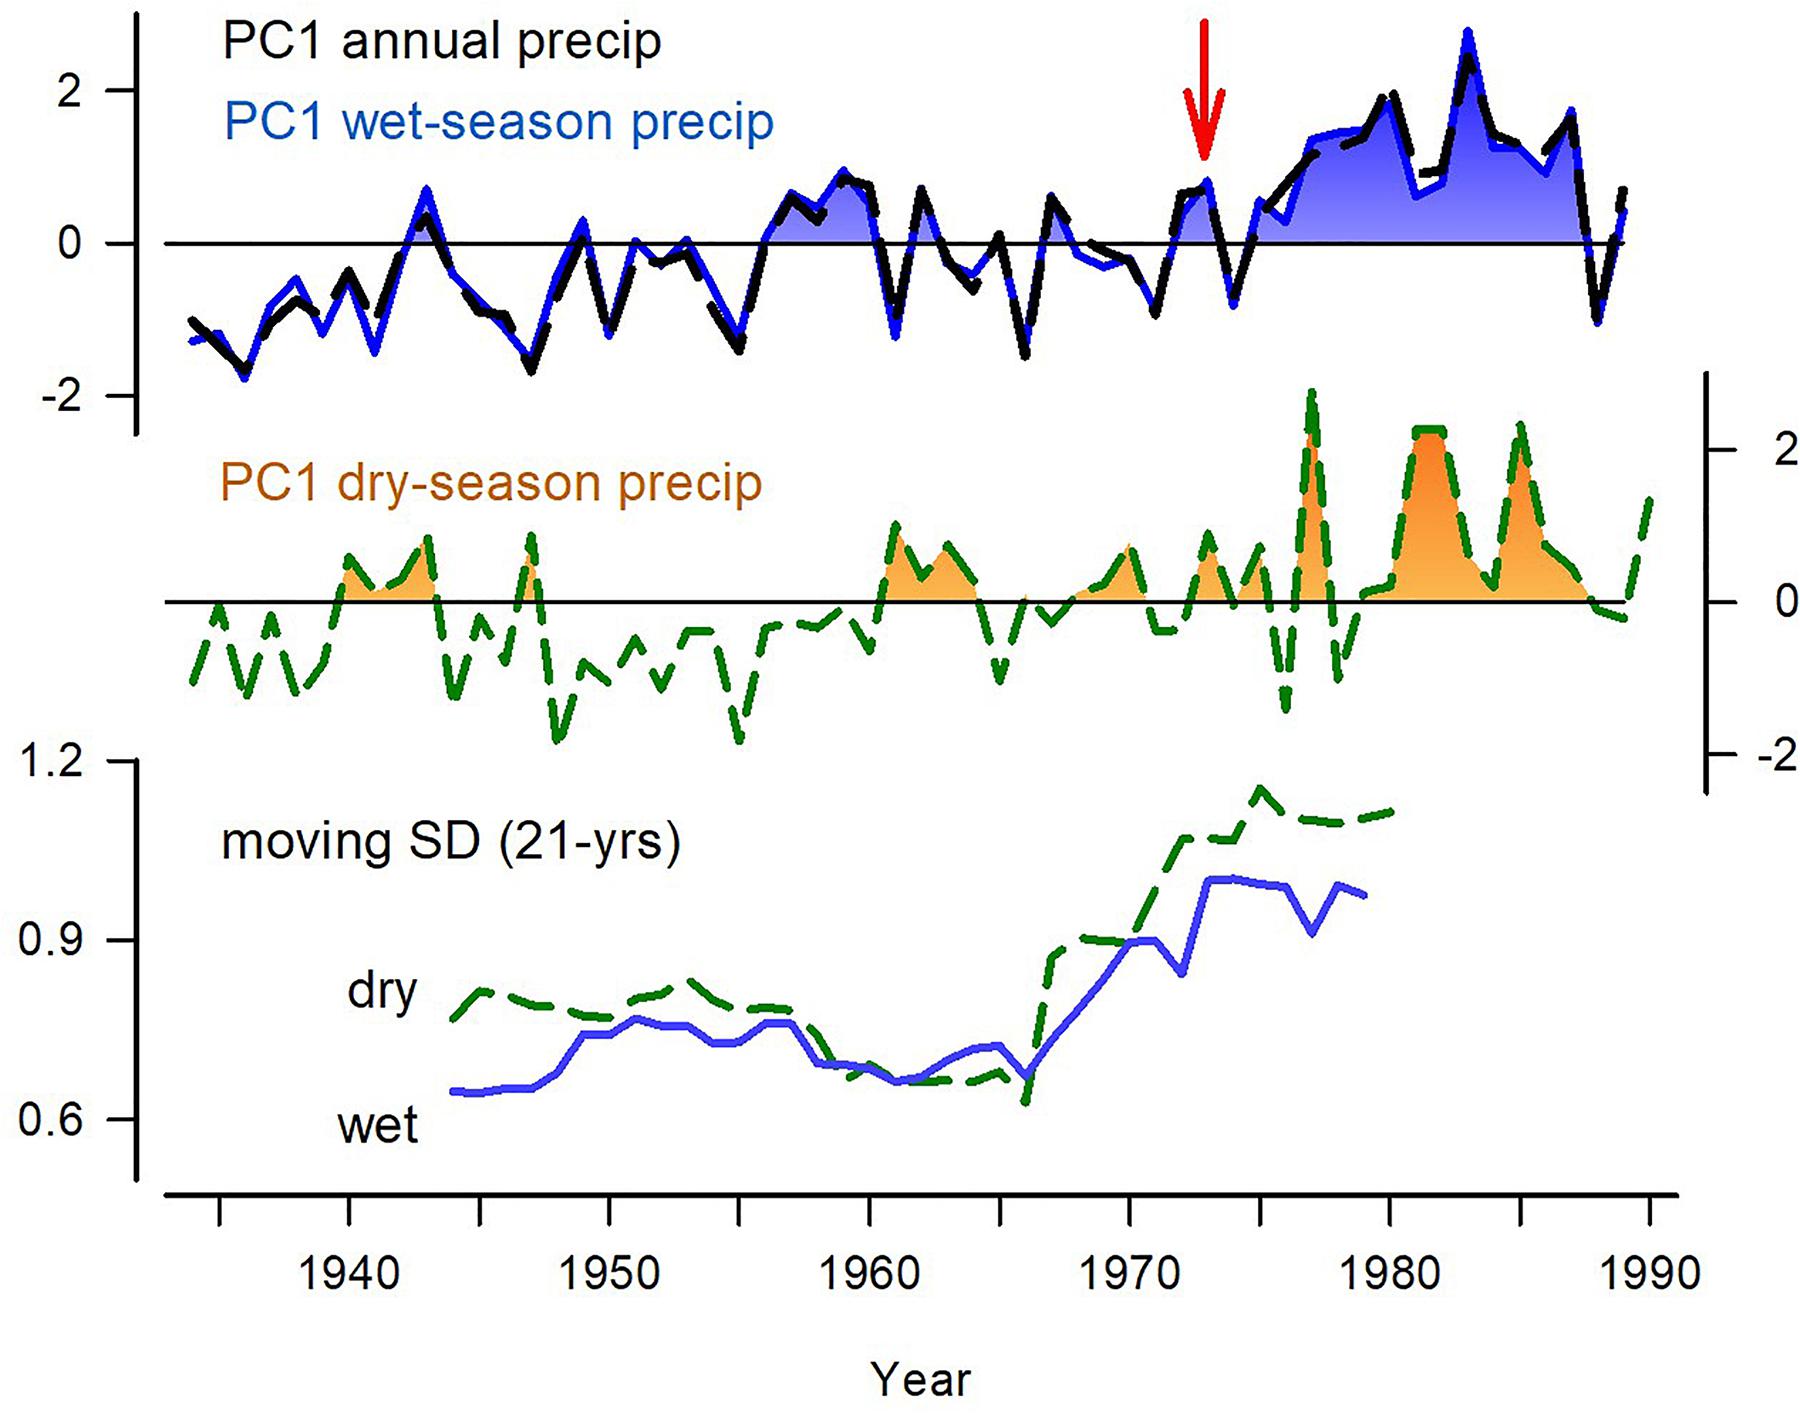
Figure 3. Amplitudes of the first principal components (PC1) for (top) annual precipitation (July to June; black dashed line), wet (October to March; blue line) and (middle) dry seasons (April to September; below) for the common period 1934–1990; moving standard deviations (bottom) for the PC1s of the wet and dry seasons estimated over 21-year periods centered at the year 11. The red arrow indicates the “climatic jump” in precipitation at NWA.
The spatial dominant patterns of precipitation during the wet season (Figure 4) show that the PC1 is characterized by a uniform pattern through all NWA region (Figure 4A). In contrast, the PC2 associated with 10% of the total variance, shows opposite patterns between records above and below ∼900 m (Figure 4B). Finally the PC3, explaining 7.7% of the wet-season precipitation variability discriminates between the north- and south-subregions in NWA (Figure 4C). The three PCs cumulatively explain 51% of the total rainfall variability during the wet season in subtropical NWA. Figures 4D–F show the temporal expression of PC1, PC2, and PC3, respectively. As shown before, PC1 resumes the main variability in NWA rainfall characterized by an increasing trend in precipitation well above the mean after 1970.
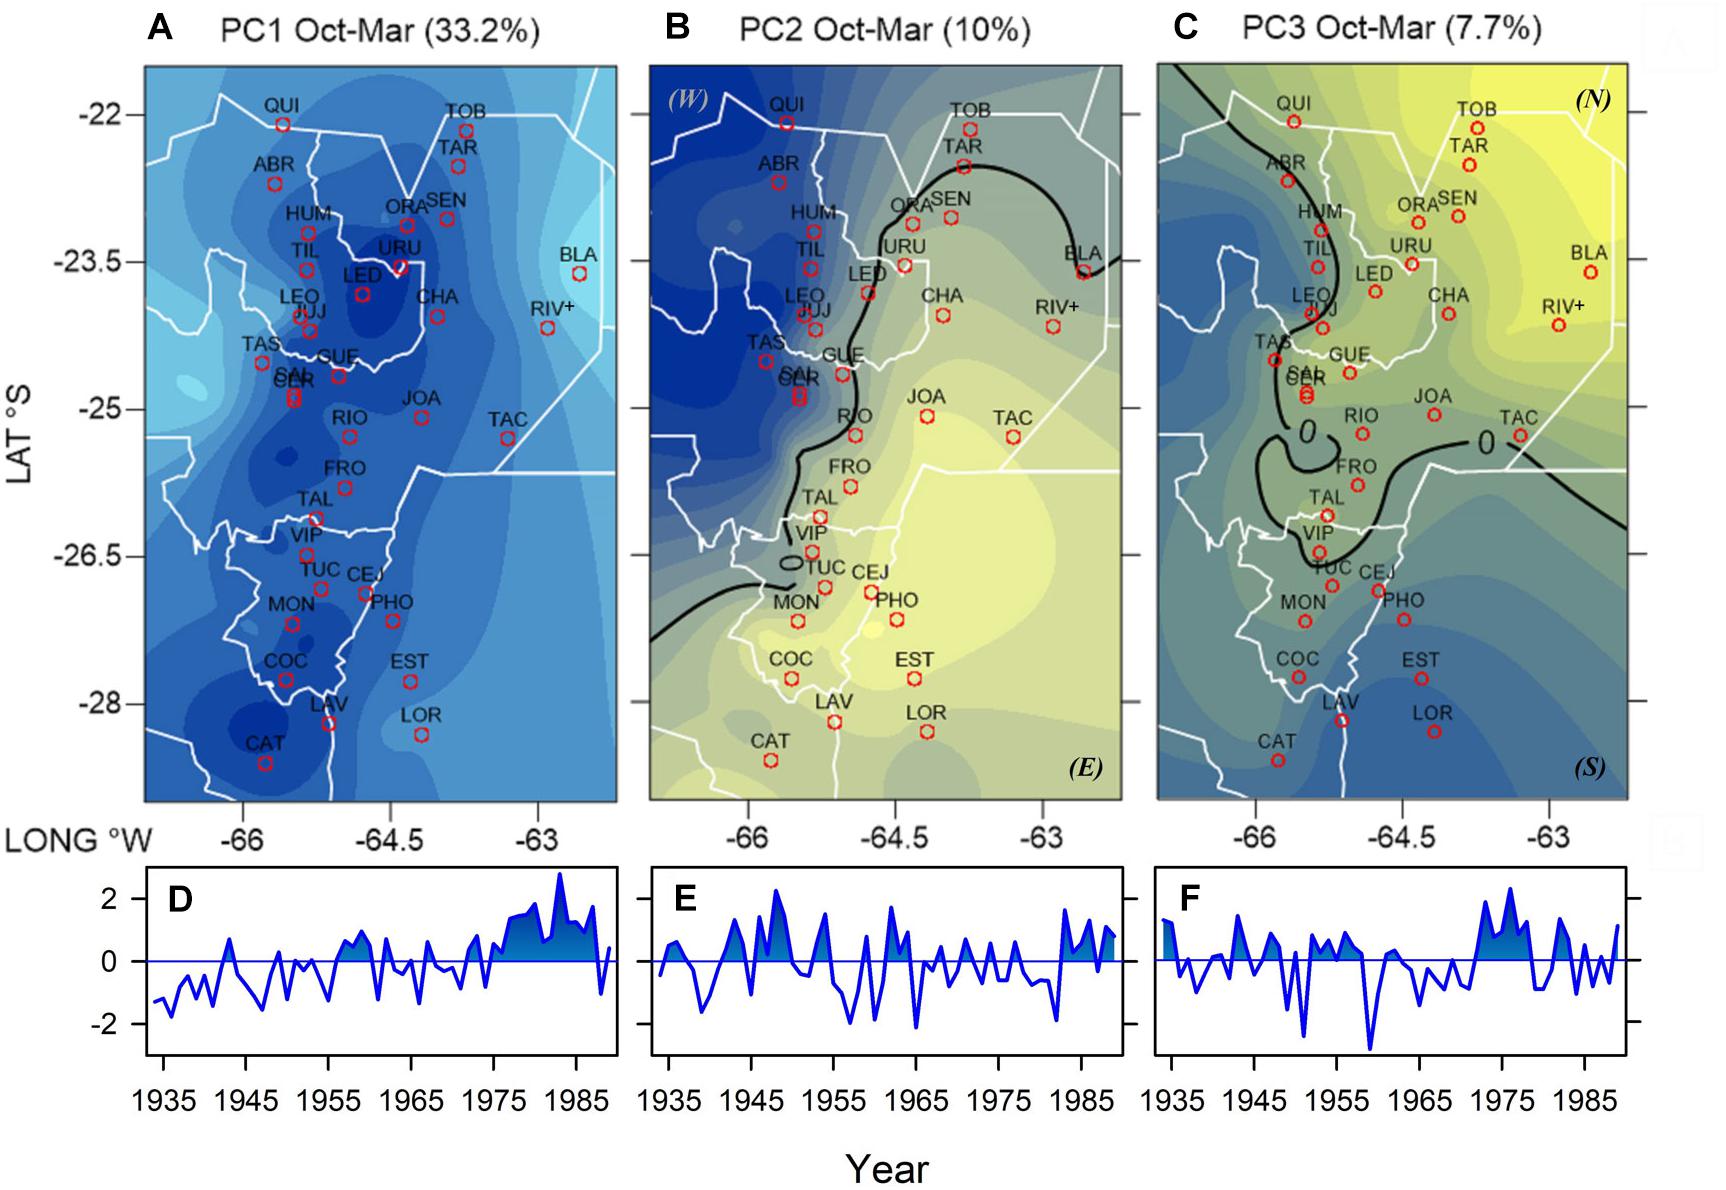
Figure 4. Spatial variations (loadings) of the three principal components PC1 (A), PC2 (B), and PC3 (C) for the wet-season (October–March) precipitation from the network of 34 weather stations (red dots) in NWA. The percentage (%) of the total variability explained by each PCs is indicated in parenthesis. Black thick line separates positive from negative station contributions to PC. The amplitudes from PC1 (D), PC2 (E), and PC3 (F) over the common period 1934–1990.
The extended hydroclimatic records for NWA during the wet season are shown in Figure 5A. The instrumental records from ORA, URU, TUC, COC, all stations located in the montane area were used to prolong PC1 (hereafter as “pcAll”). The composite records, which covers the interval 1874 to 2016, is highly correlated with PC1 (r = 0.92, p > 0.05, n = 56). PC2 contains positive and negative loadings that separate the component into altitudinal bands, and consequently, two precipitation series (lower and higher belts) were generated. The precipitation records positively related to the PC2 amplitudes (r = 0.62, p > 0.05, n = 56) is the records from the high-elevation La Quiaca (QUI) station (hereafter as “pcW”) located at 3,442 m. This precipitation series cover the period 1903–2016. The stations from the lower montane belt TUC and PHO are inversely related to PC2 (r = -0.40, p > 0.05, n = 56; hereafter “pcE”), also cover the 1874–2016 period. The instrumental records from BLA, RIV, SEN, TOB, all stations located in north-eastern Chaco region, are significant negatively correlated with PC3 (r = -0.68, p > 0.05, n = 56; hereafter “pcN”) and extends from 1912 to 2016. Finally, the records from the stations in the south-eastern Chaco lowlands (EST, LAV, LOR), which are significantly positive related to PC3 (r = 0.50, p > 0.05, n = 56; hereafter “pcS”) cover the interval 1903–2016.
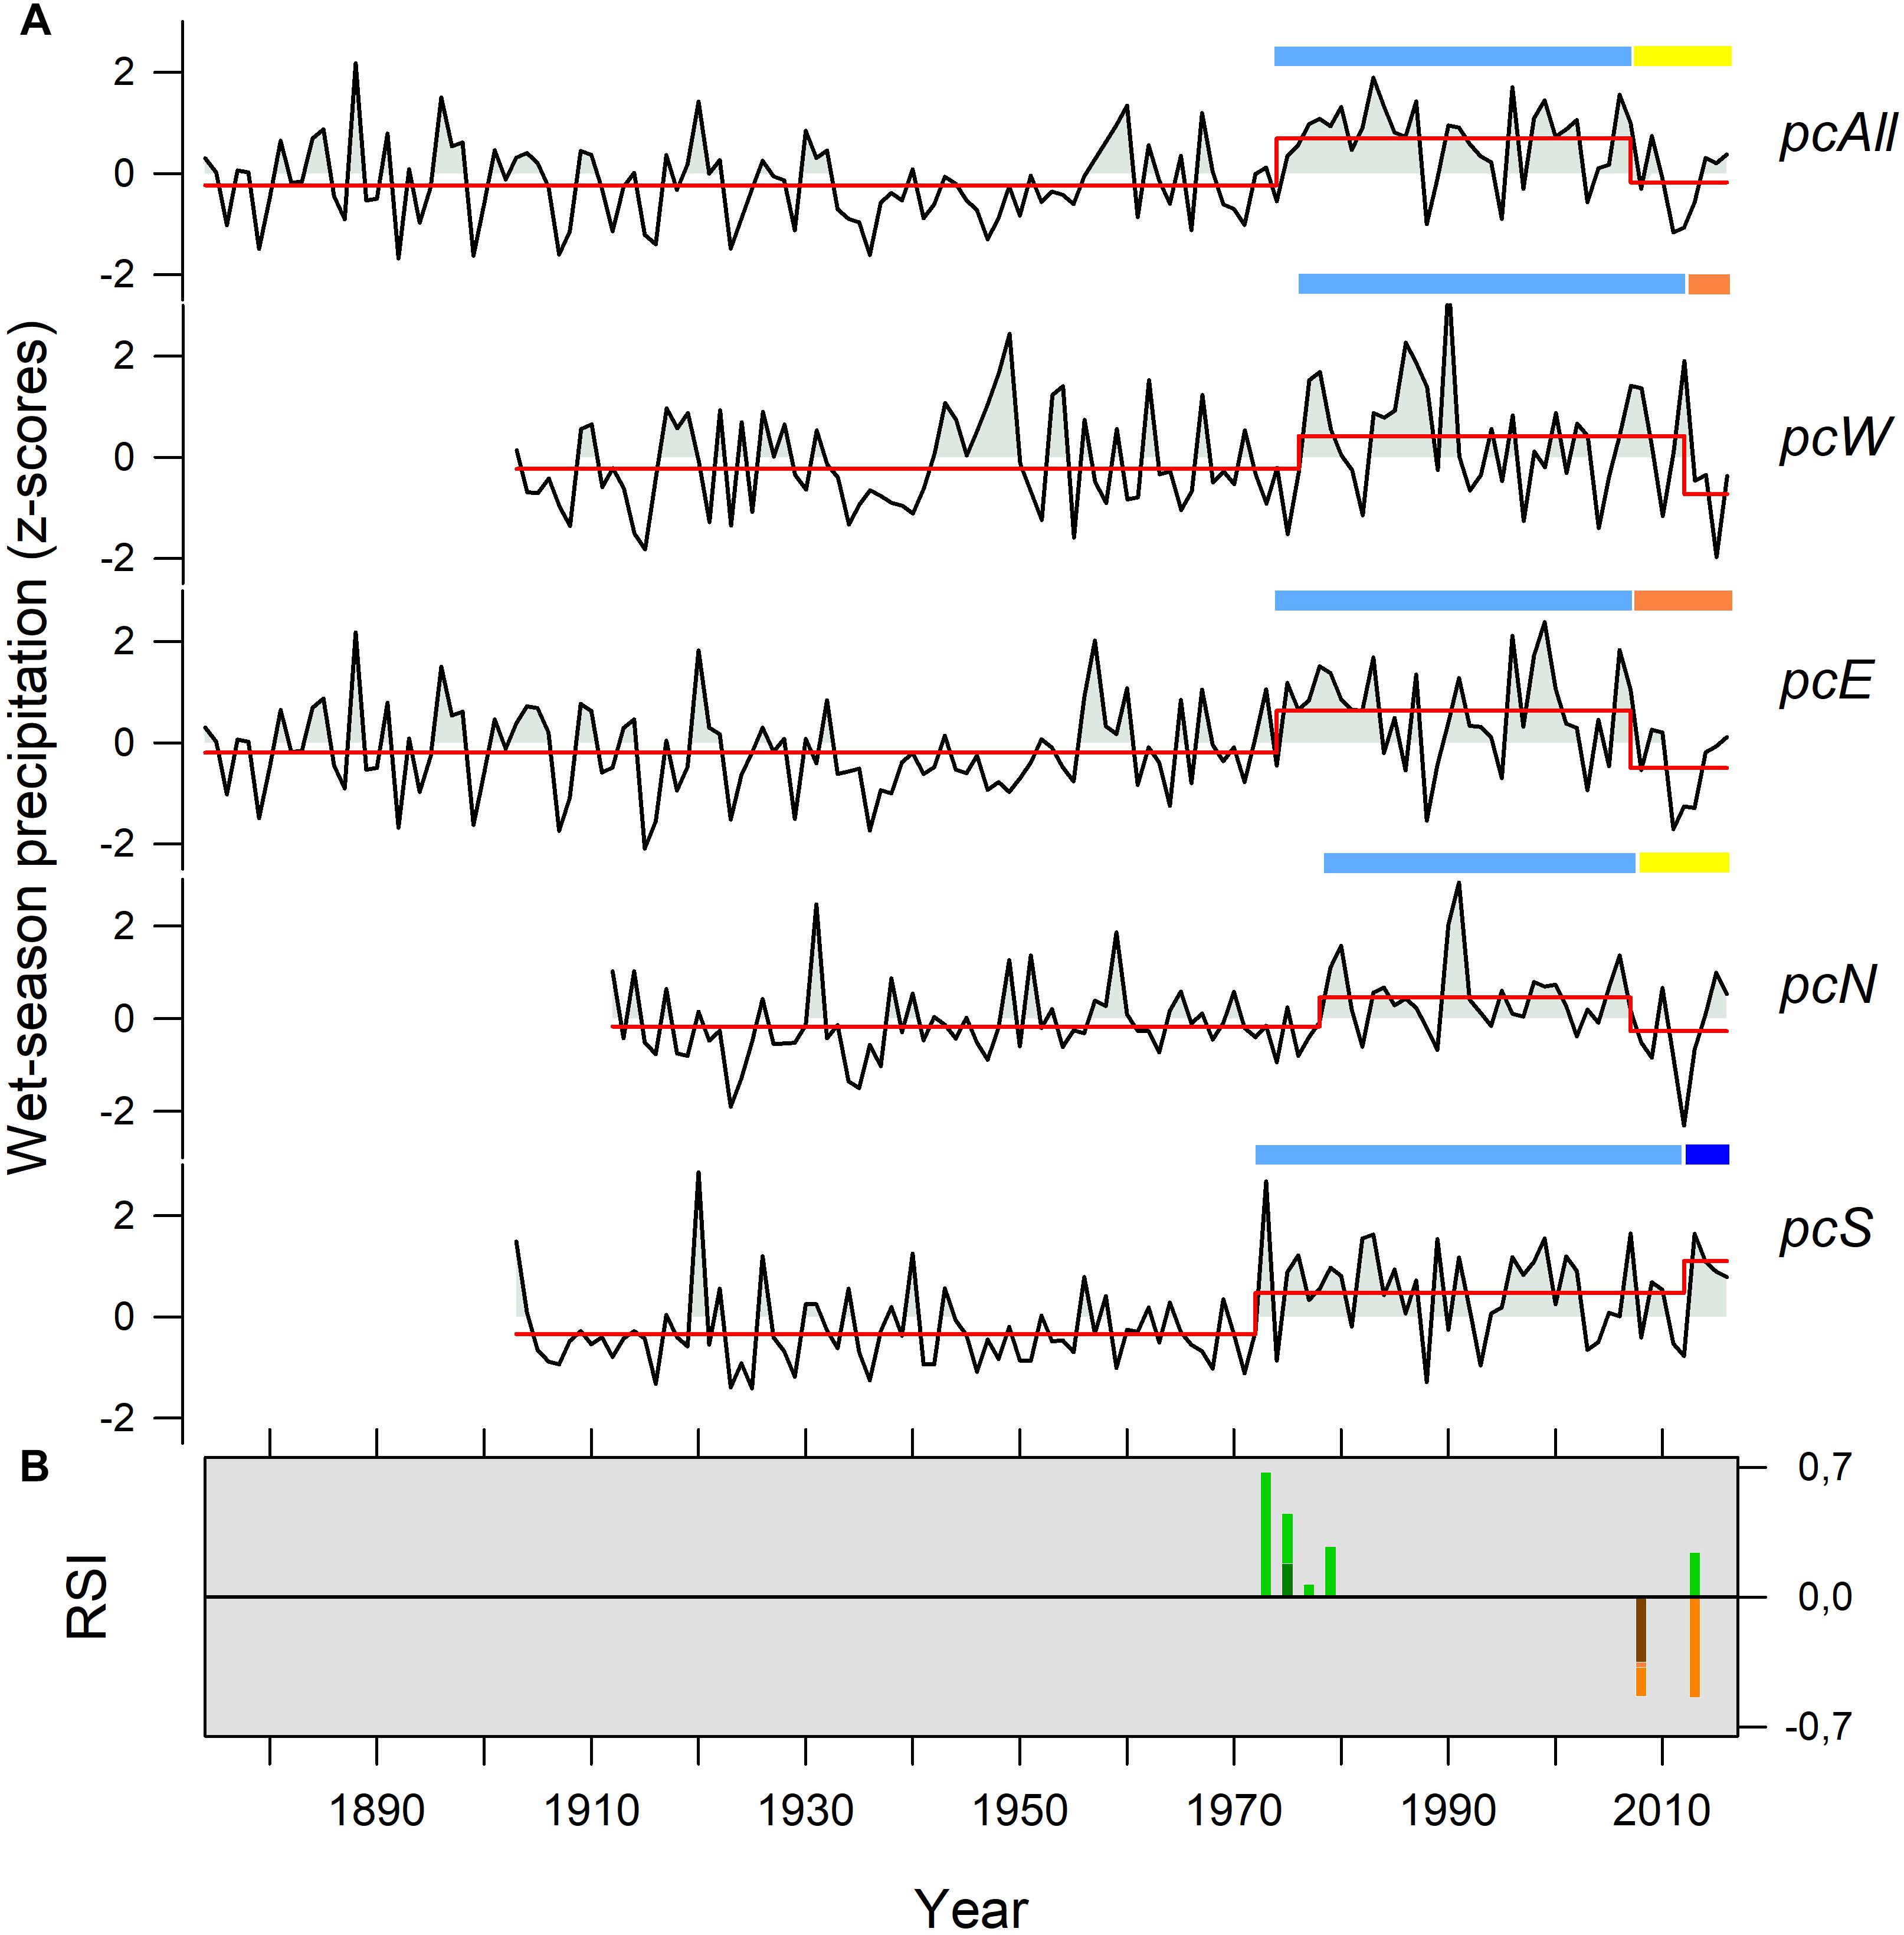
Figure 5. (A) Composite normalized precipitation records associated with the three principal components (PC1, PC2, and PC3 in Figure 4) for the wet season (October to March) precipitation in NWA. pcAll corresponds to those stations better correlated (r > 0.40) with PC1; pcW and pcE correspond, respectively, to the stations positively and negatively related with PC2; pcN and pcS correspond to the stations showing positive and negative correlations with PC3, respectively. The red lines at each series represent the means for different periods determined by the regime shift test (Rodionov, 2004). The upper blue bars (yellow/orange) correspond to periods of abundant (reduced) precipitation; the intensity of the color is in relation to the magnitude of the wet/dry period. (B) Regime shift index (RSI) represents the normalized anomalies relative to the magnitude of change in the means; the higher the RSI, the greater the difference between means. Green (orange) bars represent positive (negative) changes and the length of the bars corresponds to the magnitude of change during each climatic jump; darker green (orange) bars correspond to years where mean changes occurred in two or more series. All changes are significant for a p < 0.10.
The shift detection technique applied to the five extended precipitation records (pcAll, pcW, pcE, pcN, and pcS) shows a significant positive change starting in the 1970s and ending between 2008 and 2013 (represented by blue and yellow tick lines above the series in Figure 5A). There is also a non-significant positive shift around 1950–1960 (at pcAll, pcE, and pcN), but is not steady neither homogeneous in the individual instrumental series. The five extended composite records, which include 13 stations well distributed across NWA, show positive shift during the 1970s decade. Starting in the year 1973 the positive shift is detected in pcS stations, in pcAll and pcE in 1975, in pcW in 1977, and finally pcN in 1979. These increases in precipitation are relatively stable in all series until approximately the year 2010, showing some differences depending on sub-regions. The pcAll, pcW, pcE, pcN records (Figure 5A), integrating most NWA stations show a negative shift between 2008 and 2013, which has persisted until the last year on record (2016). The stations from the SE Chaco (series pcS) show, on the contrary, a second positive shift from 2013 to 2016. However, the significance of these recent changes is difficult to validate due to the short period considered. The magnitudes and years at which these jumps in precipitation occurred are displayed in Figure 5B according to the regime shift index (RSI). The first positive anomalies (green bars) in the five series representative from NWA occurred during the 1970s showing different magnitude but remained stable until approximately 2010, when all records displayed contrasting negative anomalies (orange bars) with the exception of pcS, the only series with a new positive anomaly in the year 2013.
The PCA of the five extended instrumental precipitation records from the wet season in NWA (hereafter PC1.ext) is shown in Figure 6. The PC1.ext retains 53% of total variability, covers the interval 1912–2016 and captures the dry years during the first half of the 20 century and the increase in precipitation from 1970s. The positive tendency (dotted line) along the precipitation series accounts for this trend. According to the Rodionov test (bars above) the positive shift in precipitation occurs from 1976 and lasts until 2008, where a negative shift in the mean precipitation conditions is registered. According to the PC1.ext values transformed into percentiles, years ranging between P20 and P40 are more frequent during the decades of 1920, 1930 and 1940; from the 1970s onward, precipitation amounts that reach the P80 prevail. Since the 2005, however, years of abundant rainfalls (P80, years 2006 and 2007) alternate with dry years (P20, year 2011) and extreme droughts (P5, year 2012) suggesting an increase in precipitation variability.
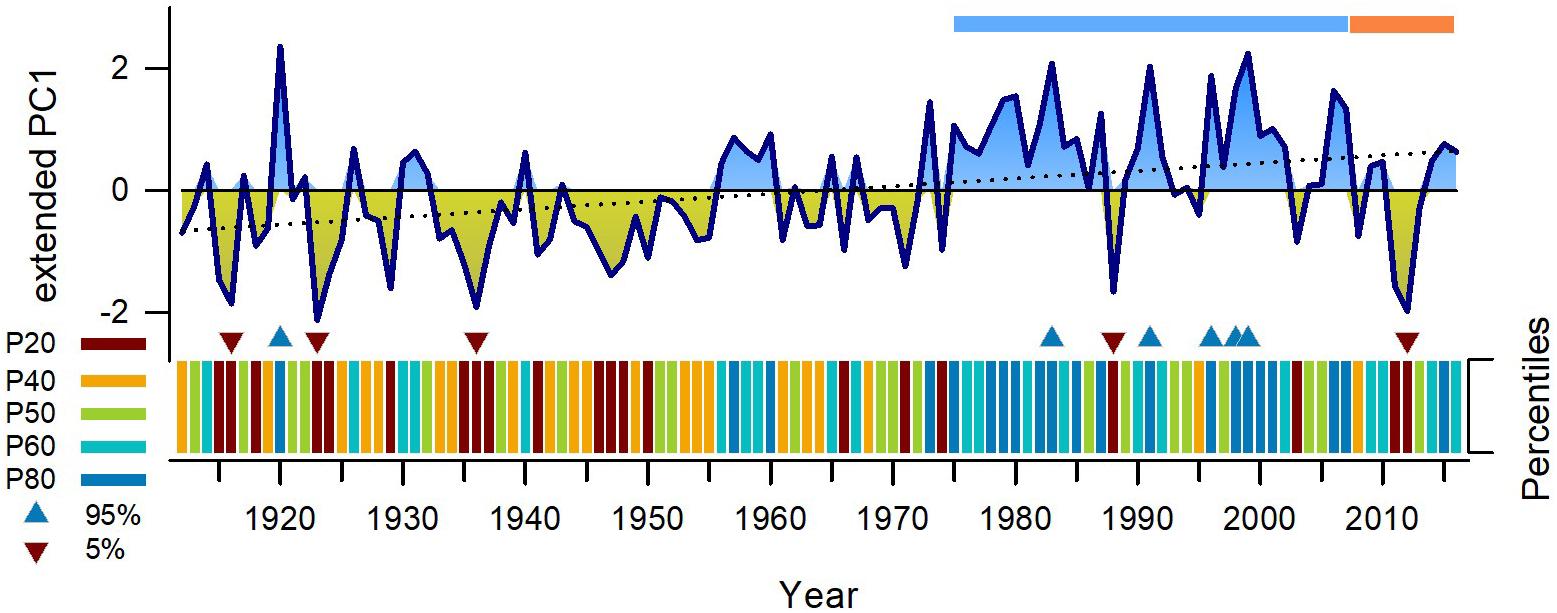
Figure 6. The first principal component (hereafter PC1.ext) from the five precipitation normalized precipitation records shown in Figure 5, associated with wet season precipitation across NWA. This PC1.ext covers the period 1912–2016 and explains 53% of summer precipitation variability in NWA. Blue (orange) bars are associated with periods of abundant (reduced) precipitation determined by the regime shift test (Rodionov, 2004); dotted line represents the linear trend over the whole 1912–2016 period (p < 0.0001). The graph below represents the same data but transformed into percentiles. P20 (from the minimum value to 20), P40 (between 20 and 40), P50 (between 40 and 60), P60 (between 60 and 80), P80 (80 to the maximum value of the series); blue (brown) triangles represents values above 95% (below 5%) of the precipitation series, which are considered as extreme pluvials (or severe droughts).
Our precipitation PC1.ext record is highly significant and positive correlated with October–March gridded surface rainfall over tropical–subtropical South America during the interval 1915–2015 (Figure 7A). Significant correlations are recorded over southern Bolivia, western Paraguay and the northwestern sector of Argentina, encompassing the upper part of binational basins of the Pilcomayo and Bermejo rivers. The positive relationships also reaches the dry region known as the “arid diagonal” over central Argentina, implying that the PC1.ext contains a spatially large precipitation signals across the South American subtropics.
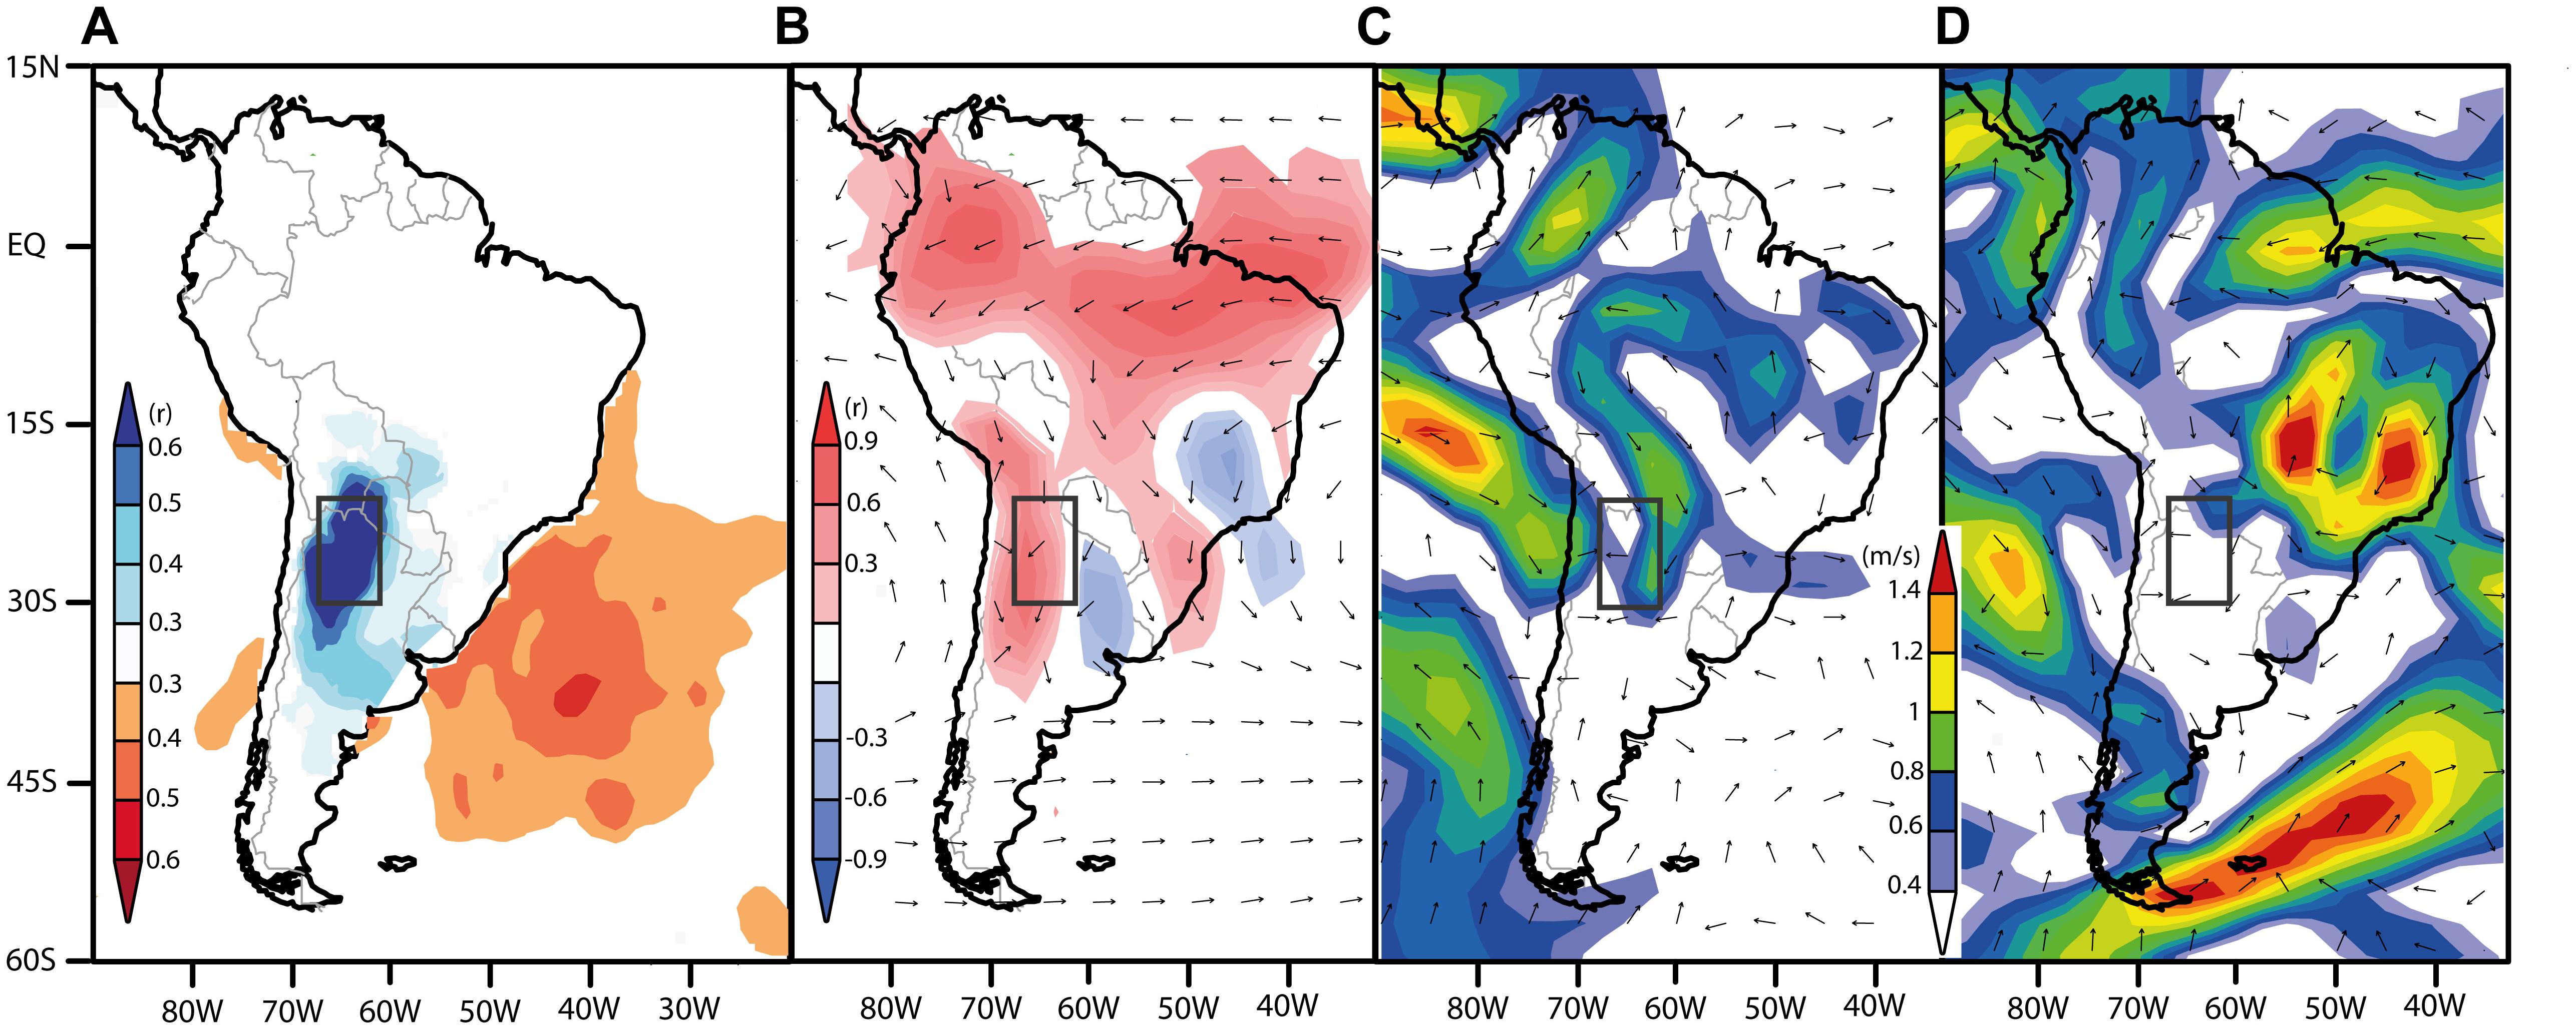
Figure 7. Spatial correlations between PC1.ext from normalized summer NWA precipitation and (A) CRU TS 4.01 gridded precipitation (0.5° × 0.5°) from summer (October to March) over the period 1915–2015 period (blue correlations) and the South Atlantic Ocean surface temperature (SST) from HadISST 1° reconstruction for October–March along the 1915–2015 period (red correlations). (B) Spatial correlations between PC1.ext and meridional wind (shaded correlations) and direction (arrows) at 850 mb mean field for October–March season. (C) Spatial correlations between PC1.ext and zonal and meridional wind velocity (shaded) and direction (arrows) at 850 mb composites for the 5 years with the most extreme positive precipitations in PC1.ext (years 1983, 1991, 1996, 1998, 1999); (D) the same as (C) but for the 5 years with the most extreme negative precipitations (years 1950, 1971, 1988, 2011, 2012). Shaded bars show correlations (r) and wind velocity (m/s) accordingly. Wind correlations and composites were extracted from NCEP-NCAR reanalyses (period 1948–2016 available). Rectangles in (A–D) highlights the NW Argentina study area.
Variations in PC1.ext are also related to SST over the South Atlantic during the spring–summer (October–March) season. Significant positive Pearson’s coefficients appear over a large oceanic area in the subtropical Atlantic Ocean (from 20 to 45° S). Over the 100-year period (1912–2016) a correlation coefficient of r = 0.49 (p < 0.05, n = 105) result from comparing our PC1.ext with seasonal (October–March) variations in sea surface South Atlantic temperatures (Supplementary Figure 2). Correlations between PC1.ext and vector wind anomalies at 850 mb for the period 1948–2016 show positive values alongside the equatorial tropics region and the mountain fringe over the subtropics from 15 to 35°S; negative correlations are located over the south-eastern South America region for the same spring–summer season. The composite mean of the five most extreme wet years (derived from PC1.ext) and wind direction and velocity at 850 mb (for 1948–2016 available reanalysis period) over South America (Figure 7C) indicate a significant air flow associated with moisture transport from the tropical Amazon region toward NWA. Figure 7D is the same analysis but for the five most extreme dry years and shows large wind circulation values centered at the eastern South America region and over southern South Atlantic Ocean.
Discussion
The present study provides an updated and long-term overview of interannual variations in precipitation in NW Argentina. This region embraces extreme diverse subtropical environments covering from the western lowland Chaco, the sub-Andean ranges to the upper-elevation Prepuna. Strong east–west rainfall gradients interact with marked temperature variations induced by elevation changes. Comparatively, climate variability in the region has been less studied than the nearby south-eastern South America (SESA). SESA contemplates an area of capital importance since it is the nucleus of the agricultural production which significantly contributes to the gross domestic product (World Bank data, 2018). On the other hand, the population in NWA represents ∼10% of the total of Argentina inhabitants (Instituto Nacional de Estadísticas y Censos República Argentina [INDEC], 2010) with an economy that largely relies on agriculture (traditionally tobacco, sugarcane, and critics; more recently soybean production) (Grau et al., 2005; Gasparri and Grau, 2009). This makes the region’s economy very sensitive to climate variations; 20% of the population lives in rural agricultural areas, while a considerable proportion live in small towns or in marginal areas of the large cities where climatic catastrophes are more pronounced due to the lack of infrastructure [i.e., in the last years: Tartagal (Salta) February/2006, February/2009; Balcozna (Catamarca) March/2015; northern valleys and Capital City (Catamarca) April/2017; Tilcara (Jujuy) February/2017, February/2018; Las Lajitas (Salta) March/2017; Santa Victoria Este (Salta) February/2018; Apolinario Saravia (Salta) October/2018]. Thus it is necessary to achieve a deeper knowledge about the forcing and recurrence of these severe climatic events that affect the socioeconomic activities in the region.
We compiled the meteorological records available to provide a robust estimate of the spatial–temporal variability of precipitation in NWA. The rugged topography introduces a wide range of environmental gradients that induce marked differences in precipitation regimes between nearby localities. However, regardless of location, all station display similar behavior on precipitation variability. PC scores for the annual (July–June) and wet (October–March) seasons, show that precipitation is concentrated in the summer period. PC1 scores of the dry season (April–September) show similar trends to PC1 for the wet season. Interannual variation of dry-season precipitation show persistence from conditions during the previous wet season, i.e., a wet rainy season is followed by a relatively humid dry season (i.e., Grimm and Saboia, 2015). However, there is a greater interannual variability in the records of the dry season even after the increase in rainfall in the 1970s. The moving standard deviations after 1970 show values that rise significantly; this occur when year-to-year values change dramatically. The large interannual variability recorded for the dry season could reflect the extreme low or even absent rainfall during this period in some years. From June to September, the NWA stations records rainfall ranging from 0 to 4 mm over the entire period. In general, the precipitation standard deviations during the winter dry season are higher than in the wet season, so winter precipitation is much more variable, occurring in some sites as snow precipitation.
In spite of this interannual pattern, the entire NWA region (from 22 to 30° S and from 62.5 to 67° W) exhibits a dominant, homogeneous pattern of interannual precipitation variability. The spatial representation of the PC1 October–March (wet season), reveals that this uniform pattern of interannual variations in NWA precipitation occurs in the 33.2% of the years (Figure 4), where wet (or dry) years are commonly occurring across the entire region, regardless of local variations associated with topography. For the period 1916–1990, Barros et al. (2000a) noted that the first principal component of the interannual precipitation variability along subtropical Argentina show a spatial pattern with abundant/reduced precipitation across the whole region, an indication that precipitation variability in NWA is largely influenced by broad-scale processes. Garreaud (2000) observed that summer convective storms are organized in meso-scale bands that span in large areas across the Central Andes and cause similar patterns of seasonal rainfall throughout the region. In the Bolivian Altiplano, summer precipitation largely depends on tropical moisture sources (Garreaud et al., 2003). Wet and dry episodes, due to anomalies in the upper zonal winds, occurs all across the Altiplano. Higher-order patterns of spatial variability show associations between precipitation and topography in NWA. The spatial pattern related to PC2 October–March, which explains 10% of the total variability, shows that precipitation at lowlands (below 900 m) shows an inverse relationship with that recorded at upper elevations. Finally, the pattern related to PC3 October–March (7.7% of the total variability) reveals that the stations located at the northeastern sector in the lowland Chaco display rainfall variations opposite to those recorded in most NWA weather stations.
Castino et al. (2017) performed a detailed analysis on NWA precipitation and found, on the basis of 13 records, a positive trend across the area for the period 1950–2014, although not spatially homogeneous. Additionally, these authors also recorded mixed precipitation patterns with no significant trends at low elevations, mainly negative at high elevations, and positive at the transition between low and intermediate elevations. They also state that by using 0.5° × 0.5° gridded CPC datasets rather than gauge data in these mountain environments, some difficulties in the interpretation of the results can arise. Yet, the paper supports the evidence that precipitation behaves differentially both at low (eastern) and high (western) elevations, as shown in the PC2 October–March spatial representation for our 34 instrumental stations in NWA (Figure 4).
The amplitude scores of the principal components are very useful to characterize the temporal expressions of common variations in precipitation throughout NWA. The amplitudes of PC1 October–March show a clear positive trend for the period 1934–1990 and important increases or jumps in the mid-1950s and mid-1970s. Our results are consistent with Castañeda and Barros (1994) analysis of precipitation trends east of the Andes showing positive trends during 1916–1991 for most Argentinean territory, with two marked increases or “jumps” in the late fifties and mid-seventies, with the latter persistent last for at least two decades. The marked increase in precipitation during the 20th century facilitated the agricultural expansion (especially soybean) in the arid Chaco lowlands, following the cutting of approximately 147,000 km2 of dry forest for the year 2013 (Gasparri and Grau, 2009; Volante et al., 2016; Baumann et al., 2017). The precipitation in SESA region throughout most of the last century (e.g., Liebmann et al., 2004; Barros et al., 2008) induced a growth in agricultural production (Viglizzo and Frank, 2006) and a sustained increase in river flow (Genta et al., 1998). Finally, the temporal expression of PC2 October–March and PC3 October–March, which cumulatively explain 17.7% of total variability show not clear patterns trends in the long-term precipitation variability.
Further analyses were conducted to identify those stations that most contributed to the dominant modes of precipitation variability across NWA to merge them in composite records and extend the precipitation series representative of each PC. The PC1 October–March extension series (pcAll; Figure 5) is composed by four records located along the Andean range, and consequently, representative of precipitation in the mountain sub-Andean front. The pcAll extends from 1874 to 2016 and shows some extreme positive wet seasons at the end of the 19th century, positive anomalies from 1955 to 1960 and particularly from 1975 to 2008. After that, precipitation fluctuates along the mean with two dry. Consecutive 2011–2012 years. Similar trends in total annual precipitation have been reported by Penalba and Robledo (2010) along northern Argentina for the period 1961–2000. The additional modes of precipitation variability during the wet season (pcW, pcE, and pcN) show similar positive shifts along the 1970s and negative reversals in 2008 and 2013. Two positive changes are displayed in pcS during the 1970s and after 2013; however, the 2013 shift significance is dubious due to the short interval for evaluation (only 3 years). A similar pattern, but with opposite signs is recorded for pcW series. From an extreme positive event in 2013, precipitation in La Quiaca (QUI) recorded in 2015 the most extreme negative event only comparable in intensity to the year 1915. In both cases, additional data is necessary to establish the stability of the pcS and pcW changes during the last years.
The first PCA (PC1.ext, Figure 6) from the five updated precipitation records in NWA captures around 60% of the total rainfall variability and provides a representative regional record longer than a century (1912–2016). This extended record captures the main features in rainfall variability including the increase in precipitation in the 1970s that lasts for almost four decades to 2008, as registered not only by the interannual amplitudes, but also by the Rodionov shift test. This extended record is in agreement with multi-decadal precipitation variations derived by Lovino et al. (2018) from the GPCP gridded dataset for the nearby northeastern Argentina region. According to these authors, the first PC, which ranges from 1905 to 2010 and accounts for 60% of the total variance, shows a persistent wet period between 1970 and 2005, followed by a dry period thenceforth. As stated above, the increase in precipitation during the second half of the 20th century allowed the expansion of agricultural practices into the dry Chaco lowlands, an extent area formerly dominated by hardwood forests adapted to the extreme dry-hot conditions within the so-called “heat pole of South America” (Prohaska, 1976). Barros et al. (2000a), Penalba and Robledo (2010), Saurral et al. (2016), and Castino et al. (2017) found positive trends in annual precipitation in most of northern (central, NE and NW) Argentina from late 1950s to 2000. Agosta and Compagnucci (2008) found the occurrence of a prolonged wet event from 1973 to the 2000s. According to these authors, the transition from a cold to a warm PDO phase in 1976/1977 was the onset of the wet period associated with a southward enhancement of the SALLJ that transport moisture from the Amazon region.
According to the PC1.ext, precipitation values below 5% of the data appear evenly distributed along the 105-year record. On the contrary, five of the six wettest events are concentrated from the 1980s to 2010s. Although our analyses end in the year 2016, it is worth to mention that the austral summers of 2017 and 2018 (not shown here) has been characterized by extremely heavy rains, suggesting that the wet conditions still prevail across the NWA. These wet events affected the upper basins of the subtropical mountains of Argentina and Bolivia, causing the displacement of more than 20,000 inhabitants and the total loss of goods and cattle at the locality of Santa Victoria Este in the lowland Chaco due to an extreme flood by the Pilcomayo River (Clarín, 2018; El Tribuno, 2018; La Nación, 2018). The occurrence of extremely dry events in 2003, 2011, and 2012, suggests an increment of extreme precipitation events in NWA. For instance, Cavalcanti et al. (2011) recorded an increase in drier conditions for some regions in La Plata basin during the last decades, with the occurrence of severe droughts in 1988/1989, 1995/1996, and 2008/2009, which are also present, though with different intensities, in our PC1.ext precipitation series.
Several studies have reported close relationships between precipitation variations in SESA and El Niño conditions in the tropical Pacific (e.g., Aceituno, 1988; Montecinos et al., 2000; Nogues-Paegle and Mo, 2002). Some very wet years in PC1.ext are associated with very strong (e.g., 1983, 1997/1998), and strong (1991, 1987, 1973, 1965) El Niño events, whereas only the very strong La Niña event in 1988 was concurrent with an extreme dry year in NWA. According to Grimm and Tedeschi (2009) during the El Niño events the low-level barotropic anticyclonic anomalies extend from northern-central Brazil to southeast Brazil, increasing the moisture inflow from the Atlantic and strengthening the SALLJ east of the Andes. These conditions for dynamical lift and convergence of moisture enhance rainfall in SESA (see below). The effect of the intensified subtropical jet would explain the relationship between strong El Niño and extreme rainfall some years. Nevertheless, Penalba and Rivera (2016) state that there is a weak association between the ENSO events and precipitation intensity in NWA, which would explain the poor relationships between these variables. On the other hand, surface temperature changes in the Pacific and Atlantic seem to be related to long-time scale hydroclimatic variability in NWA. Changes in the PDO phases seem to be coupled with precipitation changes in NWA (Supplementary Figure 2). As aforementioned, the climate shift in the tropical Pacific in 1970s associated with a phase change of the PDO is significantly related to an enhanced activity and positive trends in the SALLJ (Marengo et al., 2004). In addition, interdecadal variability of around 15 years has been observed in the SACZ (and river flows in La Plata basin) by Robertson and Mechoso (2000). In line with these observations, a tree-ring based river flow reconstruction from NWA shows an oscillation mode centered at 14 years that explains 12.4% of the river flow variability over the last 300 years (Ferrero et al., 2015).
The onset of the South America monsoon occurs by September in the equatorial Amazon and spreads to the east and southeastern Brazil by October (Vera et al., 2006). According to Garreaud et al. (2009), large amounts of moistures from the tropical Atlantic Ocean is transported to the Amazon basin and southward to La Plata basin by the SALLJ in connection to the very intense continental low formed over the Chaco region (the “Chaco Low”). According to Vera et al. (2006) the SALLJ is other of the primary elements associated with subtropical South American convective systems and the strongest winds can be found between 15 and 20° S, over the Bolivian lowlands and Paraguay. In line with these observations, the spatial correlation field between PC1.ext and gridded CRU precipitation show significant relationships with precipitation over southeast Bolivia, western Paraguay and to approx. 30° S in the subtropics (Figure 7A). Vuille and Keimig (2004) observed similar spatial patterns for near-surface humidity and cloud coverage along the eastern Andes. This flow toward the east suggests a strong relationship between variations in the NWA precipitation and the strength of the SALLJ. The spatial correlations field between PC1.ext precipitation series and mean meridional winds in summer (October to March) shows this pattern of stronger winds along the eastern flank of the tropical–subtropical Andes to NWA (Figure 7B). The spatial correlations also capture the continental-scale gyre that transports moisture westward from the tropical Atlantic Ocean to the Amazon basin, which in turn is channeled to the south by the SALLJ.
The South Atlantic convergence zone (SACZ), a semi-permanent band of cloudiness and convective precipitation extending from southern Amazonia through southeastern Brazil to the surrounding Atlantic Ocean, is a distinct feature of the SAMS (Kodoma, 1992; Carvalho et al., 2004). At intraseasonal scales, the SACZ is responsible for a see-saw in precipitation over eastern South America (Nogues-Paegle and Mo, 1997; Diaz and Aceituno, 2003). Enhanced activity over the SACZ is associated with an excess of precipitation in its core and southern Brazil and a concurrent decrease in rainfall in the subtropical plains (northern Argentina, Paraguay, and Uruguay) (Gandú and Silva Diaz, 1998). The opposite conditions (increased southward moisture flux from the Amazon region) prevail during weak SACZ periods (Diaz and Aceituno, 2003). Interestingly, while positive relationships occur between the PC1.ext and monsoon summer circulation, negative relationships between our PC1.ext and summer winds emerge over the SACZ core. Hence, our composite precipitation series of NWA is capturing all important hemispheric patterns related to the summer monsoon circulation.
Given the relationship between tropical transport and SACZ, contrasting phases in the subtropical precipitation should emerge by comparing years with enhanced and reduced precipitation over NW Argentina. Based on the NCEP–NCAR reanalysis, the five wettest years in the regional PC1.ext precipitation series for the period 1948–2016 were selected to compose the hemispheric wind anomalies at 850 mb over South America. Figure 7C shows the emerging features of these comparisons consistent in the continental wind gyre from the tropics complemented with the SALLJ from the Amazon basin toward the subtropical (NWA) latitudes. Other circulation features associated with PC1.ext are the cyclonic-type wind anomalies on the west sector of the continent and the anticyclonic anomalies the southeastern Pacific that favor a strong subtropical low-level jet stream along the eastern flank of the central Andes (Diaz and Aceituno, 2003). This circulation pattern is consistent with a strengthened Chaco low over NWA, as revealed by the presence of positive 850 mb anomalies over the region (which in turn is consistent with a weakened SACZ). On the contrary, the composite from the five driest years in PC1.ext (Figure 7D) show exactly the opposite pattern to that described for the wet years. A core of cyclonic anomaly and enhanced circulation activity is located over Brazilian and the adjacent Atlantic Ocean (north of the mean position of the SACZ). On the other hand, a large anticyclonic circulation anomaly in the southern portion of the continent exerts a blocking effect on the westerly flow. Low-level zonal westerly (easterly) winds over tropical Brazil during summer are associated with an active (inactive) SACZ and moisture divergence (convergence) over SESA, implying a weak (strong) SALLJ (Herdies et al., 2002; Jones and Carvalho, 2002; Vera et al., 2006). The patterns shown in Figures 7C,D are consistent with the regional summer circulation (and rainfall) proposed for the South American monsoon (e.g., Nogues-Paegle and Mo, 1997, 2002).
One of the factors that influence the interannual precipitation variability in NWA is related to SST anomalies over the subtropical South Atlantic off the South American coast. The subtropical high over South Atlantic advects moisture from the ocean to the continent between 25 and 40°S, due to the pressure gradient between the south Atlantic subtropical high and the Chaco low (Nogues-Paegle and Mo, 2002). In addition, the SST anomalies could modify regional circulation by affecting vertical movements (Barros et al., 2000b). The anomalies located in the western subtropical South Atlantic can differentially influence the northeast and northwestern regions of Argentina (Robertson and Mechoso, 2000). According to Barros et al. (2000b) the SESA region receives moisture from the Amazon basin and the Atlantic Ocean, being the latter controlled by the SACZ position. These authors showed that a warmer SST is associated with a displacement to the south of the climatological position of the SACZ. A southward-displaced SACZ tends to be weaker (or absent) and could favor the development of a stronger low-level jet (Herdies et al., 2002). This translates in an enhanced moisture transport from the Amazon to the subtropical latitudes of South America. Figure 7A shows the significant positive correlations between NWA precipitation and sea-surface temperatures, with significant positive correlations between the two series for the last 105 years (Supplementary Figure 3). The correlation between SST and precipitation over NWA suggests that warmer SSTs promote a weaker SACZ and an enhanced advection of tropical moisture to NWA through the SALLJ (Diaz and Aceituno, 2003). On the other hand, long-term changes in NWA precipitation could be related to enhanced moisture flux partly driven by the Atlantic Ocean SST as suggested by Wang et al. (2018). The increase in the sea-surface temperature over the South Atlantic Ocean triggered a strengthened deep convection in the last decades, which resulted in areas with intensified convergence and increased precipitation such as the tropical Amazon basin and the subtropical Andean ridge. Overall, the Atlantic Ocean forcing on NWA precipitation variability is complex through changes in the intensity of the moisture source as well as on the influences on ocean-atmosphere circulation.
The increase in precipitation over NWA (22°–29° S and 62.5°–67° W) since 1970s identified in the 34 records (Supplementary Material) compiled in this study, from the Chaco lowlands through the Andean mountain range, to high-elevation Prepuna, suggesting that this change in mean conditions respond to large-scales climate variability. Castino et al. (2017) results reflect similar patterns in NWA, while Lovino et al. (2018) show analogous variations in the nearby region of northeastern Argentina. According to our records, the positive trend in precipitation has leveled during the last years (from 2010s). The interruption in the positive trend has also been identified in surrounding regions including the central-western Argentina (29°–36° S; Agosta and Compagnucci, 2012) and northeastern Argentina (Lovino et al., 2018). The recent changes in precipitation trends have been attributed by these authors to Pacific low-frequency SST variability. Marengo (2009) showed that hydroclimate variations in the Amazonia are characterized by decadal to multi-decadal cycles, which may also affect rainfall in the NWA (Figure 6). Nevertheless, Soares and Marengo (2009) determined that under a warming scenario, the moisture flux from tropical regions could increment in over 40%, which would accelerate the hydrological cycle and increase the frequency of the extreme rainfall events already detected in the northern Argentina region (Marengo et al., 2009).
According to Magrin et al. (2014), “the severity of the impacts from climate extremes depend not only on the extreme themselves but also on exposure and vulnerability” from humans. Heavy deforestation, poor economic conditions and infrastructure, and slow governmental responses, affect large areas in NWA and especially marginal sectors of the population. The capability of the precipitation record obtained by broad-scale instrumental stations in NW Argentina of capturing quite accurately the main features of the South American monsoon dynamics, opens the opportunity of deeper investigate the contributions of each large-scale forcing to the precipitation in these subtropical areas. The magnitude of coming hydroclimatic events has yet to be assessed to improve water managing and prevent repeatedly disasters in the subtropical Andean range and adjacent lowlands.
Author Contributions
MF and RV developed the study, carried out statistical analysis, and wrote the manuscript. MF updated, reanalyzed the climatic data, and designed the figures.
Funding
This work was supported by the Argentinean National Agency for Promotion of Science and Technology (ANPCyT) under project PICT-2014-2797, the International Fellowship Program of CONICET and partially funded by BNP Paribas Foundation. Servicio Meteorológico Nacional de Argentina (SMN), Instituto Nacional de Tecnología Agropecuaria (INTA) and Estación Experimental Obispo Colombres (EEAOC, Tucumán) provided the instrumental records of precipitation.
Conflict of Interest Statement
The authors declare that the research was conducted in the absence of any commercial or financial relationships that could be construed as a potential conflict of interest.
Acknowledgments
We wish to thank Federico Otero, Juan Rivera (IANIGLA, CONICET) and Mónica De Membiela for helping with climatic data, Dave Meko (LTRR, U. Arizona) for providing support with time-series analysis, Lidia Ferri (IANIGLA, CONICET) for assisting with cartographic material, and both reviewers. The science and technology system in Argentina is nowadays on the verge of collapse due to budget cuts. We urge the Argentinean government to revert current policies.
Supplementary Material
The Supplementary Material for this article can be found online at: https://www.frontiersin.org/articles/10.3389/feart.2019.00148/full#supplementary-material
Footnotes
- ^ https://sites.google.com/site/climatelogic/
- ^ https://climexp.knmi.nl/
- ^ https://www.esrl.noaa.gov/psd/cgi-bin/data/testdap/corr.pl/
- ^ https://www.esrl.noaa.gov/psd/cgi-bin/data/composites/printpage.pl
References
Aceituno, P. (1988). On the functioning of the Southern oscillation in the South American sector. Part I: surface climate. Mon. Wea. Rev. 116, 505–524. doi: 10.1175/1520-0493(1988)116<0505:otfots>2.0.co;2
Aceituno, P., Prieto, M. D. R., Solari, M. E., Martínez, A., Poveda, G., and Falvey, M. (2009). The 1877–1878 El Niño episode: associated impacts in South America. Clim. Change 92, 389–416.
Agosta, E. A., and Compagnucci, R. H. (2008). The 1976/77 austral summer climate transition effects on the atmospheric circulation and climate on southern South America. J. Clim. 21, 4365–4383. doi: 10.1175/2008jcli2137.1
Agosta, E. A., and Compagnucci, R. H. (2012). Central-west Argentina summer precipitation variability and atmospheric teleconnections. J. Clim. 25, 1657–1677. doi: 10.1175/jcli-d-11-00206.1
Báez, S., Malizia, A., Carilla, J., Blundo, C., Aguilar, M., Aguirre, N., et al. (2015). Large-scale patterns of turnover and basal area change in Andean forests. PLoS One 10:e0126594. doi: 10.1371/journal.pone.0126594
Barros, R. V., Boninsegna, J. A., Camilloni, I. A., Chidiak, M., Magrín, G. O., and Rusticucci, M. (2015). Climate change in Argentina: trends, projections, impacts and adaptation. WIREs Clim. Change 6, 151–169. doi: 10.1002/wcc.316
Barros, V. R., Doyle, M. E., and Camilloni, I. A. (2008). Precipitation trends in southeastern South America: relationship with ENSO phases and with low-level circulation. Theor. Appl. Climatol. 93, 19–33. doi: 10.1007/s00704-007-0329-x
Barros, V., Castañeda, M. E., and Doyle, M. (2000a). “Recent precipitation trends in Southern South America East of the Andes: an indication of climate variability,” in Southern Hemisphere Paleo and Neoclimates, eds P. Smolka and W. Volkheimer (Berlin: Springer-Verlag), 187–206. doi: 10.1007/978-3-642-59694-0_13
Barros, V., Gonzalez, M., Liebmann, B., and Camilloni, I. (2000b). Influence of the South Atlantic convergence zone and South Atlantic sea surface temperature on interannual summer rainfall variability in southeastern South America. Theor. Appl. Climatol. 67, 123–133. doi: 10.1007/s007040070002
Baumann, M., Gasparri, I., Piquer-Rodríguez, M., Gavier Pizarro, G., Griffiths, P., Hostert, P., et al. (2017). Carbon emission from agricultural expansion and intensification in the Chaco. Glob. Change Biol. 23, 1902–1916. doi: 10.1111/gcb.13521
Boers, N., Bookhagen, B., Barbosa, H., Marwan, N., Kurths, J., and Marengo, J. A. (2014). Prediction of extreme floods in the Central Andes by means of Complex Networks. Nat. Commun. 5:5199. doi: 10.1038/ncomms6199
Boninsegna, J. A., Argollo, J., Aravena, J. C., Barichivich, J., Christie, D., Ferrero, M. E., et al. (2009). Dendroclimatological reconstructions in South America: a review. Palaeogeogr. Palaeocl. 281, 210–228. doi: 10.1016/j.palaeo.2009.07.020
Briggs, P. R., and Cogley, J. G. (1996). Topographic bias in mesoscale precipitation networks. J. Clim. 9, 205–218. doi: 10.1175/1520-0442(1996)009<0205:tbimpn>2.0.co;2
Carilla, J., Grau, H. R., Paolini, L., and Morales, M. (2013). Lake fluctuations, plant productivity, and long term variability in high elevation tropical Andean ecosystems. Arct. Antarct. Alp. Res. 45, 179–189. doi: 10.1657/1938-4246-45.2.179
Carvalho, L., Jones, C., and Liebmann, B. (2004). The South Atlantic Convergence Zone: intensity, form, persistence, and relationships with intraseasonal to interannual activity and extreme rainfall. J. Clim. 17, 88–108. doi: 10.1175/1520-0442(2004)017<0088:tsaczi>2.0.co;2
Castañeda, M. E., and Barros, V. (1994). Las tendencias de la precipitación en el Cono Sur de América al este de los Andes. Meteorologica 19, 23–32.
Castino, F., Bookhagen, B., and Strecker, M. R. (2017). Rainfall variability and trends of the past six decades (1950-2014) in the subtropical NW Argentine Andes. Clim. Dyn. 48, 1049–1067. doi: 10.1007/s00382-016-3127-2
Cavalcanti, I. F. A., Carril, A. F., Barreiro, M., Bettolli, M. L., Cherchi, A., and Grimm, A. (2011). CLARIS LPB WP6: processes and future evolution of extreme climate events in La Plata Basin. CLIVAR Exch. 57, 22–24.
Clarín (2018). Pilcomayo: inundaciones y olvido. Available at: https://www.clarin.com/opinion/pilcomayo-inundaciones-olvido-0-SyilRu9nf.html (accessed May, 2018).
Diaz, A. F., and Aceituno, P. (2003). Atmospheric circulation anomalies during episodes of enhanced and reduced convective cloudiness over Uruguay. J. Climate 16, 3171–3185. doi: 10.1175/1520-0442(2003)016<3171:acadeo>2.0.co;2
Diaz, H., Eischeid, J., Duncan, C., and Bradley, R. S. (2003). Variability of freezing levels, melting season indicators, and snow cover for selected high-elevation and Continental regions in the last 50 years. Climat. Change 59, 33–52. doi: 10.1007/978-94-015-1252-7_3
El Tribuno (2018). Temen una nueva crecida por las lluvias en Bolivia. Available at: https://www.eltribuno.com/salta/nota/2018-2-23-0-0-0-temen-una-nueva-crecida-del-pilcomayo-por-las-lluvias-en-bolivia (accessed March, 2018).
Fadrique, B., Báez, S., Duque, A., Malizia, A., Blundo, C., Carilla, J., et al. (2018). Widespread but heterogeneous responses of Andean forests to climate change. Nature 564, 207–212. doi: 10.1038/s41586-018-0715-9
Ferrero, M. E. (2011). Changes in Woody Growth in the Subtropical Regions of South America in Relation to Climatic Variability. Ph. D. dissertation, Universidad Nacional de Córdoba: Córdoba.
Ferrero, M. E., Villalba, R., De Membiela, M., Ferri Hidalgo, L., and Luckman, B. H. (2015). Tree-ring based reconstruction of Río Bermejo streamflow in subtropical South America. J. Hydrol. 525, 572–584. doi: 10.1016/j.jhydrol.2015.04.004
Gandú, A. W., and Silva Diaz, P. L. (1998). Impact of tropical heat sources on the South American tropospheric circulation and subsidence. J. Geophys. Res. 103, 6001–6015. doi: 10.1029/97jd03114
Garcia, N. O., Nieto Ferreira, R., and Latrubesse, E. M. (2011). “Climate and geomorphologic-related disasters in Latin America,” in Natural Hazard and Human-Exacerbated Disaster in Latin America, ed. E. Latrubesse (Amsterdam: Elsevier), 1–27. doi: 10.1016/s0928-2025(08)10001-3
Garreaud, R. D. (2000). Cold air incursions over subtropical South America: mean structure and dynamics. Mon. Weather Rev. 128, 2544–2559. doi: 10.1175/1520-0493(2000)128<2544:caioss>2.0.co;2
Garreaud, R. D., Vuille, M., and Clement, A. C. (2003). The climate of the Altiplano: observed current conditions and mechanisms of past changes. Palaeogeogr. Palaeocl. 194, 5–22. doi: 10.1016/s0031-0182(03)00269-4
Garreaud, R. D., Vuille, M., Compagnucci, R., and Marengo, J. (2009). Present–day South American climate. Palaeogeogr. Palaeocl. 281, 180–195. doi: 10.1016/j.palaeo.2007.10.032
Gasparri, N. I., and Grau, H. R. (2009). Deforestation and fragmentation of Chaco dry forests in NW Argentina (1972-2007). For. Ecol. Manag. 258, 913–921. doi: 10.1016/j.foreco.2009.02.024
Genta, J. L., Perez-Iribarren, G., and Mechoso, C. R. (1998). A recent increasing trend in the streamflow of rivers in southeastern South America. J. Clim. 11, 2858–2862. doi: 10.1175/1520-0442(1998)011<2858:aritit>2.0.co;2
Grau, H. R., Gasparri, N. I., and Aide Mitchel, T. (2005). Agriculture expansion and deforestation in seasonally dry forests of north-western Argentina. Environ. Conserv. 32, 140–148. doi: 10.1017/s0376892905002092
Grimm, A. M., and Saboia, J. P. J. (2015). Interdecadal variability of the South American precipitation in the monsoon season. J. Clim. 28, 755–775. doi: 10.1175/jcli-d-14-00046.1
Grimm, A. M., and Tedeschi, R. G. (2009). ENSO and extreme rainfall events in South America. J. Clim. 22, 1589–1609. doi: 10.1175/2008jcli2429.1
Herdies, D. L., da Silva, A., Dias, M. A. S., and Nieto-Ferreira, R. (2002). Moisture budget of the bimodal pattern of the summer circulation over South America. J. Geophys. Res. 107, 8075–8088.
Instituto Nacional de Estadísticas y Censos, República Argentina [INDEC] (2010). Available at: https://www.sig.indec.gob.ar/censo2010/ (accessed June, 2018).
Jones, C., and Carvalho, L. M. (2002). Active and break phases in the South American monsoon system. J. Clim. 15, 486–494.
Kodoma, Y. (1992). Large-scale common features of subtropical precipitation zones (the Baiu frontal zone, the SPCZ and the SACZ). Part I: characteristic of subtropical frontal zones. J. Meteorol. Soc. Jpn. 70, 813–836. doi: 10.2151/jmsj1965.70.4_813
La Nación (2009). Desastre en Tartagal por un alud de lodo. Available at: https://www.lanacion.com.ar/1098346-desastre-en-tartagal-por-un-alud-de-lodo (accessed March, 2018).
La Nación (2018). El Pilcomayo no deja de crecer y aísla a varios parajes salteños. Available at: https://www.lanacion.com.ar/2106627-el-pilcomayo-no-deja-de-crecer-y-aisla-a-varios-parajes-salteno (accessed March, 2018).
La Sorte, F., and Jetz, W. (2010). Projected range contractions of montane biodiversity under global warming. Proc. R. Soc. Lond. 227, 3401–3410. doi: 10.1098/rspb.2010.0612
Latrubesse, E., and Brea, D. (2011). “Floods in Argentina,” in Natural Hazard and Human-Exacerbated Disaster in Latin America, ed. E. Latrubesse (Amsterdam: Elsevier), 333–349. doi: 10.1016/s0928-2025(08)10016-5
Liebmann, B., Vera, C. S., Carvalho, L. M. V., Camilloni, I. A., Hoerling, M. P., Allured, C., et al. (2004). An observed trend in central South American precipitation. J. Clim. 17, 4357–4367. doi: 10.1098/rstb.2017.0300
Lovino, M. A., Müller, O. V., Müller, G. V., Sgroi, L. C., and Baethgen, W. E. (2018). Interannual-to-multidecadal hydroclimate variability and its sectoral impacts in northeastern Argentina. Hydrol. Earth Syst. Sci. 22, 3155–3174. doi: 10.5194/hess-22-3155-2018
Magrin, G. O., Marengo, J. A., Boulanger, J.-P., Buckeridge, M. S., Castellanos, E., Poveda, G., et al. (2014). “Central and South America,” in Climate Change 2014: Impacts, Adaptation, and Vulnerability. Part B: Regional Aspects. Contribution of Working Group II to the Fifth Assessment Report of the Intergovernmental Panel on Climate Change, eds V. R. Barros, C. B. Field, D. J. Dokken, M. D. Mastrandrea, (Cambridge: Cambridge University Press), 1499–1566.
Marengo, J. A. (2009). Long-term trends and cycles in the hydrometeorology of the Amazon basin since the late 1920s. Hydrol. Process. 23, 3236–3244. doi: 10.1002/hyp.7396
Marengo, J. A., Jones, R., Alves, L. M., and Valverde, M. C. (2009). Future change of temperature and precipitation extremes in South America as derived from the PRECIS regional climate modelling system. Int. J. Climatol. 29, 2241–2255. doi: 10.1002/joc.1863
Marengo, J. A., Soares, W. R., Saulo, C., and Nicolini, M. (2004). Climatology of the Low-Level Jet east of the Andes as derived from the NCEP–NCAR reanalyses: characteristics and temporal variability. J. Clim. 17, 2261–2280. doi: 10.1175/1520-0442(2004)017<2261:COTLJE>2.0.CO;2
Masiokas, M. H., Villalba, R., Luckman, B. H., Montaña, E., Betman, D., Christie, D., et al. (2013). “Recent and historic Andean snowpack and streamflow variations and vulnerability to water shortages in central-western Argentina,” in Climate Vulnerability: Understanding and Addressing Threats to Essential Resources, ed. R. A. Pielke (Amsterdam: Elsevier), 213–227. doi: 10.1016/b978-0-12-384703-4.00522-0
Messerli, B., Viviroli, D., and Weingartner, R. (2004). Mountains of the world: vulnerable water towers for the 21st century. AMBIO Special Rep. 13, 29–34.
Minetti, J. L., and Vargas, W. M. (1997). Trends and jumps in the annual precipitation in South America, south of the 15° S. Atmósfera 11, 205–221.
Montecinos, A., Díaz, A., and Aceituno, P. (2000). Seasonal diagnostic and predictability of rainfall in subtropical South America based on tropical Pacific SST. J. Clim. 13, 746–758. doi: 10.1175/1520-0442(2000)013<0746:sdapor>2.0.co;2
Neukom, R., Luterbacher, J., Villalba, R., Küttel, M., Frank, D., Jones, P. D., et al. (2010). Multi-centennial summer and winter precipitation variability in southern South America. Geophys. Res. Lett. 37:L14708.
Neukom, R., Prieto, M. D. R., Moyano, R., Luterbacher, J., Pfister, C., Villalba, R., et al. (2009). An extended network of documentary data from South America and its potential for quantitative precipitation reconstruction back to the 16th century. Geophys. Res. Lett. 36:L12703.
Nogues-Paegle, J., and Mo, K. C. (1997). Alternating wet and dry conditions over South America during summer. Mon. Weather Rev. 125, 279–291. doi: 10.1175/1520-0493(1997)125<0279:awadco>2.0.co;2
Nogues-Paegle, J., and Mo, K. C. (2002). Linkages between summer rainfall variability over South America and sea surface temperature anomalies. J. Clim. 15, 1389–1407. doi: 10.1175/1520-0442(2002)015<1389:lbsrvo>2.0.co;2
Nosetto, M. D., Jobbágy, E. G., Brizuela, A. B., and Jackson, R. B. (2012). The hydrologic consequences of land cover change in central Argentina. Agr. Ecosyst. Environ. 154, 2–11. doi: 10.1016/j.agee.2011.01.008
Página12 (2009). Mucho más que una catástrofe natural. Available at: https://www.pagina12.com.ar/diario/sociedad/3-119773-2009-02-10.html (accessed March, 2018).
Penalba, O. C., and Robledo, F. A. (2010). Spatial and temporal variability of the frequency of extreme daily rainfall regime in the La Plata Basin during the 20th century. Climat. Change 98, 531–550. doi: 10.1007/s10584-009-9744-6
Penalba, O. G., and Rivera, J. A. (2016). Precipitation response to El Niño/La Niña events in South America – emphasis in regional drought occurrences. Adv. Geosci. 42, 1–14.
Piovano, E. L., Córdoba, F. E., and Stutz, S. (2014). Limnogeology in Southern South America: an overview. Lat. Am. J. Sedimentol. Basin Anal. 21, 65–75.
Prohaska, F. J. (1976). “Climates of Central and South America,” in World Survey of Climatology, ed. W. S. Schwerdtfeger (Amsterdam: Elsevier), 13–112.
Robertson, A., and Mechoso, C. R. (2000). Interannual and interdecadal variability of the South Atlantic convergence zone. Mon. Wea. Rev. 128, 2947–2957. doi: 10.1175/1520-0493(2000)128<2947:iaivot>2.0.co;2
Rodionov, S. N. (2004). A sequential algorithm for testing climate regime shifts. Geophys. Res. Lett. 31:L09204.
Rodionov, S. N. (2006). The use of prewhitening in climate shift detection. Geophys. Res. Lett. 33: 12707.
Saulo, C. E., Seluchi, M. E., and Nicolini, M. (2004). A case study of a Chaco low-level jet event. Mon. Weather Rev. 132, 2669–2683. doi: 10.1175/mwr2815.1
Saurral, R. I., Camilloni, I. A., and Barros, V. R. (2016). Low-frequency variability and trends in centenial precipitation stations in southern South America. Int. J. Climatol. 37, 1774–1793. doi: 10.1002/joc.4810
Sevruk, B., and Kirchhofer, W. (1992). The Mean Annual Corrections of Measured Precipitation Amounts, 1951-1980. Bern: Hydrological Atlas of Switzerland.
Soares, W. R., and Marengo, J. A. (2009). Assessments of moisture fluxes east of the Andes in South America in a global warming scenario. Int. J. Climatol. 29, 1395–1414. doi: 10.1002/joc.1800
Vera, C., Higgins, W., Amador, J., Ambrizzi, T., Garreaud, R. D., Gochis, D., et al. (2006). Toward a unified view of the American monsoon systems. J. Clim. 19, 4977–5000. doi: 10.1175/jcli3896.1
Viglizzo, E., and Frank, F. C. (2006). Ecological interactions, feedbacks, thresholds and collapses in the Argentine Pampas in response to climate and farming during the last century. Quat. Int. 158, 122–126. doi: 10.1016/j.quaint.2006.05.022
Viviroli, D., and Weingartner, R. (2004). The hydrological significance of mountains: from regional to global scale. Hydrol. Earth Syst. Sci. 8, 1017–1030. doi: 10.5194/hess-8-1017-2004
Volante, J. N., Mosciaro, M. J., Gavier-Pizarro, G. I., and Paruelo, J. M. (2016). Agricultural expansion in the Semiarid Chaco: poorly selective contagious advance. Land Use Policy 55, 154–165. doi: 10.1016/j.landusepol.2016.03.025
Vuille, M., and Keimig, F. (2004). Interannual variability of summertime convective cloudiness and precipitation in the central Andes derived from ISCCP-B3 data. J. Clim. 17, 3334–3348. doi: 10.1175/1520-04422004)017<3334:ivoscc>2.0.co;2
Vuille, M., Burns, S., Taylor, B., Cruz, F., Bird, B., Abbott, M., et al. (2012). A review of the South American monsoon history as recorded in stable isotopic proxies over the past two millennia. Clim. Past 8, 1309–1321. doi: 10.5194/cp-8-1309-2012
Vuille, M., Francou, B., Wagnon, P., Jue, I., Kaser, G., Mark, B. G., et al. (2008). Climate change and tropical Andean glaciers: past, present and future. Earth Sci. Rev. 89, 79–96. doi: 10.1016/j.earscirev.2008.04.002
Wang, X. Y., Li, X., Zhu, J., and Tanajura, C. A. S. (2018). The strengthening of Amazonian precipitation during the wet season driven by tropical sea surface temperature forcing. Environ. Res. Lett. 13:094015. doi: 10.1088/1748-9326/aadbb9
Wilks, D. S. (2011). Statistical Methods in the Atmospheric Sciences. San Diego, CA: Academic Press.
World Bank data (2018). Available at: https://datos.bancomundial.org/indicador/NV.AGR.TOTL.ZS?end=2017&locations=AR&start=1965 (accessed November, 2018).
Keywords: rainfall variability, extreme events, subtropical South America, NW Argentina, mountain hydroclimatology
Citation: Ferrero ME and Villalba R (2019) Interannual and Long-Term Precipitation Variability Along the Subtropical Mountains and Adjacent Chaco (22–29° S) in Argentina. Front. Earth Sci. 7:148. doi: 10.3389/feart.2019.00148
Received: 28 December 2018; Accepted: 27 May 2019;
Published: 12 June 2019.
Edited by:
Raquel Nieto, University of Vigo, SpainReviewed by:
Eduardo Zorita, Helmholtz Centre for Materials and Coastal Research (HZG), GermanyEveraldo Barreiros De Souza, Federal University of Pará, Brazil
Copyright © 2019 Ferrero and Villalba. This is an open-access article distributed under the terms of the Creative Commons Attribution License (CC BY). The use, distribution or reproduction in other forums is permitted, provided the original author(s) and the copyright owner(s) are credited and that the original publication in this journal is cited, in accordance with accepted academic practice. No use, distribution or reproduction is permitted which does not comply with these terms.
*Correspondence: María Eugenia Ferrero, bWZlcnJlcm9AbWVuZG96YS1jb25pY2V0LmdvYi5hcg==