 Tao Feng
 Zachary Tipton4
- 1Department of Atmospheric Sciences, Yunnan University, Kunming, China
- 2Key Laboratory of Atmospheric Environment and Processes in the Boundary Layer Over the Low-Latitude Plateau Region, Yunnan University, Kunming, China
- 3State Key Laboratory of Numerical Modeling for Atmospheric Sciences and Geophysical Fluid Dynamics (LASG), Institute of Atmospheric Physics, Chinese Academy of Sciences, Beijing, China
- 4Department of Biological Sciences, University of Arkansas, Fayetteville, AR, United States
In recent decades, Southwest China (SWC) has experienced a series of severe and extensive droughts resulting in tremendous socioeconomic losses. The annual maximum dry spell length (AMDSL), which refers to the number of consecutive days without rainfall, or days with rainfall below a threshold, plays an important role in triggering drought. The main objective of this study is to provide a comparison of the capabilities of current regional climate models (RCMs) in simulating extreme dry spell characteristics in mountainous SWC. Five available RCM simulations utilized in the Coordinated Regional Climate Downscaling Experiment (CORDEX)-East Asia project over 1981–2005 were employed in this study; the RCMs being NIMR-HadGEM3, SNU-MM5, SNU-WRF, KNU-RegCM4, and YSU-RSM. First, it was found that all of the RCMs reasonably simulate the main seasonality features of rainfall and dry days in SWC. Furthermore, four of the RCMs, excepting YSU-RSM, can accurately capture the spatial pattern of dry-day occurrence based on Taylor diagram diagnosis. Second, we assessed the performance of the five RCMs to detect and reproduce the climatology and variability of the AMDSL. In general, the RCMs simulate the spatial pattern of long-term mean and interannual variability of the AMDSL in SWC well. Based on Taylor diagram evaluation, NIMR-HadGEM3 was the best among the five in simulating the AMDSL characteristics. Third, the generalized extreme value (GEV) distribution is considered the most suitable model for fitting the AMDSL in both observation and RCM experimental data in comparison to other three-parameter probabilistic models. Higher value centers of the scale parameter and the location parameter indicate a wider and amplified distribution of the AMDSL over the low-latitude highlands (LLH) region against other areas in SWC, which is consistent with the spatial patterns of climatological AMDSL. In addition, sensitivity analysis of different thresholds for dry days shows that the 1 mm threshold is suitable for this study and that different threshold choices have little effect on simulation ability. Overall, the results show that although significant differences are found between RCMs, the RCMs excepting YSU-RSM can reasonably reveal extreme dry spell occurrence and amplitude, along with the spatial distribution of the AMDSL at a 20-year return period in SWC. This information is useful for model evaluation and improvement, future climate projections, and water resource risk management.
Introduction
Southwest China (SWC), as shown in Figure 1, covers an area of approximately 1.23 million km2, or 12.9% of China, containing four provinces and one municipality. SWC is one of the most densely populated and highest grain-producing regions in China and also contains the headwaters of many important rivers for supplying water to Chinese agriculture and the Mekong River Basin (MRB). Droughts have had significant impacts on economic growth, water scarcity, crop failure, and the daily lives of millions of people in this area (Qin et al., 1997; Cheng et al., 2009). In recent decades, droughts, as defined by National Climate Center, have been widespread and frequent in SWC and have been associated with 60% of the economic losses from all meteorological disasters (Qin et al., 1997; Cheng et al., 2009; Wang et al., 2015). Severe droughts were observed more frequently in the area during the last decade, with the summer of 2006, the autumn of 2009 to the spring of 2010 (Yang et al., 2011; Barriopedro et al., 2012), and the summer of 2011 (Sun and Yang, 2012; Wang et al., 2014) being most notable. Considerable efforts have been expended on surveying the drought characteristics as well as establishing the possible physical causes and mechanisms of droughts in SWC, which have been reviewed by Wang et al. (2015).
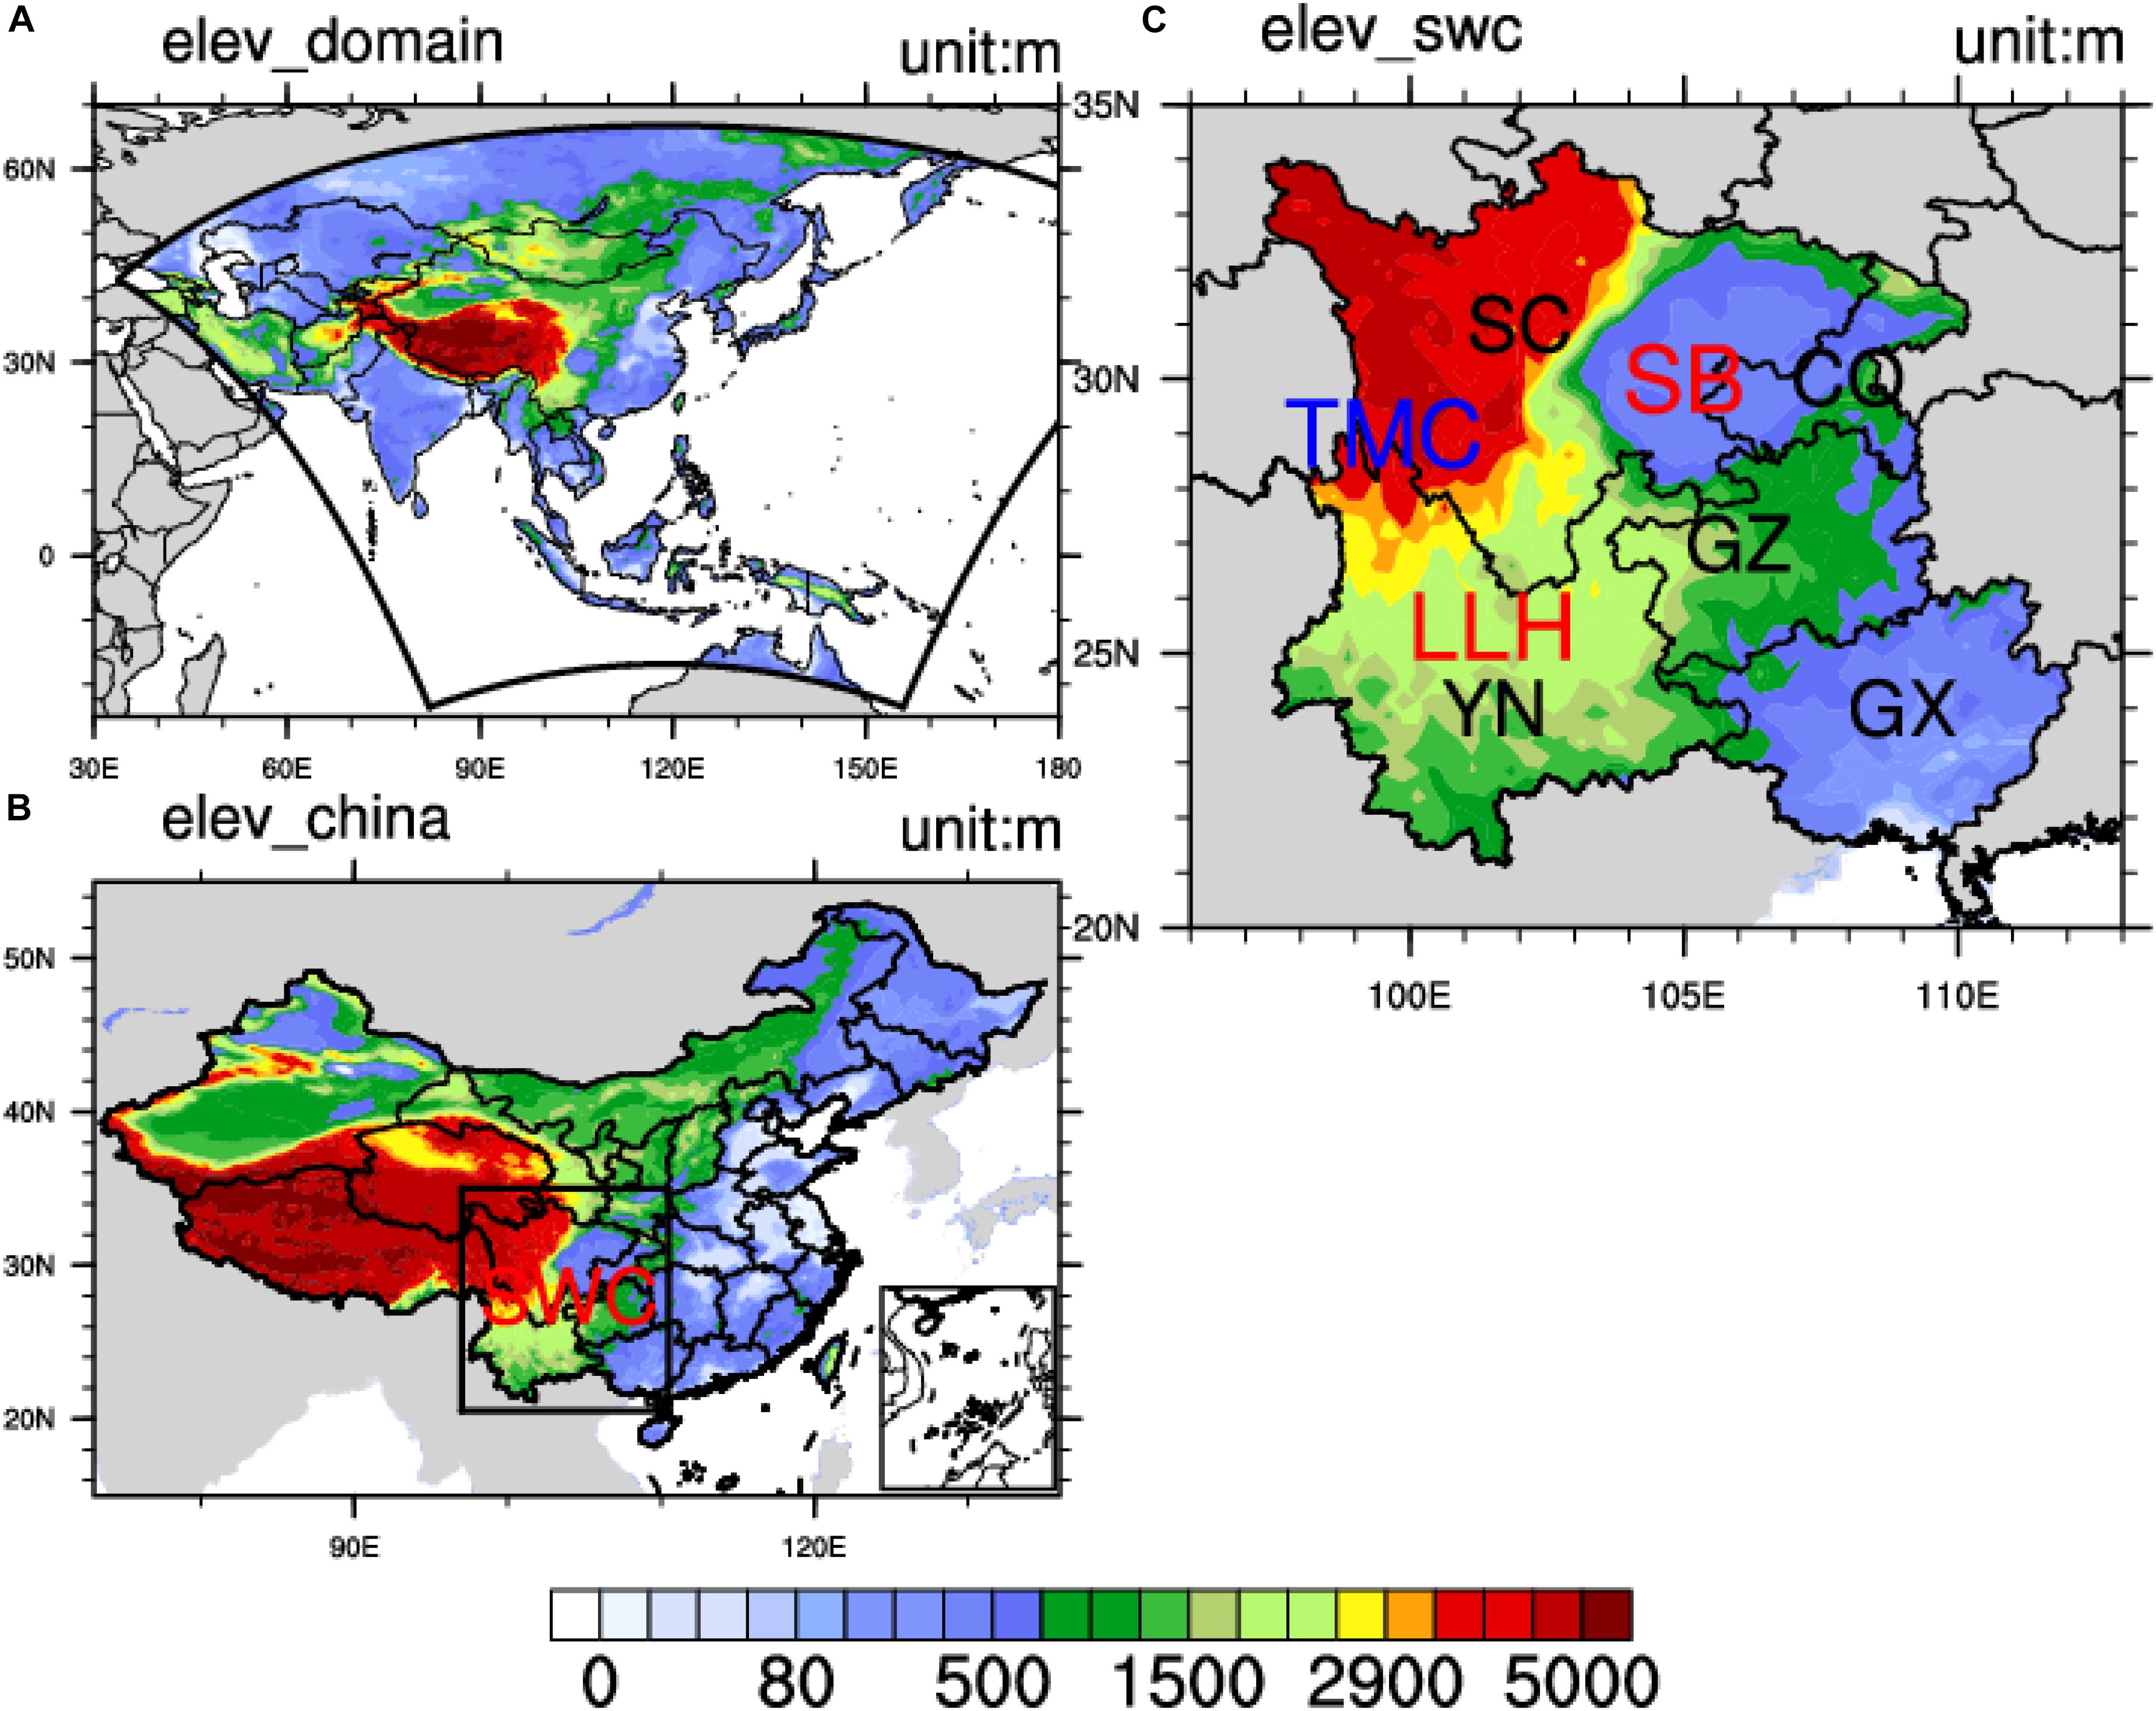
Figure 1. (A) The entire CORDEX East Asia domain (within the outer black line). (B) The analysis sub-region, Southwest China (SWC), with latitudes and longitudes ranging from 21°N to 35°N and 98°E to 112°E, respectively. (C) Zoomed view of SWC with administrative divisions (black font) and main terrain elements (colored font) marked. Shading indicates topography.
To assess drought characteristics and impacts, it is necessary to study hydro-meteorological variables that affect water availability, including precipitation frequency and intensity, evaporation, and dry spells (Vicente-Serrano et al., 2010; Spinoni et al., 2019). In particular, the number of consecutive dry days (CDD) without rainfall, or days with rainfall below a specific threshold, is defined as a dry spell. This variable can show the effect of long periods of precipitation deficit on soil moisture conditions, ground water levels, and available water in reservoirs (Tebaldi et al., 2006; Modarres, 2010; Sushama et al., 2010; Sarhadi and Heydarizadeh, 2014; Saaroni et al., 2015; Raymond et al., 2016; Tramblay and Hertig, 2018). Exceptionally long dry spell periods play an important role in the occurrence and intensity of drought and have strong environmental and social impacts. SWC is comprised of complex terrain including the low-latitude highlands (LLH), Sichuan basin (SB), southeastern Tibetan Plateau (SETP), and Traverse Mountain Chain (TMC), as shown in Figure 1C. In addition, SWC is located in the interface area between the Indian Summer Monsoon (ISM) and the East Asian Summer Monsoon (EASM). Both the combination of the two monsoons and the complex terrain make the interannual variability of the AMDSL stronger and harder to simulate with state-of-art climate models.
Regional climate models (RCMs) are our primary tool for understanding how extreme local-scale precipitation characteristics may change in the future under global warming scenarios (Wang et al., 2004; Christensen and Christensen, 2007; Giorgi et al., 2009; von Storch and Zorita, 2019). RCMs have a higher resolution than earth system models (ESMs) but span a limited area. To improve the confidence of an RCM on extreme precipitation or extreme dry spell representation, the added value from downscaled physical processes is the key challenge in regional climate modeling (Maraun et al., 2010; Rummukainen, 2015). In general, two factors have the largest contribution to a model’s ability to simulate extremes: horizontal grid resolution and physical parameterization schemes (Christensen and Christensen, 2007; Chan et al., 2013, 2014). The horizontal grid resolution has been considered the most important factor in simulating extremes (Pope and Stratton, 2002; Roeckner et al., 2006; Salathé et al., 2008; Shaffrey et al., 2009; Wehner et al., 2010). With finer-scale physical processes and better representation of the orographic effect, increasing the horizontal grid resolution could give better representation of small-scale processes affecting precipitation extremes and lead to increasing model ability to simulate extremes like the AMDSL (Pope and Stratton, 2002; Roeckner et al., 2006; Chan et al., 2013, 2014). Previous studies have reported an improved confidence in simulating extreme precipitation and extreme dry spells over continental Europe and Canada (Boberg et al., 2010; Rauscher et al., 2010; Sushama et al., 2010; Wehner et al., 2010; Kopparla et al., 2013).
Recently, an international collaborative program known as the Coordinated Regional Climate Downscaling Experiment (CORDEX) project has provided a quality-controlled dataset of downscaled precipitation for the historical past and future climate changes as well as a model evaluation framework over East Asia (Giorgi et al., 2009)1. Several previous studies have examined the performance of a single RCM or ensemble RCMs in simulating precipitation climatology and precipitation extremes over CORDEX-East Asia (CORDEX-EA) (Huang et al., 2015; Park et al., 2016; Li et al., 2018). Although RCMs have shown systematic bias in mean and extreme precipitation, those models have been able to reproduce spatiotemporal characteristics of extreme precipitation over China and East Asia (Park et al., 2016; Li et al., 2018).
Previous studies have already evaluated the capacity of RCMs to reproduce the spatiotemporal characteristics of dry spells. For example, Herrera et al. (2010) and Domínguez et al. (2013) use RCMs from the ENSEMBLES/ESCENA project to assess the ability of the simulations to reproduce the mean and maximal annual number of CDDs in Spain. They found that the models tend to have negative CDD number bias compared to observations. López-Franca et al. (2015) also used five RCMs from the ESCENA project to detect the annual average of dry spells length (AADSL) index in Spain. In their study, they found that the five RCM simulations reproduced the observed AADSL pattern in Spain well. Fantini et al. (2016) used nine RCMs from the Euro-CORDEX and Med-CORDEX experiments to assess the ability of the RCMs to reproduce the frequency of dry days or dry spells. They also found those RCMs tend to underestimate the extreme dry spell frequency over wetter regions of the Mediterranean Basin. Raymond et al. (2018) used HyMeX/Med-CORDEX experiments to detect very long dry spells (VLDS) over the Mediterranean Basin. They found that at least 51% of the observed VLDS were reproduced by the RCM simulations and that those RCMs accurately simulated spatiotemporal characteristics. Nevertheless, studies on the frequency and intensity of extreme dry spells, especially the interannual change in extreme dry spells, have rarely been conducted over complex terrain and different climate type area like SWC, for which area the ability of RCMs to simulate extreme dry spells is worth studying. Here we present the evaluation results of the CORDEX-EA project using an ensemble of five RCM simulations driven by the HadGEM2-AO global model (Lee et al., 2014; Oh et al., 2014). The AMDSL distribution characteristics were analyzed based on GEV theory in both observation and RCM simulations.
This paper is arranged as follows into five sections. Observations and model simulations are described in section “Observations and Model Simulations.” In section “Methodology,” we present the methodology of distribution parameter estimation and return value calculation. In section “Results,” RCM performances are assessed for dry day occurrence, dry spell frequency, AMDSL climatology, and the GEV fitted AMDSL return value. In section “Discussion and Conclusion,” we conclude and discuss our results.
Observations and Model Simulations
Observational Datasets
Among the sets of high-resolution gridded precipitation data such as the multi-source weighted ensemble precipitation product (Beck et al., 2017a, b), Version 1.2 of the Global Precipitation Climatology Project (GPCP) daily precipitation estimates (Huffman et al., 2001), the CN05 daily precipitation data for China (CMA; Wu and Gao, 2013), and the APHRODITE (APHRO) gridded precipitation data (Yatagai et al., 2012), we chose the appropriate observation data based on two principles: one is having finer horizontal resolution than the RCM simulation data and the other is that the data are widely used for RCM evaluation over the East Asia domain (Oh et al., 2014; Huang et al., 2015; Li et al., 2018).
The simulated results for mean AMDSL and extremes for the historical period (1981–2005) were validated against two widely used daily high-resolution gridded observational datasets, namely, the CN05 and APHRO gridded daily precipitation data. The CN05 product was developed and distributed by the National Climate Centre of China and contains daily precipitation at a horizontal resolution of 0.25° × 0.25°. APHRO is also a high-resolution daily precipitation dataset developed by the Meteorological Research Institute of the Japan Meteorological Agency (MRI/JMA). In this study, we used the latest and improved version of the daily dataset for Monsoon Asia (APHRO_MA_V1101R1), covering 60.0°E–150.0°E, 15.0°S–55.0°N at a high spatial resolution of 0.25° × 0.25°. The dataset was accessed at the official website of the APHRODITE project: http://www.chikyu.ac.jp/precip/english/products.html.
RCM Simulations
Five RCMs are utilized in CORDEX-East Asia climate experiments. RCMs include three nonhydrostatic RCMs (NIMR-HadGEM3, SNU-MM5, and SNU-WRF) and two hydrostatic RCMs (KNU-RegCM4 and YSU-RSM). Here, SNU-WRF and SNU-MM5 stand for simulation data from WRF (Skamarock et al., 2005) and MM5 (Cha and Lee, 2009) from Seoul National University, respectively. KNU-RegCM4 stands for simulation data from RegCM4 (Giorgi et al., 2012) from Kongju National University. NIMR-HadGEM3 stands for simulation data from HadGEM3_RA (Davies et al., 2005) from the National Institute of Meteorological Research in South Korea. YSU-RSM represents simulation data from RSM (Hong et al., 2013) from Yonsei University. Following the modeling framework of the CORDEX project (Giorgi et al., 2009), the simulations are driven by boundary and initial conditions from the historical simulation of HadGEM2-AO GCM with 1.875° × 1.25° longitude–latitude horizontal resolution, and are integrated from 1981 to 2015 over the East Asia domain, which includes East Asia, India, the Western Pacific Ocean, and the northern part of Australia, as shown in Figure 1. All RCM simulations have a spatial horizontal resolution of 0.44° (∼50 km). Different physical schemes including convection scheme, land surface, and the planetary boundary layer (PBL) scheme are applied across RCMs, as summarized in Table 1. The dataset was accessed at https://www.cordex.org/domains/region-7-east-asia/.
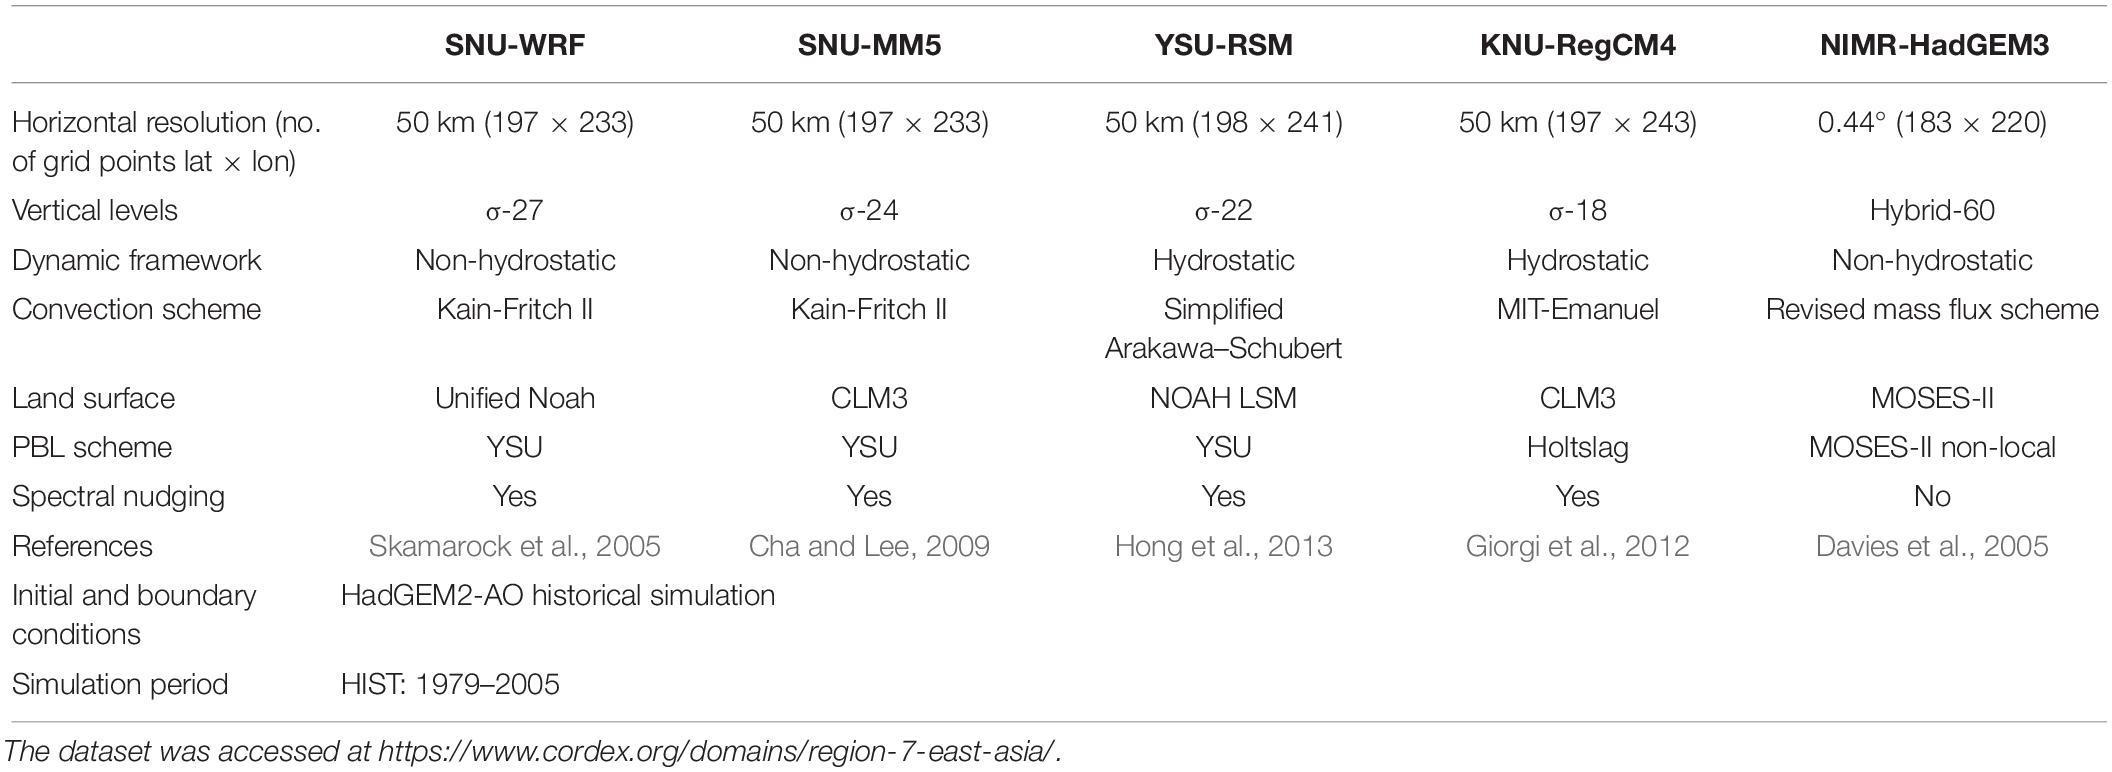
Table 1. Detailed information on RCMs used in this study.
As mentioned above, the two observational datasets have finer spatial resolution than RCM simulations. In this study, both observations and RCM simulations were interpolated onto the standard CORDEX-EA grids (Giorgi et al., 2009) by applying the nearest-neighbor interpolation method (Kotlarski et al., 2014) before conducting comparative analysis. Furthermore, in order to avoid the influence of the interpolation method on the analysis results, a bilinear interpolation algorithm was also applied to the same datasets as a comparative analysis. The results of analysis with Taylor diagrams show that the conclusions obtained by the two interpolation methods are basically consistent.
Methodology
Threshold for the AMDSL
In this study, following previous studies (Frich et al., 2002; Sushama et al., 2010; Raymond et al., 2016, 2018; Tramblay and Hertig, 2018), an annual maximum dry spell length (AMDSL) is defined as the largest number of consecutive days without precipitation or with precipitation less than 1 mm/day, a threshold also adopted to identify CDD by the Expert Team on Climate Change Detection and Indices (ETCCDI) (Zhang et al., 2011). The choice of this threshold is subjective and has been used in most previous studies on CDD or AMDSL on a global and regional scale (Sushama et al., 2010; Donat et al., 2016; Raymond et al., 2016; Herold et al., 2017). Thus, the AMDSL is mostly defined as a punctual measure through a pure statistical approach rather than a physical approach. To avoid the effect of threshold selection on the results, a threshold sensitivity analysis was also applied in this study. Another three thresholds, 0.5, 2, and 3 mm/d, are considered for comparative analysis.
Extreme Value Modeling
An important part of event extreme statistics is to identify the suitable distribution from which the extremes extracted from an observed period were drawn. Extreme events are computed using two different approaches: block maxima (like the AMDSL) and peaks-over-threshold (POT). Coles et al. (2001) demonstrated that the distribution of POT asymptotically converges to generalized Paredo (GPD) (Dominguez-Castro et al., 2019). Similarly, that of block maxima like the AMDSL converges to GEV.
The location, scale, and shape parameter of the GEV distribution can be estimated from a time series of block maxima (e.g., the AMDSL). Several estimation approaches are available including the L-moment method (Hosking and Wallis, 2005), probability-weighted moments, and maximum-likelihood estimator (MLE) (Coles et al., 2001). As linear combinations of order statistics, L-moments are resistant to the effects of outliers and thus provide robust estimates of distribution parameters (Hosking and Wallis, 2005; Sushama et al., 2010). In this study, we used the L-moment method for estimating GEV distribution parameters.
To further explore the best fitting model for the AMDSL in both observation and RCM simulations, the best-fit distribution is identified following the steps of L-moment theory proposed by Hosking (1990) (see details in Supplementary Material). Four commonly used three-parameter distributions are considered to the AMDSL, which include GEV, three-parameter lognormal distribution (LN3), Pearson type 3 distribution (PIII), and GPD, as given in Supplementary Table S1. The theoretical relationship between the empirical L-skewness (τ3) and L-kurtosis (, , , and for the considered GEV, LN3, PE3, and GPD models, respectively) are presented in Supplementary Table S2. After the theoretical τ4 value was calculated for the considered extreme distributions, the goodness-of-fit measure of minimum absolute difference (|D|) proposed by Hosking and Wallis (1993) was used to identify the best-fit distribution function. The optimum fitted distribution functions can be chosen by comparing the difference |D| between empirical and theoretical L-kurtosis based on a given empirical L-skewness value. The best choice of distribution is the one with minimum difference |D|.
There are several conventional methods for identifying the most suitable extreme distribution, including probabilistic-probabilistic plots, quantile–quantile plots, and L-moment relationships. This is more easily achieved by using L-moments than via conventional moments and other goodness-of-test methods (Kroll and Vogel, 2002; Sushama et al., 2010).
Results
Annual Cycles of Rainfall and Dry Days
Based on the spatial distribution of annual rainfall, SWC has abundant precipitation of 1200–1800 mm per year on the long-term average (Wang et al., 2015). Rainfall in the SWC area also has a distinct seasonal character. The wet season is from May to September, and the dry season is from October to April of the following year. Figure 2A illustrates the performance of the CORDEX RCMs in simulating area-averaged annual rainfall cycles for the SWC. Grid cells in two sets of gridded observations and model simulations are averaged for the comparison over SWC. The two gridded observations have substantially similar annual cycles of monthly mean precipitation, standard deviation, and monthly mean dry days. All of the five RCMs capture the shape of the monthly mean rainfall seasonality well but with a certain degree of overestimation, 1.5–2.5 mm/day, in the wet season. As shown in Figure 2B, all five RCMs also simulate the standard deviation of the annual cycle of monthly rainfall well, which indicates that RCMs show relatively good performance in simulating the interannual variability of rainfall in each month but with 0.8–1.5 mm/day overestimation of the variability. Furthermore, the area-averaged climatology of dry days is also presented in Figure 2C. All of the RCMs can simulate the shape of the seasonal cycle of dry days for each month well. Three models, KNU-RegCM4, YSU-RSM, and NIMR-HadGEM3, have an overall underestimation of the annual cycle of dry days by 2–4 days/month. SNU-MM5 captured dry day seasonality well but with a relative underestimation by 2.5 days/month during the dry season. SNU-WRF reproduced the annual cycle of dry days very well.
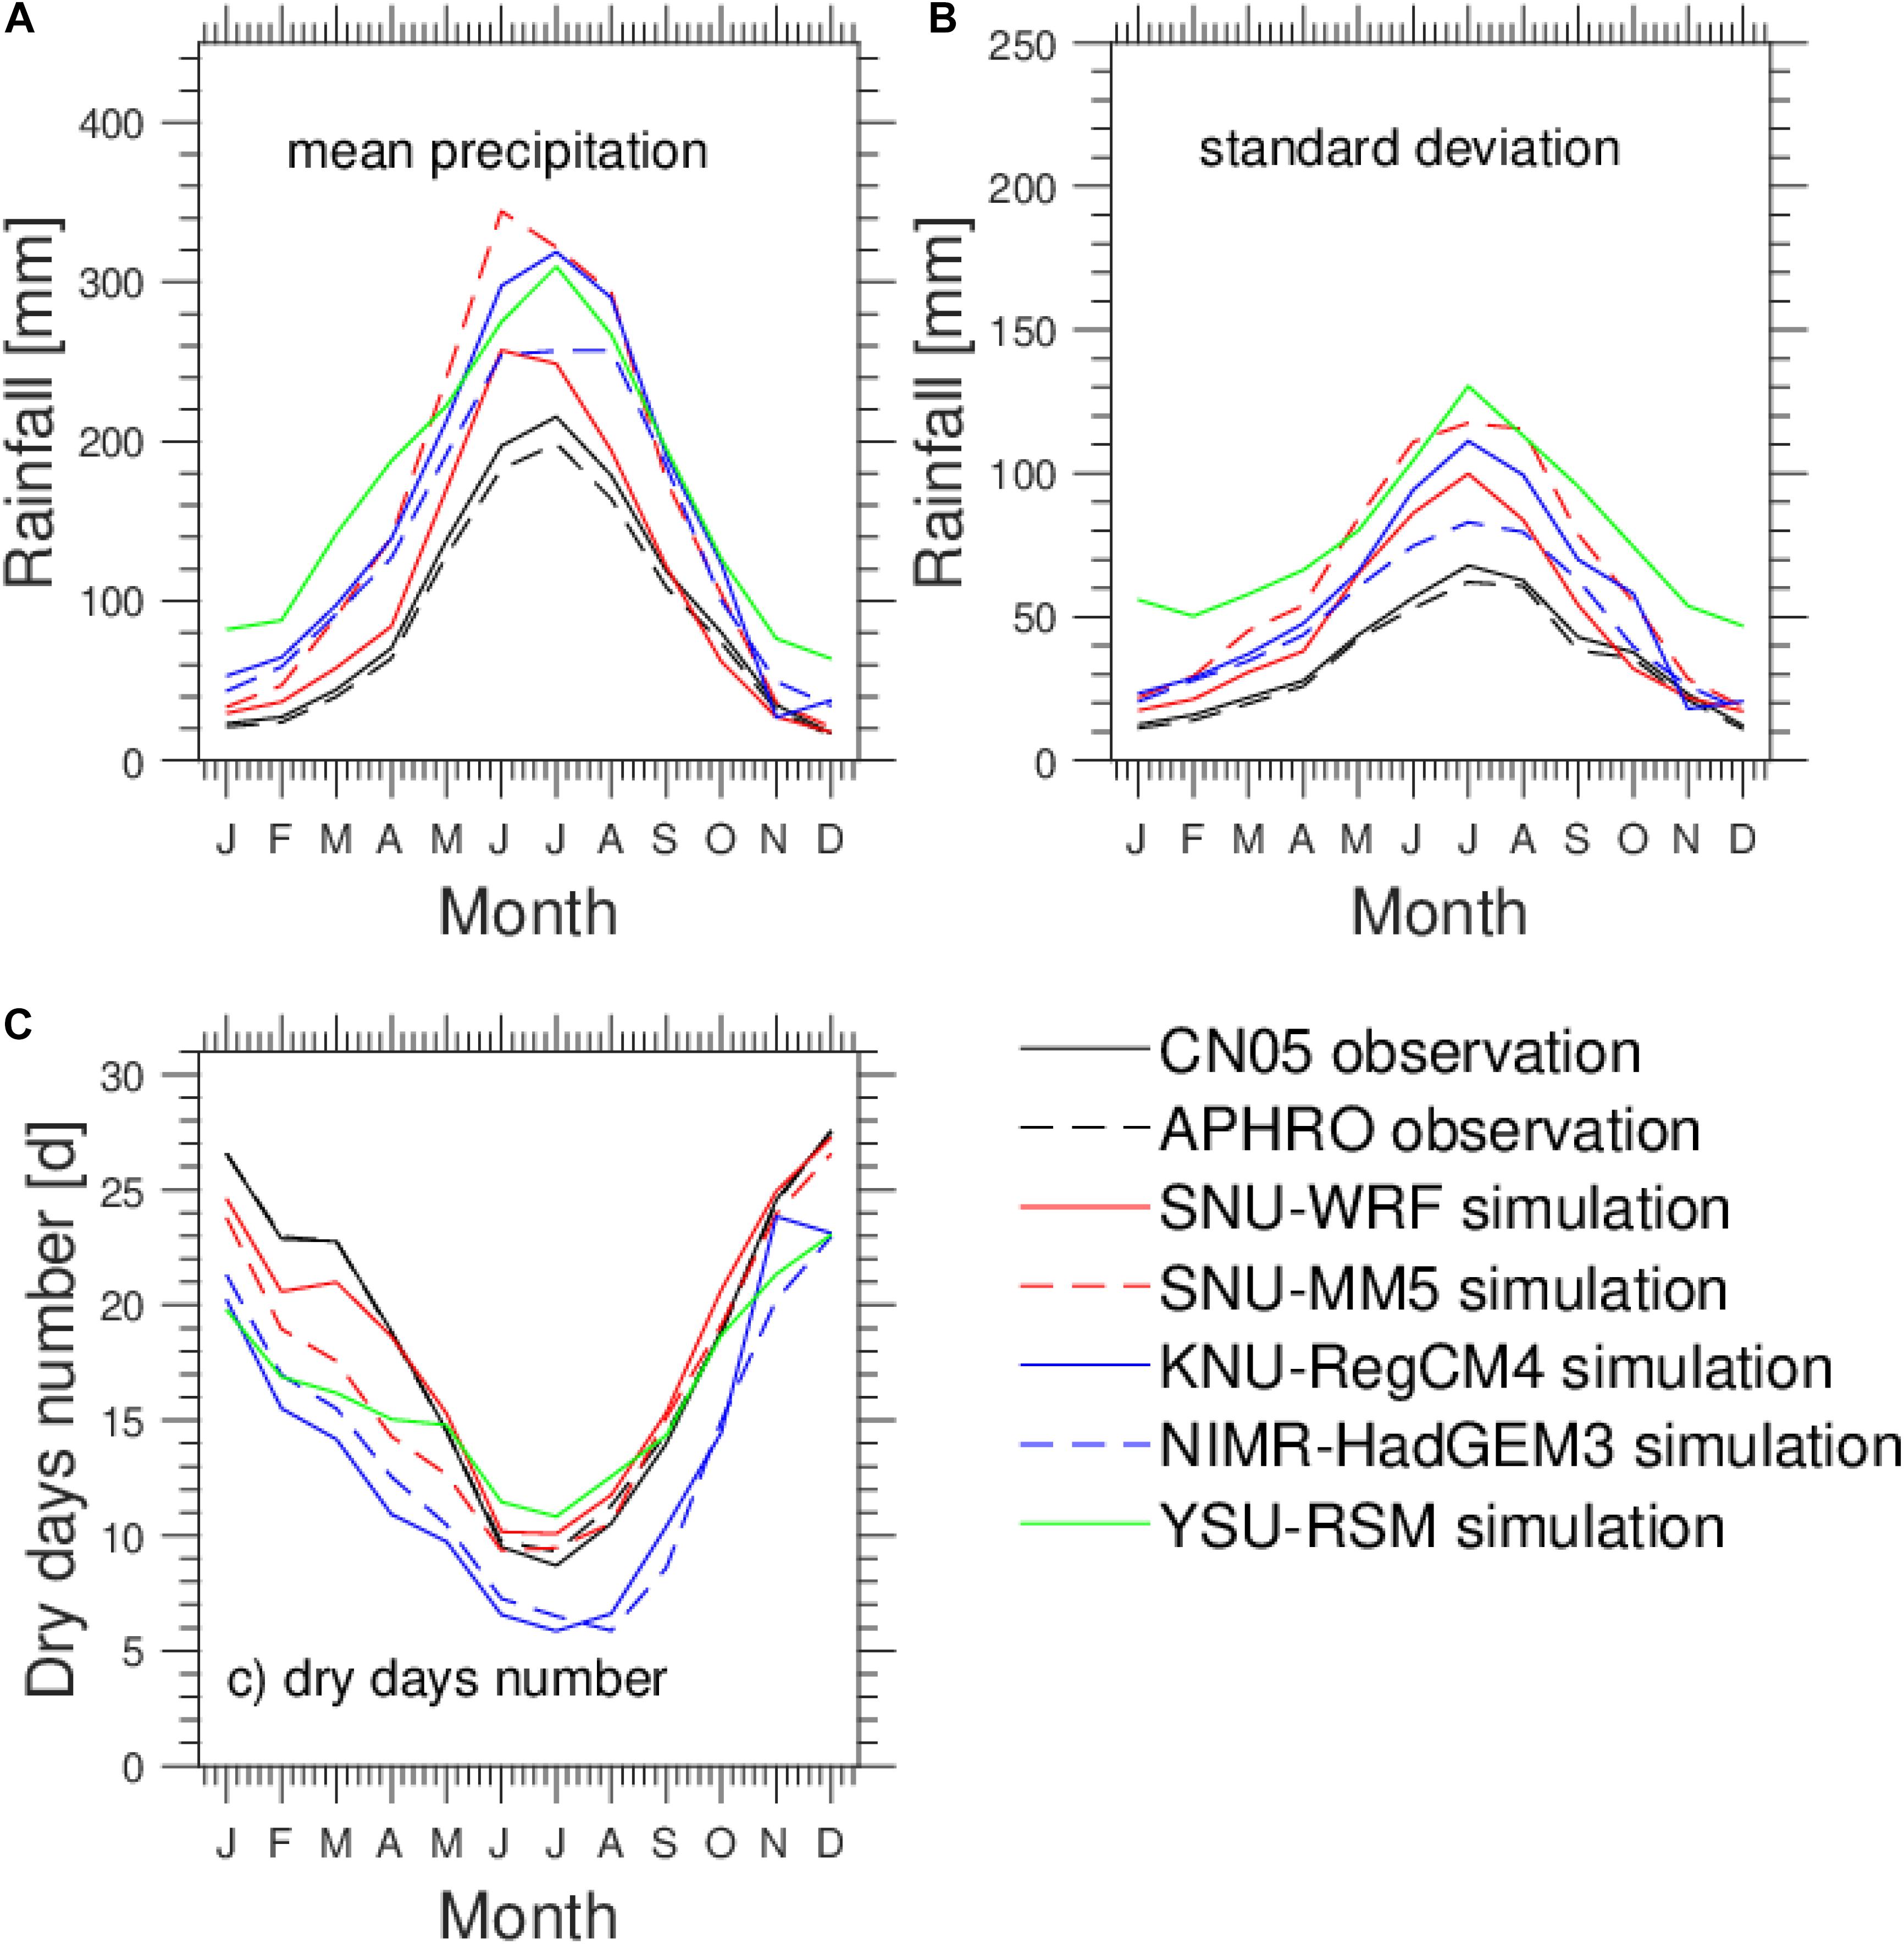
Figure 2. (A) Annual cycle of area-averaged monthly mean precipitation over SWC. (B) Annual cycle of area-averaged monthly standard deviation of monthly mean precipitation. (C) Annual cycle of area-averaged monthly mean number of dry days. The different line types represent two observations (CN05 and APHRO) and five RCM simulations (SNU-WRF, SNU-MM5, YSU-RSM, KNU-RegCM4, and NIMR-HadGEM3), respectively.
Spatial Pattern of Dry Days and Dry Spell Distribution
Figure 3 shows the spatial pattern of the proportion of dry days in the two rainfall observation datasets and in the five RCM simulations. The climatological mean proportion of dry days tends to be much larger in the northeastern part of SWC, including CQ and GZ, where the distance of water vapor transport from the tropical ocean is higher and the number of precipitation days is lower. A smaller proportion of dry days is identified in SB and is mainly affected by the mesoscale geographical convergence induced by the SETP and the Southwest Low Vortex (SLV). Another low dry ratio area is the southern part of YN, an area mainly influenced by the tropical monsoon at ground altitudes. The results of the spatial pattern regarding the proportion of dry days from the two different sources were consistent, indicating the reliability of the results. For RCMs, besides YSU-RSM, the other four RCMs reasonably reproduced the spatial distribution pattern for the proportion of dry days. SNU-MM5 had the best correlation in simulating the spatial pattern of the mean ratio of dry days, with a PCC of 0.81. SNU-WRF reproduced a center with a larger proportion of dry days in CQ, the northeastern part of SWC. Simultaneously, SNU-WRF and NIMR-HaDGEM3 simulations showed a negative bias in the LLH region, with a lower proportion of dry days. The terrain in the two areas mentioned above is complex due to influences by the TMC and Wushan Mountain Chain (WMC), and this has a significant impact on the simulation ability of RCMs. YSU-RSM exhibited the worst performance in simulating dry day characteristics.
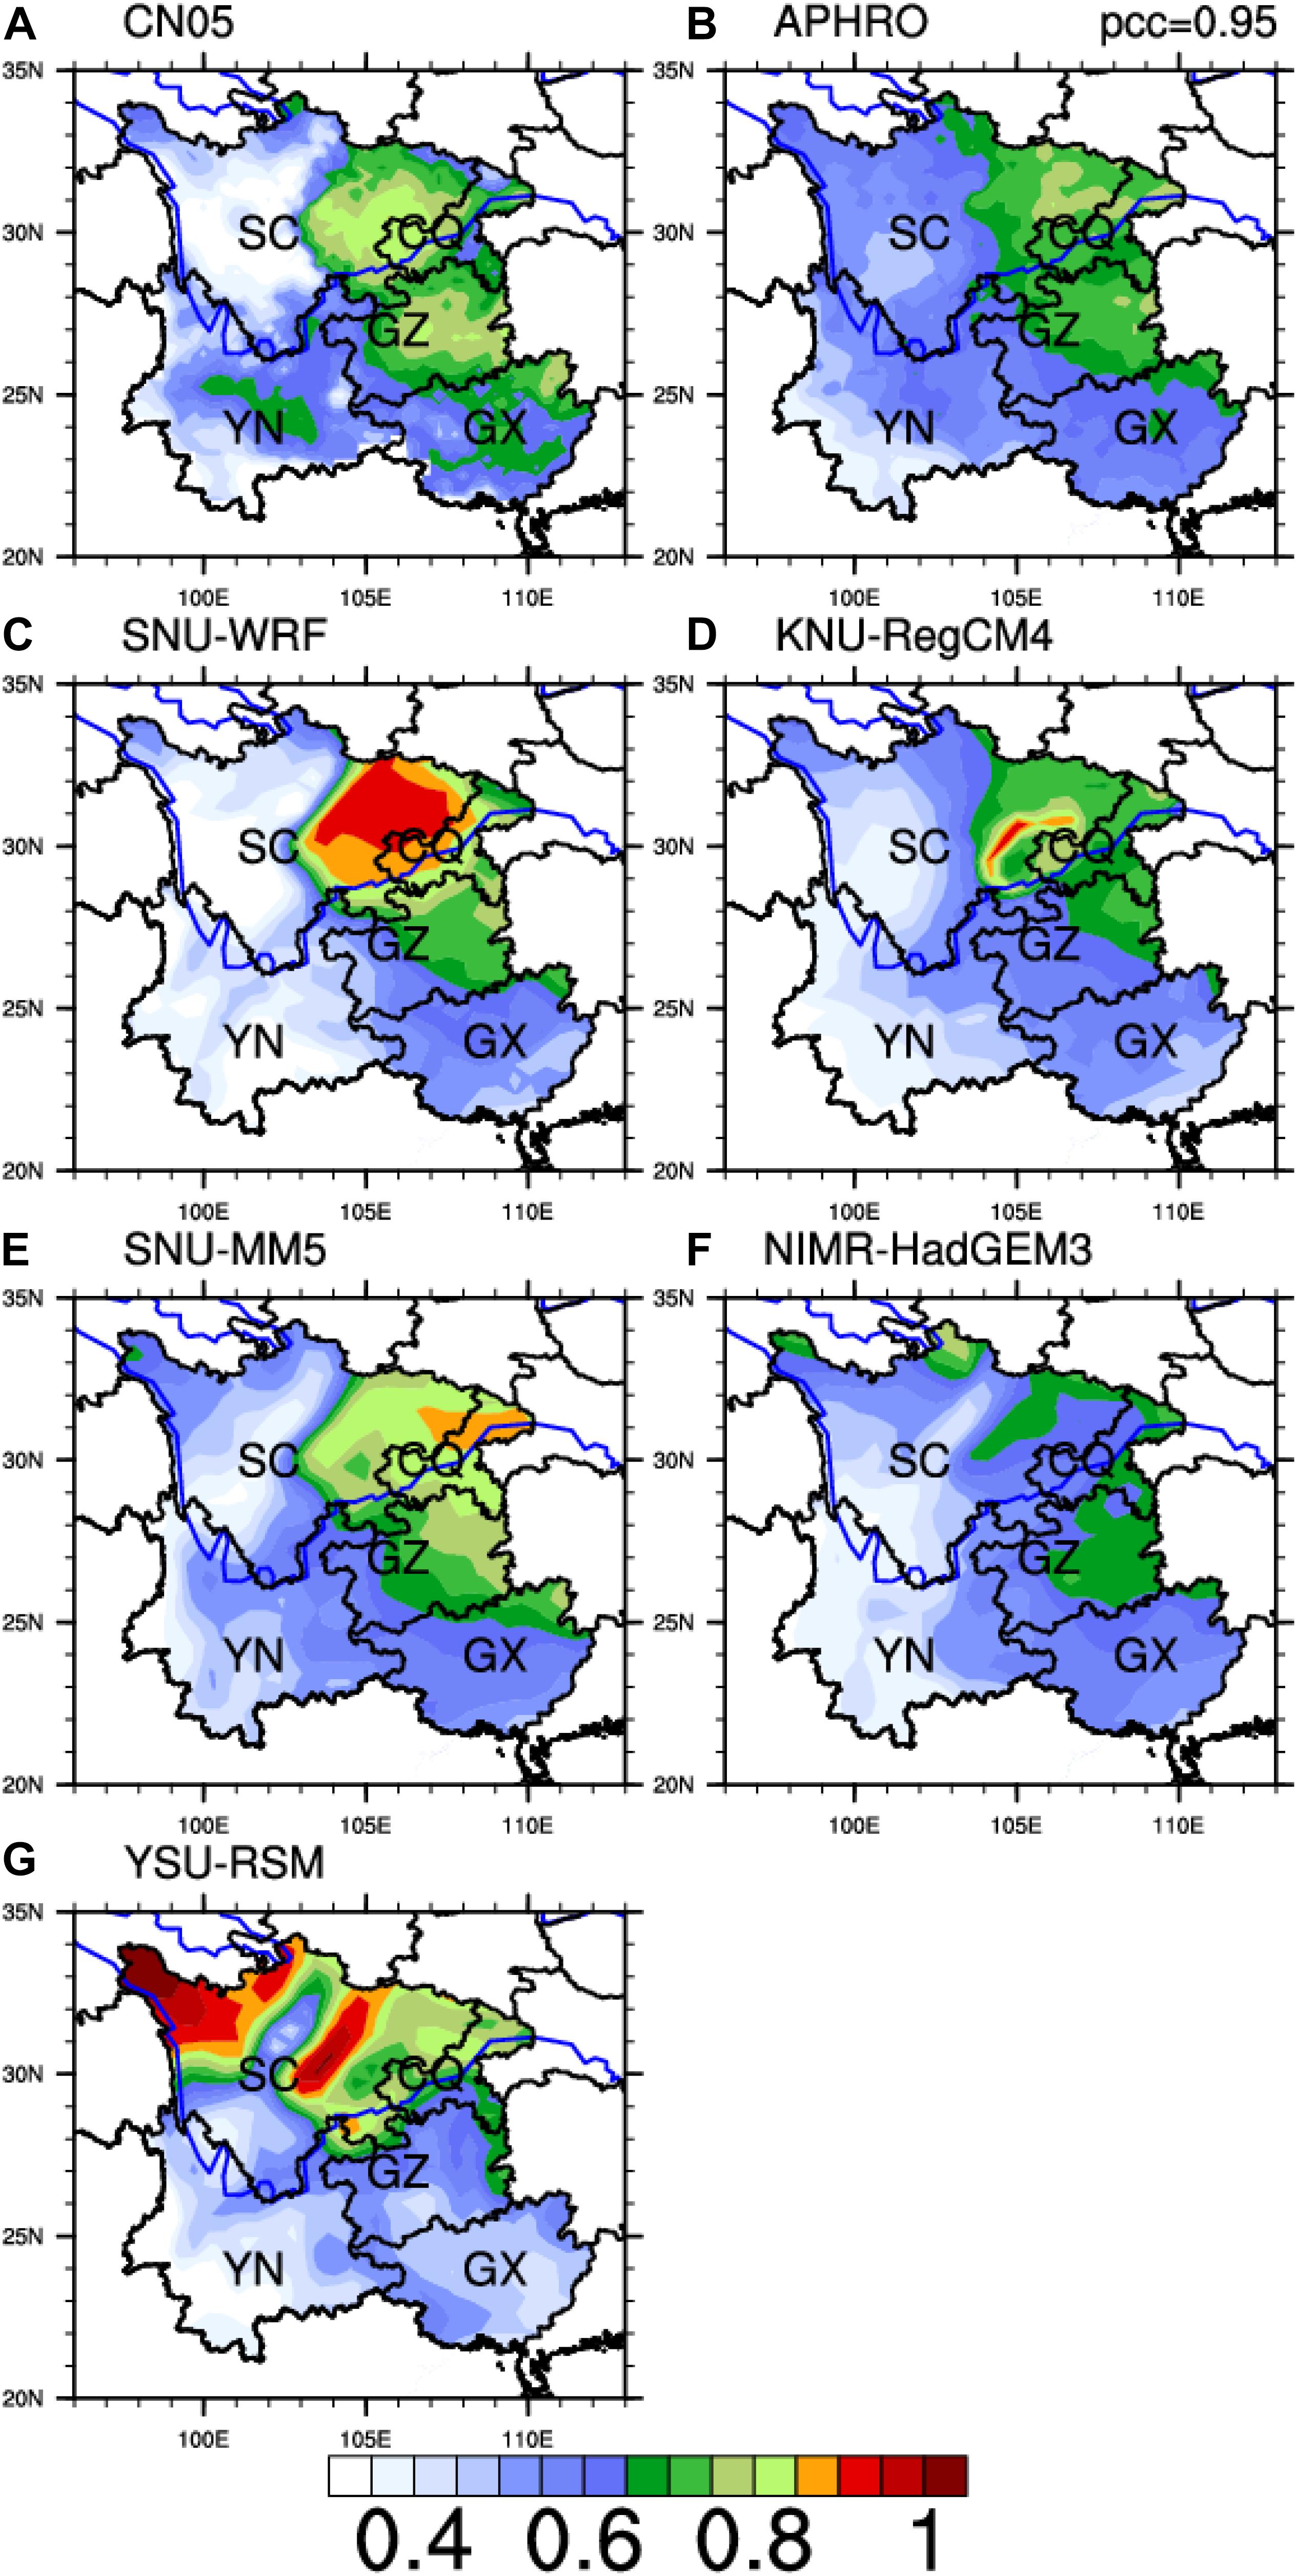
Figure 3. Spatial distributions of dry day occurrence (unit:%) from two observations, (A) CN05 and (B) APHRO, and five RCM simulations, (C) SNU-WRF, (D) KNU-RegCM4, (E) SNU-MM5, (F) NIMR-HadGEM3, and (G) YSM-RSM.
Using Taylor diagrams (Taylor, 2001, see details in Supplementary Material), Figure 4A presents a concise statistical summary of RCM performances in simulating the dry day ratio over SWC. The pattern correlation, root-mean-square difference, and amplitude of variation of the dry day ratio of each RCM are presented. In general, the closer the colored dots are to the reference point, the better the model’s utility. Apart from YSU-RSM, the RCMs presented good spatial correlations with the observations for the proportion of dry days, ranging from 0.7 to 0.85. SNU-WRF showed a strong correlation but with larger spatial variance, which led to decreased model utility compared to the other three RCMs. Spatial correlations are significant at the 95% confidence level except for the YSU-RSM simulation. As we expected, for the four precipitation thresholds, the spread of points is larger for the lower threshold compared to those for the higher threshold due to the larger sample size for the latter (Sushama et al., 2010). However, threshold sensitivity analysis based on the Taylor diagrams indicates that choosing different thresholds for dry days does not significantly affect ability to simulate the dry day ratio pattern. In addition, among all threshold values used in the sensitivity study, the 1 mm/day threshold used to identify the AMDSL in this study provided the best model simulation ability.
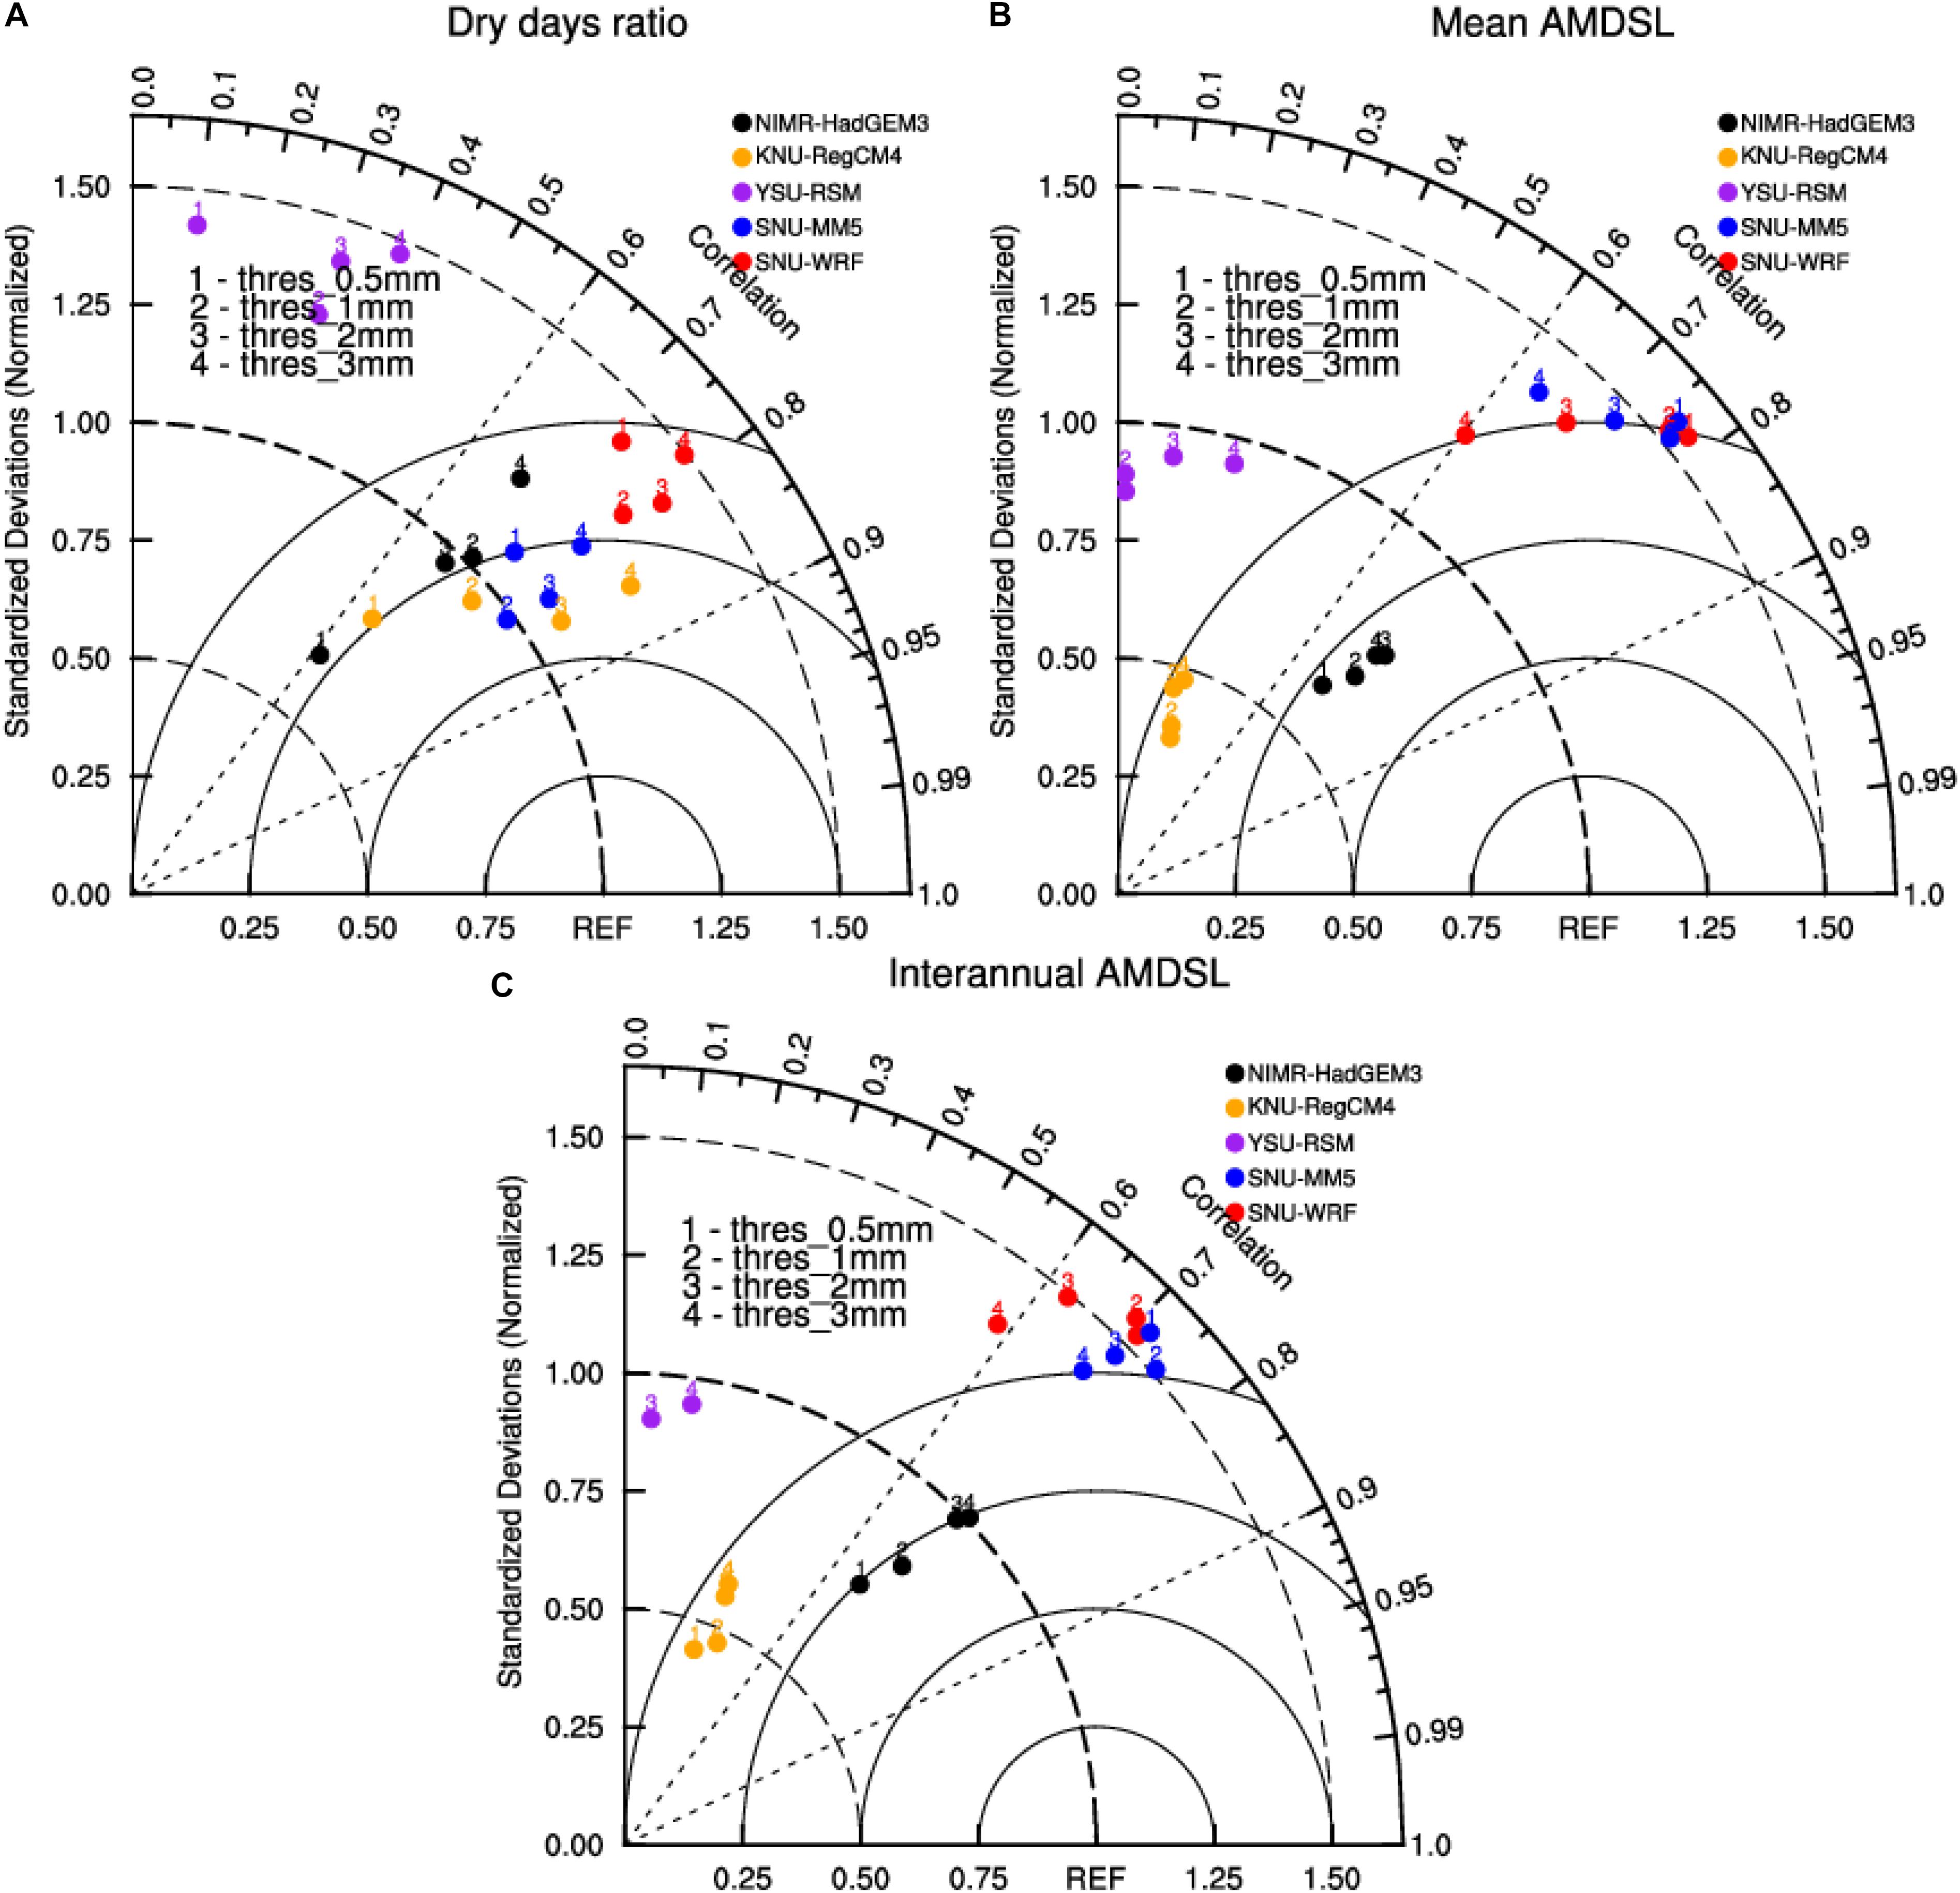
Figure 4. Multivariable Taylor diagram displaying normalized statistical comparisons of SNU-WRF (red), SNU-MM5 (blue), YSU-RSM (purple), KNU-RegCM4 (orange), and NIMR-HadGEM3 (black) simulated climatological dry days ratio (A), mean AMDSL (B), and interannual variability of the AMDSL (C), respectively. Numbers indicate four different thresholds for dry days.
Another important characteristic of dry spells is the PDF of dry spells as a function of different dry spell lengths, which is shown in Figure 5. The area covered by the curve is 1. All five RCMs showed similar area-averaged probability distribution functions of dry spells, including KNU-RegCM4 and YSU-RSM, two models with lower ability to simulate dry day occurrence. NIMR-HadGEM3 and KNU-RegCM4 agree well with the observational datasets but tended to overestimate dry spells of less than 5 days. SNU-WRF and SNU-MM5 underestimate the 2–5-day dry spell frequency but tended to overestimate the 5–15-day dry spell frequency.
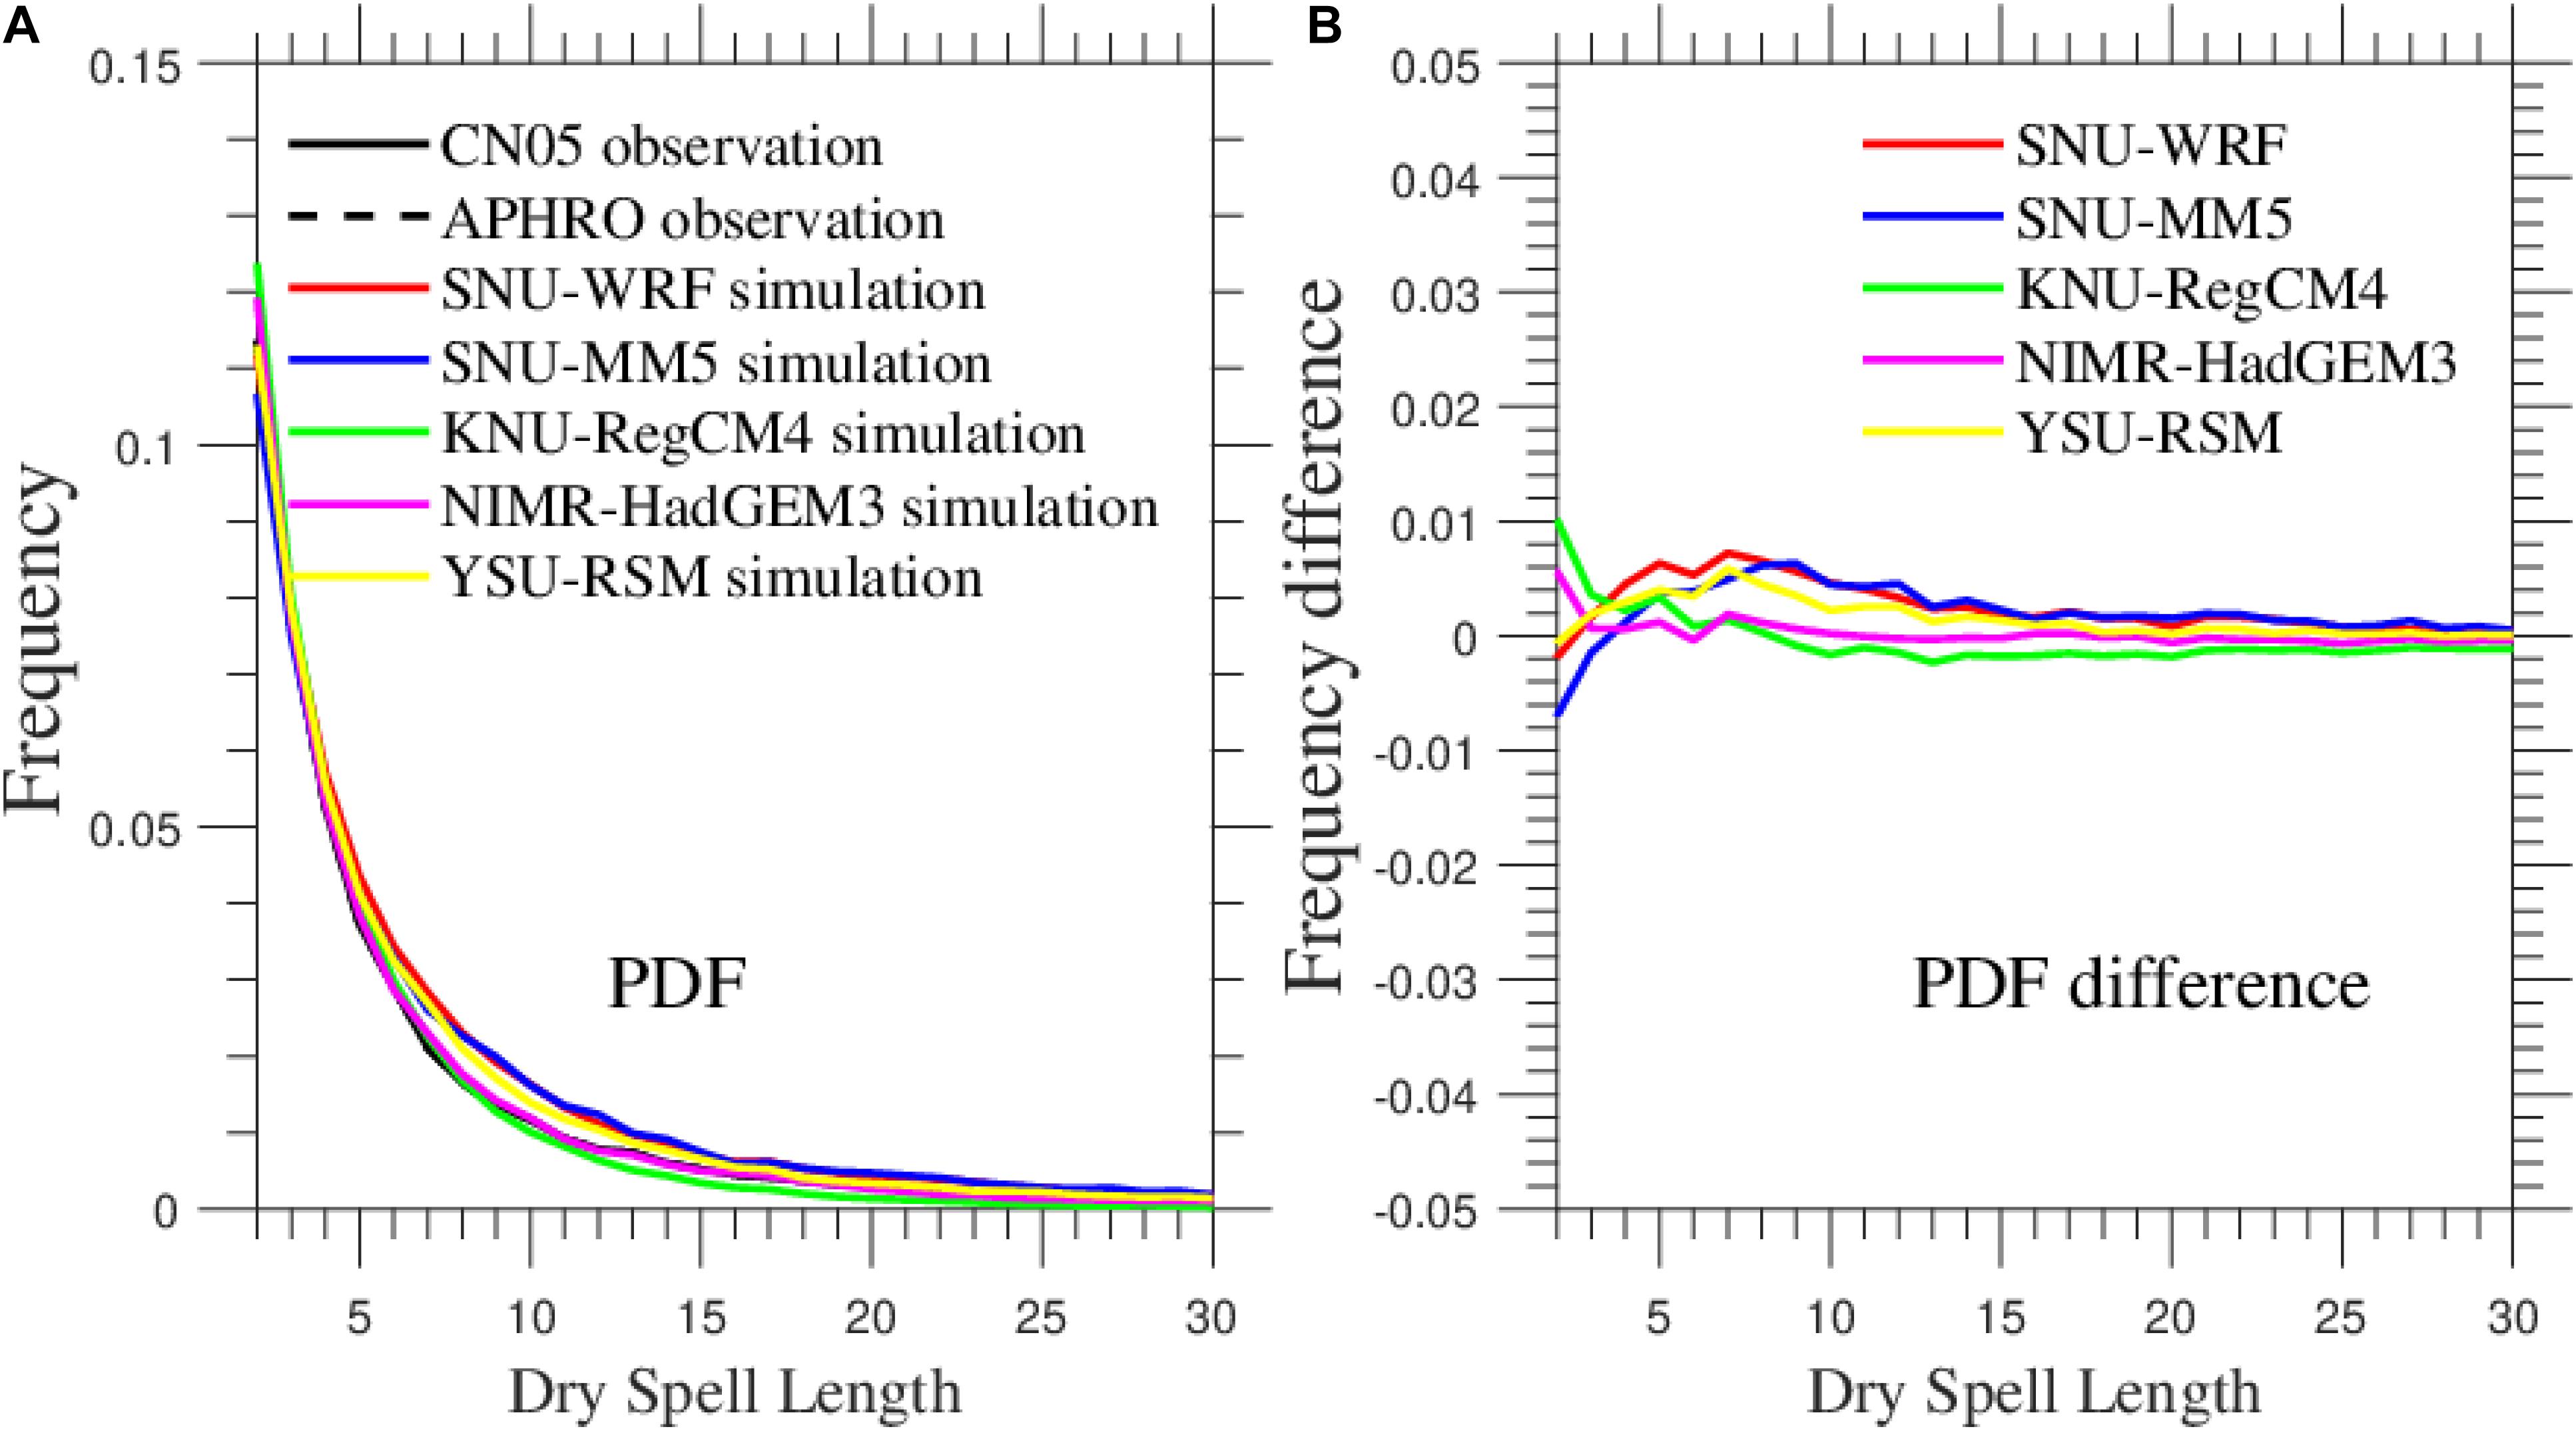
Figure 5. (A) Probability distribution functions of dry spell length (days), for rainfall in two observational datasets and five RCM simulations. (B) PDF differences of five RCMs against CN05 observational data. The different line colors represent two observations (CN05 and APHRO) and five RCM simulations (SNU-WRF, SNU-MM5, YSU-RSM, KNU-RegCM4, and NIMR-HadGEM3), respectively.
Climatology and Interannual Variability of AMDSL
The climatological AMDSLs in two observational datasets and five RCM simulations are shown in Figure 6. Larger mean AMDSL is identified over the east side of the LLH and the TMC despite the lower proportion of dry days in this region compared to CQ. These results show that dry days in the LLH tended to appear more concentrated, although the proportion of dry days is lower than that in CQ, which leads to a higher risk of longer dry spells or meteorological drought. In contrast, a smaller mean AMDSL is located on the west side of the TMC, SB, and most of the CQ and GX regions. For the spatial distribution of the average intensity of AMDSL, the observation data of the two sets of grid points are more consistent with a PCC of 0.98. The four RCMs besides YSU-RSM reasonably reproduced the spatial distribution pattern of the mean AMDSL except in some areas with large changes in terrain such as the two sides of the TMC and the edge of SB. NIMR-HadGEM3 had better ability to simulate the spatial pattern of the mean AMDSL with a PCC of 0.70. The KNU-RegCM4 simulation exhibited positive model bias with higher simulated intensity of the AMDSL in CQ and GX regions but showed negative model bias with lower intensity of the AMDSL over the LLH, indicating that KNU-RegCM4 has limited ability to simulate the climatology of AMDSL over complex terrain areas.
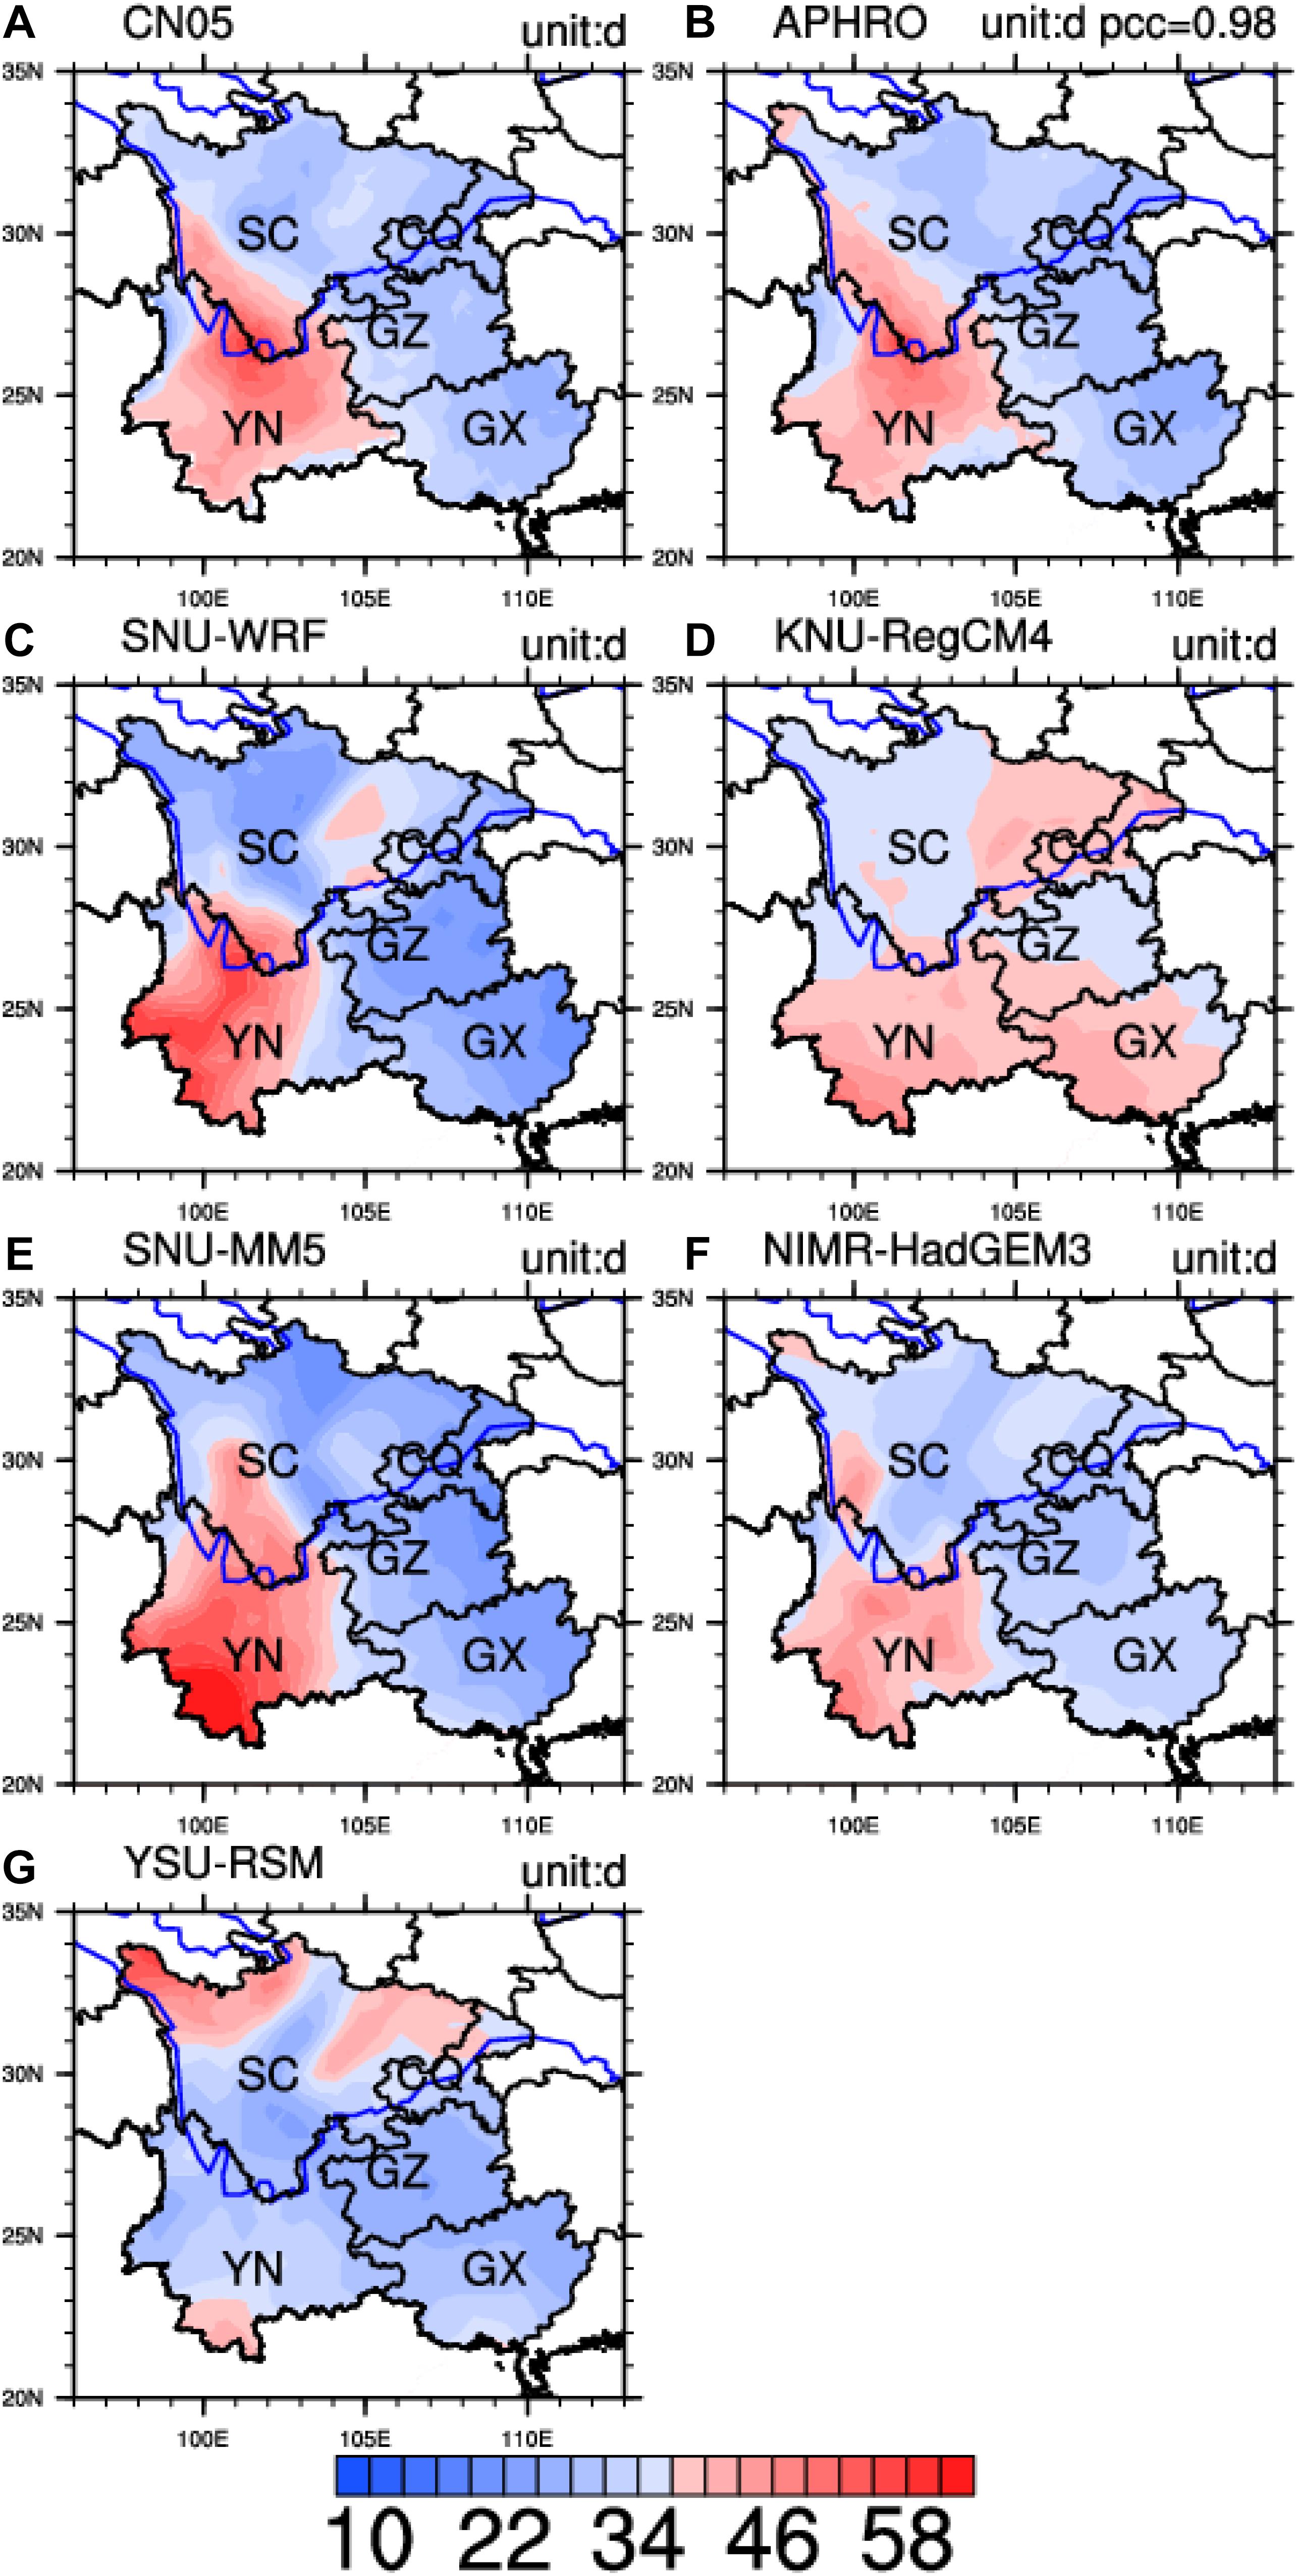
Figure 6. Spatial distributions of mean annual maximum dry spell length (AMDSL) (unit: day) from two observations: (A) CN05, (B) APHRO; and five RCM simulations: (C) SNU-WRF, (D) KNU-RegCM4, (E) SNU-MM5, (F) NIMR-HadGEM3, and (G) YSM-RSM.
Figure 4B presents a Taylor diagram summary of the RCMs performances in simulating the mean AMDSL over SWC. Spatial correlations are significant at the 95% confidence level except for the YSU-RSM simulation. Although there are four RCMs that reasonably reproduced the observed AMDSL spatial pattern, the spatial variability between RCMs is quite different. NIMR-HadGEM3 had better ability than the other three RCMs in simulating the mean AMDSL. The correlation coefficients of SNU-WRF and SNU-MM5 were higher, but the root-mean-square error was also large. Therefore, these two RCMs are comparable to KNU-RegCM’s simulation ability. Threshold sensitivity analysis indicated that choosing different thresholds for dry days does not significantly affect the ability to simulate the AMDSL spatial pattern.
Figure 7 shows the spatial distribution pattern of standard deviation of the AMDSL. Larger interannual variability is identified over the east side of the LLH and TMC. These results show that interannual fluctuation of the AMDSL is very high and the magnitude of the AMDSL may vary from year to year in this region, which lead to continuously observed very long dry periods (10–15 days) and severe meteorological droughts in the area. This area also corresponds to the interface area between the ISM and the EASM, where the combination of the two monsoons makes the interannual variability of the AMDSL stronger than the northeastern part of SWC and the west side of the TMC. The four RCMs excepting YSU-RSM reproduced the spatial distribution pattern of AMDSL interannual variations relatively well, with PCCs of 0.5, 0.71, 0.78, and 0.71, respectively. SNU-WRF reproduced smaller interannual variability in the SETP and GX areas. For NIMR-HadGEM3, positive discrepancies lie in the northeastern part of SWC, which corresponds to the area where NIMR-HadGEM3 simulated a larger proportion of dry days. KNU-RegCM4 showed less ability to simulate the spatial variability of AMDSL interannual variations, which is consistent with the previous results regarding mean AMDSL. Since the terrain is very complex, the area also has a diverse climate ranging from tropical to temperate; KNU-RegCM4’s ability to simulate AMDSL characteristics with complex terrain still needs improvement.
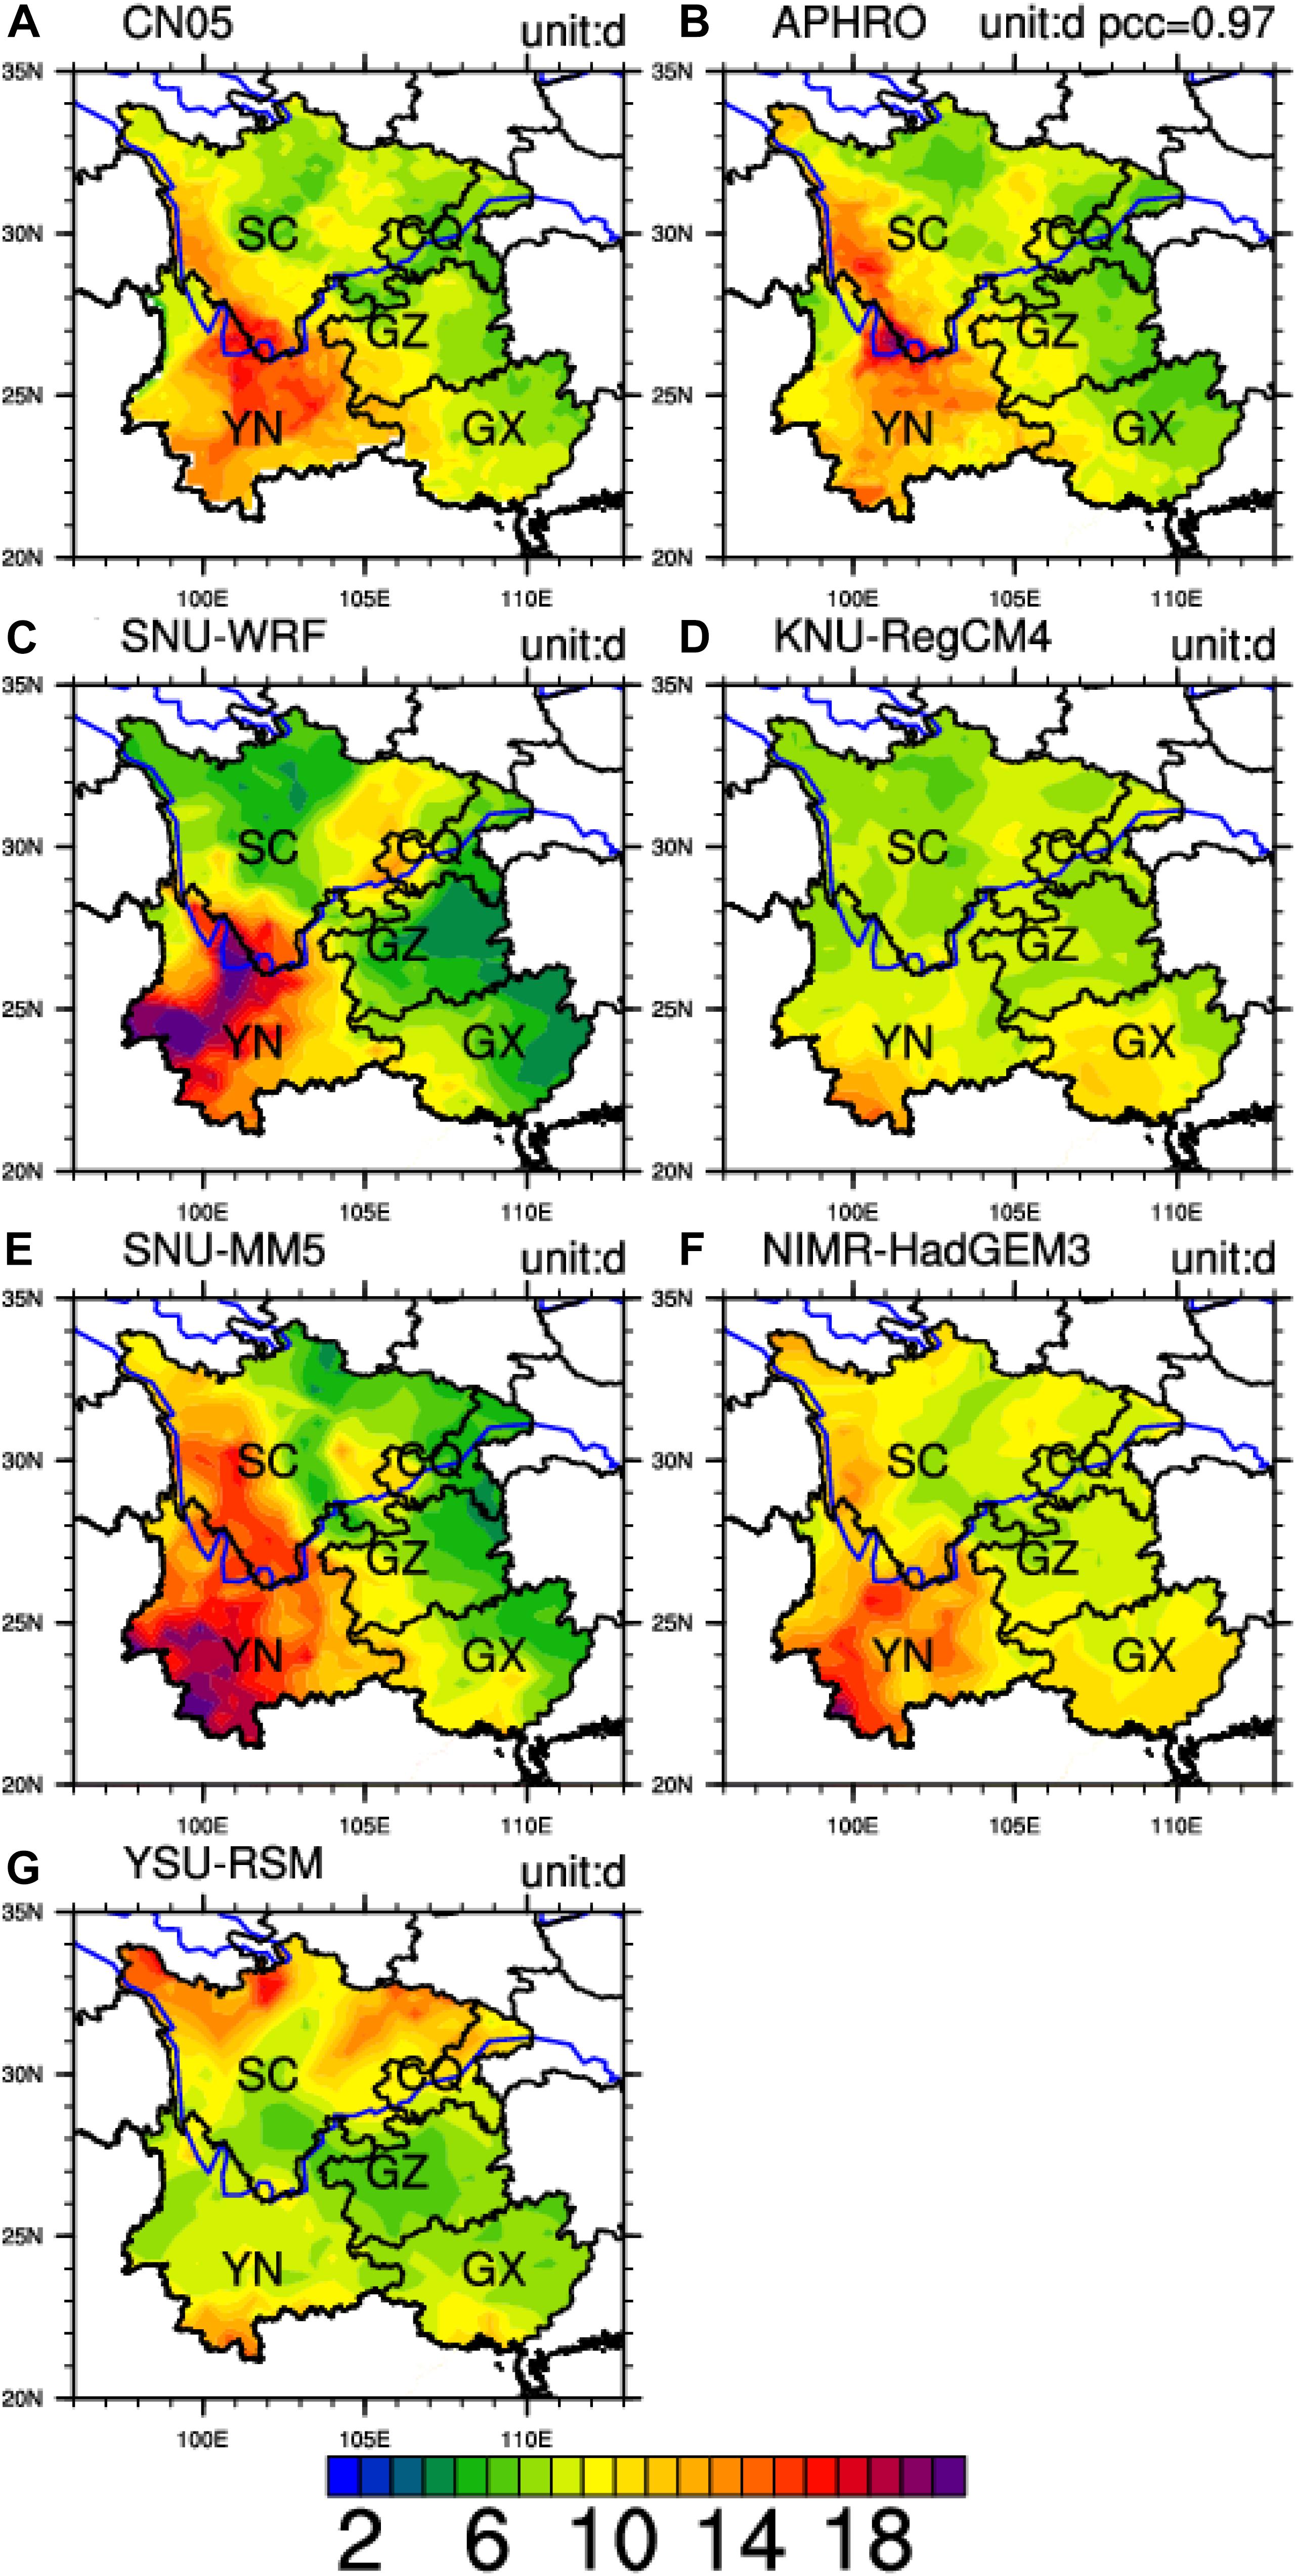
Figure 7. Spatial distributions of interannual variability of the annual maximum dry spell length (AMDSL) (unit: day) from two observations: (A) CN05, (B) APHRO; and five RCM simulations: (C) SNU-WRF, (D) KNU-RegCM4, (E) SNU-MM5, (F) NIMR-HadGEM3, and (G) YSM-RSM.
Figure 4C presents a Taylor diagram summary of RCM performances in simulating the interannual variability of AMDSL over SWC. Compared to Figure 4B, there are four RCMs, excepting YSU-RSM, that have simulation abilities close to the model abilities to simulate AMDSL.
Identification of Extreme Distribution for the AMDSL
An important part of extreme event statistics is to identify a suitable distribution from which the extremes extracted from an observed period were drawn. In particular, several conventional methods are used to identify the most suitable extreme distribution, including probabilistic–probabilistic plots, quantile–quantile plots, and L-moment relationships.
Figure 8 compares the empirical L-kurtosis with theoretical L-kurtosis of the GEV, LN3, PE3, and GPD models for a given empirical L-skewness value of the AMDSL series from CN05 observations, and corresponding series in the five RCM simulations. Comparing the yellow column representing the GEV distribution in Figure 8, the GEV model offers a better fit compared to the other probability models for the AMDSL series in the CN05 dataset and three RCM simulations, SNU-WRF, YSU-RSM, and NIMR-HadGEM3. The LN3 model is the best-fitted model in SNU-MM5 and KNU-RegCM4 simulations. Conversely, the GPD model showed a bad fit compared with other extreme models, with a very large |D| value.
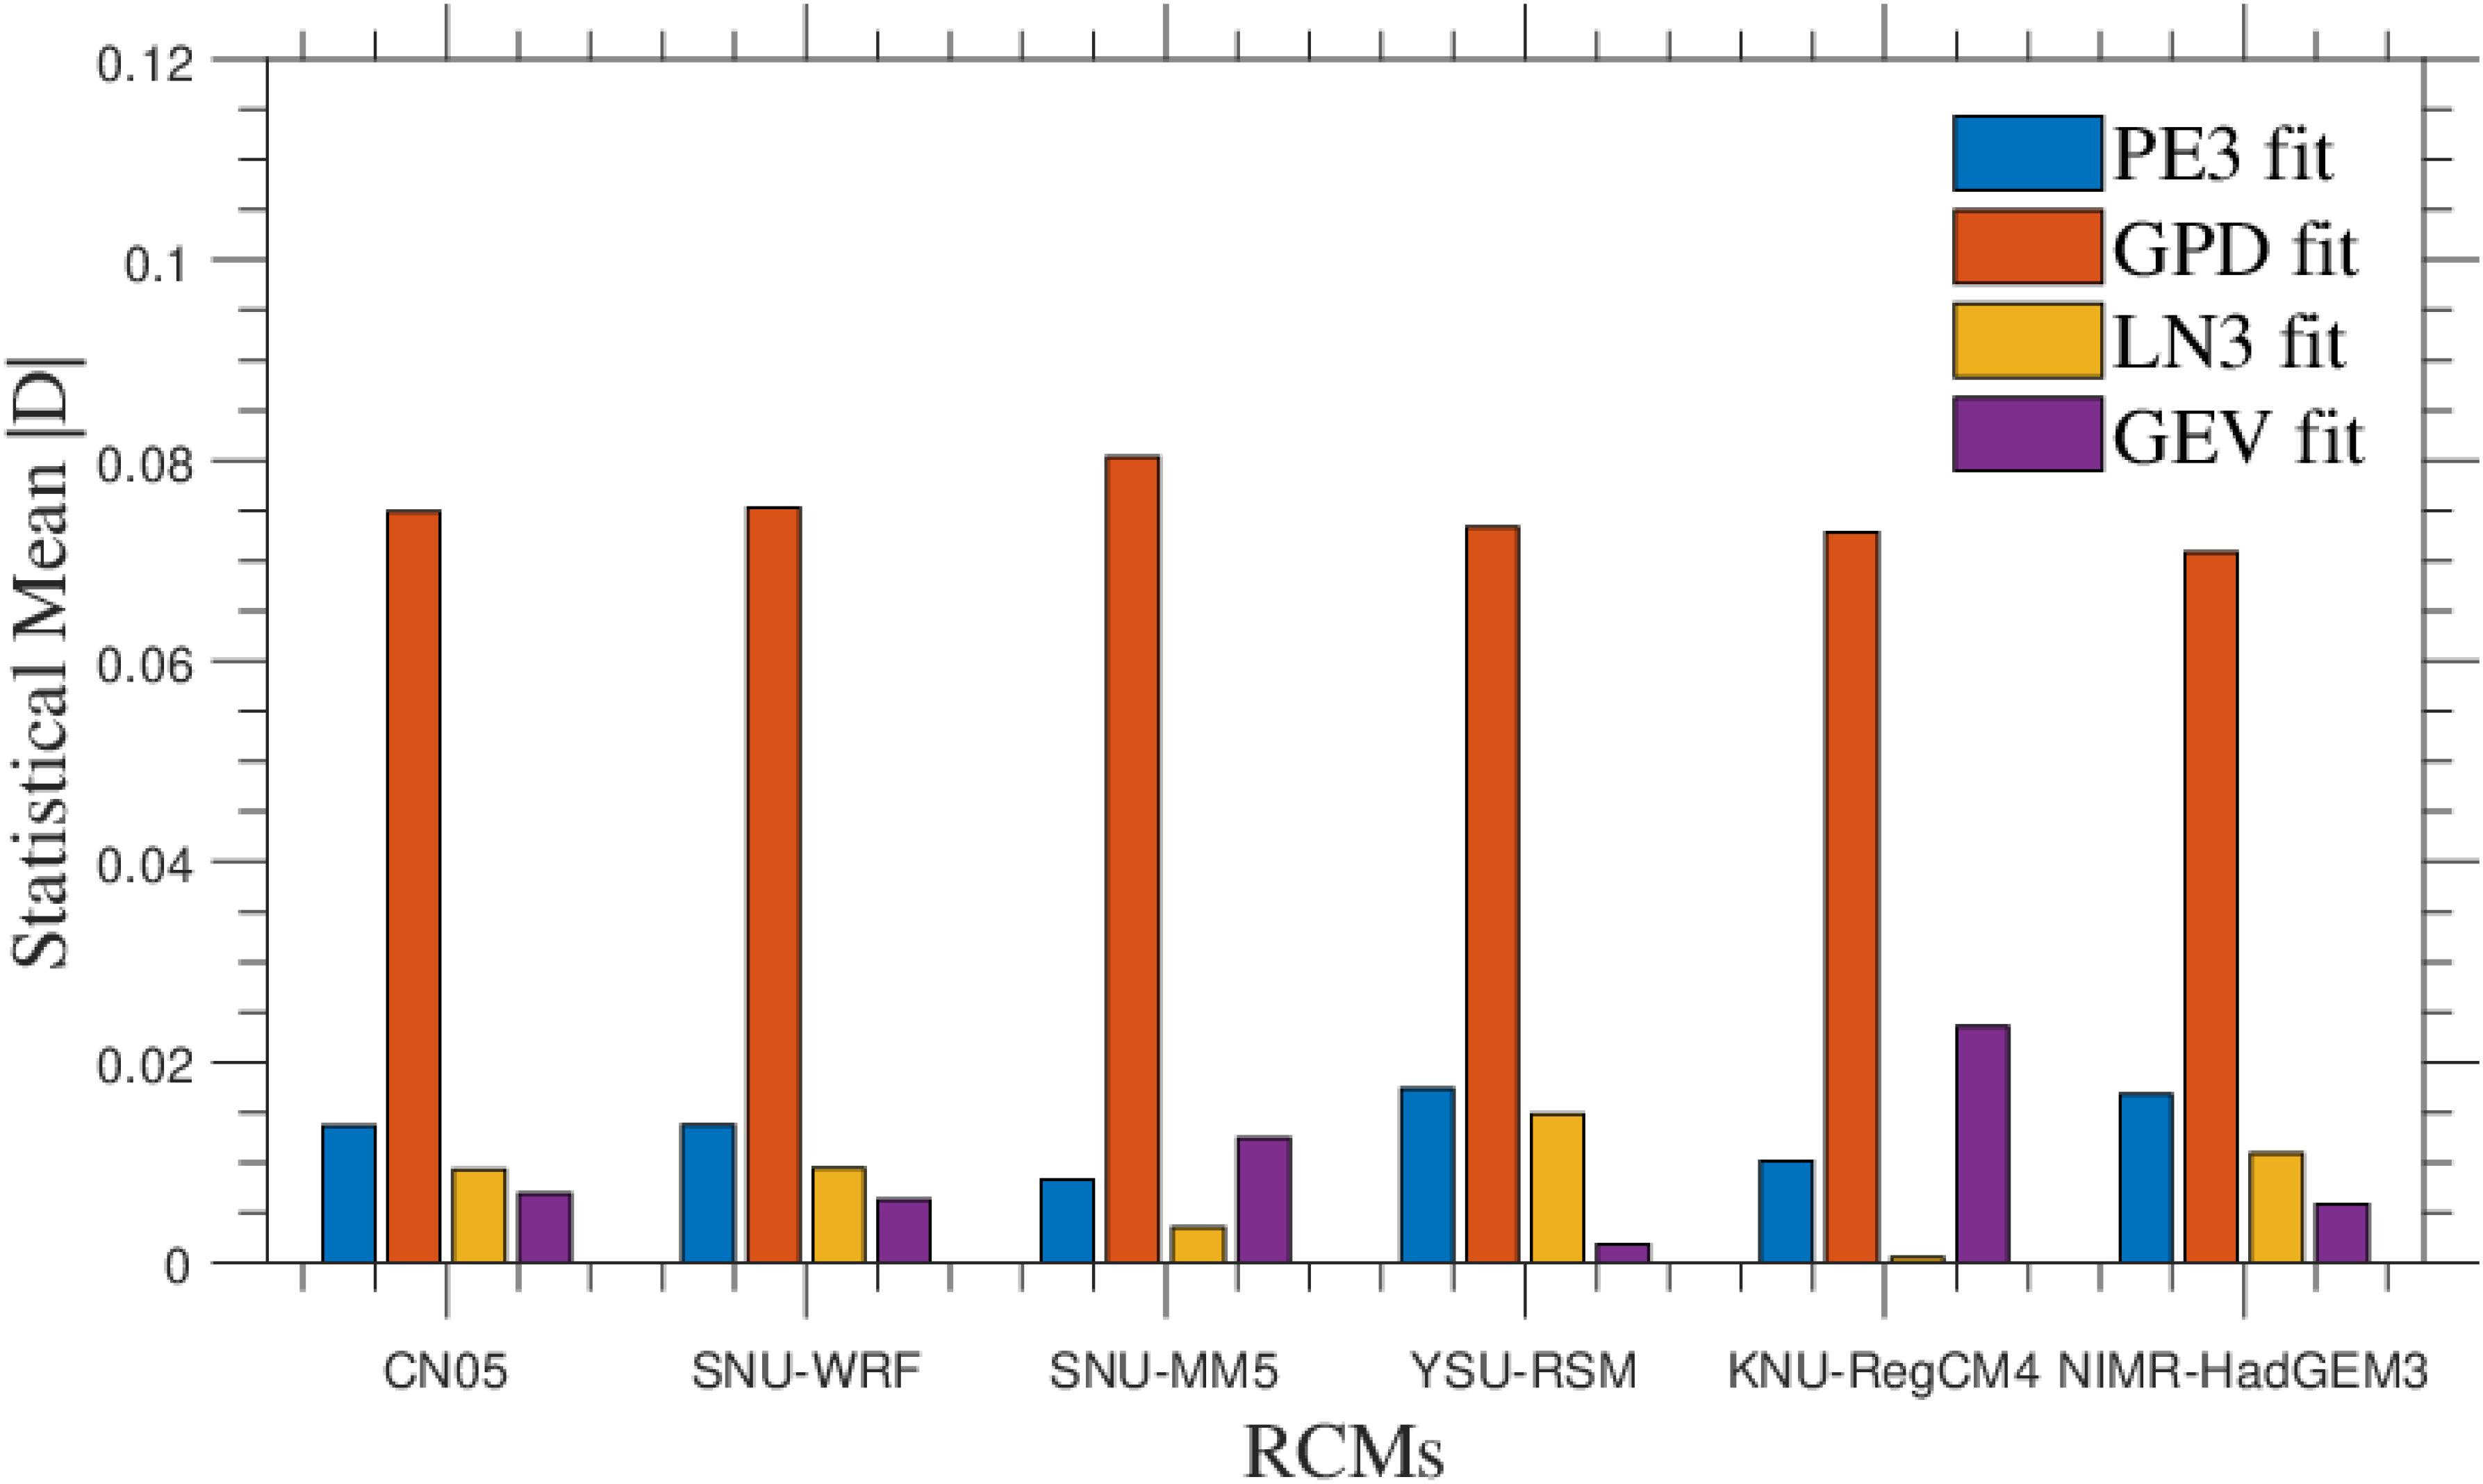
Figure 8. Statistical mean values of absolute differences (|D|) of fitted L-kurtosis values from different probabilistic models against theoretical L-kurtosis values in the CN05 observational dataset and five RCM simulations (SNU-WRF, SNU-MM5, YSU-RSM, KNU-RegCM4, and NIMR-HadGEM3). Probabilistic models include the generalized extreme value (GEV) (purple bar), three-parameter lognormal (LN3) (orange bar), generalized Pareto (GPD) (red bar), and Pearson Type III (PE3) (blue bar).
Figure 9 compares the empirical probability with the theoretical probability of GEV for the AMDSL time series with a cell grid at 101.75°E, 23.25°. The probability–probability plots indicate that the GEV model offers a relatively good fit to the AMDSL time series.
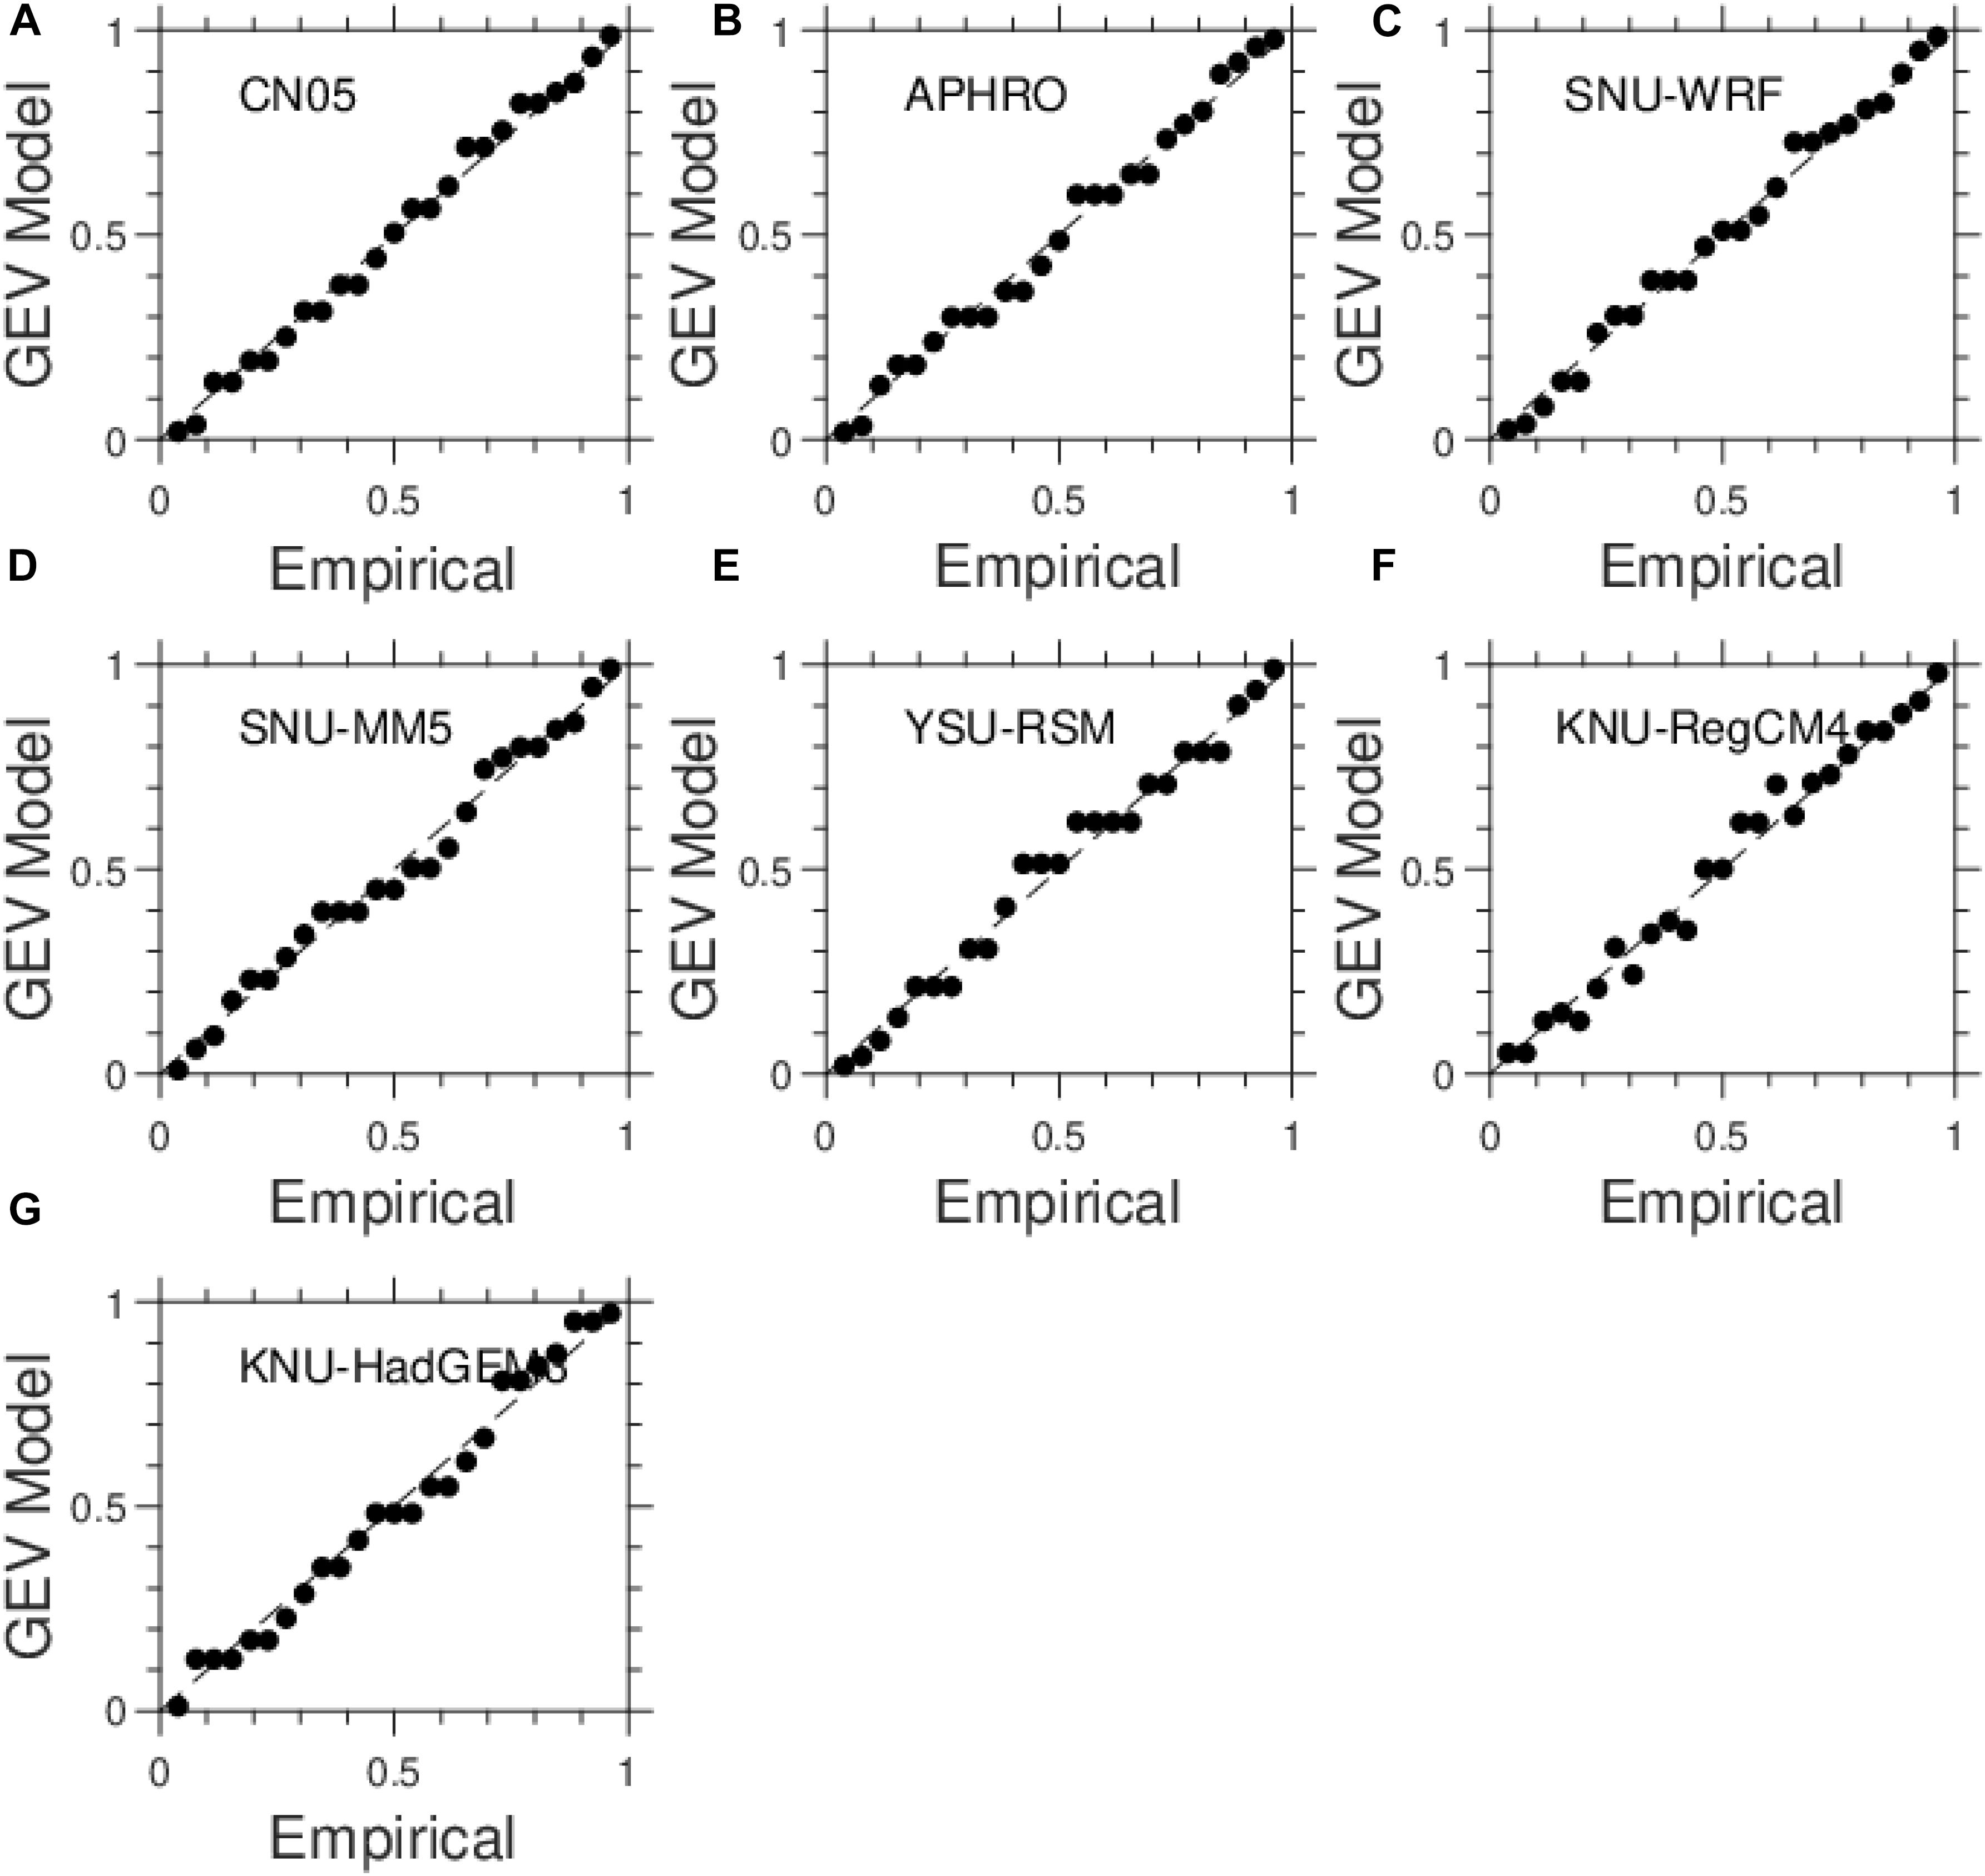
Figure 9. Probabilistic–probabilistic plots of the annual AMDSL time series for cell grid at 101.75°E, 23.25° from two observations, (A) CN05 and (B) APHRO, and five RCMs, (C) SNU-WRF, (D) SNU-MM5, (E) YSM-RSM, (F) NIMR-HadGEM3, and (G) KNU-RegCM4.
Simulated GEV Distribution Parameters
After fitting the GEV model to the AMDSL time series, three GEV parameters were estimated at each model gird cell for the five RCM simulations and also for the CN05 dataset. An explanation of the parameters in the GEV model is given in Supplementary Figure S1. Since both scale parameter α and location parameter ξ in GEV fitting contribute to the estimation of the 20-year return value, further analysis of model ability in simulating individual GEV parameters is needed for assessment of RCM performance.
The GEV scale parameter α, as characterized by the width of the probability distribution function, is a general measurement of the interannual variability of the AMDSL. In general, higher scale parameter values lead to a wider distribution and higher variability of the rarely occurring AMDSL. The spatial distribution pattern of scale parameter α for observed AMDSL over SWC is shown in Figure 10A. The distribution pattern is similar to the spatial pattern of the standard deviation of the AMDSL, which indicates that the scale parameter reasonably reflects the interannual variability of the AMDSL. The most dramatic center of AMDSL interannual change was found in the LLH region, which reflects the interaction of the EASM and the ISM. The spatial patterns of AMDSL scale parameter values in the five RCM simulations are also shown in Figure 10. The SNU-WRF, SNU-MM5, and NIMR-HadGEM3 simulations captured the large α value center in the LLH region and a northeast–southwest contrast dipole mode, with PCCs of 0.75, 0.80, and 0.77, respectively. In addition, SNU-WRF and SNU-MM5 produced positive bias, with overestimated interannual variation of the AMDSL in the southern part of YN, an area that is significantly affected by the tropical summer monsoon.
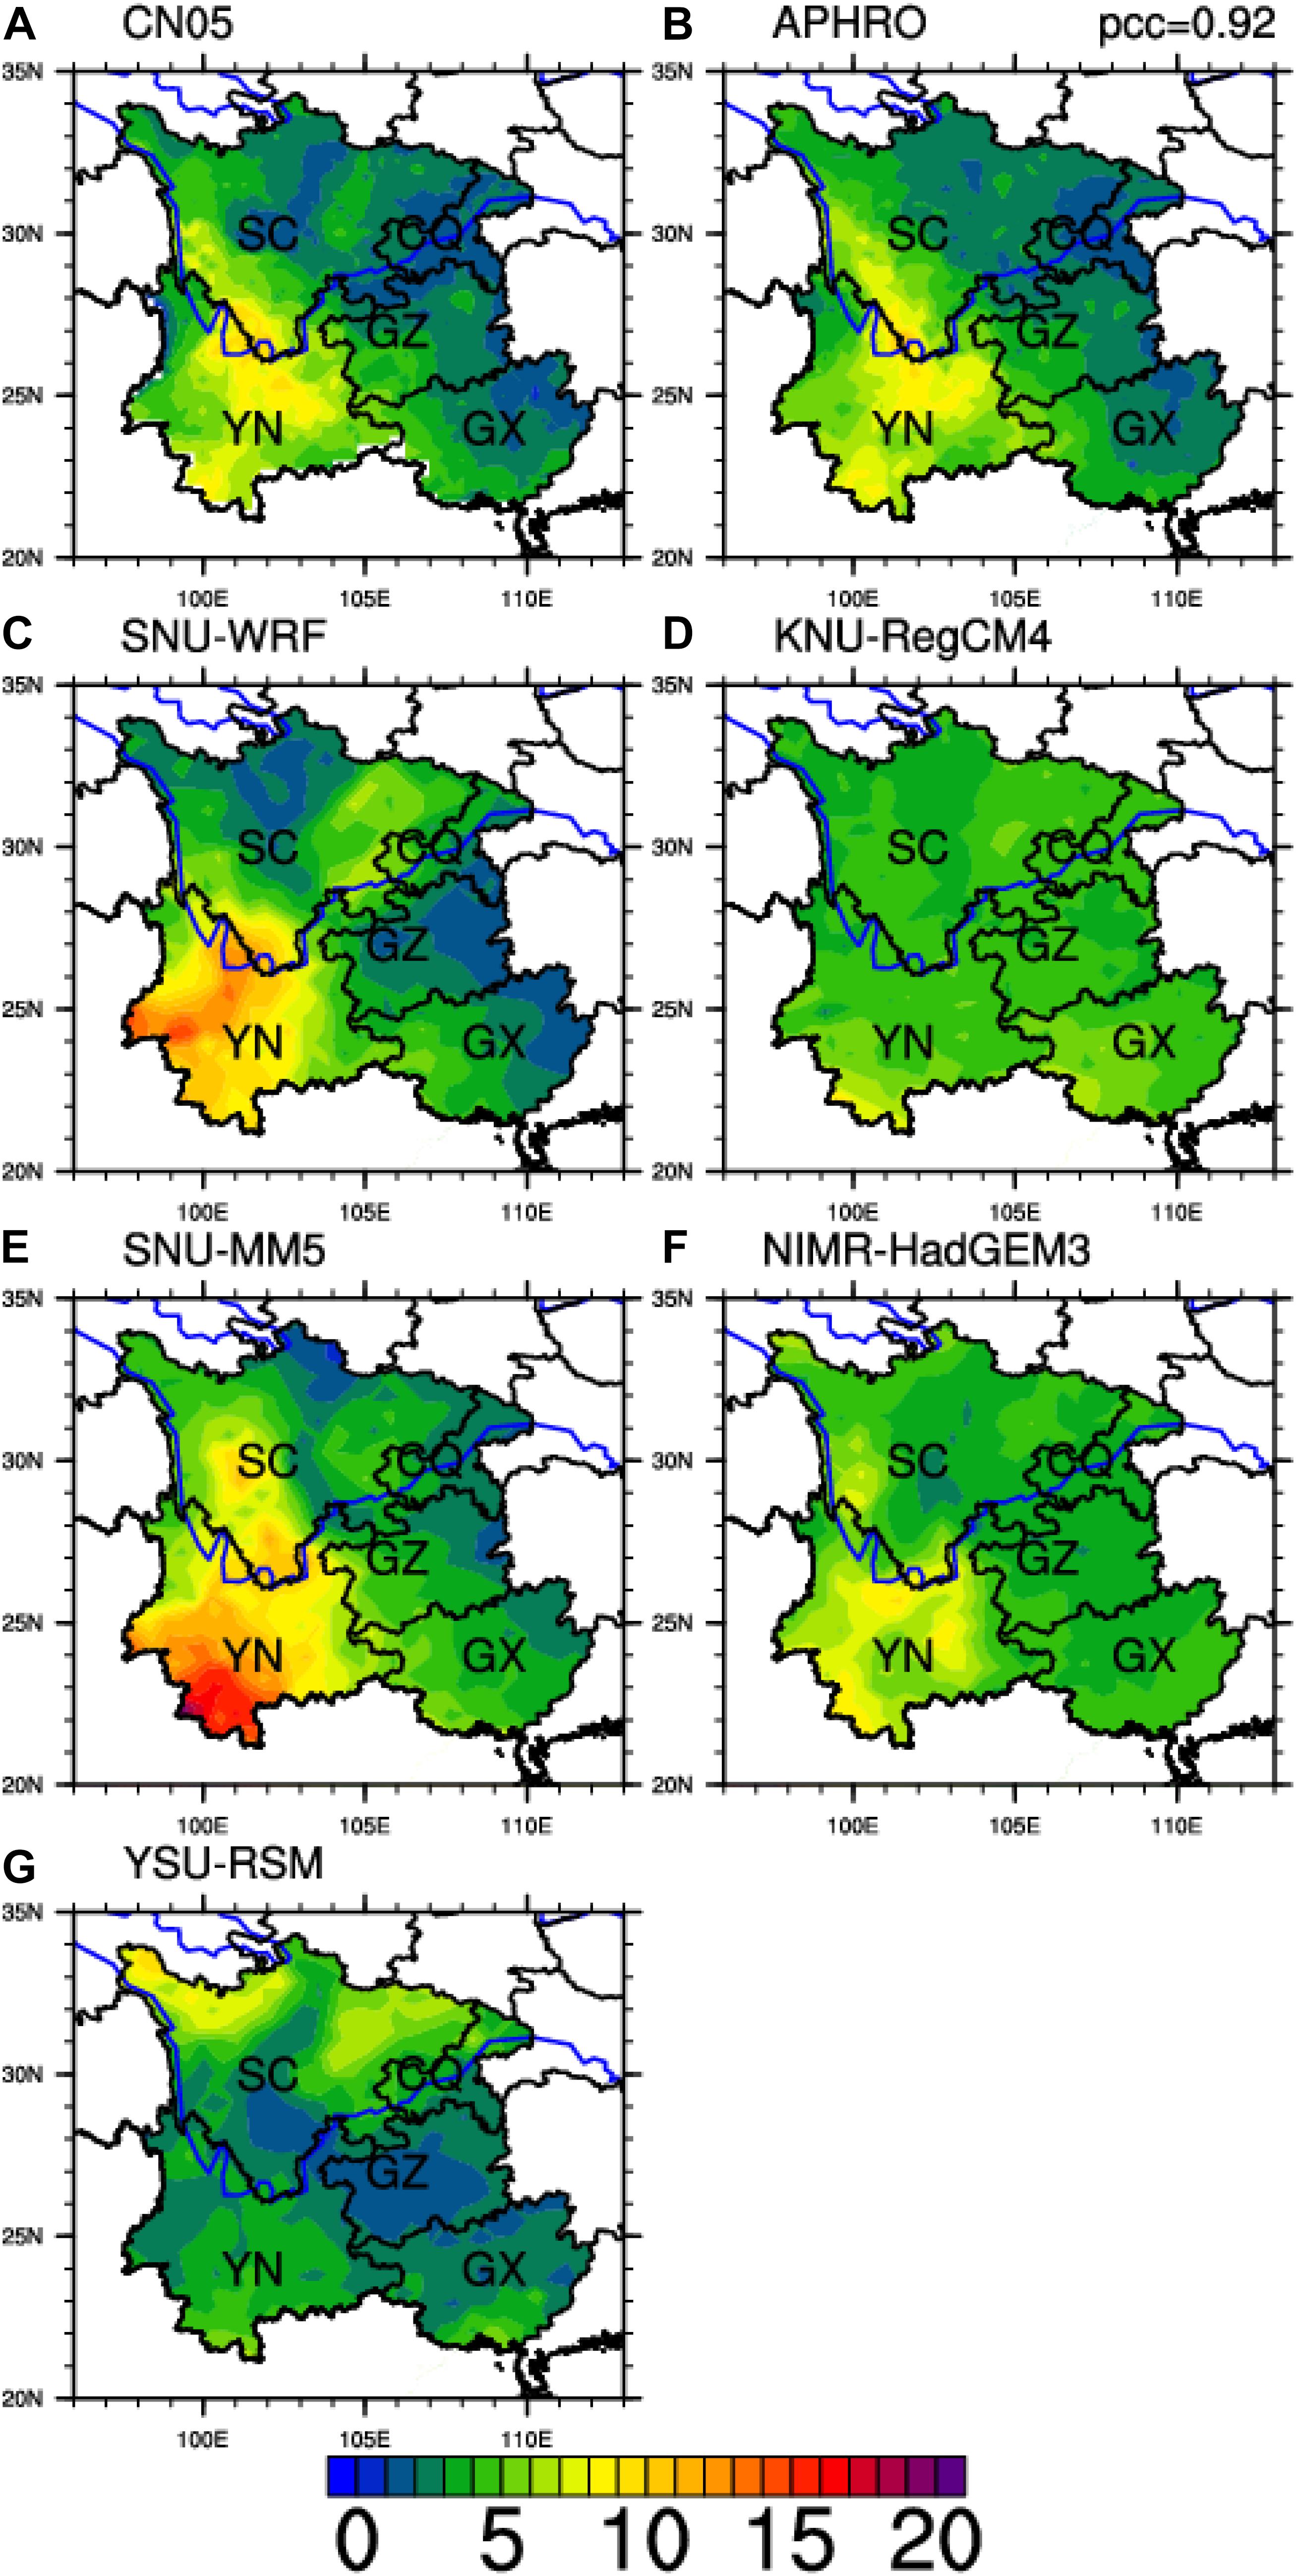
Figure 10. Spatial distributions of the GEV scale parameter of the AMDSL. (A) CN05, (B) APHRO, and five RCMs: (C) SNU-WRF, (D) KNU-RegCM4, (E) SNU-MM5, (F) NIMR-HadGEM3, and (G) YSM-RSM.
Figure 11A presents a Taylor diagram summary of RCM performances in simulating the scale parameter over SWC. Spatial correlations are significant at the 95% confidence level except for the YSU-RSM simulation. Similar to Figure 4B, four RCMs, except for YSU-RSM, reasonably reproduce the interannual variation of the AMDSL, but the spatial variability between RCMs is still different. Threshold sensitivity analysis indicated that choosing different thresholds for dry days does not significantly affect the ability of RCMs to simulate the AMDSL spatial pattern.
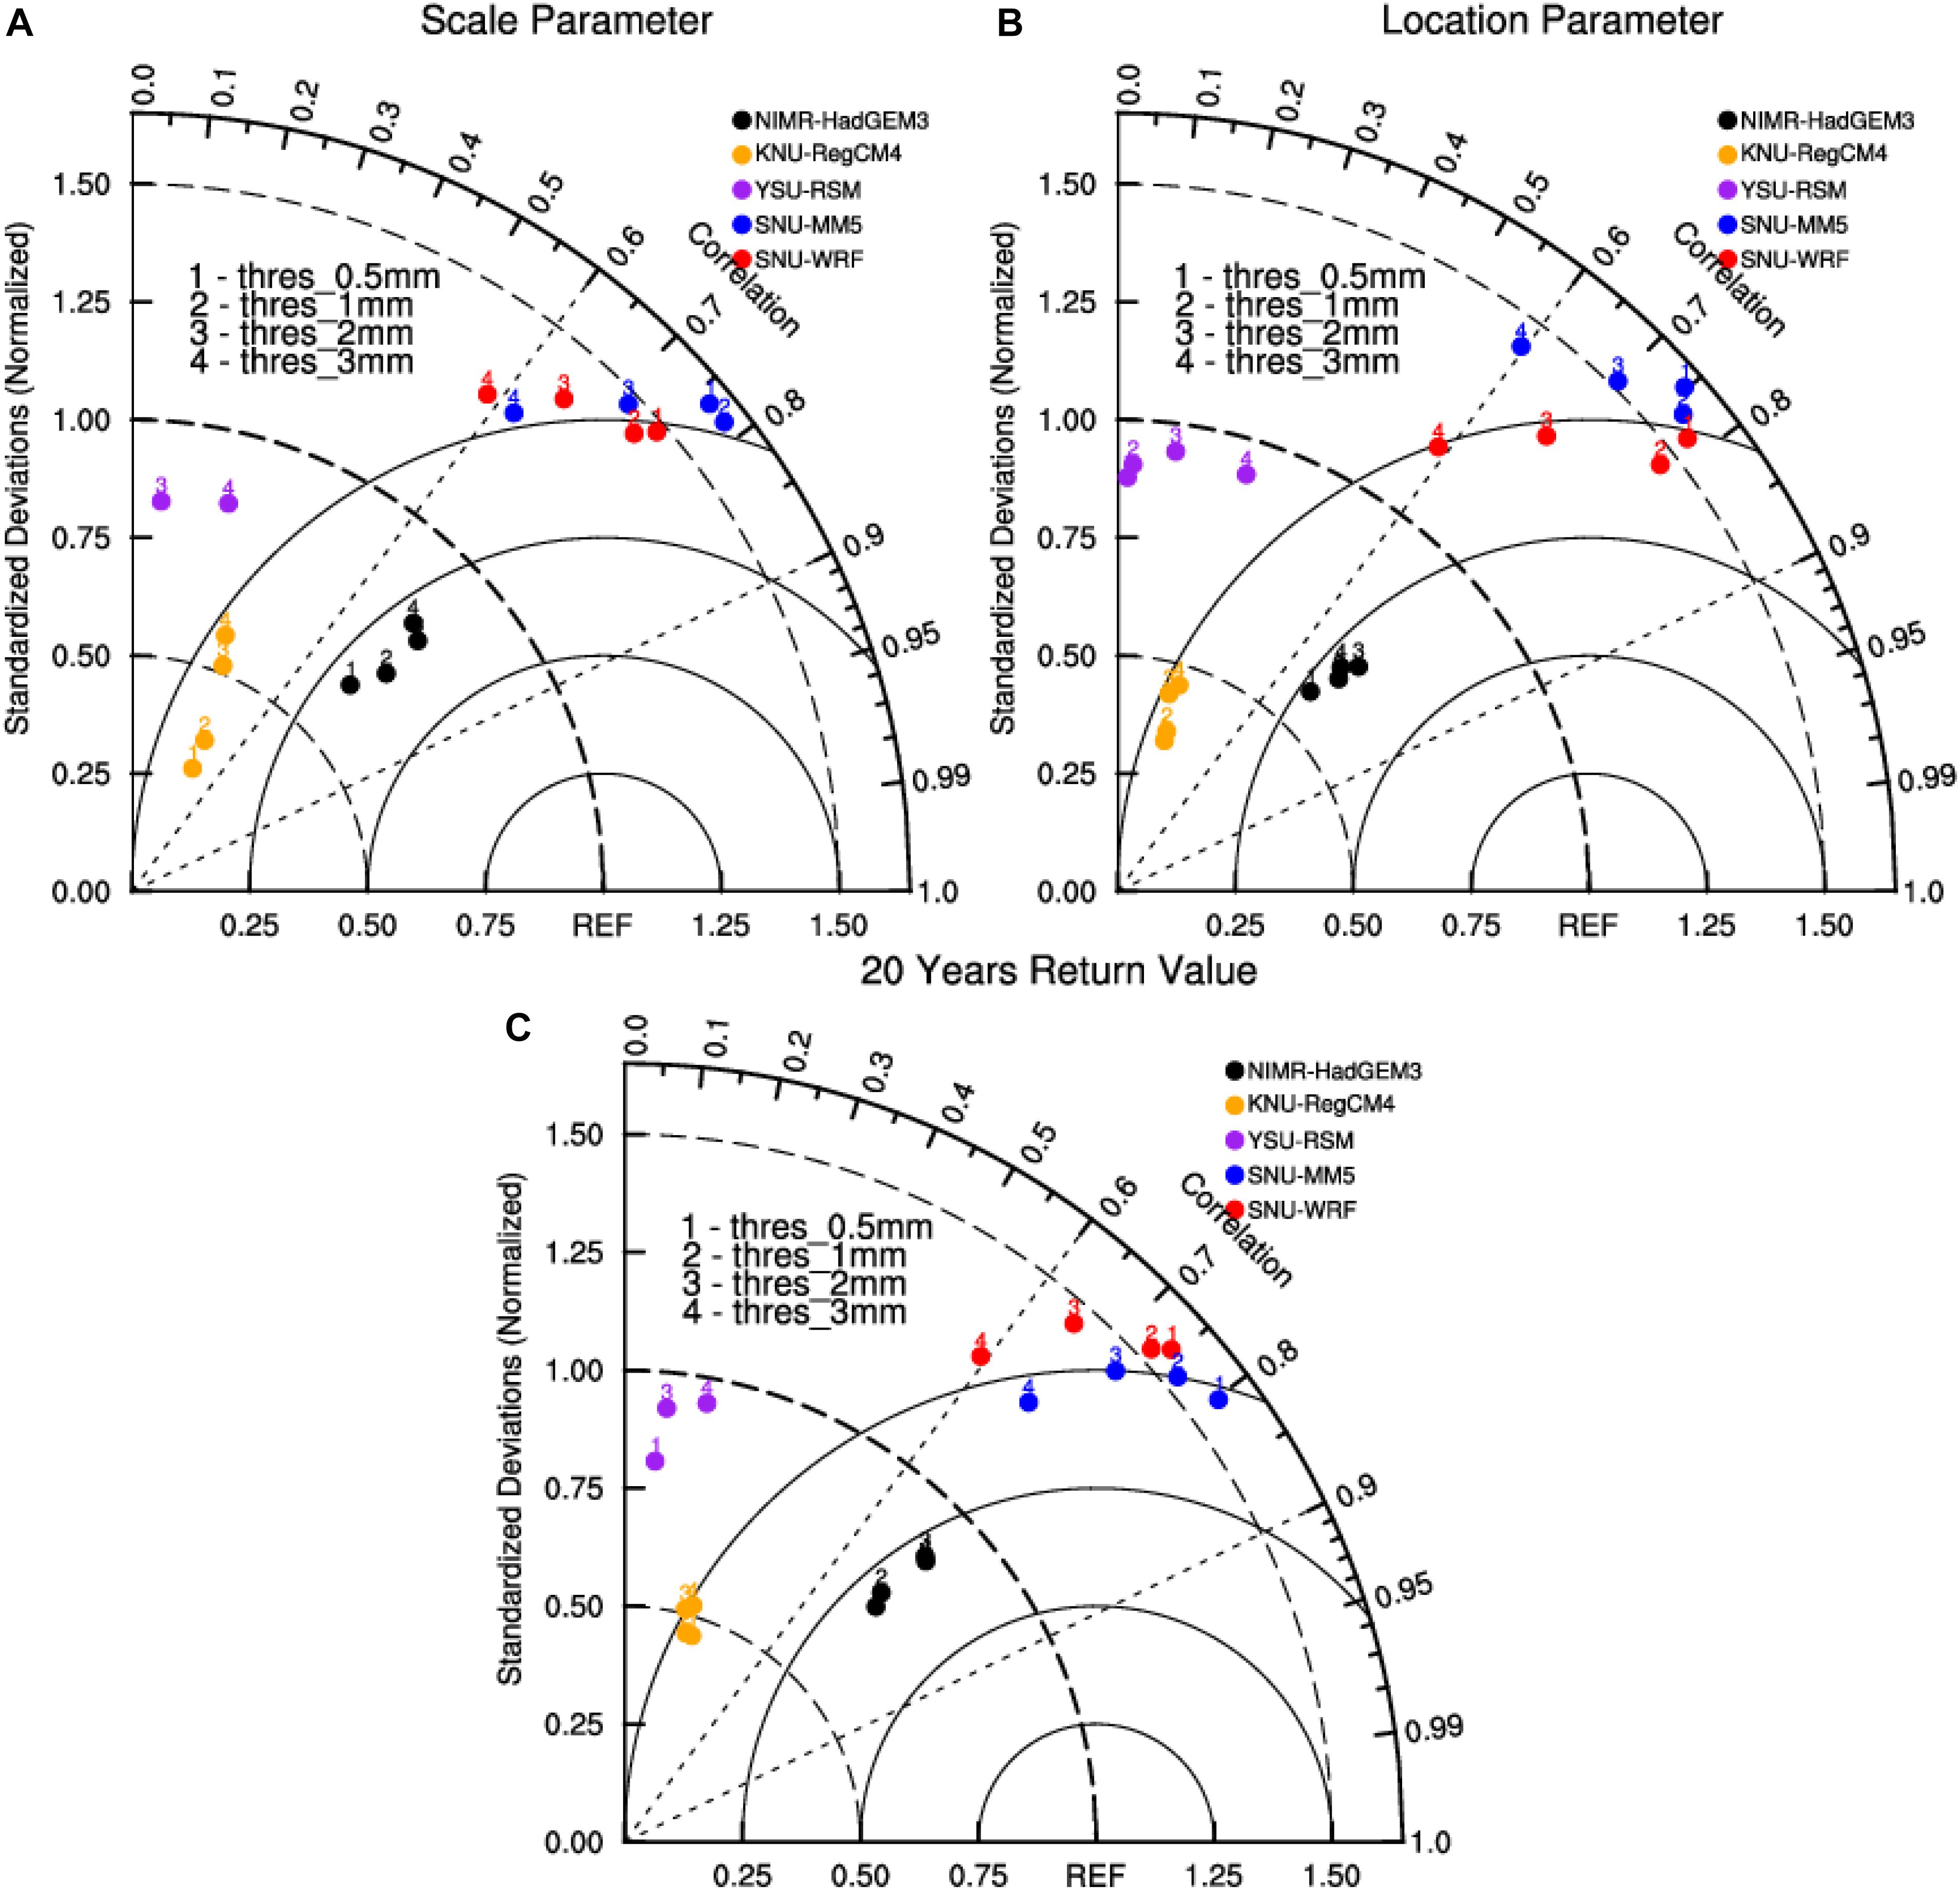
Figure 11. Multivariable Taylor diagram displaying normalized statistical comparisons of the SNU-WRF (red), SNU-MM5 (blue), YSU-RSM (purple), KNU-RegCM4 (orange), and NIMR-HadGEM3 (black) simulated GEV (A) scale parameter, (B) location parameter, and (C) 20-year return value of the AMDSL, respectively. Numbers indicate four different thresholds for dry days.
The GEV location parameter ξ is characterized by the position of the probability distribution function, which is a measurement of the averaged amplitude of the AMDSL. The spatial distribution patterns of the location parameter ξ for observed and simulated AMDSL over SWC are shown in Supplementary Figure S2. The distribution pattern is similar to that of the mean AMDSL. Both a larger location parameter and mean AMDSL are identified over the east side of the LLH and TMC, indicating a higher amplitude of the AMDSL and higher risk of drought in this region.
Figure 11B presents a Taylor diagram summary of RCM performances in simulating the location parameter over SWC. Spatial correlations are significant at the 95% confidence level except for the YSU-RSM simulation. Similar to Figure 4C, four RCMs, excepting YSU-RSM, reasonably reproduce the interannual variation of the AMDSL, but the spatial variability between RCMs is still different.
Based on equations in Supplementary Material Part B, the 20-year return values in each model grid were derived by inverting the GEV cumulative distribution function. In general, spatial maps of AMDSLs (Figure 12) revealed that the 20-year return value of the AMDSL increases gradually from the northeast to the southwest over SWC. The spatial pattern is similar to both the GEV scale parameter and location parameter. Higher values of the scale parameter over the LLH indicated a wider distribution of the AMDSL, and higher values of the location parameter led to an amplified distribution of the AMDSL. The interaction of two parameters resulted in an intensified northeast–southwest spatial contrast dipole mode of 20-year return values of the AMDSL. NIMR-HadGEM3 showed better simulation ability than the other three models based on Figure 11C.
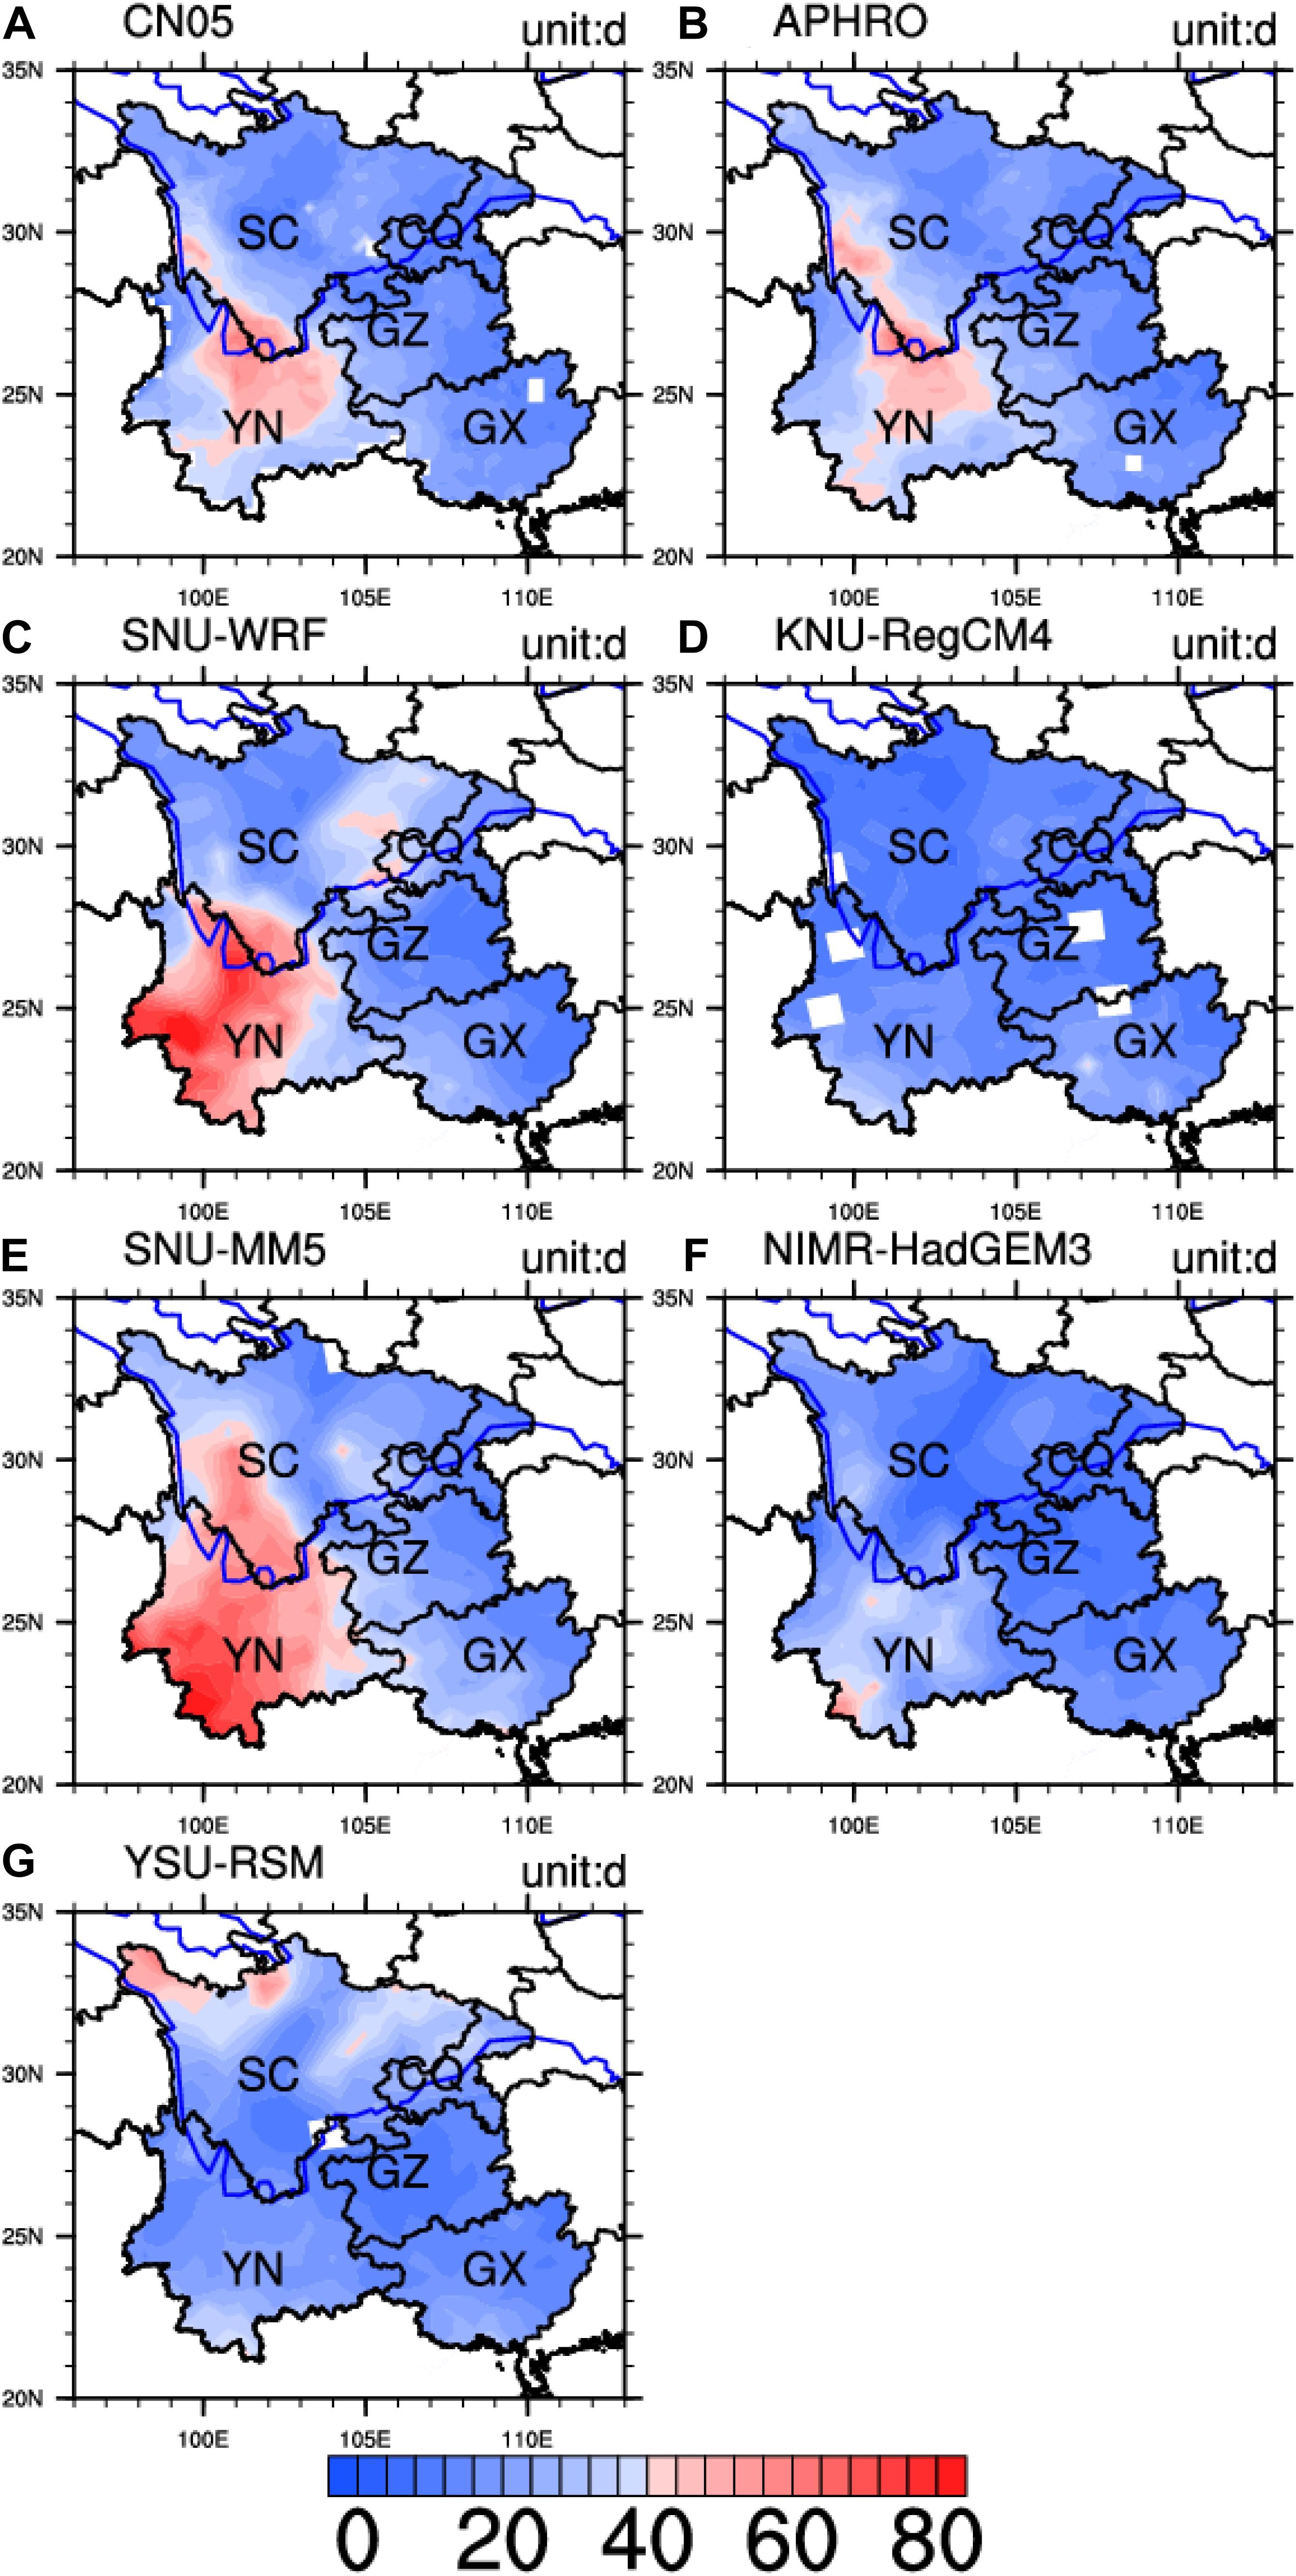
Figure 12. Spatial distributions of the GEV 20-yr return value of the AMDSL. (A) CN05, (B) APHRO; and five RCMs: (C) SNU-WRF, (D) KNU-RegCM4, (E) SNU-MM5, (F) NIMR-HadGEM3, and (G) YSM-RSM.
Figure 13 presents the linear relationship between relative model bias of the 20-year return value of the AMDSL and the dry day occurrence. Obviously, the simulated relative error of the RCMs for the occurrence of dry days is the main source for the simulated model bias of the mean AMDSL (Supplementary Figure S3) and 20-year return values of the AMDSL.
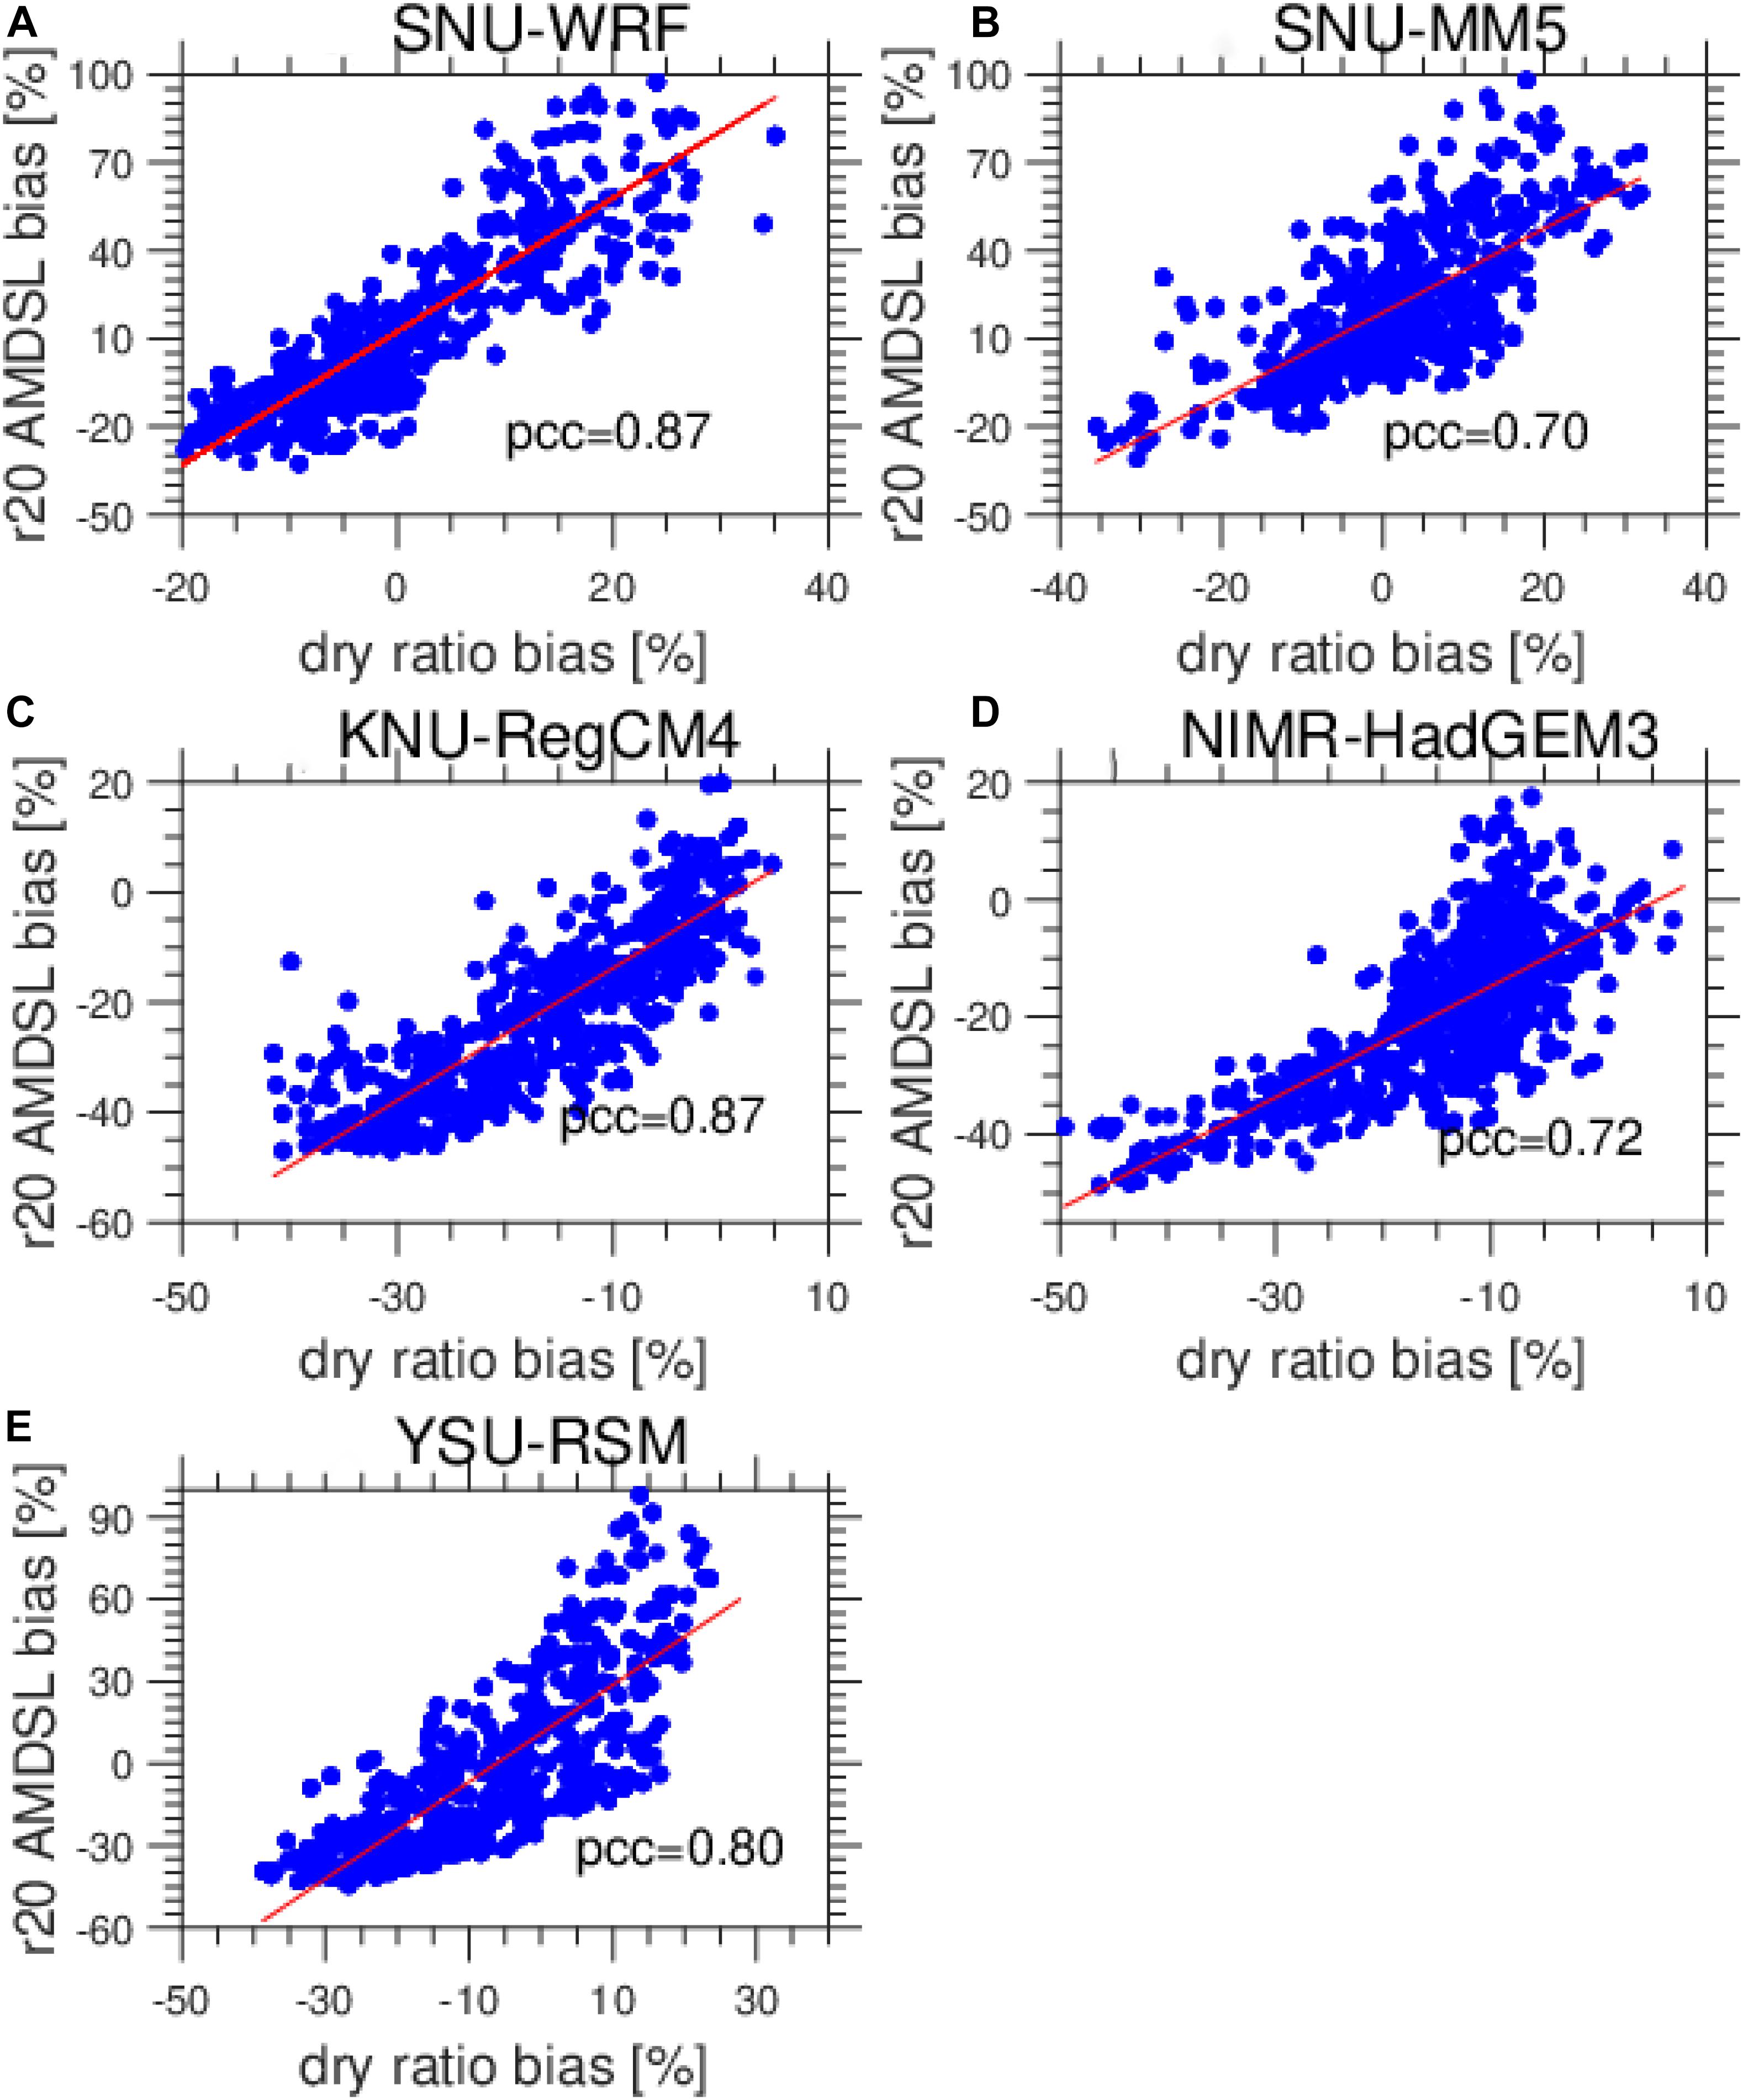
Figure 13. Scatter plots of relative model bias of the 20-year return value of the AMDSL against relative model bias of dry day occurrence. (A) SNU-WRF, (B) SNU-MM5, (C) KNU-RegCM4, (D) NIMR-HadGEM3, and (E) YSM-RSM.
Overall, based on the spatial distribution of the AMDSL in climatological mean and in distribution return values, higher values of the AMDSL were more likely to appear in the LLH, an area affected by both the EASM and the ISM. This region can also be considered as at higher risk of drought conditions (Wang et al., 2014). As most of SWC is used for agriculture and is more often subjected to soil moisture deficits due to longer lasting droughts, any increase in dry spell duration, particularly during the spring, can affect the agricultural sector significantly.
Discussion and Conclusion
In this study, we comprehensively evaluated the performance of five CORDEX-EA RCMs in simulating AMDSL characteristics in an area of complex terrain. The focus of this paper is not on unveiling the physical processes of the AMDSL nor on assessing its robust projection results but on providing a comparison of the capabilities of five RCMs in simulating the intensity and interannual variability of the AMDSL in SWC. This evaluation will provide insight to determine whether the AMDSL can be reasonably reproduced on a regional scale with RCMs.
The monthly variation in precipitation, interannual variability of precipitation, and mean dry days was well identified in both the CN05 and APHRO data. The five RCMs also reproduced the annual cycle of monthly mean precipitation, interannual variability, and monthly mean dry days but tended to overestimate the monthly mean precipitation and underestimate the monthly mean dry days. In addition, the five RCMs all simulated the probability distribution of dry spells over SWC reasonably well.
For the five RCMs used in this study, the four RCMs besides YSU-RSM reproduced the spatial pattern of the proportion of dry days and the climatology of the AMDSL over the SWC region. This is consistent with the previous results of RCM simulations on different regional scales (Tebaldi et al., 2006; Sushama et al., 2010; Wehner et al., 2010; Raymond et al., 2016, 2018; Tramblay and Hertig, 2018). It should be noted that large spatial variability differences are found among different RCM simulations. This variability can be attributed to the variance of RCMs in simulating extreme dry spells over complex terrain areas (Herrera et al., 2010; López-Franca et al., 2015). It is also worth noting that the RCMs reasonably simulate the spatial distribution of the interannual variability of AMDSL. Based on Taylor diagram evaluations, the four RCMs besides YSU-RSM show comparable ability to simulate the interannual variability of AMDSL compared to the climatology of AMDSL.
The generalized extreme value (GEV) distribution is considered the most suitable model for fitting the AMDSL in both observations and model experiments. The simulation of GEV scale parameters and location parameters is consistent with the simulation of the interannual variability and climatology of AMDSL by the RCMs. This is consistent with the previous results for RCMs simulating the probability distribution of the AMDSL (Tebaldi et al., 2006; Sushama et al., 2010; Wehner et al., 2010; Tramblay and Hertig, 2018).
The limitation of our study is the use of only five RCM simulations driven by one GCM. This meant that the full range of variability was not assessed. Additional RCM simulations are gradually becoming available, and these will be considered in the future. Furthermore, though dry spells can be indicators of drought (Tebaldi et al., 2006), other indicators, including temperature, soil moisture, and evaporation, were not well addressed in the present study.
Overall, the main findings on the performances of the five RCM simulations in reproducing various features of the AMDSL can be summarized as follows:
(a) Though the results show large spatial variability differences among different RCMs, four RCM simulations among five reasonably reproduced the AMDSL climatology and interannual variability. In addition, these four RCMs showed an ability to simulate the interannual variability of AMDSL that was comparable to that for simulation of the climatology of AMDSL. The results may provide references for choosing preferential RCMs in studies of the AMDSL and drought events in areas of complex terrain like SWC.
(b) The GEV distribution of the AMDSL could reveal the spatial distribution of the intensity and variability of the AMDSL, which would be helpful for longer-period return value estimation under present climate conditions and would be applicable to extreme dry spell prevention and mitigation.
(c) Probabilistic distribution analysis of the AMDSL over a range of precipitation thresholds was performed in the present study, and it is notable that, based on Taylor diagram summaries, the different threshold values did not influence the abilities of RCMs.
(d) The performance of RCMs in simulating the intensity and extreme distribution of the AMDSL is highly influenced by the ability of the model to simulate the occurrence of dry days.
Data Availability Statement
Publicly available datasets were analyzed in this study. This data can be found here: https://www.cordex.org/domains/region-7-east-asia/.
Author Contributions
TF designed the work, finished regional model data analysis, and wrote the manuscript. LX contributed to model evaluation and manuscript writing. YC designed the work and wrote the manuscript. ZT contributed to further analysis of regional climate model data.
Funding
This work was supported by the National Natural Science Foundation of China (41875109), the Natural Science Foundation of Yunnan Province (Grant No. 2018FB074), the Educational Foundation of Yunnan Province (Grant No. 2018JS014), the Yunnan Excellent Youth Fund Development Project (2018YDJQ012), and the Project of Power Construction Corporation of China (DJ-ZDZX-2016-02).
Conflict of Interest
The authors declare that the research was conducted in the absence of any commercial or financial relationships that could be construed as a potential conflict of interest.
Acknowledgments
The authors thank all the scientists and crew members who were involved in the program. The authors also thank the reviewers for their valuable comments, which helped to improve the manuscript a lot.
Supplementary Material
The Supplementary Material for this article can be found online at: https://www.frontiersin.org/articles/10.3389/feart.2019.00294/full#supplementary-material
Footnotes
References
Barriopedro, D., Gouveia, C. M., Trigo, R. M., and Wang, L. (2012). The 2009/10 drought in China: possible causes and impacts on vegetation. J. Hydrometeor. 13, 1251–1267. doi: 10.1175/JHM-D-11-074.1
Beck, H. E., Van Dijk, A. I., Levizzani, V., Schellekens, J., Gonzalez Miralles, D., Martens, B., et al. (2017a). MSWEP: 3-hourly 0.25 global gridded precipitation (1979-2015) by merging gauge, satellite, and reanalysis data. Hydrol. Earth Syst. Sci. 21, 589–615. doi: 10.5194/hess-21-589-2017
Beck, H. E., Vergopolan, N., Pan, M., Levizzani, V., van Dijk, A. I., Weedon, G. P., et al. (2017b). Global-scale evaluation of 22 precipitation datasets using gauge observations and hydrological modeling. Hydrol. Earth Syst. Sci. 21, 6201–6217. doi: 10.5194/hess-21-6201-2017
Boberg, F., Berg, P., Thejll, P., Gutowski, W. J., and Christensen, J. H. (2010). Improved confidence in climate change projections of precipitation further evaluated using daily statistics from ENSEMBLES models. Clim. Dym. 35, 1509–1520. doi: 10.1007/s00382-009-0683-8
Cha, D. H., and Lee, D. K. (2009). Reduction of systematic errors in regional climate simulations of the summer monsoon over East Asia and the western North Pacific by applying the spectral nudging technique. J. Geophys. Res. 114:D14108. doi: 10.1029/2008JD011176
Chan, S. C., Kendon, E. J., Fowler, H. J., Blenkinsop, S., Ferro, C. A. T., and Stephenson, D. B. (2013). Does increasing the spatial resolution of a regional climate model improve the simulated daily precipitation? Clim. Dyn. 41, 1475–1495. doi: 10.1007/s00382-012-1568-9
Chan, S. C., Kendon, E. J., Fowler, H. J., Blenkinsop, S., Roberts, N. M., and Ferro, C. A. T. (2014). The value of high-resolution Met Office regional climate models in the simulation of multi-hourly precipitation extremes. J. Clim. 27, 6155–6174. doi: 10.1175/JCLI-D-13-00723.1
Cheng, J. G., Yan, H. M., and Yan, H. S. (2009). Analysis on Characteristic and Cause of Severe Climate Disaster in Yunnan. Beijing: China Meteorology Press.
Christensen, J. H., and Christensen, O. B. (2007). A summary of the PRUDENCE model projections of changes in European climate by the end of this century. Clim. Change 81, 7–30. doi: 10.1007/s10584-006-9210-7
Coles, S., Bawa, J., Trenner, L., and Dorazio, P. (2001). An Introduction to Statistical Modeling of Extreme Values, Vol. 208. London: Springer.
Davies, T., Cullen, M. J. P., Malcolm, A. J., Mawson, M. H., Staniforth, A., White, A. A., et al. (2005). A new dynamical core for the Met Office’s global and regional modeling of the atmosphere. Q. J. R. Meteorol. Soc. 131, 1759–1782. doi: 10.1256/qj.04.101
Domínguez, M., Romera, R., Sánchez, E., Fita, L., Fernández, J., Jiménez-Guerrero, P., et al. (2013). Present-climate precipitation and temperature extremes over Spain from a set of high resolution RCMs. Clim. Res. 58, 149–164. doi: 10.3354/cr01186
Dominguez-Castro, F., Vicente-Serrano, S. M., Tomas-Burguerra, M., Pena-Gallardo, M., Begueria, S., El Kenawy, A., et al. (2019). High-spatial-resolution probability maps of drought duration and magnitude across Spain. Nat. Hazards Earth Syst. Sci. 19, 611–628. doi: 10.5194/nhess-19.611-2019
Donat, M. G., Alexander, L. V., Herold, N., and Dittus, A. J. (2016). Temperature and precipitation extremes in century-long gridded observations, reanalyses, and atmospheric model simulations. J. Geophys. Res. Atmos. 121, 11174–11189. doi: 10.1002/2016JD025480
Fantini, A., Raffaele, F., Torma, C., Bacer, M., Coppola, E., Giorgi, F., et al. (2016). Assessment of multiple daily precipitation statistics in ERA-Interim driven Med-CORDEX and Euro-CORDEX experiments against high resolution observations. Clim. Dyn. 51, 877–900. doi: 10.1007/s00382-016-3453-3454
Frich, P., Alexander, L. V., Della-Marta, P., Gleason, B., Haylock, M., Tank, A. M. G. K., et al. (2002). Observed coherent changes in climatic extremes during the second half of the twentieth century. Clim. Res. 19, 193–212. doi: 10.3354/cr019193
Giorgi, F., Coppola, E., Solmon, F., Mariotti, L., Sylla, M. B., Bi, X., et al. (2012). RegCM4: model description and preliminary tests over multiple CORDEX domains. Clim. Res. 52, 7–29. doi: 10.3354/cr01018
Giorgi, F., Jones, C., and Asrar, G. R. (2009). Addressing climate information needs at the regional level: the CORDEX framework. WMO Bull. 58, 175–183.
Herold, N., Behrangi, A., and Alexander, L. V. (2017). Large uncertainties in observed daily precipitation extremes over land. J. Geophys. Res. Atmos. 122, 668–681. doi: 10.1002/2016JD025842
Herrera, S., Fita, L., Fernández, J., and Gutiérrez, J. M. (2010). Evaluation of the mean and extreme precipitation regimes from the ENSEMBLES regional climate multi model simulation over Spain. J. Geophys. Res. Atmos. 115:D21117. doi: 10.1029/2010JD013936
Hong, S.-Y., Park, H., Cheong, H.-B., Kim, J.-E. E., Koo, M.-S., Jang, J., et al. (2013). The global/regional integrated model system (GRIMs). Asian Pac. J. Atmos. Sci. 49, 219–243. doi: 10.1007/s13143-013-0023-0
Hosking, J. R. M. (1990). L-moments: analysis and estimation of distributions using linear combinations of order statistics. J. R. Statist. Soc. B 52, 105–124. doi: 10.1111/j.2517-6161.1990.tb01775.x
Hosking, J. R. M., and Wallis, J. R. (1993). Some statistics useful in regional frequency analysis. Water Resour. Res. 29, 271–281. doi: 10.1029/92WR01980
Hosking, J. R. M., and Wallis, J. R. (2005). Regional Frequency Analysis: An Approach Based on L-Moments. Cambridge: Cambridge University Press.
Huang, B., Polanski, S., and Cubasch, U. (2015). Assessment of precipitation climatology in an ensemble of CORDEX-East Asia regional climate simulations. Clim. Res. 64, 141–158. doi: 10.3354/cr01302
Huffman, G. J., Adler, R. F., Morrissey, M. M., Bolvin, D. T., Curtis, S., Joyce, R., et al. (2001). Global precipitation at one-degree daily resolution from multisatellite observations. J. Hydrometeor. 2, 36–50. doi: 10.1175/1525-75412001002<0036:GPAODD<2.0.CO;2
Kopparla, P., Fischer, E. M., Hannay, C., and Knutti, R. (2013). Improved simulation of extreme precipitation in a high-resolution atmosphere model. Geophys. Res. Lett. 40, 5803–5808. doi: 10.1002/2013GL057866
Kotlarski, S., Keuler, K., Christensen, O. B., Colette, A., Déqué, M., Gobiet, A., et al. (2014). Regional climate modeling on European scales: a joint standard evaluation of the EURO-CORDEX RCM ensemble. Geosci. Model Dev. 7, 1297–1333. doi: 10.5194/gmd-7-1297-2014
Kroll, C. N., and Vogel, R. M. (2002). Probability distribution of low streamflow series in the United States. ASCE J. Hydrol. Eng. 7, 137–146. doi: 10.1061/(ASCE)1084-069920027:2(137)
Lee, J.-W., Hong, S.-Y., Chang, E.-C., Suh, M.-S., and Kang, H.-S. (2014). Assessment of future climate change over East Asia due to the RCP scenarios downscaled by GRIMs-RMP. Clim. Dyn. 42, 733–747. doi: 10.1007/s00382-013-1841-6
Li, H. X., Chen, H. P., Wang, H. J., and Yu, E. T. (2018). Future precipitation changes over China under 1.5°C and 2.0°C global warming targets by using CORDEX regional climate models. Sci. Total. Environ. 640-641, 543–554. doi: 10.1016/j.scitotenv.2018.05.324
López-Franca, N., Sánchez, E., Losada, T., Domínguez, M., Romera, R., and Gaertner, M. A. (2015). Markovian characteristics of dry spells over the Iberian Peninsula under present and future conditions using ESCENA ensemble of regional climate models. Clim. Dyn. 45, 661–677. doi: 10.1007/s00382-014-2280-8
Maraun, D., Wetterhall, F., Ireson, A. M., Chandler, R. E., Kendon, E. J., Widmann, M., et al. (2010). Precipitation downscaling under climate change: recent developments to bridge the gap between dynamical models and the end user. Rev. Geophys. 48:RG3003. doi: 10.1029/2009RG000314
Modarres, R. (2010). Regional dry spells frequency analysis by L-moment and multivariate analysis. Water Resour. Manage. 24, 2365–2380. doi: 10.1007/s11269-009-9556-5
Oh, S.-G., Park, J.-H., Lee, S.-H., and Suh, M.-S. (2014). Assessment of the RegCM4 over East Asia and future precipitation change adapted to the RCP scenarios. J. Geophys. Res. Atmos. 119, 2913–2927. doi: 10.1002/2013JD020693
Park, C., Min, S.-K., Lee, D., Cha, D.-H., Suh, M.-S., Kang, H.-S., et al. (2016). Evaluation of multiple regional climate models for summer climate extremes over East Asia. Clim. Dyn. 46, 2469–2486. doi: 10.1007/s00382-015-2713-z
Pope, V., and Stratton, R. (2002). The processes governing horizontal resolution sensitivity in a climate model. Clim. Dyn. 19, 211–236. doi: 10.1007/s00382-001-0222-8
Qin, J., Ju, J. H., and Xie, M. E. (1997). Weather and Climate in Low Latitudes Plateau (in Chinese). Beijing: China Meteorology Press, 210.
Rauscher, S. A., Coppola, E., Piani, C., and Giorgi, F. (2010). Resolution effects on regional climate model simulations of seasonal precipitation over Europe. Clim. Dyn. 35, 685–711. doi: 10.1007/s00382-009-0607-7
Raymond, F. A., Drobinski, C., Ullmann, P., and Camberlin, P. (2018). Extreme dry spells over the Mediterranean Basin during the wet season: assessment of HyMeX/Med-CORDEX regional climate simulations (1979-2009). Int. J. Climatol. 38, 3090–3105. doi: 10.1002/joc.5487
Raymond, F. A., Ullmann, P., Camberlin, P., Drobinski, C., and Chateau Smith, C. (2016). Extreme dry spell detection and climatology over the Mediterranean Basin during the wet season. Geophys. Res. Lett. 43, 7196–7204. doi: 10.1002/2016GL069758
Roeckner, E., Brokopf, R., Esch, M., Giorgetta, M., Hagemann, S., Kornblueh, L., et al. (2006). Sensitivity of simulated climate to horizontal and vertical resolution in the ECHAM5 atmosphere model. J. Clim. 19, 3771–3791. doi: 10.1175/JCLI3824.1
Rummukainen, M. (2015). Added value in regional climate modeling. WREs Clim. Change 7, 145–159. doi: 10.1002/wcc.378
Saaroni, H., Ziv, B., Lempert, J., Gazit, Y., and Morin, E. (2015). Prolonged dry spells in the Levant region: climatologic-synoptic analysis. Int. J. Climatol. 35, 2223–2236. doi: 10.1002/joc.4143
Salathé, E. P., Steed, R., Mass, C. F., and Zah, P. H. (2008). A high-resolution climate model for the U.S. Pacific Northwest: mesoscale feedbacks and local responses to climate change. J. Clim. 21, 5708–5726. doi: 10.1175/2008JCLI2090.1
Sarhadi, A., and Heydarizadeh, M. (2014). Regional frequency analysis and spatial pattern characterization of Dry Spells in Iran. Int. J. Climatol. 34, 835–848. doi: 10.1002/joc.3528
Shaffrey, L., Stevens, I., Norton, W. A., Roberts, M. J., Vidale, P. L., Harle, J. D., et al. (2009). U.K. HiGEM: the new U.K. high-resolution global environment model—Model description and basic evaluation. J. Clim. 22, 1861–1896. doi: 10.1175/2008jcli2508.1
Skamarock, W. C., Klemp, J. B., Dudhia, J., Gill, D. O., Barker, D. M., Wang, W., et al. (2005). A Description of the Advanced Research WRF Version 2. NCAR Technical note NCAR/TN-4681STR.
Spinoni, J., Barbosa, P., De Jager, A., McCormick, N., Naumann, G., Vogt, J. V., et al. (2019). A new global database of meteorologcial dorught events from 1951 to 2016. J. Hydrol. Reg. Stud. 22:100593. doi: 10.1016/j.ejrh.2019.100593
Sun, C., and Yang, S. (2012). Persistent severe drought in southern China during winter–spring 2011: large-scale circulation patterns and possible impacting factors. J. Geophys. Res. 117:D10112. doi: 10.1029/2012JD017500
Sushama, L., Khaliq, N., and Laprise, R. (2010). Dry spell characteristics over Canada in a changing climate as simulated by the Canadian RCM. Glob. Planet. Chang 74, 1–14. doi: 10.1016/j.gloplacha.2010.07.004
Taylor, K. E. (2001). Summarizing multiple aspects of model performance in a single diagram. J. Geophys. Res. 106, 7183–7192. doi: 10.1029/2000JD900719
Tebaldi, C., Hayhoe, K., Arblaster, J. M., and Meehl, G. A. (2006). An intercomparison of model-simulated historical and future changes in extreme events. Clim. Change 79, 185–211. doi: 10.1007/s10584-006-9051-4
Tramblay, Y., and Hertig, E. (2018). Modelling extreme dry spells in the mediterranean region in connection with atmospheric circulation. Atmos. Res 202, 40–48. doi: 10.1016/j.atmosres.2017.11.015a
Vicente-Serrano, S. M., Beguería, S., and López-Moreno, J. I. (2010). A multiscalar drought index sensitive to global warming: the standardized precipitation evapotranspiration index. J. Clim. 23, 1696–1718. doi: 10.1175/2009JCLI2909.1
von Storch, H., and Zorita, E. (2019). The history of ideas of downscaling—from synoptic dynamics and spatial interpolation. Front. Environ. Sci. 7:21. doi: 10.3389/fenvs.2019.00021
Wang, L., Chen, W., and Zhou, W. (2014). Assessment of future drought in Southwest China based on CMIP5 multimodel projections. Adv. Atmos. Sci. 31, 1035–1050. doi: 10.1007/s00376-014-3223-3
Wang, L., Chen, W., Zhou, W., and Huang, G. (2015). Drought in Southwest China: a review. Atmos. Ocean. Sci. Lett. 8, 339–344. doi: 10.3878/AOSL20150043
Wang, Y., Leung, L. R., McGregor, J. L., Lee, D.-K., Wang, W. C., Ding, Y. H., et al. (2004). Regional climate modeling: progress, challenges and prospects. J. Meteorol. Soc. Jpn. 82, 1599–1628. doi: 10.2151/jmsj.82.1599
Wehner, M. F., Smith, R. L., Bala, G., and Duffy, P. (2010). The effect of horizontal resolution on simulation of very extreme US precipitation events in a global atmosphere model. Clim. Dyn. 32, 241–247. doi: 10.1007/s00382-009-0656-y
Wu, J., and Gao, X. (2013). A gridded daily observation dataset over China region and comparison with the other datasets (in Chinese). Chin. J. Geophys. 56, 1102–1111. doi: 10.6038/cjg20130406
Yang, Y. L., Du, Y., Chen, H. S., and Zhang, Y. S. (2011). Influence of ENSO event on rainfall anomaly over Yunnan Province and its neighboring regions during late spring-early summer (in Chinese). Chin. J. Atmos. Sci. 35, 729–738. doi: 10.3878/j.issn.1006-9895.2011.04.12
Yatagai, A., Kaminguchi, K., Arakawa, O., Hamada, A., Yasutomi, N., and Kitoh, A. (2012). APHRODITE: constructing a long-term daily gridded precipitation dataset for Asia based on a dense network of rain gauges. Bull. Am. Meteor. Soc. 93, 1401–1415. doi: 10.1175/BAMS-D-11-00122.1
Keywords: regional climate models, annual maximum dry spell length, CORDEX East Asia, generalized extreme value, L-moments
Citation: Feng T, Tipton Z, Xia L and Chang Y (2019) Evaluation of CORDEX Regional Climate Models in Simulating Extreme Dry Spells in Southwest China. Front. Earth Sci. 7:294. doi: 10.3389/feart.2019.00294
Received: 31 October 2018; Accepted: 28 October 2019;
Published: 06 December 2019.
Edited by:
Martin Stendel, Danish Meteorological Institute (DMI), DenmarkReviewed by:
Rosane Rodrigues Chaves, Federal University of Rio Grande do Norte, BrazilMyoung-Seok Suh, Kongju National University, South Korea
Merja H. Tölle, University of Giessen, Germany
Copyright © 2019 Feng, Tipton, Xia and Chang. This is an open-access article distributed under the terms of the Creative Commons Attribution License (CC BY). The use, distribution or reproduction in other forums is permitted, provided the original author(s) and the copyright owner(s) are credited and that the original publication in this journal is cited, in accordance with accepted academic practice. No use, distribution or reproduction is permitted which does not comply with these terms.
*Correspondence: Tao Feng, dGFvZmVuZ0B5bnUuZWR1LmNu; Youli Chang, eWxjaGFuZ0B5bnUuZWR1LmNu