 Cécile Dupouy1,2*
 Rüdiger Röttgers3
 Marc Tedetti1
 Robert Frouin4
 François Lantoine5Martine Rodier6Chloe Martias1,2
 Madeleine Goutx1
- 1Aix Marseille Univ, Université de Toulon, CNRS, IRD, MIO UM 110, 13288, Marseille, France
- 2Institut de Recherche pour le Développement (IRD), Nouméa, New Caledonia
- 3Helmholtz-Zentrum Geesthacht, Centre for Materials and Coastal Research, Geesthacht, Germany
- 4Scripps Institution of Oceanography, University of California, San Diego, San Diego, CA, United States
- 5Laboratoire d’Ecogéochimie des Environnements Benthiques, UMR 8822, Banyuls-sur-Mer, France
- 6Institut de Recherche pour le Développement (IRD), UMR 241, Ecosystèmes Insulaires Océaniens, Faa’a, French Polynesia
New Caledonia (Southwest Pacific), like all tropical Pacific Island countries, is impacted by weather events, climate change, and local anthropogenic forcing. Strong erosion of particles and dissolved organic matter (DOM) from ultramafic rocks, associated with trace metals dissemination (i.e., nickel, manganese and cobalt), potentially affects lagoon waters and coral reefs surrounding the main island. The CALIOPE (CALedonian Inherent Optical PropErties) cruises were performed along the Eastern Lagoon of New Caledonia (ELNC) (400 km, 13 transects from Bay to open ocean, 51 stations) during contrasted meteorological conditions: a dry period (October 2011), a windy situation (March 2014), and a strong rainy event (March 2016). CDOM absorption and fluorescence (FDOM), particulate absorption, backscattering, suspended particulate matter (SPM), total chlorophyll a (TChla), nutrients (NOx), pigment and phytoplankton composition were measured. Among the four CDOM fluorophores, the humic-like component (λEx/λEm: 235/460 nm), assimilated to a photoproduct of terrestrial organic matter, had relatively low fluorescence compared to protein-like fluorophores. As CDOM absorption, particulate absorption, backscattering, SPM, total chlorophyll a (TChla) and nutrient (NOx) concentrations, this humic-like material generally showed the highest values during rainfall events, the latter inducing an increase in riverine terrigeneous inputs and change toward higher phytoplankton size classes. The tyrosine 1-like (λEx/λEm: 220, 275/304 nm) and tryptophan-like fluorophores (λEx/λEm: 230, 300/352 nm) were strongly influenced by wind displaying a 7-fold and 3-fold increase, respectively in windy situation compared to calm conditions. These increases could be related to enhancements of autochthonous biological activities (highest mean concentrations of Synechococcus spp., phycoerythrin, pico- and nano-eukaryotes, heterotrophic bacteria and nanoplankton observed in wind condition) through the inputs of organic and mineral materials issued from the wind-induced sediment resuspension, atmospheric deposition and water mass mixing. By contrast, the tyrosine 2-like fluorophore (λEx/λEm: 245, 275/304 nm) substantially increased during rain events and presented the lowest values in wind conditions. These strong increases may be linked to the stimulation of planktonic activities due to riverine inputs. Therefore, this study emphasizes the significant differential influence of weather conditions (calm/wind/rain) on biogeochemistry and CDOM/FDOM distributions in the ELNC.
Introduction
Marine dissolved organic matter (DOM), a heterogeneous mixture of carbon-containing molecules, is the largest pool of reduced carbon on Earth, comparable in size to the atmospheric CO2 reservoir (Hansell, 2013; Carlson and Hansell, 2015). DOM plays a key role in oceanic biogeochemical cycles and constitutes a primary source of energy for heterotrophic growth (Moran et al., 2016; Martínez-Pérez et al., 2017). In the ocean, DOM is mainly produced by phytoplankton photosynthesis and associated trophic web interactions (Carlson and Hansell, 2015; Aparicio et al., 2016; Kwon et al., 2018). In coastal waters, DOM additionally comes from land drainage, mostly soil-derived OM carried by rivers (Mounier et al., 1999; Fichot and Benner, 2014; Fichot et al., 2016). A significant part of DOM is biotically or abiotically transformed into biologically recalcitrant material, escaping further mineralization, accumulating in surface waters (Thingstad et al., 1997; Hansell et al., 2009).
Chromophoric or colored DOM (CDOM) is the fraction of DOM that absorbs ultraviolet (UV) and visible radiations (Bricaud et al., 1981). CDOM is ubiquitous in the ocean and has autochthonous (planktonic) or terrestrial origins (Murphy et al., 2008; Jiao et al., 2010; Romera-Castillo et al., 2010; Nelson and Siegel, 2013; Fichot and Benner, 2014). CDOM, which is the main attenuator of UV solar radiation in the ocean, has a strong influence on the underwater light field and ocean color (Siegel et al., 2002; Tedetti and Sempéré, 2006; Blondeau-Patissier et al., 2009) and undergoes photochemical processes in surface waters (Mopper and Kieber, 2002; Stubbins et al., 2010). The composition and distribution of CDOM in the ocean is studied through its absorption and fluorescence properties. Recently, several studies have investigated the relationships between absorption and fluorescence properties of CDOM and dissolved organic carbon (DOC) concentrations (Zhang et al., 2013; Rochelle-Newall et al., 2014; Specchiulli et al., 2018) or dissolved lignin concentrations in coastal waters (Stedmon and Markager, 2005; Osburn et al., 2012; Dixon et al., 2014; Yamashita et al., 2015; Fichot et al., 2016).
In marine tropical oligotrophic ecosystems, absorption and fluorescence properties of CDOM remain scarce compared to lakes or coastal areas (e.g., Zhang et al., 2009, 2013). Weathering of soils is a source of fluorescent CDOM in rivers and coastal ecosytems (Mounier et al., 2018). In shallow coastal tropical ecosystems, CDOM absorption is typically low due to strong solar photobleaching (Nelson et al., 1998; Swan et al., 2012) that significantly influences the biogeochemical cycles of DOM through photodegradation (Osburn et al., 2012; Hu et al., 2016). In the coral reef ecosystem of La Reunion Island (Indian ocean), fluorescence properties of CDOM revealed a dominance of autochthonous/biological material in oceanic waters, an increase in humic-like material in reef waters in contact with volcanic grounds, and the presence of anthropogenic compounds in some of the water bodies (Tedetti et al., 2011). Submarine ground waters entering the tropical lagoons were identified by their fluorescence signatures in Hawaii (Nelson et al., 2015). In a mesocosm representing ideally the Southwest Caledonian lagoon, CDOM fluorescence was linked to picophytoplankton abundance (Tedetti et al., 2016).
New Caledonia (Southwest Pacific) is a large mountainous island surrounded by a tropical oligotrophic lagoon. Its eastern coast includes a large variety of physical and chemical environments, like steep mountains, coastal areas influenced by strong erosion on mining extraction sites of lateritic soils, smaller and larger river mouths and mangroves. The health of this large lagoon is of prime importance to local islander for food picking, local fisheries, water renewal and transport, recreation activities. Some zones in the North Eastern coast and Western coast were classified as a World Heritage Site by the UNESCO (David et al., 2010) while anthropogenic activity (mining industry) is high on the Eastern coast. The East Coast plays a major role in freshwater and nutrient outputs due to runoffs into the Southern lagoon and propagating later into the Southwestern lagoon as determined by a coupled physical-biogeochemical model (Fuchs et al., 2013). In order to identify the main factors driving CDOM composition and biogeochemistry in the Eastern Lagoon of New Caledonia (ELNC), three CALedonian Inherent Optical Properties of the East coast (CALIOPE) cruises were conducted during the last decade, allowing one to perform measurements under a wide range of environmental conditions. Tropical storms with strong rain or wind events can negatively alter the lagoons balance by massive inflow of turbid fresh water that may extend even further offshore, beyond the lagoon (Dupouy et al., 2014, 2018; Favareto et al., 2018; Martias et al., 2018).
The objective of the CALIOPE cruises was to identify the origin of CDOM in the coastal waters in and around the ELNC and to examine its relationships to environmental forcing. In particular, what are the major environmental drivers that regulate CDOM dynamics During the three cruises, biogeochemical parameters, ocean color with light absorption and backscattering, and CDOM fluorescence properties of the waters have been characterized during calm and dry (2011), windy (2014), and rainy (2016) conditions. In the present paper, we describe the variability of biogeochemistry, optical properties, phytoplankton composition and pigments, and CDOM fluorophores from the set of these three CALIOPE cruises and examine this variability as a function of season, and in relation to the contrasted meteorological conditions and environmental parameters experienced during the three cruises.
Materials and Methods
Study Area
The Grande Terre of New Caledonia is a large mountainous island (16,372 km2). Its Eastern coast includes steep mountains, coastal areas influenced by mining extraction of lateritic lands, and small and large river mouths, with Mont Panié (South of the Ouaième river) as the highest point (over 1,500 m) in the northern part (Figure 1). Two thirds of the area (from Yate to Canala, Southern and Midlle zones, transects 1–8) is composed of weathered ultramafic rocks, mainly peridotites, forming Ni-lateritic and saprolitic horizons (Chevillotte et al., 2006) enriched in transition metals, such as nickel, chromium, cobalt, and manganese (Trescases, 1975), extracted in about thirty large, active open-pit mines in the Middle Zone (mining centers, Figure 1). Vegetation cover is formed in majority by mining scrub (transects 1–9) (Bonvallot et al., 2013). Volcano sedimentary basement from granitic land at Houailou and metamorphic land extend from Poindimié to Hienghene covered with a mix of dense humid forests in highs and savannahs on the coast North of Houailou (Northern Zone, transects 10–12). Four major estuaries form at the rivers Yate, Thio, Houailou, and Hienghene (Figure 1) with fringing mangroves, restricted to estuarine river mouths (Canala, Houailou) or to narrow bands exposed to trade winds (Yate, Hienghene, Ponerihouen). River flows can suddenly increase after rain. The adjacent seafloor around the river mouths is dominated by terrigenous sediments, mainly silt and clay, but further out, toward the barrier reefs, by calcareous coralline sediments (Bonvallot et al., 2013). Surface water in the ELNC is a mixture of riverine water, depending on the rain intensity, and oceanic water arriving through passes from the warm tropical area at the East (Marchesiello et al., 2010). The ELNC is relatively deep (40–60 m) compared to the Western lagoon. While the barrier reef is well emerged and close to land at the Western coast, the ELNC is delimited by submerged and discontinuous coral reefs at a distance of more than 20 km from the coast.
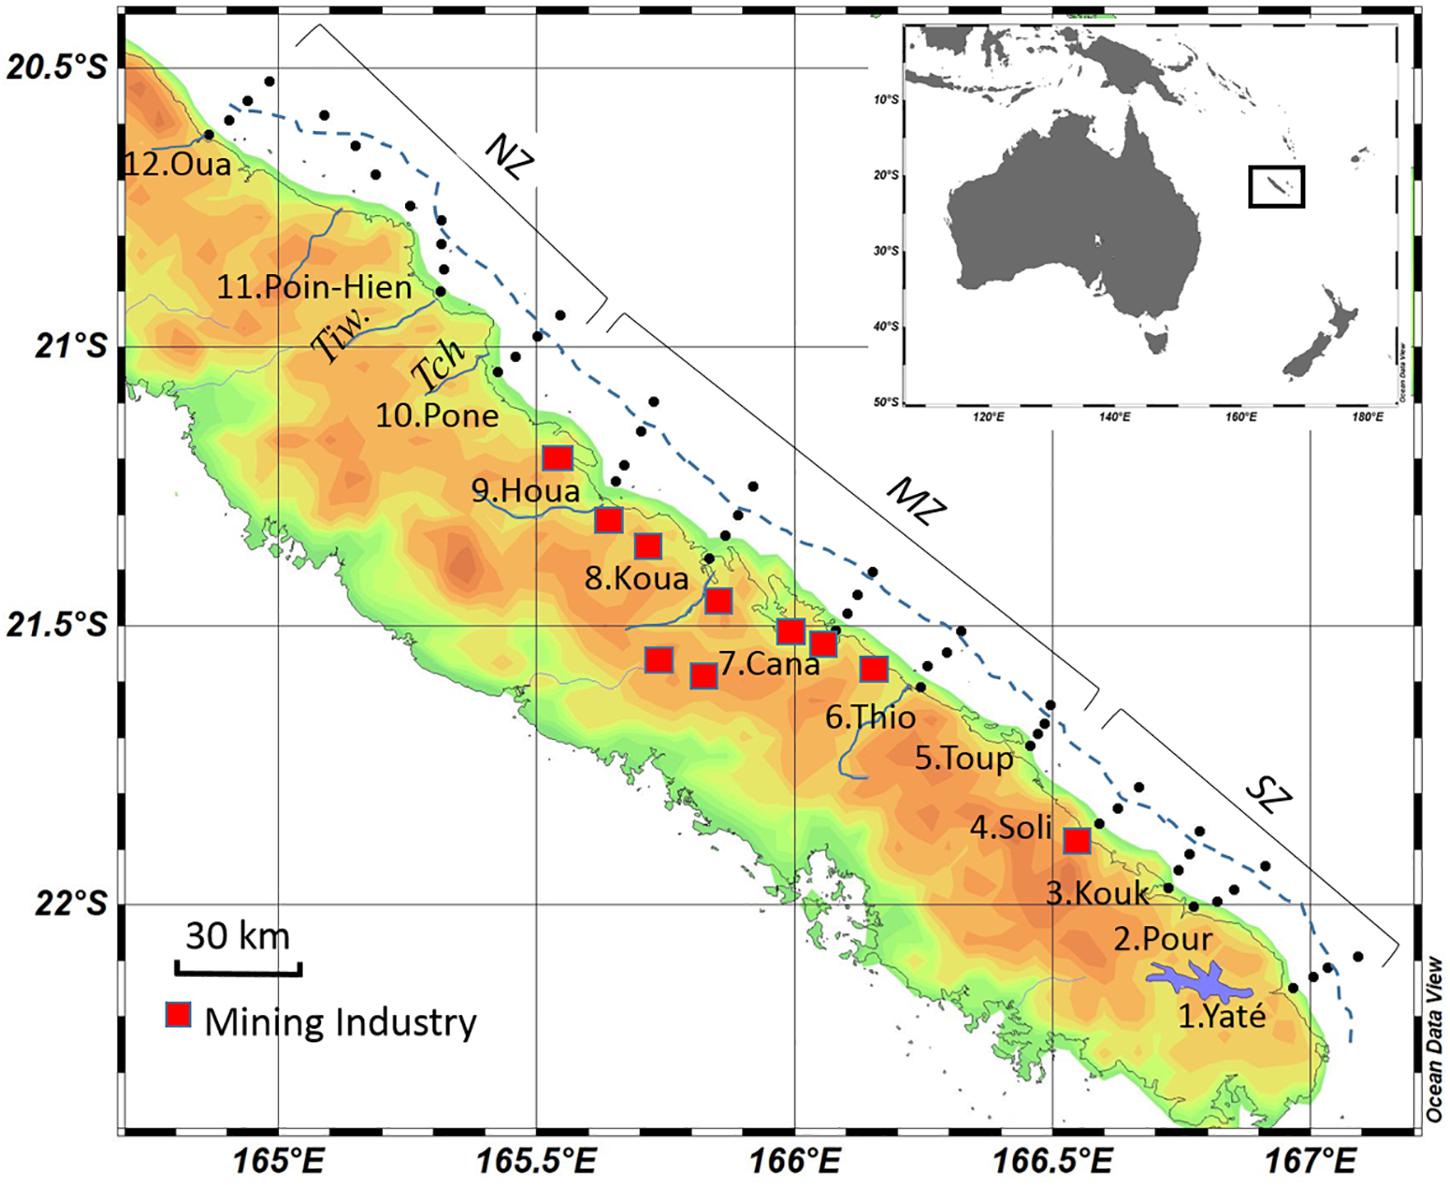
Figure 1. Map of the CALIOPE cruises indicating the immerged barrier reef (blue line) and transects number, along the cruise track. For clarity, three zones were defined the Southern zone, the Middle zone, and the Northern zone (Table 1). Transects are indicated, and the name of the town at each transect. Twelve transects were performed. Rivers and villages associated for each transect are: (1) Yaté, (2) Pourina, (3) Kouakoue (4) Solitaire, (5) Toupeti, (6) Thio, (7) Canala, (8) Kouaoua (9) Houailou, (10) Ponerihouen (11) Poindimié to Hienghène, (12) Ouaieme. The off-shore station of each transect is situated outside of the barrier reef (see Table 1).
The climate of New Caledonia is semi-tropical, characterized by a warm rainy season and a cooler season (warm and humid conditions are centered around March) and modified by southeasterly trade winds and cyclones, which occur most frequently between November and March (wet meteorological regimes; Lefèvre et al., 2010). The Northeastern coast of the island receives the most rain, with peaks during the summer months (November to March, with violent episodic tropical storms creating high river runoffs). As a consequence, total solar irradiance is higher in winter (October) and minimum in Nov-March (French National Meteorological center). The mean annual temperature drops from 27.5 in summer to 24.3°C in winter.
Sampling and in situ Measurements
The CALIOPE cruises were conducted from 4 to 12 October 2011 (CAL1, doi: 10.17600/11100090), 8 to 20 March 2014 (CAL2, doi: 10.17600/14003900), and 9 to 20 March 2016 (CAL3, doi: 10.17600/16003400). A total of 51 stations were made during a total cruise period of 8–12 and 11 days, with two transects of 8 stations achieved per day (Figure 1): transects 1–4 (Southern Zone, SZ), transect 5–9 (Middle Zone, MZ), and transect 10–12 (Northern Zone, NZ). The stations covered about two degrees of latitude (22.30°S at the Southern tip of the ELNC to 20.50°S at its Northern tip). All transects were carried out from the coast to the open ocean through passages in the Barrier Reef (Figure 1 and Table 1). Stations were equally distant from coast to ocean (4 stations per transect), except transect 11, which crossed the deep Hienghène lagoon to Poindimié (Supplementary Figure S1). Water depth in bays and coasts (<10 m) contrasted with that of deep waters off the barrier reef (depth >100 m). Sampling time elapsed from 6 to 18 h. Tide conditions were highly variable, which can influence water properties at the coral reef barrier (the third and fourth station of each transect). In March 2016 during CAL3, the SZ and NZ were sampled successively, and MZ was sampled later, at the end of the cruise. Meteorological conditions were very different during the three cruises. Mean air temperature was 22°C in October 2011, and 26°C in March 2014 and 2016, respectively (Meteorologie Nationale, Thio, transect 6, MZ). Wind intensity also varied from low in October 2011 and March 2016 (<5 m s–1), to high (>10 m s–1) in March 2014 (Table 2). Monthly rain intensity showed a large range, i.e., from 16 mm in October 2011 during CAL1, 26 mm in March 2014 during CAL2 to a high value of 622 mm in March 2016 during CAL3.
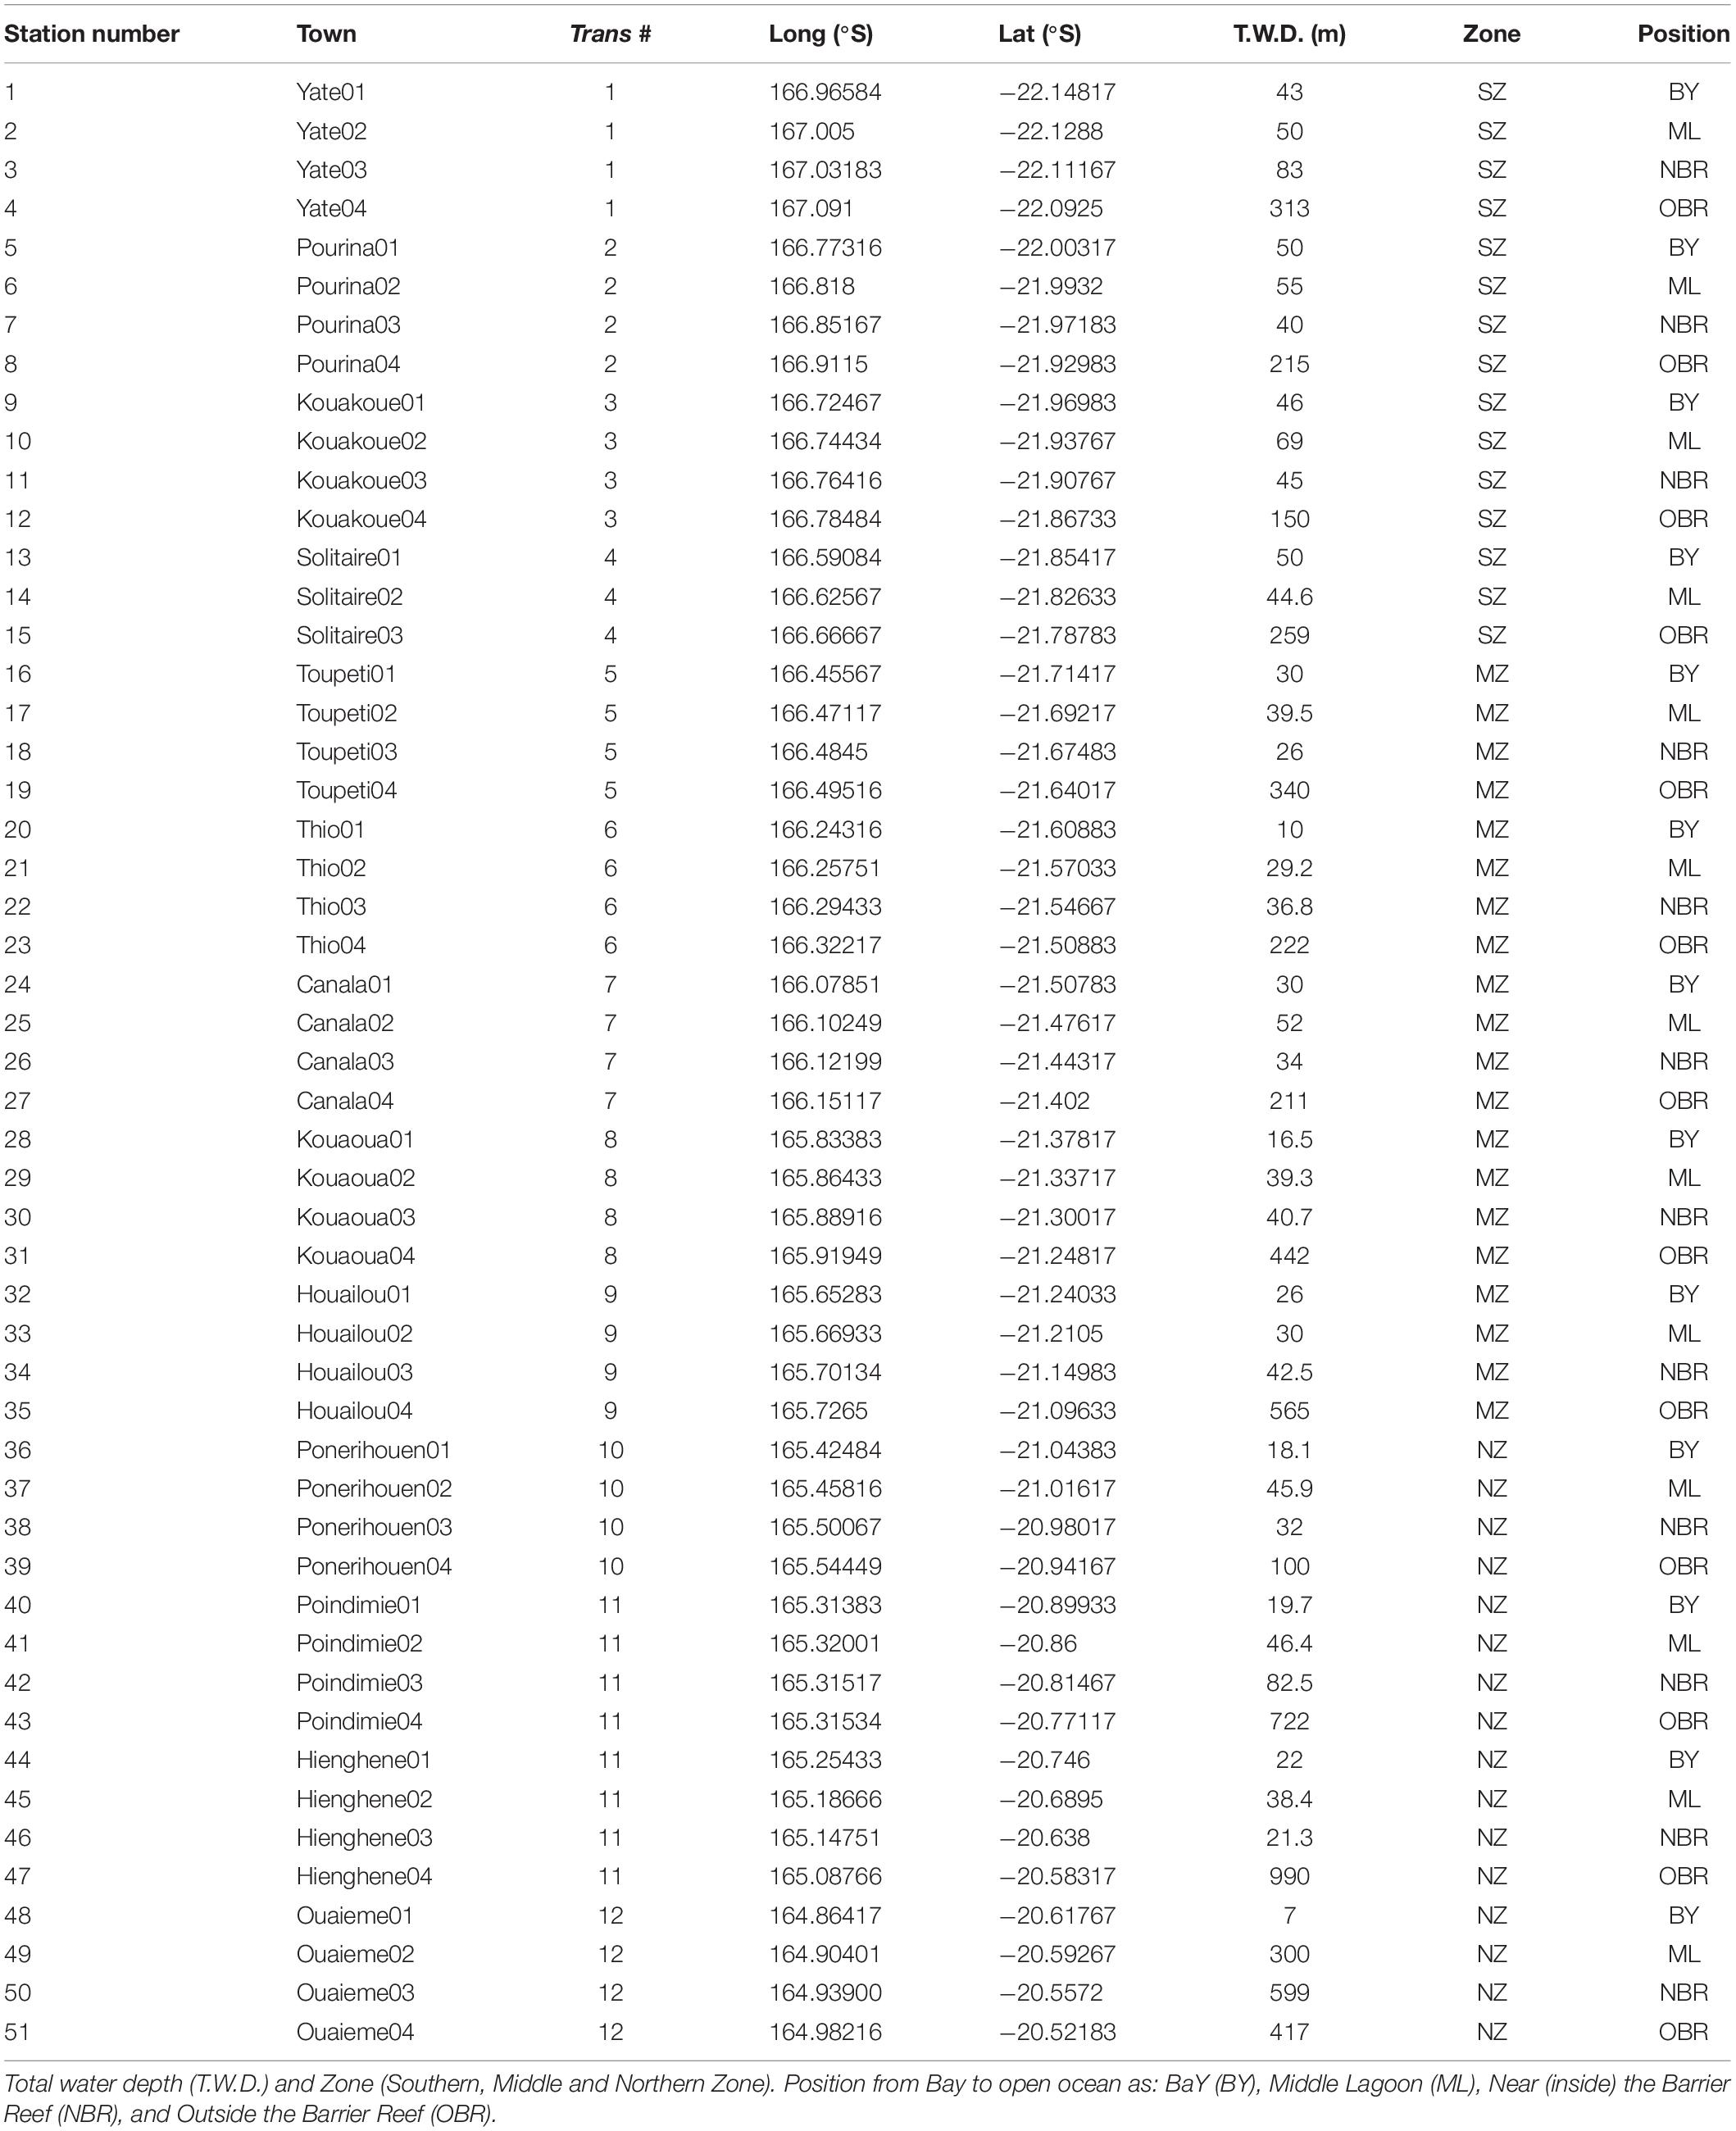
Table 1. Station number “along track” (see Supplementary Figure S1) and Town name, transect number, longitude and latitude.
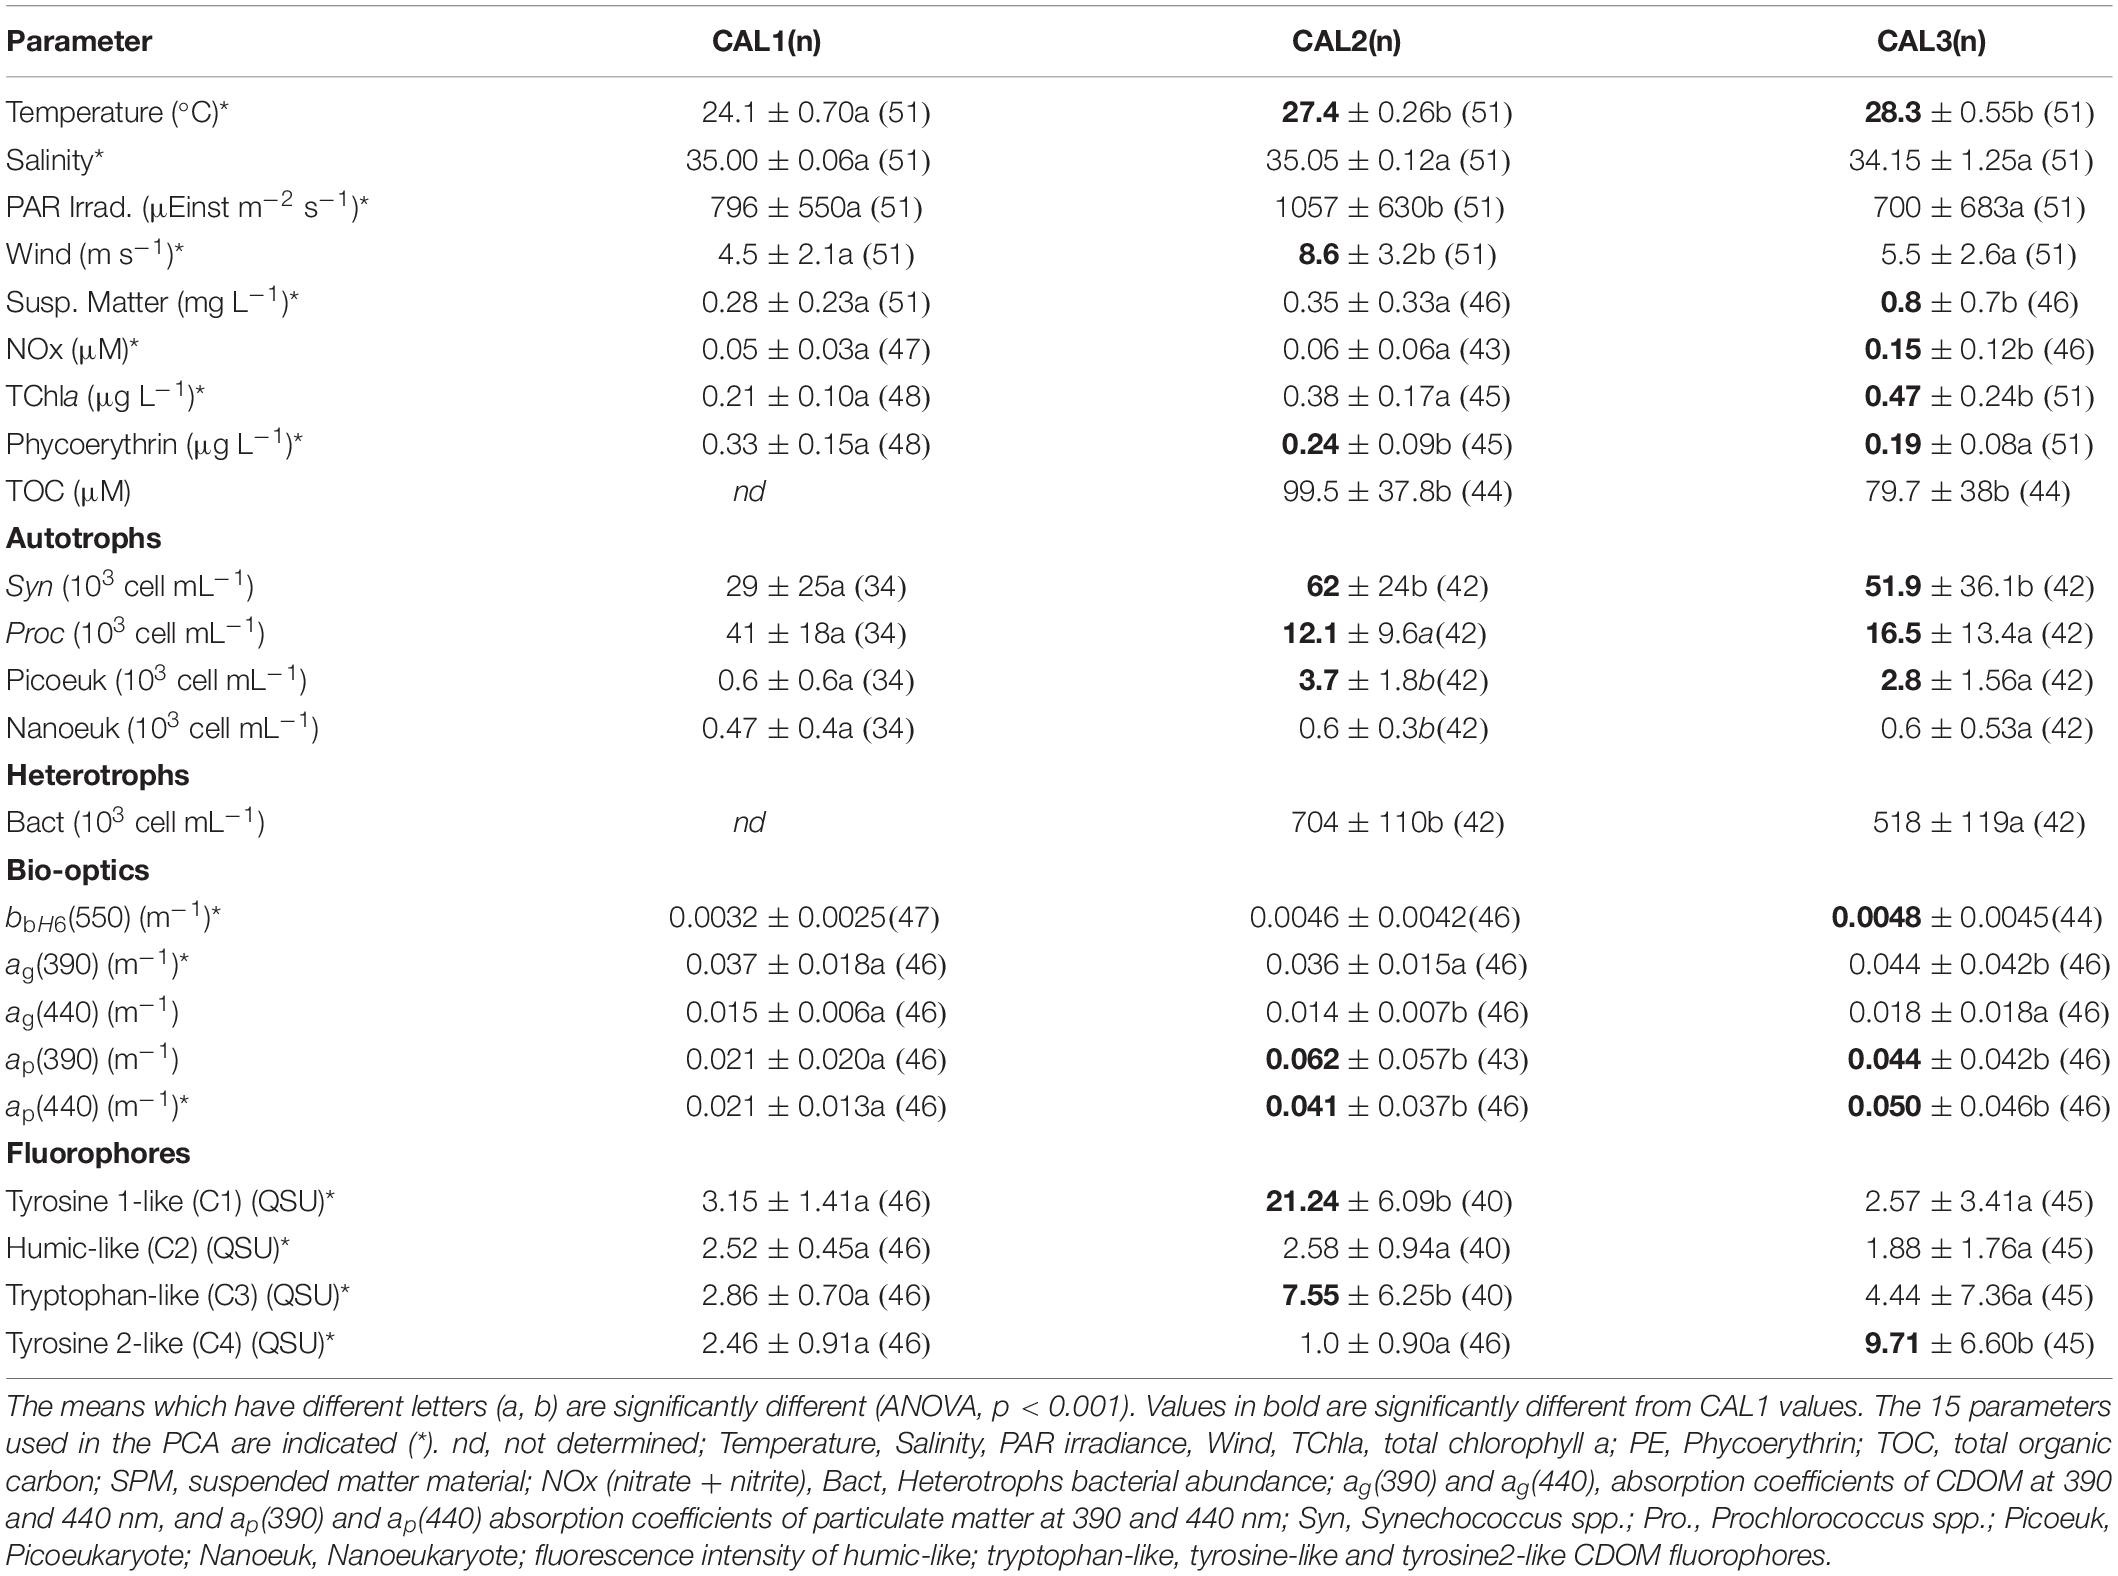
Table 2. Mean values and associated standard deviations of chromophoric dissolved organic material, environmental and biogeochemical parameters of samples collected for the 3 CALIOPE cruises (n max = 51).
Discrete water samples from 2-m depth were collected at each station using a CTD/rosette equipped with twelve 5-L Niskin bottles. Temperature and salinity profiles were measured, using a SeaBird 911 CTD, from the surface to 2 m above the bottom. The CTD/rosette was kept for 3 min at the water surface for sensor stabilization before starting the downcast. Salinity and temperature averaged over the first 0.5 m of depth were extracted from the profile after a careful elimination of outliers. Photosynthetically Available Radiation (PAR) in the water column (in μEinst m–2 s–1) was measured with a LI-COR Biospherical PAR Sensor. The backscattering coefficient, bb(λ), was measured 10 min after the return of the CTD in a separate cast with a Hydroscat–6 profiler (H6: HobiLabs, wavebands centered at 440, 488, 510, 550, 620, and 670 nm with a bandwidth of 10 nm for 440 to 550 nm bands, and 20 nm for the 620 and 670 nm bands), and data processed using the manufacturer’s protocol as in Dupouy et al. (2010). Calibration of the instrument was done 1 month prior to the cruises. The σ-correction was applied with a constant (0.015) backscattering ratio. In total, the σ-correction increases the backscattering coefficient in the blue channel (440 nm) by 2%, and less than 2% in other channels for the range of total chlorophyll a (TChla) measured in the oligotrophic lagoon and adjacent waters (maximum value of 1 μg L–1). This correction was applied to all data, but may be less appropriate in enclosed bays where TChla is above 1 μg L–1. Possible errors in the σ-correction of absorption loss at the blue wavelengths may persist for the most absorbing waters (Dupouy et al., 2010). In order to interpret the laboratory-analyzed parameters obtained from the first Niskin sample, data processing included an averaging of measurements along the profile of the 1–5 m layer for the CTD (temperature, salinity, PAR) parameters and the Hydroscat-6 data. Hyperspectral remote sensing reflectance [Rrs(λ)] spectra were derived from measurements by a TriOS system mounted in a surface frame of upwelling radiance, Lu(0–,λ) (FOV = 7°), and downwelling irradiance, Ed(0+,λ), at λ = 320 to 950 nm with Δλ∼10 nm (sampled by every 3.3 nm). Above surface Rrs was calculated as described in Dupouy et al. (2010); Murakami and Dupouy (2013), and Favareto et al. (2018).
Collection and Filtration of Water Samples
Water samples for CDOM fluorescence and absorption were immediately filtered onboard under low vacuum pressure through 0.22-μm Millipore GSWP filters in acid-cleaned Nalgene filtration units. Between each sampling operation, the whole filtration system was cleaned by filtering Milli-Q water. The filtrates were stored in pre-combusted (450°C, 6 h) 250-mL Schott glass bottles and kept in the dark at 4°C. Unfiltered samples for total (particulate + dissolved) light absorption measurements with a Point-Source Integrating-Cavity Absorption Meter (PSICAM) were stored in 250-mL Schott glass bottles for immediate analysis, while absorption by CDOM was measured later at the end of the day with the same instrument. Forty milliliters of unfiltered water was immediately mixed with 20 μL of mercury chloride and kept in the dark at 4°C for NOx (nitrate + nitrite) analyses. For TChla, 250 mL of water were filtered on 25-mm GF/F filters, immediately kept at −20°C and later at −80°C. For phycoerythrin (PE), the pigment of cyanobacteria (Lantoine and Neveux, 1997), a volume of 2–3 L was filtered onto a 47-mm GF/F filter and kept at −20°C then at −80°C before analysis. Samples for flow cytometry were prepared from 1.8 mL of water fixed with 200 μL of paraformaldehyde (4% final concentration). After a reaction time of 15 min at ambient temperature, samples were frozen and first stored at −169°C in liquid N2 and later at −80°C until analysis. For HPLC analysis of Chla and divinyl-Chla, 2 to 4 L of water were filtered on 25-mm GF/F filters in duplicate, immediately kept at −20°C and later at −80°C during 3 months. The TChla value is therefore an average of two surface samples at the same station and the sum of Chla and DV-Chla. For suspended particulate matter (SPM), water (2.25 L) was filtered onto pre-weighted, 47-mm Nuclepore filters (pore size 0.45 μm), rinsed with ammonium formiate to eliminate salt crystals (20 mL, 1.08 mM), and dried in an oven at 60°C on board.
Analytical Methods
Biogeochemical Parameters and Phytoplankton Counts
Suspended particulate matter concentration (mg L–1) was obtained from measurements (in triplicate) of total particle dry weight as the difference between the filter weight before and after sample filtration, normalized to the filtration volume. NOx, the sum of nitrate + nitrite were analyzed by colorimetry on an auto-analyzer with continuous flux (AA3 Bran + Luebbe autoanalyser) (Raimbault et al., 1999). Chlorophylls and accessory pigments were analyzed by HPLC at the NASA laboratory according to NASA protocols (Van Heukelem and Thomas, 2001; Hooker et al., 2005). Accessory pigments from HPLC analyses, i.e., DV-Chla, the marker pigment of Prochlorococcus, and Chlorophyll C1 + 2, and C3, fucoxanthin, 19′hexa-fucoxanthin, 19′ but-fucoxanthin, alloxanthin and peridinin, were used to calculate the size of phytoplankton communities with the Ras et al. (2008) equations. The sum of MV-Chla and DV-Chla, i.e., TChla (μg L–1), was considered here as total phytoplankton biomass. PE concentration was measured by visible spectrofluorimetry with the methodology by Lantoine and Neveux (1997). Phytoplankton counts were obtained by flow cytometry and allowed to distinguish Synechococcus, Prochlorococcus, nanoeucaryotes and picoeucaryotes, and the presence of nitrogen-fixing cyanobacteria Crocosphaera.
Absorption Measurements
The total absorption coefficient of dissolved and particulate chromophoric material [atot(λ)] was measured on board in triplicate using the PSICAM, with highly purified water as reference (Röttgers et al., 2014). The spectral absorption by CDOM [ag(λ)] was obtained from measurements of the 0.22-μm filtered seawater samples as in Röttgers and Doerffer (2007). The spectral absorption coefficient of particulate matter [ap(λ)] was then determined by subtracting ag(λ) from atot(λ) as described in Tedetti et al. (2016). The mean spectrum of the respective absorption coefficients was used in the analysis. The calibration of the PSICAM consisted in determining the total cavity reflectivity spectrum from solutions of the dye nigrosine (Certistain®, Merck) with maximum absorption coefficient between 1 and 3 m–1. Absorption spectra were corrected for salinity and temperature differences between sample and reference water according to Röttgers and Doerffer (2007). The mean precision of the PSICAM within the range 370–700 nm is ±0.0008 m–1, whereas its uncertainty here is ±5%, even for absorption values <0.1 m–1. Here, CDOM absorption at 440 nm was used as a proxy of phytoplankton production and the CDOM absorption at 390 nm as an indicator of terrestrial inputs. Spectral slope of ag(λ), Sg (in nm–1), was computed by applying a non-linear (exponential), least-squares fit to the ag(λ) values between 370 and 500 nm as in Tedetti et al. (2016). The average correlation coefficient (r)of the exponential least-squares fits was 0.99 (n = 131).
CDOM Fluorescence
Chromophoric or colored DOM fluorescence measurements were carried out using a Hitachi F-7000 spectrofluorometer. Excitation-emission matrices (EEMs) were generated over excitation wavelength λEx between 200 and 550 nm in 5 nm intervals, and emission wavelength λEm between 280 and 600 nm in 2 nm intervals, with 5 nm slit widths on both Ex and Em sides, a scan speed of 1200 nm min–1, a time response of 0.5 s, and a PMT voltage of 700 V. Blanks (ultrapure water) and solutions of quinine sulfate dihydrate (Fluka, purum for fluorescence) in 0.05 M H2SO4 from 0.5 to 50 μg L–1 were run with each set of samples (Tedetti et al., 2016; Ferretto et al., 2017; Martias et al., 2018).
According to the low absorption coefficients measured here, samples were not corrected for inner filtering effects (Tedetti et al., 2016; Martias et al., 2018). EEMs were normalized to the water Raman scattering peak, blank-corrected by subtracting the pure water EEM, and converted into quinine sulfate units (QSU), where 1 QSU corresponds to the fluorescence of 1 μg L–1 quinine sulfate in 0.05 M H2SO4 at λEx/λEm of 350/450 nm. In this work, we used the parallel factor analysis (PARAFAC) model created and validated by Martias et al. (2018) for the 150 EEM surface marine samples (∼50 × 3: CAL1–3).
Data Processing
All data were compiled in a database. In order to better understand the factors driving FDOM in the Eastern lagoon, we selected 15 variables (indicated by asterisks in Table 2, see further), i.e., the fluorophores contributions, the main meteorological parameters, and the main biogeochemical ones resulting from the 50 stations, and from the three cruises (151 points). This data set was analyzed with the R package (Ihaka and Gentleman, 1996), R studio version 3.5.3, and with the packages «ggplot2» and «factomineR» for the principal component analysis (PCA) analysis.
Results
For each cruise, average and variability of the different parameters were calculated from data of all stations (Table 2). Additionally, all stations were divided into four categories according to their distance to the coast (stations in BaYs: BY; stations of Middle Lagoon: ML; stations Near the Barrier Reef: NBR; Oceanic stations beyond the Barrier Reef: “OBR”). For each category and for each cruise, October 2011 (CAL1), March 2014 (CAL2), and March 2016 (CAL3), average and variability of each parameter (n = 12) were represented as boxplots (Figures 2–5).
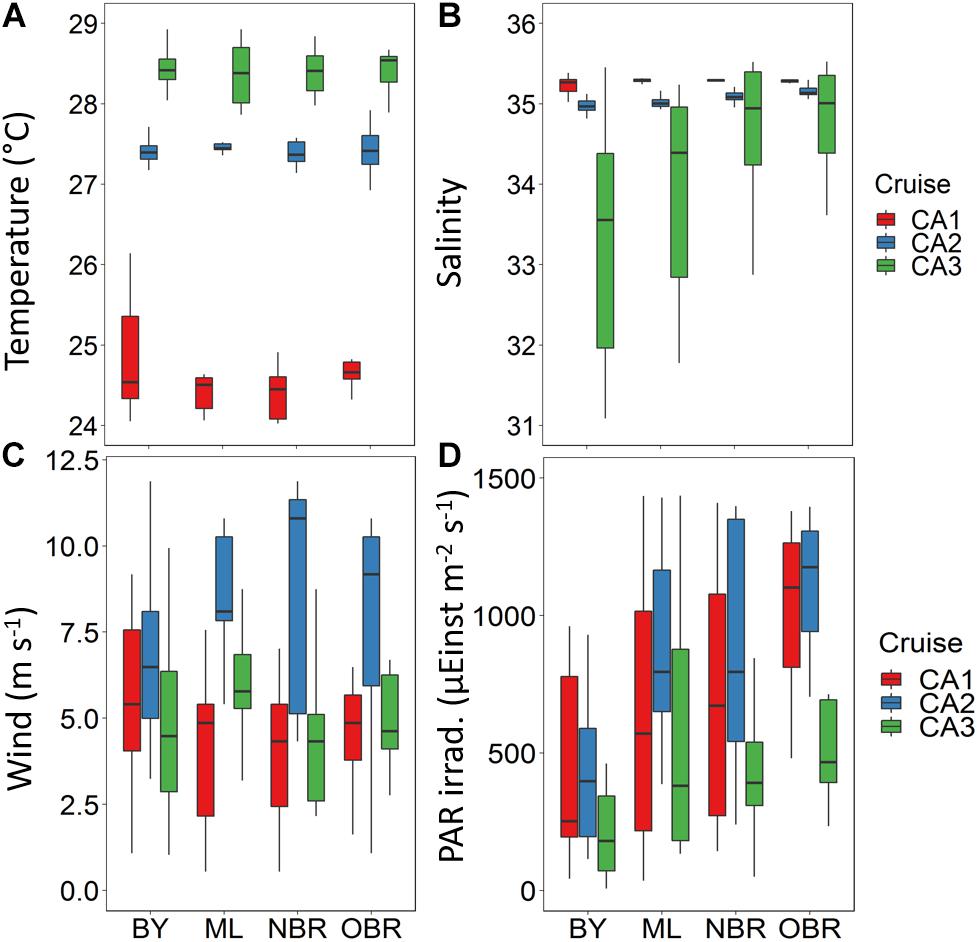
Figure 2. Boxplots showing average and variation outside the upper and lower quartiles of (A) temperature, (B) salinity, (C) wind, and (D) PAR irradiance versus the position of the station along the transect (from the coast (“bay, BY,” “middle lagoon, ML,” “near (inside) the barrier reef, NBR,” and “outside of the barrier reef, OBR”), and for the three CAL cruises (CAL1 in red, CAL2 in blue, CAL3 in green). Water temperature (°C) and salinity, from the Seabird CTD, PAR irradiance (μEinst m–2 s–1) from the Biospherical, and wind force (ms–1) from the R/V Alis meteorological acquisition station.
Physical Features
As expected, lagoon average water temperatures in October (CAL1: 24.1°C, austral winter) were lower than in March (CAL2: 27.4°C and CAL3: 28.3°C, austral summer) (Figure 2A). Bays were slightly cooler in winter, and temperature was quite constant along transects in summer. Lagoon water salinities were maximal in October (CAL1: 35.3) (Figure 2B) and exceptionally low in March 2016 (CAL3: <31) and more variable in bays more influenced by river runoff. At offshore stations, salinity was higher and relatively similar to that measured at the other cruises (Figure 2B). Lagoon wind intensities were the highest in March 2014 (CAL2: 8 m s–1), with the BY, ML, and OBR stations more impacted by wind (Figure 2C). Winds were weaker in October and March 2016 (CAL1 and CAL3: 5 m s–1). In general, during all cruises, wind was higher and more variable near the coast (in BY) and lower at the NBR stations. Lagoon winds were mostly Southeast trades with directions being more from the East in October (CAL1: 128°) and more from the Southeast in March (CAL2: 143° and CAL3: 145°) (Table 2). Along the transect and due to the orientation of the main land, wind direction varied slightly from the Southeast in the offshore to middle lagoon region (OBR, ML, and ML), to more from the South at the coast (BY). Surface PAR irradiance (Figure 2D) varied from less than 200 to more than 1000 μEinst m–2 s–1 along tracks due to sampling at various times during the day (i.e., Sun zenith angles) and variable cloud cover. Average lagoon surface PAR irradiance was high in October and near the coast (CAL1: 760 μEinst m–2 s–1), and March 2014 (CAL2: 1008 μEinst m–2 s–1). It was the lowest due to dense rain clouds in March 2016 (CAL3: <500 μEinst m–2 s–1) (Table 2). For the two March cruises, surface PAR irradiance was lower near the coast (BY) than in the open ocean (OBR stations), which is typical of tropical islands where clouds grow in intensity and volume above land by convection (Lefèvre et al., 2010), but this was less pronounced during the dry October season (Figure 2D). In summary, the October 2011, March 2014, and March 2016 cruises were representative of dry with moderate wind, windy and sunny, and calm and rainy conditions, respectively.
Biogeochemical Parameters
Average SPM and TChla showed (1) minimal concentrations during the dry period in October and (2) more or less pronounced decreasing gradients toward the ocean in October (calm), and March 2014 (wind) indicating the influence of allochtonous sources in the lagoon, i.e., river runoff, coastal erosion, or bottom re-suspension more efficient in bays (Figures 3A,C). These gradients were less clear in March 2016 (rain), with highest values at the barrier reef. SPM was maximal during the rainy March 2016 period (CAL3: 0.80 ± 0.7 mg L–1). While higher in the bays, some isolated SPM values >1 mg L–1 could also be observed at the NBR stations in March 2016 (Figure 3A). TChla (minimum at CAL1: 0.21 ± 0.10 μg L–1) was higher in windy March 2014 (0.38 ± 0.17 μg L–1), and rainy March 2016 (CAL3: 0.47 ± 0.24 μg L–1) (Figure 3C). At the inverse, DV-Chla the main pigment of Prochlorococcus was the most abundant in dry conditions (CAL1: 0.037 μg L–1) and the least abundant in the wind and rainy conditions (Table 2). As expected for this oceanic species, the highest values were found offshore (0.032 and 0.026 μg L–1). NOx concentration showed an almost constant value along the transect except maxima in bays during all cruises. It was at its minimum during the windy March 2016 period and quite high during the calm October period, possibly indicative of a different assimilation by phytoplankton (Table 2). It was twice larger during the rainy March 2016 (CAL3: 0.15 ± 0.12 μM) with a small NOx gradient from the BY to the OBR stations, which indicated a generalized impact of rain to the whole lagoon width (Figure 3B). PE was low like TChla in October dry conditions (CAL1: 0.33 μg L–1), but then showed an opposite behavior than TChla with its higher concentration during the windy March 2014 period (CAL2: 0.69 μg L–1) than during the rainy March 2016 one (CAL3: 0.51 μg L–1; Figure 3D).
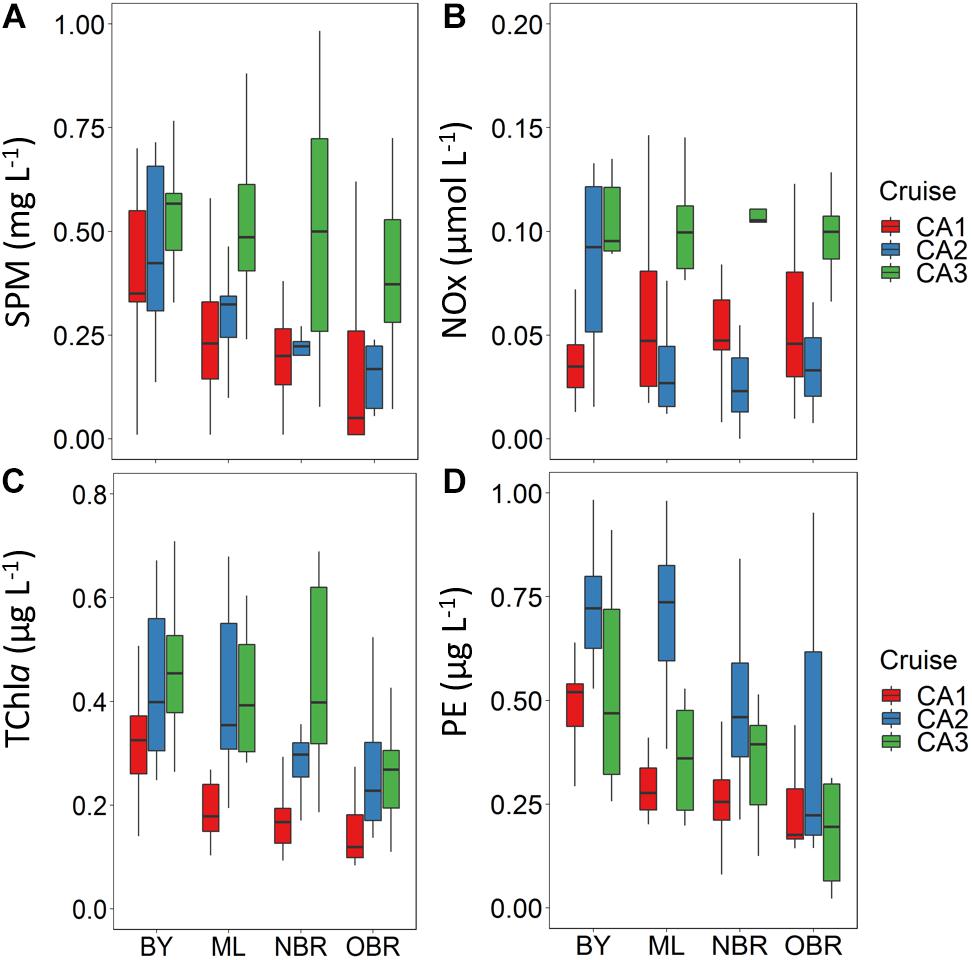
Figure 3. Boxplot showing average and variation outside the upper and lower quartiles of (A) SPM (in mg L–1), (B) nitrate + nitrite (μM), (C) TChla (μg L–1), and (D) phycoerythrin concentration (PE, μg L–1) versus the position of the station along the transect from the coast (“bay, BY,” “middle lagoon, ML,” “near (inside) the barrier reef, NBR,” and “outside of the barrier reef, OBR”), and for the three cruises (CAL1 in red, CAL2 in blue, CAL3 in green).
Microorganisms and Pigment Compositions
Average bacterial abundance was higher in the windy March 2014 period (Table 2 and Figure 4A) than in the rainy one (not measured in October). The abundance of Prochlorococcus increased toward the open ocean, reaching a maximum in more saline offshore waters (following the DV-Chla pattern). Its inter-cruise variability was high with a maximum abundance during the dry October period (CAL1: 41 103 cells mL–1), and lower ones during the windy or rainy summers (12 and 16 103 cells mL–1, respectively; Table 2 and Figure 4B). Synechococcus spp. presented an inverse gradient than Prochlorococcus, being more abundant in bays (up to 75 103 cells mL–1) and middle lagoon waters, but only at CAL1. It also showed high abundance with large variability from the barrier reef (NBR) and in the ocean (OBR) during wind and rain conditions. Synechococcus was the most abundant group in the ELNC during the windy period (Figure 4C), confirming their main pigment PE pattern. Zeaxanthin (not shown), the main photoprotective pigment of cyanobacteria (Synechococcus and Prochlorococcus), increased from the coast to the ocean in relation with a highest cyanobacteria abundance and the increase of PAR (photoprotection) even during the windy and rainy periods. Pheophytin_a and pheophorbide_a, degradation pigments of Chla, were both higher in abundance during the rainy March 2016 period. Nitrogen-fixing Crocosphaera species were observed during the rainy period together with Prochlorococcus cells (Martias et al., 2018) and Trichodesmium slicks were observed at the OBR stations (in March 2016 in Houailou, during a sunny day). Accessory pigments (from HPLC analyses), i.e., Chlorophyll C1 + 2, Chlorophyll C3, fucoxanthin, 19′hexa-fucoxanthin, 19′ but-fucoxanthin, and peridinin, varied as TChla, and indicated a higher abundance of large eukaryotic algae during the rainy period in March 2016 (CAL3). This was confirmed by the calculations from pigment: TChla ratios, with picoeucaryotes being the major component in October oligotrophic state, microphytoplankton largely dominating during the rainy March 2016 period, and nanoeucaryotes showing equivalent (and low, i.e., 50%) proportions during all periods (Figures 5A–C).
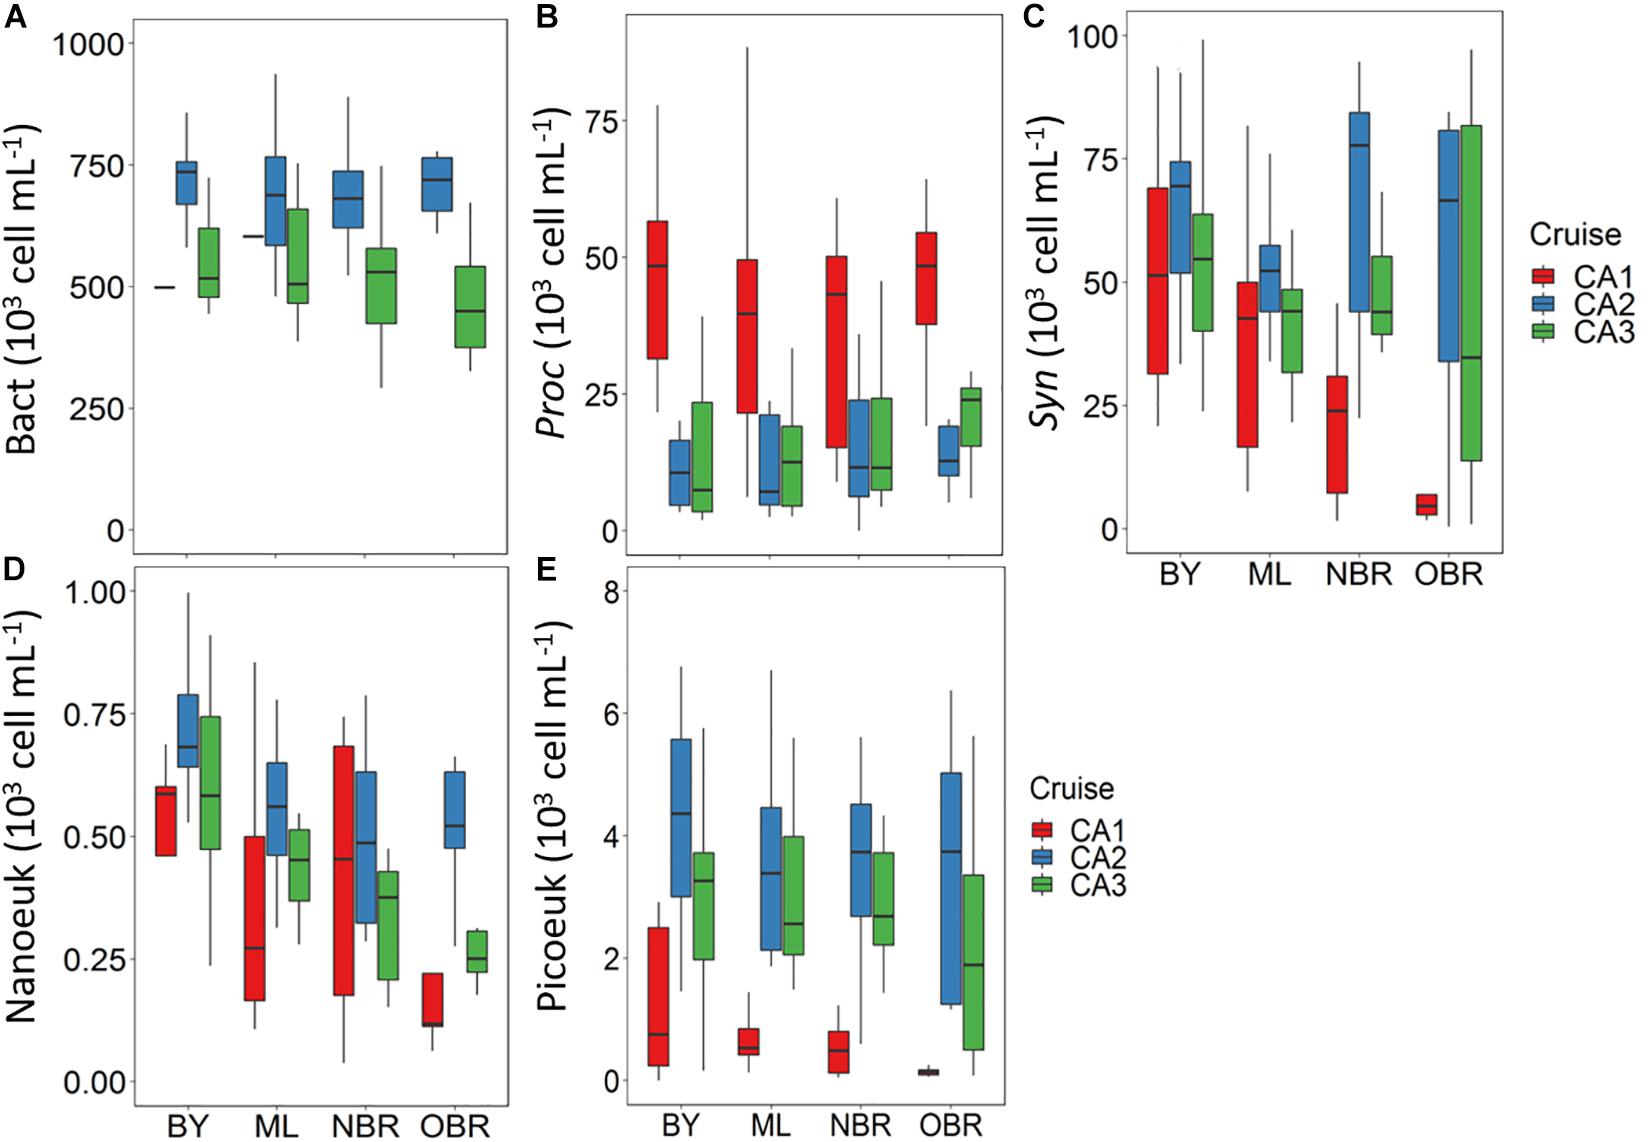
Figure 4. Boxplots showing average and variation outside the upper and lower quartiles of the abundance of (A) heterotrophic bacteria, (B) Prochlorococcus (C) Synechococcus, (D) nanoeukaryotes, and (E) picoeucaryotes, versus the position of the station along the transect from the coast (“bay, BY,” “middle lagoon, ML,” “near (inside) the barrier reef, NBR,” and “outside of the barrier reef, OBR”), and for the three cruises (CAL1 in red, CAL2 in blue, CAL3 in green). Abundance in cells mL–1.
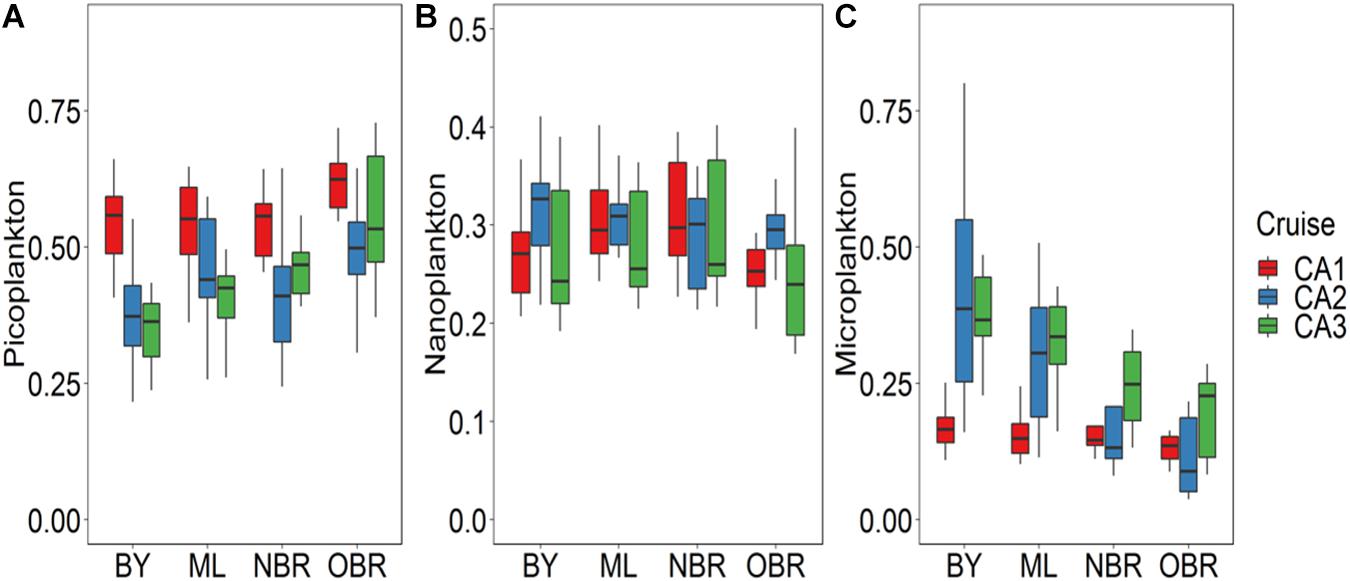
Figure 5. Boxplots showing average and variation outside the upper and lower quartiles of the abundance of (A) picoplankton (B) nanoplankton, and (C) microplankton (% TChla) versus the position of the station along the transect from the coast (“bay, BY,” “middle lagoon, ML,” “near (inside) the barrier reef, NBR,” and “outside of the barrier reef, OBR”), and for the three cruises (CAL1 in red, CAL2 in blue, CAL3 in green).
Absorption by CDOM and Particles and Backscattering by Particles
The average absorption coefficients of CDOM (ag) at 390 and 440 nm (Figures 6A,B), the absorption coefficient of particulate matter (ap) at 440 nm (Figure 6C), and the Hydroscat-6 backscattering coefficient (bbH6) at 550 nm (Figure 6D) showed a general decreasing gradient toward the ocean during all cruises. These coefficients had their minimum values in the October dry period with average values of 0.038 m–1 for ag(390), 0.0224 m–1 for ap(440), and <0.01 m–1 for bbH6(550) (Table 2). ag(390) was not significantly different during the windy March 2014 period (0.036 ± 0.015 m–1) but significantly higher during the rainy March 2016 period (0.044 ± 0.042 m–1). ag(440) was almost similar during strong wind and heavy rain (Table 2). Sg over the range 370–500 nm (0.0143−0.0246 nm–1) tended to increase toward the open ocean (Supplementary Figure S6) at all cruises but presented a stronger variability during rain, and particularly at the barrier reef.
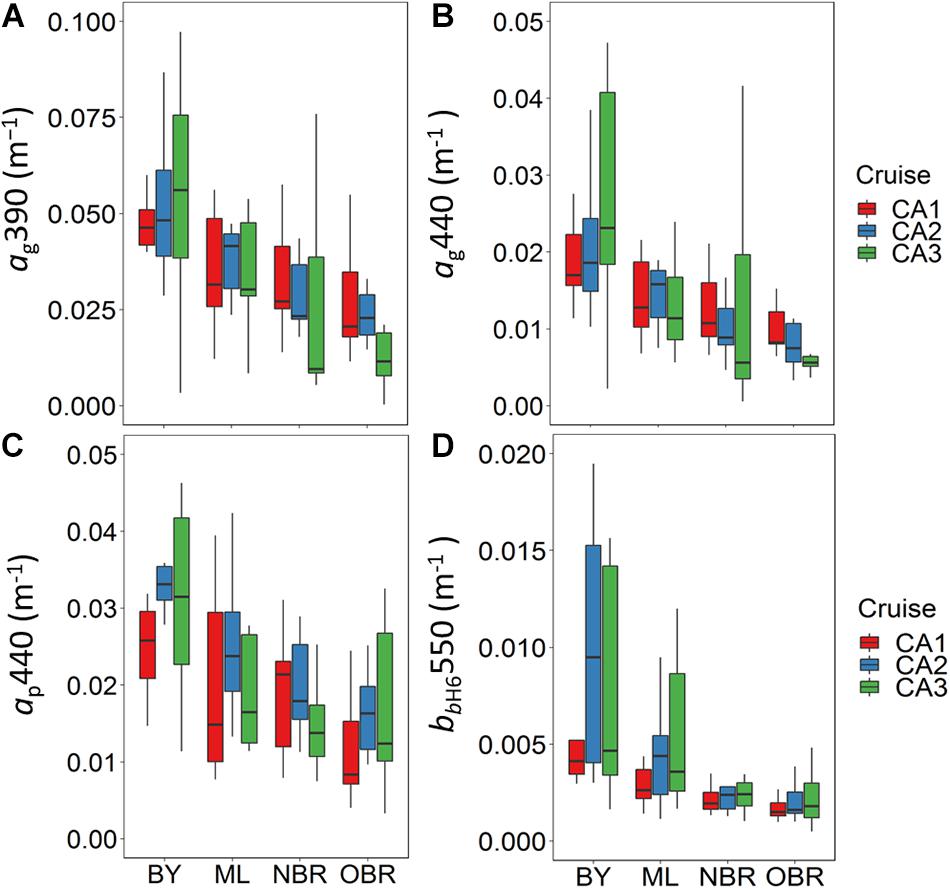
Figure 6. Boxplots showing average and variation outside the upper and lower quartiles of (A,B) CDOM absorption at 390 and 440 nm, (C) particulate absorption coefficient at 440 nm, and (D) backscattering of the H6 (uncorrected) at 550 nm, versus the position of the station along the transect from the coast (“bay, BY,” “middle lagoon, ML,” “near (inside) the barrier reef, NBR,” and “outside of the barrier reef, OBR”), and for the three cruises (CAL1 in red, CAL2 in blue, CAL3 in green). Absorption and backscattering coefficients expressed in m–1.
The particulate absorption, ap(440), showed similar distributions to those of ag(390) with no significant difference during the windy or rainy periods. A high variability of ap(440) concerned bays and the barrier reef stations (with values >0.04 m–1) during the March 2016 rainy period (Figure 6C). Particle backscattering had the lowest value in October dry conditions [average bbH6(550) value of 0.0033 m–1 during CAL1] and was higher in the summer windy or rainy March 2014 or 2016 periods [average bbH6(550) values of 0.0049 and 0.0045 m–1 during CAL2 and CAL3]. These higher values in summer are due to extremely high values of bbH6(550) in BY and ML stations (>0.01 m–1) (Figure 6D). For all cruises, ocean color from reflectance measurements exhibited a classical increasing gradient from Bay to offshore waters in the Eastern lagoon at both wavelengths. This corroborates the finding of a higher transparency of waters offshore, as described for CAL2 in Favareto et al. (2018) (Supplementary Figure S2). Rrs(390) was lower in March 2016 (CAL3) in relation with high CDOM absorption in the UV domain, and Rrs(440) was lower in March 2014 (CAL2) in relation with particulate material, living and non-living (absorption in the blue).
CDOM Fluorescence
Four fluorophores were identified during each CALIOPE cruise in the surface waters, as in Martias et al. (2018): C1 (λEx/λEm: 220, 275/304 nm), namely a tyrosine-like fluorophore, C2 (λEx/λEm: 235/460 nm), a humic-like fluorophore, C3 (λEx/λEm: 230, 300/352 nm), a tryptophan-like fluorophore, and a tyrosine 2-like fluorophore, C4 (λEx/λEm: 245, 275/304 nm). Average fluorescence contributions of all fluorophores ranged from 1 to 35 QSU (Figures 7A–D and Supplementary Figure S3). The fluorescence contributions of the tyrosine-like fluorophore (C1) were rather constant along the transect, and showed significantly higher values (by a factor of 6) in the March 2014 windy period (CAL2) compared with the October dry period or the March 2016 rainy period (ANOVA, n = 153, p < 0.05; Table 2, Figure 7A, and Supplementary Figure S3). The humic-like (C2) fluorescence contributions were low compared to those of other fluorophores (<5 QSU) (Table 2, Figure 7B, and Supplementary Figure S3). This humic-like material always showed a bay-to-offshore decreasing gradient, whatever the cruise/meteorological conditions. Its fluorescence contributions were on average higher during the windy period (CAL2) relative to the rainy period (CAL3) even though maximal fluorescence contributions were always recorded during rainfalls. The spatio-temporal distribution of the tryptophan-like fluorophore (C3) was close to that of C1 fluorophore with higher values (by a factor >3) during the windy period, but no clear pattern was observed from coast to offshore zone (Table 2, Figure 7C, and Supplementary Figure S3). The tyrosine 2-like (C4) exhibited the highest fluorescence contributions in the rainy March 2016 (factor of 8) and intermediate contributions during the October dry period. This fluorophore did not show much gradient from bays to ocean (Table 2, Figure 7D, and Supplementary Figure S3).
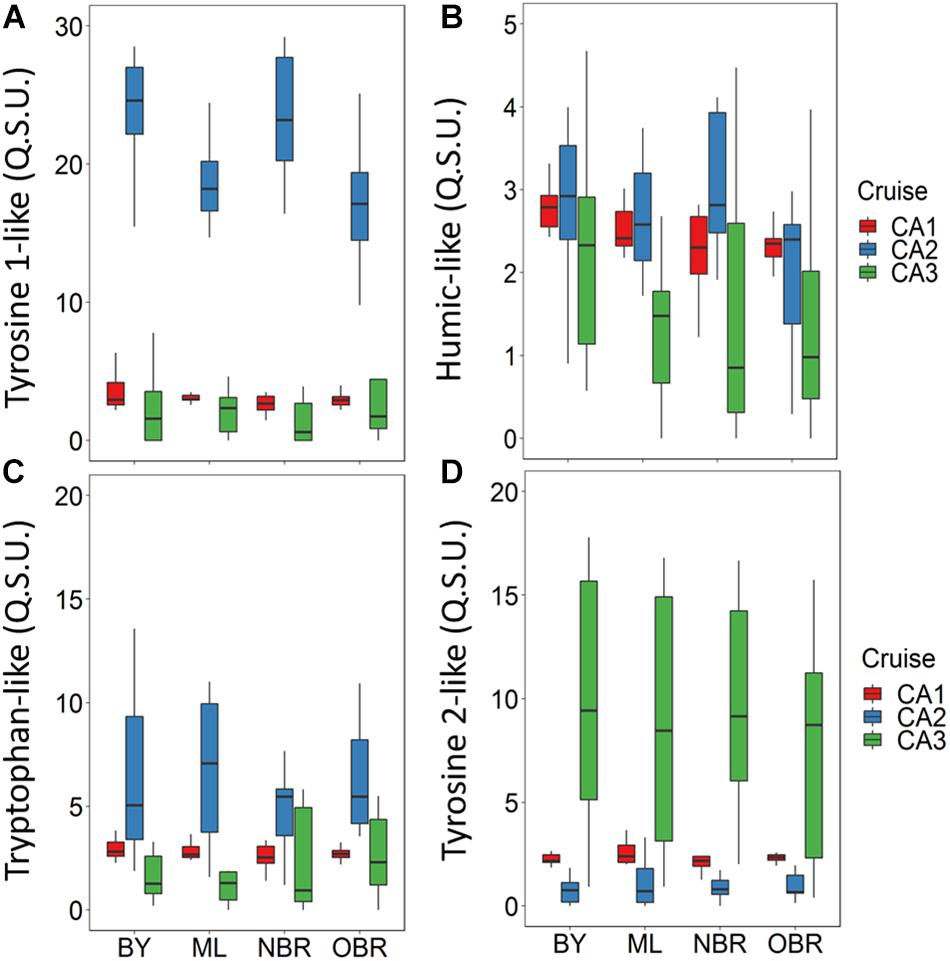
Figure 7. Boxplots showing average and variation outside the upper and lower quartiles of the fluorescence contributions (QSU) of the four CDOM components: (A) humic-like, (B) tyrosine 1-like, (C) tryptophan-like, and (D) tyrosine 2-like fluorophores versus the position of the station along the transect from the coast (“bay, BY,” “middle lagoon, ML,” “near (inside) the barrier reef, NBR,” and “outside of the barrier reef, OBR”), and for the three cruises (CAL1 in red, CAL2 in blue, CAL3 in green). Fluorescence intensity expressed in QSU.
PCA Classification of Samples
Figure 8 shows the PCA results, based on Pearson correlation matrix given in Table 3, applied on the 4 fluorophores and a group of 15 physical and biogeochemical parameters. Axis 1 represented 29% of the total variance, while the second axis represented 15%. Table 3 presents the correlation coefficients (r values) of linear regressions between the chromophoric, physical and biogeochemical parameters for the samples collected during the three cruises (n = 155). Here we consider that only the correlations that are significant (p < 0.05) reflect relevant linear relationships. All biogeochemical parameters, i.e., NOx (r = −0.36), SPM (r = −0.38), ag(390) (r = −0.41), bb(550) (r = −0.46), ap(440) (r = −0.47), PE (r = −0.49) and TChla (r = −0.58) concentrations, were inversely related to salinity (n = 155, p < 0.05), and positively correlated with temperature (a reduced “summer” effect). ag(390) and ap(440) were strongly correlated to each other (r = 0.86, n = 155, p < 0.05) and ag(390) was also strongly correlated with bbH6(550) (r = 0.75, n = 155, p < 0.05), but also with bb(550) (r = 0.74), ap(440) (r = 0.87), PE (r = 0.59) and TChla (r = 0.48) (Table 3). The C2 humic-like fluorophore was positively correlated with ag(390) (r = 0.50, n = 155, p < 0.05) and anti-correlated with water-depth (r = −0.34). Even though the tyrosine (C1) and tryptophan-like (C3) fluorophores were highly correlated (r = 0.55, n = 155, p < 0.0001), they showed an anti-correlation with the tyrosine 2-like (C4) fluorophore (r = −0.48, n = 155, p = 0.005). None of those protein-like fluorophores was correlated with the absorption coefficients (r = 0.09–0.42, n = 155, p > 0.5–0.05) (Table 3). The tyrosine 1-like (C1) fluorophore (and the tryptophan-like to a lesser extent) was significantly correlated with wind intensity (r = 0.38), while the tyrosine 2-like (C4) fluorophore was inversely correlated with wind (r = −0.32). In our study, the tryptophan-like (C3) was only weakly correlated with the humic-like (C2) material. On the correlation circle resulting from the PCA (Figure 8A), the first axis represents the intensity of biogeochemical parameters, i.e., PE, TChla, and SPM reflected by the optical coefficients ap(440), bb(550), ag(390) (and to a lesser extent NOx). The latter are strongly correlated with the first principal component (the arrows closest to the x-axis) (the “Bay” effect). The second (vertical) axis represented the gradient of fluorescence intensity of the tyrosine-like (C1) versus the tyrosine 2-like (C4) fluorophore. In Figure 8B, stations were dispersed along the first (horizontal) axis, with BAY stations on the right, and all other stations (ML, NBR, and OBR) on the left. The four clusters (Figure 8B) identified (K-means classification) correspond to the bay stations (in pink, mainly from CA3), the C1 tyrosine-like rich ones (in gray, mainly from CAL2), the C4 tyrosine 2-like rich ones (in yellow, mainly from CAL3) and in blue a group of stations presenting intermediate values of fluorescence of C1 and C4 and mainly from CAL1.
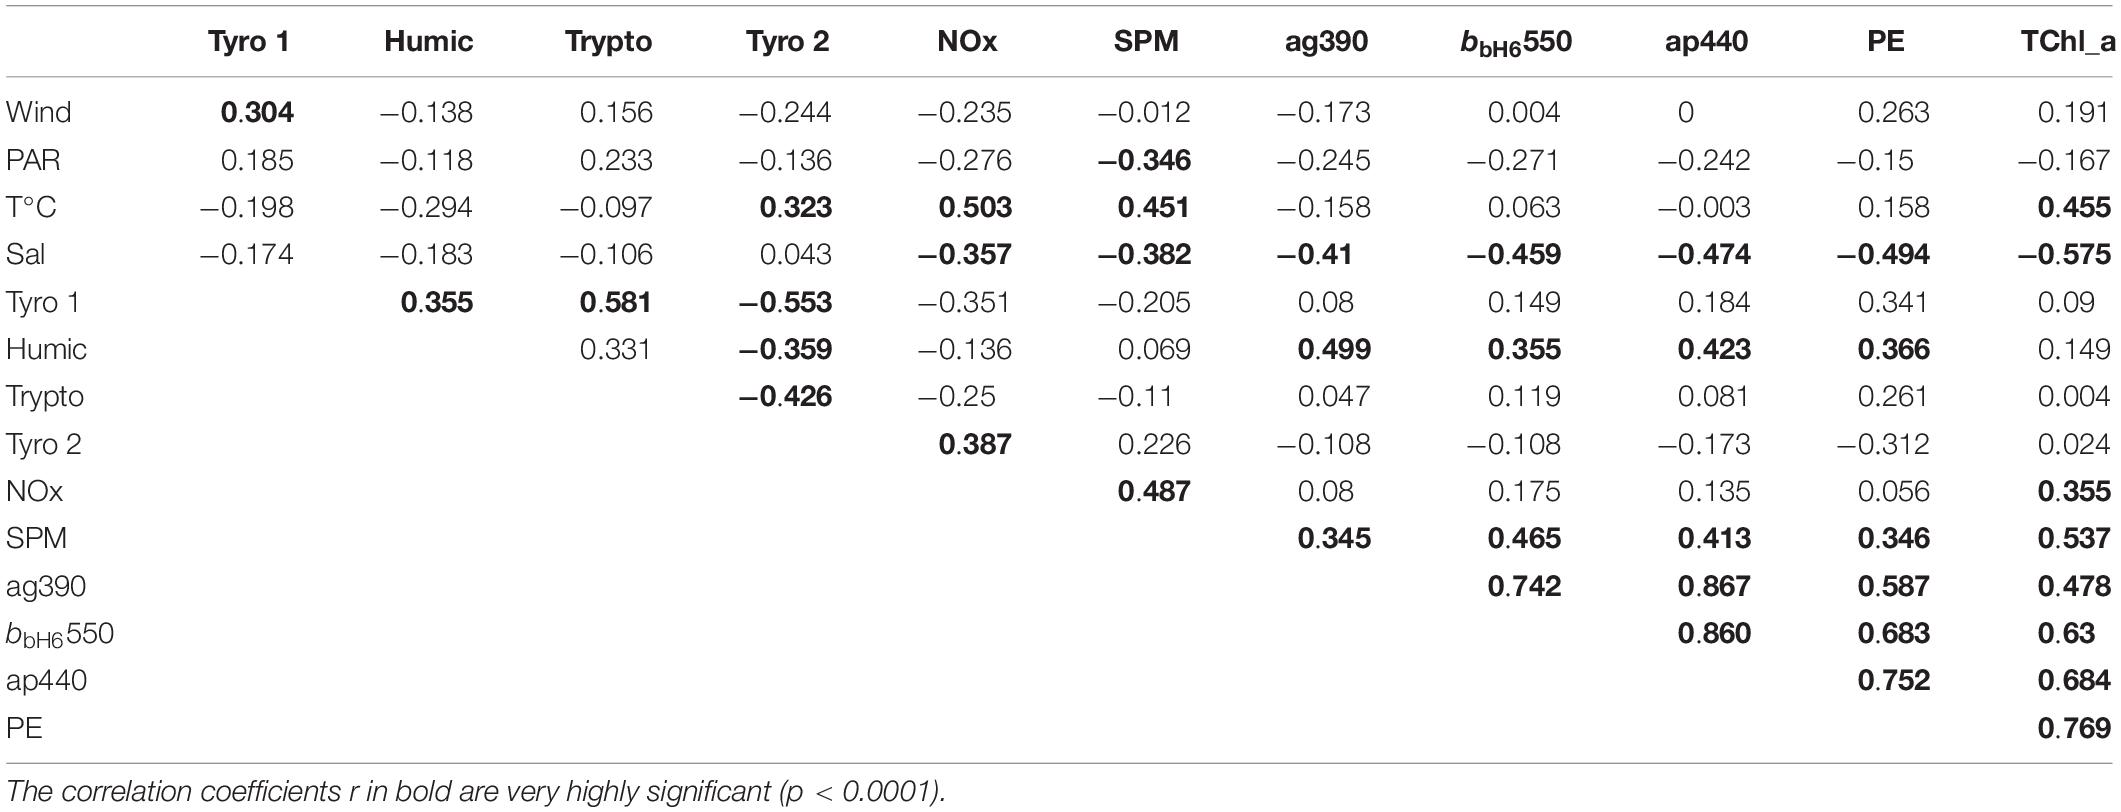
Table 3. Pearson’s correlation coefficient, r, of linear regressions between the chromophoric, biogeochemical and environmental parameters of samples collected during the three cruises (n = 155).
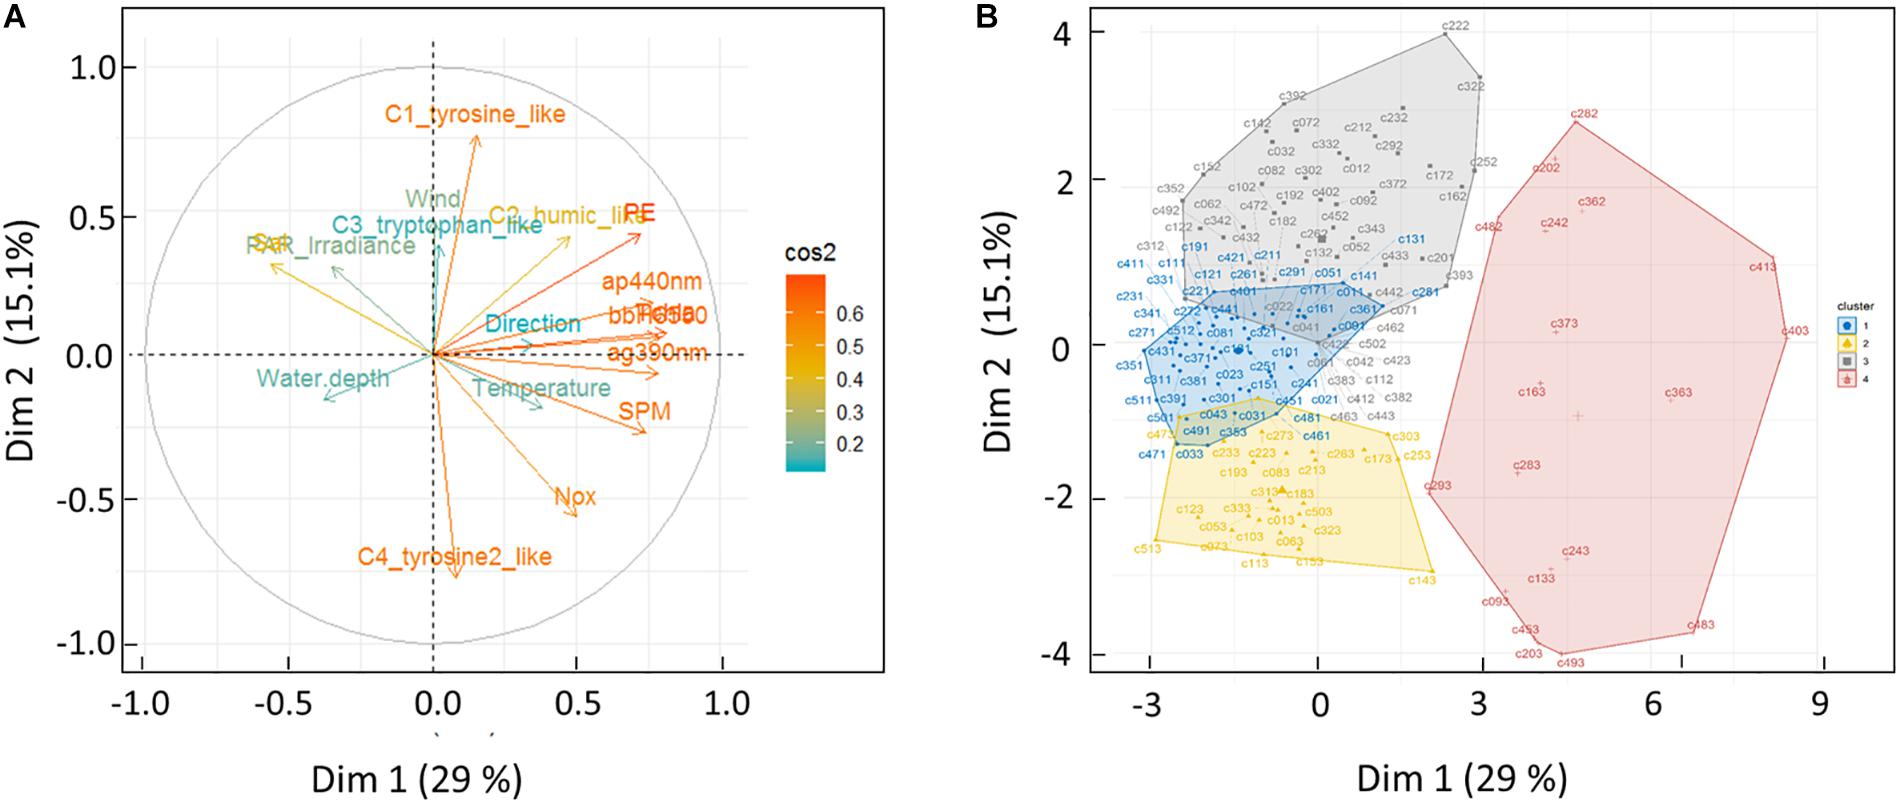
Figure 8. Principal component analysis (PCA): (A) Pearson’s correlation matrices and (B) projection of samples onto PC1 and PC2, computed on CDOM absorption and fluorescence, core biogeochemical and environmental parameters (15 parameters indicated in Table 2). All bay, middle lagoon, near barrier reef, and ocean samples (n = 153) were used for PCA. The first two numbers correspond to the (“1” to “51”) station numbers as labeled map in Supplementary Figure S1, while the third number correspond to the cruise number (“1,” “2,” “3,” for CAL1, CAL2 or CAL3).
Discussion
The CDOM dynamics are regulated by its sources (terrestrial discharge and biological production, here phytoplankton, coral reefs) and transformation processes (microbial and photochemical degradations), though the transport processes include water mass transport and exchange (D’Sa and Kim, 2017). In the following, we will examine how the variation in weather conditions directly and indirectly influence the CDOM fluorophore dynamics through influence of environmental parameters. Basically, rainy period would increase the CDOM fluorescence intensity and also its discharge flux, as shown by Martias et al. (2018) for CAL3. Here we complete these findings from the data acquired during the two other cruises (CAL1, CAL2, i.e., calm, wind) off the Eastern coast.
Trophic Status of the ELNC
The CALIOPE cruises allowed for the first time one to detect the impact of drastically different trophic conditions on the biogeochemical variables in the ENLC, while most studies focused on the South Western tropical lagoon of New Caledonia (Fichez et al., 2010). The trophic status in the ELNC was evidenced by the relatively low values of nutrient (NOx). The oligotrophic state (CAL1, maybe characterized by unconsumed elevated nutrients compared to other cruises) remains the same when the high density thermal stratification of lagoon waters is established, which is observed during dry and calm periods that happen frequently during inter-seasons in New Caledonia (Dupouy et al., 2010; Murakami and Dupouy, 2013). Oligotrophy is disrupted when either wind or rain is modifying nutrient concentrations and enhance them, as for example a long and intense rainy episode (1 month in 2000) which brought nutrients in the Eastern lagoon (Ouinné Bay) with NOx values of 4 μM. Such high values (>1 μM) were never recorded during the three CALIOPE cruises, even in March 2016 after rain. It is remarkable that rain rather than wind increased NOx in the Eastern lagoon. During high wind (South-Eastern trade), due to the configuration of the coast, the extension of the coastal waters is restricted to a narrow coastal band.
Influence of Meteorological Conditions on Microorganisms, Their Pigmentation and Optical Properties
In the ENLC, TChla, PE, and SPM were strongly impacted either by wind or by rain as also shown in the South Western lagoon (Neveux et al., 2009; Dupouy et al., 2010; Torréton et al., 2010). All these biogeochemical parameters were very well related to each other as shown in Table 3 (r > 0.45, n = 155, p < 0.05). TChla showed values comparable with those found during an inter-annual survey in 2002–2003 at the Ouinne Bay (our Transect 4), i.e., following an eukaryotic bloom in a rainy event 2001 (Tenório et al., 2005). In the Eastern lagoon, picoplanktonic and filamentous cyanobacteria represent the dominant autotrophic groups (Tenorio et al., 2018). PE rather than TChla was increased in the presence of high wind, probably in relation with a higher Synechococcus abundance during the wind period. Trichodesmium was an episodic component during the CALIOPE cruises, with a surface bloom found at Transect 9 in March 2016 during a sunny day. The other groups, nano- and pico-eukaryotes were also favored by high wind. Such a finding may be a specificity of the Eastern coast as no results of such a wind effect was ever recorded on the Western lagoon. Wind and rain impacted nanoplankton, as well as microplankton (from HPLC measurements) in a similar manner. Total organic carbon (TOC) was increased by wind (Table 2). Optical properties of the ELNC were of the same order of magnitude as those in the South Western lagoon (Röttgers et al., 2016), with higher absorption by total particulate (phytoplankton, detritus, minerals) in bays (Dupouy et al., 2010; Murakami and Dupouy, 2013). Neither wind, nor rain disturbed the general decreasing patterns of CDOM or particulate absorption from bays to offshore. Surprisingly, no drastic changes in any component of absorption were observed after rain compared with after wind (Favareto et al., 2018). At the opposite, backscattering of particles was enhanced similarly after rain as after wind (Favareto et al., 2018). CDOM slopes (0.0143–0.0246 nm–1) were slightly higher than during the mesocosm experiment VAHINE (0.015–0.019 nm–1; Tedetti et al., 2016) which could reflect a higher influence of photobleaching. Their general increase from bays to offshore indicates the transitions from a terrestrial to marine organic matter combined to the effect of photodegradation.
Influence of Meteorological Conditions on CDOM Fluorophores
Here we evaluate for the first time in the influence of contrasted meteorological situations (dry weather, wind and rain conditions) on the distribution of CDOM fluorophores in the ENLC. The relative low fluorescence contributions of CDOM fluorophores observed in the ELNC are in accordance with those reported by Tedetti et al. (2016) and Martias et al. (2018), and reflect the oligo-mesotrophy of the lagoon waters. With low nutrient and TOC concentrations (<150 μM during the CALIOPE 1 and 2 cruises; Table 2), low phytoplankton biomass (TChla < 0.6 μg L–1), SPM (<1.5 mg L–1), the ENLC experienced relatively low fluorophores contributions (<35 QSU). These minimal values in the ELNC correspond to minima observed offshore during CAL3 (Martias et al., 2018) and were similar to those observed at a coastal station in oligotrophic waters of the Mediterranean Sea: between 0.5 and 5 QSU, for all fluorophores, with only one daily extreme value of 21 QSU (station SOFCOM; Para et al., 2010) and during a mesocosm experiment in the Southwest Caledonia coast near the Boulari Passage in February 2016, where they remained below 7.5 QSU (Tedetti et al., 2016). Even in mesotrophic conditions in the ENLC during CAL3 after a strong rain (Martias et al., 2018), our CDOM fluorescence contributions were evidently far lower than those typically found in eutrophic areas of temperate waters (though rarely expressed in QSU) with DOC > 1 mg L–1 (Zhang et al., 2013; Guo et al., 2014; Zhao et al., 2017), associated with phytoplankton blooms in coastal waters (Fukuzaki et al., 2014; Hansen et al., 2016), and in microalgal cultures (Kinsey et al., 2018).
Humic-Like Fluorophore
A part of fluorescent and absorptive CDOM pools were coupled considering the relatively high correlation between the fluorescence intensity of the humic-like (C2) fluorophore and all optical parameters (absorption, backscattering), as well as all biogeochemical parameters. The highest correlation (r = 0.50, n = 155, p < 0.05) was observed between ag(390) and C2 (Table 3). The humic-like fluorophore identified here by PARAFAC belongs to the UVC humic-like/peak A category (λEx/λEm: <230–260/400–500 nm) (Coble, 1996; Ishii and Boyer, 2012), recognized as one of the most ubiquitous humic-like components in the aquatic medium (Kowalczuk et al., 2009, 2013) and already identified in a mesocosm positioned in the south of the Western Tropical Caledonian lagoon (Tedetti et al., 2016). Proposed as a photodegradation product of marine OM, it is abundant in the photic zone and shallow surface waters (Yamashita et al., 2008; Ishii and Boyer, 2012) and appears to be no more photodegradable (as it absorbs in the UVC domain) and resistant to biodegradation (Balcarczyk et al., 2009; Fellman et al., 2010). In our study, spatial distributions of this humic-like fluorophore (C2) and ag(390) exhibited a high similarity (Figure 9). Elevated fluorescence contributions of this compound were always found in the Middle Zone of the ELNC, a region impacted by river outputs. Also, higher values were observed during windy or rainy conditions, albeit average values for the four stations of the transect (BY, ML, NBR, OBR) were the highest for the windy conditions (Supplementary Figure S3). Hence, the distribution of this fluorophore in the ENLC was related to terrestrial inputs. The impact of open-cast mining is known to be high in rivers of the Middle Zones (Thio to Houailou, Transects 6 to 9) as they drain ultramafic lands, while the Ouaième river in the Northern Zone drain karstic lands (Transect 12) (Bird et al., 1984). The effect of a high erosion there, probably due to mining extraction activities, and the thereby induced high riverine input of particulate and dissolved material, seems to be a constant significant feature in this part of the ELNC that is not much influenced by seasonal or episodic events. Because wind and rain induced a stimulation of biological activities in the ENLC, we may thus assume that the C2 humic-like fluorophore would be a photoproduct of terrestrial but also marine OM.
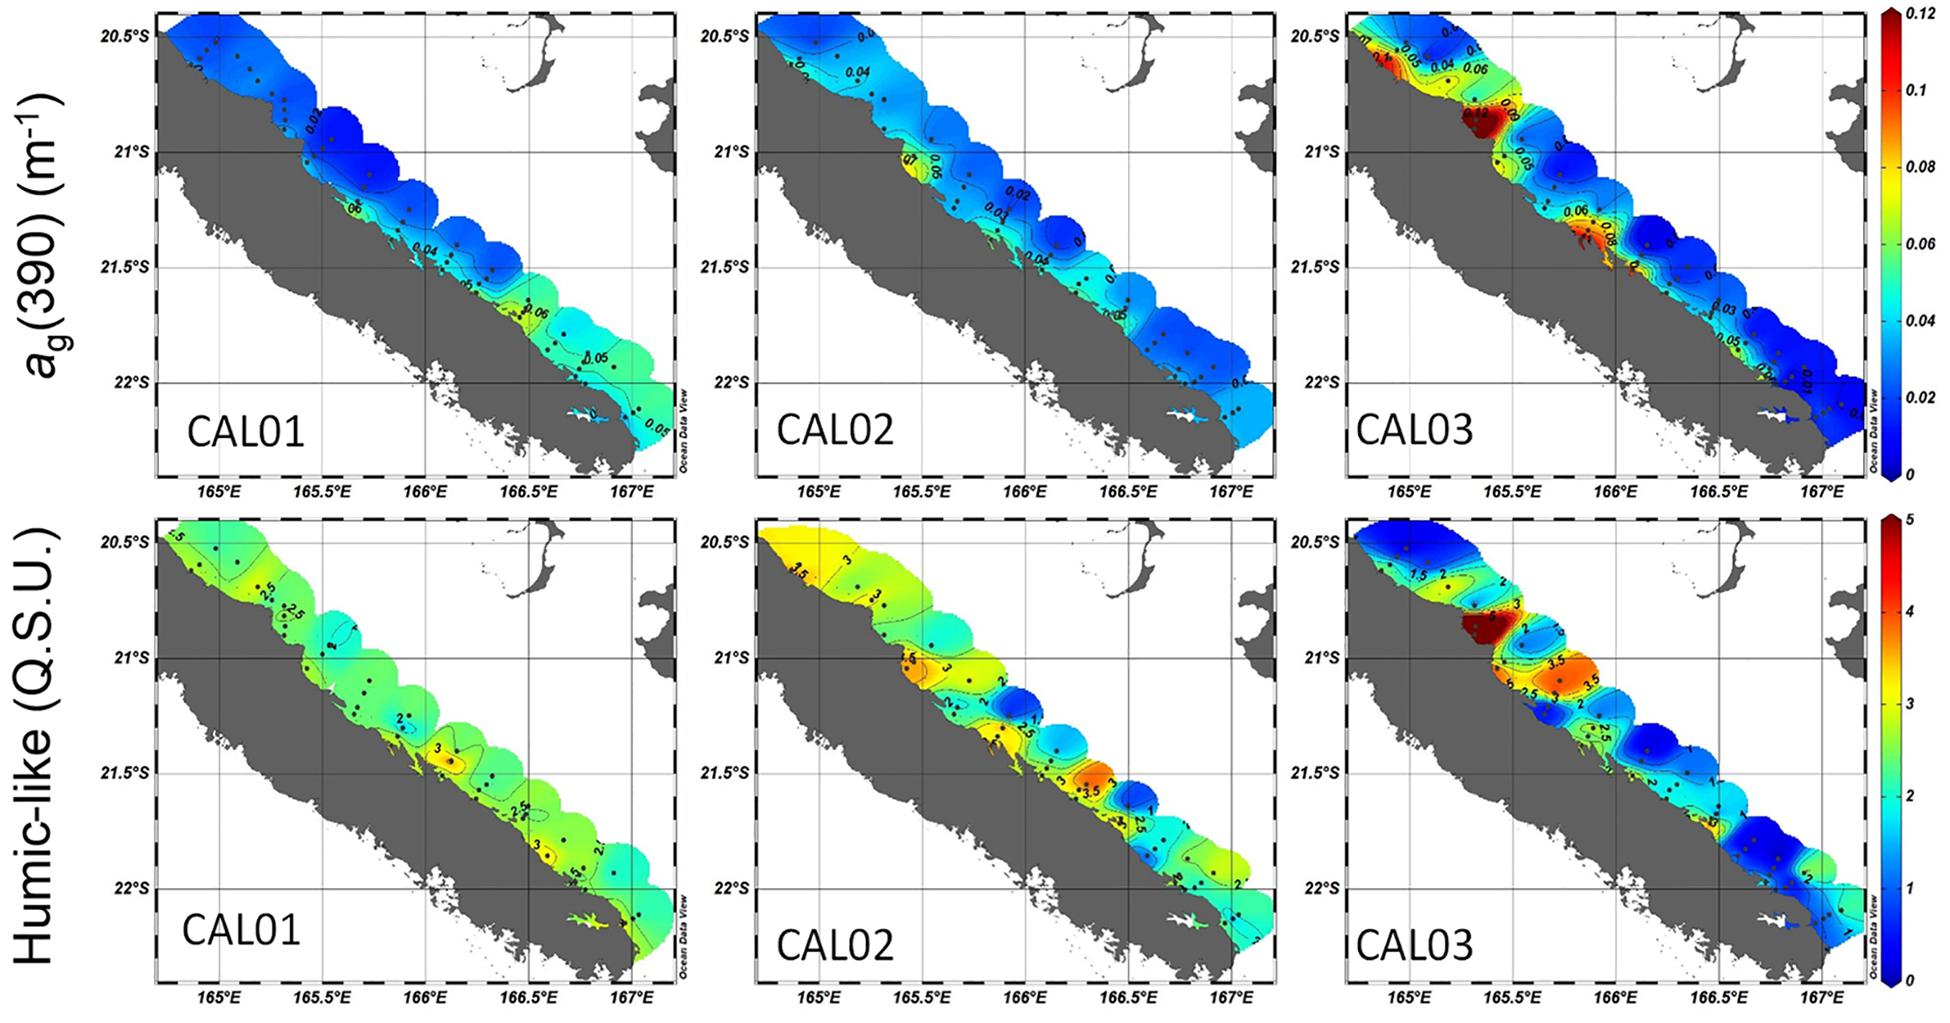
Figure 9. Comparison of the distributions along the Eastern lagoon of New Caledonia of CDOM absorption at 390 nm [ag(390), in m–1] (upper row) and C2 humic-like fluorescence contribution (in QSU) (lower row) for the three cruises.
Protein-Like Fluorophores
In the ELNC, fluorescent CDOM was dominated by three protein-like components, i.e., compounds containing nitrogen, while humic-like material was not much abundant. The three CDOM protein-like components identified (tryptophan-, tyrosine 1-, and tyrosine 2-like) displayed different patterns over the cruise, which implies that they were driven by different production/degradation processes. Wind intensity (positively for the tyrosine 1-like and negatively for the tyrosine 2-like), and temperature (weakly positively for tyrosine 2-like) influenced the overall distributions of these components. In contrast to the humic-like fluorophore, protein-like materials were not correlated to any of the biogeochemical parameters (Table 3 and Figure 8A). These compounds are known to be released by marine autochthonous phytoplankton activity and consumed by heterotrophic bacteria as labile substrates (Yamashita and Tanoue, 2003; Nieto-Cid et al., 2006; Davis and Benner, 2007; Suksomjit et al., 2009; Romera-Castillo et al., 2010). Yamashita et al. (2015) found that tryptophan and tyrosine-like fluorophores were related to total amino-acid concentrations. Moreover, protein-like fluorophores can be directly associated to humic substances (Stedmon and Cory, 2014), which would complicate their identification by spectrofluorimetry in the natural environment. Generally, these compounds do not show any conservative behavior in the salinity gradient (Kowalczuk et al., 2009).
Tyrosine 1- and tryptophan-like fluorophores
The tyrosine 1-like fluorophore (C1), and in a lesser extent, tryptophan-like fluorophore (C3) was significantly linked to high wind intensity, which reached more than 10 m s–1 (Supplementary Figures S3–S5). The 7-fold and 3-fold increase of C1 and C3, respectively, from North to South under windy conditions would be the result of the stimulation of the autochthonous biological activity in the ENLC, as shown by the increase in bacteria/cyanobacteria abundances, PE, and TChla concentrations. This biological stimulation would induce inputs of OM and nutrients by wind-driven resuspension of sediments and atmospheric inputs. Indeed, sediment resuspension in shallow waters is known to carry to the overlying water/water column particulate and dissolved OM, nutrients, and metals (Stahlberg et al., 2006; He et al., 2016) that may favor planktonic activity (Ben Othman et al., 2017). Resuspension would affect shallow areas (bays and reefs), and to a lesser extent the middle lagoon due to its depth (>60 m). Atmospheric inputs may result in particles transported by wind from mining extraction sites that are pushed by trades from the South to the North of the ELNC. Atmospheric deposition of particles (Maki et al., 2016) can affect the whole lagoon as aerosols can be transported over long distance in New Caledonia (Lefèvre et al., 2010; Csavina et al., 2012; Pasquet et al., 2018). Aerosols, which are known to be enriched in nutrients, OM and metals, may induce a stimulation of plankton abundances, including those of Synechococcus sp. (Chung et al., 2011; Pulido-Villena et al., 2014). Besides its release by planktonic activities (Coble, 1996, 2007; Nieto-Cid et al., 2006; Massicotte and Frenette, 2011), the tryptophan-like material would be also associated with coral reef, as pointed out by Martias et al. (2018) due to the high values recorded close to the barrier reef during the rainy period (see below).
Tyrosine 2-like fluorophore
The C4 tyrosine 2-like fluorophore was decoupled from C1 as seen from the PCA. During CAL1 and CAL2, its fluorescence contribution was low (Supplementary Figures S3, S5) and displayed much higher fluorescence intensities during the rainy period. Martias et al. (2018) made the assumption of an oceanic origin for this fluorophore, with regard to the significant positive correlation observed between its fluorescence intensities and Prochlorococcus sp. abundance during (only) the rainy period. However, when compiling all data from the three cruises, it appears that this relationship is no longer valid because the highest Prochlorococcus abundances are encountered under CAL1 in dry/calm conditions (Figure 4B). Prochlorococcus did not show any increase during rainfalls. Consequently, it is more likely that tyrosine 2-like fluorophore was mainly driven by other planktonic communities that were particularly enhanced in rainy conditions, although an association with Prochlorococcus cannot be excluded in some extent in the MZ (see below).
Episodic Events and Latitude Variations Along the Coast
Aside from the bay-ocean gradient and influence of wind or rain described above, CDOM fluorophores also exhibited some variations in response to some exceptional environmental conditions. In the NZ, the C2 humic-like fluorophore patch observed at 21°S, in the rainy period with >3.5 QSU (Figure 9, at Transects 10 and 11, stations 35, 36, and 40, 41, Supplementary Figures S1, S3) was associated with low salinity [and high abundance of particles, CDOM, NOx, bbH6(550), SPM, TChla, PE, and eucaryotic algae]. This is an example of an association between humic-like fluorescence intensity and fresh waters (Dixon et al., 2014; Guo et al., 2014) (at CAL3, r = −0.33). The Ouaième to Tiwaka Northern Caledonian rivers between Ponerihouen and Poindimié (Transects 10 and 12 noted “Tch,” for Tchamba, “Ti” for Tiwaka and “Tip” for Tipindge, see Figure 1 map) drain non-lateritic karstic lands (Chevillotte et al., 2006) and the black color of the river water corresponded to fresh material ejected just after rain probably as black carbon from recent or old fires.
The MZ is rich in C3 tryptophan-like fluorophore (North of the MZ, Transects 7 to 9, stations 27 to 33, Supplementary Figure S1 from Kouaoua to Houailou) both during rainy and windy periods (Supplementary Figures S3, S5). Elevated fluorescence patches extend as a plume that can be followed from the coast to the outside of the Barrier Reef. This particular zone of the cruise, between Canala, Kouaoua, and Houailou is characterized by a secondary fringing barrier reef inside the lagoon (Cabioch et al., 2008) where living corals could excrete material further degraded as tryptophan as pointed out by Martias et al. (2018). This zone has also the particularity to be occupied by a large mangrove forest on the Canala estuary (Marchand et al., 2007). Condensed tannins extracted from red mangrove (Rhizophora) leaves and roots exhibit the fluorescence peak in the close vicinity of the T-peak (Maie et al., 2007, 2012). As the influence of mangrove soils on the composition of fluorescent CDOM has been previously demonstrated (Tadini et al., 2018), they could also be a source for this particular fluorophore.
The NZ and SZ are rich areas of C4 tyrosine 2-like fluorophore associated with oceanic waters with a high abundance of Prochlorococcus corresponding to saline waters (>35) from the ocean entering the lagoon during the rain period (Martias et al., 2018; Supplementary Figures S3, S5). The MZ because of the influence of fresh waters (minima < 32) in the large river flows in association with a high silicate outputs from the Middle Zone rivers (SiOH4 > 20 μM, Martias et al., 2018) remains poor in C4. However, the association of C4 with oceanic waters did not exist in calm and windy periods (Supplementary Figures S3, S5).
Insight From Ocean Color-Derived CDOM Data
High precipitations observed in New Caledonia for a long period (2002–2017) in January-February (warm cyclonic season) (Meteo France) alternate with mostly dry, winter periods. The maximum in precipitation occurs in February-March while the minimum in the winter months (June to October). During this period, for which satellite ocean color imagery is available, strong rain events were recorded in summer months, as in March 2016 (Dupouy et al., 2018). The increase in CDOM absorption in the MZ, and occasionally in the NZ, should be captured by satellite (Chen et al., 2011; Devlin et al., 2015; Vantrepotte et al., 2015; Joshi et al., 2017; Wang et al., 2017; Aurin et al., 2018) as well as the other high rain events which occurred in April 2008 or February 2009 (Figure 10). Moreover, by following satellite-derived variations of CDOM distributions, it would be possible to estimate the extension of the C2 humic-like fluorophore at sea. Since erosion of lateritic lands is indeed associated with enhanced metal concentrations in the waters, as found in bays during CAL3 and provoking the quenching of some fluorophores (Martias et al., 2018), ocean color could be also used to trace metallic contaminations of waters.
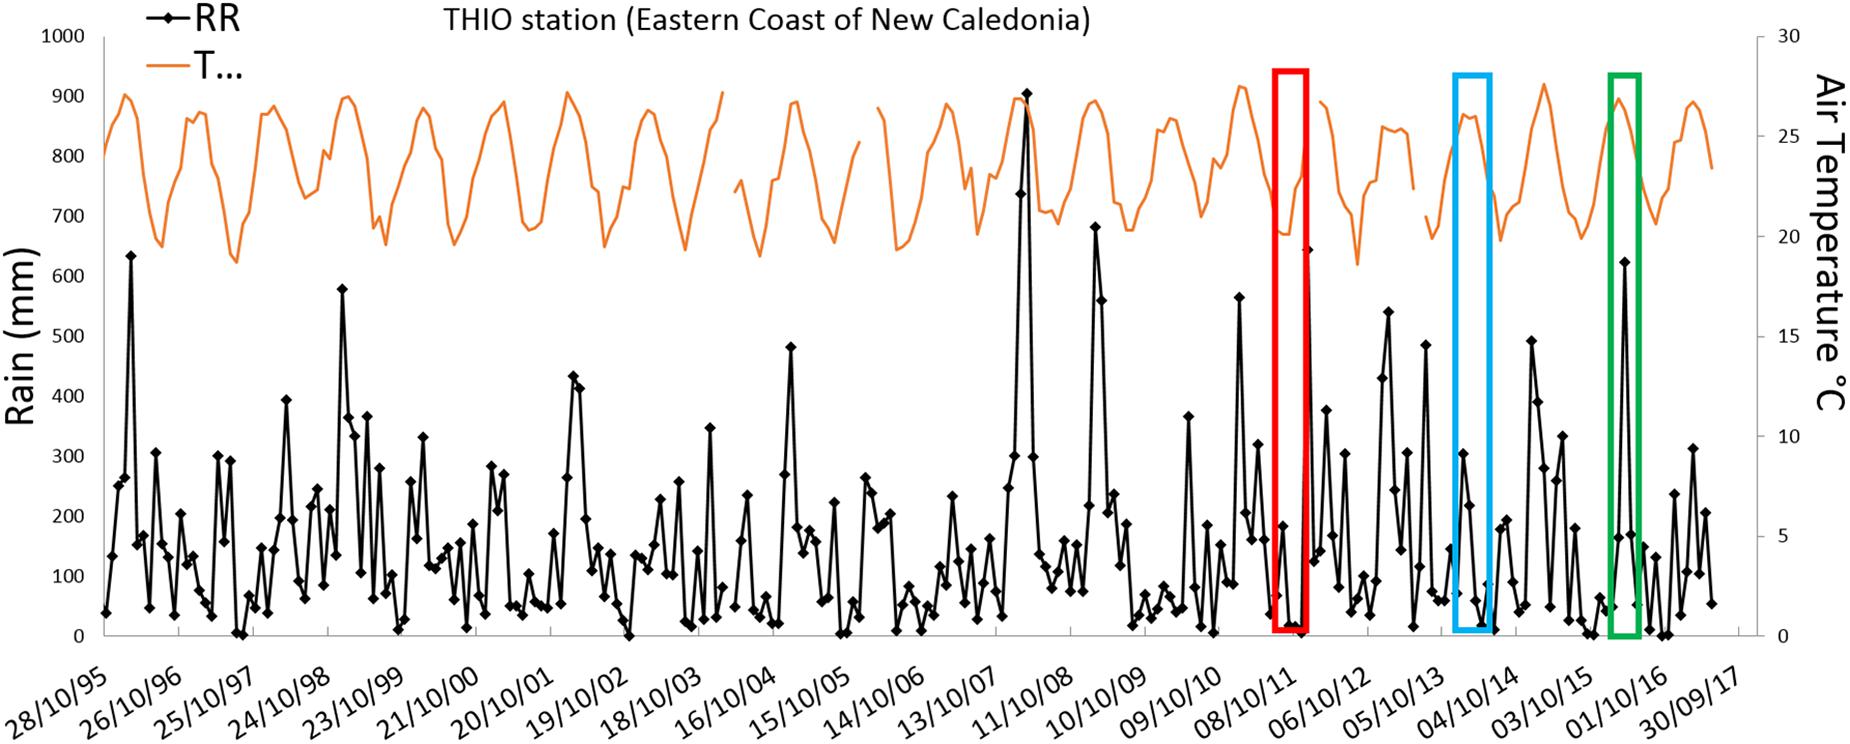
Figure 10. Time seriesof rain (RR) and temperature (T) at the THIO village station, the station representative of the MiddleZone of the Eastern lagoonof New Caledonia during 1995–2017 (from Météorologie Nationale in New Caledonia data). Rectangles indicate when the CALIOPE cruises occurred (CAL1 in red, CAL2 in blue, and CAL3 in green).
Conclusion
The CALIOPE cruises conducted off the East Coast of New Caledonia, a largely under-sampled area, showed that CDOM fluorescence characteristics varied substantially, both temporally and spatially. The ideal pattern of the CALIOPE cruises allowed us to get a quasi-synoptic view of biogeochemical and CDOM fluorescence properties over about 2° in latitude in less than 2 weeks. Different biologically driven CDOM processes in the water column of the ELNC were highlighted. The humic-like component, relatively low in QSU, was largely influenced by rainfall and terrigeneous inputs, as CDOM absorption, particulate absorption, backscattering, SPM, TChla, and NOx concentrations. It was detected at the coast in the middle zone of the ELNC, quite permanently. Inversely, the protein-like fluorophores showed different dependencies on environmental conditions, with the tyrosine 1- and tryptophan-like influenced by wind (with a 7-fold and 3-fold increase, respectively), and the tyrosine 2-like associated to rainfalls and subsequent biological production. The protein-like fluorophores showed weak dependencies on temperature and TChla. Nevertheless, strong and quick variations of the physical and biogeochemical conditions along the coast occurred during cruises. For example, the quick return of sunny conditions just after the tropical rain event may have complicated the pattern and prevented a synoptic mapping of the fluorophore distribution due to a strong irradiation affecting the detection of fluorophores, as humic-like ones. Also, some fluorophores may be degradation products of other ones and the cruise track might not have readily captured their abundance. Lastly, the metallic contaminations in bays might have decreased the fluorescence of some fluorophores (quenching). The relationship between the C2 humic-like and CDOM absorption could be validated in connection with high frequency remote sensing of CDOM distribution by inversion of reflectance, or in situ measurements (with a glider). In conclusion, even if there is still a severe lack of direct evidence linking PARAFAC fluorescent components to organic molecules in DOM (Yamashita et al., 2015), our spectrofluorimetry study allowed a description of different processes involved in the distribution and evolution of DOC in tropical lagoons. It is of prime importance to have access to this variability since CDOM fluorophores may be linked to trace metal concentrations, reducing or enhancing metal contamination of the lagoon waters off this highly lateritic New Caledonia coast.
Data Availability Statement
Publicly available datasets were analyzed in this study. This data can be found here: https://campagnes.flotteoceanographique. fr/campagnes/11100090/fr/; https://campagnes.flotteoceano graphique.fr/campagnes/14003900/fr/; and https://campagnes.flotteoceanographique.fr/campagnes/16003400/fr/.
Author Contributions
CD, CM, RR, RF, and MR participated in the CALIOPE cruises. FL analyzed and processed the flow cytometry data, pigments, and phycoerythin analysis. MT analyzed and processed the fluorescence data. MG was responsible of the Chemistry team in M.I.O. supported the TREMOLO program. All authors contributed to the writing and the discussion around the manuscript.
Funding
CD, MT, and MR were funded by the Institut de Recherche pour le Développement (IRD, France). The National Aeronautics and Space Administration (NASA) supported RF under various grants. Ocean color measurements with the TRIOS were supported by a JAXA-NASA joint research project for Global Imager sensor calibration. The TREMOLO project was supported by the INSU EC2CO (Ecosphère Continentale et Côtière) program. The CALIOPE cruises received the support from the Commission Nationale de la Flotte Côtière. Additional funding was obtained from Mediterranean Institute of Oceanography IRD-MIO Actions Sud.
Conflict of Interest
The authors declare that the research was conducted in the absence of any commercial or financial relationships that could be construed as a potential conflict of interest.
Acknowledgments
We thank the captains and crews of R/V Alis for operations at sea during the three CALIOPE cruises. We also thank Province Nord and Province Sud of New Caledonia and town halls of the Eastern Coast for cruise authorization in the ELNC. We thank Luciane Favareto, Master 2 student from INPE (Brazil) for her participation in CAL2, and Shilpa Lal, Master 2 student from PACE-SD at the University of the South Pacific in Suva (Fiji), for her help during CAL3, Yves Gouriou, Responsible of the R/V Alis scheduling, for his constant support, and for adapting the R/V Alis cruises to allow sampling of different meteorological conditions on the East Coast and David Varillon for his help in instrumentation deployment and data acquisition. We acknowledge Hiroshi Murakami for making available the JAXA’s TRIOS radiometer system and for data processing. We acknowledge Philippe Gérard, for nutrient analysis and Crystal Thomas, NASA Goddard Space Flight Center, Maryland (United States), for HPLC analysis. We would like to thank Meterologie Nationale in New Caledonia for rain and temperature data and DAVAR (Direction des Affaires Vétérinaires) for river flow data and Farid Juillot for his advice in statistical analysis and data interpretation and Jacques Neveux for his help in improving the manuscript. We are grateful to the two reviewers for their comments and corrections.
Supplementary Material
The Supplementary Material for this article can be found online at: https://www.frontiersin.org/articles/10.3389/feart.2020.00054/full#supplementary-material
FIGURE S1 | Map of the CALIOPE cruises stations, with the number along track at transects (Table 1).
FIGURE S2 | Ocean color (remote sensing reflectance, Rrs) at 390 and 440 nm for the three CALIOPE cruises.
FIGURE S3 | Comparison of the distributions of the fluorescence contributions (in QSU) of (A) C1 tyrosine 1-like, (B) C2 humic-like, (C) C3 tryptophan-like, and (D) C4 tyrosine 2-like fluorophores along the Eastern lagoon of New Caledonia, versus the number of the station along track (station number 1 to station number 51) and for the three cruises (CAL1 in red, CAL2 in blue, CAL3 in green). The zone is indicated (NZ, SZ, and MZ).
FIGURE S4 | Comparison of the distributions of the fluorescence contributions (in QSU) of C1 tyrosine 1-like fluorophore along the Eastern lagoon of New Caledonia and for the three cruises.
FIGURE S5 | Comparison of the distributions of the fluorescence contributions (in QSU) of C3 tryptophan-like (A) and (B) C4 tyrosine 2-like fluorophores along the Eastern lagoon of New Caledonia and for the three cruises.
FIGURE S6 | Spectral slope S(370–500 nm) in nm–1 for the three cruises (CAL1 in red, CAL2 in blue, CAL3 in green) versus the position of the station along the transect from the coast (“bay, BY,” “middle lagoon, ML,” “near (inside) the barrier reef, NBR,” and “outside of the barrier reef, OBR”).
References
Aparicio, F. L., Nieto-Cid, M., Borrull, E., Calvo, E., Pelejero, C., Sala, M. M., et al. (2016). Eutrophication and acidification: do they induce changes in the dissolved organic matter dynamics in the coastal Mediterranean Sea? Sci. Total Environ. 563–564, 179–189. doi: 10.1016/j.scitotenv.2016.04.108
Aurin, D., Maninno, A., and Lary, D. J. (2018). Remote sensing of CDOM, CDOM spectral slope, and dissolved organic carbon in the global ocean. Appl. Sci. 8:2687. doi: 10.3390/app8122687
Balcarczyk, K. L., Jones, J. B. Jr., Jaffé, R., and Maie, N. (2009). Stream dissolved organic matter bioavailability and composition in watersheds underlain with discontinuous permafrost. Biogeochemistry 94, 255–270. doi: 10.1007/s10533-009-9324-x
Ben Othman, H., Pringault, O., Louati, H., Sakka Hlaili, A., and Leboulanger, C. (2017). Impact of contaminated sediment elutriate on coastal phytoplankton community (Thau lagoon, Mediterranean Sea, France). J. Exp. Mar. Biol. Ecol. 486, 1–12. doi: 10.1016/j.jembe.2016.09.006
Bird, E. C. F., Dubois, J.-P., and Iltis, J. (1984). The Impacts of Opencast Mining on the Rivers and Coasts of New Caledonia. Tokyo: United Nations University.
Blondeau-Patissier, D., Brando, V., Oubelkheir, K., Dekker, A., Clementson, L., and Daniel, P. (2009). Bio-optical variability of the absorption and scattering properties of the Queensland inshore and reef waters, Australia. J. Geophys. Res. 114:C05003. doi: 10.1029/2008JC005039
Bonvallot, J., Gay, J.-C., and Habert, E. (2013). Atlas de la Nouvelle-Calédonie. Nouméa: IRD éditions/Congress of New Caledonia.
Bricaud, A., Morel, A., and Prieur, L. (1981). Absorption by dissolved organic matter of the sea (yellow substance) in the UV and visible domain. Limnol. Oceanogr. 26, 43–53. doi: 10.4319/lo.1981.26.1.0043
Cabioch, G., Wirrmann, D., Sémah, A. M., Corrège, T., and Le Cornec, F. (2008). Évolution des paléoenvironnements dans le Pacifique lors de la dernière déglaciation : exemples en Nouvelle-Calédonie et au Vanuatu. J. Soc. Océan. 126–127, 25–40. doi: 10.4000/jso.4482
Carlson, C. A., and Hansell, D. A. (2015). “DOM source, sinks, reactivity, and budgets,” in Biogeochemistry of Marine Dissolved Organic Matter, 2nd Edn. eds D. A. Hansell and C. A. Carlson (San Diego, CA: Academic Press), 65–126. doi: 10.1016/B978-0-12-405940-5.00003-0
Chen, S., Huang, W., Chen, W., and Chen, X. (2011). An enhanced MODIS remote sensing model for detecting rainfall effects on sediment plume in the coastal waters of Apalachicola Bay. Mar. Environ. Res. 72, 265–272. doi: 10.1016/j.marenvres.2011.09.014
Chevillotte, V., Chardon, D., Beauvais, A., Maurizot, P., and Colin, F. (2006). Long-term tropical morphogenesis of New Caledonia (Southwest Pacific): importance of positive epeirogeny and climate change. Geomorphology 81, 361–375. doi: 10.1016/j.geomorph.2006.04.020
Chung, C. C., Chang, J., Gong, G. C., Hsu, S. C., Chiang, K. P., and Liao, C. W. (2011). Effects of Asian dust storms on synechococcus populations in the subtropical Kuroshio Current. Mar. Biotechnol. 13, 751–763. doi: 10.1007/s10126-010-9336-5
Coble, P. G. (1996). Characterization of marine and terrestrial DOM in seawater using excitation–emission matrix spectroscopy. Mar. Chem. 51, 325–346. doi: 10.1016/0304-4203(95)00062-3
Coble, P. G. (2007). Marine optical biogeochemistry: the chemistry of ocean color. Chem. Rev. 107, 402–418. doi: 10.1021/cr050350
Csavina, J., Field, J., Taylor, M. P., Gao, S., Landázuri, A., Betterton, E. A., et al. (2012). A review on the importance of metals and metalloids in atmospheric dust and aerosol from mining operations. Sci. Total Environ. 433, 58–73. doi: 10.1016/j.scitotenv.2012.06.013
David, G., Leopold, M., Dumas, P. S., Ferraris, J., Herrenschmidtd, J. B., and Fontenelle, G. (2010). Integrated coastal zone management perspectives to ensure the sustainability of coral reefs in New Caledonia. Mar. Pollut. Bull. 61, 323–334. doi: 10.1016/j.marpolbul.2010.06.020
Davis, J., and Benner, R. (2007). Quantitative estimates of labile and semi- labile dissolved organic carbon in the western Arctic Ocean: a molecular approach. Limnol. Oceanogr. 52, 2434–2444. doi: 10.2307/4502392
Devlin, M. J., Petus, C., Da Silva, E., Tracey, D., Wolff, N. H., Waterhouse, J., et al. (2015). Water quality and river plume monitoring in the great barrier reef: an overview of methods based on ocean colour satellite data. Remote Sens. 7, 12909–12941. doi: 10.3390/rs71012909
Dixon, J. L., Osburn, C. L., Paerl, H. W., and Peierls, B. L. (2014). Seasonal changes in estuarine dissolved organic matter due to variable flushing time and wind-driven mixing events. Estuar. Coast. Shelf Sci. 151, 210–220. doi: 10.1016/j.ecss.2014.10.013
D’Sa, E. J., and Kim, H.-C. (2017). Surface gradients in dissolved organic matter absorption and fluorescence properties along the New Zealand Sector of the Southern Ocean. Front. Mar. Sci. 28:21. doi: 10.3389/fmars.2017.00021
Dupouy, C., Neveux, J., Ouillon, S., Frouin, R., Murakami, H., Hochard, S., et al. (2010). Inherent optical properties and satellite retrieval of chlorophyll concentration in the lagoon and open ocean waters of New Caledonia. Mar. Pollut. Bull. 61, 503–518. doi: 10.1016/j.marpolbul.2010.06.039
Dupouy, C., Röttgers, R., Tedetti, M., Martias, C., Murakami, H., and Doxaran, D., et al. (2014). “Influence of CDOM and particle composition on ocean color of the Eastern new caledonia lagoon during the CALIOPE cruises,” in Proceddings of the SPIE, 9261, Asia-Pacific Remote Sensing: Ocean Remote Sensing and Monitoring from Space, 92610M. Beijing. doi: 10.1117/12.2073309
Dupouy, C., Wattelez, G., Martias, C., Juillot, J., Andréoli, R., Lille, D., et al. (2018). “Rain-derived particles and CDOM distribution along the east coast of New Caledonia,” in Proceddings of the SPIE, 10778, Asia-Pacific Remote Sensing: Remote Sensing of the Open and Coastal Ocean and Inland Waters; 107780K. Honolulu, HI. doi: 10.1117/12.2501807
Favareto, L., De Moraes Rudorff, N., Kampel, M., Frouin, R., Röttgers, R., Doxaran, D., et al. (2018). Bio-optical properties of the Eastern lagoon of New Caledonia, South Tropical Pacific. Remote Sens. 10:1043. doi: 10.3390/rs10071043
Fellman, J. B., Hood, E., and Spencer, R. G. M. (2010). Fluorescence spectroscopy opens new windows into dissolved organic matter dynamics in freshwater ecosystems: a review. Limnol. Oceanogr. 55, 2452–2462. doi: 10.4319/lo.2010.55.6.2452
Ferretto, N., Tedetti, M., Guigue, C., Mounier, S., Raimbault, P., and Goutx, M. (2017). Spatio-temporal variability of fluorescent dissolved organic matter in the Rhône River delta and the Fos-Marseille marine area (NW Mediterranean Sea, France). Environ. Sci. Pollut. Res. 24, 4973–4989. doi: 10.1007/s11356-016-8255-z
Fichez, R., Chifflet, S., Douillet, P., Gérard, P., Guttierez, F., Jouon, A., et al. (2010). Biogeochemical typology and temporal variability of lagoon waters in a coral reef ecosystem subject to terrigeneous and anthropogenic inputs (New Caledonia). Mar. Pollut. Bull. 61, 309–322. doi: 10.1016/j.marpolbul.2010.06.021
Fichot, C. G., and Benner, R. (2014). The fate of terrigenous dissolved organic carbon in a river-influenced ocean margin. Glob. Biogeochem. Cycles 28, 300–318. doi: 10.1002/2013GB004670
Fichot, C. G., Benner, R., Kaiser, K., Shen, Y., Amon, R. M. W., Ogawa, H., et al. (2016). Predicting dissolved lignin phenol concentrations in the Coastal Ocean from chromophoric dissolved organic matter (CDOM) absorption coefficients. Front. Mar. Sci. 3:7. doi: 10.3389/fmars.2016.00007
Fuchs, R., Pinazo, C., Douillet, P., Fraysse, M., Grenz, C., Mangin, A., et al. (2013). Modeling the ocean-lagoon interaction via upwelling processes on the South West of New Caledonia. Estuar. Coast. Shelf Sci. 135, 5–17. doi: 10.1016/j.ecss.2013.03.009
Fukuzaki, K., Imai, I., Fukushima, K., Ishii, K.-I., Sawayama, S., and Yoshioka, T. (2014). Fluorescent characteristics of dissolved organic matter produced by bloom-forming coastal phytoplankton. J. Plank. Res. 36, 685–694. doi: 10.1093/plankt/fbu015
Guo, W., Yang, L., Zhai, W., Chen, W., Osburn, C. L., Huang, X., et al. (2014). Runoff-mediated seasonal oscillation in the dynamics of dissolved organic matter in different branches of a large bifurcated estuary—the Changjiang Estuary. J. Geophys. Res. Biogeosci. 119, 776–793. doi: 10.1002/2013JG002540
Hansell, D. A. (2013). Recalcitrant dissolved organic carbon fractions. Ann. Rev. Mar. Sci. 5, 421–445. doi: 10.1146/annurev-marine-120710-100757
Hansell, D. A., Carlson, C. A., Repeta, D. J., and Schlitzer, R. (2009). Dissolved organic matter in the ocean: a controversy stimulates new insights. Oceanography 22, 202–211. doi: 10.5670/oceanog.2009.109
Hansen, A. M., Kraus, T. E. C., Pellerin, B. A., Fleck, J. A., Downing, B. D., and Bergamaschi, B. A. (2016). Optical properties of dissolved organic matter (DOM): Effects of biological and photolytic degradation. Limnol. Oceanogr. 61, 1015–1032. doi: 10.1002/lno.10270
He, W., Chen, M., Schlautman, M. A., and Hur, J. (2016). Dynamic exchanges between DOM and POM pools in coastal and inland aquatic ecosystems: a review. Sci. Total Environ. 55, 415–428. doi: 10.1016/j.scitotenv.2016.02.031
Hooker, S. B., Van Heukelem, L., Thomas, C. S., Claustre, H., Ras, J., and Schlüter, L., et al. (2005). The Second SeaWiFS HPLC Analysis Round-Robin Experiment (SeaHARRE-2). NASA Tech. Memo. 2005–212785. Greenbelt, MD: NASA Goddard Space Flight Center, 112.
Hu, B., Wang, P. F., Zhang, N. N., Wang, C., and Ao, Y. H. (2016). Photoproduction of dissolved organic carbon and inorganic nutrients from resuspended lake sediments. Environ. Sci. Pollut. Res. 23, 22126–22135. doi: 10.1007/s11356-016-7327-4
Ihaka, R., and Gentleman, R. (1996). R, a language for data analysis and graphics. J. Comput. Graph. Stat. 5, 299–314. doi: 10.2307/1390807
Ishii, S. K. L., and Boyer, T. H. (2012). Behavior of reoccurring PARAFAC components in fluorescent dissolved organic matter in natural and engineered systems: a critical review. Environ. Sci. Technol. 46, 2006–2017. doi: 10.1021/es2043504
Jiao, N., Herndl, G. J., Hansell, D. A., Benner, R., Kattner, G., and Wilhelm, S. W. (2010). Microbial production of recalcitrant dissolved organic matter: long-term carbon storage in the global ocean. Nat. Rev. Microbiol. 8, 593–599. doi: 10.1038/nrmicro2386
Joshi, I. D., D’Sa, E. J., Osburn, C. L., Bianchi, T. S., Ko, D. S., Oviedo-Vargas, D., et al. (2017). Assessing chromophoric dissolved organic matter (CDOM) distribution, stocks, and fluxes in Apalachicola Bay using combined field, VIIRS ocean color, and model observations. Remote Sens. Environ. 191, 359–372. doi: 10.1016/j.rse.2017.01.039
Kinsey, J. D., Corradino, G., Ziervogel, K., Schnetzer, A., and Osburn, C. L. (2018). Formation of chromophoric dissolved organic matter by bacterial degradation of phytoplankton-derived aggregates. Front. Mar. Sci. 4:430. doi: 10.3389/fmars.2017.00430
Kowalczuk, P., Durako, M. J., Young, H., Kahn, A. E., Cooper, W. J., and Gonsior, M. (2009). Characterization of dissolved organic matter fluorescence in the South Atlantic Bight with use of PARAFAC- model: interannual variability. Mar. Chem. 113, 182–196. doi: 10.1016/j.marchem.2009.01.015
Kowalczuk, P., Tilstone, G. H., Zab, M., Röttgers, R., and Thomas, R. (2013). Composition of dissolved organic matter along an Atlantic meridional transect from fluorescence spectroscopy and parallel factor analysis. Mar. Chem. 157, 170–184. doi: 10.1016/j.marchem.2013.10.004
Kwon, H. K., Kim, G., Lim, W. A., and Park, J. W. (2018). In-situ production of humic-like fluorescent dissolved organic matter during Cochlodinium polykrikoides blooms. Estuar. Coast. Shelf Sci. 203, 119–126. doi: 10.1016/j.ecss.2018.02.013
Lantoine, F., and Neveux, J. (1997). Spatial and seasonal variations in abun- dance and spectral characteristics of phycoerythrins in the tropical northeastern Atlantic Ocean. Deep Sea Res. Pt. I 44, 223–246. doi: 10.1016/s0967-0637(96)00094-5
Lefèvre, J., Marchesiello, P., Jourdain, N., Menkes, C., and Leroy, A. (2010). Weather regimes and orographic circulation around New Caledonia. Mar. Pollut. Bull. 61, 413–431. doi: 10.1016/j.marpolbul.2010.06.012
Maie, N., Scully, N. M., Pisani, O., and Jaffé, R. (2007). Composition of a protein-like fluorophore of dissolved organic matter in coastal wetland and estuarine ecosystems. Water Res. 41, 563–570. doi: 10.1016/j.watres.2006.11.006
Maie, N., Yamashita, Y., Cory, R. M., Boyer, J. N., and Jaffé, R. (2012). Application of excitation emission matrix fluorescence monitoring in the assessment of spatial and seasonal drivers of dissolved organic matter composition: Sources and physical disturbance controls. Appl. Geochem. 27, 917–929. doi: 10.1016/j.apgeochem.2011.12.021
Maki, T., Ishikawa, A., Mastunaga, T., Pointing, S. B., Saito, Y., Kasai, T., et al. (2016). Atmospheric aerosol deposition influences marine microbial communities in oligotrophic surface waters of the western Pacific Ocean. Deep Sea Res. Pt. I 118, 37–45. doi: 10.1016/j.dsr.2016.10.002
Marchand, C., Dumas, P., Virly, S., Buisson, D., and Duke, N. (2007). Typologies et Biodiversité des mangroves de Nouvelle-Calédonie, ZONECO Report. Nouméa: DTSI Nouvelle-Calédonie, 213.
Marchesiello, P., Lefèvre, J., Vega, A., Couvelard, X., and Menkes, C. (2010). Coastal upwelling, circulation and heat balance around New Caledonia’s barrier reef. Mar. Pollut. Bull. 61, 432–448. doi: 10.1016/j.marpolbul.2010.06.043
Martias, C., Tedetti, M., Lantoine, F., Jamet, L., and Dupouy, C. (2018). Spatial distribution of chromophoric dissolved organic matter and trace metals in the New Caledonia tropical lagoon (South Pacific Ocean). Sci. Total Environ. 61, 438–452. doi: 10.1016/j.scitotenv.2017.10.261
Martínez-Pérez, A. M., Nieto-Cid, M., Osteholz, H., Catalá, T. S., Reche, I., Dittmar, T., et al. (2017). Linking optical and molecular signatures of dissolved organic matter in the Mediterranean Sea. Sci. Rep. 7:3436. doi: 10.1038/s41598-017-03735-4
Massicotte, P., and Frenette, J.-J. (2011). Spatial connectivity in a large river system: resolving the sources and fate of dissolved organic matter. Ecol. Appl. 21, 2600–2617. doi: 10.2307/41416682
Mopper, K., and Kieber, D. (2002). “Photochemistry and the cycling of carbon, sulfur, nitrogen and phosphorus,” in Biogeochemistry of Marine Dissolved Organic Matter, 1st Edn. eds D. A. Hansell and C. A. Carlson (San Diego, CA: Academic Press), 455–507. doi: 10.1016/B978-012323841-2/50011-7
Moran, M. A., Kujawinski, E. B., Stubbins, A., Fatland, R., Aluwihare, L. I., Buchan, A., et al. (2016). Deciphering ocean carbon in a changing world. Proc. Natl. Acad. Sci. U.S.A. 113, 3143–3151. doi: 10.1073/pnas.1514645113
Mounier, S., Braucher, R., and Benaïm, J.-Y. (1999). Differentiation of organic matter’s properties of the Rio Negro basin by cross-flow ultra-filtration and UV-spectrofluorescence. Water Res. 33, 2363–2373. doi: 10.1016/s0043-1354(98)00456-4
Mounier, S. J. L., Marins, R. V., and de Lacerda, L. D. (2018). “Determining the influence of urbanization on mangrove zones of northeastern Brazil: characterization of ceará state coastal zone organic matter inputs,” in Threats to Mangrove Forests. Coastal Research Library, Vol. 25. eds C. Makowski and C. Finkl (Cham: Springer), 199–222. doi: 10.1007/978-3-319-73016-5_10
Murakami, H., and Dupouy, C. (2013). Atmospheric correction and inherent optical property estimation in the southwest New Caledonia lagoon using AVNIR-2 high-resolution data. Appl. Opt. 52, 182–198. doi: 10.1364/AO.52.000182
Murphy, K. R., Stedmon, C. A., Waite, T. D., and Ruiz, G. M. (2008). Distinguishing between terrestrial and autochthonous organic matter sources in marine environments using fluorescence spectroscopy. Mar. Chem. 108, 40–58. doi: 10.1016/j.marchem.2007.10.003
Nelson, C. E., Donahue, M. J., Dulaiova, H., Goldberg, S. J., La Valle, F. F., and Lubarsky, K. (2015). Fluorescent dissolved organic matter as a multivariate biogeochemical tracer of submarine groundwater discharge in coral reef ecosystems. Mar. Chem. 177, 232–243. doi: 10.1016/j.marchem.2015.06.026
Nelson, N. B., and Siegel, D. A. (2013). The global distribution and dynamics of chromophoric dissolved organic matter. Ann. Rev. Mar. Sci. 5, 447–476. doi: 10.1146/annurev-marine-120710-100751
Nelson, N. B., Siegel, D. A., and Michaels, A. F. (1998). Seasonal dynamics of colored dissolved material in the Sargasso Sea. Deep Sea Res. Pt. I 45, 931–957. doi: 10.1016/s0967-0637(97)00106-4
Neveux, J., Tenório, M. M. B., Jacquet, S., Torréton, J.-P., Douillet, P., Ouillon, S., et al. (2009). Chlorophylls and phycoerythrins as markers of environmental forcings on phytoplankton in the southwest lagoon of New Caledonia and oceanic adjacent area. Intern.J. Oceanogr. 2009:23251. doi: 10.1155/2009/232513
Nieto-Cid, M., Aìlvarez-Salgado, X. A., and Peìrez, F. F. (2006). Microbial and photochemical reactivity of fluorescent dissolved organic matter in a coastal upwelling system. Limnol. Oceanogr. 51, 1391–1400. doi: 10.4319/lo.2006.51.3.1391
Osburn, C. L., Handsel, L. T., Mikan, M. P., Paerl, H. W., and Montgomery, M. T. (2012). Fluorescence tracking of dissolved and particulate organic matter quality in a river-dominated estuary. Environ. Sci. Technol. 46, 8628–8636. doi: 10.1021/es3007723
Para, J., Coble, P. G., Charrière, B., Tedetti, M., Fontana, C., and Sempéré, R. (2010). Fluorescence and absorption properties of chromophoric dissolved organic matter (CDOM) in coastal surface waters of the northwestern Mediterranean Sea, influence of the Rhône River. Biogeosciences 7, 4083–4103. doi: 10.5194/bg-7-4083-2010
Pasquet, C., Monna, F., van Oort, F., Gunkel-Grillon, P., Laporte-Magoni, C., Losno, R., et al. (2018). Mobility of Ni, Co, and Mn in ultramafic mining soils of New Caledonia, assessed by kinetic EDTA extractions. Environ. Monit. Assess. 190:638. doi: 10.1007/s10661-018-7029-0
Pulido-Villena, E., Baudoux, A. C., Obernosterer, I., Landa, M., Caparros, J., and Catala, P. (2014). Microbial food web dynamics in response to a Saharan dust event: results from a mesocosm study in the oligotrophic Mediterranean Sea. Biogeosciences 11, 5607–5619. doi: 10.5194/bg-11-5607-2014
Raimbault, P., Diaz, F., Pouvesle, W., and Boudjellal, B. (1999). Simultaneous determination of particulate organic carbon, nitrogen and phosphorus collected on filters, using a semi-automatic wet-oxidation method. Mar. Ecol. Prog. Ser. 180, 289–295. doi: 10.3354/meps180289
Ras, J., Claustre, H., and Uitz, J. (2008). Spatial variability of phytoplankton pigment distributions in the Subtrop-ical South Pacific Ocean: comparison between in situ and predicted data. Biogeosciences 5, 353–369. doi: 10.5194/bgd-4-3409-200
Rochelle-Newall, E., Hulot, F. D., Janeau, J. L., and Merroune, A. (2014). CDOM fluorescence as proxy of DOC concentration in natural waters: a comparison of four contrasting tropical systems. Environ. Monit. Assess. 186, 589–596. doi: 10.1007/s10661-013-3401-2
Romera-Castillo, C., Sarmento, H., Álvarez-Salgado, X. A., Gasol, J. M., and Marrasé, C. (2010). Production of chromophoric dissolved organic matter by marine phytoplankton. Limnol. Oceanogr. 55, 446–454. doi: 10.4319/lo.2010.55.1.0446
Röttgers, R., and Doerffer, R. (2007). Measurements of optical absorption by chromophoric dissolved organic matter using a point-source integrating-cavity absorption meter. Limnol. Oceanogr. Meth. 5, 126–135. doi: 10.4319/lom.2007.5.126
Röttgers, R., Doxaran, D., and Dupouy, C. (2016). Quantitative filter technique measurements of spectral light absorption by aquatic particles using a portable integrating cavity absorption meter (QFT-ICAM). Optics Express 24, A1–A20. doi: 10.1364/OE.24.0000A1
Röttgers, R., Dupouy, C., Taylor, B. B., Bracher, A., and Wozniak, S. B. (2014). Mass-specific light absorption coefficients of natural aquatic particles in the near-infrared spectral region. Limnol. Oceanogr. 59, 1449–1460. doi: 10.4319/lo.2014.59.5.1449
Siegel, D. A., Maritorena, S., Nelson, N. B., Hansell, D. A., and Lorenzi-Kayser, M. (2002). Global distribution and dynamics of colored dissolved and detrital organic materials. J. Geophys. Res. 107, 3228–3249.
Specchiulli, A., Cilentia, L., D’Adamoa, R., Fabbrocinia, A., Guob, W., and Huangc, L. (2018). Dissolved organic matter dynamics in Mediterranean lagoons: the relationship between DOC and CDOM. Mar. Chem. 202, 37–48. doi: 10.1016/j.marchem.2018.02.003
Stahlberg, C., Bastviken, D., Svensson, B. H., and Rahm, L. (2006). Mineralisation of organic matter in coastal sediments at different frequency and duration of resuspension. Estuar. Coast. Shelf Sci. 70, 317–325. doi: 10.1016/j.ecss.2006.06.022
Stedmon, C. A., and Cory, R. M. (2014). “Biological origins and fate of fluorescent dissolved organic matter in aquatic environments,” in Aquatic Organic Matter Fluorescence, eds P. G. Coble, J. Lead, A. Baker, D. M. Reynolds, and R. G. M. Spencer (New York, NY: Cambridge University Press), 278–299.
Stedmon, C. A., and Markager, S. (2005). Tracing the production and degradation of autochthonous fractions of dissolved organic matter using fluorescence analysis. Limnol. Oceanogr. 50, 1415–1426. doi: 10.4319/lo.2005.50.5.1415
Stubbins, A., Spencer, R. G. M., Chen, H., Hatcher, P. G., Mopper, K., Hernes, P. J., et al. (2010). Illuminated darkness: molecular signatures of Congo River dissolved organic matter and its photo- chemical alteration as revealed by ultrahigh precision mass spectrometry. Limnol. Oceanogr. 55, 1467–1477. doi: 10.4319/lo.2010.55.4.1467
Suksomjit, M., Nagao, S., Ichimi, K., Yamada, T., and Tada, K. (2009). Variation of dissolved organic matter and fluorescence characteristics before, during and after phytoplankton bloom. J. Oceanogr. 65, 835–846. doi: 10.1007/s10872-009-0069-x
Swan, C. M., Nelson, N. B., and Siegel, D. A. (2012). The effect of surface irradiance on the absorption spectrum of chromophoric dissolved organic matter in the global ocean. Deep Sea Res. Pt. I 63, 52–64. doi: 10.1016/j.dsr.2012.01.008
Tadini, A., Nicolodelli, G., Senesi, G., Ishida, D., Montes, C., Lucas, Y., et al. (2018). Soil organic matter in podzol horizons of the Amazon region: Humification, recalcitrance, and dating. Sci. Total Environ. 61, 160–167. doi: 10.1016/j.scitotenv.2017.09.068
Tedetti, M., Cuet, P., Guigue, C., and Goutx, M. (2011). Characterization of dissolved organic matter in a coral reef ecosystem subjected to anthropogenic pressures (La Réunion Island, Indian Ocean) using multi-dimensional fluorescence spectroscopy. Sci. Total Environ. 409, 2198–2210. doi: 10.1016/j.scitotenv.2011.01.058
Tedetti, M., Marie, L., Röttgers, R., Rodier, M., Van Wambeke, F., Helias, S., et al. (2016). Evolution of dissolved and particulate chromophoric materials during the VAHINE mesocosm experiment in the New Caledonian coral lagoon (south-west Pacific). Biogeosciences 13, 3283–3303. doi: 10.5194/bg-13-3283-2016
Tedetti, M., and Sempéré, R. (2006). Penetration of ultraviolet radiation in the marine environment. A Review. Photochem. Photobiol. 82, 389–397. doi: 10.1562/2005-11-09-IR-733
Tenorio, M., Dupouy, C., Rodier, M., and Neveux, J. (2018). Trichodesmium and other filamentous cyanobacteria in New Caledonian waters (South West Tropical Pacific) during an El Niño episode. Aquat. Microb. Ecol. 81, 219–241. doi: 10.3354/ame01873
Tenório, M. M. B., LeBorgne, R., Rodier, M., and Neveux, J. (2005). The impact of terrigeneous inputs on the Bay of Ouinne (New Caledonia) phytoplankton communities: a spectrofluorometric and microscopic approach. Estuar. Coast. Shelf Sci. 64, 531–545. doi: 10.1016/j.ecss.2005.02.030
Thingstad, T. F., and Hagstrøm, Å, and Rassoulzadegan, F. (1997). Export of degradable DOC from oligotrophic surface waters: caused by a malfunctioning microbial loop? Limnol. Oceanogr. 42, 398–404. doi: 10.4319/lo.1997.42.2.0398
Torréton, J.-P., Rochelle-Newall, E., Pringault, O., Jacquet, S., Faure, V., and Briand, E. (2010). Variability of primary and bacterial production in a coral reef lagoon (New Caledonia). Mar. Pollut. Bull. 61, 335–348. doi: 10.1016/j.marpolbul.2010.06.019
Trescases, J. J. (1975). L’évolution géochimique supergène des roches ultrabasiques en zone tropicale: formation des gisements nickelifères de Nouvelle-Calédonie. Sci. Nat. 78:278.
Van Heukelem, L., and Thomas, C. S. (2001). Computer-assisted high-performance liquid chromatography method development with applications to the isolation and analysis of phytoplankton pigments. J. Chromatogr. 910, 31–49. doi: 10.1016/s0378-4347(00)00603-4
Vantrepotte, V., Danhiez, F.-P., Loisel, H., Ouillon, S., Mériaux, X., Cauvin, A., et al. (2015). CDOM-DOC relationship in contrasted coastal waters: implication for DOC retrieval from ocean color remote sensing observation. Opt. Exp. 33, 11–22. doi: 10.1364/OE.23.000033
Yamashita, Y., Fichot, C. G., Shen, Y., Jaffé, R., and Benner, R. (2015). Linkages among fluorescent dissolved organic matter, dissolved amino acids and lignin-derived phenols in a river-influenced ocean margin. Front. Mar. Sci. 2:92. doi: 10.3389/fmars.2015.00092
Yamashita, Y., Jaffé, R., Maie, N., and Tanoue, E. (2008). Assessing the dynamics of dissolved organic matter (DOM) in coastal environments by excitation emission matrix fluorescence and parallel factor analysis (EEM-PARAFAC). Limnol. Oceanogr. 53, 1900–1908. doi: 10.4319/lo.2008.53.5.1900
Yamashita, Y., and Tanoue, E. (2003). Chemical characterization of protein-like fluorophores in DOM in relation to aromatic amino acids. Mar. Chem. 82, 255–271. doi: 10.1016/S0304-4203(03)00073-2
Wang, Y. F., Zhang, X. Y., Zhang, X., Meng, Q. J., Gao, F. J., and Zhang, Y. (2017). Characterization of spectral responses of dissolved organic matter (DOM) for atrazine binding during the sorption process onto black soil. Chemosphere 180, 531–539. doi: 10.1016/j.chemosphere.2017.04.063
Zhang, Y. L., Liu, X. H., Wang, M., and Qin, B. (2013). Organic geochemistry compositional differences of chromophoric dissolved organic matter derived from phytoplankton and macrophytes. Org. Geochem. 55, 26–37. doi: 10.1016/j.orggeochem.2012.11.007
Zhang, Y., Van Dijk, M., Liu, M., Zhu, G., and Qin, B. Q. (2009). The contribution of phytoplankton degradation to chromophoric dissolved organic matter (CDOM) in eutrophic shallow lakes: field and experimental evidence. Water Res. 43, 4685–4697. doi: 10.1016/j.watres.2009.07.024
Keywords: chromophoric dissolved organic matter, fluorescence, New Caledonia, Tropical Pacific, lagoons, bio-optics, phytoplankton, rivers
Citation: Dupouy C, Röttgers R, Tedetti M, Frouin R, Lantoine F, Rodier M, Martias C and Goutx M (2020) Impact of Contrasted Weather Conditions on CDOM Absorption/Fluorescence and Biogeochemistry in the Eastern Lagoon of New Caledonia. Front. Earth Sci. 8:54. doi: 10.3389/feart.2020.00054
Received: 31 May 2019; Accepted: 13 February 2020;
Published: 20 March 2020.
Edited by:
Luiz Drude Lacerda, Federal University of Ceará, BrazilReviewed by:
Eurico D’Sa, Louisiana State University, United StatesPiotr Kowalczuk, Institute of Oceanology (PAN), Poland
Copyright © 2020 Dupouy, Röttgers, Tedetti, Frouin, Lantoine, Rodier, Martias and Goutx. This is an open-access article distributed under the terms of the Creative Commons Attribution License (CC BY). The use, distribution or reproduction in other forums is permitted, provided the original author(s) and the copyright owner(s) are credited and that the original publication in this journal is cited, in accordance with accepted academic practice. No use, distribution or reproduction is permitted which does not comply with these terms.
*Correspondence: Cécile Dupouy, Y2VjaWxlLmR1cG91eUBpcmQuZnI=; Y2VjaWxlLmR1cG91eUBtaW8ub3N1cHl0aGVhcy5mcg==