 Ruili Huang*
 Menghang Xia
 Dac-Trung NguyenTongan ZhaoSrilatha SakamuruJinghua ZhaoSampada A. Shahane
 Anna RossoshekAnton Simeonov
- Division of Pre-clinical Innovation, National Center for Advancing Translational Sciences, National Institutes of Health, Rockville, MD, USA
Tens of thousands of chemicals with poorly understood biological properties are released into the environment each day. High-throughput screening (HTS) is potentially a more efficient and cost-effective alternative to traditional toxicity tests. Using HTS, one can profile chemicals for potential adverse effects and prioritize a manageable number for more in-depth testing. Importantly, it can provide clues to mechanism of toxicity. The Tox21 program has generated >50 million quantitative high-throughput screening (qHTS) data points. A library of several thousands of compounds, including environmental chemicals and drugs, is screened against a panel of nuclear receptor (NR) and stress response (SR) pathway assays. The National Center for Advancing Translational Sciences (NCATS) has organized an international data challenge in order to “crowd-source” data and build predictive toxicity models. This Challenge asks a “crowd” of researchers to use these data to elucidate the extent to which the interference of biochemical and cellular pathways by compounds can be inferred from chemical structure data. The data generated against the Tox21 library served as the training set for this modeling Challenge. The competition attracted participants from 18 different countries to develop computational models aimed at better predicting chemical toxicity. The winning models from nearly 400 model submissions all achieved >80% accuracy. Several models exceeded 90% accuracy, which was measured by area under the receiver operating characteristic curve (AUC-ROC). Combining the winning models with the knowledge already gained from Tox21 screening data are expected to improve the community's ability to prioritize novel chemicals with respect to potential human health concern.
Introduction
Humans are exposed to many different chemicals during the course of their lifetimes through various sources including food, household cleaning products, and medicines. In some cases, these chemicals can be toxic. In fact, more than 30% of promising pharmaceuticals have failed in human clinical trials because they were found to be toxic despite promising pre-clinical studies in animal models (Kola and Landis, 2004). Creating rapid and efficient methods for assessing chemical toxicity has the potential to improve how scientists evaluate environmental chemicals, develop new medicines, and even foster decisions made by regulatory agencies on whether or not these chemicals should be made available. More than 80,000 chemical compounds are registered for use in the U.S., and for 95% of them, there is no data on human exposure to inform society about their effects on health (Judson et al., 2009). The use of in silico approaches, such as quantitative structure-activity relationship (QSAR) models that infer biological activity from chemical structure similarity, is a viable alternative to fill in the gap where experimental data is lacking (Muster et al., 2008; Vedani and Smiesko, 2009). These models could be applied to all the chemicals of environmental concern and obtain an estimate on their toxicity potential in a matter of hours of computational time. Chemicals estimated to have a high potential for toxicity, which would be a much smaller number, could be prioritized for experimental evaluation and validation. In addition, these models could also identify structural features of a chemical that are responsible for its toxic activity, which could serve as structural alerts for toxicity (Sanderson and Earnshaw, 1991; Saiakhov and Klopman, 2008). Combining these computational models with existing experimental data will make chemical prioritization more time and cost efficient.
The U.S. Tox21 program (NRC, 2007; Collins et al., 2008; Kavlock et al., 2009; Tice et al., 2013), a collaboration between the National Institute of Environmental Health Sciences (NIEHS)/National Toxicology Program (NTP), the U.S. Environmental Protection Agency's (EPA) National Center for Computational Toxicology (NCCT), the National Institutes of Health (NIH) National Center for Advancing Translational Sciences (NCATS), and the U.S. Food and Drug Administration (FDA), is aimed at developing better toxicity assessment methods. The goal is to quickly and efficiently test whether certain chemicals have the potential to disrupt processes in the human body that may lead to adverse health effects. The Tox21 consortium leverages its partners' resources and expertise to predict more effectively how a collection of ~10,000 compounds (referred to as Tox21 10K library) composed of environmental chemicals and approved drugs will affect human health and the environment. The Tox21 10K library has been tested in a quantitative high-throughput screening (qHTS) format against a panel of nuclear receptor (NR) (Huang et al., 2011, 2014; Hsu et al., 2014; Chen et al., 2015) and stress response (SR) pathway assays (Attene-Ramos et al., 2015; Nishihara et al., 2016), producing over 50 million data points to date (PubChem, 2013b). These data can serve as a knowledge-base to correlate chemical structures to their biological activities to develop QSAR models. To encourage the mining and usage of these data now publicly available, NCATS launched the Tox21 Data Challenge 20141, the goal of which was to “crowdsource” data analysis by independent researchers to reveal how well they can predict compounds' interference in cellular and biochemical pathways resulting in potential toxicity by using only chemical structure data. The Challenge's computational models could become part of the decision-making tools for government agencies in determining which environmental chemicals and drugs are of the greatest potential concern to human health.
Here, we describe the Challenge and provide an overall summary of the results. Data from 12 assays were selected based on data quality and public interests for this Challenge (Table 1). The Challenge was divided into subchallenges. In subchallenges 1–12, participants were asked to model compound activity for each one of the 12 assays. In subchallenges 13 and 14, participants were asked to model all NR pathway assays (NR Panel Challenge) and all SR pathway assays (SR Panel Challenge). In the final subchallenge, 15 (Grand Challenge), participants were asked to build models for all 12 assays. The Tox21 10K dataset was used for model training. Data generated on part of the LOPAC1280 (Library of Pharmacologically Active Compounds) collection was used for testing. For final model evaluation and scoring, a new set of compounds provided by the EPA, for which no experimental data were available at the time of the Challenge, was screened against the 12 assays. This new set of data together with the rest of the LOPAC data was used to evaluate the final model submissions. The Challenge was launched on July 16, 2014 and closed for scoring on November 14, 2014. Participants were encouraged to enter the competition as teams. One winning team with the best predictive model was selected for each subchallenge, and the winners were announced on January 26, 2015. One hundred and twenty five participants representing 18 different countries registered for the Challenge (Figure 1). Three hundred and seventy eight model submissions from 40 teams were received for final evaluation (Figure 1).
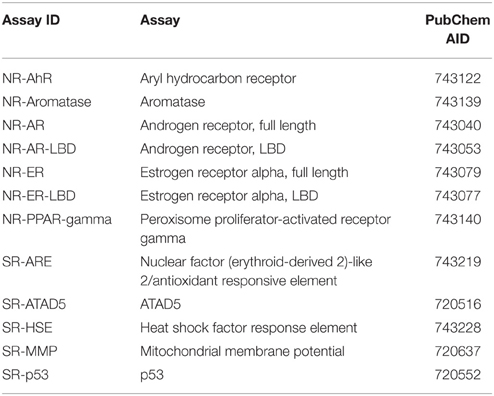
Table 1. Tox21 assays used in subchallenges.
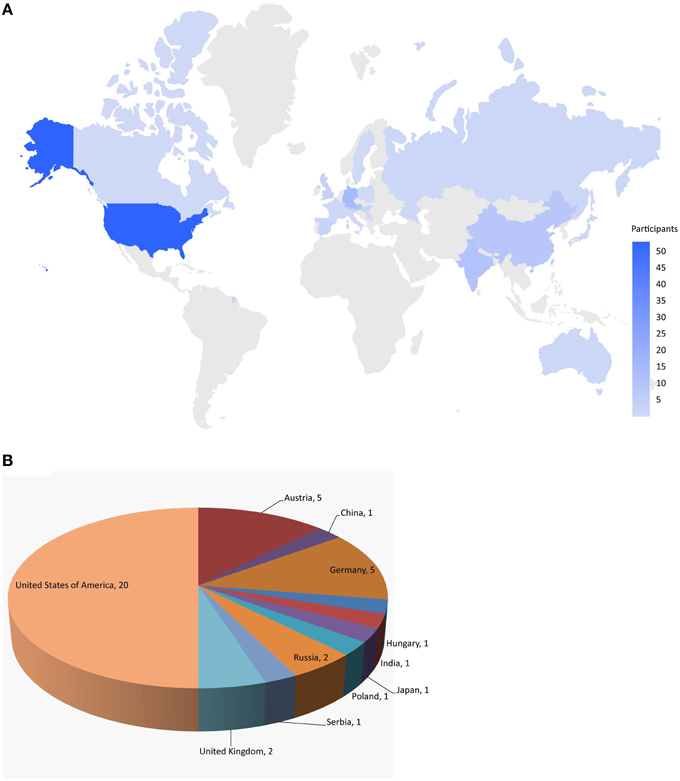
Figure 1. Worldwide challenge participation. (A) Distribution of individuals registered for the challenge. (B) Distribution of teams that submitted models for final evaluation.
Methods
The qHTS data generated on the Tox21 10K compound collection are publicly available (PubChem, 2013a,b). The 12 assays were selected based on data quality, active rate, and toxicological relevance for the Tox21 Challenge and their PubChem assay IDs (AIDs) are listed in Table 1. All of the compounds in the Tox21 10K collection went through analytical quality control (QC) to test for their purity and identity. The samples that failed QC were excluded from the training set for the Challenge. Based on the concentration response data, each compound in each assay was assigned one of three possible activity outcomes: active, inactive, and inconclusive (Huang et al., 2014; Attene-Ramos et al., 2015). The compounds that showed inconclusive activity in all 12 assays were filtered out, thus leaving 8043 samples for the training set. The LOPAC1280 collection (Sigma-Aldrich) contained 1280 compounds, 688 of which overlapped with the Tox21 10K compounds. The non-overlapping 592 LOPAC compounds were randomly split into two sets of equal size, with 296 compounds in each set. One set was provided to the Challenge participants for model testing and the other was held back for final evaluation. An additional set of 345 compounds, for which no experimental data was available at the time of the Challenge, was provided by the EPA as an extension to the Tox21 10K collection. The training, test, and final evaluation sets appeared to cover similar chemical structure spaces as shown by the 3D plots generated using principal components 1–3 generated from the 729-bit ChemoTyper2 fingerprints (Supplementary Figure 1). The chemical structures of these compounds were provided to the Challenge participants to generate activity predictions. While in parallel, these compounds were also screened against the 12 assays to generate experimental data. The experimental screens were finished at the same time as the final model submission was closed. These newly generated assay data together with the 296 LOPAC compounds (641 compounds total) were used as the final evaluation set to score and rank the model submissions to determine the winners. All datasets were posted online3 for registered participants to download, which are now open to the public.
Challenge participants were asked to provide an estimate of the probability of a chemical being active in an assay as well as an active/inactive call. The performance of the model was evaluated by the area under the Receiver Operating Characteristic (ROC) curve (AUC-ROC) using the activity estimates produced by the model. The ROC curve is a plot of sensitivity [TP/(TP+FN)] vs. (1-specificity [TN/(TN+FP)]) (Zweig and Campbell, 1993), where TP = true positive (number of active compounds also predicted as active), FP = false positive (number of inactive compounds predicted as active), TN = true negative (number of inactive compounds also predicted as inactive), and FN = false negative (number of active compounds predicted as inactive). A perfect model would have an AUC-ROC of 1 and an AUC-ROC of 0.5 indicates a random classifier. In cases where there was a tie between the AUC-ROC scores from two teams, the balanced accuracy (BA = (specificity + sensitivity)/2) calculated based on the active/inactive calls was used to determine the final ranking. Teams were expected to provide a prediction on the activity of every compound in the final evaluation set. Missing predictions were counted as false positive or false negative in the scoring process. Teams were asked, in addition, to provide a description of the prediction method they used, which should be embodied in a set of algorithms and a software system, for the Challenge organizers to directly use to verify the results. Challenge rules and scoring criteria were also posted online4, where registered Challenge participants were able to upload their model predictions and method descriptions.
Consensus Modeling
A consensus model (Eduati et al., 2015) was built for each assay based on all the submitted models for that assay, such that the probability of a chemical being active in an assay is determined by combining predictions made by all individual models. Each individual model is also weighed by its predictive performance on the final evaluation set, as measured by the AUC-ROC score, such that better performing models would contribute more to the consensus prediction. Specifically, for the consensus model, the probability C of chemical i being active is calculated as follows:
where n is the total number of models that provided predictions for chemical i, Pj is the predicted probability of chemical i being active by model j, and wj is the weight of model j, which is the AUC-ROC score on the final evaluation set obtained by model j. Ci is thus the consensus prediction of the activity of chemical i in an assay. The performances of the consensus models are evaluated by generating the AUC-ROC scores on the final evaluation set using these consensus probabilities as predictors.
Results and Discussion
Challenge Participation
The training dataset was made available to the Challenge participants at the time of the Challenge launch in July 2014. The test dataset was provided in early August 2014, when a Leaderboard was also created on the Challenge website for teams to submit their predictions on the test set. Teams were allowed to train and test their models using the Leaderboard until October 2014, at which point the Leaderboard was closed, the test dataset was released to the participants to test and improve models on their own, and the Challenge began to accept model submissions for final evaluation. Fifty-three teams participated in the Challenge by submitting a model either at the testing stage or for final evaluation. Final model submission was closed in November 2014 when the scoring started. Teams were allowed an additional month to submit their method descriptions. Final model performance scores and ranking were made available to all teams who submitted a model for final evaluation on the Challenge website in January 2015. The top ranking teams and their scores were posted on the Challenge website5 and the winning teams (Table 2) were announced on the NCATS website, January 26, 20156. For the final model evaluation, we received 378 model submissions from 40 teams (Figure 1), averaging 32 models per assay/subchallenge.
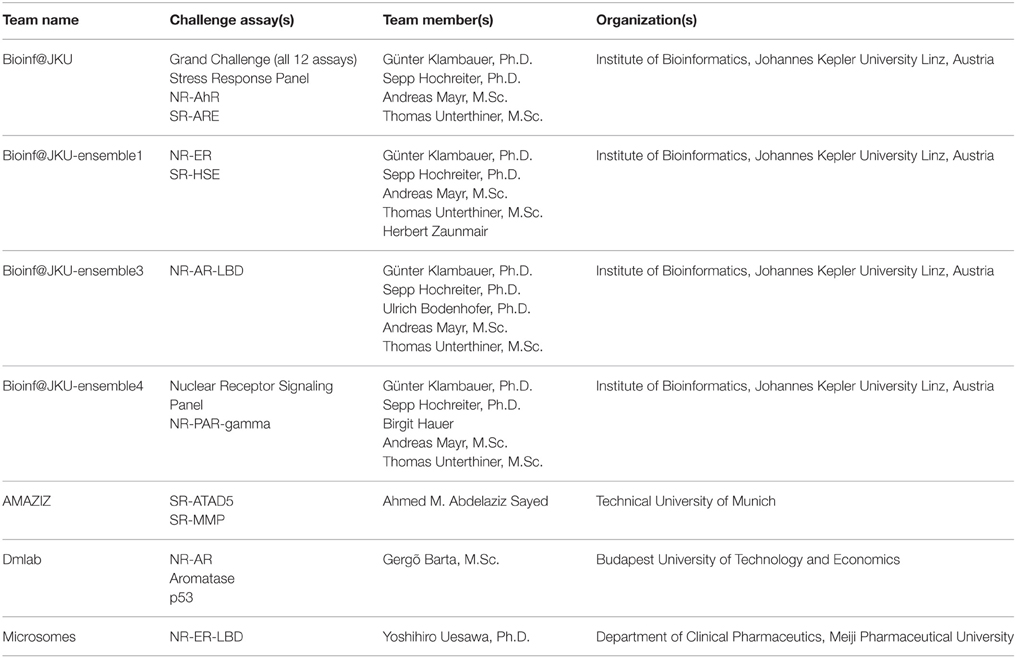
Table 2. Tox21 challenge winners.
Model Performance
The performances of the submitted models measured by AUC-ROC and BA are shown in Figure 2. All winning models performed well with AUC-ROC scores ranging from 0.81 to 0.95 (1 is the perfect score) and BAs ranging from 0.68 to 0.90. The BA values were found generally lower than the AUC-ROC scores because the teams were asked to decide on their own the most appropriate cutoffs to make the active/inactive calls based on their training and testing results. This task tested the contestant's ability to select the right cutoff using the ROC. If the optimal cutoff was selected, the BA should have been very close to the AUC-ROC value.
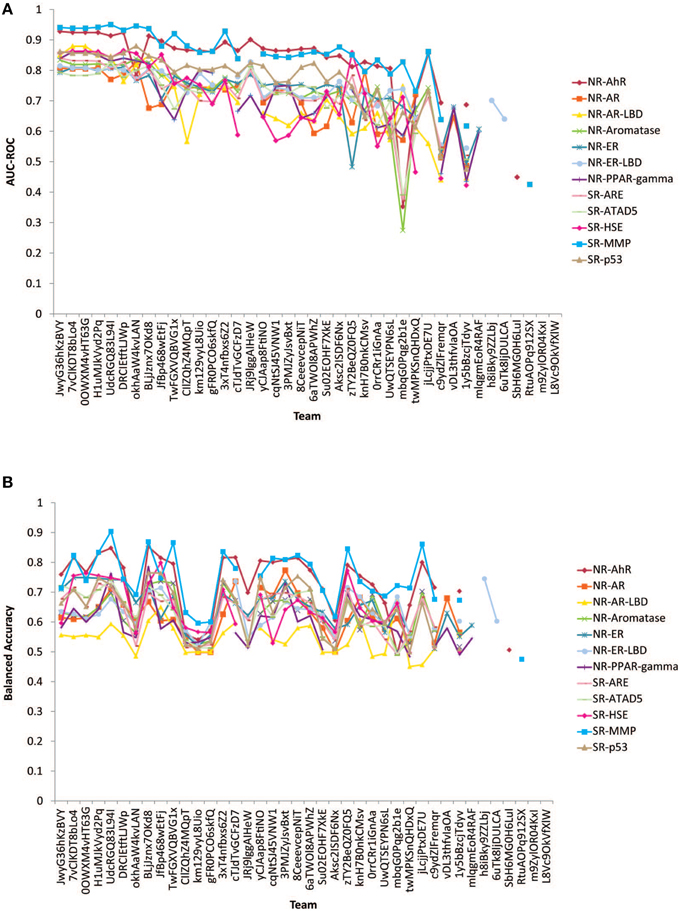
Figure 2. Performances of models received for the 12 subchallenges for final evaluation. (A) Measured by AUC-ROC (B) Measured by balanced accuracy.
Subchallenges SR-MMP and NR-AhR received the best performing models with the best AUC-ROC scores >0.9 and average AUC-ROC scores >0.8. The models received for the other subchallenges were comparable on average, with the NR-AR and NR-AR-LBD models achieving the lowest average performance scores (~0.7). A common confounding factor that affected model performance was data quality. We checked the reproducibility of the training and the final evaluation datasets against the model performances (Figure 3). All datasets used for this Challenge were found to be of high quality with >90% reproducibility. No correlation was found between data reproducibility and the average AUC-ROC score per subchallenge, as all datasets were highly reproducible and the best performing models were already reaching the level of assay precision.
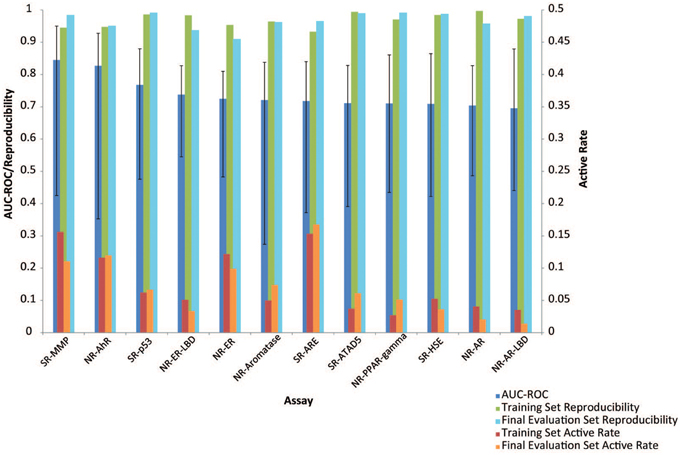
Figure 3. Factors influencing model performance (displayed as mean AUC-ROC ± standard deviation). Assays that had higher active rates received better models. No correlation was found between data reproducibility and model performance because all assays were highly reproducible.
Active rate or data balance is another common factor that affects model performance. Models built on less balanced data or assays with lower active rates (e.g., < 5%) are generally of lower quality. There are different computational approaches to balance data and enhance model performance, but if the number of actives is too low, the information that can be retrieved from the active chemical structures that the model is trained on will be limited, nonetheless. Active rate was taken into consideration when selecting assays for the Challenge such that assays with extremely low active rates (e.g., < 2%) were excluded. The active rates of the assays used in the Challenge were compared against the model performances as well (Figure 3), and a positive correlation was found between the two (r = 0.63, p = 0.03), i.e., models built for assays with higher active rates tend to perform better. For example, the assays with the best performing models, SR-MMP and NR-AhR, had >10% active rates, whereas the NR-AR assays that received the lowest average model performances had < 5% actives.
Consensus Modeling—Wisdom of the Crowd
The goal of this Challenge was to rely on the wisdom of the crowd to identify high quality models that could aid chemical toxicity assessment, and previous challenges have shown that aggregation of predictions, which leverage the collective insight of all participants, can provide a more robust estimate than any individual model (Marbach et al., 2012; Eduati et al., 2015). We generated consensus models by aggregating the individual model predictions and tested the performance of the models on the final evaluation set. The consensus models performed on a par with the winning models (Figure 4). We tried a few different aggregation approaches. When we averaged all individual model predictions to produce the consensus prediction, the consensus model performed better than 86% of the individual models for each subchallenge, on average. We then weighed the predictions from each individual model by their AUC-ROC score, such that the better performing models would contribute more to the consensus prediction. This approach improved the performance of the consensus models by outperforming 87% of the individual models. To further reduce the impact of poor performing individual models, we only included the top performing models (AUC-ROC > 0.8) from each subchallenge. In this case, the consensus model performed better than 96% of the individual models for each subchallenge. For 6 out of the 12 subchallenges, the consensus model outperformed the winning model. Interestingly, even though weighing all individual predictions equally (including the worst individual models) resulted in less than optimal consensus models, the consensus models still outperformed the individual models 86% of the time, portraying the wisdom of the crowd.
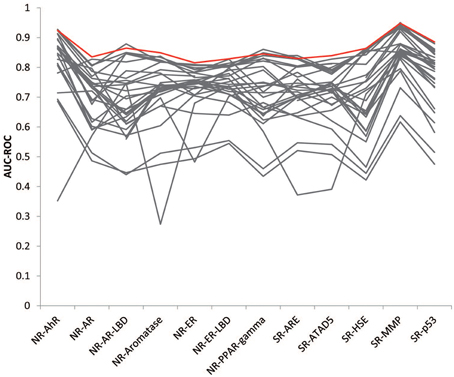
Figure 4. Wisdom of the crowd. The best consensus models (colored in red) outperformed 96% of the individual models (colored in gray) on average and half of the winning models.
In addition, we checked the compounds that were frequently predicted correctly or incorrectly by teams, and calculated a correct prediction rate for each compound in the final evaluation set. We then looked at the activity outcome distribution of each compound in the 12 assays used in the Challenge. In each assay, there were often a number of compounds for which no conclusive activity call could be made. Some compounds showed inconclusive activity in more assays than others. Based on this information, we also calculated an inconclusive rate for each compound in the final evaluation set. When the two parameters were compared, we found a strong negative correlation between the correct prediction rate and the inconclusive rate of compounds (r = −0.75, p < 10−20). Inclusive outcomes were excluded when evaluating model performances, but the compounds that tend to produce inconclusive outcomes still appeared to be less predictable than compounds for which the activity was often clear. This observation suggests that there might be certain characteristics of the frequent inconclusive compounds that make them “unpredictable” and outliers/violators of the structure-dictates-activity rule. These compounds and their assay activities will be examined in more detail in a follow up study. Nevertheless, this type of information/insight could only be learned through a crowdsource exercise like this Challenge.
Methods used by Winning Teams
A wide range of chemical descriptors and/or fingerprints, and machine learning algorithms were employed by the winning teams, including both public tools and commercial or custom in-house software. The sources of chemical descriptors included MOE (Chemical Computing Group Inc., Montreal, Canada), ChemAxon (ChemAxon LLC., Cambridge, MA), Dragon (Talete SRL, Milan, Italy), PaDel (Yap, 2011), RDKit7, PubChem fingerprint8, GSFrag (Tetko et al., 2005), ISIDA fragments (Ruggiu et al., 2010), ESTATE indices (Hall and Kier, 1995), AlogPS (Tetko and Tanchuk, 2002), CDK (Steinbeck et al., 2003), inductive descriptors (Cherkasov, 2005), Adriana.Code (Molecular Networks GmbH, Erlangen, Germany), QNPR (Thormann et al., 2007), MERA, and MerSy (Bartashevich et al., 2002), to list a few. Examples of modeling algorithms included Random Forest (Breiman, 2001), deep neural networks (Schmidhuber, 2014), support vector machines (SVM) (Cortes and Vapnik, 1995), Elastic Nets (Zou and Hastie, 2005), Gradient Boosting Decision Trees (Friedman, 1999), Extra Trees (Geurts et al., 2006), associative neural networks (Tetko, 2008), and k-Nearest Neighbors (Altman, 1992). SVM appeared to be a popular algorithm choice among the winning teams. The winners commonly used multiple descriptor types and applied feature selection to select the most relevant descriptors, employed multiple modeling algorithms, and applied consensus models to make the final predictions. In addition to what the Challenge provided, the Grand Challenge winner also used outside data, such as data from literature and public databases including PubChem and ChEMBL (Gaulton et al., 2012).
Conclusions
The Tox21 Data Challenge produced high quality winning models, thus confirming the ability of computational approaches to provide meaningful predictions of toxicity responses in terms of pathway disruption upon environmental compound exposure using (only) chemical structure information. The combination of the individual models from all participating teams produced better performing consensus models, some of which even outperformed the winning models, showing the wisdom of the crowd. The high predictive performance of these models also serves as a validation of the quality of datasets produced from the Tox21 qHTS assays, which were the basis for this Challenge. The winning models will be made publicly available so that they can be applied to other chemical sets for which no experimental data are available and used to prioritize chemicals for more in-depth toxicity evaluation. All winning models, or better performing consensus models, can be applied in parallel to establish activity/toxicity profiles for these data poor chemicals. Compared to the other challenge participants, the winning teams often applied multiple descriptor types with feature selection, and multiple modeling algorithms to reach consensus predictions. As a follow up study, we will compare in detail the methods used by different teams to determine if there are specific techniques that enabled the winning models to outperform other models.
Author Contributions
RH, MX, AR, and AS designed, developed and managed the project. SS, JZ, and SAS performed the experiments and collected data. RH designed the analyses and performed computational analyses of challenge outcomes. DN and TZ implemented the challenge website, participated in the scoring of predictions, collection of code, methods, and outcomes. RH and TZ scored the model submissions. RH managed the challenge and wrote the manuscript. All authors reviewed the manuscript.
Conflict of Interest Statement
The author declares that the research was conducted in the absence of any commercial or financial relationships that could be construed as a potential conflict of interest.
Acknowledgments
This work was supported by the Intramural Research Programs of the National Toxicology Program (Interagency agreement #Y2-ES-7020-01), National Institute of Environmental Health Sciences, the U.S. Environmental Protection Agency (Interagency Agreement #Y3-HG-7026-03), and the National Center for Advancing Translational Sciences, National Institutes of Health. We would also like to thank Samuel Michael and Carleen Klumpp-Thomas for assisting with the screens, Paul Shinn, Misha Itkin, and Danielle VanLeer for compound management, William Leister for the Tox21 10K library quality control, and Deborah Ngan and Nicole Spears for proof reading the manuscript. The views expressed in this article are those of the authors and do not necessarily reflect the statements, opinions, views, conclusions, or policies of the National Center for Advancing Translational Sciences, National Institutes of Health, or the United States government. Mention of trade names or commercial products does not constitute endorsement or recommendation for use.
Supplementary Material
The Supplementary Material for this article can be found online at: http://journal.frontiersin.org/article/10.3389/fenvs.2015.00085
Footnotes
1. ^https://tripod.nih.gov/tox21/challenge/
3. ^https://tripod.nih.gov/tox21/challenge/data.jsp
4. ^https://tripod.nih.gov/tox21/challenge/submissions.jsp
5. ^https://tripod.nih.gov/tox21/challenge/leaderboard.jsp
6. ^http://www.ncats.nih.gov/news-and-events/features/tox21-challenge.html
References
Altman, N. S. (1992). An introduction to kernel and nearest-neighbor nonparametric regression. Am. Stat. 46, 175–185.
Attene-Ramos, M. S., Huang, R., Michael, S., Witt, K. L., Richard, A., Tice, R. R., et al. (2015). Profiling of the Tox21 chemical collection for mitochondrial function to identify compounds that acutely decrease mitochondrial membrane potential. Environ. Health Perspect. 123, 49–56. doi: 10.1289/ehp.1408642
Bartashevich, E. V., Potemkin, V. A., Grishina, M. A., and Belik, A. V. (2002). A method for multiconformational modeling of the three-dimensional shape of a molecule. J. Struct. Chem. 43, 1033–1039. doi: 10.1023/A:1023611131068
Chen, S., Hsieh, J. H., Huang, R., Sakamuru, S., Hsin, L. Y., Xia, M., et al. (2015). Cell-based high-throughput screening for aromatase inhibitors in the Tox21 10K library. Toxicol. Sci. 147, 446–457. doi: 10.1093/toxsci/kfv141
Cherkasov, A. (2005). Inductive QSAR descriptors. distinguishing compounds with antibacterial activity by artificial neural networks. Int. J. Mol. Sci. 6, 63–86. doi: 10.3390/i6010063
Collins, F. S., Gray, G. M., and Bucher, J. R. (2008). Toxicology. Transforming environmental health protection. Science 319, 906–907. doi: 10.1126/science.1154619
Cortes, C., and Vapnik, V. (1995). Support-vector networks. Mach. Learn. 20, 273–297. doi: 10.1007/BF00994018
Eduati, F., Mangravite, L. M., Wang, T., Tang, H., Bare, J. C., Huang, R., et al. (2015). Prediction of human population responses to toxic compounds by a collaborative competition. Nat. Biotechnol. 33, 933–940. doi: 10.1038/nbt.3299
Friedman, J. H. (1999). Greedy function approximation: a gradient boosting machine. Available online at: http://statweb.stanford.edu/~jhf/ftp/trebst.pdf
Gaulton, A., Bellis, L. J., Bento, A. P., Chambers, J., Davies, M., Hersey, A., et al. (2012). ChEMBL: a large-scale bioactivity database for drug discovery. Nucleic Acids Res. 40, D1100–D1107. doi: 10.1093/nar/gkr777
Geurts, P., Ernst, D., and Wehenkel, L. (2006). Extremely randomized trees. Mach. Learn. 63, 3–42. doi: 10.1007/s10994-006-6226-1
Hall, L. H., and Kier, L. B. (1995). Electrotopological state indices for atom types: a novel combination of electronic, topological, and valence state information. J. Chem. Inf. Comput. Sci. 35, 1039–1045. doi: 10.1021/ci00028a014
Hsu, C. W., Zhao, J., Huang, R., Hsieh, J. H., Hamm, J., Chang, X., et al. (2014). Quantitative high-throughput profiling of environmental chemicals and drugs that modulate farnesoid X receptor. Sci. Rep. 4:6437. doi: 10.1038/srep06437
Huang, R., Sakamuru, S., Martin, M. T., Reif, D. M., Judson, R. S., Houck, K. A., et al. (2014). Profiling of the Tox21 10K compound library for agonists and antagonists of the estrogen receptor alpha signaling pathway. Sci. Rep. 4:5664. doi: 10.1038/srep05664
Huang, R., Xia, M., Cho, M. H., Sakamuru, S., Shinn, P., Houck, K. A., et al. (2011). Chemical genomics profiling of environmental chemical modulation of human nuclear receptors. Environ. Health Perspect. 119, 1142–1148. doi: 10.1289/ehp.1002952
Judson, R., Richard, A., Dix, D. J., Houck, K., Martin, M., Kavlock, R., et al. (2009). The toxicity data landscape for environmental chemicals. Environ. Health Perspect. 117, 685–695. doi: 10.1289/ehp.0800168
Kavlock, R. J., Austin, C. P., and Tice, R. R. (2009). Toxicity testing in the 21st century: implications for human health risk assessment. Risk Anal. 29, 485–487. discussion: 492–487. doi: 10.1111/j.1539-6924.2008.01168.x
Kola, I., and Landis, J. (2004). Can the pharmaceutical industry reduce attrition rates? Nat. Rev. Drug Discov. 3, 711–715. doi: 10.1038/nrd1470
Marbach, D., Costello, J. C., Kuffner, R., Vega, N. M., Prill, R. J., Camacho, D. M., et al. (2012). Wisdom of crowds for robust gene network inference. Nat. Methods 9, 796–804. doi: 10.1038/nmeth.2016
Muster, W., Breidenbach, A., Fischer, H., Kirchner, S., Müller, L., and Pähler, A. (2008). Computational toxicology in drug development. Drug Discov. Today 13, 303–310. doi: 10.1016/j.drudis.2007.12.007
Nishihara, K., Huang, R., Zhao, J., Shahane, S. A., Witt, K. L., Smith-Roe, S. L., et al. (2016). Identification of genotoxic compounds using isogenic DNA repair deficient DT40 cell lines on a quantitative high throughput screening platform. Mutagenesis 31, 69–81. doi: 10.1093/mutage/gev055
NRC (2007). Toxicity Testing in the 21st Century: A Vision and a Strategy. Washington, DC: The National Academies Press.
PubChem (2013a). Tox21 Phase II Compound Collection [Online]. Available online at: http://www.ncbi.nlm.nih.gov/pcsubstance/?term=tox21 (Accessed Dec 4, 2013).
PubChem (2013b). Tox21 Phase II Data [Online]. Available online at: http://www.ncbi.nlm.nih.gov/pcassay?term=tox21 (Accessed Nov 16, 2013).
Ruggiu, F., Marcou, G., Varnek, A., and Horvath, D. (2010). ISIDA property-labelled fragment descriptors. Mol. Inform. 29, 855–868. doi: 10.1002/minf.201000099
Saiakhov, R. D., and Klopman, G. (2008). MultiCASE expert systems and the REACH initiative. Toxicol. Mech. Methods 18, 159–175. doi: 10.1080/15376510701857460
Sanderson, D. M., and Earnshaw, C. G. (1991). Computer prediction of possible toxic action from chemical structure; the DEREK system. Hum. Exp. Toxicol. 10, 261–273. doi: 10.1177/096032719101000405
Schmidhuber, J. (2014). Deep learning in neural networks: an overview. Neural Netw. 61, 85–117. doi: 10.1016/j.neunet.2014.09.003
Steinbeck, C., Han, Y., Kuhn, S., Horlacher, O., Luttmann, E., and Willighagen, E. (2003). The chemistry development kit (CDK): an open-source Java library for chemo- and bioinformatics. J. Chem. Inf. Comput. Sci. 43, 493–500. doi: 10.1021/ci025584y
Tetko, I. V. (2008). Associative neural network. Methods Mol. Biol. 458, 185–202. doi: 10.1007/978-1-60327-101-1_10
Tetko, I. V., Gasteiger, J., Todeschini, R., Mauri, A., Livingstone, D., Ertl, P., et al. (2005). Virtual computational chemistry laboratory–design and description. J. Comput. Aided Mol. Des. 19, 453–463. doi: 10.1007/s10822-005-8694-y
Tetko, I. V., and Tanchuk, V. Y. (2002). Application of associative neural networks for prediction of lipophilicity in ALOGPS 2.1 program. J. Chem. Inf. Comput. Sci. 42, 1136–1145. doi: 10.1021/ci025515j
Thormann, M., Vidal, D., Almstetter, M., and Pons, M. (2007). Nomen est omen: quantitative prediction of molecular properties directly from IUPAC names. Open Appl. Inform. J. 1, 28–32. doi: 10.2174/1874136300701010028
Tice, R. R., Austin, C. P., Kavlock, R. J., and Bucher, J. R. (2013). Improving the human hazard characterization of chemicals: a Tox21 update. Environ. Health Perspect. 121, 756–765. doi: 10.1289/ehp.1205784
Vedani, A., and Smiesko, M. (2009). In silico toxicology in drug discovery - concepts based on three-dimensional models. Altern. Lab. Anim. 37, 477–496.
Yap, C. W. (2011). PaDEL-descriptor: an open source software to calculate molecular descriptors and fingerprints. J. Comput. Chem. 32, 1466–1474. doi: 10.1002/jcc.21707
Zou, H., and Hastie, T. (2005). Regularization and variable selection via the Elastic Net. J. R. Stat. Soc. B 67, 301–320. doi: 10.1111/j.1467-9868.2005.00503.x
Keywords: Tox21, HTS, nuclear receptor, stress response, predictive model, QSAR, in vitro assay
Citation: Huang R, Xia M, Nguyen D-T, Zhao T, Sakamuru S, Zhao J, Shahane SA, Rossoshek A and Simeonov A (2016) Tox21Challenge to Build Predictive Models of Nuclear Receptor and Stress Response Pathways as Mediated by Exposure to Environmental Chemicals and Drugs. Front. Environ. Sci. 3:85. doi: 10.3389/fenvs.2015.00085
Received: 31 August 2015; Accepted: 22 December 2015;
Published: 14 January 2016.
Edited by:
Juergen Pilz, Alpen-Adria Universitaet Klagenfurt, AustriaReviewed by:
Christina Mitsakou, King's College London, UKIjaz Hussain, Quaid-i-Azam University, Islamabad, Pakistan
Copyright © 2016 Huang, Xia, Nguyen, Zhao, Sakamuru, Zhao, Shahane, Rossoshek and Simeonov. This is an open-access article distributed under the terms of the Creative Commons Attribution License (CC BY). The use, distribution or reproduction in other forums is permitted, provided the original author(s) or licensor are credited and that the original publication in this journal is cited, in accordance with accepted academic practice. No use, distribution or reproduction is permitted which does not comply with these terms.
*Correspondence: Ruili Huang, aHVhbmdydUBtYWlsLm5paC5nb3Y=