 Temesgen Alemneh
 Benjamin F. Zaitchik2
 Belay Simane
 Argaw Ambelu
- 1Department of Environmental Health Sciences and Technology, Jimma University, Jimma, Ethiopia
- 2Department of Earth and Planetary Sciences, Johns Hopkins University, Baltimore, MD, United States
- 3Center for Environment and Development, College of Development Studies, Addis Ababa University, Addis Ababa, Ethiopia
The Blue Nile Highlands of Ethiopia are a densely populated, predominantly rural region dominated by smallholder crop-livestock mixed farming systems. Population growth, coupled with low productivity, have long posed a threat to natural forest ecosystems in the region, as trees have been removed for fuelwood and to clear area for grazing or crop production. In recent years, however, there has been a trend to replace cropland with eucalyptus plantations. This change has major implications for the hydrology, soils, and agricultural economy of the region. This study examines changes in tree cover for a highland area at the center of the Blue Nile Highlands. Landsat imagery from 1986 to 2017 is applied to characterize changing tree cover patterns over space and time. We find that total tree cover in this highland region has shifted dramatically over the past 30 years. Between 1987 and 1999 there was dramatic loss of tree cover, particularly in areas of natural vegetation at high and low elevation. This period coincided with the fall of the Derg government and the transition to the current political system. In the period since 1999 there has been an increase in tree cover, with rapid gains in recent years. This increase has taken two distinct forms: regrowth in previously forested areas, due in part to active conservation measures, and the establishment of eucalyptus plantations in mid-elevation zones. The ecological and economic implications of these two types of tree cover—protected forest vs. woodlot plantations—are quite distinct, with plantation forestry providing biomass energy at a cost to food production and water resources. Mapping cropland conversion to eucalyptus in recent years makes it possible to quantify the net impacts that this trend has had on local production of energy and food, and to estimate implications for water consumption. Effective monitoring of these changes is important for the ongoing development and implementation of effective land use policy in the region.
Introduction
Under natural conditions, the Highlands of Ethiopia are a forest-dominated region. The relatively cool and mostly wet conditions support mixed forests of Choke mountain such as Asta (Erica arborea), Hypericum revolutum, giant lobiloa (Lobelia synchopetala), lady's mantle (Alchemilla humania), and Guassa grass (Festuca spp.) (Teferi et al., 2010). Indeed, although the highlands have been home to farming and grazing activities for many centuries, it has been estimated that at the turn of the Twentieth century the highland zone was still highly forested, with a cover of ~40% (Britenbach, 1961). Today that coverage is greatly reduced, as population growth coupled with low productivity agriculture have driven rapid deforestation for fuel wood, creation of new grazing lands, and expanded croplands. Loss of forest cover has had significant implications for biodiversity, has accelerated land degradation, and has fundamentally altered watershed hydrology (Zeleke and Hurni, 2001). This is a significant concern for local livelihoods and for national resource management. In the Western Highlands, which form the headwaters of the Blue Nile River, the impact that forest cover change has on hydrology and erosion takes on international significance. Historically, erosion from the Ethiopian Highlands has been credited with delivering fertile sediment to Sudan and Egypt, but it has also been to blame for filling reservoirs and clogging irrigation channels in Sudan (Eggen et al., 2016). In coming years, as Ethiopia completes the Grand Ethiopian Renaissance Dam (GERD) on the Blue Nile, sediment from the highlands will no longer reach downstream countries in large volumes, but it may affect operations and project lifespan of the GERD or of complementary dams planned further upstream.
Interestingly, the loss of tree cover in the Western Highlands that characterized much of the Twentieth century is believed to have reversed in recent years (Strategic Environmental and Social Assessment, 2017). This has occurred for two reasons. First, increased awareness of ecosystem services and the dangers of land degradation have led to conservation efforts in some recently deforested areas (Zeleke and Hurni, 2001). Second, there has been a rapid expansion of plantation forestry in favor of field crop agriculture in the past decade. These plantation forests are dominated by eucalyptus—specifically, Eucalyptus globules and Eucalyptus camaldulensis—with Acacia diccurence also common in some areas. Ecologically and hydrologically, these single species plantations are entirely different from natural forest cover, and the loss of active cropland and possible contribution of eucalyptus plantations to loss of soil fertility has been met with alarm in some government reports and scientific studies (Kidanu et al., 2005; Amhara National Regional State Bureau of Agriculture, 2017; Jaleta et al., 2017; Strategic Environmental and Social Assessment, 2017). At the same time, plantation forests, and particularly eucalyptus plantations, offer substantial economic benefit in local communities. The trees are fast growing, easy to cultivate (Christina et al., 2011; Qiao et al., 2016), provide land tenure security, are at low risk of failing, and provide higher direct economic returns than most traditionally cultivated field crops (Bekele, 2015; Jaleta et al., 2017). They also provide some wood for local use. Though the primary markets for eucalyptus charcoal and scaffolding are urban and international—the trade between western Ethiopia and Sudan is significant—a fraction of woody material is used locally for fuel and other applications (Strategic Environmental and Social Assessment, 2017).
While government officials and some researchers have begun to investigate this eucalyptus dynamic (Mengist, 2011; Bekele, 2015; Jaleta et al., 2016, 2017; Strategic Environmental and Social Assessment, 2017), there is a general lack of information on the extent of the process and conservation efforts in natural forest zones have been described but their impacts have not been quantified. Analyses of the social dynamics and environmental impacts associated with these changes require consistent information on tree cover change at landscape scale, and on the implications that these changes have for interconnected energy, water, and food resources in the region. Here we apply satellite imagery to investigate change in tree cover over the period 1986–2017. The analysis is stratified by agroecological zone in order to isolate changes in historically forested regions from change in areas where tree plantations are replacing cropland. This analysis provides a quantitative estimate of changing tree cover pattern in the Blue Nile Highlands that we can associate with policy and economic trends over the past three decades. We then apply estimates of plantation biomass production, eucalyptus water consumption, and average crop yields in the region to convert maps of tree cover change to first order estimates of policy-relevant impacts on energy, water and food resources. These data can provide a foundation for analysis and modeling efforts to understand the economic, hydrological, and ecological impacts of tree cover change in the region.
Materials and Methods
Study Area
The Blue Nile Highlands are located in western Ethiopia, centered around 10°N, and 36°E (Figure 1). The region is characterized by hilly and sometimes steeply dissected terrain. We performed our study in the East Gojjam Zone, a region that is representative of Blue Nile Highland conditions and that includes a large elevation gradient: 800–4,200 meter above sea level (m.a.s.l.), from the gorge of Blue Nile River to the top of Choke Mountain. The rainy season coincides with the northern shift of inter-tropical convergence zone (ITCZ) in boreal summer, with most rainfall falling between May and September (Taye et al., 2011; Zaitchik et al., 2012). The distribution of rainfall across the Blue Nile Highlands shows variability associated with topographic gradients. The western slopes tends to be wetter than the eastern slopes, and in our study region the strongest precipitation gradients follow elevation: wettest conditions are at high elevation and the driest conditions are in the Blue Nile gorge (Simane et al., 2013). These precipitation contrasts combined with the elevation temperature gradient produce a sequence of distinct agroecological zones (Figure 1; Table 1). These zones are characterized by different ecologies and crop mixes, with implications for livelihood strategies and climate vulnerabilities (Simane et al., 2013).
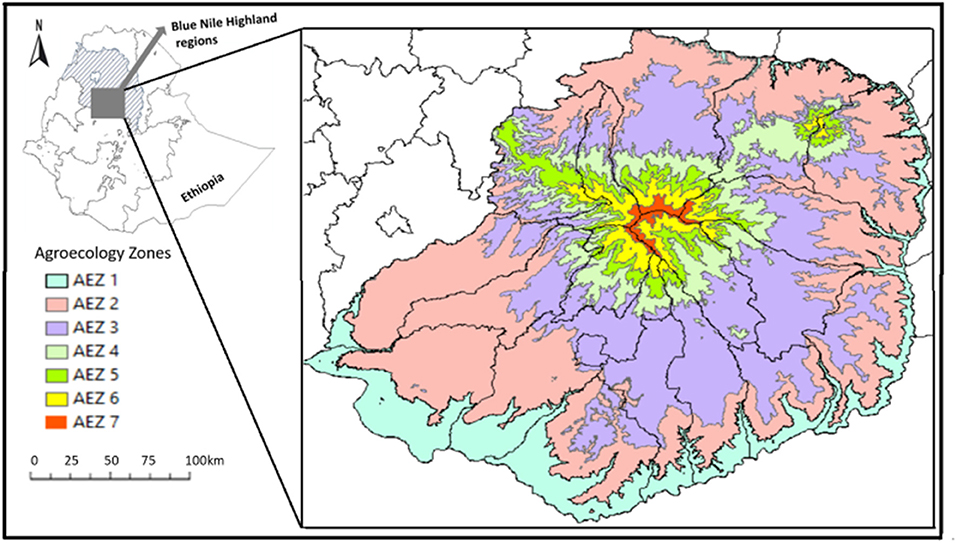
Figure 1. Agroecologial zones of Choke Mountain, in the Blue Nile Highlands. Zones are shown for East Gojjam zone, which defines the spatial extent of this study. Black lines are woreda boundaries.
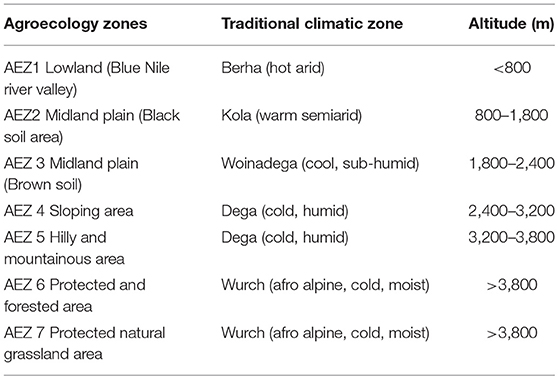
Table 1. Traditional classification of agroecological zone in the Choke Mountain wahtershed (modified from Simane et al., 2013), (AEZ, agroecology zones).
Agriculturally, East Gojjam is dominated by smallholder crop-livestock mixed farming systems (Zaitchik et al., 2012; Eggen et al., 2016). The types of crops cultivated in the region differ as a function of agroecological zone and the soil type. For example, teff, wheat, barley, sorghum, maize and potato are among the most widely cultivated crops for home consumption and for market purposes, with sorghum and maize dominant at low elevations, teff and wheat found predominantly in midland agroecosystems, and barley and potato found in high elevation agroecozones. Importantly, the highest elevation zones—agroecological zones 6 and 7—were relatively undisturbed forest and grasslands until recent decades (Simane et al., 2013). Only in the 1980s did land and population pressure lead to significant encroachment on these zones for grazing, collection of fuel wood, and in some cases production of barley or potato (Figures 2A,B) (Simane et al., 2013). Similarly, in the lowest elevation zone (agroecozone 1) there was, until recent decades, reasonable scrub and tree cover in the steep and dissected terrain of the gorge. As population pressure increased in the last decades of the Twentieth century, these wooded areas were encroached upon in an effort to create new, albeit extremely marginal, cropland.
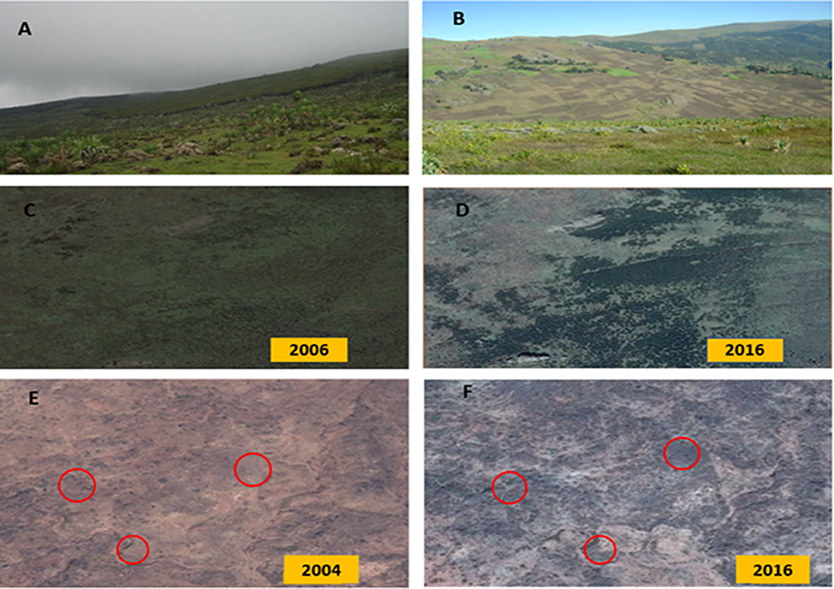
Figure 2. (A,B) example pictures by (Temesgen Alemneh) showing tree cover clearance in agreoco zones 6 and 7 for grazing (A) and cropping (B); (C,D) satellite images of agroeco zone 7, showing some reestablishment of natural tree cover in the last decade; (E,F) satellite images of agroeco zone 1, showing return of natural tree cover. Satellite images are from Google Earth/Digital Globe (C,E) and Google Earth/CNES/Airbus (D,F). (Red circles indicated in E and F are used to draw out areas of tree cover returns between 2004 and 2016).
In the midland agroecozones 2–5, slopes are reasonably gentle, soils are more fertile, and there is neither the crop-limiting cold of the highlands nor the frequent droughts found in the gorge. In these areas subsistence agriculture is reasonably productive, and it has long been the favored land use. However, due to a combination of factors that will be discussed later in the paper, recent years have seen a dramatic increase in eucalyptus plantations (Figures 3, 4). Rapid changes in tree cover in these zones, then, is almost exclusively due to plantation forestry, while changes in agroecozones 1, 6, and 7 are more closely related to the removal or reestablishment of natural tree stands.
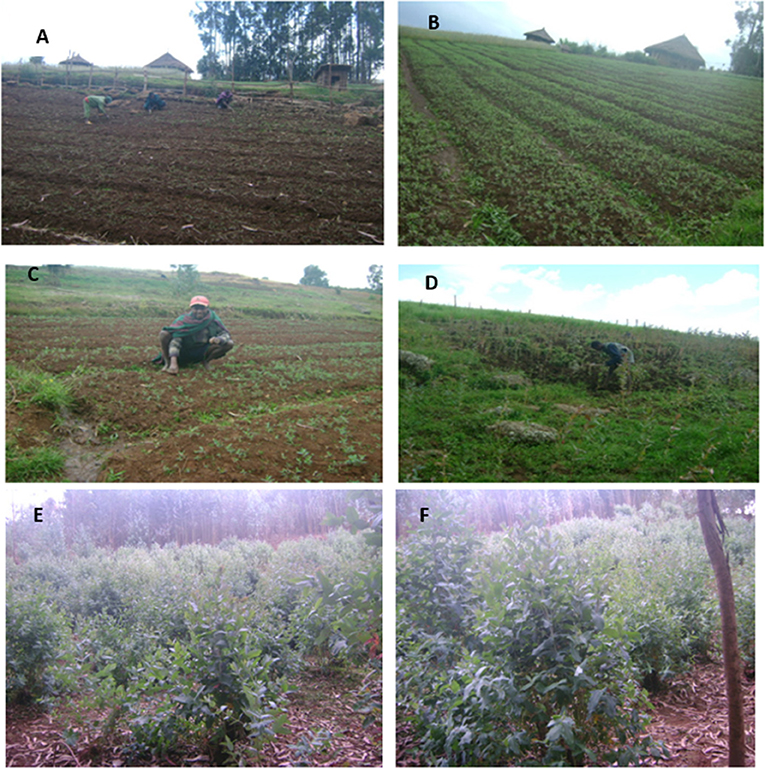
Figure 3. Pictures by Temesgen Alemneh: (A–D) examples of first rotation cultivation of eucalyptus on croplands, and (E,F) the second rotation growing eucalyptus after harvesting.
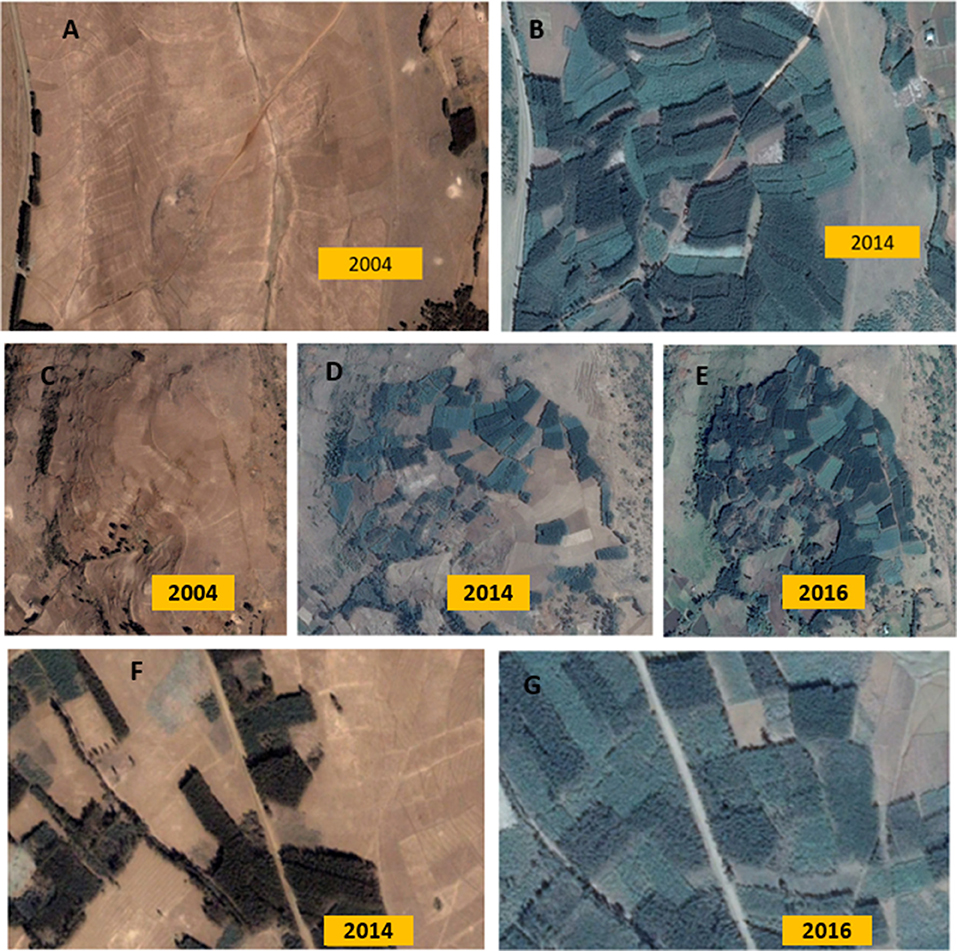
Figure 4. High resolution images highlight rapid expansion of eucalyptus plantations in agroecology zone 5 (A–E) (between 2004 and 2014, and 2004, 2014, and 2016) and in agroecology zone 4 (F–G) at the expense of croplands. All satellite images are from Google Earth/Digital Globe (A,C), and Google Earth/CNES/Airbus (B,D–G).
Data
The objectives of this study are to quantify and characterize changes in tree cover over the past several decades and evaluate the observed land cover changes in terms of food, energy and water resources. Since a long time record is required, and since forest plantations in Ethiopia can be less than a hectare in size, we used Landsat images which are 30 m resolution continuously from 1986 to the present (Landsat-4 through Landsat-8). The spatial resolution and multispectral character of Landsat imagery is well suited for agriculture and other environmental monitoring studies (Cohen and Goward, 2004).
For this study, images from Landsat-5 Thematic Mapper (TM) and Landsat-8 Operational Land Imager (OLI) provided the best seasonally matched images of the study region over the broadest possible time period (Table 2). We selected dry season images from the period after field crops are harvested (late January and February), in order to maximize the availability of cloud free images and to minimize confusion between young trees and active field crops. At this time of year, trees are some of the only live and actively growing vegetation in the study area, making them relatively easy to detect.
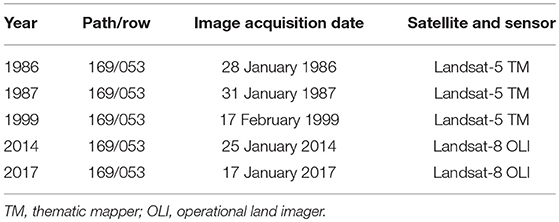
Table 2. Cloud free Landsat satellite images acquired over the Blue Nile highlands; East Gojjam, Ethiopia.
A limitation of our method is that we do not directly distinguish plantation forest from natural forest. At Landsat spectral and spatial resolution there were no distinguishing characteristics that made it possible to do this reliably across the entire landscape. Instead, we classify all tree cover as a single class and interpret the results on the basis of landscape context; i.e., natural forest is found in steep or protected lands at low and high elevation, while there is essentially no natural forest in the midland agricultural region beyond a few protected areas around churches that have not changed over time. For this reason, we were able to interpret midland tree cover change (agroecozones 2-5) as a function of plantations, where tree cover change on steep slopes of the gorge (agroecozone 1) and in the protected area on top of the mountain (agroecozones 6–7) was understood to be natural tree cover change. Further, we do not attempt to distinguish between tree species in plantation forestry. It is known that the majority of plantations in the study region are monocrop eucalyptus, but other orchard and woodlot species are present and are included in our tree cover results.
Image Processing
Supervised classification was performed on each selected Landsat image using the Maximum Likelihood classifier in ESRI ArcMap 10.5. All reflective bands were used as input to the classification. Training regions were manually digitized, with classes identified through visual inspection of the landsat images, cross-checked with Google Earth for recent images, and the authors' extensive experience living and working in the region. The following classes were defined as input to the maximum likelihood classifier: (1) tree cover; (2) cropland; (3) grazing land; (4) other vegetation (such as bush and shrubs); (5) water body; and (6) settlement and towns. Training regions, and the subsequent classification results, were limited to East Gojjam Zone, which offers a convenient boundary for the analysis. The accuracy of the classification approach was evaluated for the 2017 image using 265 points and comparing the classification result to the land cover class as determined from high resolution Google Earth imagery from the same time period. As our focus is on comparing tree covered to non-tree areas, we selected approximately 50% of points from tree covered areas (as identified in Google Earth) and 50% from non-tree areas. User's accuracy (error of commission), Producer's Accuracy (error of omission), Overall Accuracy, and the Kappa Coefficient were calculated using standard methods (Jensen, 1996). Kappa Coefficient is a measure of the difference between the observed agreement between two maps and the agreement that might be attained by chance (Campbell, 2007), and is calculated as:
It was not possible to evaluate the classification of the earlier images due to lack of availability of high resolution imagery, so we adopt our 2017 accuracy assessment as indicative of the performance of our classification approach.
Subsequent to classification, all classes were collapsed into one “tree” class and one “non-tree” class. These classes were applied in order to map and quantify changes in tree cover over the period of study. We did not attempt to distinguish between natural forest and plantation forest in the classification stage, owing to the optical diversity of both types of forest as a function of age, siting, and species. Instead, we distinguish between plantation and natural forest by landscape context and land use history, as described in results and discussion. All analyses were performed for East Gojjam as a whole and also stratified by agroecological zone.
Results and Discussion
Accuracy of Land Cover Classification
We categorized the land uses of the Blue Nile Highland regions into trees, croplands, grasslands, other vegetation, water bodies and settlement and towns. These categories capture the major land covers of the study region, and they were applied consistently across all images to allow for analysis of land use dynamics over time (Fagan et al., 2015) in different agroecological zones of the region.
Accuracy assessment of the 2017 classification demonstrates adequate performance. In an evaluation of the classification for 265 points with known land cover identified in high resolution Google Earth images from within 1 year of the Landsat acquisition date, we found overall accuracy of 92.5% for tree vs. non-tree (91.3% for all classes) and Kappa coefficient of 0.85 for tree vs. non-tree—i.e., 85% improvement over chance agreement. With respect to tree vs. non-tree classes, the User's Accuracy for trees was 88.0% and the Producer's Accuracy was 97.7%. The slightly lower User's Accuracy is a result of terrain shadows being incorrectly classified as forest. Full results are presented in Table 3.
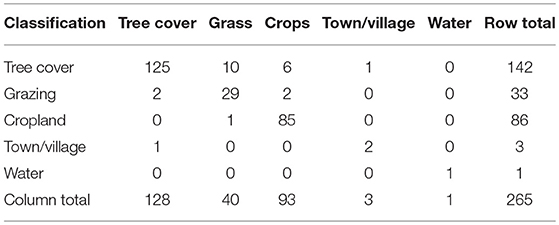
Table 3. Error matrices of classification map of landsat imagery from Blue Nile highland regions.
Tree Cover Change Between 1987 and 2017
Our analysis of tree cover change through time begins in 1986. This date represents the oldest seasonally appropriate image we could obtain from the Landsat 4–8 mission series, and it is also a historically appropriate time to establish a baseline for recent land cover change dynamics. In 1986 the derg dictatorship had been in power for 12 years but was beginning to weaken, with government reorganization occurring in 1987 and the regime ultimately falling in 1991, after an extended civil war. The derg had overseen a large tree plantation program throughout the country, including the use of both exotic species (e.g., eucalyptus) and indigenous plants (e.g., Hagenia abyssinica). The program was implemented at the household level in each homestead area, in stream buffer zones—i.e., along river banks to prevent erosion—and in open areas selected by the community for common use. This activity significantly contributed to the expansion of tree cover in the region. In this sense, 1986 represents a potential high tree stand period within recent Ethiopian history.
Indeed, our classification of Landsat imagery from 1986 and 1987 indicate that East Gojjam Zone was 6–8% covered by trees—including both natural forest and plantation—at this high stand period. Tree cover was greatest in AEZ 7 (56–57%; Table 4), the natural forest and grassland area at the top of the mountain, but was also relatively high in the steep, erosion-prone slopes of the Blue Nile gorge (AEZ 1; 6–11%) and in the high elevation, low productivity AEZ 6 (25–27%), located just downslope of the AEZ 7 mountain top (Figure 5). Classification results are relatively stable between 1986 and 1987 for most AEZ, as would be expected, but there is a significant difference in AES 1 between the 2 years that is likely an artifact of illumination rather than an actual large-scale change.
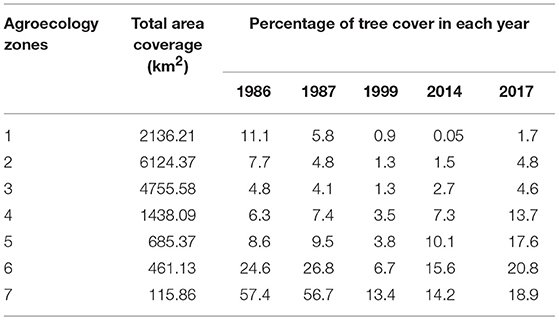
Table 4. The total area coverage of each agroecology zones and percentage of the tree cover in each year.
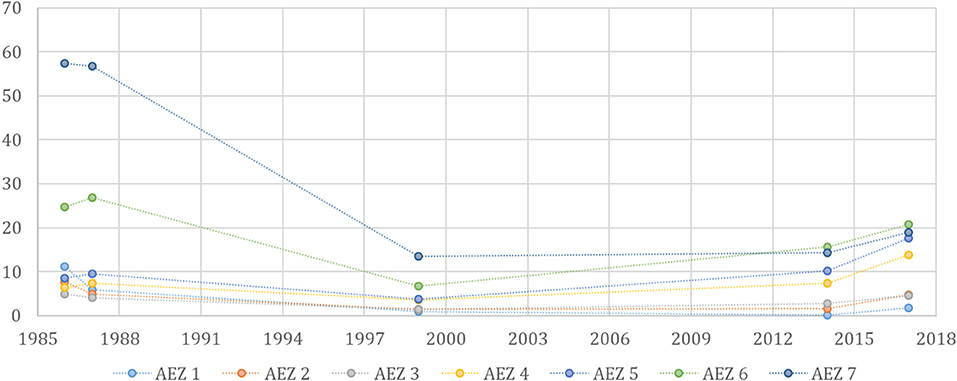
Figure 5. Percent tree cover in each AEZ in the 1986, 1987, 1999, 2014, and 2017 Landsat classifications.
Subsequent to the fall of the derg in 1991 there was an extended transition period as the new government consolidated power and put land policies in place. This period, represented in our analysis by the difference between the 1987 and 1999 images, was associated with land grabbing for crops and grazing, encroachment of agriculture to higher elevation, and a weakening of communal land management arrangements. These dynamics are dramatically evident in our classification of tree covered areas, as the 1999 image is the low point in our analysis for tree cover across all AEZ. Overall tree cover dropped to 2%, with major losses in the ecologically sensitive and/or erosion prone portions of AEZ 1, 6, and 7. The loss of natural forest cover in high elevation zones is particularly apparent (Figure 6), as natural tree cover was lost to fuelwood harvesting, conversion for grazing land, and in some cases low productivity cropping. Tree cover was also reduced in midland AEZ, primarily due to the loss of plantation and buffer strip tree planting enforced by the derg. We do note that a lack of appropriate Landsat imagery in this period limits our confidence in the quantitative details of our classification result. Only one cloud free dry season image could be obtained for this historic period, and it is possible that illumination effects or other image-specific conditions could introduce error. Nevertheless, site-specific examinations like Figure 6 confirm that the general patterns of tree loss are realistic.
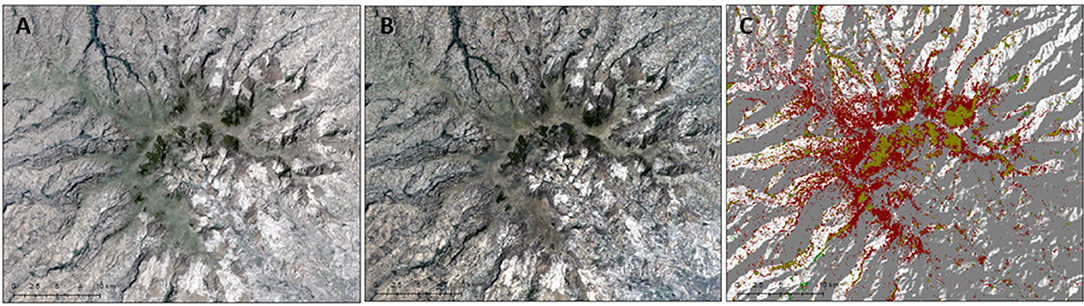
Figure 6. True color Landsat composites for the summit of Choke Mountain in (A) 1987 and (B) 1999. (C) Shows classified change in tree covered area between the two images: red is tree cover lost between 1987 and 1999, green is tree cover gained, and yellow is persistent tree cover. Gray shading in (C) is hill shade.
The period between 1999 and 2014 saw relatively small rates of change in tree cover. Some gain was observed in AEZ 6, as government watershed protection policies were established and enforced. Tree cover also increased somewhat in AEZ 4 and AEZ 5, as the trend toward plantation forestry, primarily eucalyptus, began to take shape in the 2000's (Bewket, 2005). With these exceptions, however, total tree cover was mostly static over this 15 year period, particularly relative to the rapid changes seen before and after. Overall, tree cover in 2014 was 3%.
In contrast to the relative stasis between 1999 and 2014, changes in tree cover between 2014 and 2017 are dramatic. Overall tree cover increased by 3% from 2014 to 2017, but what is most notable is the location of this increase. The change is in some part attributable to forest recovery at the top of the mountain, and there is a small amount of regrowth in AEZ 1 that could be attributed to new conservation efforts or to transient differences in climate (or image quality) between the 2 years. But in the mid-elevation AEZ there is a significant increase in tree cover, most evident in AEZ 4 and AEZ 5. In 2017, tree cover in these two AEZ is higher than it was at any other period in our analysis, including the 1986 and 1987 baseline images. The reason for this change is almost entirely attributable to a shift from mixed crop and livestock agriculture to plantation forestry, dominated by eucalyptus (e.g., Figure 7).
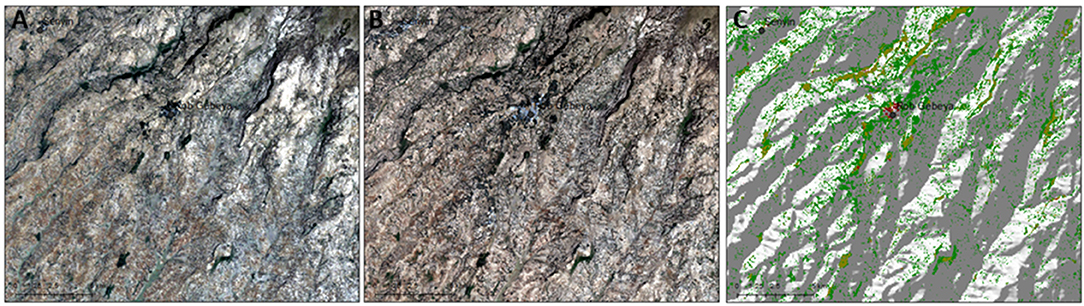
Figure 7. True color Landsat composites for a region centered on AEZ 4 and 5 in (A) 1999 and (B) 2017. (C) Shows classified change in tree covered area between the two images: red is tree cover lost between 1999 and 2017, green is tree cover gained, and yellow is persistent tree cover. Gray shading in (C) is hill shade.
Implications for Food, Energy, and Water Resources
The quantitative tree cover area estimates presented above are subject to uncertainties related to classification method, Landsat resolution, and the limited availability of cloud-free imagery in the middle period of analysis. Nevertheless, the general trends of deforestation at high and low elevations in the first period of analysis (1986 to 1999) followed by stabilization (1999 to 2014) and a combination of forest recovery due to conservation and a rapid expansion in plantations in recent years (2014 to 2017) appears to be consistent across the analysis, supported by image evaluation with Google Earth, and in line with known land cover change patterns in the study region.
Recovery of forest cover at the mountain top (AEZ 7, AEZ 6) (Figures 2 C,D) and in the steep Blue Nile gorge (AEZ 1) (Figures 2E,F) provides multiple benefits: reduced erosion, higher river flow in the dry season, and enhanced biodiversity, among others (Yitebitu et al., 2010). Expansion of tree plantations, however, has been controversial. While tree crops—and in particular rapid-growing eucalyptus species—offer significant economic and land security benefits to the farmer, they come at the cost of lost food production, increased water consumption, and, for eucalyptus, allelopathy that can prevent returning a plot to field crops and that acts to reduce yields on neighboring plots (Kidanu et al., 2005; Mesfin and Wubalem, 2014). Here we consider the total impact that conversion of crop and pasture land to tree plantation has on energy, food and water in the study region. The numbers are not intended to be exact, but rather to provide general order of magnitude considerations to put the current eucalyptus boom in context. We assume that all plantations are eucalyptus. This is not entirely true, but it is true for the large majority of plots. The energy implications of eucalyptus production are significant. Rural households in Ethiopia depend heavily on biomass energy in the form of fuelwood, charcoal, cow dung and crop residues. These traditional biomass energy sources account for about 90% of total primary energy use in Ethiopia (Mekonnen and Köhlin, 2008), and about 99% of rural areas rely on biomass as their primary cooking fuel. Biomass is mainly used for cooking and to a minor extent for heating and lighting, and demand for biomass energy has increased over recent decades as population has increased (Chanie et al., 2013; Bekele, 2015). This demand is, in part, responsible for loss of natural forests and for declining soil fertility. Plantation forestry has the potential to address this demand. While eucalyptus plantations in the study region currently serve multiple markets, including domestic timber needs and charcoal trade to Sudan, the presence of plantation forests does address local energy need to some extent. Studies of eucalyptus growing regions in Ethiopia have indicated that on the order of half of the harvested eucalyptus biomass is used locally for energy and other uses (e.g., Barreiro and Tomé, 2012; Berhanu et al., 2017).
The productivity of eucalyptus plantations varies widely as a function of environment, species, management, and stand age. In Ethiopia, rotations of eucalyptus are usually between 5 and 25 years (Selamyihun, 2004). The average annual rate of biomass production increases with time in this age range (Pohjonen and Pukkala, 1990). Realized biomass yields differ dramatically by site and management approach, and a wide range of estimates can be found in the literature. Here we use the estimates of Pohjonen and Pukkala (1990), which indicate that for an average site and a coppicing cycle of 5–10 years, eucalyptus stands yielded an average of approximately 30 m3 ha−1 yr−1, averaged across the harvesting cycle. For a Eucalyptus globulus wood density of 545 kg m−3 (Barotto et al., 2017), this means a wet wood yield of ~16,000 kg ha−1 yr−1. Using a rough conversion of 10 MJ kg−1 for freshly harvested wood, this is equivalent to 160 GJ ha−1 yr−1.
Our estimates of tree cover change indicate that between 2014 and 2017 14,280 ha of tree cover was added to AEZ 4 and 5. Assuming that this change was entirely associated with forest plantation, and recognizing that almost all forest plantations in these elevation zones are eucalyptus (Bewket, 2005), we calculate a total energy production of 2.3·106 GJ yr−1. Rural households in the study area use a combination of fuelwood, dung, and crop residues for biomass energy, but fuelwood is the most common and represents about two-thirds of total biomass energy use (Bewket, 2005; Federal Democratic Republic of Ethiopa, 2012)-. Average annual household wood consumption is estimated to be about 511.3 kg (5,113 MJ) (Bewket, 2005), such that the increase in forest plantation area observed between 2014 and 2017 could meet the fuelwood needs of nearly 225,000 households if 50% of the material was used locally for energy. As a point of comparison, the Ethiopian Central Statistics Agency (2007) census recorded a total of 506,520 households in East Gojjam. The population is estimated to have increased substantially in the decade since this census, but the first order conclusion is that expansion of forestry plantation on this scale can have a transformative impact on the biomass energy economy of the region.
This gain in energy production comes at a direct cost of land lost for food production. There is the direct loss of land converted to eucalyptus plus additional loss due to allelopathy and shading affecting neighboring fields (Dessie and Erkossa, 2011). Considering only the direct effect, the average yields of grain crops in AEZ 4 and AEZ 5 are on the order of 3,200 and 3,100 kg ha−1 for wheat, respectively, and 2,100 and 2,300 kg ha−1 for barley (Eggen et al., submitted). These are two of the major staple grains in these AEZ (Simane et al., 2013). Engido (Avena spp.) and potato are also important, but we do not have consistent yield estimates for those crops. Maize and tef are planted to lesser extent (Simane et al., 2013, Eggen et al., submitted). To make a simplified assumption, if all of the land converted to plantation forestry between 2014 and 2017 came from productive crop lands previously planted in wheat or barley, then these AEZ lost a total of 4.5·107 kg of wheat production or 3.1·107 kg of barley production. The average rural household consumes 447 kg of staple grain per year (Worku et al., 2017), so this total loss translates to the grain needs of on the order of 70,000 to 100,000 households. This clearly indicates that the trend in eucalyptus production has a potentially significant impact on future food security of the region (Amhara National Regional State Bureau of Agriculture, 2017).
Eucalyptus also draws scrutiny because of its high transpiration rate, which leads to significant water consumption. Eucalyptus roots are capable of reaching shallow ground water, meaning that mature stands can impact water reserves that are typically untapped by crops and grasses. One estimate from Ethiopia holds that eucalyptus plantations use 785 liters of water to produce 1 kg of biomass (Davidson, 1989). Using our biomass production estimate of ~16,000 kg ha−1 yr−1, this translates into a consumption of 12,560 m3 water per hectare per year, or 1,256 mm m−2 yr−1. This rate of water consumption is on the same order as the total annual rainfall in these AEZ, and is substantially higher than estimated evapotranspiration from crops and grasslands in the area (Zaitchik et al., 2012). This raises a concern for the viability of local streams and, considering the study region's location in the headwaters of the Blue Nile basin, potentially has broader implications for water resources in a contentious transboundary basin. The impact would not appear to be overwhelming relative to the total water balance of the basin: the Blue Nile has an average annual flow on the order of 50 billion cubic meters per year. Even if eucalyptus doubles the rate of evapotranspiration relative to other land uses, the conversion 14,280 ha to eucalyptus in AEZ 4 and 5 would only result in an evapotranspiration increase of 90 million cubic meters per year. Extrapolated over the entire Blue Nile basin this could become meaningful, but it will not drastically change total downstream water availability. The impact on local streams and the character of the hydrological regime is likely to be more relevant when considering impacts on locally-available water (Christina et al., 2011). Potential benefits of increased water consumption include reduction in local waterlogging and possible reduction of certain types of saturation-induced flooding (Jaleta et al., 2017).
Conclusion
The Blue Nile highlands of Ethiopia are a region of subsistence, low input agriculture and high population growth. These characteristics make for significant land pressures, including the conversion of marginal lands and natural forest and grasslands into cropped agriculture. This trend has been noted by numerous sources and in many parts of the Ethiopian highlands (e.g., FAO, 2010). Our analysis of tree cover in Landsat imagery captures this trend for the first portion of our analysis period: between 1987 and 1999 there was substantial loss of forest cover in steep lands and high elevation areas in East Gojjam. However, in recent years deforestation has slowed due to enforcement of watershed protection policies (Federal Democratic Republic of Ethiopa, 2018). At the same time, tree cover in the form of plantation forestry—particularly of eucalyptus—has increased rapidly on land that was previously used for crops or communal pasture. Combined, these trends have led to an increase in total tree cover in both high or marginal areas (AEZ 1, 6, and 7) and in fertile agricultural areas (especially AEZ 4 and 5). The analysis presented here relies on a relatively small number of Landsat images, and is therefore subject to some uncertainty in the quantitative estimates of tree cover change. The general patterns, however, are robust across images early in the period (1986 and 1987) and at the end of the period (2014 and 2017), and they align with general understanding of tree cover trend in the region (e.g., Amhara National Regional State Bureau of Agriculture, 2017).
The expansion of eucalyptus plantations has been controversial. While these plantations currently offer significant economic benefit to farmers (Matthies and Karimov, 2014; Bekele, 2015) and help to meet timber and fuel wood demand, the practice removes land from food crop production, consumes large amounts of water, and, due to allelopathy and shading, reduces crop yield for neighboring farms. Studies and reports on the phenomenon come to divergent conclusions about the long-term desirability of the trend (Demel, 2000; Mesfin and Wubalem, 2014). We do not attempt a socioeconomic analysis of the eucalyptus boom, nor do we make any conclusions about the net benefit or cost of eucalyptus conversions in this region. Instead, we attempt to provide some context for the observed land cover change in terms of basic resources of energy, food, and water. Using area change estimates from our own analysis together with published estimates (Kidanu et al., 2005; Mesfin and Wubalem, 2014; Jaleta et al., 2017) of eucalyptus wood yield, water use, and energy content, we find that eucalyptus plantations on the scale observed in the study region have the potential to offset on the order of 99% of rural household energy use, averaged across East Gojjam. While we do not know whether eucalyptus is actually being used in this way, it is helpful to consider how the practice might contribute to energy needs, simply to assess its value in terms of basic human needs. We also find that the total water consumption is significant relative to the local water balance, in that eucalyptus in the Ethiopian highlands have been estimated to have annual water consumption on the same order as annual precipitation in the study area. The impact on main stem Blue Nile flows might also be detectable, but we estimate that it is small relative to the total flow of the river, or relative to the volume of evaporation observed at downstream open water reservoirs along the Nile. Finally, using observed yield data from the AEZ most affected by the eucalyptus boom, we estimate that grain production directly lost to land conversion into forest plantation is on the order of 3.1·107 kg of barley production or 4.5·107 kg of wheat production, which is enough to meet the grain needs of 70,000 to 100,000 households under current consumption patterns. These diverse impacts on food, energy, and water are relevant to any policy intended to discourage or encourage further eucalyptus conversions in the Ethiopian highlands.
Author Contributions
TA and BZ conceived of the study. TA implemented all analyses, performed literature review, and wrote the manuscript. BZ supported the analysis and edited the manuscript. BS provided expertise in agricultural systems of the region and policy implications of plantation forestry. AA provided manuscript review and environmental health perspectives.
Funding
This research project was supported by the Belmont Forum NILE-NEXUS project through NSF grant ICER-1624335.
Conflict of Interest Statement
The authors declare that the research was conducted in the absence of any commercial or financial relationships that could be construed as a potential conflict of interest.
Acknowledgments
We acknowledge Johns Hopkins University, department of Earth and Planetary Science for giving visiting scholarship including financial support to the Ph.D. candidate TA. Furthermore, we would like to forward our in-depth thanks to the Carnegie Landsat Analysis System lite (CLASlite) software package course support team for providing continuous support and giving guidelines to use the package efficiently.
References
Amhara National Regional State Bureau of Agriculture (ANRSBA) (2017). GIS and Remote Sensing Based Exotic Species Expansion Assessment Over Croplands from 1985–2016. Bahir Dar: Amhara National Regional State Bureau of Agriculture.
Barotto, A. J., Monteoliva, S., Gyenge, J., Martínez-Meier, A., Tesón, N., and Fernández, M. E. (2017). Wood density and anatomy of three Eucalyptus species: implications for hydraulic conductivity. Forest Syst. 26, 1–11. doi: 10.5424/fs/2017261-10446
Barreiro, S., and Tomé, M. (2012). Analysis of the impact of the use of eucalyptus biomass for energy on wood availability for eucalyptus forest in Portugal: a simulation study. Ecol. Soc. 17:14. doi: 10.5751/ES-04642-170214
Bekele, T. (2015). Integrated utilization of Eucalyptus globulus grown on the Ethiopian highlands and its contribution to rural livelihood : a case study of Oromia, Amhara and Southern Nations Nationalities and People's Regional State Ethiopia. Int. J. Basic Appl. Sci. 4, 80–87.
Berhanu, N. F., Debela, H. F., and Dereje, B. J. (2017). Fuel wood utilization impacts on forest resources of Gechi District, South Western Ethiopia. J. Ecol. Nat. Environ. 9, 140–150. doi: 10.5897/JENE2017.0642
Bewket, W. (2005). Biofuel consumption, household level tree planting and its implications for environmental management in the Northwestern Highlands of Ethiopia. Eastern Africa Soc. Sci. Res. Rev. 21, 19–38. doi: 10.1353/eas.2005.0002
Britenbach, F. V. (1961). Forest and woodlands of Ethiopia. Ethiopian Forestry Re-view 1. CIA, 2001.CIAeThe World Factbook Ethiopia Available online at: http://www.cia.gov/cia/
Campbell, J. B. (2007). Inrtoduction to remote sensing, 4th Edn. New York, NY: A division of Guilford Publications, Inc., 72 Spring steeet.
Chanie, T., Collick, A. S., Adgo, E., Lehmann, C. J., and Steenhuis, T. S. (2013). Eco-hyadrological impacts of Eucalyptus in the semi-humid Ethiopian highlands: the Lake Tana plain. J. Hydrol. Hydromech. 61, 21–29. doi: 10.2478/johh-2013-0004
Christina, M., Laclau, J. P., Goncalves, J. L. M., Jourdan, C., Nouvellon, Y., and Bouillet, J. P. (2011). Almost symmetrical vertical growth rates above and below ground in one of the world's most productive forests. Ecosphere 2, 1–10. doi: 10.1890/ES10-00158.1
Cohen, W. B., and Goward, S. N. (2004). Landsat's role in ecological applications of remote sensing. BioScience 54, 535–545. doi: 10.1641/0006-3568(2004)054[0535:LRIEAO]2.0.CO;2
Davidson, J. (1989). The Eucalyptus dilemma. Arguments for and against Eucalyptus planting in Ethiopia. Forestry Research Centre Seminar Note Series No. 1. Addis Ababa.
Demel, T. (2000). “Facts and experience on Eucalyptus in Ethiopia and elsewhere: ground for making wise and informed decision,” in Workshop on Eucalyptus Dilemma, 15 November 2000 (Addis Ababa).
Dessie, G., and Erkossa, T. (2011). “Eucalyptus in East Africa Socio-economic and environmental issues,” in Planted Forests and Trees Working Paper 46/E, Forest Management Team, Forest Management Division. Rome: FAO.
Eggen, M., Ozdogan, M., Zaitchik, B. F., and Simane, B. (2016). Land cover classification in complex and fragmented agricultural landscapes of the Ethiopian highlands. Remote Sens. 8:1020. doi: 10.3390/rs8121020
Ethiopian Central Statistics Agency (2007). The Population and Housing Census of Ethiopia, Amhara Region (Addis Ababa: Ethiopian Central Statistics Agency).
Fagan, M. E., DeFries, R. S., Sesnie, S. E., Arroyo-Mora, J. P., Soto, C., Singh, A., et al. (2015). Mapping species composition of forests and tree plantations in northeastern Costa Rica with an integration of hyperspectral and multitemporal landsat imagery. Remote Sens. 7, 5660–5696. doi: 10.3390/rs70505660
Federal Democratic Republic of Ethiopa (FDRE) (2012). Ethiopia's Green Economy Strategy. Addis Ababa.
Federal Democratic Republic of Ethiopa (FDRE) (2018). Forest Development Conservation and Utilization Proclamation 1065/2018. Addis Ababa
Jaleta, D., Mbilinyi, B., Mahoo, H., and Lemenih, M. (2016). Eucalyptus expansion as relieving and provocative tree in Ethiopia. J. Agri. Ecol. Res. Int. 6, 1–12. doi: 10.9734/JAERI/2016/22841
Jaleta, D., Mbilinyi, B. P., Mahoo, H. F., and Lemenih, M. (2017). Effect of Eucalyptus expansion on surface runoff in the central highlands of Ethiopia. Ecol. Process. 6, 1–8. doi: 10.1186/s13717-017-0071-y
Jensen, J. R. (1996). Introductory Digital Image Processing: A Remote Sensing Perspective, 2nd Edn. (New Jersey, NJ: Prentice-Hall, Inc).
Kidanu, S., Mamo, T., and Stroosnijder, L. (2005). Biomass production of Eucalyptus boundary plantations and their effect on crop productivity on Ethiopian highland Vertisols. Agroforestry Syst. 63, 281–290. doi: 10.1007/s10457-005-5169-z
Matthies, B. D., and Karimov, A. A. (2014). Financial drivers of land use decisions: the case of smallholder woodlots in Amhara, Ethiopia. Land Use Policy 41, 474–483. doi: 10.1016/j.landusepol.2014.06.012
Mekonnen, A., and Köhlin, G. (2008). Determinants of Household Fuel Choice in Major Cities in Ethiopia, EfD Discussion Paper, 23.
Mengist, M. (2011). Eucalyptus Plantations in the Highlands of Ethiopia Revisited : A Comparison of Soil Nutrient Status After the First Coppicing, 104.
Mesfin, A., and Wubalem, T. (2014). Eucalyptus in Ethiopia Risk or Opportunity: Ethiopian Institute of Agricultural Research. Addis Ababa. Available online at: http://www.eiar.gov.et
Pohjonen, V., and Pukkala, T. (1990). Yield models for Eucalyptus globulus fuelwood plantations in Ethiopia. Biomass 21, 129–143. doi: 10.1016/0144-4565(90)90054-N
Qiao, H., Wu, M., Shakir, M., Wang, L., Kang, J., and Niu, Z. (2016). Classification of small-scale eucalyptus plantations based on NDVI time series obtained from multiple high-resolution datasets. Remote Sens. 8, 1–20. doi: 10.3390/rs8020117
Selamyihun, K. (2004). Using Eucalyptus for Soil and Water Conservation on the Highland Vertisols of Ethiopia. Available online at: http://search.ebscohost.com/login.aspx?direct=true&db=lah&AN=20043040461&site=ehost-live
Simane, B., Zaitchik, B. F., and Ozdogan, M. (2013). Agroecosystem analysis of the choke mountain watersheds, Ethiopia. Sustainability 5, 592–616. doi: 10.3390/su5020592
Strategic Environmental and Social Assessment (SESA) (2017). For the Implementation of REDD+ in Ethiopia, March, 2017. The Federal Democratic Republic of Ethiopia Ministry of Environment, Forest and Climate Change (Addis Ababa).
Taye, M. T., Ntegeka, V., Ogiramoi, N. P., Willems, P., Leuven, U., and Division, H. (2011). Assessment of climate change impact on hydrological extremes in two source regions of the Nile River Basin. Hydrol. Earth Syst. Sci. 15, 209–222. doi: 10.5194/hess-15-209-2011
Teferi, E., Uhlenbrook, S., Bewket, W., Wenninger, J., and Simane, B. (2010). The use of remote sensing to quantify wetland loss in the Choke Mountain range, Upper Blue Nile basin, Ethiopia. Hydrol. Earth Syst. Sci. 14, 2415–2428. doi: 10.5194/hess-14-2415-2010
Worku, I. H., Dereje, M., Minten, B., and Hirvonen, K. (2017). Diet transformation in Africa: the case of Ethiopia. Agri. Econ. 48, 73–86. doi: 10.1111/agec.12387
Yitebitu, M., Eshetu, Z., and Nune, S. (2010). Ethiopian Forest Resources: Current Status and Future Management Options in View of Access to Carbon Inances. (Addis Ababa: UNDP).
Zaitchik, B. F., Simane, B., Habib, S., Anderson, M. C., Ozdogan, M., and Foltz, J. D. (2012). Building climate resilience in the Blue Nile/Abay Highlands: a role for earth system sciences. Int. J. Environ. Res. Public Health 9, 435–461. doi: 10.3390/ijerph9020435
Keywords: tropical highlands, eucalyptus globulus, agroecological zones, Blue Nile basin, tree cover changes
Citation: Alemneh T, Zaitchik BF, Simane B and Ambelu A (2019) Changing Patterns of Tree Cover in a Tropical Highland Region and Implications for Food, Energy, and Water Resources. Front. Environ. Sci. 7:1. doi: 10.3389/fenvs.2019.00001
Received: 24 September 2018; Accepted: 03 January 2019;
Published: 22 January 2019.
Edited by:
Richard George Lawford, Morgan State University, United StatesReviewed by:
Elzbieta Antczak, University of Łódz, PolandAngelina Sanderson Bellamy, Cardiff University, United Kingdom
Copyright © 2019 Alemneh, Zaitchik, Simane and Ambelu. This is an open-access article distributed under the terms of the Creative Commons Attribution License (CC BY). The use, distribution or reproduction in other forums is permitted, provided the original author(s) and the copyright owner(s) are credited and that the original publication in this journal is cited, in accordance with accepted academic practice. No use, distribution or reproduction is permitted which does not comply with these terms.
*Correspondence: Temesgen Alemneh, dHlpbWFuaTFAamh1LmVkdQ==; dGVtdS4xMjIxQGdtYWlsLmNvbQ==