 Lilian Ndungu
 Maungu Oware1
 Anastasia Wahome
 Emily Adams
- 1SERVIR-Eastern and Southern Africa, Regional Centre for Mapping Resource for Development, Nairobi, Kenya
- 2SERVIR Science Coordination Office, Huntsville, AL, United States
The Kenyan rangelands contribute significantly to the country's GDP through livestock production and tourism. With dependence on rain-fed pastures, climate variability coupled with human induced factors such as overgrazing have adversely affected the rangeland ecosystems. And while indigenous communities and conservation experts already use their knowledge of the landscape to make decisions, this information is usually localized. Earth observation imagery provides a bigger picture that can complement indigenous knowledge and improve decision making. This research leverages on data from the MODIS receiver located at the Regional Centre for Mapping of Resources for Development (RCMRD) to develop the indices for the web-based Rangelands Decision Support Tool (RDST). The tool (RDST) automates data processing and provides an easy to use interface for accessing indices for rangeland monitoring. MODIS Normalized Difference Vegetation Index (NDVI), anomalies and deviation indices are provided on the tool at decadal, monthly, and seasonal time steps. Users begin their assessments by selecting their monitoring units and an NDVI index that responds to their specific questions. These questions respond to assessing current conditions, monitoring trends and changes in vegetation, and evaluating proxies for drought conditions. The information can then be overlaid with other ancillary datasets (roads, water sources, invasive species, protected areas, place names, conflict areas, migration routes), for context. At the click of a button, the information can be downloaded as a map for further analysis or application in sub regional decision making. Information and maps generated by this tool are being used decision making tool by rangeland managers in the counties and in other management units (conservancies and ranches). Specifically, inform adjustments to existing grazing plans, managing movement of livestock from designated grazing areas in wet and dry season, monitoring the success of rehabilitation efforts and resilience of the rangeland ecosystems, monitoring drought, managing scarce water resources, and monitoring the spread of invasive species. Successful implementation and application for decision making has relied heavily on local indigenous knowledge and capacity building on use of the earth observation indices. The SERVIR project service planning engagement approach was used in engagements with stakeholders. This improved their participation in co-development of the tool and indices; and in adoption of the tools for decision making.
Introduction
Rangelands make up 80% of Kenya's land mass which is classified as arid and semi-arid. The rangelands generate 90% of the tourism revenue, host 70% of the country's livestock, and are home to ~10 million people. Approximately 75 to 85% of the population's livelihoods depends on rainfed pasture production (Government of Kenya, 2012; REGLAP, 2012).
The rangelands are under continuous threat due to climate variability, coupled with rapidly growing livestock and human populations. Extreme events are also increasing in intensity and frequency, resulting in notable decline in productivity in the rangelands due to shorter recovery time (Landmann and Dubovyk, 2014). Drought has been considered to be a major factor triggering land degradation processes especially in the rangelands. Studies have stressed the importance of drought episodes in explaining the occurrence of major degradation in some regions (Indeje et al., 2005; Vågen et al., 2014; Vicente-Serrano et al., 2015; Kyuma et al., 2016).
Degradation when not managed, leads to desertification and colonization of the degraded lands by invasive species. Between 1997 and 2000, severe degradation was estimated to have grown from 23 to 30% in Kenya (Mulinge et al., 2015). The increase in degradation in Kenya can be linked to a combination of factors such as unsustainable land use/land cover changes. Some of those, are caused by human factors such as felling of trees for charcoal and timber, overgrazing, exceeding the carrying capacity of the land and encroachment into protected areas (Mulinge et al., 2015).
Degraded lands in Kenya and especially in the North, when continually put into production, without restoration or other conservation measures, can become irreversibly unproductive, jeopardizing the livelihoods of millions of people who depend on these systems (Herrick et al., 2013; Vågen et al., 2014; Winowiecki et al., 2018). Current adaptation strategies that include shifts from purely pastoral to agro-pastoral systems have resulted in increased conflict as livestock and wildlife migration routes become closed due to changes in land ownership.
Despite these challenges, the role of the rangelands in contributing to food security in Kenya is set to grow with the changing dietary wants especially due to urbanization (Herrero et al., 2010; Silvestri et al., 2012). In developing countries, as economies grow, the dietary wants of the population are changing from cereal based to meat based, giving rise to the projected need for sustainable livestock systems to meet the needs of the population in what was termed as a “livestock revolution” (Delgado et al., 2001). For example, the total consumption of meat and milk is projected to grow by 119 and 74%, respectively by 2020 (Alexandratos and Bruinsma, 2015). The Kenyan rangelands have a diverse potential that is not fully utilized in livestock production and tourism, but also in renewable energy, natural resources, and resilient communities (Government of Kenya, 2012).
Recognizing the critical role that the rangeland plays in Kenya's economy, organized groups have been established to develop mechanisms for improving the health of the rangelands. This has led to growing investments in the rangeland's different actors. Private and donor partners have implemented resilience programs to promote rangeland conservation in the counties. The United States Agency for International Development (USAID), has been working through the Partnerships for Resilience and economic growth (PREG) and through collaborations such as RCMRD and its SERVIR East & Southern Africa project, to promote development of technologies, products and tools for decision making.
Locally, organized groups have been established to develop mechanisms for improving the health of the rangelands. These include conservancies such as the Northern Rangelands Trust (NRT) which brings together 35 community led conservancies to collectively implement initiatives for sustainable management of the rangeland ecosystems. This is achieved through efforts such as reseeding and practicing planned rotational grazing. The conservancies use emerging technologies and the indigenous knowledge of the rangelands landscape, to implement measures geared toward improving the rangelands ecosystem.
The government of Kenya also set up a Ministry for the Development of Northern Kenya and other Arid Lands (MDNKOAL) in recognition of the prolonged under-investment and inequalities in the rangelands. This was in cognizant of the fact that the failure to specifically fast track and prioritize developments in the rangelands was affecting achievement of development agendas such as Kenya's Vision 2030 among others (Government of Kenya, 2012).
Successful management of the rangelands requires reliable and relevant information on vegetation changes to quantify the effects of these changes on the rangeland ecosystem. Intensive and long-term ground-based assessments can produce fine scale, accurate and localized information. However, they are expensive, time and labor intensive; and do not provide full coverage and visualization of the spatial dynamism in rangeland ecosystem. Increasing availability in multi-temporal and multi-spatial satellite imagery provides an avenue for their application to provide an in-depth understanding of the vegetation dynamics at different scales and time steps (Trodd and Dougill, 1998). NDVI has been widely used to monitor vegetation changes in the arid and semi-arid lands. These changes include vegetation response and improvement in vigor following rainfall events. Further, the changes in vegetation abundance and changes in total plant cover and greenness due to utilization as livestock graze and move through the landscape or monitoring units can be observed using earth observation data (Trodd and Dougill, 1998).
Rationale
Different online data catalogs and repositories provide satellite imagery, while others host static maps on vegetation condition and indicators of rangeland productivity. These repositories do not provide users with the freedom to create their own outputs. Sometimes, the information required to make a decision is in different locations. The developed Rangelands Decision Support Tool (RDST) seeks to facilitate near real time assessment and monitoring of rangeland resources by developing a web-based tool that aggregates key indicators of rangeland productivity with ancillary data and allow for integration of user selected indicators to produce maps at different administrative and conservancy boundaries.
The greatest challenge in uptake of technologies and tools meant for decision making is sustainability of initiatives and especially ensuring data recency, coupled with insufficient capacity in understanding and interpreting information. The RDST has been simplified using easy to understand color schemes, simplified interface and detailed information snippets that allow users from different backgrounds such as grazing coordinators and rangeland managers to utilize the tool, generate the maps and make informed assessments. All data processing is automated.
Continuous engagement with stakeholders was done to build their capacity in application of the indices integrated in the RDST for decision making. During training, practical application-based scenarios were developed to demonstrate application of the tool to inform decision making. Specifically, in monitoring of vegetation condition changes in dry and wet seasons, monitoring the effectiveness of grazing plans, assessment of pasture availability by delineating usable pastures from invasive species, monitoring trends and assessing the success of interventions for rehabilitation or improvement of the rangelands.
Study Area
While data was generated for the entire country, the application of the tool for decision making focuses on 24 counties (Figure 1) which comprise the arid and semi-arid areas (ASALS) where aridity levels range between 30 and 100%. Rainfall in the arid areas ranges between 150 and 550 mm per year, and in semi-arid between 550 and 850mm per year. These areas are characterized by high temperatures throughout the year with high evapotranspiration rates. The ASALs experience high variability in the frequency and intensity of rainfall events.
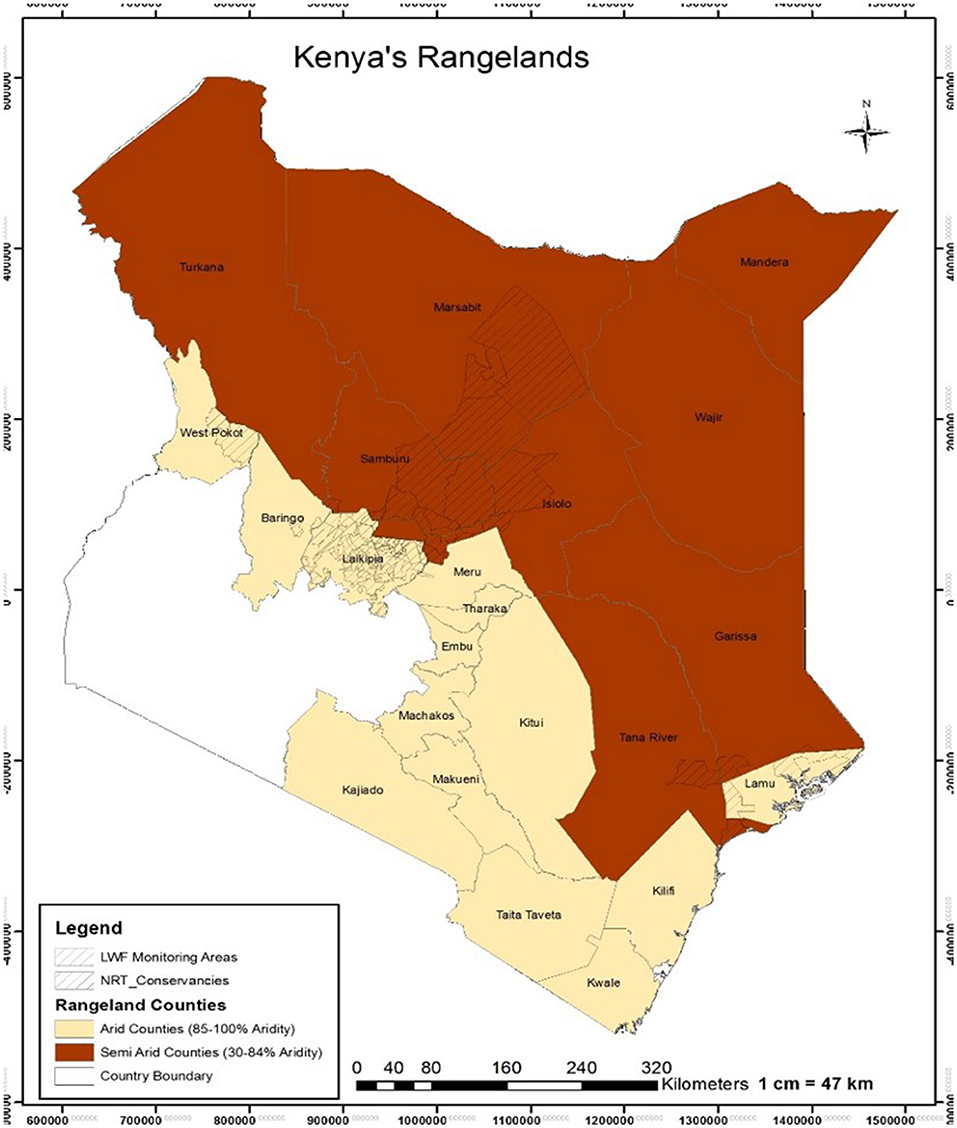
Figure 1. Study area.
Population in the rangelands varies by region. For example population density ranges from 1 or 2 people per km2 in parts of Turkana and Marsabit to 358 people per km2 in parts of Kilifi. Areas where conservancies, community and private monitoring units have been established have been highlighted in Figure 1. These include the NRT group of conservancies and Laikipia Wildlife Forum (LWF) monitoring units.
Materials
Data and Data Sources
Satellite Imagery
Vegetation indices (VI) are transformations of multi spectral data that enhance information about the vegetation properties and reduce effect of external factors such as atmospheric effects. Identification of the different vegetation types due to their properties is based on spectral signatures. The VI quantifies the amount and vigor of vegetation (Xu and Guo, 2015). They normally change over time with the seasonal behavior of vegetation and decrease in cases of vegetation stress. Dead or light vegetation reflect more red light while green vegetation absorbs red light. Many factors affect VI values like plant photosynthetic activity, total plant cover, biomass, plant and soil moisture, and plant stress.
This study utilized the Normalized Difference Vegetation Index (NDVI) from the Moderate Resolution Imaging Spectroradiometer (MODIS) receiver, located at RCMRD. Modis NDVI was selected due to correlation with many ecosystem attributes, availability of the data and coverage over the study area at 250 m resolution. The dataset, which is freely available, can be acquired daily, however a Maximum Value Composite (MVC) every 10 days is preferred to allow for error reduction and corrections due to cloud cover and other distortions. Because of its ease of use and relationship to many ecosystem parameters (Landmann and Dubovyk, 2014), NDVI has seen widespread use in rangeland ecosystems such as monitoring vegetation dynamics or plant phenological changes over time, estimating biomass production g/m2, monitoring grazing impacts or attributes related to grazing management (e.g., stocking rates), assessing changes in rangeland condition, vegetation or land cover classification and carbon sequestration (Indeje et al., 2005; Baumann, 2009; Landmann and Dubovyk, 2014).
Ancillary Data
Relevant ancillary data to assist in interpretation and contextualization of the NDVI indices was prepared. In consultation with the stakeholders, administrative, and monitoring boundaries (counties, wards, conservancies were added to the web-based tool. Stakeholders provided shapefiles of their monitoring units such as grazing blocks that were divided into wet and dry grazing blocks and buffer zones. Other datasets included rivers, roads, surface water points (dams and water pans), conflict zones, migration routes and protected areas. Invasive species maps showing location of Opuntia and Prosopis Juliflora with a time stamp based on date of data collection are included in the tool (see Supplementary Table 1).
Methods
The methodology workflow is illustrated in Figure 2.
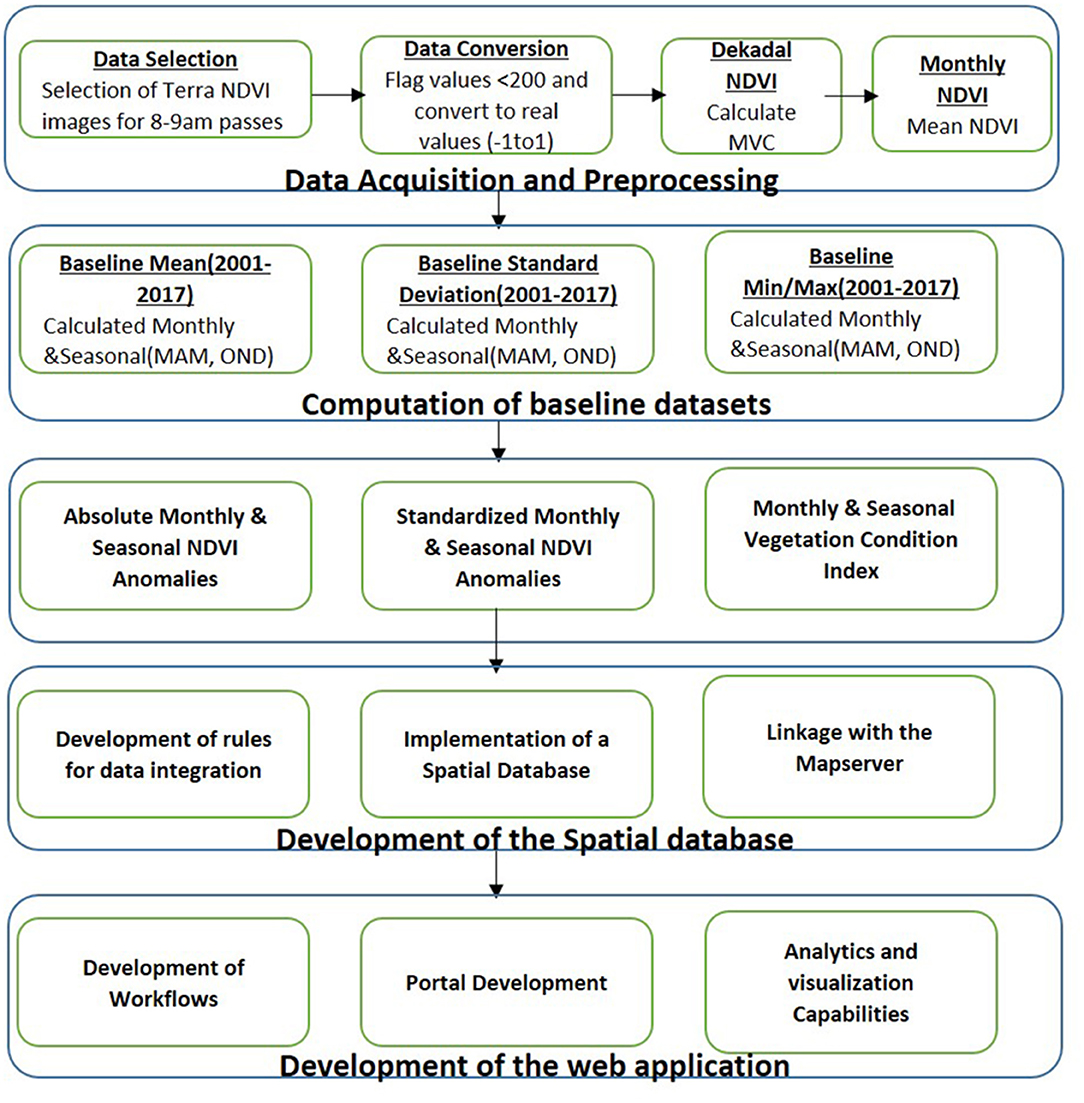
Figure 2. Methodology workflow.
Data Acquisition and Processing
MODIS Terra NDVI is acquired between 8 a.m. and 9:30 p.m. since the passes within this time frame produced clear images with less cloud cover. The raw files are automatically projected to WGS84 coordinate system and then clipped using the Kenya national boundary shapefile. The physical NDVI values were then computed from the digital numbers. Some digital values were used to flag specific pixels: 255 for invalid pixels, 254 for water/sea, 253 for snow/ice, 252 for cloud/shadow, and 251 for missing data. Ten-day Maximum Value Composites (MVC) were computed from the daily files. NDVI values range between −1 and 1. The values lower than 0.1 typically correspond to areas with little or no vegetation (rocks, ice, and desert). Moderate values (~0.2 and 0.3) correspond to shrub and grasslands and high values (0.5 and above) typically correspond to dense vegetation. Monthly and seasonal NDVI was also generated. The seasons were loosely defined for the long rains (March, April and May) and short rains (October, November, and December).
At a monthly and seasonal interval, NDVI absolute anomalies, standard anomalies and the Vegetation Condition Index (VCI) were also generated. Anomalies are quantitative measurements applied to assess how the greenness of the vegetation varies over space and time. The standard anomalies represent the difference between the current values and the long-term mean. They highlight deviations from normal vegetation development portraying both positive and negative changes that give a qualitative indication of how good or bad the current season or month is compared with other similar periods. Below-normal conditions relate to less than normal conditions such as drought or stress while above normal conditions relate to increased/improved productivity. Anomalies help highlight areas of potential concern and take into account the variations over time (dekad, month, and season) in productivity of the vegetation hence giving the bigger picture. Continuous persistence of negative anomalies is a red flag especially due to dependence on rain-fed pastures for livelihoods in the rangelands. VCI was also calculated due to its ability to detect and spatially delineate anomalies in vegetation condition and growth, both in extension and intensity which is useful for monitoring vegetation changes within a season for early warning.
1. Monthly NDVI (NDVIi,m,y) for each Monitoring Unit (MU) i in month m and year y is obtained by averaging the 3 dekadal values in each month:
2. NDVI Absolute Anomalies (AANDVIi,m,y) for each MU i in month m and year y is obtained by subtracting monthly NDVI from a baseline monthly mean (2001 to 2017)
3. Standard Anomalies (Z-score) of the NDVI for each MU i in each month m and each year y (NDVIi,m,y) were calculated with a baseline monthly mean (2001 to 2017) mean (E) and standard deviation (SD) of the particular MU and month:
4. VCI for each MU i in each month m and each year y (NDVIi,m,y) were calculated with a baseline monthly minimum(min) and maximum(max) from 2001 to 2017
Similar computations were applied for computation of the seasonal variables with long term mean and standard deviation calculated for the months within the season.
Development of the Spatial Database
A relational database was designed and implemented with rules for integration of spatial and non-spatial data effected. The database was implemented in PostgreSQL/PostGIS. PostGIS is an Extender for PostgreSQL that allows its ability to manage geospatial data within a relational database structure. The database was then populated with both raster and vector datasets.
Development of the Web Application
The web application was built using JavaScript libraries—ExtJS, OpenLayers, and jQuery. Extjs renders the viewport containing the panels, forms, toolbars and menus. Web maps were rendered using Openlayers which connects to the Web Map Services (WMS) published via Geoserver and ArcGIS Server. The vector and raster datasets found on the application reside in a Geoserver where they are updated frequently. The ArcGIS server provided the web processing service which enables on-the-fly generation of downloadable maps. Both the front-end and backend applications were deployed on the web by the Apache2 web server running in Ubuntu Linux OS. Communication between the front-end and backend was enabled via Ajax requests and responses with a REST API. JSON was used as the data format during information exchange.
Automation
Python scripts were developed to automate the data processing chain and automatic publishing of final indices. This ensures that data is automatically available for users at preset intervals at the beginning of a new dekad, month, or season. A parallel dataset is downloaded as backup to ensure that local servers' failure does not affect timely availability of the indices.
Navigation
The Rangelands decision support tool interface is illustrated in Figure 3. It allows users to select indices, the necessary ancillary data, and produce downloadable maps. The system is able to link user selection in the production of final maps providing the user with the freedom of working with specific inputs from the wide array of indices and ancillary data provided at a user defined boundary.
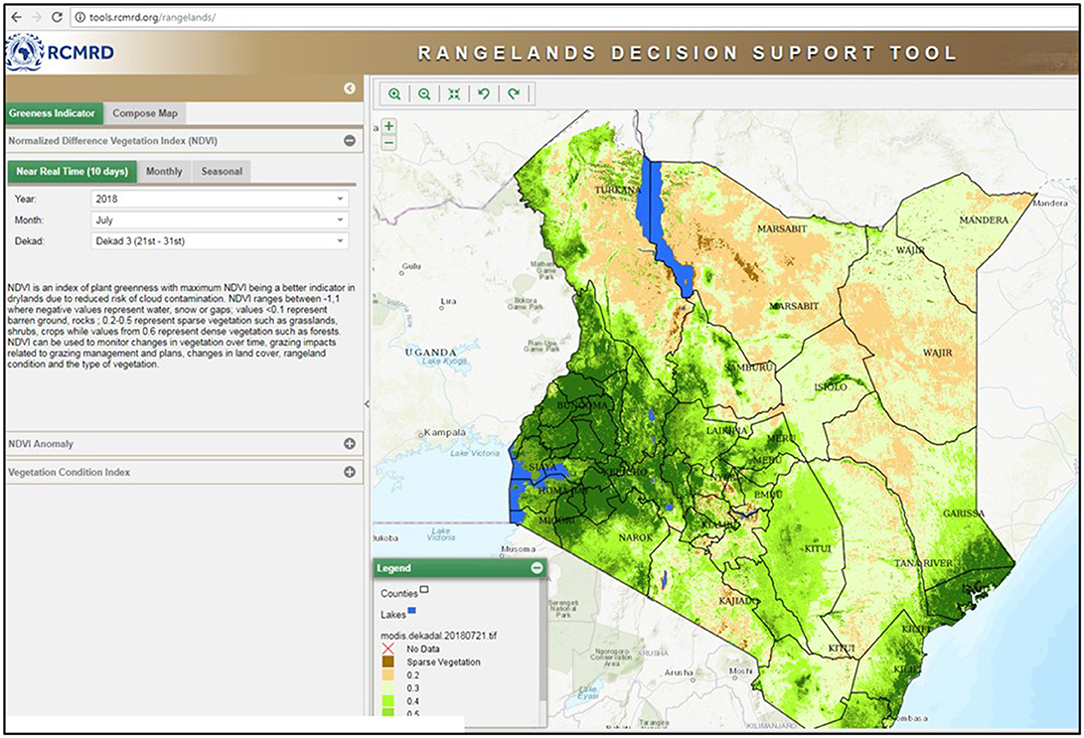
Figure 3. The rangeland decision support tool interface.
The SERVIR Service Planning Approach
Development of the tool adopted a consultative needs assessment method, where rangeland actors were involved to identify gaps and challenges in their decision-making processes. Initial consultations engaged three groups from NRT, LWF and FEWSNET (Famine Early Warning Network). The need for a spatially and temporally flexible dynamic tool was identified and the stakeholders were involved in co-development of the tool. An understanding of information flow in decision making and identification of key actors in the process informed the selection of indices, temporal and spatial extents and monitoring units. By developing stakeholder maps, critical rangeland actors were identified and engaged and this led to a growth in the number users for the tool. With the expected growth, processing of the indices was done for the entire ASAL region to allow for new users to plug in their monitoring units and use the tool.
Through the PREG partnership, Kenya RAPID, SERVIR E&SA, and Mercy Corps Livestock Market Systems program, supported five counties (Turkana, Isiolo, Marsabit, Garisa, and Wajir) to digitize their grazing plans and rehabilitation areas. This will enable them use to the tool to monitor the rangelands and assess the success of interventions. With an understanding of the multiple stakeholders with different backgrounds, the tool's main goal was to provide an easy to use interface, processed indices for different monitoring needs, easily interpretable and relatable legends where green colors represent improving vegetation conditions and browning represent declining conditions; and the flexibility to allow users select ancillary data from an array of relevant indicators to produce maps at the click of a button. To support understanding of the indices and correct interpretation, awareness and capacity building trainings were conducted.
The trainings included all relevant rangeland actors such as researchers, data producers, rangeland managers, rangeland coordinators, and county officers. The approach on capacity building required users to apply the tool in solving challenges or informing relevant decisions. The participants were required to identify management problems or concerns they were experiencing and apply the tool to assess/monitor the situation and come up with actionable information that would be presented management for reporting, or to influence/emphasize on a suggested plan of action, or even to an understanding of conditions being experienced. The use cases focused on short term and long-term trends assessments, monitoring vegetation recovery or decline, and monitoring success of interventions.
Results
Context
Application of the tool for decision making requires interpretation within the right context. Some of the considerations include an understanding of the response of the Kenyan ASALS to the challenges being experienced. Recurrent droughts that leave no time for recovery and diminishing resources for grazing due to privatization of land and agro pastoralism has contributed to increasing the strain on available resources, resulting in degradation and colonization of invasive species in degraded lands (Figure 4).
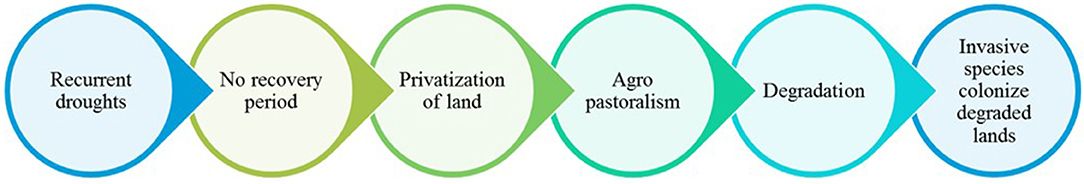
Figure 4. Contextualizing interpretation of rangeland conditions.
Further there is need to interpret negative changes within the right context. Negative values or browning can be caused by normal seasonal changes such as the loss of annuals which leave the land bare. Identification of degradation should be done by use of multiple indices to observe trends of vegetation changes over time. Greening in the rangelands can also be attributed to colonization by invasive species.
Careful interpretation of the VCI is called for since it can show very unpredictable and sharply fluctuating results for regions with rather constant vegetation index profiles, such as warm and cold deserts and equatorial forests and therefore users should apply it in assessments in areas with clear phenological profiles.
Application of the Tool for Addressing Specific Management and Monitoring Challenges
The tool has been successfully applied for monitoring by NRT and LWF groups of conservancies. Specifically, monitoring utilization of grazing resources over time in the wet and dry grazing areas by using the tool to inform movement of livestock from one paddock to the next. This resulted in time saved and efficiency by eliminating the need to frequently send scouts to monitor vegetation changes in the grazing blocks. The tool has also been used to monitor improvements or decline in vegetation productivity, an assessment of degradation or resilience of the landscape and the success of investments in conservation and rehabilitation of the rangeland's ecosystem. NRT and LWF provided their grazing blocks and rehabilitation areas shapefiles as an input to the tool. With capacity building, the stakeholders realized the value of spatially viewing the health of the ecosystem which allows them to identify hotspots where interventions should be prioritized. By using the tool, the stakeholders were able to assess the success of their grazing plans and identify areas where they need to be reviewed. Specific application examples are provided below.
Assessment of the Resilience of Lewa Conservancy
Concerns that the conservancy was experiencing degradation raised during a drought year (2017) led to the assessment to ascertain if the loss in vegetation productivity was linked to drought or degradation. An assessment of the vegetation conditions from 2016 to 2018 using standardized anomalies for the long rains season (MAM) (Figure 5) found that the decline in vegetation productivity was linked to the drought and the conservancy demonstrated full recovery when the drought ended and the long rains commenced. The information was submitted to management to array concerns on the efficacy of management strategies implemented as the ecosystem was resilient and recovered quickly after the major drought.
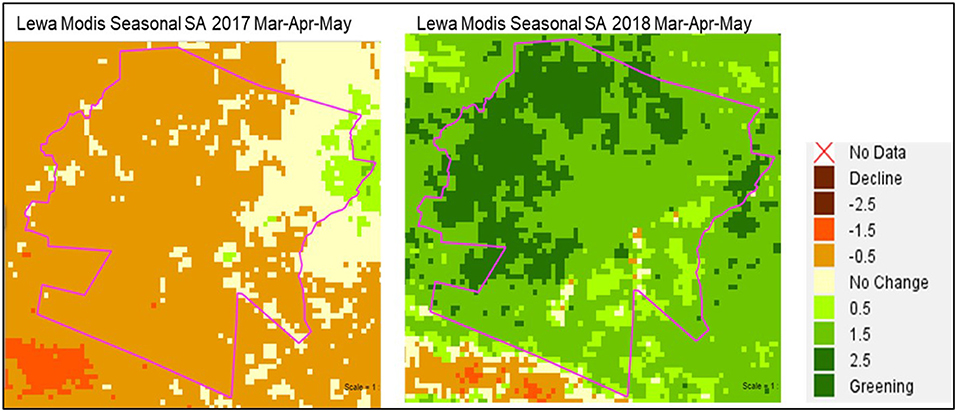
Figure 5. Standardized anomalies for lewa conservancy during the 2017 and 2018 long rains season.
Assessment of the Drought Events in Ol-Pejeta Conservancy
Assessment of drought impact on vegetation conditions from onset to recovery over several years was assessed in Ol Pejeta Conservancy using absolute anomalies. Feedback from the conservancy confirmed that there were four prolonged dry spells between 2006 and 2017 which affected the communities. From the maps it was clear to see that drought events are becoming more frequent with the sequence alternating between a good (wet) year and a dry (drought) year leaving little time for total recovery. The maps were developed and used for reporting to management. Figure 6 shows the drought progression between 2009 and 2011, and 2017 to 2017 Long Rains Season in Ol-Pejeta Conservancy using Absolute Anomalies.
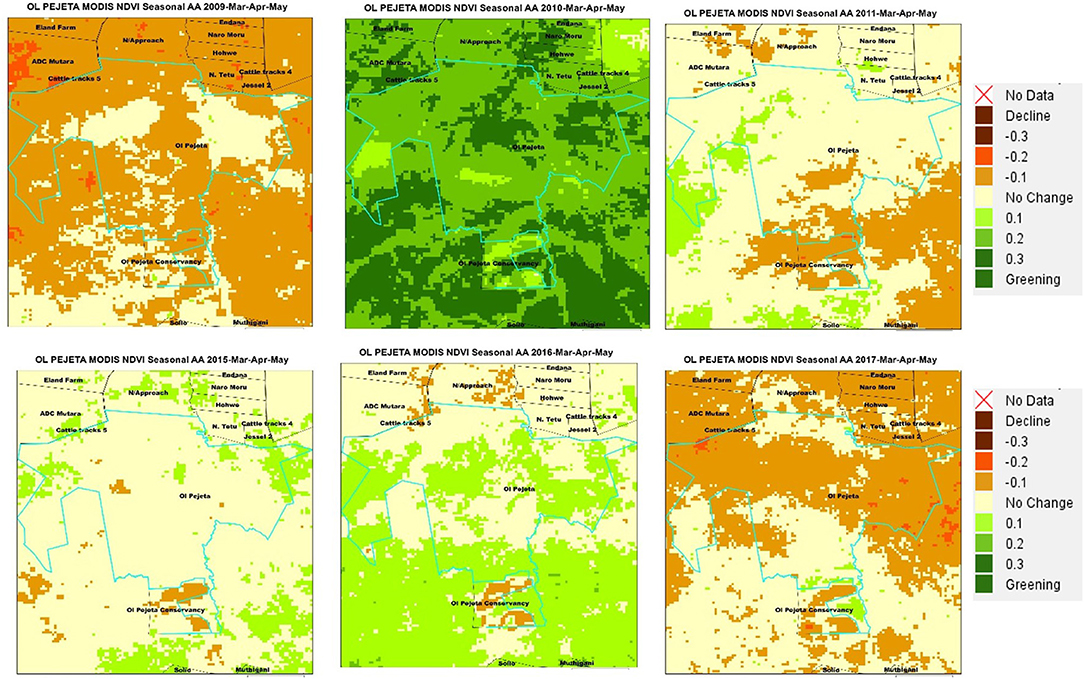
Figure 6. Drought progression between 2009 and 2011, and 2017 to 2017 long rains season in ol-pejeta conservancy using absolute anomalies.
Assessment Human Induced Degradation on Mathews Range Forest Reserve
Mathews mountain range in Namunyak Conservancy in Samburu County, is protected forest reserve made of an expanse of lush indigenous forest which hosts abundant populations of wildlife and rare plant species (Numanyak Wildlife Conservancy, 2010).
Due to increased frequency of drought events with little time for recovery, strain on the protected resource is clearly visible in Figure 7, even in good years such as 2011 and 2012 where degradation (dark brown) can be observed. Discussions with conservancy managers confirmed that the situation was as a result of an influx of livestock from the North of Kenya, resulting in exceeded carrying capacity and encroachment by livestock on the protected resource. Further due to the impact of the droughts on livelihoods of the communities, cutting of trees for charcoal burning after the drought in 2010 contributed to the observed trends. The assessment further correlated to evaluation of the forest, which established that parts of the forest were experience slight to severe degradation (Numanyak Wildlife Conservancy, 2010) due to human activities such as cutting of trees and overgrazing.
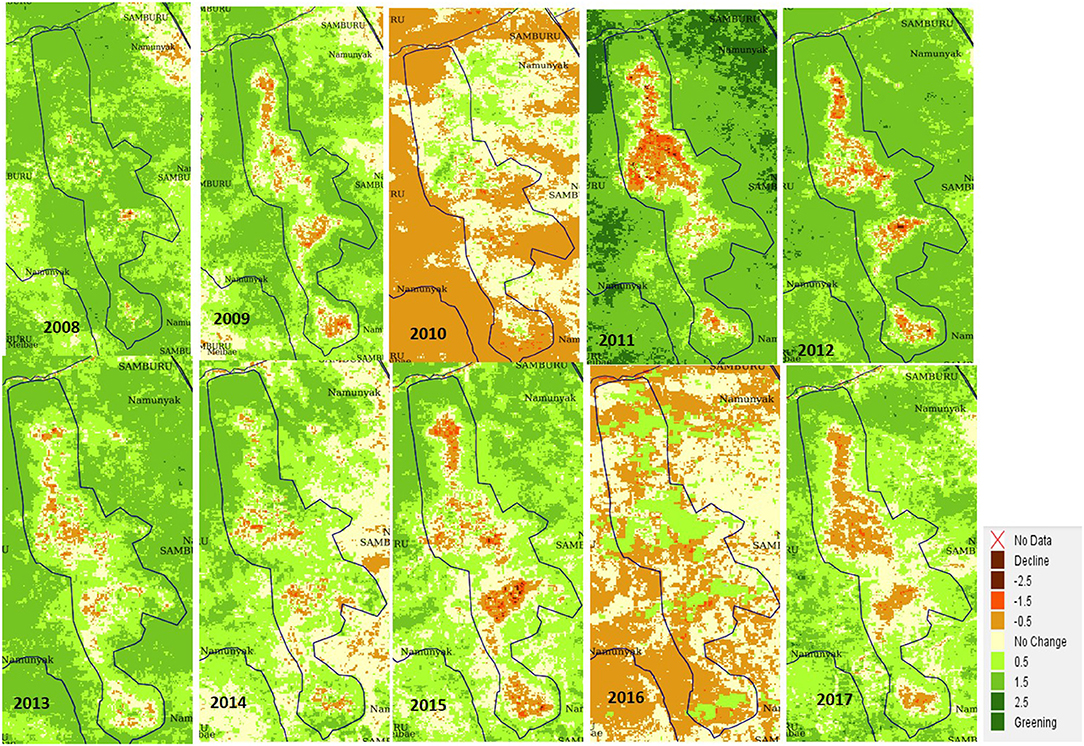
Figure 7. Implication of prolonged drought events on Mathews Range Forest Reserve.
Prompting a Paradigm Shift From “Business as Usual” to Rehabilitate Degraded Areas in Il Ngwesi Conservancy
The NRT's Il Ngwesi conservancy has established rotational grazing with clear delineation of wet and dry grazing areas. However, with frequent droughts, the capacity of the ecosystem is strained and recovery, even when the drought ends is slow. Further encroachment by invasive species such as the Prosopis Juliflora, further reduces available pastures. The NRT team used the maps to verify both the loss in vegetation productivity, coupled with their knowledge on the ground, to delineate extent of invasive species. From the maps developed, the proposed a review of the current grazing plans which outlined the need to prioritize and set aside part of the conservancy for rehabilitation through reseeding and clearing of the invasive species to promote recovery. VCI maps were developed for the short rains season to assess the situation (Figure 8).
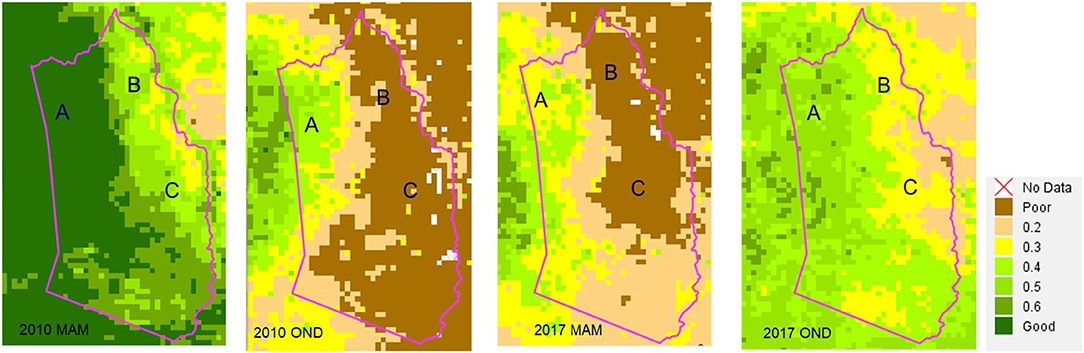
Figure 8. Seasonal VCI for IlNgwesi on two drought years during the long rains (MAM) and Short rains (OND) seasons.
From their grazing map in Figure 9, Region A represents Mukogondo forest which is a dry season grazing resource. Region C represents the area where degradation notable by continued vegetation productivity decline over time has been recorded. Toward the north in Region B is the Ol-Donyiro area where the invasive species (prosopis Juliflora) has dominated. Region B&C which are generally drier represent the wet season grazing area. To promote recovery in B&C the grazing coordinator, proposed that those areas should be set aside for rehabilitation, with clearing of invasive species done in Area B and reseeding in B & C.
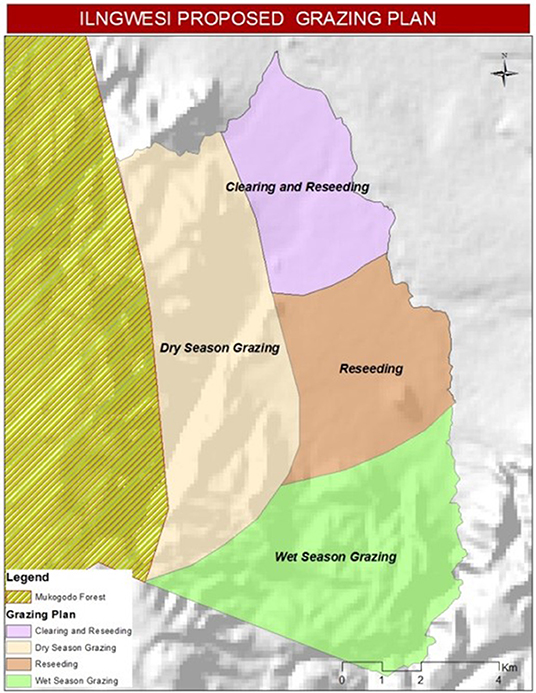
Figure 9. Proposed revised grazing plan for Il Ngwesi Conservancy.
Conclusions
Sample case studies demonstrate the application of the tool for decision making in the rangelands. Specifically, the application of the tool for monitoring changes in vegetation condition due to events such as drought, with local knowledge identification of human induced and climate induced changes in vegetation, and the assessment of the ability of a rangeland ecosystem to recover after drought events.
Clearly, supplementary local and indigenous knowledge was critical in the assessments. Emphasis is therefore given on the combination of local indigenous knowledge of the rangeland landscape coupled with the web-based tool indices for improved decision making. During the discussions with stakeholders, it was clear that the tool can support assessment of the success of current management plans and identify areas where interventions were not successful for review. For example, due to recurrent dry spells, some areas in Namunyak conservancy were becoming degraded and the grazing coordinators developed maps that demonstrated these negative changes. They planned to present the maps to management to suggest a review of the management plans in terms of livestock movements in wet and dry season to ensure recovery. The tool in such case was used to prompt action by reviewing the management plans. The tool was also applied to allay alarm and panic by the management on alleged degradation in Lewa since the maps provided proof that ecosystem recovered well and quickly after drought.
Recommendations
While the application of the tool for decision making is clear, further improvements are required to improve its capabilities. Based on feedback from stakeholders, addition of a monitoring component on surface water is under development to complement the vegetation indices. Addition of a smoothing algorithm is also required to improve the indices especially VCI. Development of an NDVI utilization component to support improved assessments per land cover class within a monitoring unit is required. This would allow quantification of the changes in different classes of interest for different monitoring needs. Data collection should be done for validation of the vegetation indices.
Data Availability Statement
The datasets generated and processed for this research can be accessed through the web based decision support tool at http://tools.rcmrd.org/rangelands or the mini viewer at http://apps.rcmrd.org/rangelands/.
Author Contributions
LN led the development of the web-based decision support tool and writing this paper, with review from RM, AW, and EA. MO was the lead web developer, with SO leading development of scripts for automation.
Funding
The tool has been developed with funding from USAID under the SERVIR Eastern and Southern Africa (ESA) project at the Regional Centre for Mapping of Resources for Development.
Conflict of Interest
The authors declare that the research was conducted in the absence of any commercial or financial relationships that could be construed as a potential conflict of interest.
Acknowledgments
Participation and contribution from rangeland stakeholders have provided invaluable input in the development and application of the tool for decision making. Kenya RAPID provided support in engaging stakeholders in their implementing counties and promoting use of the tool for decision making. Special thanks to NRT, LWF, and specifically Lewa (Dr. David Kimiti) and Ol-Pejeta (Benard Chiira) for contributing information on application of the tool through the case studies. Ngugi Kimani who supported the integration of user input in map composing function on the RDST.
Supplementary Material
The Supplementary Material for this article can be found online at: https://www.frontiersin.org/articles/10.3389/fenvs.2019.00187/full#supplementary-material
Abbreviations
ASAL, Arid and Semi-Arid Lands; FEWSNET, Famine Early Warning Network; GDP, Gross Domestic Product; GHA, Greater Horn of Africa; LWF, Laikipia Wildlife Forum; MAM, March April May; MDNKOAL, Ministry for the Development of Northern Kenya and other Arid Lands; MODIS, Moderate Resolution Imaging Spectro-radiometer; MVC, Maximum Value Composite; NASA, National Aeronautical Space Agency; NDMA, National Drought Management Authority; NDVI, Normalized Difference Vegetation Index; NRT, Northern Rangelands Trust; OND, October, November and December; PREG, Partnerships for Resilience and economic growth; RCMRD, Regional Centre for Mapping of Resources for Development; RDST, Rangelands Decision Support Tool; REGLAP, Regional Learning and Advocacy Programme; SDG, Sustainable Development Goals; USAID, United States Agency for International Development; VCI, Vegetation Condition Index; VI, Vegetation indices; WMS, Web Map Services.
References
Alexandratos, N., and Bruinsma, J. (2015). World Agriculture Towards 2030/2050 the 2012 Revision. ESA Working Paper No 12–03.
Baumann, G. (2009). How to assess rangeland condition in semiarid ecosystems? The indicative value of vegetation in the High Atlas Mountains, Morocco (Dissertation). Mathematisch-Naturwissen-Schaftlichen Fakultät, Universität Köln, Cologne, Germany.
Delgado, C. L., Rosegrant, M. W., and Meijer, S. (2001). “Livestock to 2020: the revolution Continues,” Paper Presented at the Annual Meetings of the International Agricultural Trade Research Consortium (IATRC) (Auckland). Available online at: http://ageconsearch.umn.edu/bitstream/14560/1/cp01de01.pdf
Government of Kenya (2012). Vision 2030 Development Strategy for Northern Kenya and Other Arid Lands. Final Report. Government of Kenya.
Herrero, M., Ringler, C., van de Steeg, J., Thornton, P., Zhu, T., Omolo, E., et al. (2010). Climate Variability and Climate Change and Their Impacts on Kenya's Agricultural Sector. Nairobi: ILRI.
Herrick, J. E., Urama, K. C., Karl, J. W., Boos, J., Johnson, M.-V. V., Shepherd, K. D., et al. (2013). The global land-potential knowledge system (LandPKS): supporting evidence-based, site-specific land use and management through cloud computing, mobile applications, and crowdsourcing. J. Soil Water Conserv. 68, 5A−12A. doi: 10.2489/jswc.68.1.5A
Indeje, M., Ogallo, L. J., Davies, G., Dilley, M., and Anyamba, A. (2005). Predictability of the normalized difference vegetation index in Kenya and potential applications as an indicator of Rift Valley fever outbreaks in the greater. J. Clim. 19, 1673–1687. doi: 10.1175/JCLI3708.1
Kyuma, R. K., Wahome, R. G., Kinama, J. M., and Wasonga, V. O. (2016). Temporal relationship between climate variability, prosopis juliflora invasion and livestock numbers in the drylands of magadi, Kenya. Afr. J. Environ. Sci. Technol. 10, 129–140. doi: 10.5897/AJEST2015.2034
Landmann, T., and Dubovyk, O. (2014). Spatial analysis of human-induced vegetation productivity decline over eastern Africa using a decade (2001-2011) of medium resolution MODIS time-series data. Int. J. Appl. Earth Observ. Geoinformation 33, 76–82. doi: 10.1016/j.jag.2014.04.020
Mulinge, E., Gicheru, P., Muriithi, F., and Kihiu, E. (2015). “Economics of land degradation and improvement in Kenya,” in Economics of Land Degradation and Improvement - A Global Assessment for Sustainable Development, 1–686. doi: 10.1007/978-3-319-19168-3
Numanyak Wildlife Conservancy (2010). Mathews Forest Range Ecological Assessment Summary Report. Nairobi.
REGLAP (2012). Key Statistics on the Drylands of Kenya, Uganda and Ethiopia, REGLAP Secretariat, October, 2012. Nairobi: REGLAP Secretariat.
Silvestri, S., Bryan, E., Ringler, C., Herrero, M., and Okoba, B. O. (2012). Climate change perception and adaptation of agro-pastoral communities in Kenya. Reg. Environ. Change 12, 791–802. doi: 10.1007/s10113-012-0293-6
Trodd, N. M., and Dougill, A. J. (1998). Monitoring vegetation dynamics in semi-arid African Rangelands: use and limitations of earth observation data to characterize vegetation structure. Appl. Geogr. 18, 315–330. doi: 10.1016/S0143-6228(98)00024-1
Vågen, T. G., Winowiecki, L. A., Tondoh, J. E., Desta, L. T., and Gumbricht, T. (2014). Mapping of soil properties and land degradation risk in Africa using MODIS reflectance. Geoderma 263, 216–225. doi: 10.1016/j.geoderma.2015.06.023
Vicente-Serrano, S. M., Cabello, D., Tomás-Burguera, M., Martín-Hernández, N., Beguería, S., Azorin-Molina, C., et al. (2015). Drought variability and land degradation in semiarid regions: assessment using remote sensing data and drought indices (1982-2011). Remote Sens. 7, 4391–4423. doi: 10.3390/rs70404391
Winowiecki, L., Vågen, T.-G., Kinnaird, M. F., and O'Brien, T. G. (2018). Application of systematic monitoring and mapping techniques: assessing land restoration potential in semi-arid lands of Kenya. Geoderma 327, 107–118. doi: 10.1016/j.geoderma.2018.04.017
Keywords: ASALS, rangelands, NDVI, MODIS, vegetation indices, Kenya
Citation: Ndungu L, Oware M, Omondi S, Wahome A, Mugo R and Adams E (2019) Application of MODIS NDVI for Monitoring Kenyan Rangelands Through a Web Based Decision Support Tool. Front. Environ. Sci. 7:187. doi: 10.3389/fenvs.2019.00187
Received: 31 May 2019; Accepted: 11 November 2019;
Published: 11 December 2019.
Edited by:
Niall Patrick Hanan, New Mexico State University, United StatesReviewed by:
Randall Boone, Colorado State University, United StatesJulius Anchang, New Mexico State University, United States
Copyright © 2019 Ndungu, Oware, Omondi, Wahome, Mugo and Adams. This is an open-access article distributed under the terms of the Creative Commons Attribution License (CC BY). The use, distribution or reproduction in other forums is permitted, provided the original author(s) and the copyright owner(s) are credited and that the original publication in this journal is cited, in accordance with accepted academic practice. No use, distribution or reproduction is permitted which does not comply with these terms.
*Correspondence: Lilian Ndungu, bG5kdW5ndUByY21yZC5vcmc=