 Edward Ouko1*
 Steve Omondi1Robinson Mugo1
 Anastasia Wahome1Kenneth Kasera1Emmanuel Nkurunziza1John Kiema1Africa Flores2,3
 Emily C. Adams2,3Samson Kuraru4*Margaret Wambua5
- 1Regional Centre for Mapping of Resources for Development, Nairobi, Kenya
- 2SERVIR Science Coordination Office, NASA Marshall Space Flight Center, Huntsville, AL, United States
- 3Earth System Science Center, The University of Alabama in Huntsville, Huntsville, AL, United States
- 4Northern Rangelands Trust, Isiolo, Kenya
- 5Laikipia Wildlife Forum, Nanyuki, Kenya
Kenya is composed of diverse geographic regions and is heavily impacted by climatic variability. Habitat heterogeneity has led to a diverse number of plants and animals. Invasive species, however, threaten this biodiversity. This study mapped the current distribution of Acacia reficiens and Opuntia spp. using occurrence data, then applied a species distribution model to identify where suitable habitats occur under current and projected climatic scenarios under Representative Climate Pathways (R) 2.6 and 8.5. Occurrences of the two invasive plant species were sampled using an android-based application and a GPS (Global Positioning System) device. Predictor variables included: elevation, distance to streams and rivers, human population density, and vegetation indices (monthly Normalized Difference Vegetation Indices (NDVI) and Enhanced Vegetation Indices (EVI) derived from MODIS products 1-km spatial resolution). The mean of 25 replicates was used in identifying suitable habitats. We evaluated model performance using the average test AUC, mean testing omission rate metrics, and mean regularized training gain. The predictive models for both species performed better than random chance (p < 0.05). Mean test AUC values of 0.96 and 0.97 for A. reficiens and Opuntia spp. respectively, were achieved and their associated 95% confidence intervals showed the fitted models realized the high discriminative ability to differentiate optimal conditions for invasive plant species from random pseudo-absence points. The mean test AUC results for A. reficiens (0.97 ± 0.02) and Opuntia spp. (0.985 ± 0.01) were regarded as high. The models yielded moderate test gain values of 2.4 and 2.7, respectively. The model predictions show the distributions of A. reficiens and Opuntia spp. may increase under future climatic scenarios; with current extents estimated at 339,000 and 183,000 ha, respectively, with projected future spread reaching 732,800 and 206,900 ha, respectively, by 2070. Data on mapping, monitoring, and assessment of the invasive species can provide governments with insight into how the poor and vulnerable people are affected by the loss and degradation of biodiversity and ecosystems due to the spread of such species. This information is key in achieving the Sustainable Development Goals 15 (SDG) of the UN, aimed at the protection, restoration, and promotion of sustainable use of terrestrial ecosystems.
Introduction
Invasive species are a major threat to global human well-being, biodiversity, and economies. The threat of incursion is directly linked to the rate at which the invasive species propagules are introduced and the level of disturbances that encourages their establishment (Hernández et al., 2006). Invasive plant species are plants that produce large numbers of offspring, with greater chances of spreading widely (Ratnayake, 2015). Deforestation, climate change, and habitat degradation have led to the loss of biodiversity and have allowed for the proliferation of invasive species (Thomas and Thomas, 2013). There are situations when native species are regarded as “invasive.” This occurs when conditions responsible for controlling a species are weakened or absent, for instance, due to climate change. Suddenly, the species realizes an enormous and abnormal increase. Acacia reficiens, native to Kenya, have generally shown an aggressive invader tendency similar to those of invasive species. Though such species are important components of their habitats and ecosystems at large, some suggest they should not be referred to as “invasive” but “expansive” or “super-dominant” (Ratnayake, 2015).
A. reficiens is a bush, or small tree, about 3–4 m tall, the top is usually flattened, the branches are reddish-brown and it’s a native of Ethiopia, Somalia, Kenya, Namibia, Sudan, Uganda, and Angola (Witt, 2017). A. reficiens are regarded as a very aggressive invader in many places, especially, but not necessarily, in disturbed areas. Opuntia spp. of the family Cactaceae is found in many arid and semi-arid parts of Kenya. They are drought tolerant with flattened succulent stems that keep moisture most of the year. The spines cause injury to the intestines and mouths of wildlife and livestock (Witt, 2017). Opuntia spp. is among the most spread and naturalized invasives in the arid and semi-arid areas of Northern Kenya, hampering rural livelihoods and the ecosystems. The invasion has been linked to changes in land-use practices which leads to degradation. They were introduced mostly intentionally for ornamental purposes (Obiri, 2017; Githae, 2019).
There is no known record or quantification of either current or potential distribution of A. reficiens or Opuntia spp. in Kenya. The use of species distribution models can help identify habitat suitability for the occurrence and potential distribution based on climate data. Correlative models allow for the prediction of species’ potential niches by associating their occurrences to environmental proxies like climate, topography, vegetation indices, and then apply a relationship to identify areas of similar environmental conditions over which the species are likely to establish (Mitchell et al., 2016). The objectives of this research were to (1) use citizen science derived A. reficiens and Opuntia spp. occurrence data to map their current distributions, (2) map the current distribution of A. reficiens and Opuntia spp. in Samburu – Laikipia region using a time-series of MODIS vegetation indices and topographic environmental variables, and (3) predict the potential distribution under different climate change scenarios using bio-climatic variables.
Materials and Methods
Study Area
The larger Laikipia-Samburu is a diverse ecosystem, consisting of different habitats and land use practices (Wittemyer et al., 2010). Laikipia is predominantly made up of large-scale ranches with resident wildlife species. Conversely, Samburu is a lower-elevation pastoralist grazing region composed of forested ranges (Omondi et al., 2002). The region is in a transition area for the three major vegetation types; semi-desert grassland, shrubland, and Acacia. The vegetation is mainly grassland, woodland, bushland, and dry forest with a scattered declining riparian forest that is important for the maintenance of the region’s biodiversity. Forests cover 6% of Laikipia, and the region’s soils are mainly black cotton, with significant areas also characterized by red sandy soils’ (Jong et al., 2015). The rainfall is generally bimodal, where the long rains occur during April-May period, often accounting for 80% of the total yearly rainfall. The short rains fall later in October-November. The long-term annual precipitation mean between 1990 and 2010 was recorded at approximately 630 mm (Bergmann et al., 2016). The Laikipia drainage constitutes the upper Ewaso Ng’iro River catchment, which is the only major source of water. In dry spells, water flowing through perennial rivers are fed by the Mt. Kenya and Ndarua Range catchments (Government of Kenya, 2007; Figure 1).
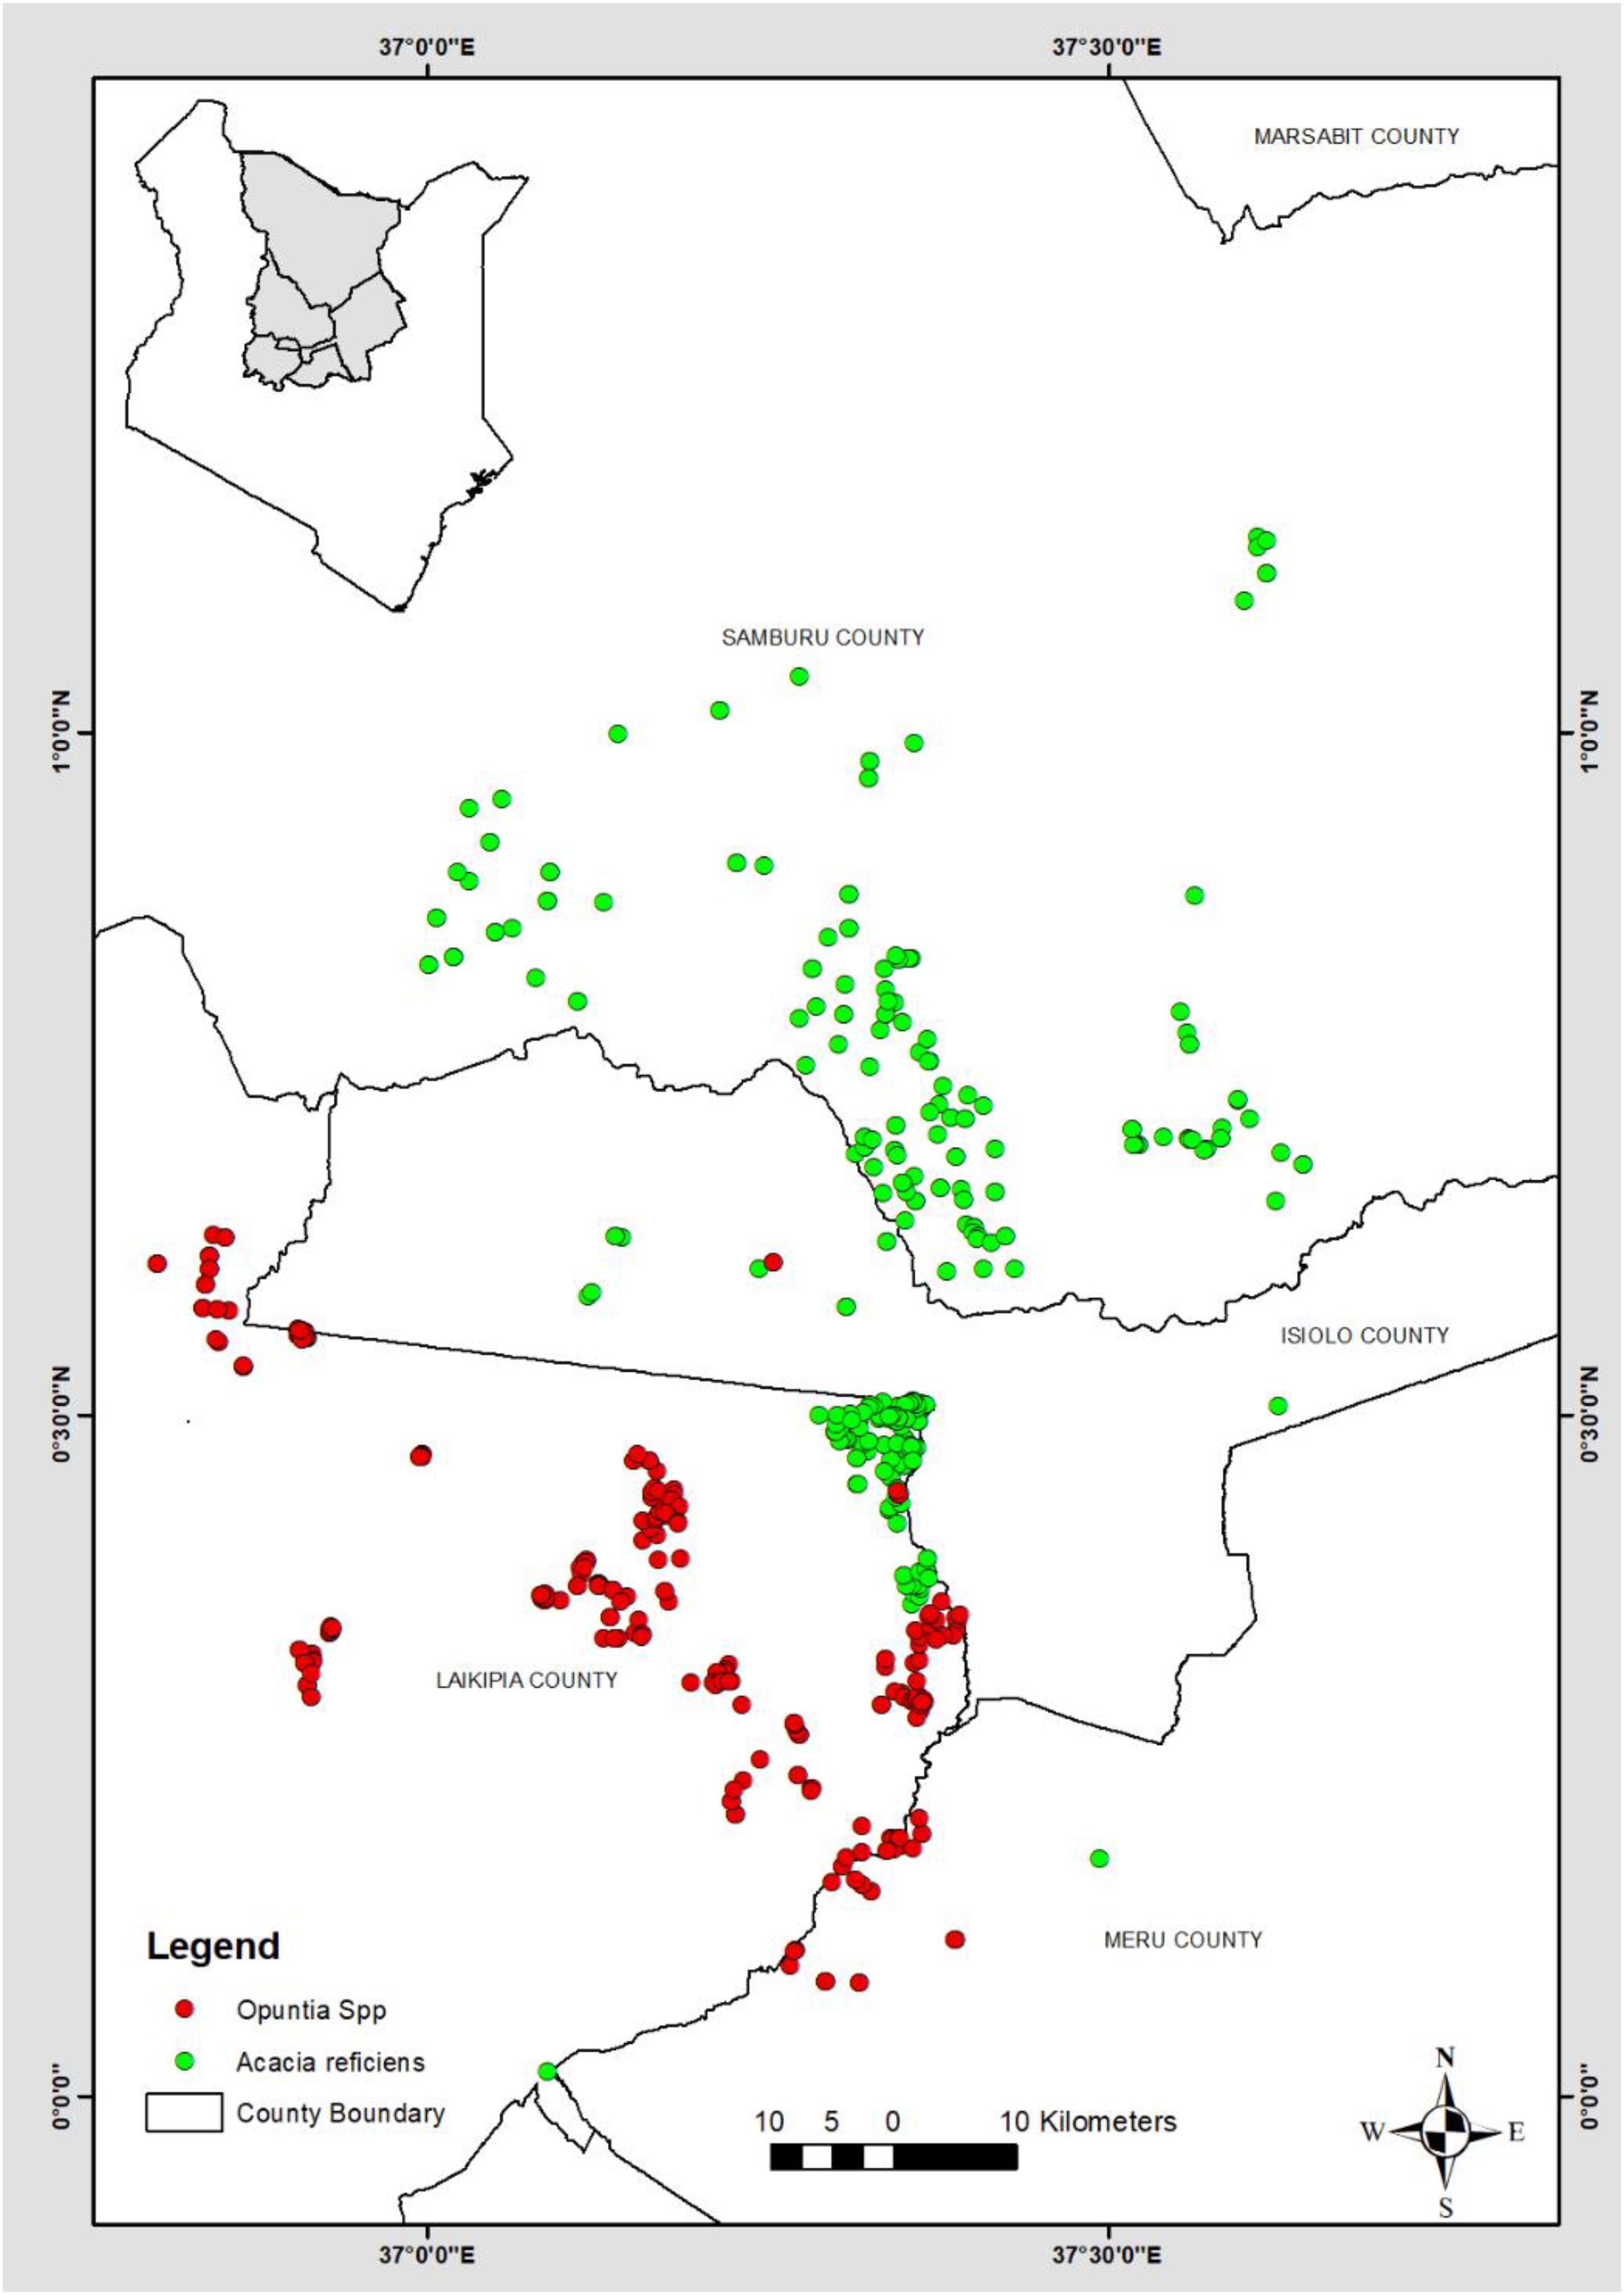
Figure 1. Study area and locations of records used for modeling.
Species Occurrence Data
The study focused mainly on five counties (Laikipia, Samburu, Isiolo, Marsabit, and parts of Meru) which have been heavily affected by A. reficiens and Opuntia spp. reducing forage spaces for livestock and wildlife. Both Opuntia spp. and A. reficiens occur in the same geographical space, so we used the same sets of environmental predictors.
Citizen Science Data
Because reliable spatial information on the invasive plant species was not available, we collected point locations from the study area using a custom-built electronic application installed in android phones, christened the Invasive Species Mapper (ISM) (see Appendix A) currently available on the Google Play Store. The ISM is customized to include any list of local invasive plant species, take photos, and work offline in remote areas with limited internet access.
We applied the ISM Android App, in fixed plot sizes of 1,000 m2. This ensured that the data collected were consistent with assessments of the relative cover of invasive species in a particular location. In addition to fixed plot sizes, plots were stratified by the conservancy and randomized to ensure that the landscape was sampled consistently and that the plots without Opuntia spp. or other invasive species were also included. In addition to estimating the infested area within each plot, the total number (count) of individual plants were counted for the invasive species detected.
Local field assistants and rangeland coordinators that had functional knowledge of local vegetation distribution, especially of the invasive species were trained on how to use the ISM in data collection. The data collected are remotely archived on an online platform for visualization and sharing1 (see Appendix A). To reduce the spatial bias/autocorrelation, the data collection on A. reficiens and Opuntia spp. occurrences were random within a minimum distance of 200 m between the occurrence points. A total of 362 A. reficiens and 338 Opuntia spp. geo-tagged presence observations were randomly collected from 2016. Another set was collected from May to June 2017 and finally from September to November 2019. Five (5) counties of Meru, Samburu, Laikipia, Marsabit, and Isiolo were targeted. These counties comprise several conservancies with most occurrences recorded in Samburu and Laikipia counties (Figure 1).
Environmental Predictors
At the sub-national scale, we assumed climate is an important parameter for plant growth and survival. Correlative modeling of species ranges needs environmental data that have a direct or indirect link to the species’ spatial distribution. The proximal variables (direct) have an immediate effect on species while the distal variables (indirect) are dependent on the former with some varying degrees (Koh, 2008). Elevation, slope angle, and slope aspect are indirect variables and only correlate with organisms through their interactions with parameters like temperature and precipitation (Austin, 2007). Air temperature, soil water levels, and solar radiation directly define plant niches (Dymond and Johnson, 2002). The current and projected future climate data used were obtained at the highest-available resolution of (30 arc-seconds (∼1 km). The current climate data were derived through interpolation of observed data representing 1960 through 1990 (v.1.4). Future climate projections relied on predictions of the GISS – E2 – R model being part of CMIP5 (IPPC 5th Assessment) for climate average 2041–2060 for RCPs 2.6 and 8.5 being the lowest and highest emission climate scenarios, respectively. For comparison of the single-sourced derived current and future climate data, the WorldClim’s current data (version 1.4) were used in the downscaling and calibration process2. MODIS products (MOD 13Q1) derived at 1-km2 resolution comprising Enhanced Vegetation Index (EVI) and monthly Normalized Difference Vegetation Index (NDVI) were used as measures of vegetation productivity for the year 2017. Non-climatic variables were resampled to 0.00833 degrees (∼1 km2 at the equator) using the nearest neighborhood algorithm to coincide with WorldClim climate derived predictors. Data sets used in modeling were derived from different sources at different resolutions, so scale conversion was done for consistent analyses (Park, 2011). Slope and elevation were derived from Shuttle Radar Topography Mission (30 m SRTM).
Modeling Approach
The MaxEnt program uses a maximum-likelihood algorithm to produce a probability distribution. The MaxEnt algorithm applies pixels of known species occurrence data and randomly generated pseudo-absence background data to form sample points (Hernández et al., 2006; Young et al., 2013). A collinearity analysis was computed to eliminate highly correlated variables. The correlation coefficient and the variance inflation factor (VIF) were calculated. The VIF helps measure inflation of variance of the coefficient estimate due to multicollinearity. In this study, the analysis of collinearity was done within the full list of original variables. Any variable with a VIF value above five was flagged off as collinearity concern (Dormann et al., 2013).
The distal variables are normally avoided because such indirect correlation tends to propagate errors when models predict species’ potential niches under different climate scenarios (Baldwin, 2009; Pearson, 2010). A species distribution model (SDM) hierarchical process was applied. First, the invasive species were modeled specifically using the 19 bioclimatic variables3. The subsequent models run included the 24 MODIS variables representing monthly EVI and NDVI, elevation, soils types, distance to rivers, and population density. The relative importance of the predictors was determined by the percent contribution and permutation importance derived from MaxEnt results. The variables of less importance were removed systematically, leaving variables with a significant contribution to model performance, resulting in an AUC > 0.8. The initial analyses reduced the number of variables to 8 non-correlated vegetation indices and topographic predictors for both A. reficiens and Opuntia spp., respectively, and seven non-correlated climatic variables for mapping the occurrence and projecting potential niches, respectively.
The resulting model was tested for variable correlation, because correlated variables may mislead interpretations. We ran a pairwise Pearson correlation in R Studio, and only variables with r ≥ ± 0.8 were used in the final model prediction. In the mapping of current A. reficiens and Opuntia spp., distribution, NDVI for August and May, and EVI for August and January were used. Other remote sensing proxies included: altitude, distance to rivers, soil drainage, and population density. The current climate data derived through interpolation of observed data representing 1960 through 1990 (v.1.4) were also used in mapping the current extent of the invasive species. These were Isothermality, mean diurnal range, temperature seasonality, precipitation seasonality, annual precipitation, precipitation of wettest quarter, and precipitation of wettest month. For predicting the potential habitats of the two species, similar current climate variables were used under RCPs 2.6 and 8.5, respectively (Table 1).
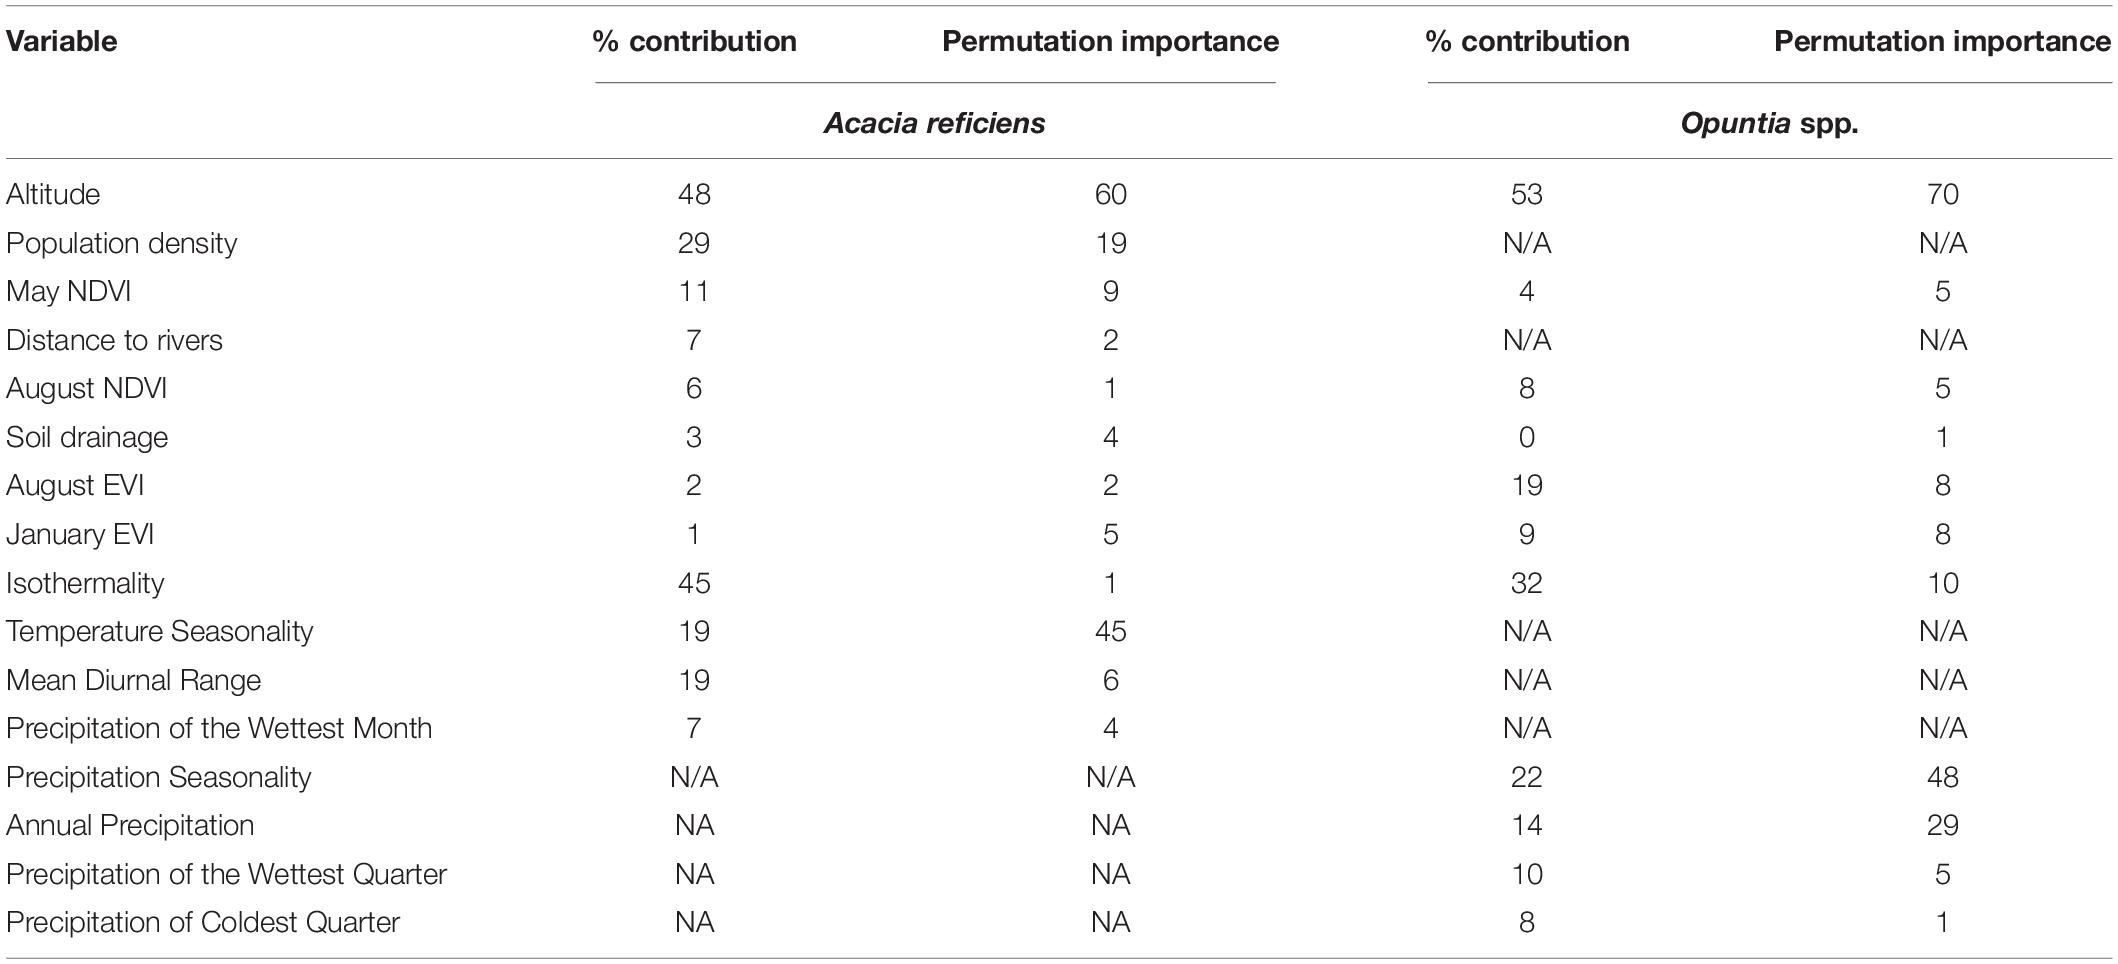
Table 1. Permutation and percent importance of remote sensing and topo-climatic predictor variables of the two MaxEnt models for A. reficiens and Opuntia spp. under the current and potential distribution.
The model parameters were set as follows: replication type was set to sub-sample, 30% random test, the number of iterations was set to 5,000 with replicates of 25 and a regularization value of 1. The MaxEnt model allows one to run a model multiple times and then averages the results from all the model runs. A default setting of 10,000 background points was used and over 700 sites across the study area were used to ensure good representation of all environments (Elith et al., 2011). The model performance was evaluated based on the mean test AUC, testing omission rate, and mean training gain. The threshold used in converting MaxEnt probability outputs into binary maps have effects on the extent of predicted distribution (Baldwin, 2009). The minimum training presence logistic considers suitable all sites that are at least suitable within the training set. It is a conservative approach preferred in modeling invasive species. The last models used to identify suitable niches were built based on the means of 25 replicates grids in MaxEnt. The average logistic threshold was used in estimating optimal niches for the invasive plant species. Continuous output binary is created by choosing a value of the relative occurrence rate under which a given species being modeled is considered present (Merow et al., 2013). Determining biologically accurate thresholds may depend on a species population density or prevalence, for example in this study this information is not fully known, therefore arbitral threshold values are not recommended (Hernández et al., 2006). MaxEnt uses threshold-dependent and independent tests to evaluate a model output. For the threshold-dependent tests, it uses a specific threshold to divide a response as either suitable or unsuitable. A variety of threshold-dependent values are generated, and it’s at the user’s discretion to choose a value based on their objectives (Young et al., 2013). For instance, in the case of research or management reasons, an accurate prediction of species presence (sensitivity) rather than species absence (specificity) would be of greater emphasis. A threshold weighted to achieve sensitivity would be ideal for this study. The models’ significance against random chance is determined in MaxEnt using the threshold – dependent metrics which applies a one-tailed binomial test (Phillips, 2008). The output binary was converted to raster format and the distribution maps were generated by classifying images into two classes, 0.00 to 0.5 and 0.5 to 1.0. Pixels in the lower range were considered as areas of less than 50% chances of species occurrence and the higher ranges to depict areas with at least 50% probability of species existence, hence a highly suitable habitat. The areas which are projected to have changed under different climate scenarios were estimated by calculating the difference in future distribution and present distribution. The negative values denoted range expansion; the zero values denoted no change while positive values were areas of range reduction (Figures 2, 3). In most cases selecting suitable modeling algorithms and associated datasets are a challenge in ecological modeling, so limitations of overestimation of the presence of species are inherent. The SDMs assume random sampling of the presence of species within a grid cell, which leads to a high probability of presence in each grid cell, and overestimation (Thapa et al., 2018).
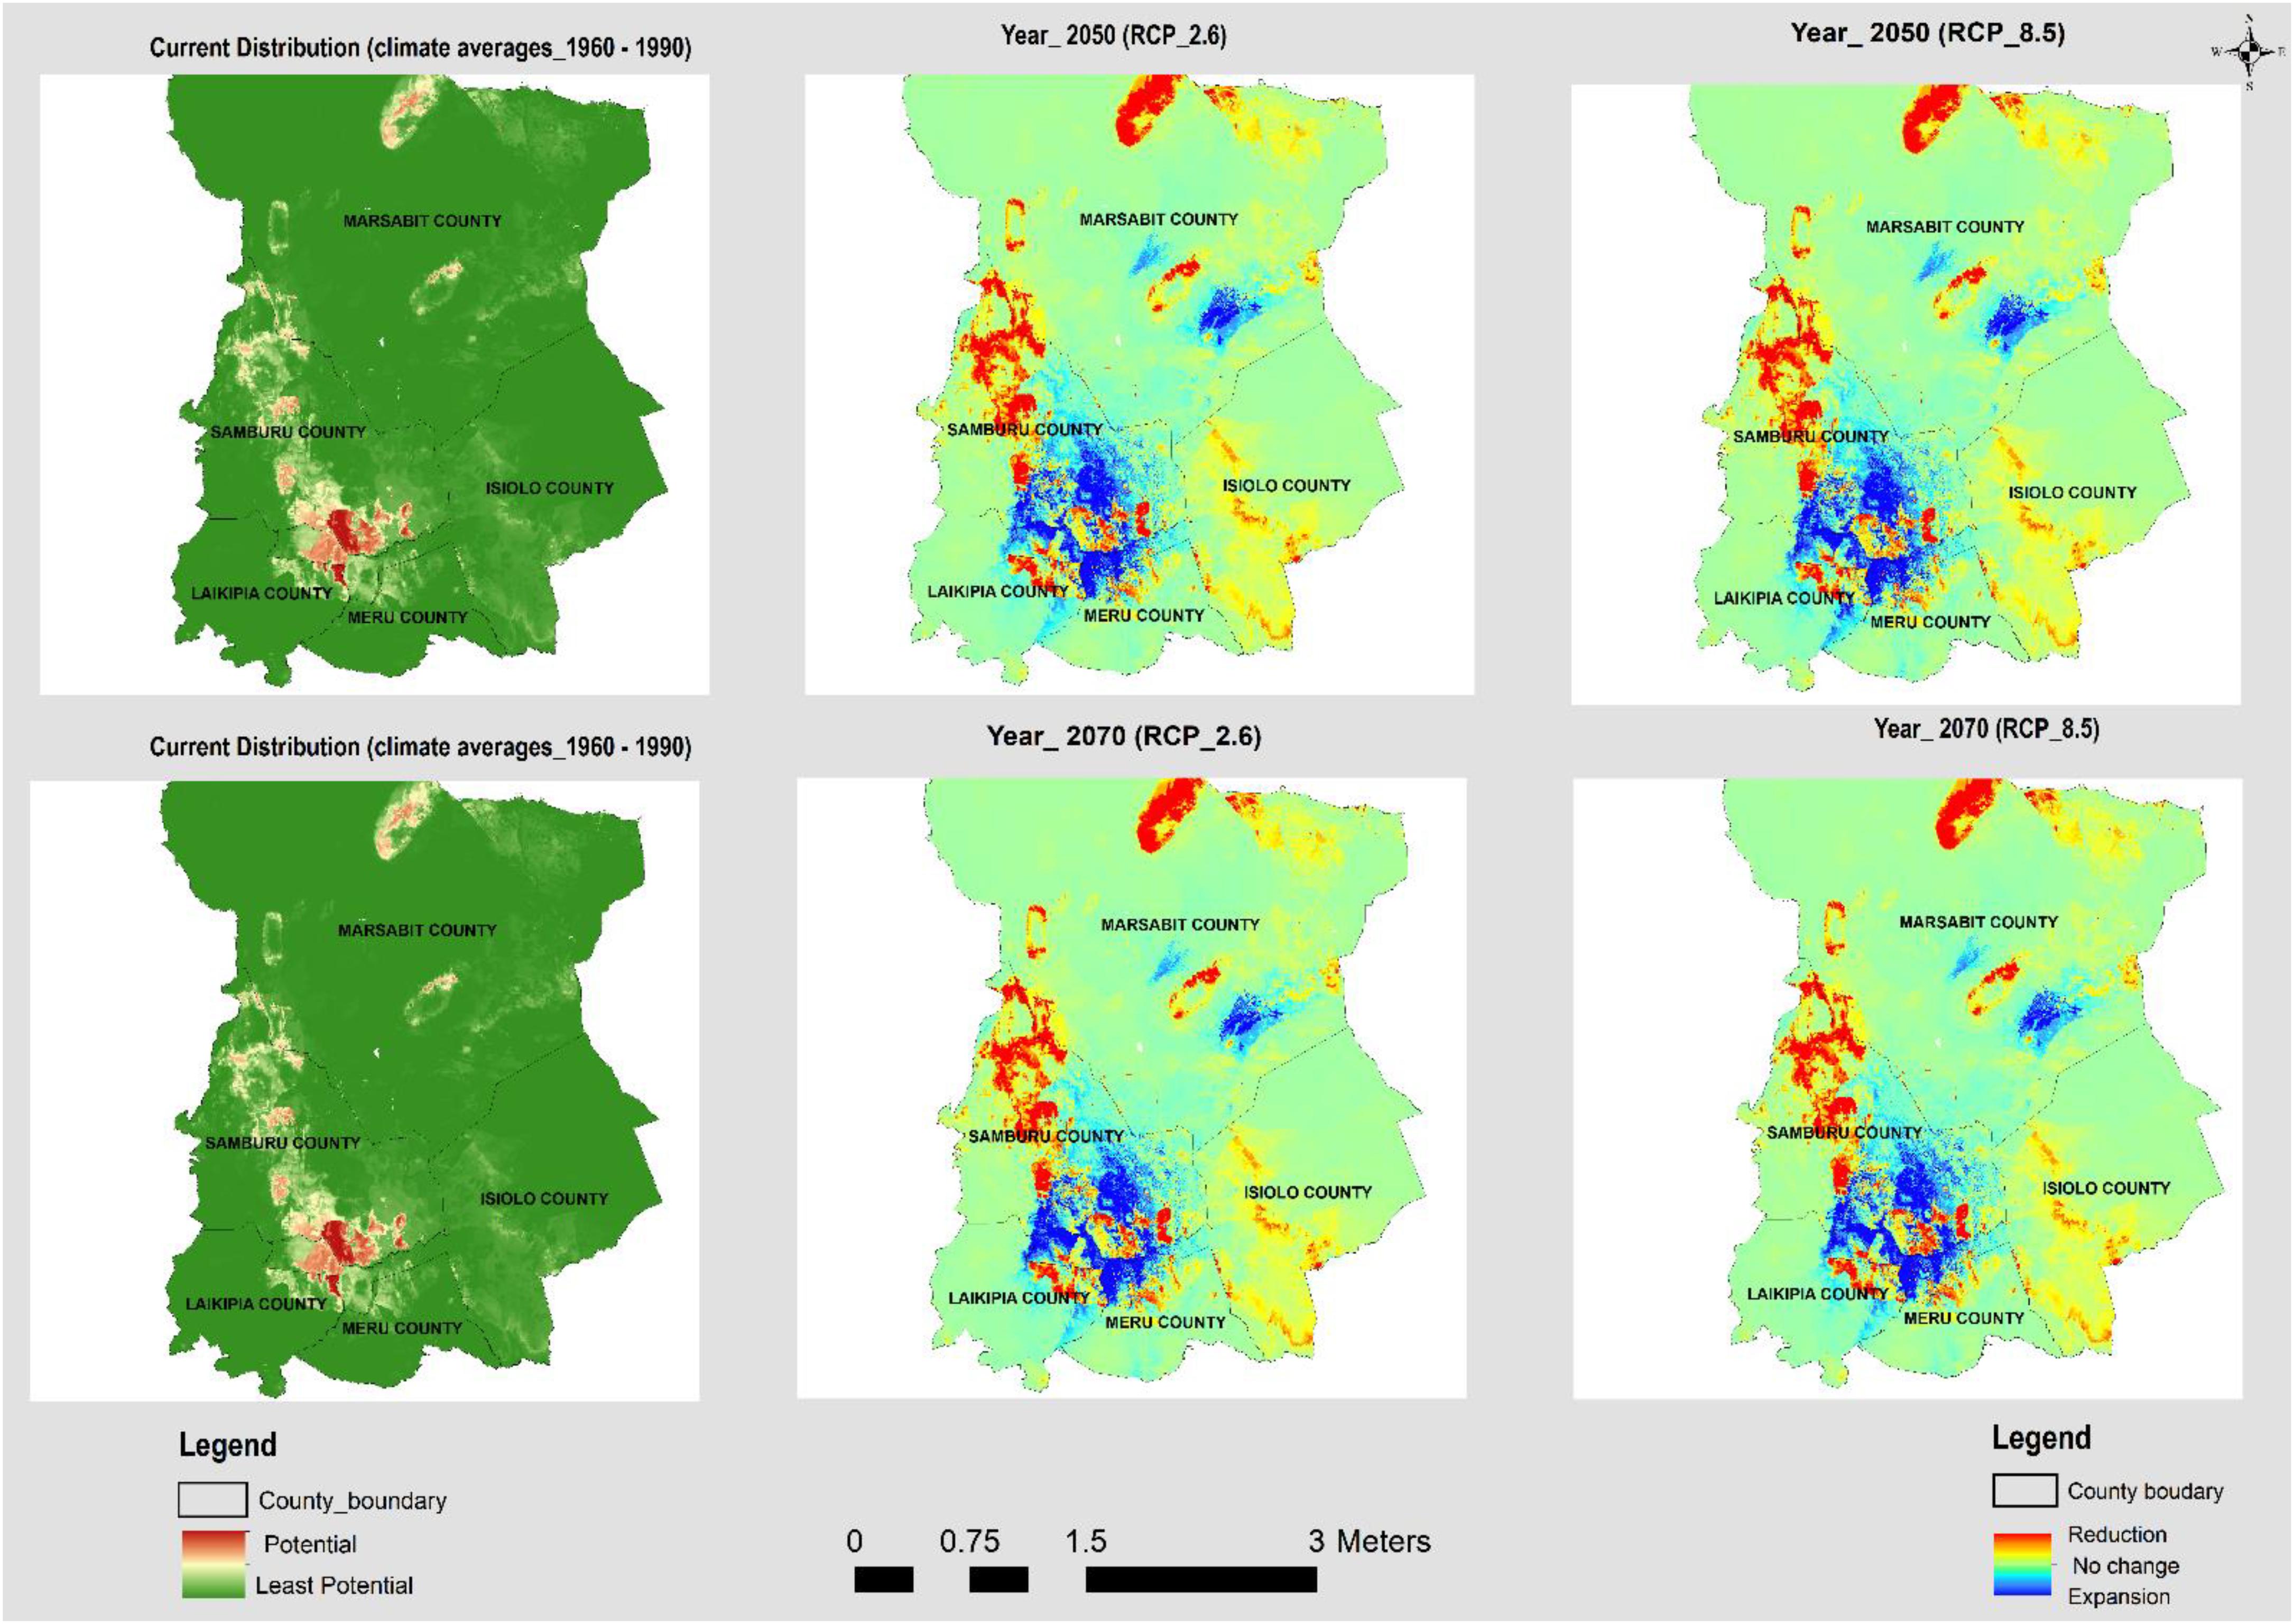
Figure 2. The current and potential distribution under RCP 2.6 and RCP 8.5 for the years 2050 and 2070 for A. reficiens.
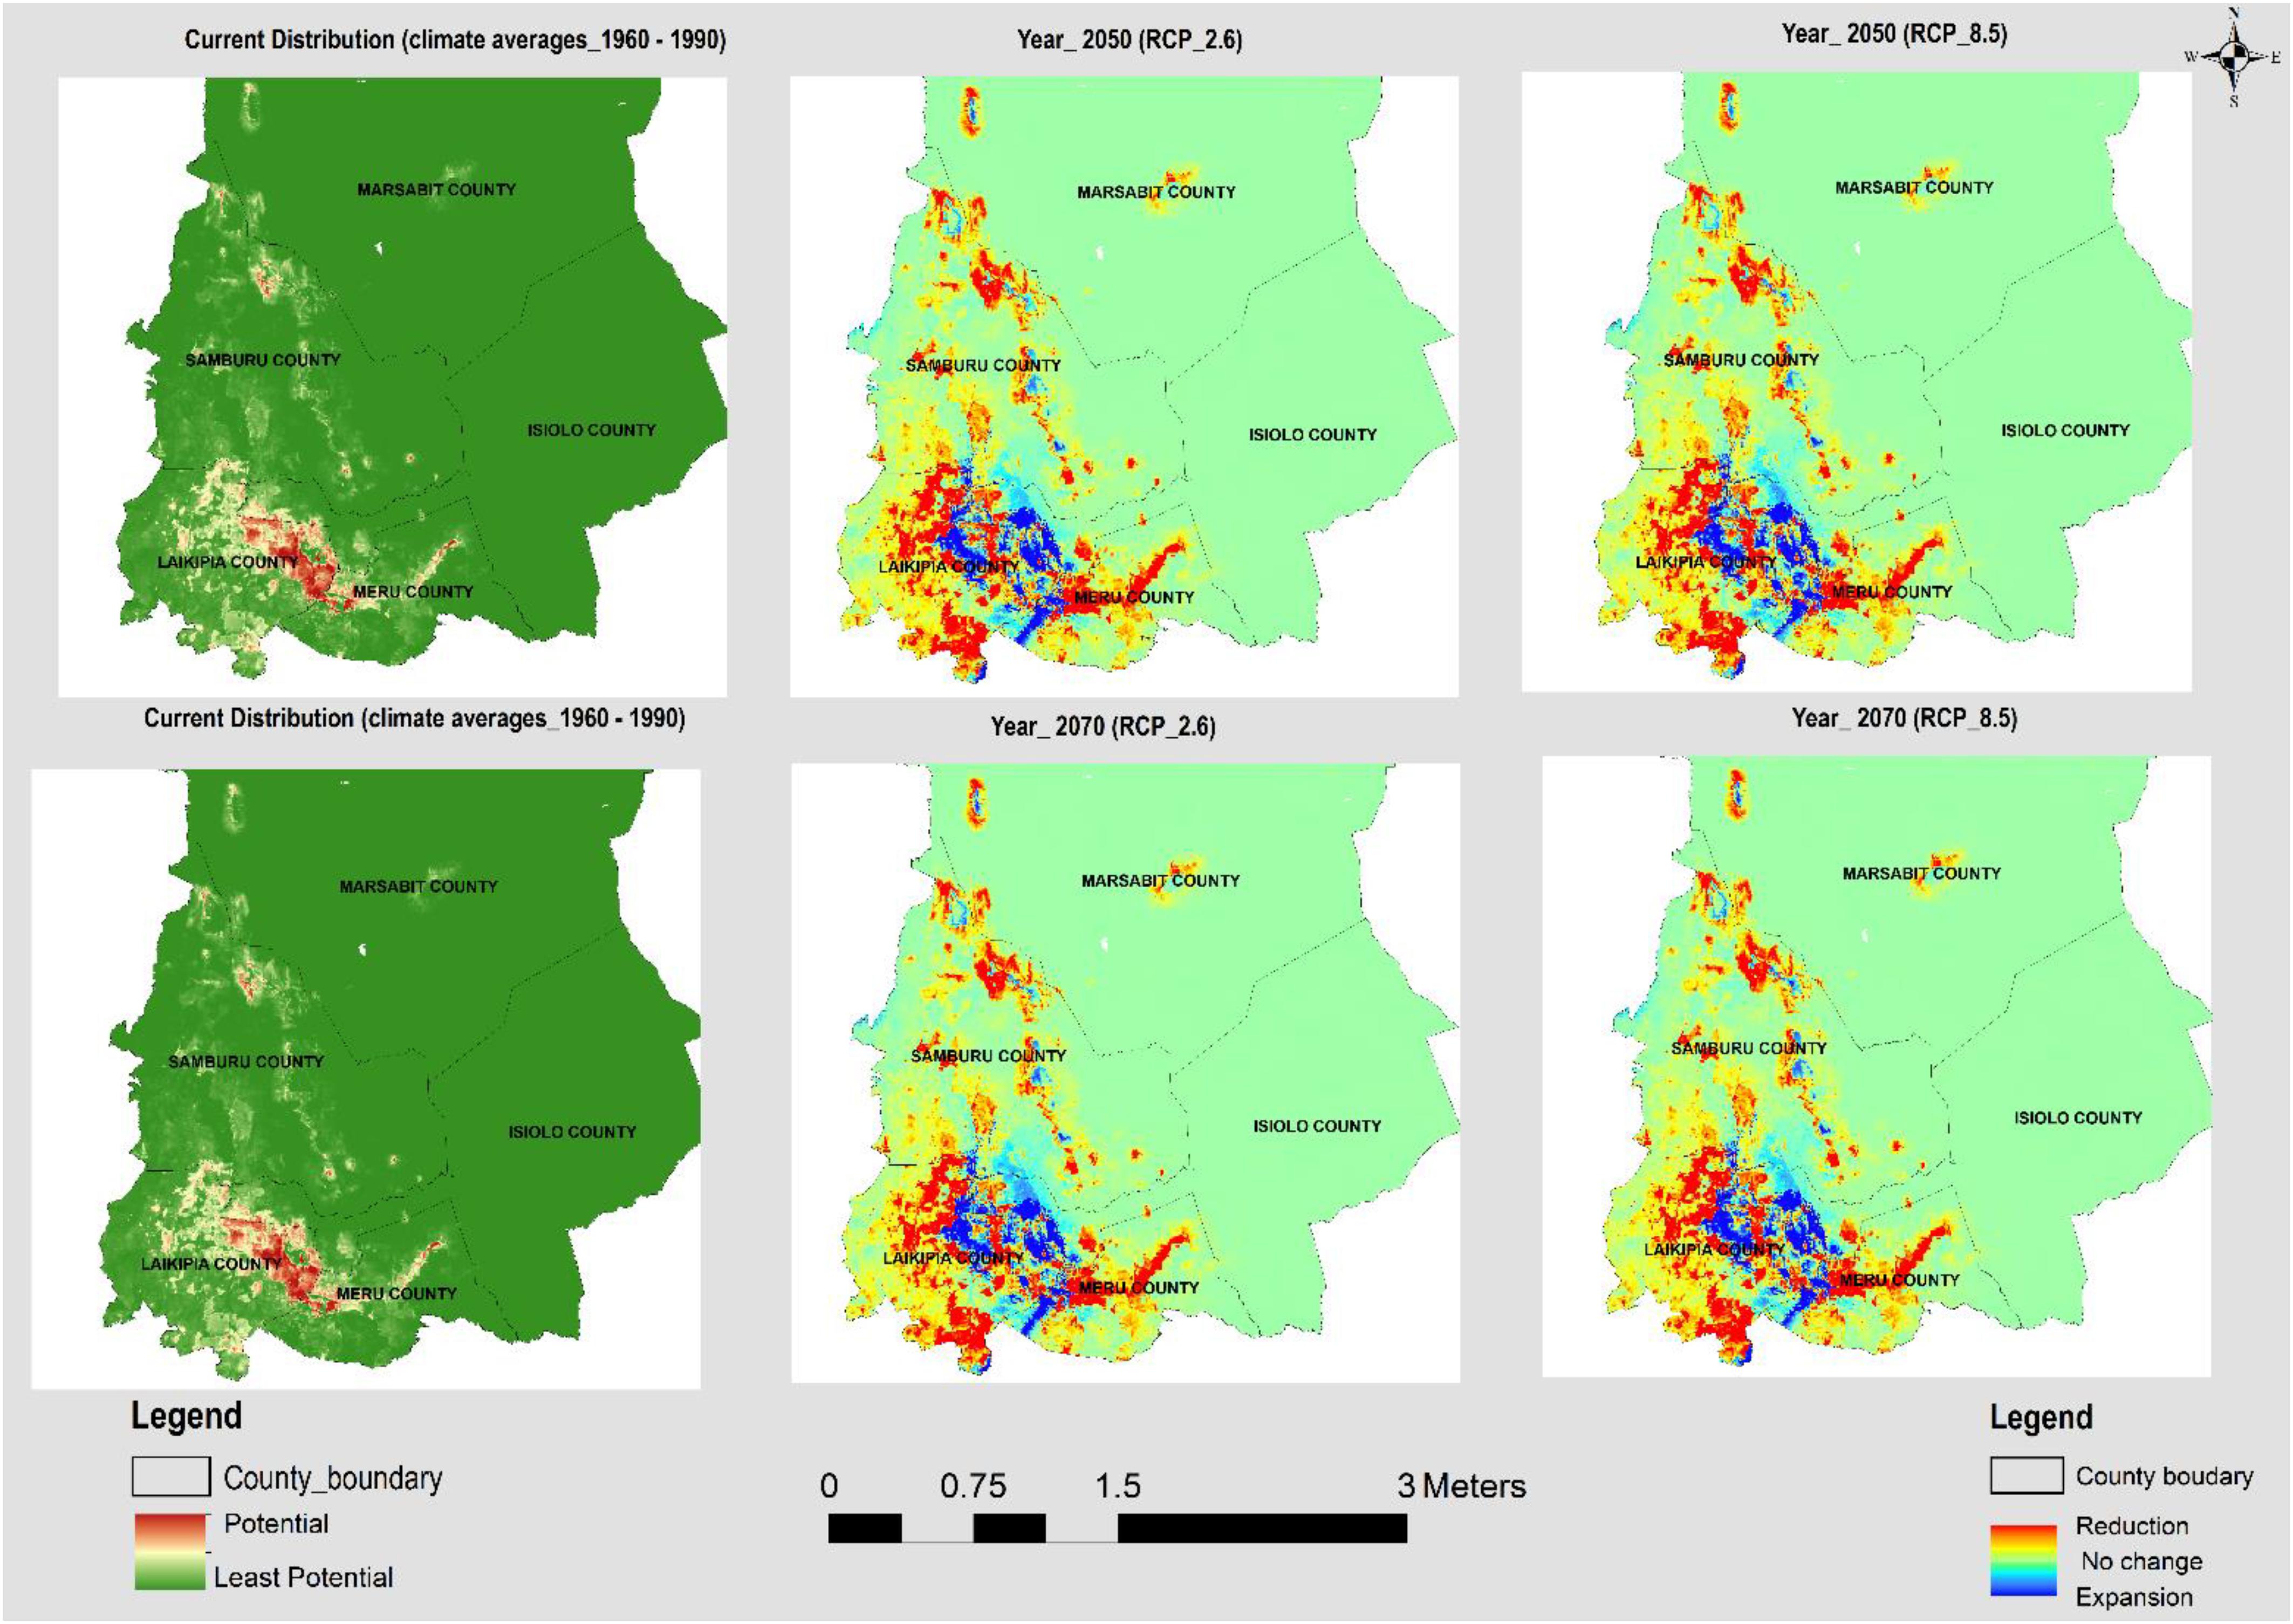
Figure 3. The current and potential distribution under RCP 2.6 and RCP 8.5 for the years 2050 and 2070 for Opuntia spp.
Results
The models generated p < 0.005, performing better than random prediction. The high mean test AUC values (0.97 and 0.98 for A. reficiens and Opuntia spp., respectively), is an indication that the models fitted could easily discriminate optimal conditions for the invasive species from the randomly generated background points. The highest test AUC value of 0.986 was derived from the models built for Opuntia spp. under future climatic projections (see Appendix B). An analysis of the relative contributions of individual remote sensing variables used in mapping the current distribution of both A. reficiens and Opuntia spp. showed that elevation was the greatest predictor of presence points of both A. reficiens and Opuntia spp. with percent importance of 48.3 and 53.4, respectively. Besides, climate variables whose contribution was significant in mapping the current extents of both species included temperature seasonality and Isothermality. In predicting the future extents under different climate scenarios, Isothermality was the most important variable predictor for both species (Table 1). We diagnosed the input variables based on the results of the jackknife procedure. This helps to identify the loss or gain in the predictor power as each variable is omitted from the models or used independently. A jackknife test of variable importance indicated that the variables which decreased model test AUC most when removed were August EVI and Soil drainage for A. reficiens and Opuntia spp., respectively, for the current distribution. Under future projection Precipitation of Wettest Month and Mean Diurnal Range reduced the test AUC value the most for A. reficiens and Opuntia spp., respectively, and contain information that is not present in other variables. Suitable habitats for both species under study were predicted widely in most conservancies. From the areas calculated based on the model results, the current extents of A. reficiens and Opuntia spp. were 339,000 and 183,000 ha, respectively, (Figures 2, 3). The future distribution is predicted to expand to other conservancies within the projected climate scenarios within RCP 2.6 and RCP 8.5 by the year 2050 and 2070. Quantitatively, reduction of the suitable habitats is also expected to increase marginally especially for both species. This will be highly pronounced by 2070 (Figures 2, 3). The future rates of expansion and reduction of suitable habitats are projected to shift consistently within the conservancies over different climate scenarios. The average proportion of suitable habitats for both species under reduction is slightly higher than areas under expansion over the same RCPs (see Appendix C).
Discussion
In this study, altitude, population density, distance to rivers, NDVI of May and August, EVI of January and August were important variables in identifying the current extents of the two invasive species whose distributions were modeled. Minimal seasonal variations in temperature and rainfall were important predictors in mapping the current extents and in predicting suitable areas of invasion in 2050 and 2070. Generally, rainfall, human interventions, distance to rivers, soil drainage, precipitation seasonality, and temperature seasonality explained the distributions of A. reficiens and Opuntia spp. (see Appendix D). The model prediction shows the distributions of A. reficiens and Opuntia spp. are projected to shift (extend and reduce) under future climatic scenarios (2050 and 2070). This could pose an imminent threat to native plants and the well-being of the local communities who are largely pastoralists. The current distribution of A. reficiens and Opuntia spp. are mainly within the community conservancies within Laikipia and Samburu counties. The areas infested were overlaid on soil type information, and it showed that well-drained soils on the slopes of the hills with a mean elevation of about 1200 m above sea level, provided suitable conditions for the growth of A. reficiens and Opuntia spp. (see Appendices E, F). Livestock, humans, and wildlife feed on Opuntia spp. and are believed to be agents of dispersal (Witt, 2017). This is confirmed by the existence of Opuntia spp. on the banks of rivers and in densely populated areas within the conservancies. The relative probability of presence of A. reficiens and Opuntia spp. increases with the increase in altitude and population density, though they diminish with the increase of distance from rivers and streams (see Appendices E, F). The results show that the current predicted distributions of A. reficiens infestation cover mainly Samburu County, while Opuntia spp. is predominant in Laikipia County. Both range reduction and expansion for A. reficiens and Opuntia spp. are consistent over different climate scenarios. The invasive species range expansion is projected to begin as early as 2050. A. reficiens and Opuntia spp. are projected to expand by 5 and 1%, respectively, relative to the study area, with expansion marginally increasing by 2070. Comparatively, the rate of reduction of suitable niches for both A. reficiens and Opuntia spp. is slightly higher than the rate expansion over 2050 and 2070 climate scenarios (see Appendix C). When A. reficiens encroaches landscapes, it results in an imbalance in bush grass ratios and decreasing biodiversity, lowering the grass productivity (Winowiecki, 2014). Its seeds germinate easily and can displace other species without disturbance. It is found mostly on plains but also grows on hills and dry rivers seldom on the sand. Even though A. reficiens causes challenges, several of its parts are utilized by the locals as a source of traditional medicine (Wakshum Shiferaw et al., 2018). Both fire and herbivory independently can affect tree cover by altering demographic height transitions. According to the local communities, A. reficiens is preferred by wild animals and livestock and could as well explain the increase in their invasion over-time.
The relative probability of presence of A. reficiens increases with increases in variance in temperature parameters (Isothermality, temperature seasonality and mean diurnal range) (see Appendix D). The phenological variations of A. reficiens were detected by NDVI of May and August, EVI of January and August. The grasses, crops, and other herbaceous vegetation are likely to turn brown in August and January, while the shrubs and woody vegetation would appear green making it possible to discriminate predominantly A. reficiens infested areas. Due to its deep root system, A. reficiens is likely to absorb moisture from precipitation of the driest months to remain green and can be easily discriminated in the dry months of August, January, February, and March due to contrast in general vegetation cover. With global climate change, the potential distribution of A. reficiens in northern Kenya may increase; thereby expanding the areas at risk of invasion. A. reficiens is an aggressive invader and is expected to increase its water use efficiency in the future allowing it to invade xeric habitats4 (Accessed on the 1st of May, 2020). Its increased probability of presence in wide annual temperature ranges may enable it to out-compete other native species, especially for water resources. The relative probability presence of Opuntia spp. increases steadily with an increase in precipitation of the wettest quarter, precipitation seasonality, and annual precipitation (see Appendix D). They are easily identified in the dry months of August and January by both EVI and NDVI of those months. Opuntia spp. displace native species of plants, degrades the pasture, and inhibits the free movement of wildlife, people, and livestock. It also blocks access to water with a high frequency of replication, creating a dense colony over new areas (Githae, 2019). Most of Opuntia spp. have shoots comprising of flattened stem portions (cladodes) which are relatively tolerant to lower temperatures of −6°C, though extremely endures high temperatures of up 65°C (Nobel et al., 2003). It can thrive in rainfall regimes of 250–1200 mm per year with very hot summers of over 40°C. Opuntia spp. have a superficially extending root system, penetrating in the shallow and rocky substratum. Consequently, precipitation of the driest months reaches to their roots easily and enable them to thrive (Rocchetti et al., 2018).
The accuracy of the models was determined by the AUC value, which can either be ≤0.5 (no-better-than-random) or 1 (perfect). The discriminative ability of species distribution models has been widely tested using AUC statistics. There are concerns about relying on the AUC as the sole measure of model performance (Jiménez-valverde, 2012). Though AUC has been found to perform comparatively better than other measures in scenarios where the species, the target area, and the occurrence data (test and training samples) are uniform across the compared model, same case as this study (Lecours et al., 2016).
Though model overall accuracy is high for current and future maps of the two species, we believe this can be improved by increasing the number of samples within the wider Samburu Laikipia region. Ecological niche models usually suffer some limitations, for instance, over-estimation of the presence of species. MaxEnt uses presence-only data which may lead to high predicted figures for environmental conditions beyond the specified range. Though, this is avoided by applying a threshold value to the output raster (Thapa et al., 2018). The presence-only and climate-based models can potentially contribute to error propagation in the interpretation of the results, for instance, areas visited more often will depict strong geographic bias. The MaxEnt modeling technique employs cross-validation which uses fewer data sets as a way to offset the challenges of data deficiency. Besides, species distribution models can be biased resulting in local biasness and model generalization impacting on model reliability. MaxEnt depends on the jackknife kriging which maintains ordinary kriging simplicity and unbiasedness as well as reducing local-scale bias and over-generalization tendency (Odeny et al., 2019).
Information on current and possible future extent of invasive species would help ecosystem managers focus scarce conservation and restoration resources on areas with a high probability of invasion, narrowing down to areas with high probabilities of suitable environments and regions of lower probabilities values. Habitat suitability thresholds are usually selected subjectively with limited information to guide in choosing appropriate thresholds for presence- dependent modeling (Phillips et al., 2006). The results of this study demonstrated that climate and remotely sensed data can be analyzed to help in the development of predictive models over areas of conservation concern, providing conservationists with vital information in developing current and future eradication and control plans. Early detection methods help in the control or eradication of the invasive species thereby minimizing the control costs (Rejmánek and Pitcairn, 2002). Also, the outcome of this research will help achieve sustainable development goal number 15, which aims at protecting, restoring, and promoting sustainable use of terrestrial ecosystems. This research demonstrated the strengths of citizen science in data collection through a mobile-based application. Through this process, over 1,000 presence points of both A. reficiens and Opuntia spp. have been collected reducing financial and time constraints. By providing invasive species extent and distribution data to the conservation practitioners, the impacts of invasive alien species on land and water ecosystems can be reduced. Formulating policies on informed data would help in achieving the SDG target number 15.8 by 2020, through controlling and eradicating the priority invasive species.
We are cognizant of some challenges associated with species distribution modeling when applied to near and long-term climate projections (Thuiller and Maa, 2009; Jarnevich et al., 2015). In most cases, biological field data are biased representing an untrue picture of species distribution and abundance. Important areas may have been under-sampled, models may be heavily influenced by sample bias, and there may be mismatches in the resolution of sample plots relative to the resolution and accuracy of predictor variables. Furthermore, climate projections, especially long-term climate projections, have unknown (and often unknowable) accuracies and uncertainty associated with them. We view these model results as “hypotheses” that can only be verified and improved with iterative monitoring and modeling (Jarnevich et al., 2015).
Conclusion
Our findings suggest that suitable habitats for A. reficiens and Opuntia spp. are throughout most parts of Laikipia Samburu regions. The seeds from A. reficiens and Opuntia spp. can be dispersed by domestic, wild animals and by run-off water. This explains the distributions of these species mostly along the streams and river banks. The predicted expansion of Opuntia spp. and A. reficiens throughout most of their ranges means that if the seeds continue to be propagated by agents like floods, humans, and animals, increased vigilance is needed to identify and eradicate new invasion with focus on floods, humans, and wildlife dispersal. It will also be important to raise public awareness on the proliferation threats posed by invasive species, identification and, appropriate control measures. For the first time, this research estimated the current and potential extents of A. reficiens and Opuntia spp. in Northern Kenya. Though there was limited occurrence data, we anticipate further expansion of both species in most parts of Laikipia Samburu region. The study revealed that topo-climatic variables combined with remotely-sensed data (vegetation indices) can be used with the invasive species occurrence data in a predictive model to quantify the current and potential extents of A. reficiens and Opuntia spp. The method used is easy and transferable to areas with similar challenges of invasive species. Currently, there is a push for increased evidence-based conservation, with challenges in collecting better site-specific information to prioritize areas for conservation and inform actions on priority areas. Documenting the distribution data on invasive species is important to this end. The predictive maps created from the models are being used as a baseline for current and future monitoring initiatives. Regional governments can use the modeled maps and the distribution data to help conservationists and decision-makers in the formulation of policies to assist in managing and monitoring the ecosystems. For future studies, we propose the inclusion of presence data from the broader Samburu Laikipia area including the species native ranges. High-resolution time-series images and additional variables such as grazing density may result in new findings on the distribution of invasive species in Northern Kenya.
Data Availability Statement
Publicly available datasets were analyzed in this study. This data can be found here: www.worldclim.com.
Author Contributions
All authors listed have made a substantial, direct and intellectual contribution to the work, and approved it for publication.
Conflict of Interest
The authors declare that the research was conducted in the absence of any commercial or financial relationships that could be construed as a potential conflict of interest.
Acknowledgments
The authors are greatly indebted to RCMRD/SERVIR-Eastern and Southern Africa Project, NASA, and USAID for providing the technical support and funding, respectively. Special thanks to Thomas J. Stohlgren and Paul H. Evangelista whose technical advice made a significant contribution to this publication.
Footnotes
- ^ http://mobiledata.rcmrd.org/invspec/
- ^ http://www.worldclim.org/version1
- ^ https://www.worldclim.org/bioclim
- ^ http://www.nbri.org.na/sites/default/files/treeatlas/pdf/TAP_Acacia%20reficiens.pdf
References
Austin, M. (2007). Species distribution models and ecological theory: A critical assessment and some possible new approaches. Ecol. Model. 200, 1–19. doi: 10.1016/j.ecolmodel.2006.07.005
Baldwin, R. A. (2009). Use of maximum entropy modeling in wildlife research. Entropy 11, 854–866. doi: 10.3390/e11040854
Bergmann, C., Roden, P., Bergmann, C., Ulrich, A., and Nüsser, M. (2016). Tracing divergent livelihood pathways in the drylands: A perspective on two spatially proximate locations in Laikipia County, Kenya Tracing divergent livelihood pathways in the drylands: A perspective on two spatially proximate locations in Laikipia Co. J. Arid Environ. 124, 239–248. doi: 10.1016/j.jaridenv.2015.08.004
Dormann, C. F., Elith, J., Bacher, S., Buchmann, C., Carl, G., Carré, G., et al. (2013). Collinearity: A review of methods to deal with it and a simulation study evaluating their performance. Ecography 36, 027–046. doi: 10.1111/j.1600-0587.2012.07348.x
Dymond, C. C., and Johnson, E. A. (2002). Mapping vegetation spatial patterns from modeled water, temperature and solar radiation gradients. ISPRS J. Photogramm. Remote Sens. 57, 69–85. doi: 10.1016/S0924-2716(02)00110-7
Elith, J., Phillips, S. J., Hastie, T., and Dudı, M. (2011). A statistical explanation of MaxEnt for. Divers. Distribut. 17, 43–57. doi: 10.1111/j.1472-4642.2010.00725.x
Githae, E. W. (2019). Status of Opuntia Invasions in the Arid and Semi-Arid Lands of Kenya. Wallingford: CABI, doi: 10.1079/PAVSNNR201813003
Hernández, P. A., Catherine, H. G., Master, L. L., and Albert, D. L. (2006). The effect of sample size and species characteristics on performance of different species distribution modeling methods. Ecography 29, 773–785. doi: 10.1111/j.0906-7590.2006.04700.x
Jarnevich, C. S., Stohlgren, T. J., Kumar, S., Morisette, J. T., and Holcombe, T. R. (2015). Ecological Informatics Caveats for correlative species distribution modeling. Ecol. Inform. 29, 6–15. doi: 10.1016/j.ecoinf.2015.06.007
Jiménez-valverde, A. (2012). Insights into the area under the receiver operating characteristic curve (AUC) as a discrimination measure in species. 5, 498–507. doi: 10.1111/j.1466-8238.2011.00683.x
Jong, Y. A., De, Africa, E., Diversity, P., Program, C., Butynski, T. M., et al. (2015). Laikipia County Geography, Environment, and Biodiversity. Kenya: Eastern Africa Primate Diversity and Conservation Program, doi: 10.13140/RG.2.1.1257.2640
Koh, L. P. (2008). Assessing ecological responses to environmental change using statistical models. J. Appl. Ecol. 45, 1321–1329. doi: 10.1111/j.1365-2664.2007.0
Lecours, V., Brown, C. J., Devillers, R., Lucieer, V. L., and Edinger, N. (2016). Comparing selections of environmental variables for ecological studies: a focus on terrain attributes. PLoS One 11:e0167128. doi: 10.1371/journal.pone.0167128
Merow, C., Smith, M. J., and Silander, J. A. (2013). A practical guide to MaxEnt for modeling species’ distributions: what it does, and why inputs and settings matter. Ecography 36, 1058–1069. doi: 10.1111/j.1600-0587.2013.07872.x
Mitchell, P. J., Monk, J., and Laurenson, L. (2016). Sensitivity of fine-scale species distribution models to locational uncertainty in occurrence data across multiple sample sizes. Methods Ecol. Evol. 8, 12–21. doi: 10.1111/2041-210X.12645
Nobel, P. S., Barrera, E., De, Nobel, P. S., et al. (2003). Tolerances and acclimation to low and high temperatures for cladodes, fruits and roots of a widely cultivated cactus, Opuntia ficus-indica. New Phytol. 157, 271–279.
Obiri, J. F. (2017). Invasive plant species, and their disaster-effects in dry tropical. (forests) and rangelands of Kenya and Tanzania. J. Disaster Risk Stud. 3, 417–428.
Odeny, D., Karanja, F., Mwachala, G., Pellikka, P., and Marchant, R. (2019). Impact of Climate Change on Species Distribution and Carbon Storage of Agroforestry Trees on Isolated East African Mountains. Am. J. Clim. Change 364–386. doi: 10.4236/ajcc.2019.83020
Omondi, P., Bitok, E., Kahindi, O., and Mayienda, R. (2002). Total Aerial Count of Elephants in\nSamburu-Laikipia. Ecosystem
Park, N.-W. (2011). The effects of spatial patterns in low resolution thematic maps on geostatistical downscaling. Korean J. Remote Sens. 27, 625–635. doi: 10.7780/kjrs.2011.27.6.625
Pearson, R. G. (2010). Species’ distribution modeling for conservation educators and practitioners. Lessons Conserv. 3, 54–89. doi: 10.1016/S0140-6736(10)61462-6
Phillips, A. R. S. (2008). A Brief Tutorial on Maxent. Available online at: https://biodiversityinformatics.amnh.org/open_source/maxent/Maxent_tutorial2017.pdf (accessed March 25, 2019).
Phillips, S. J., Anderson, R. P., and Schapire, R. E. (2006). Maximum entropy modeling of species geographic distributions. Ecol. Modell. 190, 231–259. doi: 10.1016/j.ecolmodel.2005.03.026
Ratnayake, R. M. C. S. (2015). Why plant species become invasive? Characters Related to Successful Biological Invasion. Available online at: https://www.researchgate.net/publication/273452847_Why_plant_species_become_invasive (accessed April 20, 2019).
Rejmánek, M., and Pitcairn, M. J. (2002). “When is eradication of exotic pest plants a realistic goal?,” in Turning the Tide: The Eradication of Invasive Species, eds C. R. Veitch and M. N. Clout (Gland: IUCN), 249–253.
Rocchetti, G., Pellizzoni, M., Montesano, D., and Lucini, L. (2018). Italian Opuntia ficus-indica Cladodes as Rich Source of Bioactive Compounds with Health-Promoting Properties. Foods 7:24. doi: 10.3390/foods7020024
Thapa, S., Chitale, V., Rijal, S. J., and Bisht, N. (2018). Understanding the dynamics in distribution of invasive alien plant species under predicted climate change in Western Himalaya Understanding the dynamics in distribution of invasive alien plant species under predicted climate change in Western Himalaya. PLoS One 13:e0195752. doi: 10.1371/journal.pone.0195752
Thomas, S., and Thomas, S. M. (2013). Predicting the Spatial Distribution of an Invasive Plant Species and Modeling Tolerance to Herbivory Using Lythrum salicaria L. as a model system. Graduate Theses and Dissertations, Iowa State University, Iowa.
Thuiller, X., and Maa, W. (2009). Comparing niche- and process-based models to reduce prediction uncertainty in species range shifts under climate change. Ecology 90, 1301–1313. doi: 10.1890/08-0134.1
Wakshum Shiferaw, Demissew, S., and Tamrat Bekele. (2018). Invasive alien plant species in Ethiopia: ecological impacts on biodiversity a review paper. Int. J. Mol. Biol. 3, 169–176. doi: 10.15406/ijmboa.2018.03.00072
Winowiecki, L. A. (2014). Baseline Assessment of Rangeland Health - Kalama and Namunyak Conservancies. Kenya: Northern Rangelands Trust.
Witt, A. (2017). Guide to the Naturalized and Invasive Plants of Laikipia. Wallingford: CAB International, doi: 10.1079/9781786392152.0000
Wittemyer, G., Douglas-hamilton, I., Samburu, L., Kahindi, O., Wittemyer, G., King, J., et al. (2010). Employing participatory surveys to monitor the illegal killing of elephants across diverse land uses in Laikipia – Samburu, Kenya Employing participatory surveys to monitor the illegal killing of elephants across diverse land uses. Afr. J. Ecol. 48, 972–983. doi: 10.1111/j.1365-2028.2009.01200.x
Keywords: invasive species, maxent, modeling, prediction, species distribution modeling, climate
Citation: Ouko E, Omondi S, Mugo R, Wahome A, Kasera K, Nkurunziza E, Kiema J, Flores A, Adams EC, Kuraru S and Wambua M (2020) Modeling Invasive Plant Species in Kenya’s Northern Rangelands. Front. Environ. Sci. 8:69. doi: 10.3389/fenvs.2020.00069
Received: 01 May 2019; Accepted: 11 May 2020;
Published: 11 June 2020.
Edited by:
Niall Patrick Hanan, New Mexico State University, United StatesReviewed by:
Jamil Hasan Kazmi, University of Karachi, PakistanWenjie Ji, New Mexico State University, United States
David W. Kimiti, Other, Isiolo, Kenya
Copyright © 2020 Ouko, Omondi, Mugo, Wahome, Kasera, Nkurunziza, Kiema, Flores, Adams, Kuraru and Wambua. This is an open-access article distributed under the terms of the Creative Commons Attribution License (CC BY). The use, distribution or reproduction in other forums is permitted, provided the original author(s) and the copyright owner(s) are credited and that the original publication in this journal is cited, in accordance with accepted academic practice. No use, distribution or reproduction is permitted which does not comply with these terms.
*Correspondence: Edward Ouko, ZW91a29AcmNtcmQub3Jn; Samson Kuraru, U2Ftc29uLmt1cmFydUBucnQta2VueWEub3Jn