 Christine Moore1*
 Alexandra C. Morel1,2
 Rebecca Ashley Asare3Michael Adu Sasu3
 Stephen Adu-Bredu4
 Yadvinder Malhi1
- 1School of Geography and the Environment, Environmental Change Institute, University of Oxford, Oxford, United Kingdom
- 2Institute of Zoology, Zoological Society of London, London, United Kingdom
- 3Nature Conservation Research Centre, Accra, Ghana
- 4CSIR-Forestry Research Institute of Ghana, Kumasi, Ghana
Quantifying human impact on the environment is increasingly important and particularly so in complex mosaic landscapes. Such landscapes are prolific in the developing world, notably in West African, small holder cocoa farming communities. Human Appropriated Net Primary Productivity (HANPP) is a metric which has been developed to quantify the human impact on the environment and has been used in a number of studies globally. However, most operationalization's of HANPP have been done on a coarse global scale or a very local scale, and few studies exist of complex mosaic landscapes. This study utilizes Unmanned Autonomous Vehicles (UAV), or drones, to classify land use and HANPP for three cocoa farming regions in Ghana's Central Region. The results of the study indicate while all regions differ in land use composition, the primary crop for all is cocoa, followed by palm and then land that was previously cultivated which has been left fallow. The average HANPP was 44% for all measured regions, calculated using net primary productivity (NPP) values of an adjacent natural tropical forest. The HANPP for the three regions studied was found to be approximately 6.69, 8.00, and 9.85 Mg C ha−1 yr−1. These values are higher than those that have been reported in some widely accepted global studies, and highlight the need for more regional and landscape scale studies to supplement global assessments of HANPP.
Introduction
Understanding and quantifying human impact on the biosphere is increasingly important in the face of global climate change and large-scale land conversion. Under climate change, it is predicted that these tropical regions will experience increases in inter-annual variability of seasonality, accompanied by increasing uncertainty around the intensity, arrival and duration of rainfall events (Feng et al., 2013). Further, these regions have undergone, and continue to undergo, significant land conversion, often resulting in highly biodiverse landscapes being replaced with large-scale monocropping systems or small-scale mixed cropping systems (Laurance et al., 2014). While significant research has been done on the conversion of tropical regions to large scale monocropping systems (Koh and Wilcove, 2008; Fox et al., 2014; Bonini et al., 2018) the dynamics of land use and land conversion in small scale mixed cropping systems have received less attention (Collier and Dercon, 2014). Small scale farming is particularly prevalent in tropical West Africa, where farmers typically keep farms of <5 ha, and also undertake primarily rain-fed agriculture practices (Morton, 2007; Rapsomanikis, 2015). These factors, combined with extensive poverty amongst farmers, result in highly complex, and potentially vulnerable agricultural systems.
Most human uses of land are dependent on the land's biological productivity, in other words it's Net Primary Productivity (NPP) per area, which is the annual rate of production of living biomass (Imhoff et al., 2004). However, this metric alone cannot provide sufficient evidence for the relationship between the NPP of a natural landscape, and the NPP of the human modified landscape. Understanding and quantifying this distinction is of principle importance when seeking to understand the complex relationships between humans and the biosphere. As a result, Human Appropriation of Net Primary Productivity (HANPP) has emerged as a primary indicator which explicitly addresses the social-ecological nature of human use and conversion of land systems. The indicator is a measure of the difference between the NPP of the potential vegetation (NPPpot) had the ecosystem not been altered by humans and the unexploited NPP of the actual vegetation (NPPeco) present (Figure 1). HANPP can be further dissociated into HANPPharv which describes the biomass which is exploited from the ecosystem (either as harvest material which is removed from the system, or unused harvest [e.g., slash] that remains in the ecosystem) and the land-use change-associated HANPPluc which describes the difference in total ecosystem NPP caused by the conversion of the native vegetation to the current land use (Haberl et al., 2014).
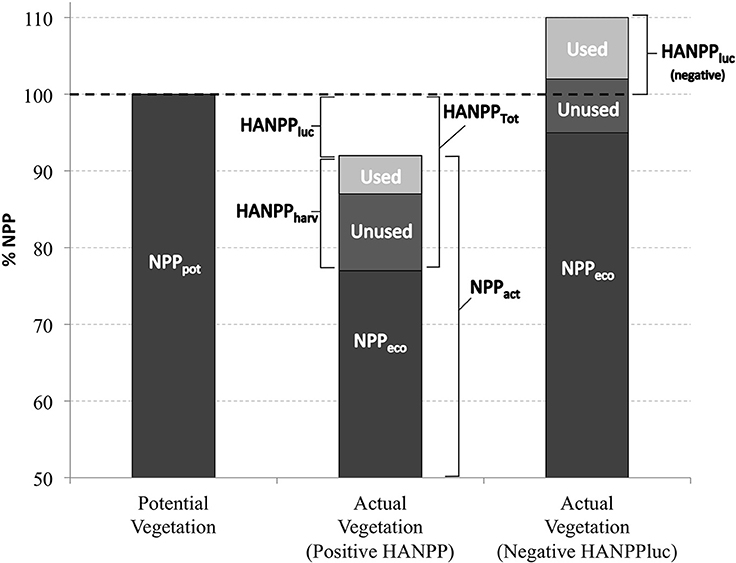
Figure 1. How to measure the HANPP of a landscape. HANPP is a combination of HANPPharv [the NPP harvested, whether it is used (removed from the landscape) or unused (left in the landscape)] and HANPPluc (the change in NPP induced by conversion of the native ecosystem to the current land). The actual NPP of the converted landscape includes both the NPPeco (NPP of the current ecosystem) and HANPPharv. If the combination of HANPPharv and NPPeco are lower than NPPpot, HANPPluc is postive and added to generate HANPPTot. However, if the combination of NPPeco and HANPPharv is higher than NPPpot, HANPPluc is then subtracted to determine HANPPTot.
Values for HANPP can vary substantially based on the background NPP (natural vegetation), the level of conversion which has occurred and the level of inputs in the form of fertilizers, irrigation etc. HANPP is often displayed as a percentage of NPP potential, where urban areas which have undergone substantial land use conversion might have a value close to 100% HANPP. For diverse tropical systems, it is rare to observe values of HANPP for converted landscapes which exceed that of the background vegetation (Figure 1). For example, agriculture in these regions is primarily rain fed, and many farmers lack the ability to input fertilizers on a consistent basis which may artificially decrease the percent of HANPP. Conversely, the input of fertilizers or irrigation can make some landscapes more productive than the baseline natural vegetation, for example agriculture in Saudi Arabia can generate HANPP values in excess of −100% (in other words at least 100% more productive than the background landscape; Haberl et al., 2014).
While HANPP is a widely accepted indicator, with many studies cross validating one another's results (Haberl et al., 2007, 2014) there is a dearth of research studies using field collected, embedded data to assess HANPP. Further, any measures of HANPP from such data need to be scaled up with relative accuracy to provide a scale of assessment comparable to regional, national, and global HANPP studies. Scaling of such data can be achieved via remote sensing, however the most common approaches, using satellite derived remote sensing imagery remain difficult to utilize in most tropical regions, notably West Africa. The perennial prevalence of clouds and seasonal interference of the Harmattan (haze and dust carried down from the Sahara) render many image collections unviable. Specifically, there remains a lack of imagery which is collected at a fine enough spatial resolution to capture the subtleties of small holder complex mosaic landscapes while also being captured frequently enough to acquire infrequent cloud-free, interference free conditions (Kuemmerle et al., 2013). This highlights the clear need to develop methods which can incorporate and scale up ground based assessments of HANPP.
One strategy which could address this apparent scale-gap, is utilizing novel Unmanned Ariel Vehicles (UAVs, commonly referred to as drones) to capture landscape and regional scale land use data, at extremely high resolutions (~10 cm2). Today, commercial UAVs offer low cost and high-resolution imagery well-suited to complex mosaic landscapes, but have until recently rarely been exploited to address this challenge. UAV-derived data can eliminate the interference of factors such as clouds or haze, while providing users with moderately large tracks (~1 km2 per flight) of highly detailed landscape data. The resulting imagery can be used to scale up local and ground based HANPP data in such a way that comparison between ground based data, and satellite imagery becomes possible. Thus, UAV imagery can fill the scale gap which allows comparison of field collected data with the standard global scale HANPP maps which have served as the basis for most HANPP studies thus far.
Case Study: Complex Cocoa Landscapes in Ghana
This kind of approach is particularly needed in tropical West Africa, where smallholder agriculture is the primary driver behind land cover change (Vittek et al., 2014)1. While many people in rural areas cultivate numerous subsistence crops such as cassava or plantain, substantial land transformation has occurred to support the cultivation of cocoa trees (Kolavalli and Vigneri, 2011). Together, Cote d'Ivoire and Ghana produce 70% of the world's cocoa, much of which is grown in regions which were historically tropical forest. In Ghana, cocoa beans and associated products account for ~60% of export earnings. Further, cocoa contributes ~10% of the agricultural GDP, providing employment to over 800,000 households (Vigneri and Kollavali, 2018). Farmers in the cocoa zones of these two countries typically cultivate farms of <5 ha, and often utilize their plots for a diversity of crop types. As a result, while cocoa trees dominate the landscape, the remaining land is used to cultivate a variety of other subsistence crops, interspersed with fallow land and large shade trees. This results in highly complex and fine-scale landscape of cocoa, subsistence crops, remnant tropical forest, and fallowed areas. The importance of understanding the land use in these regions cannot be understated, especially when considering the lack of success many global products have at detecting and mapping deforestation in tropical areas (Grainger, 2008). As such, operationalizing the measure of HANPP at a scale which is comparable with both local and global surveys is of particular relevance.
In order to determine the HANPP of such a mosaic landscape, detailed measures of HANPP of cocoa must be determined. Recent work by Morel et al. (2019) generated detailed site-level data of NPP and HANPP in cocoa farms in the Central Region of Ghana. The study reported a strong relationship between cocoa farm characteristics, namely shade tree density and cocoa tree density, and HANPP. The high level of correlation between these factors indicate that if the cocoa density and shade tree density can be measured at a larger scale, HANPP for an entire cocoa mosaic landscapes could be accurately predicted.
Here we present a novel medium-scale study of HANPP in a mosaic tree crop and agricultural landscape in West Africa. Our work combines results from detailed in situ studies of NPP and HANPP, with landscape extrapolation based on maps of vegetation cover generated from high resolution imagery collected from a UAV. Further, this study is the first attempt to reliably scale up ground-based measures to a scale comparable to the grain size of benchmark global studies of HANPP.
We address the following questions:
• What are the patterns of land use in our case study tropical mosaic landscape, and how much does cocoa dominate this landscape?
• What is the HANPP associated with this landscape, and how does it vary across the landscape?
• How well do large scale products capture the HANPP that we have quantified at the fine scale?
Methods
Study Site and SupportingMaterials
This study was carried out in the Central Region of southern Ghana around six communities bordering Kakum Conservation Area (5°33′42.712′′ N, 1°20′ 55.234′′ W; see Figure 2). The area of study was further subdivided into three distinct regions, each inclusive of two focal villages and the surrounding land use areas, following the sampling design of Morel et al. (2019). These regions are: AB (including the villages of Aboabo and Asorefie), HM (including the villages of Homaho and Nsuoekyi), and KA (including the villages of Kwame Amoabeng and Tufokrom). The entire landscape, inclusive of AB, HM, and KA, is typified to a high extent by small holder cocoa farmers, who produce cocoa, as well as oil palm (which is native to this region and is a food crop), and subsistence crops such as vegetables (Hirons et al., 2018a). The work was carried out as a part of the larger ECOLIMITS project which collected data between 2014 and 2017 to better understand the relationship between poverty and ecosystem services (Hirons et al., 2018b). The project intensively monitored two forest plots within Kakum National Park as well as eight cocoa farm plots under varying levels of management intensity for NPP and HANPP over 3 years as well as collected above ground biomass and cocoa yield data for 28 additional plots (Morel et al., 2019). Each of the intensive plots was 60 × 60 m (0.36 ha), and field measurements followed the Global Ecosystems Monitoring (GEM) protocol (Marthews et al., 2014). For shade trees, three components of NPP were estimated (canopy NPP, woody NPP, and fine root NPP). These components were also measured for cocoa trees in addition to the estimated NPP of cocoa pod production. Detailed descriptions of the full methods used to generate the NPP of cocoa farms as well the background forest NPP can be found in Morel et al. (2019). NPP values for the cocoa farms were then compared to NPP values collected for the conservation area forest plots (~17 Mg C ha−1 yr−1) to generate an estimate of HANPP of the cocoa farms. While high, these values are comparable to several other tropical regions and other studies have confirmed that West Africa has very high NPP values (Moore et al., 2017). Further, this value sits within upper bounds calculated for synthesis studies of tropical forest NPP (Clark et al., 2001).
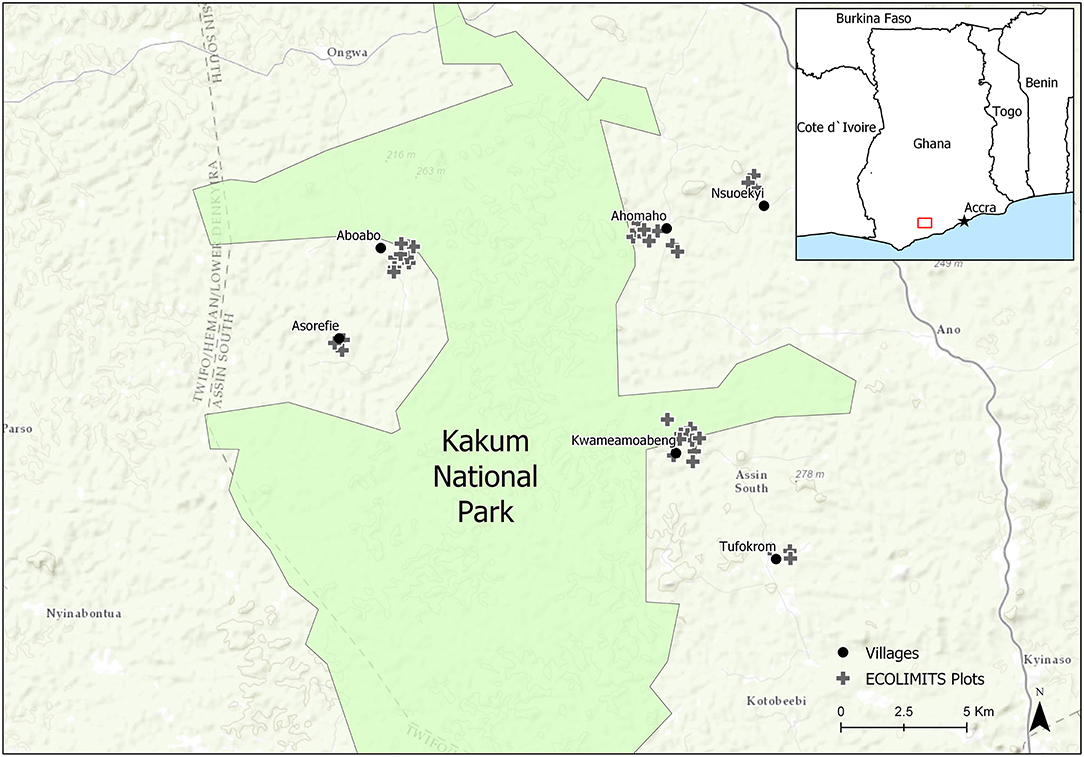
Figure 2. Study sites for the ECOLIMITS project surrounding Kakum National Park in southern Ghana. ECOLIMITS ecological plots (+) were intensively monitored for 3 years between 2014 and 2017. Six villages (•) where the household surveys for the ECOLIMITS project were conducted.
Drone Image Collection and Processing
Image Data Collection
Aerial data were collected between November 2016 and January 2017. Data were collecting using DJI Phantom 3 Professional drones (www.dji.com). Each drone is equipped with a 12.4 Megapixel RGB camera. Areas surrounding each community were divided into 1 km2 grids. Flights were then conducted as close to the center of these grids as possible. Each flight aimed to capture ~1 km2 area. Flights were flown at 120–220 m above ground level, where flight height was dependent on factors such as cloud cover, and Harmattan (dry season Saharan dust haze) conditions. The drone operation software DJI GO and Pix4D were used to carry out the drone surveys. Data were captured as individual pictures taken sequentially, with minimum 70% side overlap, and minimum 60% top/bottom overlap. This level of overlap is consistent with expert opinion on the overlap needed to generate orthomosaic images of each flight (where all individual images are rendered together to create a single, large GeoTIFF of each flight).
Drone Data Processing
After trying a number of options and facing several challenges, it was found that drone imagery could best be processed using a combination of software, including DroneDeploy2, Event 38 Unmanned Systems (Drone Data Management System (DDMS), 2018), ArcGIS 10.0 (ESRI, 2018), and Affinity Photo3 (Figure 3). Drone images were processed in single flight batches, and the resulting orthomosaics which were produced varied in size from 0.75 to 1.6 km2. Size variation was due to flight duration, flying height and conditions, such as wind, on the day of the flight.
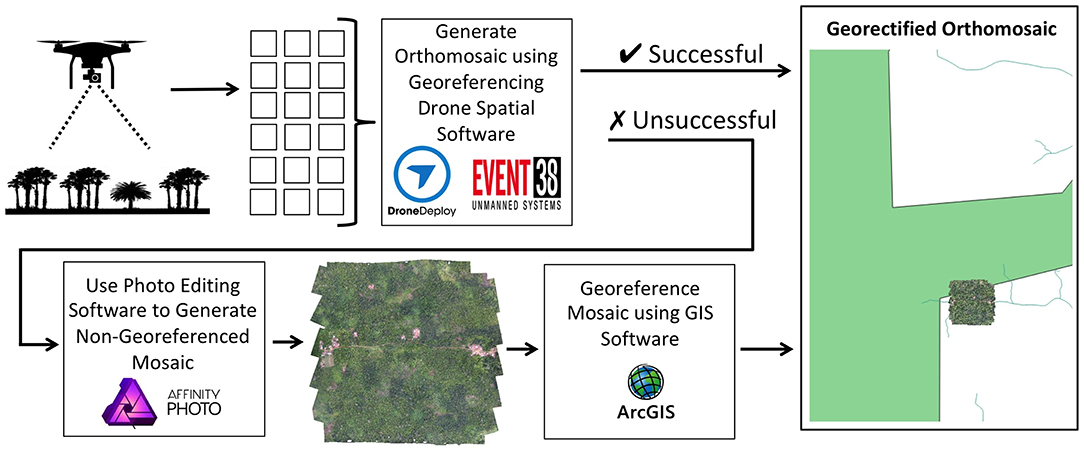
Figure 3. Drone image processing workflow: data were captured from the drone as individual images. These were then fed into drone spatial software capable of generating georectified orthomosaics (i.e., Drone Deploy, Event 38 unmanned systems). If these softwares were incapable of producing an orthomosaic, the images were fed into an advanced image editing software (Affinity Photo). The resulting orthomosaic was not georeferenced, so it was then uploaded to GIS software capable of georeferencing (ArcGIS) to produce a final georectified orthomosaic.
Land Use Classification and Cocoa Data Processing
Land-use categories and classification
Land use was determined by undertaking manual classification of the drone images using QGIS software to produce a land use vector layer. The very high resolution of the imagery made it possible to easily distinguish different land use types. Classification was carried out by one individual (the lead author), who trained using ground truth points to establish confidence in the resulting land use classifications. Land use was partitioned into nine categories: Cocoa (CCO), Cocoa with Timber Trees (CTT), Cassava (CSV), Fallow (FAL), Grass (GRS), Palm (PLM), Plantain/Banana (PLB), Settlement (SET), and Vegetables (VEG) (Table 1).
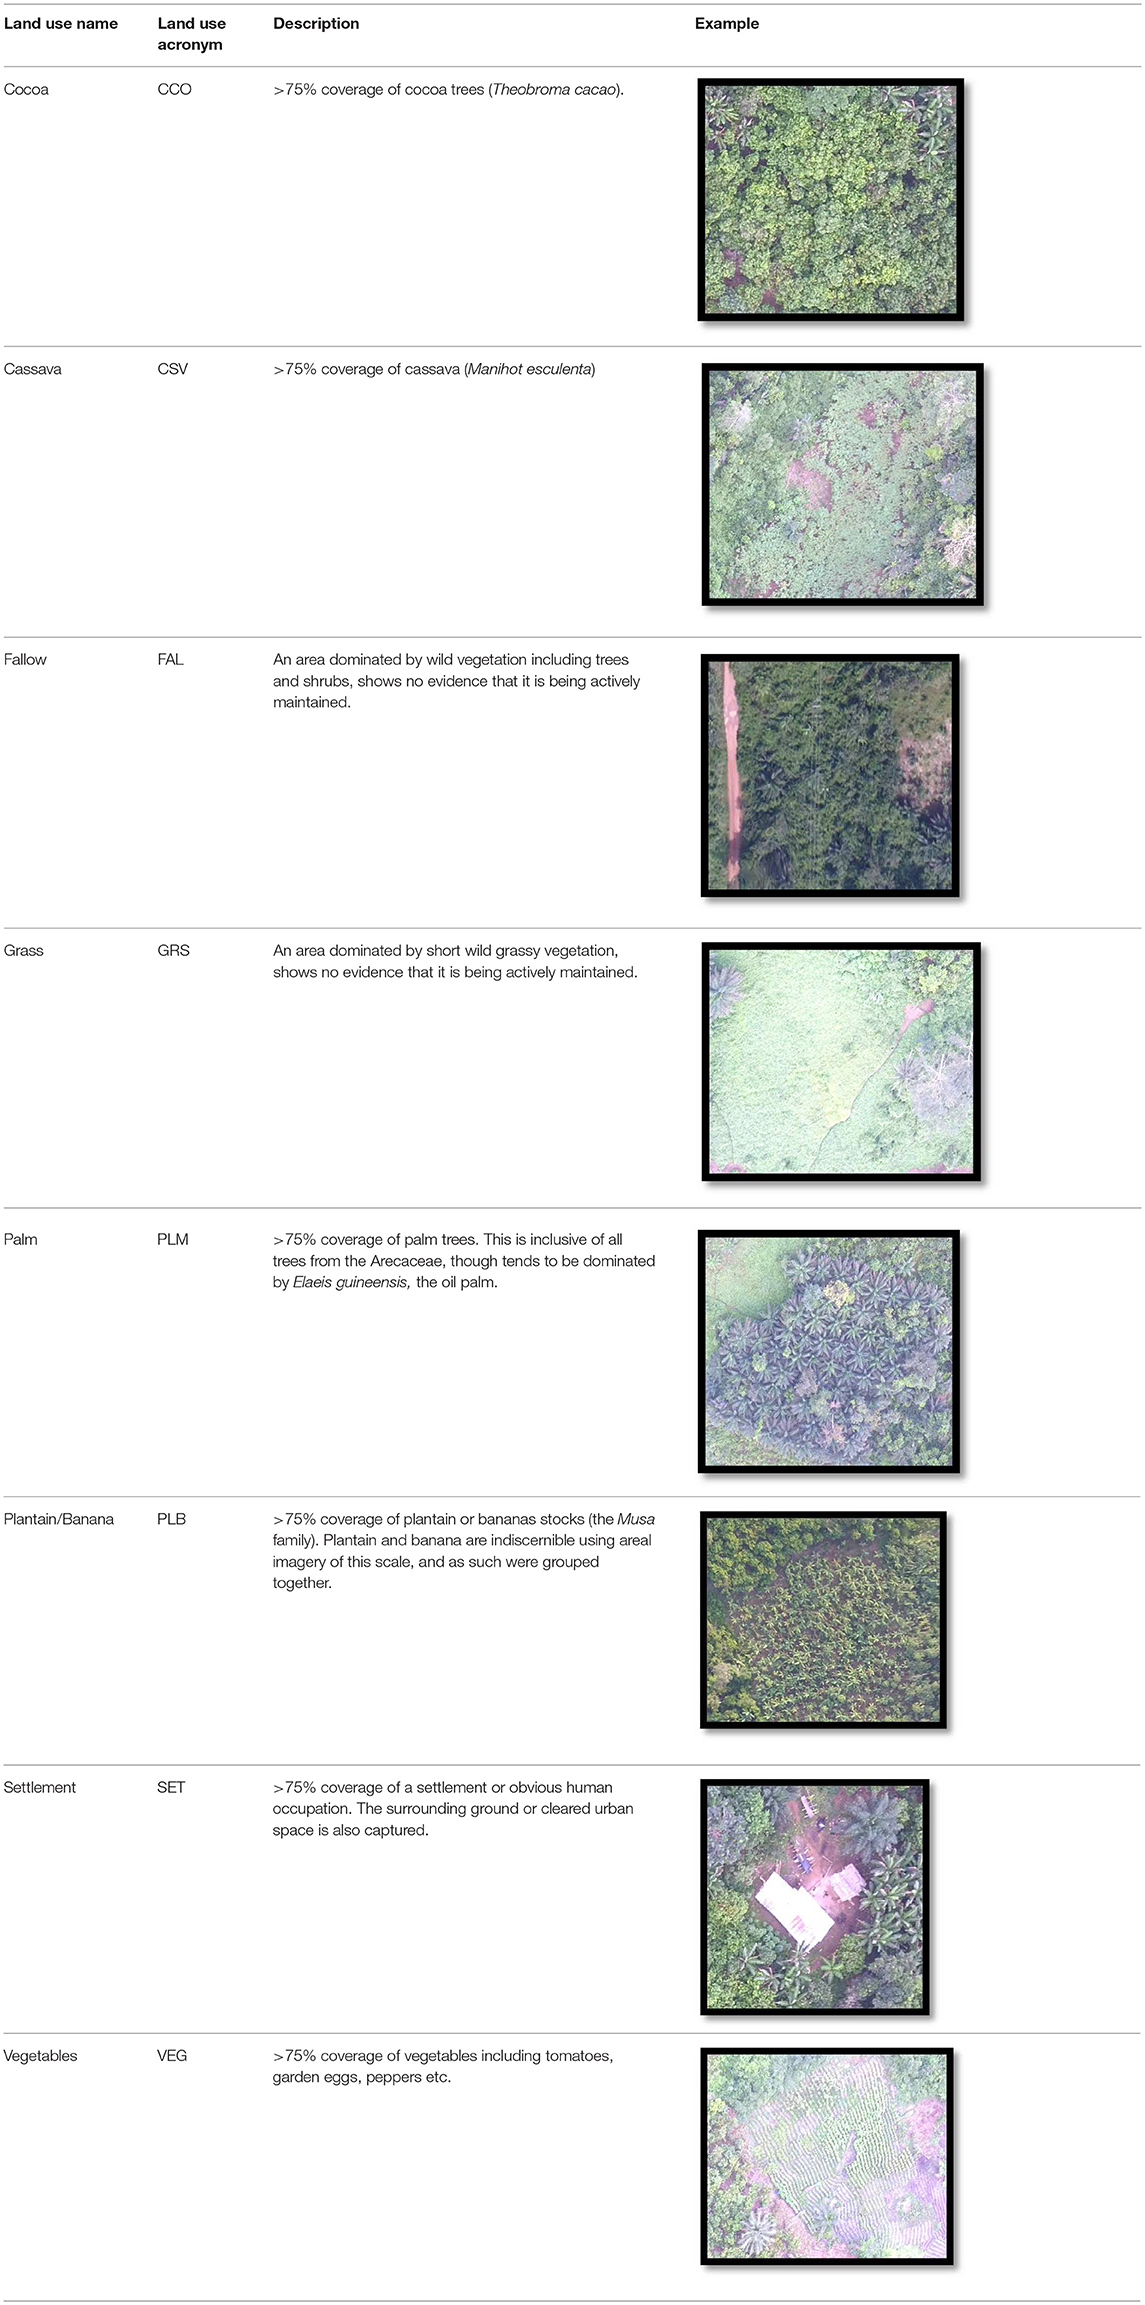
Table 1. Description of dominant land use classes in regions surrounding Kakum National Park.
Manual classification of the landscape yielded classifications for 90% of the captured land cover (Figure 4). The remaining 10% of land-use could not be discerned confidently using the drone imagery, however the areas were classified into one of two additional classes via manual classification, so that landscape level estimates of land use could be determined. The two additional classifications which were included were listed as distorted and unknown. Distorted was the class given to areas of the landscape where the images had become distorted, typically during the mosaic stitching process, or were too blurry to classify with confidence (often due to the drone changing direction). Additionally, Unknown was used to classify areas of the landscape which could not be classified with confidence, and could potentially include any of the utilized land use types presenting in a non-standard way (i.e., potentially very young cocoa) or alternate land-use types, such as rice.
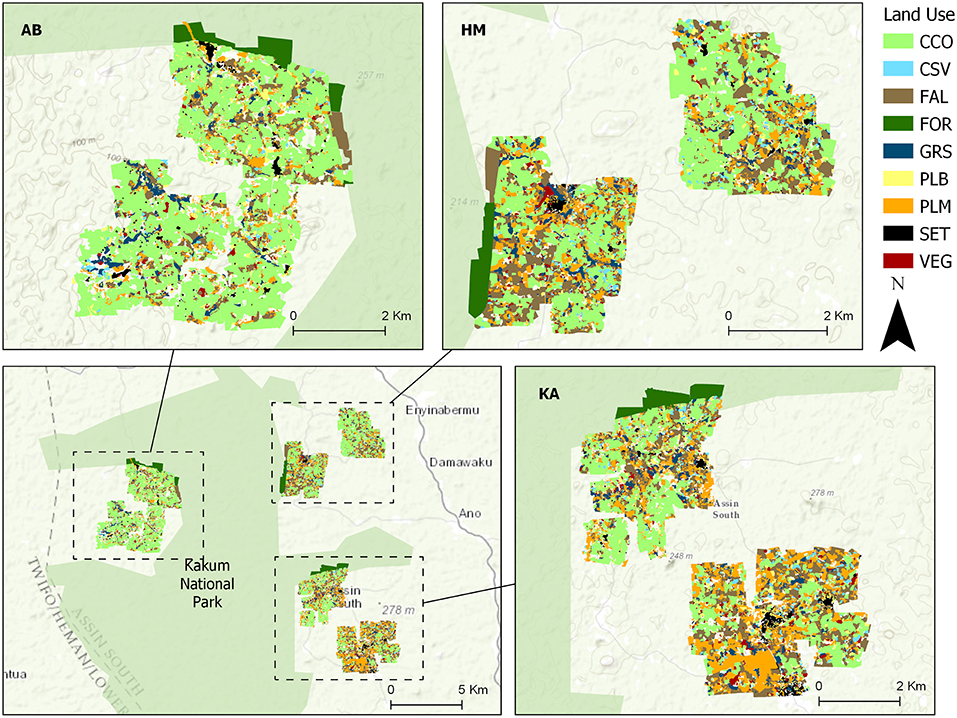
Figure 4. Land use classifications in the Aboabo (AB), Homaho (HM), and Kwameamoabeng (KA) regions of the Central Region of Ghana captured using drone imagery. Land use classifications include cocoa (CCO), cassava (CSV), fallow (FAL), forest (FOR), grassy fallow (GRS), plantain/banana (PLB), palm trees (PLM), settlements (SET), and vegetables (VEG). These communities border Kakum National Park which can be seen in the bottom left inset, depicted in green.
Detailed processing of cocoa
The land use classifications were used to clip the drone mosaics to produce rasters for analysis. Cocoa land use was further clipped from the rasters to generate cocoa only rasters. These rasters were then examined in detail and timber trees were isolated, while also removing other land-uses which were not captured in the original classification. To focus NPP/HANPP calculations on solely cocoa areas, bare ground visible between cocoa trees was removed using interactive supervised classification in ArcGIS Map 10.0.
Cocoa density was determined by comparing different estimates of cocoa density with ground-truthed data from the eight cocoa farm plots. The cocoa density measures were then calibrated using these data, and then scaled up to determine the cocoa density per hectare for the drone-sampled area.
HANPP Calculations
Measures of HANPP for cocoa
Calculations described by Morel et al. (2019) indicate that HANPP for cocoa could be estimated with relatively high accuracy from cocoa tree density and number of shade trees (Figure 5). Values for HANPP varied from −4.6 to 5.2 Mg C ha-1 yr-1 or across the plots, with the negative values being recorded at a particularly shade-tree dense, young cocoa farm, and an older farm managed largely for timber. The model suggests that density of shade trees is the largest driver of HANPP in cocoa farms, followed to a lesser extent by cocoa tree density (R2 = 0.859, p < 0.01; Figure 5). As both, or either, of the variables increase, the level of HANPP decreases.
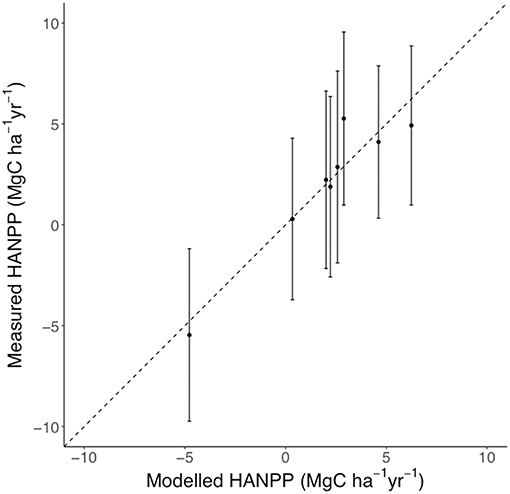
Figure 5. The relationship between measured HANPP and modeled HANPP using cocoa density and shade tree density per hectare as indicators (r2 = 0.86). Adapted from Morel et al. (2019).
Cocoa density could not be accurately determined using the drone data, so two values for cocoa density were used initially used. The first value was 600 trees/ha which was the average cocoa tree density reported by Morel et al. (2019). The second was 719 trees/ha which was the maximum cocoa tree density reported by Morel et al. (2019). This value was chosen due to the removal of ‘ground' from cocoa raster's described above, thereby resulting in a higher than average cocoa density.
The HANPP levels of cocoa were then determined using the following equation derived by Morel et al. (2019).
HANPP values for cocoa were calculated using a 1 ha grid overlaid over all study regions. In order to decrease random bias which may emerge from using a single grid, the results of this grid were compared to three other grids, each offset by 0.5 ha from the original, as well as a tessellated 0.25 ha grid. There was found to be no significant difference between the grid approaches, so the first grid was used.
HANPP levels for other land-use
HANPP levels for the remaining classified land uses were derived from NPP estimates taken from multiple literature sources for each land use. HANPP was then calculated by subtracting the resulting average NPP value for each land use from the natural NPP levels from Kakum National park, measured by Morel et al. (2019) to be 17 Mg C ha−1 yr−1 (Table 2). The calculation of HANPP normally explicitly includes the land use and harvested components of NPP, however the calculation used here automatically combines those two factors due to the harvested component (yield) already being accounted for in the calculation of NPP from literature values.
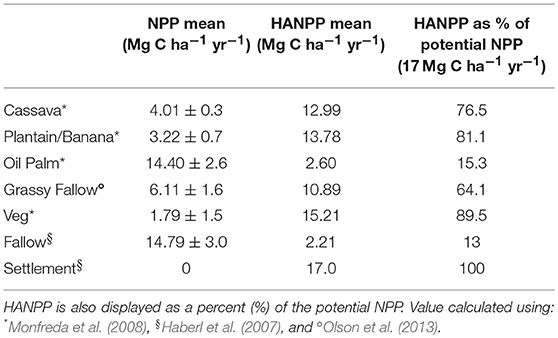
Table 2. Mean NPP and HANPP values for land uses within the study region.
HANPP values for Cassava, Plantain/Banana, Oil Plam, and Vegetables were determined using methods proposed by Monfreda et al. (2008), along with average yield estimates from various sources (detailed in Table S1). HANPP values for fallow and grassy fallow were derived using values from the literature (Haberl et al., 2007; Olson et al., 2013), while the HANPP value proposed by Haberl et al. (2007) for urban was used as a proxy for settlement (Table 2; Table S1). Detailed accounts of each calculation are provided in Supplementary Materials.
Overall HANPP calculations
Median HANPP values were calculated for each region using derived cocoa values and values from the literature as described above. Due to relatively small sample sizes for each of the literature-derived values, Monte Carlo simulation was carried out to propagate uncertainty of the values presented.
Results
General Summary Information
The total area covered by the drone surveys for the all regions ranged from 20.62 km2 for AB, to 17.73 km2 for HM, to 21.88 km2 for KA, ~62 km2 in total (Table 3). On average, 90% of the land use in each region was classified (~54 km2 in total). Cocoa was the most prominent crop in each area: the proportion of cocoa varied from 52.78% in AB, to 40.24% in HM to 26.60% in KA. In the AB and HM regions, the next most dominant land class was fallow lands which constituted 11.11 and 21.58%, respectively. For both regions the following most dominant land class was palm oil at 8.78 and 15.75%, respectively. The KA region differed from the others most notably both in the proportionally smaller cocoa crop area, but also the much higher presence of palm oil (25.81%), a similar land area to the cocoa crops (Figure S1).
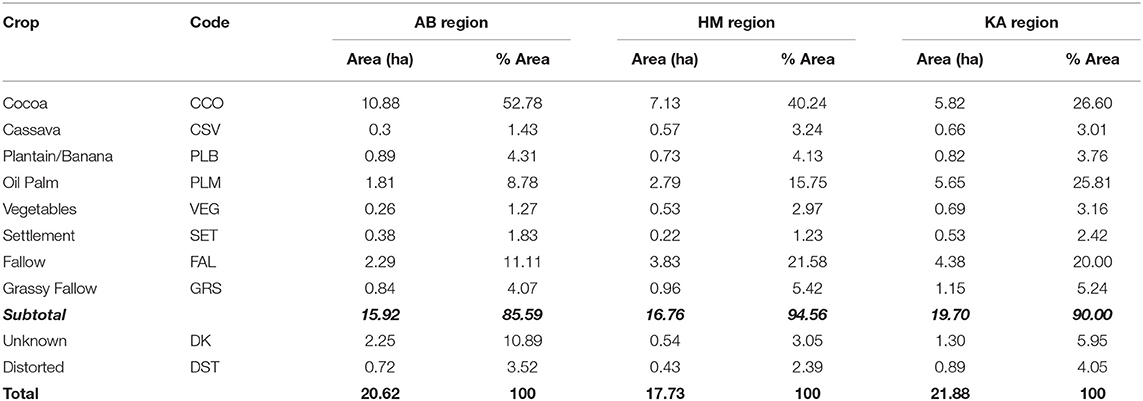
Table 3. Land use codes, area covered per land use, and percent land use for all the regions.
Cocoa Density and HANPP
The HANPP levels for cocoa were calculated using two different cocoa densities, 600 trees/ha, and 719 trees/ha. When assuming a cocoa density of 600, overall average HANPP was 6.15 ± 0.73 Mg C ha−1 yr−1, with the regional average HANPP values ranging from 6.41 ± 0.86 Mg C ha−1 yr−1 for AB to 5.95 ± 0.86 Mg C ha−1 yr−1 for HM to 5.98 ± 0.85 Mg C ha−1 yr−1 for KA (Figure S2). The average HANPP value as a percent of NPPpot was 36%, with each region being 38, 35, and 35%. When assuming a cocoa density of 719, overall average HANPP was 5.71 ± 0.73 Mg C ha−1 yr−1, with the regional average HANPP values ranging from 5.97 ± 0.36 Mg C ha−1 yr−1 for AB to 5.51 ± 0.86 Mg C ha−1 yr−1 for HM to 5.54 ± 0.85 Mg C ha−1 yr−1 for KA (Figure S2). These values were slightly lower as a percentage of NPPpot, with an average value of 34%, with each region being 35, 32, and 33%. Henceforth we report using only results with a cocoa density of 600 trees/ha, the mean cocoa density reported for our study.
Total NPP and HANPP
NPP values per region varied as expected depending on the percent land use of each type (Figure 6; Figure S3). Cocoa was the most dominant land use in all areas, and therefore had a disproportionate influence on the average NPP per hectare. With a cocoa density of 600 trees/ha, the median NPP per hectare was 10.31 ± 0.48, 9.00 ± 0.96, and 7.15 ± 1.39 Mg C ha−1 yr−1.The distributions of NPP values in each area peaked around 11–12 Mg C ha−1 yr−1 due to the dominance of cocoa on the landscape. This peak was particularly notable in the AB region. The distribution of NPP values in KA also had a second peak around 2–3 Mg C ha−1 yr−1 due to the prevalence of palm trees within that region (Figure S4).When using 17 Mg C ha−1 yr−1 as the baseline NPP for the natural forest, the median HANPP values were then calculated to be 6.69, 8.00, and 9.85 Mg C ha−1 yr−1 for AB, HM, and KA respectively (Figure 7). These values represent 39, 47, and 56% of the NPPpot.
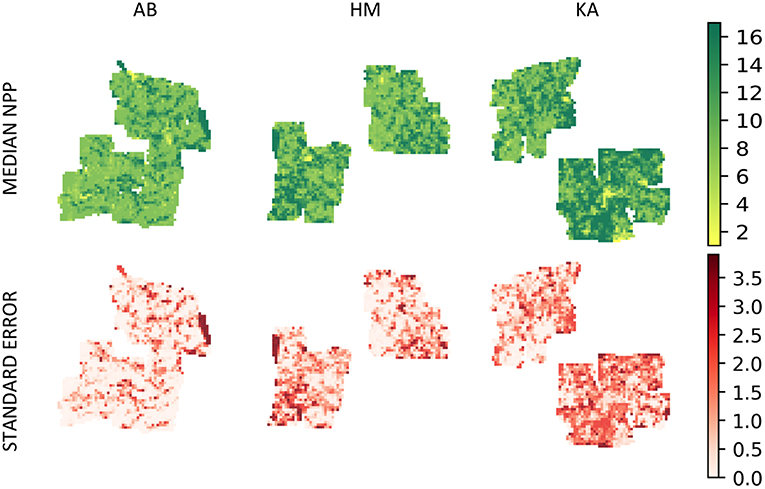
Figure 6. NPP and standard deviation values per hectare of the AB, HM, and KA regions assuming a density of 600 trees per hectare.
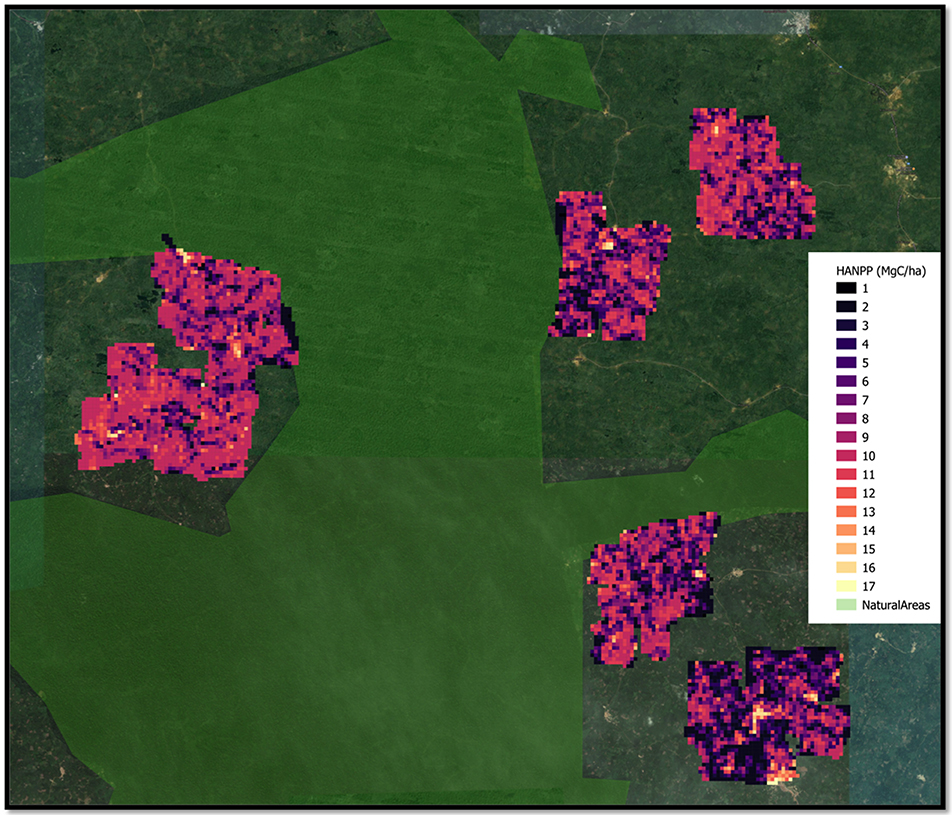
Figure 7. HANPP for all measured regions surrounding Kakum National Park.
Discussion
The results of this study highlight the significant and diverse land use practices in this complex mosaic landscape. Further, the application of HANPP as a focal metric, demonstrates the intensity of land use in the region, while also highlighting the diversity of land use practice and intensity within and between three regions surrounding Kakum National Park. Finally, the use of a novel UAV approach to capture data was successful, capturing a substantial area of land (~62 km2), where 90% was classified by land use (~54 km2) to a very high degree of resolution (<10 cm2).
Diversity of Land Use Across Regions
Each region of study surrounding the Kakum Conservation Area displayed a diversity of different land use practices. In all regions of study, the most dominant crop was cocoa, constituting ~53, ~40, and ~27% of overall land cover in Aboabo, Homaho, and Kwame Amoabeng. Given the prominence of cocoa production in the region, it could have been assumed that cocoa production may have been more uniform between regions. However, the high resolution imagery used in this study indicates a much more complex and diverse scenario. The westernmost region containing the villages of Aboabo and Asorefie (Figure 3, AB) had the highest density of cocoa farms. Both this region and the HM region (north eastern region containing the villages of Homaho and Nsuoekyi; Figure 3, HM) were dominated by cocoa trees. The next most dominant land use types in both areas were fallow areas followed by palm trees.
The third region in the south east, containing the villages of Kwame Amoabeng and Tofukrom (Figure 3, KA), had considerably different land use practices. The area of the land which was cocoa (~27%) was only marginally larger than the area which was used for palm tree cultivation (~26%). It is probable that there are some portions of the palm tree cultivation in all areas, but especially in the KA region, which are also used for the production of palm wine. Palm wine production involves completely felling the trees, but some farmers only use palm trees for the production of palm wine after a tree has surpassed its peak production for palm oil (Taabazuing et al., 2012). This could be assumed to be the common practice for all regions, but within the KA region there is a much larger emphasis on the production of palm wine, than in the other regions. This may explain the proportionally higher density of palm production in the region. Further, the KA region is under significantly different land tenure arrangements than the other study regions. For example, it is not a requirement to cultivate cocoa in the KA region, while in the AB and HM regions it is a requirement of many of the land tenure agreements.
Following cocoa and palm, fallowed areas were found to occupy the next most significant proportion of the landscape in each of the regions studied. In Ghana, given the availability of land for agriculture, and the expense of products such as fertilizer and pesticides, the primary mechanism for farmers to increase yields is by fallowing. However, due to uncertainty associated with a lack of land tenure rights, farmers with fewer land tenure rights tend to fallow land for shorter periods of time (Goldstein and Udry, 2008). This could provide a possible explanation for the relatively smaller proportion of fallowed and grassy fallow land (~14%) in the AB region, than in the other regions (~26%).
Contribution of Cocoa to HANPP
The average HANPP values for cocoa for each region were 6.41 ± 0.86 Mg C ha−1 yr−1 for AB to 5.95 ± 0.86 Mg C ha−1 yr−1 for HM to 5.98 ± 0.85 Mg C ha−1 yr−1 for KA, when assuming a cocoa density of 600 trees per hectare. Each value decreased by ~0.4 Mg C ha−1 yr−1 when the cocoa density was assumed to be 719 trees per hectare. The cocoa density did not appear to have a significant impact on the variation in HANPP values for each region. While there remain a lack of studies which explicitly look at the HANPP of cocoa, some studies examine the NPP of cocoa across different tropical landscapes. Abou Rajab et al. (2016) reported cocoa NPP varying from 7.4 to 9.1 Mg C ha−1 yr−1 and Moser et al. (2010) reported NPP values of 8.46 to 9.13 Mg C ha−1 yr−1, both for cocoa farms of varying shade levels (monoculture to shaded intercropping) in Indonesia. These values are lower than those for our study which ranged from 10.59 to 11.05 Mg C ha−1 yr−1. The high productivity noted in tropical forests of Ghana (Moore et al., 2017; Morel et al., 2019) could possibly explain these differences.
One feature of the HANPP of cocoa which this study was not able to determine was the contribution of cocoa pod production to HANPP, due to the inability to use aerial data to determine cocoa pod abundance or harvest. Other studies have highlighted contribution of cocoa pod production in determining the HANPP of a cocoa farm, at times resulting in farms appearing more productive than baseline forest landscape (Morel et al., 2019). However, pod production was not easily predicted from cocoa or shade tree density. For this system, Morel et al. (2019) reported pod production as responsible for ~3% of NPP. Given the propensity for many farmers in this landscape to leave the pod shells and all associated harvest material in the farms themselves and just remove the beans (Morel et al., 2019). Another study by Abou Rajab et al. (2016), indicated that the NPP of cocoa beans only contributed to 5% of NPP in a shade-tree and cocoa landscape in Indonesia. Thus, NPP in a complex mosaic cocoa landscape which is removed generally would only make up a small fraction of the farms productivity.
The number of shade trees, on the other hand, had a substantial impact on the HANPP values for cocoa while also being easily detectable using aerial imagery. The highest number of shade trees recorded in a single grid square was 38 trees, with many grids indicating no shade trees. It should be noted that using this method only allowed for the detection of emergent shade trees. When comparing the values recorded via drone imagery with those collected by Morel et al. (2019), the shade tree densities were generally smaller, some substantially so. Therefore, it is probable there was a greater density of other trees that were not visible using conventional drone data. This could have implications for HANPP estimates, likely overestimating them in the case of underestimating the number of shade trees. In order to measure the presence of all trees both above and below the canopy, a drone equipped with LiDAR technology would be necessary.
NPP and HANPP of Complex Mosaic Landscape
The median HANPP values for each region ranged from 6.69 Mg C ha−1 yr−1 for AB to 9.85 Mg C ha−1 yr−1 for KA. These values vary substantially from those presented in some of the benchmark global studies of HANPP. For these same regions, the global map of Haberl et al. (2007) estimates the value of HANPP as being 2.79 Mg C ha−1 yr−1 for AB, 2.75 Mg C ha−1 yr−1 for HM, and 2.64 Mg C ha−1 yr−1 for KA for the year 2000. Our values are significantly higher than those found in the Haberl study, with an approximate difference of ~4 Mg C ha−1 yr−1 per region. The results presented here suggest that there is significant underestimation of HANPP for this cocoa growing region in Ghana. This is probably due to the evergreen nature of cocoa and palm trees, which may present a similar spectral signal to tropical forest. In addition, the highly fine scale mixed use agriculture in the region may distort results from areas such as these. Alternately, given the resolution of the data (~85 km2) presented by Haberl et al. (2007), the results presented here could highlight that by not being able to differentiate these high resolution dynamics of land use, such large scale studies are likely under-estimating the scale of HANPP.
The results of this study highlight how global studies of HANPP, and potentially other global assessments, need to take special care when studying the tropics, most notably areas where mixed agriculture land uses are common. Such underestimation of HANPP is likely to be a feature of most smallholder tree crop mosaics, leading to substantial underestimation in regional HANPP. Curtis et al. (2018) recently reported that all of African deforestation was due to slash and burn agriculture as opposed to being commodity-driven, which this study suggests is not the case in tropical regions of West Africa. While global assessments provide substantial and important insight into drivers of global change, these studies must continue to be complemented or challenged by regional and local scale studies such as this one.
HANPP is a useful metric to help quantify the impact of humans on the biosphere. Decreasing HANPP is increasingly important, because lower levels of HANPP relate to higher levels of productivity, high levels of biomass and nutrient availability to support biodiversity, and possibly higher capacity to sequester carbon. Studies such as that by Krausmann et al. (2013) highlight that between 1910 and 2005, the global HANPP doubled from 13 to 25%. The results presented here indicate an average HANPP of 44% in this landscape, compared to contiguous, natural tropical forest. This value highlights the need to attempt to decrease HANPP where possible in tropical mosaic landscapes. While this study did not focus on cocoa density, the variations in density which were applied tended to have a relatively small influence on HANPP value. Alternately, the influence of shade tree density on HANPP values was substantial. The most important strategy for decreasing HANPP in cocoa dominated landscapes is to encourage the cultivation of shade trees. Research has also shown that cocoa yields can increase with increasing canopy cover provided by shade trees (Schroth et al., 2017; Asare et al., 2019), further strengthening the case that the key to climate smart strategies for cocoa is the presence of shade trees. Increasing shade tree cover not only reduces HANPP, but has other benefits including increased biodiversity and possibly more resilience of the cocoa crop to climate extremes and regional warming (Rice and Greenberg, 2000; Schroth et al., 2016).
Future Work
This study represents a significant step forward in meaningfully quantifying human impact in a complex mosaic landscape at a resolution fine enough to detect subtle differences in land use, while also being a large enough spatial scale to compare to benchmark global studies. There are a number of ways forward which can build upon this work. The first is the incorporation of temporal variability. The drone data used in this study were collected over a relatively short period of time, and the surveys were not repeated. Further work using the same approach to capture high resolution drone imagery could greatly expand our understanding of the dynamics of land use change in complex mosaic landscapes. As mentioned above, further work could undertake similar surveys using more sophisticated equipment, such as LiDAR, to examine shade trees which are not easily detectable in drone imagery, such as trees which are only 1–2 m above the canopy.
Conclusions
This study highlights the diversity and complexity of small-holder cocoa landscapes, and the importance of utilizing a range of approaches, including drone imagery and field collected data, to gain a broad understanding of such landscapes. While accurately classifying land use and land use change remain a challenge in the tropics, tools such as drones or the Sentinel II satellite, continue to emerge which can enable the capture of imagery which broaden our understanding of these highly important and often misrepresented landscapes. Global scale analysis can provide exceptional insights into many processes, such as HANPP (Haberl et al., 2007) or deforestation, however, this study highlights the continued need for approaches that can bridge these large scale products with the most detailed ground collected data. Quantifying human impact on the biosphere should remain a priority given the continued, varying, and diverse impact of humans on all aspects of the natural world. Studying HANPP remains one of the most practical approaches to understanding this inherently complex system, however continued efforts, such as those demonstrated here, are needed to ensure landscapes, particularly complex landscapes, are both accurately captured and assessed.
Data Availability
The datasets generated for this study are available on request to the corresponding author.
Author Contributions
CM, AM, and YM: project design and article writing. CM, RA, MA, and SA-B: field work and data collection. CM and AM: data analysis.
Funding
This work was a part of the project Exploring the ecosystem limits to poverty alleviation in African forest-agriculture landscapes (Project Code NE/K010379-1), which was funded with support from the Ecosystem Services for Poverty Alleviation (ESPA) program. The ESPA program was funded by the Department for International Development (DFID), the Economic and Social Research Council (ESRC), and the Natural Environment Research Council (NERC). This work was also supported by NERC grants NE/P001092/1 and NE/P00394X/1). This work was also supported by the Social Sciences and Humanities Research Council of Canada.
Conflict of Interest Statement
The authors declare that the research was conducted in the absence of any commercial or financial relationships that could be construed as a potential conflict of interest.
Acknowledgments
We would like to thank Dr. Conrad Zorn and Jonathan Aronson for their helpful support and feedback on the analysis and manuscript. Further we would like to thank our field assistants in Ghana, without whom this work would not have been possible.
Supplementary Material
The Supplementary Material for this article can be found online at: https://www.frontiersin.org/articles/10.3389/ffgc.2019.00038/full#supplementary-material
Footnotes
1. ^USGS Agricultural Expansion Across West Africa (2018). Available online at: https://eros.usgs.gov/westafrica/agriculture-expansion (accessed September 30, 2018).
2. ^DroneDeploy 2018. https://www.dronedeploy.com/
3. ^Serif (Europe) Ltd. Affinity Photo (2018). Available online at: https://affinity.serif.com/en-gb/photo/
References
Abou Rajab, Y., Leuschner, C., Barus, H., Tjoa, A., and Hertel, D. (2016). Cacao cultivation under diverse shade tree cover allows high carbon storage and sequestration without yield losses. PLoS ONE 11:e0149949. doi: 10.1371/journal.pone.0149949
Asare, R., Markussen, B., Asare, R. A., Anim-Kwapong, G., and Ræbild, A. (2019). On-farm cocoa yields increase with canopy cover of shade trees in two agro-ecological zones in Ghana. Clim. Dev. 11, 435–445. doi: 10.1080/17565529.2018.1442805
Bonini, I., Hur Marimon-Junior, B., Matricardi, E., Phillips, O., Petter, F., Oliveira, B., et al. (2018). Collapse of ecosystem carbon stocks due to forest conversion to soybean plantations at the Amazon-Cerrado transition. For. Ecol. Manage. 414, 64–73. doi: 10.1016/J.FORECO.2018.01.038
Breisinger, C., Diao, X., Thurlow, J., and Al-Hassan, R. M. (2008). “Agriculture for development in ghana – new opportunities and challenges,” IFPRI Discussion Paper 00784. Washington, DC: International Food Policy Research Institute.
Clark, D. A., Brown, S., Kicklighter, D. W., Chambers, J. Q., Thomlinson, J. R., Ni, J., et al. (2001). Net primary production in tropical forests: an evaluation and synthesis of existing field data. Ecol. Appl. 11, 371–384. doi: 10.1890/1051-0761(2001)011[0371:NPPITF]2.0.CO;2
Collier, P., and Dercon, S. (2014). African agriculture in 50 years: smallholders in a rapidly changing world? World Dev. 63, 92–101. doi: 10.1016/J.WORLDDEV.2013.10.001
Curtis, P. G., Slay, C. M., Harris, N. L., Tyukavina, A., and Hansen, M. C. (2018). Classifying Drivers of Global Forest Loss. Available online at: http://science.sciencemag.org/
Drone Data Management System (DDMS) (2018). Event 28 Unmanned Systems. Available online at: https://event38.com/drone-data-management-system/
Feng, X., Porporato, A., and Rodriguez-Iturbe, I. (2013). Changes in rainfall seasonality in the tropics. Nat. Clim. Chang. 3, 811–815. doi: 10.1038/nclimate1907
Food and Agriculture Organization (FAO) (2018). FAOSTATbase. Rome: FAO. Available online at: http://faostat.fao.org (accessed January 28, 2019).
Food and Agriculture Organization (FAO) (2012). FAOSTATbase. Rome: FAO. Available online at: http://faostat.fao.org (accessed July 16, 2018).
Food and Agriculture Organization (FAO) (2013). FAOSTATbase. Rome: FAO. Available online at: http://faostat.fao.org (accessed July 16, 2018).
Fox, J., Castella, J. -C., Ziegler, A. D., and Westley, S. B. (2014). “Expansion of rubber mono-cropping and its implications for the resilience of ecosystems in the face of climate change in Montane Mainland Southeast Asia,” in Trends and Directions of Land Change Sciences Towards Regional and Global Sustainability, Global Environmental Research, eds T. Watanabe and H. Shibata, 145–150.
Goldstein, M., and Udry, C. (2008). The profits of power: land rights and agricultural investment in Ghana. J. Polit. Econ. 116, 981–1022. doi: 10.1086/595561
Grainger, A. (2008). Difficulties in tracking the long-term global trend in tropical forest area. Proc. Natl. Acad. Sci. U.S.A. 105, 818–823. doi: 10.1073/pnas.0703015105
Haberl, H., Erb, K. H., and Krausmann, F. (2014). Human appropriation of net primary production: patterns, trends, and planetary boundaries. Annu. Rev. Environ. Resour. 39, 363–391. doi: 10.1146/annurev-environ-121912-094620
Haberl, H., Erb, K. H., Krausmann, F., Gaube, V., Bondeau, A., Plutzar, C., et al. (2007). Quantifying and mapping the human appropriation of net primary production in earth's terrestrial ecosystems. Proc. Natl. Acad. Sci. U.S.A. 104, 12942–12947. doi: 10.1073/pnas.0704243104
Hirons, M., Boyd, E., McDermott, C., Asare, R., Morel, A., Mason, J., et al. (2018a). Understanding climate resilience in Ghanaian cocoa communities – advancing a biocultural perspective. J. Rural Stud. 63, 120–129. doi: 10.1016/j.jrurstud.2018.08.010
Hirons, M., McDermott, C., Asare, R., Morel, A., Robinson, E., Mason, J., et al. (2018b). Illegality and inequity in Ghana's cocoa-forest landscape: how formalization can undermine farmers control and benefits from trees on their farms. Land Use Policy 76, 405–413. doi: 10.1016/j.landusepol.2018.02.014
Imhoff, M. L., Bounoua, L., Ricketts, T., Loucks, C., Harriss, R., and Lawrence, W. T. (2004). Global patterns in human consumption of net primary production. Nature 429, 870–873. doi: 10.1038/nature02619
International Plant Nutrition Institute (IPNI) (2015). Oil Palm Best Management Practices in Ghana: Mid-Term Report. Available online at: http://ssa.ipni.net/article/AFR-3092 (accessed July, 2018)
Koh, L. P., and Wilcove, D. S. (2008). Is oil palm agriculture really destroying tropical biodiversity? Conserv. Lett. 1, 60–64. doi: 10.1111/j.1755.263x.2008.00011.x
Kolavalli, S., and Vigneri, M. (2011). “Cocoa in Ghana: shaping the success of an economy,” in Yes Africa can: Success Stories From a Dynamic Continent, eds P. Chuhan-Pole and M. Angwafo (Washington, DC: World Bank), 201–217.
Krausmann, F., Erb, K. H., Gingrich, S., Haberl, H., Bondeau, A., Gaube, V., et al. (2013). Global human appropriation of net primary production doubled in the 20th century. Proc. Natl. Acad. Sci. U.S.A. 110, 10324–10329. doi: 10.1073/pnas.1211349110
Kuemmerle, T., Erb, K., Meyfroidt, P., Müller, D., Verburg, P. H., Estel, S., et al. (2013). Challenges and opportunities in mapping land use intensity globally. Curr. Opin. Environ. Sustain. 5, 484–493. doi: 10.1016/j.cosust.2013.06.002
Laurance, W. F., Sayer, J., and Cassman, K. G. (2014). Agricultural expansion and its impacts on tropical nature. Trends Ecol. Evol. 29, 107–116. doi: 10.1016/j.tree.2013.12.001
Marthews, T. R., Riutta, T., Oliveras Menor, I., Urrutia, R., Moore, S., Metcalfe, D., et al. (2014). Measuring Tropical Forest Carbon Allocation and Cycling: A RAINFOR-GEM Field Manual for Intensive Census Plots (v3.0), Manual, Global Ecosystems Monitoring Network. Available online at: http://gem.tropicalforests.ox.ac.uk/
MASDAR (2011). Ministry of Food, and Agriculture of Ghana. MASDAR Master Plan Study on the Oil Palm Industry in Ghana.
Ministry of Food and Agriculture, Republic of Ghana (2013). Okra Production. Available online at: http://mofa.gov.gh/site/?page_id=14173
Monfreda, C., Ramankutty, N., and Foley, J. A. (2008). Farming the planet: 2. Geographic distribution of crop areas, yields, physiological types, and net primary production in the year 2000. Glob. Biogeochem. Cycles 22. doi: 10.1029/2007GB002947
Moore, S., Adu-Bredu, S., Duah-Gyamfi, A., Addo-Danso, S. D., Ibrahim, F., Mbou, A. T., et al. (2017). Forest biomass, productivity and carbon cycling along a rainfall gradient in West Africa. Glob. Change Biol. 24, e496–e510. doi: 10.1111/gcb.13907
Morel, A. C., Adu Sasu, M., Adu-Bredu, S., Quaye, M., Moore, C., Ashley Asare, R., et al. (2019). Carbon dynamics, net primary productivity (NPP), and human appropriated NPP (HANPP) across a forest-cocoa farm landscape in West Africa. Glob. Change Biol. 25, 2661–2677. doi: 10.1111/gcb.14661
Morton, J. F. (2007). The impact of climate change on smallholder and subsistence agriculture. Proc. Natl. Acad. Sci. U.S.A. 104, 19680–19685. doi: 10.1073/pnas.0701855104
Moser, G., Leuschner, C., Hertel, D., Holscher, D., Kohler, M., Leitner, D., et al. (2010). Response of cocoa trees (Theobroma cacao) to a 13-month desiccation period in Sulawesi, Indonesia. Agroforest Syst. 79, 171–187. doi: 10.1007/s10457-010-9303-1
Norgrove, L., and Hauser, S. (2014). Improving plantain (Musa spp. AAB) yields on smallholder farms in West and Central Africa. Food Secur. 6, 501–514. doi: 10.1007/s12571-014-0365-1
Olson, R. J., Scurlock, J. M. O., Prince, S. D., Zheng, D. L., and Johnson, K. R (eds.). (2013). NPP Multi-Biome: NPP and Driver Data for Ecosystem Model-Data Intercomparison, R2. Data Set. Oak Ridge, TN: Oak Ridge National Laboratory Distributed Active Archive Center. doi: 10.3334/ORNLDAAC/615
Rapsomanikis, G. (2015). The Economic Lives of Smallholder Farmers. Available online at: www.fao.org/publications (accessed September 30, 2018).
Rhebergen, T, Fairhurst, T, Zingore, S, Fisher, M, Oberthür, T, and Whitbread, A. M. (2016). Adapting oil palm best management practices to Ghana: opportunities for production intensification. Better Crops Plant Food 100, 12–15. Available online at: http://oar.icrisat.org/9874/
Rice, R. A., and Greenberg, R. (2000). Cacao cultivation and the conservation of biological diversity. Ambio 29, 167–173. doi: 10.1579/0044-7447-29.3.167
Schroth, G., Läderach, P., Martinez-Valle, A. I., and Bunn, C. (2017). From site-level to regional adaptation planning for tropical commodities: cocoa in West Africa. Mitig. Adapt. Strateg. Glob. Chang. 22, 903–927. doi: 10.1007/s11027-016-9707-y
Schroth, G., Läderach, P., Martinez-Valle, A. I., Bunn, C., and Jassogne, L. (2016). Vulnerability to climate change of cocoa in West Africa: patterns, opportunities and limits to adaptation. Sci. Total Environ. 556, 231–241. doi: 10.1016/j.scitotenv.2016.03.024
Taabazuing, J., Luginaah, I., Djietror, G., and Otiso, K. M. (2012). mining, conflicts and livelihood struggles in a dysfunctional policy environment: the case of Wassa West District, Ghana. Afr. Geogr. Rev. 31, 33–49. doi: 10.1080/19376812.2012.690089
Vigneri, M., and Kollavali, S. (2018). Growth through pricing policy: The case of cocoa in Ghana. Rome: Food and Agriculture Organization of the United Nations. Available online at: http://www.fao.org/3/I8329EN/i8329en.pdf (accessed January 30, 2019).
Keywords: cocoa, complex mosaic landscape, human appropriated net primary productivity (HANPP), unmanned aerial vehicle (UAV), smallholder agroforestry, high-resolution imagery, ghana
Citation: Moore C, Morel AC, Asare RA, Adu Sasu M, Adu-Bredu S and Malhi Y (2019) Human Appropriated Net Primary Productivity of Complex Mosaic Landscapes. Front. For. Glob. Change 2:38. doi: 10.3389/ffgc.2019.00038
Received: 18 February 2019; Accepted: 01 July 2019;
Published: 08 August 2019.
Edited by:
Edward T. A. Mitchard, University of Edinburgh, United KingdomReviewed by:
Ervan Rutishauser, Smithsonian Tropical Research Institute (SI), United StatesTomas Ferreira Domingues, University of São Paulo, Brazil
Copyright © 2019 Moore, Morel, Asare, Adu Sasu, Adu-Bredu and Malhi. This is an open-access article distributed under the terms of the Creative Commons Attribution License (CC BY). The use, distribution or reproduction in other forums is permitted, provided the original author(s) and the copyright owner(s) are credited and that the original publication in this journal is cited, in accordance with accepted academic practice. No use, distribution or reproduction is permitted which does not comply with these terms.
*Correspondence: Christine Moore, Y2hyaXN0aW5lLm1vb3JlOUBnbWFpbC5jb20=