 Jörg Kruse
 Tarryn Turnbull
 Heinz Rennenberg
 Mark A. Adams
- 1Faculty of Forest Sciences, Institute of Tree Physiology, Albert-Ludwigs University, Freiburg im Breisgau, Germany
- 2Faculty of Agriculture, Food and Natural Resources, University of Sydney, Eveleigh, NSW, Australia
- 3Faculty of Science, Engineering and Technology, School of Science, Swinburne University of Technology, Hawthorn, VIC, Australia
Plant growth strategies are adapted to resource availability in native habitat(s), and thus reflected in traits such as photosynthetic and respiratory capacities of leaves. We explored acclimation of such traits to contrasting light and nitrogen supply for Flooded Gum (Eucalyptus grandis) and Mountain Ash (E. regnans) saplings growing under warm-temperate conditions. We focused on respiration parameters that are not routinely measured, but could expand our mechanistic understanding of trait correlation networks [interdependencies between leaf mass per area (LMA), foliar nitrogen concentration (Nmass), photosynthetic capacity (mass- based Amax) and respiration (R)]. We measured temperature responses of leaf R via calorimetric methods, in order to derive three respiration parameters that are useful to characterize capacity and flux mode of respiratory oxygen reduction in mature source leaves and young sink leaves. Subtropical E. grandis saplings produced 3-fold more biomass than E. regnans, and responded more strongly to enhanced supplies of nitrogen, in particular under semi-shade conditions. Acclimation of LMA to growth irradiance was more plastic in E. grandis, but light treatment had no effect on Nmass and mass-based Amax in this species. In E. regnans, growth under abundant nitrogen and full sunlight caused significant increases in foliar Nmass–albeit not matched by relatively modest increases in mass-based Amax. Cool-temperate E. regnans saplings appeared to allocate a substantial share of leaf-N to protective functions upon exposure to full sunlight. Foliar nitrogen was used more effectively for the production of new foliage in E. grandis, owing to better coordination with foliar capacity and flux mode of mitochondrial oxygen reduction. Most of the variation in three respiration parameters can be explained by a few physiological/anatomical variables, responding to variation in absolute and relative demand for ATP, reducing power and anabolic intermediates. These demands strongly depended on leaf developmental stage and also varied between species and treatments. Our approach opens a path to improved process- based understanding of respiratory flux control, which could facilitate predictions of plant respiration in a changing environment.
Introduction
Leaf structural and physiological traits reflect species-specific strategies that have evolved to cope with temporal and spatial variation in site conditions. Opportunities for fast growth after disturbance, for example, are better exploited by pioneering species with foliage characteristics such as low leaf mass per area (LMA), but great foliar N concentration (Nmass) and photosynthetic capacity (mass-based Amax, Vc, max, or Jmax). By contrast, adaptation to slow-growth conditions, as mediated by poor supplies of nutrients or light, is generally associated with slow turnover of foliage with comparatively great LMA, but low Nmass and photosynthetic capacity, and long nutrient residence times (Field and Mooney, 1986; Evans, 1989; Schulze et al., 1994; Wright et al., 2004). Correlations between such foliar traits are typically interpreted as a trade-off between costs of leaf construction and the duration of investment return (Westoby et al., 2002; Wright et al., 2004; Shipley et al., 2006; Niinemets et al., 2015).
Investment of nitrogen in “photosynthetic machinery” also plays a pivotal role in relationships between foliar Nmass and rates of dark respiration at a standard reference temperature (Rref, frequently determined at Tref = 20 or 25°C; Atkin et al., 2017). Rref scales positively with Nmass (Reich et al., 1996; Ryan et al., 1996; Kruse and Adams, 2008a), owing to energy requirements for protein turnover and maintenance of photosynthetic capacity, and phloem loading of photosynthetic products (Azcón-Bieto and Osmond, 1983; Noguchi et al., 2001; Bouma, 2005). Relations between Nmass – Amax – Rref differ among plant functional types, leaf developmental stages and environmental conditions (Reich et al., 2008; Atkin et al., 2015). As an example, for a given Nmass, Rref is typically greater in plants growing in cold than warm environments (Atkin et al., 2015; Slot and Kitajima, 2015; Vanderwel et al., 2015), and greater in plants growing in high- than low-light environments (Wright et al., 2006). The y-axis intercept of Rref – Nmass relationships is significantly greater in young and expanding foliage, as compared to mature foliage (Kruse et al., 2008). Such differences might partly be related to variable allocation of leaf nitrogen to metabolically active pools (photosynthetic and respiratory enzymes) relative to “inactive pools” that do not contribute to CO2- gas exchange (i.e., structural N bound in lignin). Another important factor that could produce substantial variation in the relation between Rref and Nmass is the activation state of respiratory enzymes. Activity of existing enzymes is inducible (O'Leary and Plaxton, 2017), and depends on cellular demand for ATP, reducing power, and anabolic intermediates (Araujo et al., 2012).
Recent developments in experimental methodology and theoretical concepts can help elucidate control of leaf respiration beyond analysis of Rref – Nmass relationships. Instead of point measurements at some suitable reference temperature, instantaneous temperature responses of leaf R across a broader range of measurement temperatures emerged as an invaluable tool for studying in vivo flux control (Atkin et al., 2005; Kruse et al., 2011; Liang et al., 2018). In phenomenological terms, instantaneous temperature responses of leaf respiration are best described by three-parameter, log-polynomial models (Kruse and Adams, 2008b; Adams et al., 2016; Heskel et al., 2016a,b; Reich et al., 2016). In an Arrhenius-type description, lnRref captures the “elevation” or “intercept” of the response curve, and might be used as a proxy for respiratory capacity (see section Heat Rate Measurements and the Temperature Response of Respiration; Equation 4). The other two parameters in the extended Arrhenius equation define the shape of respiratory temperature responses. Amongst the latter two “exponent parameters,” one parameter is equivalent to activation energy of leaf respiration at reference temperature, and the second parameter describes changes in activation energy as measurement temperature increases (section Heat Rate Measurements and the Temperature Response of Respiration). Temperature-dependent changes in activation energy apparently result from difference in heat capacity between a collection of enzymes bound to substrates for the reaction (i.e., respiratory CO2- release or O2-reduction), and enzymes bound to the transition state for the reaction (, Hobbs et al., 2013; Arcus et al., 2016; Liang et al., 2018). Physiological causes for variation in have not yet been elucidated, but are likely related to allosteric effectors and, in particular, post-translational modifications of enzymes – and their impact on physical flexibility (and thus heat capacity) of enzymes. Allosteric effectors and post-translational modifications play a pivotal role in the regulation of flux (O'Leary and Plaxton, 2017), such that analysis of temperature sensitivity of leaf R might be exploited for pathway analysis (Kruse et al., 2011; Atkin et al., 2017; Liang et al., 2018). For example, we recently showed that enhanced nitrate supply to Eucalyptus grandis saplings resulted in positive, concave curvature of loge–transformed rates of leaf CO2—respiration in Arrhenius—plots (Kruse et al., 2018). We interpreted concave curvature as an indicator of non-cyclic modes of carbon flux through the tricarboxylic acid (TCA) “cycle” (Sweetlove et al., 2010), in order to meet greater demand for anabolic precursors in N-assimilation.
Oxidative de-carboxylation of organic acids in the TCA- cycle must be coordinated with mitochondrial oxygen reduction. The temperature response of oxygen reduction can be determined via calorimetry and is also best fitted to the extended Arrhenius equation (Kruse and Adams, 2008b). Inhibitor studies demonstrated that proportionally greater contribution of cyanide- resistant alternative oxidase (AOX) to electron flux, resulted in concave curvature of loge–transformed rates of overall oxygen reduction (Kruse et al., 2008). We suggested that the shape of any individual, instantaneous temperature response indicates the “flux mode” at the time of measurement, that is, relative contributions of alternative vs. cytochrome pathways to oxygen reduction (Kruse et al., 2011). This suggestion is consistent with 18O/16O- fractionation studies, showing that short- term shifts in measurement temperature do not affect mitochondrial electron partitioning between the alternative and cytochrome pathways (MacFarlane et la., 2009). However, flux mode may well-differ between leaf developmental stages and vary with resource availability. If, for example, cellular demand for carbon skeleton intermediates exceeds that for ATP, activity of matrix- orientated (or internal), alternative NAD(P)H dehydrogenases and AOX help to keep the TCA- “cycle” operative (Rasmusson et al., 2004)—such that intermediates can be withdrawn for anabolism (Vanlerberghe and McIntosh, 1997).
A persistent problem in physiological interpretation of respiratory temperature responses is the fact that exponent parameters describing shape are not independent form the pre-exponential factor (i.e., lnRref) (Kruse et al., 2012, 2018; Noguchi et al., 2015). It remains difficult to evaluate environmental effects on respiratory flux mode separately from those on respiratory capacity. In the present study, young saplings of two eucalypt species (Eucalyptus grandis and E. regnans) were grown under contrasting light intensities and nitrogen availability in a common garden, in order to produce variation in leaf traits. We expected that allocation of newly acquired 15N and nitrogen concentration of individual leaves (Nmass) would increase with light and N-supply (Evans, 1996; Niinemets et al., 2015), although this effect could be attenuated by concomitant increases in foliage production and growth (i.e., dilution of leaf-N by growth), and differ between species adapted to differing climates (Kruse et al., 2012). E. grandis is native to sub-tropical coastal regions of New South Wales and Queensland, where it grows quickly on deep soils where water and nutrients are abundant (Leuning et al., 1991). E. regnans, on the other hand, is restricted to sheltered valleys with cool climates in the mountain foothills in Victoria and Tasmania, where it also grows quickly by comparison with co-occurring eucalypt species.
We sought to elucidate inter-dependencies between Nmass, lnRref and exponent parameters, in order to guide mechanistic interpretation of instantaneous temperature responses of respiratory oxygen reduction. Foliar Nmass and respiratory parameters were determined for fully expanded source leaves (henceforth denoted “mature leaves”) and very young, expanding sink leaves (henceforth denoted “young leaves”), and were supplemented with measurements of source-leaf photosynthetic capacity (Amax, Vc, max, and Jmax). Specifically, we tested the following working hypotheses: (i) Correlations between Nmass and lnRref will depend on treatment and, in particular, on leaf developmental stage. That is, lnRref per unit leaf-N is greater for young than mature leaves, emphasizing the critical role of respiratory capacity in providing energy (ATP) and anabolic intermediates for leaf expansion and growth. (ii) The relationship between Nmass and lnRref might also be influenced by flux mode, owing to interdependencies between lnRref and exponent parameters. Proportional demand for ATP relative to anabolic intermediates and reducing power likely differs between young and mature leaves, depending on N-nutrition and growth irradiance.
Materials and Methods
Site Description and Plant Material
Seeds of the two study species, Eucalyptus regnans F. Muell (Beaconsfield provenance, seedlot number 15151) and Eucalyptus grandis W. Hill (Coleambally provenance, seedlot number 21068) were obtained from the Australian Tree Seed Centre (Kingston, ACT, Australia). In November 2011 at Cobbitty, NSW Australia (34° 01′ 03.19″ S, 150° 40′ 02.80″E, 80 m a.s.l.), germinated seedlings (cotyledons plus three sets of leaves) were transferred to 45L pots of washed sand and randomly assigned to a treatment. Twelve seedlings per species were grown at three light intensities: full sunlight, 50% sun exclusion and 90% sun exclusion. We studied whole-plant shading using sun-exclusion cloth, where shading effects mainly relate to attenuation of photosynthetic photon flux density (PPFD). This approach to whole- plant shading differed from other studies of within-canopy variation of foliar traits, where spectral composition (i.e., red: far-red- ratio; R/FR) varied more strongly (Hirose and Werger, 1987; Kull and Kruijt, 1999; Niinemets, 2007).
Pots were watered daily to field capacity. Six seedlings of each species for light treatment were further allocated to one of two nitrogen treatments; 8.0 or 2.6 mM N (as NH4NO3) supplied every second day by irrigation with a modified Hoagland's solution (also containing 0.67 mM P, 4 mM K, 2.7 mM Ca, 1.3 mM Mg, 1.3 mM S, 52 μM Mn, 49 μM Fe, 20 μM Cu, 15 μM Zn, 8 μM B and 0.03 μM Mo). Average midday growth temperatures ranged between 21.6 and 24.8°C, whilst midday relative humidity remained between 56.2 and 61.9 for the duration of the experiment. After 4 months of acclimation to different growth irradiance and nitrogen nutrition, physiological measurements were completed in March 2012. Plants were given 15N-enriched nutrient solution 3 days prior to physiological measurements (10.8 atom% 15N for both nutrition regimes, applied as ), in order to study treatment effects on allocation of newly acquired nitrogen.
Gas Exchange Measurements on Source Leaves via Infrared Gas Analysis
We determined photosynthetic capacity (Vcmax, Jmax, Amax) and CO2- dark respiration (RCO2) at 25°C, using two recently calibrated infrared gas analyzers (IRGA; Li-6400, Li-Cor, NE, USA). On one source- leaf per plant per treatment we calculated carboxylation capacity (Vcmax) and electron transport capacity (Jmax) from measures of A-Ci curves (Ca: 2,000 – 50 μmol CO2 m−2 s−1, over 11 steps) at saturating light (PPFD: 1,500 μmol quanta m−2 s−1). Vcmax and Jmax were computed and standardized to 25°C leaf temperature, as described by Sharkey et al. (2007). Calculated Vcmax yielded “apparent” values, assuming large mesophyll conductance to CO2- transfer, and Cc [i.e., (CO2) at the site of carboxylation in chloroplasts] not being significantly different from Ci [i.e., intercellular (CO2)].
Instantaneous responses of photosynthesis to light intensity (PPFD: 2,000 – 0 μmol quanta m−2 s−1, over 10 steps), at ambient CO2 (Ca: 400 ppm) and 25°C cuvette air temperature were fitted to a non-rectangular hyperbola (Marshall and Biscoe, 1980; Thornley and Johnson, 1990):
where Q is the intensity of incident light (μmol quanta m−2 s−1), φ is the quantum use efficiency (μmol CO2 μmol−1 quanta), Amax is the light-saturated rate of photosynthesis (μmol m−2 s−1), θ is a curvature factor (dimensionless), and Rl is the mitochondrial respiration occurring in the light (μmol m−2 s−1). For simplicity, we assumed that Rlight = Rdark (recorded at 0 μmol quanta; but see Tcherkez et al., 2017). At the light compensation point (μmol quanta m−2 s−1), respiratory CO2–loss is balanced by photosynthetic CO2–uptake.
Gas exchange measurements were randomized between day times. After physiological measurements were concluded, leaf mass per leaf area (LMA; g DM m−2), and root/shoot-ratio of plants were determined.
Heat Rate Measurements and the Temperature Response of Respiration
We measured heat rates of living tissue in the dark (i.e., energy release per unit leaf mass and time; μJ g−1 s−1) as a proxy for respiratory oxygen reduction using two, multi-cell differential-scanning calorimeters (CSC 4100, MC-DSC, Utah, USA). Calorimeters allow for heat rate measurements over a range of different temperatures, operating in the isothermal mode (Criddle et al., 1994; Hansen et al., 1994). Prior to measurements, the calorimeters were calibrated as described by Kruse and Adams (2008b).
We tested fully expanded source leaves and rapidly expanding sink leaves. Mature leaves were detached from the base of the leading twig per plant. Two slices of leaf material (c. 1 × 2 cm, from each side of the mid rib) were excised form the leaf. We waited for 30 min until the wounding response had dissipated (Kruse et al., 2008), before leaf material was placed into calorimetry ampoules (1 cm3) and measurements were started. Young leaves with a size of c. 1 × 2 cm (or smaller) were detached form the tip of the leading twig. Young leaves were left intact and immediately measured. Respiration was measured over five steps (15–35°C). After each temperature change, we waited for 25 min until the next target temperature had been reached and the signal had stabilized. We then recorded 5- min averages of respective heat rates. After records at the third target temperature (25°C), ampoules were briefly opened, flushed with fresh air and replaced into the calorimeters. From steady-state rates of heat evolution at each measurement temperature, rates of oxygen reduction were determined as (Kruse et al., 2011):
where q is the heat rate (μW g−1 DM) and RO2 is the rate of oxygen reduction (nmol g−1 DM s−1, henceforth simply denoted ‘R'). The term ΔHO2 varies only slightly with the substrate used for oxygen reduction and is usually substituted by Thornton's “constant” or the oxycaloric equivalent (−455 ± 15 J mmol−1, negative by convention for exergonic reactions, Criddle et al., 1997). The temperature response of steady- state mitochondrial oxygen reduction can be described by an extended Arrhenius- equation (Kruse and Adams, 2008b; Figure 1A):
where Rref is the rate of respiratory O2-reduction rate at the reference temperature [Tref; 288 K (= 15°C) in the present study]; T is the measurement temperature (K); ℜ is the universal gas constant (8.314 J mol−1 K−1); Eo(Ref) (kJ mol−1) is the overall activation energy of oxygen reduction infinitesimally close to the reference temperature and δR (kK2) describes the dynamic change of with increasing measurement temperature. We define here as the (equivalent) temperature coefficient μRef (in units of kK; Criddle et al., 1994). The three parameters that capture respiratory performance at differing measurement temperatures were determined from fits of experimental data to the log- polynomial model (Origin 6.1, Microsoft; Figure 1B):
where lnRref (nmol g−1 s−1) is the loge –transformed rate of respiratory O2-reduction at the reference temperature (Tref = 288 K); μRef (kK) denotes the slope of increase of oxygen reduction at the 15°C reference temperature; and δR (kK2) describes the dynamic change of with increasing measurement temperature. For δR = 0, overall activation energy of respiration (Eo) or μ are constant over a broad range of measurement temperatures (i.e., 15–35°C), and the respiratory temperature response displays strictly linear behavior in Arrhenius plots (i.e., loge- transformed rates of R plotted against reciprocal temperature). For δR ≠ 0, deviation from classical Arrhenius kinetics becomes apparent in curvature in Arrhenius plots (as shown in Figure 1B).
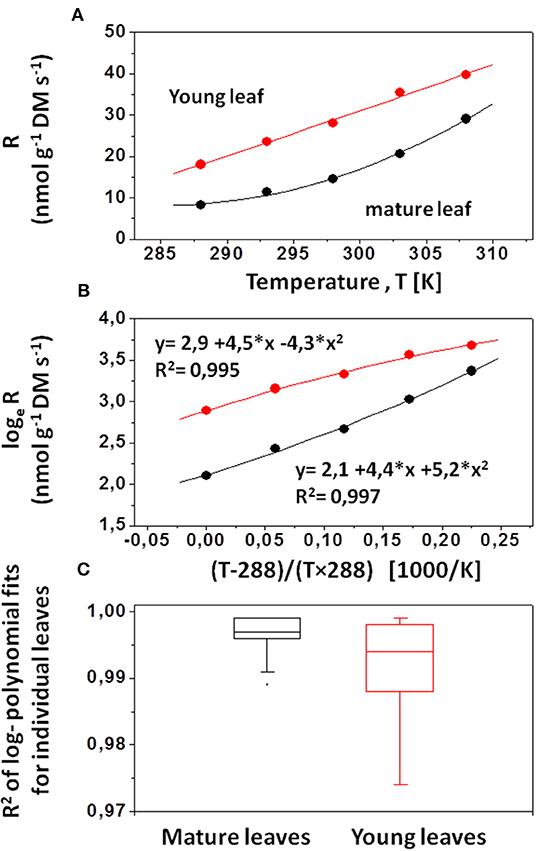
Figure 1. Determination of respiration parameters obtained via calorimetry. (A) Rates of mitochondrial oxygen reduction (nmol g−1 DM s−1) were determined indirectly from heat rates of living tissue (μW g−1 DM s−1) at five measurement temperatures (Equation 2). (B) Respiration rates were loge –transformed and plotted against reciprocal temperature (i.e., the temperature term in Equation 4 in units of 1,000/K). The intercept of individula log- polynomial fits (at Tterm = 0) is equivalent to lnRref (i.e., loge –transformed rates of respiration at 288 K reference temperature). The second parameter descibes the slope of the log- polynomial response curve infinitesimally close to Tref, and is a measure of the activation energy of R at Tref (i.e., μRef = Eo/ ℜ; μRef in units of kK). The third parameter descibes the curvature of the log- polynomial response, i.e., the change in activation energy as measurement temperature increases (δR in units of kK2). For δR>0 the curvature is concave upwards (as for the exemplary mature leaf), and for δR<0 it is convex downwards (as for the exemplary young leaf). (C) Coefficients of determination (R2) for log- polynomial fits on mature leaves (N = 72) and young leaves (N = 72). Each box indicates 25 and 75% percentiles of observed R2 – values. The median is indicated by the horizontal line within respective boxes.
Coefficients of determination (R2) for least- square log- polynomial fits averaged 0.996 (median 0.997) in mature leaves, and averaged 0.991 (median 0.994) in young leaves (Figure 1C). Similar coefficients of determination were reported for log- polynomial fits of temperature- dependent CO2- respiration determined via infrared gas analysis (Reich et al., 2016).
Determination of Leaf-N and Leaf-15N
After respiration measurements were completed, leaf material was dried at 60°C for N- and 15N-analysis. Aliquots of 1.5–2.0 mg of dried and ground plant material used for calorimetric measurements were transferred into tin capsules (IVA Analysentechnik, Meerbusch, Germany). Nitrogen (and carbon) content of samples was analyzed using an elemental analyzer (Vario EL, Elementar Analysensysteme GmbH, Hanau, Germany), coupled to an Isotope Ratio Mass Spectrometer (Delta Plus/Delta Plus Plus XL; Finnigan MAT GmbH, Bremen, Germany) by a Conflo II/III interface (Thermo-Finnigan GmbH, Bremen, Germany) for 15N/14N- analysis. We also collected leaf material prior to the 15N-labeling period (2 replicates per treatment; i.e., 24 replicates in total), to determine natural 15N-abundance. Natural abundance was not significantly different between species or treatments, and averaged 0.369 ± 0.003 atom% 15N. Foliar 15N-contents presented in this study are expressed as 15N-accumulation above natural abundance, after the labeling period (i.e., μg 15N g−1 DM).
Statistical Analysis
Statistical analysis was performed with 6 replicates per Eucalyptus species, growth irradiance and N-nutrition (and leaf age for calorimetric measurements), summing up to a total of 72 replicates (or 144 replicates for N-analysis and calorimetry; Tables S1, S2). Variation of leaf trait parameters relates to variation between individual plants (and not to within-canopy variation of individuals), in order to assess trait plasticity between different species (sensu, Pigliucci, 2005). All parameters were expressed per unit leaf dry mass to alleviate comparisons between respiratory and photosynthetic parameters. Photosynthetic parameters were also analyzed on a leaf area basis to evaluate, if photosynthetic acclimation was driven by altered LMA or Nmass (Lloyd et al., 2013; Westoby et al., 2013; Poorter et al., 2014; Tables S1, S3 and Figure S1).
Plasticity of leaf structural and photosynthetic traits between species, as affected by treatments, was analyzed via 3-way ANOVA (with species, nutrition and irradiance levels as factors; STATISTCA, version 10.0, StatSoft, Inc., Tulsa, OK, USA). For leaf- N and respiratory parameters we also tested the effect of leaf age (with N = 72 per age class). Plasticity of leaf-N and respiratory traits was analyzed via 4-way ANOVA. Effect sizes were estimated as:
where pη2 indicates how much of the observed variation (i.e., SStotal, total sum of squares = SSfactor + SSresidual) can statistically be explained by the factor under consideration (SSfactor).
To test our working hypotheses, the dependency of lnRref (defining the intercept of the log-polynomial response at 15°C, Figure 1B) on Nmass, leaf age and treatments was analyzed via ANCOVA (STATISTICA 10.0). The dependency of δR (defining the shape of the log- polynomial response, Figure 1B), on leaf age and treatments (and μRef and lnRref) was also analyzed via ANCOVA. Interdependencies between the three respiration parameters lnRref, μRef, and δR were further analyzed via Principal Component Analysis (PCA).
Results
Effects of Nitrogen Nutrition and Irradiance on Growth and Anatomical Leaf Traits
After 4 months of growth, E. grandis had, on average, accumulated three times more total biomass than E. regnans. For E. grandis, 61% of this biomass was allocated to roots, as compared to only 29% in E. regnans (Tables 1, 2). Both species responded to nitrogen (Table 1), but E. grandis more so than E. regnans (significant Species × Nutrition effect, Table 2). Growth of E. grandis was enhanced by 78% when grown with 8.0 mM N, as compared to 2.6 mM N. For E. regnans the corresponding increase was 40%. Light affected growth of both species, but not in a dose-dependent manner. Best growth was achieved in semi-shade (or 50% sunlight) and was some 40% greater than in full sunlight or 10% sunlight. Stimulation of growth in the semi-shade was more pronounced for plants receiving 8.0 mM N (significant Nutrition × Light -effect, pη2 = 0.12, not shown in Table 2).
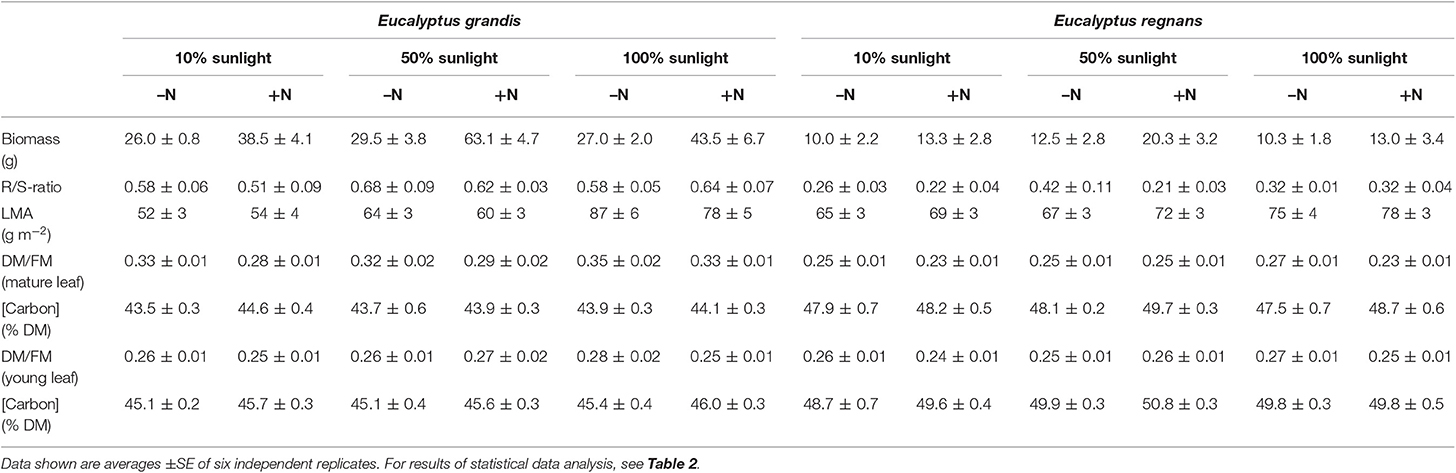
Table 1. Biometrical data of Eucalyptus grandis and Eucalyptus regnans grown under differing N-nutrition and light intensity.
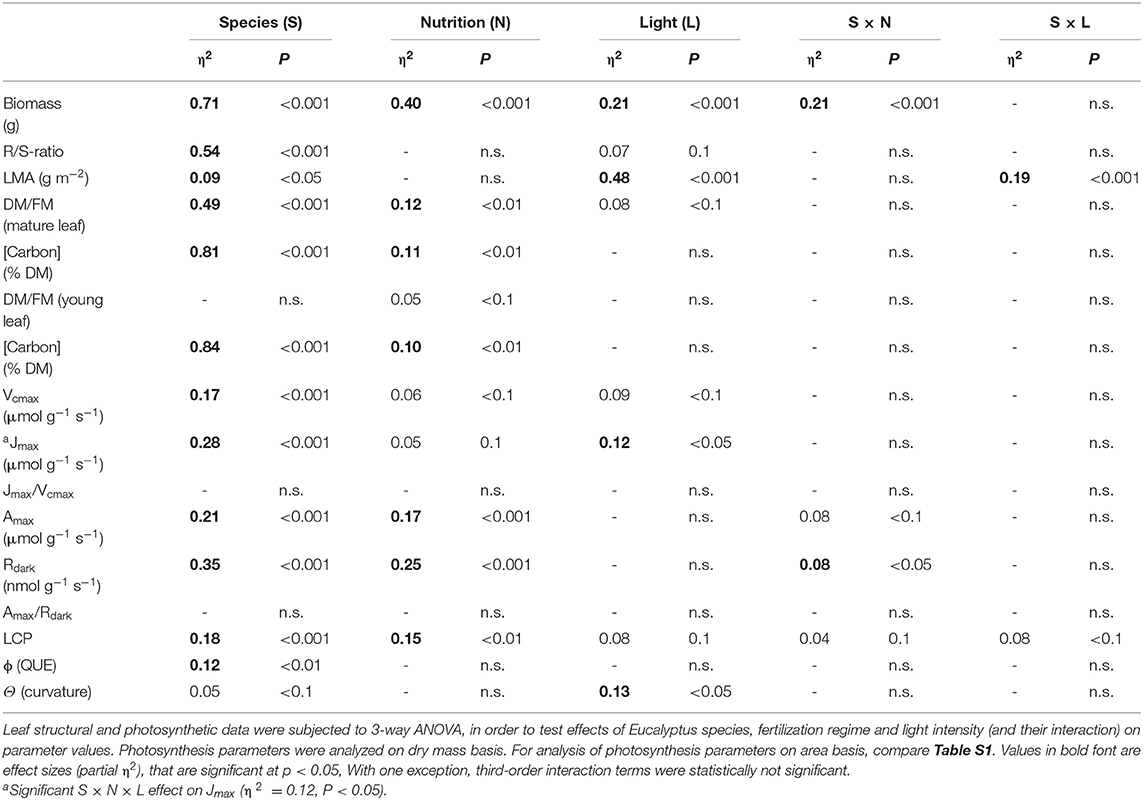
Table 2. Results of analysis of variance (ANOVA).
Treatment-induced differences in leaf mass per unit area (LMA; g DM m−2) reflected acclimation of leaf anatomy. Most variation in LMA was produced by contrasting light conditions. While both Eucalyptus sp. produced thicker leaves as growth irradiance increased (Table 1), E. grandis showed much greater flexibility (significant Species × Light-interaction, Table 2). LMA of E. grandis increased by 55%, while that of E. regnans increased by 15%, when grown in full-sunlight compared to 10% sunlight.
For E. grandis, DM/FM- ratios of mature leaves were significantly greater than those of E. regnans. DM/FM- ratios of mature leaves tended to increase with light intensity and were reduced at high N-supply (Tables 1, 2). DM/FM-ratios of young leaves were similar between species and hardly affected by treatment (Tables 1, 2).
Treatment Effects on Foliar Nitrogen Concentration and Allocation of Newly Acquired 15N
Leaves of E. regnans contained, on average, 50–60% more nitrogen than those of E. grandis (Figures 2A–D). Tripling the external rate of supply of nitrogen had surprisingly little effect on foliar N in E. grandis (Figures 2A,C), but increased that of E. regnans by 25–30% (Figures 2B,D; significant Species × Nutrition -effect, Table 3). Likewise, foliar N remained almost constant across the three light treatments for E. grandis, but was 45–50% greater in E. regnans grown in semi-shade or full sunlight as compared to plants grown in 10% sunlight (significant Species × Light -effect, Table 3). These treatment-induced patterns were similar between mature leaves and young leaves, albeit young leaves contained 60–70% more nitrogen than mature leaves.
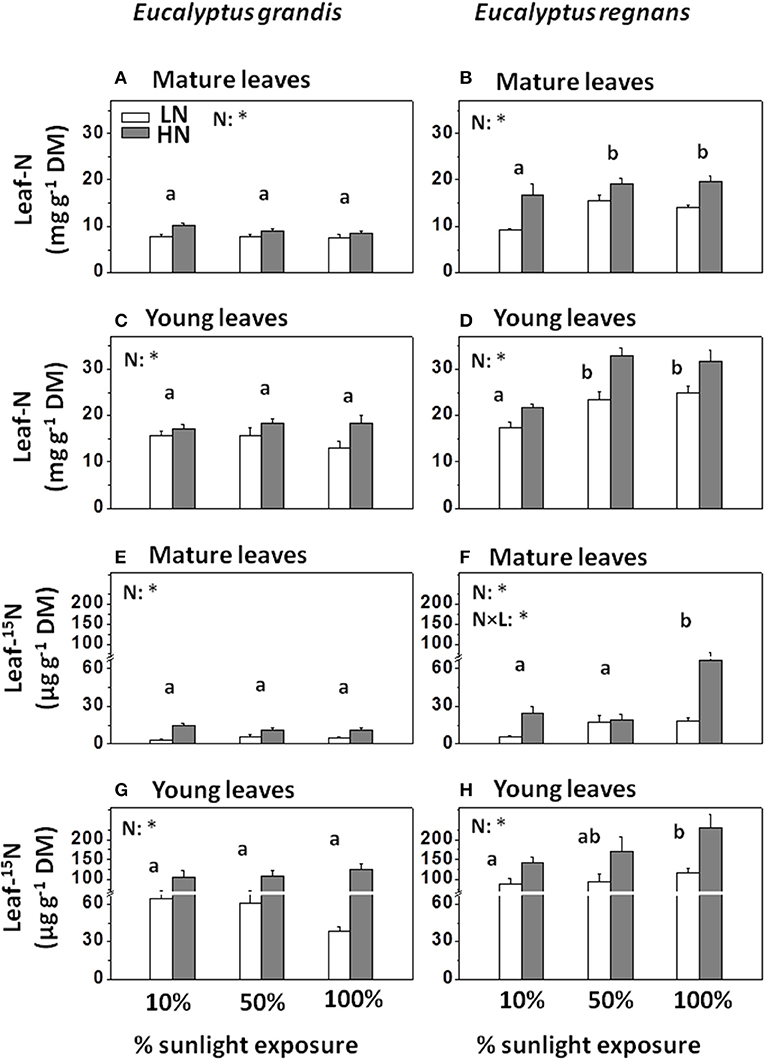
Figure 2. Leaf nitrogen contents and 15N-enrichment in Eucalyptus grown under differing N-nutrition and light intensity. (A) Nitrogen contents in mature Eucalyptus grandis leaves. (B) Nitrogen contents in mature Eucalyptus regnans leaves. (C) Nitrogen contents in young Eucalyptus grandis leaves. (D) Nitrogen contents in young Eucalyptus regnans leaves. (E) 15N-allocation to mature Eucalyptus grandis leaves. (F) 15N-allocation to mature Eucalyptus regnans leaves. (G) 15N-allocation to young Eucalyptus grandis leaves. (H) 15N-allocation to young Eucalyptus regnans leaves. Plants were given 15N-labeled nutrient solution 3 days prior to sampling (10.8 atom% 15N for each N-treatment). Open columns: “low” N-supply (LN: 2.6 mM N). Gray columns: “high” N-supply (HN: 8 mM N). Each column shows the average ± SE of six independent replicates. Different letters indicate significant differences between light regimes within species (N = 12 for each factor group; post-hoc Tukey HSD-test). Asterisk (*) indicates significant N-treatment effect (N = 18 for each factor group; n.s., not significant). With the exception of 15N-accumulation in mature E. regnans leaves (F), N × L interactions within species were not significant. For effect sizes between species and treatments (and leaf developmental stage), see Table 3. Analysis on fresh mass basis is given in Table S3.
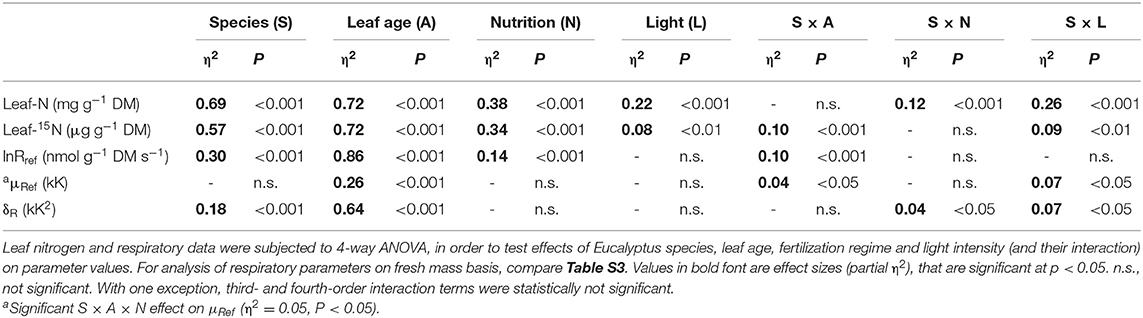
Table 3. Results of analysis of variance (ANOVA) for leaf nitrogen and respiratory parameters.
Allocation patterns of newly acquired nitrogen were informed by 15N-analysis of leaf material (Figures 2E–H), 3 days after plants were given access to 15N-enriched nutrient solution (10.8 atom % 15N). Patterns among treatments were generally similar to those for total foliar N (Figures 2E–H and Table 3), with some exceptions. For E. regnans, allocation of 15N to mature leaves was greatest under abundant N-supply and full sunlight (Figure 2F), but light effects on leaf-15N were generally weaker than those on leaf-N (Table 3). 15N- allocation to young leaves was proportionally greater than 15N- allocation to mature leaves in E. regnans, as compared to E. grandis (significant Species × Age -interaction, Table 3). With increasing growth irradiance, 15N accumulated in young leaves of E. regnans (Figure 2H), despite plant growth not changing in such a dose-dependent manner. Growth irradiance had little influence on foliar 15N of E. grandis (Figures 2E,G).
E. grandis showed greater flexibility in LMA in response to light regime, whereas E. regnans responded more strongly via variation in leaf nitrogen (Nmass). Greater DM/FM of mature E. grandis leaves was most likely due to the formation of thicker cell walls, such that foliar C/N- remained strongly correlated with DM/FM-ratios during leaf ontogeny. This was not the case for E. regnans (Figure 3).
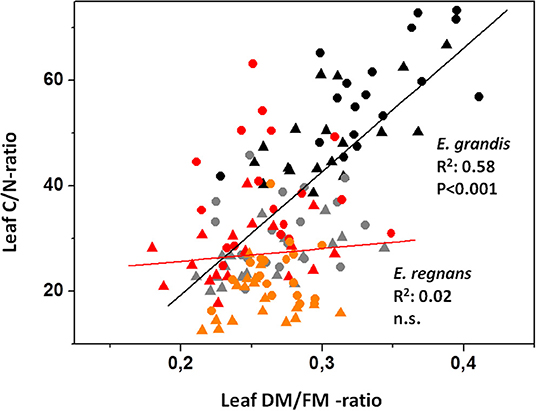
Figure 3. Relation between DM/FM- and C/N-ratios of Eucalyptus leaves. Black symbols: Eucalyptus grandis (mature leaves); gray: E. grandis (young leaves); red: E. regnans (mature); orange: E. regnans (young); circles: low N-addition; triangles: high N-addition. For E. grandis, correlation analysis included gray and black symbols (N = 72); and for E. regnans orange and red symbols (N = 72).
Photosynthetic Capacity of Source Leaves
Increasing rates of supply of N increased mass-based Amax and RCO2 by c. 10% in E. grandis (Figures 4E,G) and by 30% in E. regnans (Figures 4F,H). Nutrition- related increases in Vcmax and Jmax were weaker and statistically not significant (Figures 4A–D and Table 2).
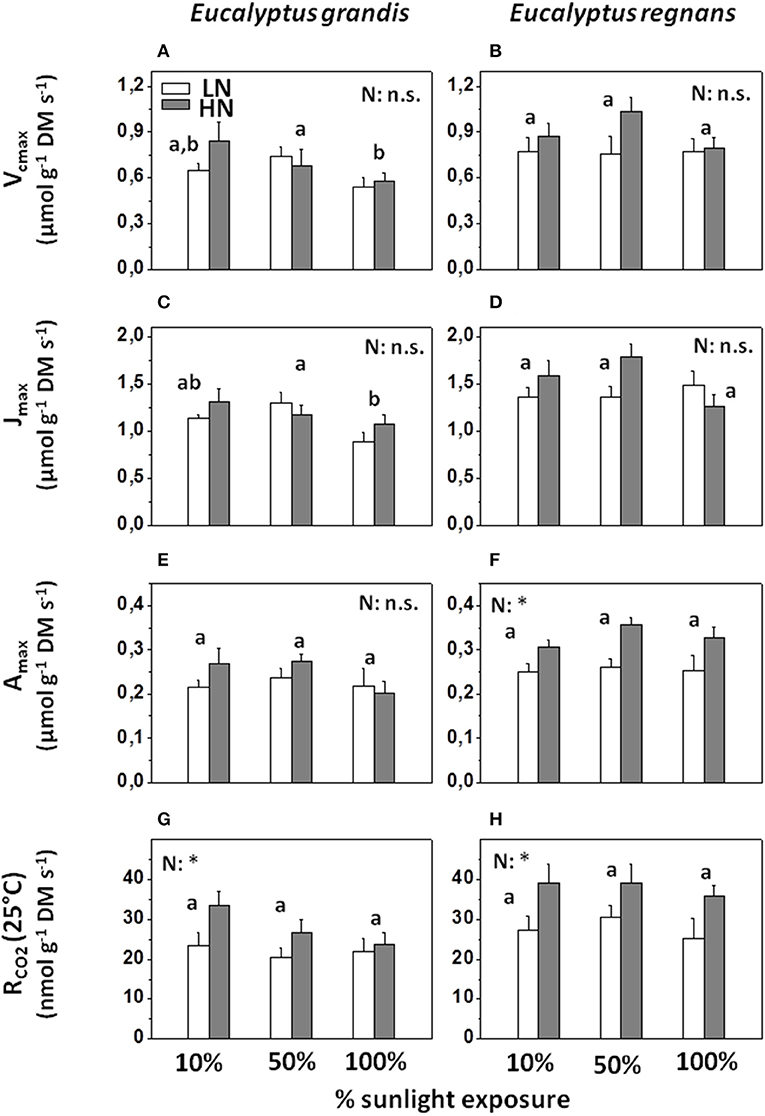
Figure 4. Photosynthetic capacity and CO2 dark-respiration (at 25°C) of Eucalyptus under differing N-nutrition and light intensity, determined via Infrared Gas Analysis. (A) Source-leaf Vcmax in Eucalyptus grandis. (B) Source-leaf Vcmax in Eucalyptus regnans. (C) Source-leaf Jmax in Eucalyptus grandis. (D) Source-leaf Jmax in Eucalyptus grandis Eucalyptus regnans. (E) Source-leaf Amax in Eucalyptus grandis. (F) Source-leaf Amax in Eucalyptus regnans. (G) Source-leaf RCO2 (CO2 dark respiration at 25°C) in Eucalyptus grandis. (H) Source-leaf RCO2 (CO2 dark respiration at 25°C) in Eucalyptus regnans. Open columns: “low” N-supply (LN: 2.6 mM N). Gray columns: “high” N-supply (HN: 8.1 mM N). Each column shows the average ±SE of 5–6 independent replicates. Different letters indicate significant differences between light regimes within species (N = 11–12 for each factor group; post-hoc Tukey HSD-test). Asterisk (*) indicates significant N-treatment effect (N = 17–18 for each factor group; n.s., not significant). N × L interactions within species were not significant. For effect sizes between species and treatments, see Table 2. For analysis on leaf area basis, see Figure S1 and Table S2.
Growth in full sunlight significantly reduced mass-based Jmax in E. grandis (Figure 3C), but this effect was not significant for Amax (Figure 3E and Table 2). We emphasize that area-based Amax increased with growth irradiance (Figure S1 and Table S3), owing to the production of thicker leaves (an effect that was more pronounced for E. grandis than E. regnans).
Parameters derived from gas exchange studies differed markedly between the two eucalypts, although species-dependent effect sizes were comparatively small (Table 2). As an example, even though mature leaves of E. regnans contained, on average, c. 60% more nitrogen than those of E. grandis (Nmass), mass-based Vcmax, Jmax, Amax, and RCO2 were only c. 25% greater (Figures 4A–H). Quantum use efficiency (i.e., the initial slope of the light response curve), was 5–10% greater for E. regnans than for E. grandis, while the light compensation point was 25% greater, corresponding to enhanced rates of respiration. There were no species-dependent or treatment-induced effects on Amax/RCO2 (Table 2). These variables were significantly correlated (R2: 0.56; P< 0.001; not shown), and effects on Amax and RCO2 were similar in size (Table 2).
Respiratory Capacity of Mature Leaves and Young Leaves
In phenomenological terms, three parameters comprehensively describe instantaneous temperature responses of mitochondrial oxygen reduction (Kruse and Adams, 2008b). At first approximation, the pre- exponential factor (lnRref) can be used as a measure of respiratory capacity (Atkin and Tjoelker, 2003; Noguchi et al., 2015; Kruse et al., 2018), even though lnRref also depends on exponent variables (analyzed in section Respiratory Temperature Sensitivity of Mature Leaves and Young Leaves). We first compared rates of CO2 respiration at 25°C (RCO2, determined via IRGA) with those of O2 reduction at 25°C (RO2, determined via calorimetry). RCO2 of middle- aged leaves fell neatly in between RO2 of mature and young leaves (Figure S2), suggesting steady decline of dark respiration as leaf development progressed.
lnRref of mature leaves significantly differed between species (c. 40% greater Rref for E. regnans, where Rref is the rate of oxygen reduction at 15°C reference temperature), but was only modestly affected by N supply and light regime. Rref of mature leaves was on average c. 10% greater under high N than low N (Figures 5A,B and Table 3). Light regime only affected Rref of mature E. regnans leaves (c. 10% greater in full sunlight, Figure 4B), but overall, sunlight exposure had little effect on Rref (Table 3).
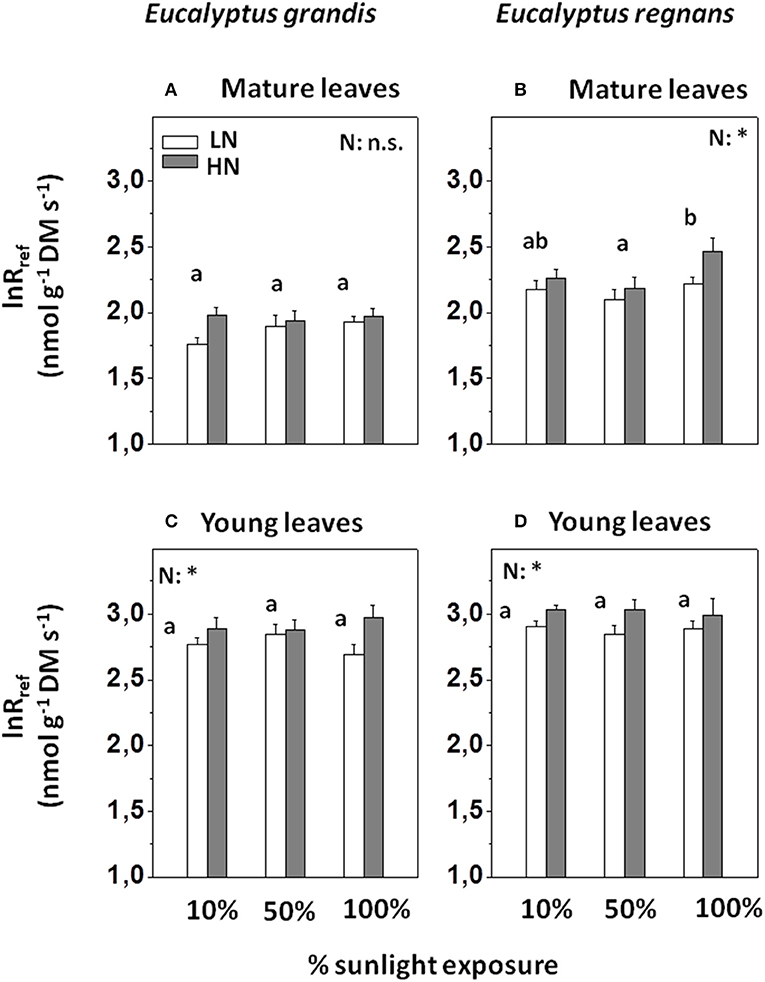
Figure 5. Capacity of mitochondrial O2-reduction in Eucalyptus grown under differing N-nutrition and light intensity, as determined via Calorimetry. (A) Capacity of respiratory O2-reduction (i.e., lnRref; logarithmic rates of O2-reduction at 15°C reference temperature) in mature Eucalyptus grandis leaves. (B) Respiratory capacity in mature Eucalyptus regnans leaves. (C) Respiratory capacity in young Eucalyptus grandis leaves. (D) Respiratory capacity in young Eucalyptus regnans leaves. Open columns: “low” N-supply (LN: 2.6 mM N). Gray columns: “high” N-supply (HN: 8 mM N). Each column shows the average ±SE of six independent replicates. Different letters indicate significant differences between light regimes within species (N = 12 for each factor group; post-hoc Tukey HSD- test). Asterisk (*) indicates significant N-treatment effect (N = 18 for each factor group; n.s., not significant). N × L interactions within species were not significant. For effect sizes between species and treatments (and leaf developmental stage), see Table 3.
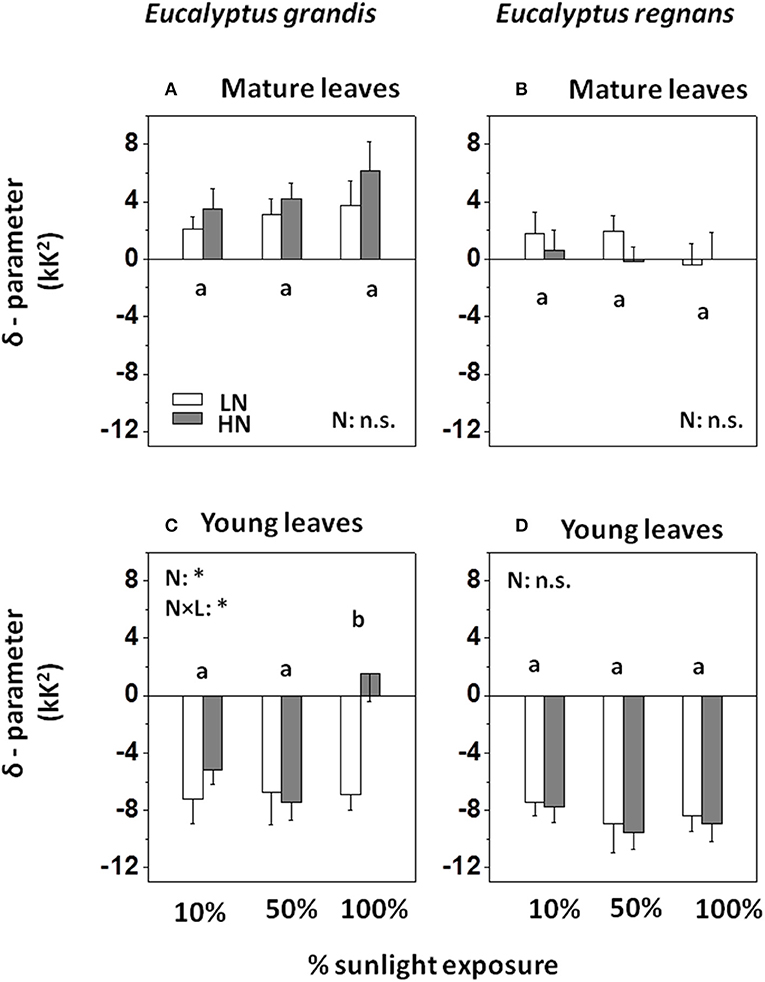
Figure 6. Temperature dependency of activation energy (δR) of mitochondrial O2-reduction in Eucalyptus grown under differing N-nutrition and light intensity. (A) Dynamic change of μ (or respiratory activation energy, Eo) with measurement temperature, captured by δ-parameter of mature Eucalyptus grandis leaves. (B) Respiratory δ-parameter for mature Eucalyptus regnans leaves. (C) Respiratory δ-parameter for young Eucalyptus grandis leaves. (D) Respiratory δ-parameter for young Eucalyptus regnans leaves. Open columns: “low” N-supply (LN: 2.6 mM N). Gray columns: “high” N-supply (HN: 8 mM N). Each column shows the average ±SE of six independent replicates. Different letters indicate significant differences between light regimes within species (N = 12 for each factor group; post-hoc Tukey HSD-test). Asterisk (*) indicates significant N-treatment effect (N = 18 for each factor group; n.s., not significant). For effect sizes between species and treatments (and leaf developmental stage), see Table 3.
Rref of young leaves was, on average, c. 130% greater than that of mature leaves (Figures 5C,D and Table 3). For both species, Rref of young leaves was 15–20% greater at high than low N supply, but unaffected by light regime. In contrast to mature leaves, Rref of young leaves was merely 10% greater for E. regnans than E. grandis (significant S × A effect on lnRref, Table 3). The above results differ slightly, if respiration is expressed per unit fresh mass (Table S4).
In accordance with the objectives of our study, we explored the relationship between lnRref and Nmass in greater detail (Figure 7A). Overall, Nmass statistically explained 56% of the variation in lnRref. However, the coefficient of determination was greater for E. grandis (R2 = 0.84, black and gray symbols, N = 72) than for E. regnans (R2 = 0.54, red and orange symbols, N = 72). Furthermore, regression slopes significantly differed between species (ANCOVA- result with lnRref as dependent variable and Nmass and Species as co-variables; species- dependent regressions not drawn in Figure 7A). In order to identify and quantify sources of residual variation, data were subjected to ANCOVA (with leaf age, nutrition and light as additional co-variables; Table 4A). For a given foliar Nmass (i.e., 16.5 mg N g−1 DM), Rref of young leaves was c.70% greater than that of mature leaves (Figure 8A). This difference was even more pronounced at 10% sunlight compared to 50 and 100% sunlight (Significant Age × Light effect, not shown in Figure 8). Overall, lnRref was similar between species at average Nmass (Figure 8C). However, this average weight conceals significant interactions between Species × Age (Figure 8D), Species × Light (Figure 8E) and Species × Nutrition (Figure 8F and Table 4A). In Eucalyptus regnans, predicted respiration at the covariable average (Nmass) was significantly less in young leaves (but greater in mature leaves), less at high growth irradiance (but greater at 10% sunlight exposure) and less under high N- supply (but similar at low N), as compared to Eucalyptus grandis (Figures 8D–F).
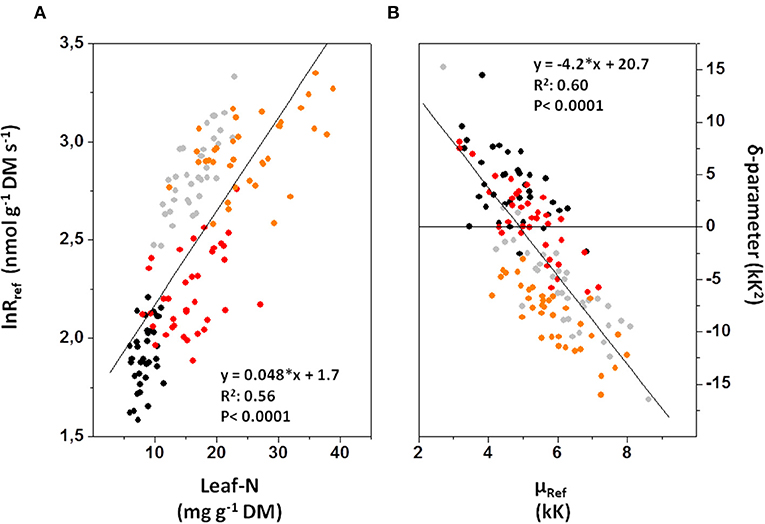
Figure 7. Relation between parameters of respiratory oxygen reduction, as affected by nitrogen status of Eucalyptus leaves. (A) Correlation between respiratory capacity (i.e., lnRref) and foliar N-contents. (B) Correlation between the temperature coefficient of O2-reduction at 15°C reference temperature [equivalent to overall activation energy at reference temperature, since μRef = Eo(Ref.)/ ℜ], and the dynamic change of activation energy with measurement temperature (δ-parameter). Black symbols: Eucalyptus grandis (mature leaves); gray: E. grandis (young leaves); red: E. regnans (mature); orange: E. regnans (young). In order to explore sources of residual variation, data were further analyzed via ANCOVA (Table 4 and Figures 8, 9) and via Principal Component Analysis (Table 5).
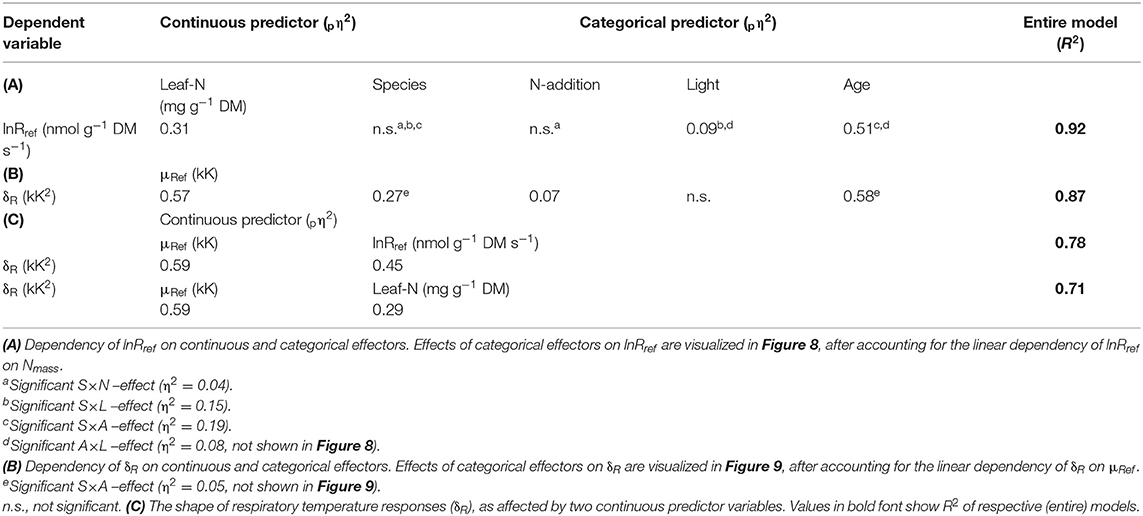
Table 4. Results of analysis of co-variance (ANCOVA).
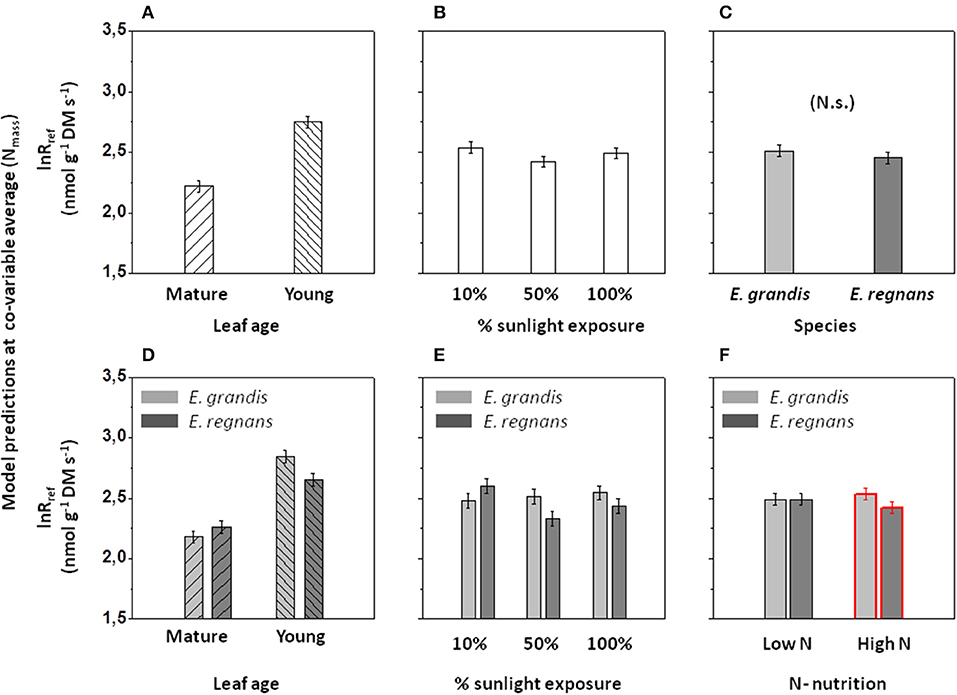
Figure 8. Effects of categorical predictor variables on respiratory capacity (lnRref), after accounting for the linear dependency on foliar Nmass as co-variable in ANCOVA. (A) Species-dependent effect. (B) Leaf age-dependent effect. (C) Effect of growth irradiance. (D) Interactive effect between species and leaf age. (E) Interactive effect between species and growth irradiance. (F) Interactive effect between species and nitrogen nutrition. Values shown are predicted capacities of mitochondrial oxygen reduction (i.e., lnRref) within ±95% confidence intervals at the co-variable average (i.e., Nmass = 16.5 mg g−1 DM). For further information on effect sizes on lnRref in ANCOVA, see Table 4A.
Respiratory Temperature Sensitivity of Mature Leaves and Young Leaves
The two exponent variables of the extended Arrhenius-model (Equations 3, 4) define the shape of respiratory temperature responses and inform us about the mode of mitochondrial electron flux (i.e., proportional contributions of the alternative and cytochrome pathways to oxygen reduction). Contrasting curvature in Arrhenius-plots (i.e., differing δR) must also affect μRef (and lnRref, section Respiratory Capacity of Mature Leaves and Young Leaves). In fact, the three parameters were mutually interdependent (see Table 5A). We first describe treatment-effects on δR, before we return to the relationship between δR and μRef.
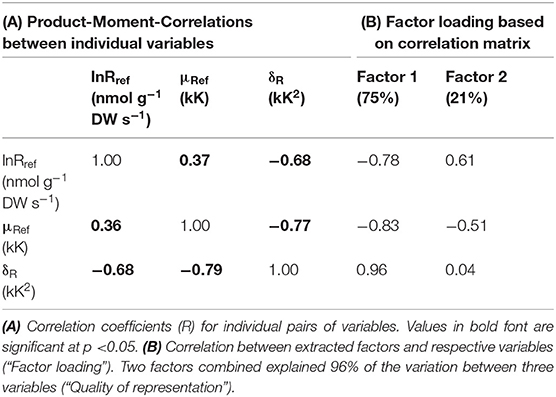
Table 5. Extraction of two principal components from variation in three variables defining respiratory performance of Eucalyptus leaves.
δR–parameter for mature leaves differed between species (Figures 6A,B), with δR averaging +3.8 kK2 for E. grandis and +0.6 kK2 for E. regnans. δR tended to increase with irradiance and N-supply in E. grandis (albeit statistically not significant within species, Figure 6A), whereas δR of mature E. regnans leaves tended to decrease in response to these treatments (Figure 6B).
δR–parameter of young leaves (Figures 6C,D) was significantly less than that of mature leaves (significant age effect, Table 3), and averaged −5.4 kK2 in E. grandis and −8.5 kK2 in E. regnans. For young leaves of E. grandis, δR increased with light and N supply—similar to the situation described for mature leaves. In contrast, δR of young E. regnans leaves tended to decline with increasing light and N supply (Figure 6D). Analysis of variance between species, leaf age classes and treatments (via 4- way ANOVA), confirmed small, but statistically significant Species × Light—and Species × Nutrition-effects on δR—parameter (Table 3).
Similar to the correlation between lnRref and Nmass (Figure 7A), there was a strong, albeit negative correlation between δR and μRef (R2 = 0.60; Figure 7B). There also was a conspicuous similarity in patterns of residual variation around the line of best fit, albeit again inverse to those observed for the lnRref – Nmass correlation. Sources of residual variation in the δR – μRef correlation were analyzed via ANCOVA (with δR as dependent variable, Table 4B). The results confirmed that species and, in particular, leaf age had comparatively large effects on δR, after accounting for the linear dependency on μRef. For example, at given μRef (i.e., 4.95 kK), predicted δR was +2.3 kK2 for mature and −3.9 kK2 for young leaves (Figure 9B). This effect was even more pronounced for E. regnans (significant Species × Age -effect; not shown in Figure 9). Incidentally, species and leaf age had marked effects on Nmass (Figures 2A–D) and lnRref (Figures 5A–D), as described above. δR–parameter was negatively correlated with lnRref (R = −0.68, Table 5A), as well as with Nmass (R = −0.56, not shown). ANCOVA with two continuous predictor variables (μRef and Nmass), explained 71% of the variation in δR (Table 4C)—considerably less than a mixed model with one continuous predictor (μRef) and categorical treatment predictors (87%, Table 4B). Most notably, high nitrogen addition increased δR (Figure 9C), thereby counteracting the generally negative relation between Nmass and δR.
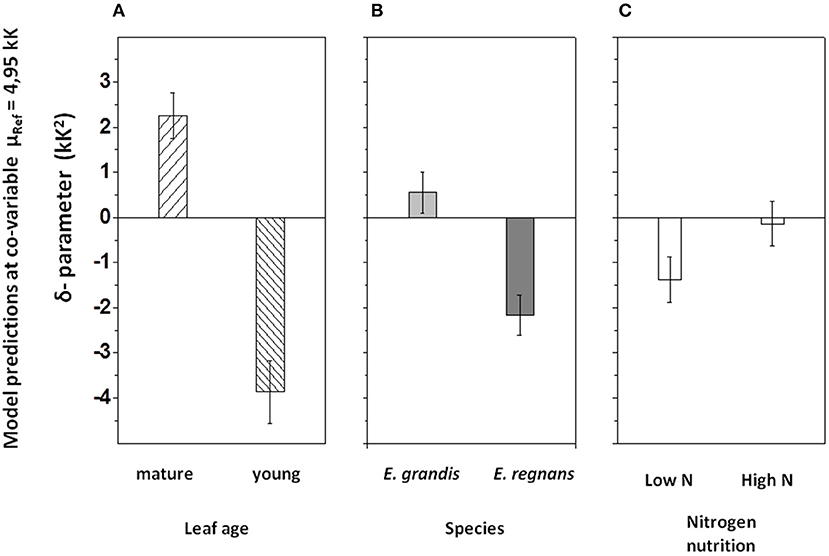
Figure 9. Effects of categorical predictor variables on δR, after accounting for the linear dependency on μRef (= Eo(Ref.)/ ℜ) as co-variable in ANCOVA. (A) Leaf age -dependent effect. (B) Species-dependent effect. (C) Nutrition-related effect. Values shown are predicted δR-values within ±95% confidence intervals at μRef = 4,95 kK (i.e., the x-axis intercept of the regression between exponent parameters; compare Figure 7B). The parameter δR defines the shape of log-polynomial temperature responses of leaf R. For δR>0 the shape is concave upwards, and for δR <0 it is convex downwards (compare Figure 1B). For further information on effect sizes on δR in ANCOVA, see Table 4B.
Finally, we extracted two principal components from the variation in three respiration parameters (lnRref, μRef, and δR; Table 5B). Two factors combined explained most of the variation in three respiration parameters (96%; Table 5B). Importantly, δR was almost entirely related to factor 1 (or “dimension 1”), but unrelated to dimension 2.
Discussion
Species-specific variability in leaf structural and physiological traits reflects selection pressures, which can produce alternative, but equally successful growth strategies under contrasting environmental conditions (Kruse et al., 2014). We studied plasticity of foliar traits as two eucalyptus species adapted to differing climate acclimated to light and nitrogen availability in a common garden. We discuss below how different plasticity of foliar traits might contribute to enhanced fitness of respective Eucalyptus seedlings in their preferred habitat (sensu Pigliucci, 2005). Particular attention was paid to respiratory traits that are not routinely measured, but could expand our mechanistic understanding of trait correlation networks (i.e., interdependencies between LMA, Nmass, Amax, and Rref; Evans, 1989; Wright et al., 2004; Niinemets et al., 2015).
Plasticity of Leaf Structural and Photosynthetic Traits in E. grandis and E. regnans
Acclimation to contrasting light regimes is often expressed per unit leaf area, because CO2-assimilation is driven by a vectorial flux of photons striking the leaf (Lloyd et al., 2013), and photosynthetic traits are primarily area- proportional (Osnas et al., 2013). However, there is also good argument that photosynthesis be considered on a mass basis (Givnish, 1988), which in combination with structural attributes (such as LMA) and Nmass, too provides insight to acclimation strategies (Le Roux et al., 1999; Evans and Poorter, 2001; Medhurst and Beadle, 2005). Furthermore, significant portions of leaf dark respiration and leaf-N are proportional to mass (Osnas et al., 2013). In the present study, we chose to express and discuss foliar traits on (dry) mass basis, and present area- based traits in Supplementary Information.
Allocation of nitrogen resources and acclimation of mass-based photosynthetic capacity (Vc, max, Jmax, Amax) is generally dominated by variation in PPFD (Kitajima, 1994; Frak et al., 2001; Pons and de Jong-van Berkel, 2004), as is the acclimation of LMA (Poorter et al., 2009). LMA increased with growth irradiance, but more so for E. grandis than E. regnans (Tables 1, 2). Foliar nitrogen, by contrast, was unaffected by light treatment in E. grandis, but increased with irandiance in E. regnans (Figure 2 and Table 3). Jmax was actually reduced when E. grandis was grown in 100% sunlight compared to 10% sunlight, but this effect was less pronounced for E. regnans (Figures 4A–F). LMA has been proposed as a “forcing variable” (Meziane and Shipley, 2001), inasmuch as attenuation of photon flux through the lamina ensures that chloroplasts located in deeper tissues are less effective (Reich et al., 1999; Meziane and Shipley, 2001). Reduced, mass-based Jmax of leaves acclimated to full sunlight can thus be explained for E. grandis given the strength of the LMA response to light regime, at constant Nmass. For E. regnans, light-dependent increases in foliar Nmass were unrelated to photosynthetic capacity, and at least some “surplus” leaf nitrogen was presumably protective (i.e., allocated to carotenoids, superoxide dismutase, ascorbate), to help dissipate excess energy (Hikosaka and Terashima, 1996; Foyer and Rennenberg, 2000; Warren and Adams, 2004; Poorter et al., 2006).
Enhanced nitrogen nutrition increased Nmass by c. 10% in E. grandis and by 25–30% in E. regnans (Figures 2A–D and Table 3), and was matched by similar increases in Amax and RCO2 (Figures 4E–H and Table 2). However, there was a strong, species-dependent mismatch between Nmass and Amax. Mature E. regnans leaves contained c. 60% more nitrogen than those of E. grandis, but Amax of E. regnans increased by only c. 25%. Growth of E. regnans was slower than of E. grandis, and less responsive to N supply (and growth irradiance; Tables 1, 2). Available nitrogen was used effectively for production of new foliage (and roots) in E. grandis (sensu, Leuning et al., 1991), whereas substantial amounts “accumulated” in E. regnans. For example, allocation of newly acquired 15N to expanding foliage was stronger in E. regnans than E. grandis, in particular in full sunlight (Figures 1G,H and Table 3). Under these conditions, young and developing leaves of E. regnans were reddish in color (not shown), reflecting accumulation of anthocyanins (and other non-photosynthetic pigments) known for their anti-oxidant and light-protective functions (Lambers et al., 1998).
The mismatch between responses of foliar nitrogen, Amax and growth in E. regnans, as compared to E. grandis, may also be related to climate of origin. E. regnans is one of many eucalypts well-adapted to cooler climates of mountain foothills in southern Australia. These species have mostly slower inherent growth rates than their lowland, northern counterparts (Kruse et al., 2012). Maintenance of greater pools of metabolic proteins can help buffer against cool temperatures, which may otherwise limit biochemical reaction rates (Berry and Björkman, 1980; Körner and Larcher, 1988; Atkin and Tjoelker, 2003). For example, DM/FM-ratios of mature leaves of E. regnans were much less than those of E. grandis (Figure 3). One interpretation is that E. regnans leaves maintain a larger fraction of nitrogen-rich symplast as they age. Put differently, E. grandis leaves have greater capacity for accretion of cell wall material (Figure 3 and Table 1). Furthermore, E. grandis more effectively used abundant nitrogen resources and light to produce new (and thicker) foliage, causing “dilution” of foliar N by growth. The location of our experiment overlapped with southern fringes of E. grandis populations, where the warm conditions were clearly better suited to sub-tropical origins of E. grandis.
Plasticity of Leaf Respiratory Traits: lnRref as a Measure of Mitochondrial Capacity
As noted by Körner (2008), a particularly obstinate difficulty in functional ecology is to define physiologically meaningful parameters and reference units for plant respiration. A potentially useful indicator of respiratory capacity is “elevation” of the curve describing temperature-dependent rates of respiration per unit mass (i.e., lnRref). Overall, respiratory capacity scaled positively with foliar nitrogen (Figure 7A). However, ANCOVA revealed marked differences in respiratory capacity between leaf developmental stages at the covariate average (Nmass, Figure 8B). This is likely due to the respective fractions of foliar N being allocated to mitochondria in young leaves, and to chloroplasts in mature leaves (Eschrich, 1995), or to greater activation state of respiratory enzymes in young leaves. Either way, developmentally linked differences in lnRref− Nmass relationships reflect greater demand for energy and anabolic intermediates in biosynthesis of expanding leaves (“growth respiration”; Penning de Vries, 1975; Azcón-Bieto et al., 1983; Thornley and Cannel, 2000; Armstrong et al., 2006; also compare Figure S2).
Respiratory capacity of young leaves at covariate average (Nmass) was less in E. regnans than E. grandis (Figure 7D). In E. regnans, respiratory capacity was, furthermore, comparatively low in full sunlight and under high N- supply (Figures 7E,F), again suggesting that under these conditions a considerable share of foliar nitrogen was allocated to protective or other functions, instead of primary metabolism. The correlation between Nmass and lnRref was stronger for E. grandis (R2 = 0.84) than E. regnans (R2 = 0.54; Figure 7B), indicating more effective usage of foliar nitrogen in primary metabolism by E. grandis, which was clearly related to faster growth.
Temperature-Dependent Changes in Activation Energy and Underlying Physiology
In the past, responses of leaf respiration to short-term shifts in (measurement) temperature were generally described via temperature- insensitive Q10 (i.e., often setting Q10 = 2.0 in Earth System Models), or via classical Arrhenius kinetics where activation energy is constant (reviewed by Atkin et al., 2005). However, it has become increasingly apparent that overall activation energy of leaf respiration (or Q10) is not constant across measurement temperatures (Atkin and Tjoelker, 2003; Noguchi et al., 2015; Heskel et al., 2016a; Adams et al., 2016; Atkin et al., 2017). In an extended, Arrhenius- type description, the temperature- dependency of activation energy is captured by the exponent parameter δR (Kruse et al., 2016, 2017).
In the present study, δR-values ranged from −15 to +10 kK2 (Figure 7B). This span of variation was considerably less than reported for a canopy gradient in Pinus radiata plantations (−40 to +10 kK2; Kruse and Adams, 2008b), and for 12 Eucalyptus species in a thermal acclimation experiment (−60 to +10 kK2; Kruse et al., 2012). However, our results suggest that even small variation in δR can be of major physiological importance. δR–parameter was significantly less in young than mature leaf, and less in E. regnans than E. grandis. Furthermore, precise calorimetric methods revealed small, but statistically significant increases of δR with nitrogen supply in E. grandis. These were not seen in E. regnans. δR increased with light in E. grandis, but decreased in E. regnans (Figures 6A–D and Table 3). We have previously argued that greater contributions of AOX (increasing δR) reflect proportionally greater demand for carbon skeleton intermediates than for ATP (Kruse et al., 2011). Increased synthesis of amino acids and cell wall compounds associated with rapid leaf growth in E. grandis, helps account for greater δR in response to greater resource availability. By contrast, comparatively low δR in E. grandis (exhibiting greater Nmass) presumably reflects proportionally greater ATP-demand for protein maintenance (Amthor, 2000; Gifford, 2003).
Synthesis and Outlook: Treatment Effects on the δR – μRef Relationship
Relationships between δR and μRef (=), where μRef denotes activation energy of mitochondrial oxygen reduction at reference temperature, help underpin mechanistic understandings of respiratory electron flux in mitochondria. At fixed reference temperature, neither μRef nor δR depend on the choice of other reference units, and are invariant to respiration being expressed per unit fresh mass, dry mass or foliar nitrogen. Nonetheless, foliar nitrogen (i.e., Nmass) does affect the relationship between μRef and δR (Table 4C).
δR and μRef were strongly correlated. δR was zero at μRef = 4.95 kK (or Eo(Ref.) = 41 kJ mol−1; Figure 7B)—similar to previous reports (Kruse and Adams, 2008b; Kruse et al., 2012). However, the coefficient of determination was significantly less (R2 = 0.60) than in previous studies. Here we have identified additional effects on the δR – μRef relation, chiefly related to variation in lnRref (Table 4C). In addition to the strong correlation between δR and μRef, δR was also negatively correlated with lnRref (Table 5A), and with Nmass. In a previous study of short-term acclimation of respiratory CO2-evolution, lnRref was negatively correlated with μRef (but not δR), and Nmass was constant (Kruse et al., 2018). The temperature sensitivity of respiration apparently differs for O2-consumption or CO2-release, in both statistical and physiological senses.
Oxygen reduction is a membrane-bound process in plant mitochondria, depending on diffusion of electron carriers (i.e., reduced ubiquinone) and the activation state of AOX vs. COX, competing for electrons (Millar et al., 2011). Here we consider three scenarios with differing influence on the relationship between exponent parameters:
1. In the first scenario, for a given membrane protein concentration, the ratio of reduced to oxidized ubiquinone (UQred/UQox) is assumed to be constant across measurement temperatures. In this scenario, δR remains tightly correlated with μRef (i.e., R2 ≈ 1.0), and the position along the continuum of δR–values indicates the activation state of AOX vs. COX (i.e., the mode of electron flux).
2. In the second scenario, we assume UQred/UQox to be greater than in the first, but still invariant with measurement temperature (and assuming the same membrane protein concentration and flux mode), thereby producing shifts in lnRref. Our results suggest variation in lnRref is a second leading dimension in the correlation between exponent parameters (Figure 7B and Tables 4C, 5B), and reflects absolute demand for ATP + reducing power + anabolic intermediates (Figure 10). Adjustments in both carbon- and electron flux to variation in demand for energy and intermediates can be quick, and do not require changes in enzyme concentration (Kruse et al., 2018). Nonetheless, sustained exposure to differing (a) light intensity, and (b) nitrogen nutrition, and differing metabolic demands between mature and young leaves, also caused pronounced species-specific variation in Nmass (Figures 2A–D).
3. In a third scenario, we assume that UQred/UQox and proportions of electron flux through the alternative relative to the cytochrome pathway are the same as in the first scenario, but that enzyme concentrations are greater. Increased frequency of collision between substrate molecules (UQred) and enzymes would, as in the second scenario, increase lnRref. At this point we recognize that membrane viscosity is a major driver of the (temperature-dependent) diffusion-velocity of electron carriers and is strongly influenced by membrane protein/lipid-ratios (Raison et al., 1980; Mitchell and Barber, 1986). Relationships between δR and μRef thus seem likely to be somewhat dependent on membrane composition.
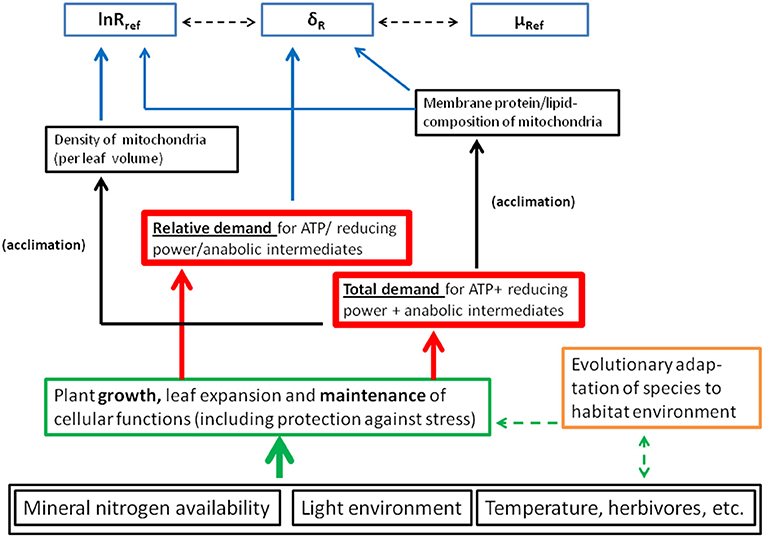
Figure 10. Proposed causal relationships between measured respiration parameters and underlying physiology. Putative physiological causes for variation in the three respiration parameters lnRref, μRef, and δR are highlighted by blue arrows. Physiological/anatomical acclimation affects correlations between respiration parameters (as indicated by dashed, black arrows). Acclimation is driven by environmentally induced shifts in cellular demand for ATP, reducing power and anabolic intermediates—both in absolute and relative terms. We emphasized acclimation to absolute demand for energy and metabolites, met by adjustments of mitochondrial density and enzyme concentration per mitochondrion. Short-term shifts in relative demand for energy and metabolites may more efficiently be met by post-translational modifications of existing enzymes (O'Leary and Plaxton, 2017). For a more detailed discussion see the text.
In phenomenological terms, respiratory temperature responses are readily captured via three parameters in an extended Arrhenius-type model (Equation 4). Nonetheless, the above scenarios illustrate complex underlying physiology (i.e., Tcherkez, 2017). In particular, assumption of entirely temperature- invariant UQred/UQox in vivo might be an over-simplification (Kruse et al., 2011). Even so, identification of two leading dimensions (or “drivers”) of correlations between exponent parameters helps elucidate flux control under in vivo conditions. From above, the two drivers we identify are (1) relative and (2) absolute, demand for ATP, reducing power and carbon skeleton intermediates (not ranked, Figure 10). Physiological/anatomical variables responsive to these drivers include mitochondrial density per leaf volume (dimension 2), enzyme concentration per mitochondrion (mostly dimension 2), and post-translational modifications of existing enzymes (dimension 1 and 2). For example, our high-nitrogen treatment increased leaf- Nmass and lnRref (Figures 5A–D), and δR (Figure 9C), responding to both higher absolute and relative demand for carbon-skeletons for amino acid synthesis (also see Kruse et al., 2018).
Elucidating interdependencies between respiratory parameters, as affected by developmental and environmental factors, will likely continue to improve our mechanistic understanding of respiratory flux control, and could, in the longer term, enable the development of a process- based model of plant respiration and growth. Improved process- based understanding of respiratory control might also facilitate formulation of algorithms describing acclimation of leaf gas exchange to climate change (Aspinwall et al., 2016), in order to better predict feedbacks on gas exchange between atmosphere and biosphere in Earth System Models (Atkin et al., 2017).
Conclusions
Eucalyptus grandis seedlings had inherently greater capacity to use mineral N for growth, whereas nitrogen “accumulated” in foliage of E. regnans. N-accumulation in leaves of E. regnans (stimulated by high N supply and high light intensity) was not matched by mostly small increases in photosynthetic capacity (mass-based Amax, Vcmax, or Jmax)—suggesting instead that a considerable fraction of leaf N was linked to protective functions. E. grandis, by contrast, was more flexible in adjusting LMA to prevailing growth irradiance.
Respiratory temperature responses could be described by three parameters of an extended Arrhenius equation, which captured species-dependent variation in acclimation to N supply and light regime. Respiratory capacity (i.e., lnRref) was strongly correlated with foliar Nmass. The exponent parameters δR and μRef provided information about modes of mitochondrial electron flux. We demonstrated closer coordination between Nmass, respiratory capacity and flux mode in E. grandis, allowing for faster rates of growth.
Correlation analysis between exponent parameters helps us understand physiological/anatomical variables controlling flux. Drivers of correlations between exponent parameters are related to (1) relative demand, and (2) absolute demand, for ATP, reducing power and anabolic intermediates.
Data Availability Statement
All datasets generated for this study are included in the article/Supplementary Material.
Author Contributions
MA and HR conceived and managed the project. TT designed the experiment and tended the plants. JK and TT performed physiological measurements and analyzed the data. All authors contributed to writing the manuscript.
Funding
This study was financially supported by the University of Sydney.
Conflict of Interest
The authors declare that the research was conducted in the absence of any commercial or financial relationships that could be construed as a potential conflict of interest.
Acknowledgments
We thank Prof. Aspinwall and two reviewers for many helpful comments on earlier draft(s) of this manuscript.
Supplementary Material
The Supplementary Material for this article can be found online at: https://www.frontiersin.org/articles/10.3389/ffgc.2020.00005/full#supplementary-material
References
Adams, M. A., Rennenberg, H., and Kruse, J. (2016). Different models provide equivalent predictive power for cross-biome response of leaf respiration to temperature. Proc. Natl. Acad. Sci. U.S.A. 113, E5993–E5995. doi: 10.1073/pnas.1608562113
Amthor, J. S. (2000). The McCree-de Wit-Penning de Vries-Thornley respiration paradigms: 30 years later. Ann. Bot. 86, 1–20. doi: 10.1006/anbo.2000.1175
Araujo, W. L., Nunes-Nesi, A., Nikoloski, Z., Sweetlove, L. J., and Fernie, A. R. (2012). Metabolic control and regulation of the tricarboxylic acid cycle in photosynthetic and heterotrophic plant tissues. Plant Cell. Environ. 35, 1–21. doi: 10.1111/j.1365-3040.2011.02332.x
Arcus, V. L., Prentice, E. J., Hobbs, J. K., Mulholland, A. J., Van der Kamp, M. W., Pudney, C. R., et al. (2016). On the temperature dependence of enzyme-catalyzed rates. Biochemistry 55, 1681–1688. doi: 10.1021/acs.biochem.5b01094
Armstrong, A. F., Logan, D. C., and Atkin, O. K. (2006). On the developmental dependence of leaf respiration: responses to short- and long-term changes in growth temperature. Am. J. Bot. 93, 1633–1639. doi: 10.3732/ajb.93.11.1633
Aspinwall, M. J., Drake, J. E., Company, C., Vårhammer, A., Ghannoum, O., Tissue, D. T., et al. (2016). Convergent acclimation of leaf photosynthesis and respiration to prevailing ambient temperatures under current and warmer climates in Eucalyptus tereticornis. New Phytol. 212, 354–367. doi: 10.1111/nph.14035
Atkin, O. K., Bahar, N. H. A., Bloomfield, K. J., Griffin, K., Heskel, M. A., and Turnbull, M. H. (2017). “Leaf respiration in terrestrial biosphere models,” in Plant Respiration: Metabolic Fluxes and Carbon Balance, Vol. 43, eds G. Tcherkez and J. Ghashghaie (Springer International Publishing AG), 107–142.
Atkin, O. K., Bloomfield, K. J., Reich, P. B., Tjoelker, M. G., Asner, G. P., Bonal, D., et al. (2015). Global variability in leaf respiration in relation to climate, plant functional types and leaf traits. New Phytol. 206, 614–636. doi: 10.1111/nph.13253
Atkin, O. K., Bruhn, D., Hurry, V. M., and Tjoelker, M. G. (2005). The hot and the cold: unravelling the variable response of plant respiration to temperature. Funct. Plant Biol. 32, 87–105. doi: 10.1071/FP03176
Atkin, O. K., and Tjoelker, M. G. (2003). Thermal acclimation and the dynamic response of plant respiration to temperature. Trends Plant Sci. 8, 343–352. doi: 10.1016/S1360-1385(03)00136-5
Azcón-Bieto, J., Lambers, H., and Day, D. A. (1983). Respiratory properties of developing bean and pea leaves. Aust. J. Plant Physiol. 10, 237–245. doi: 10.1071/PP9830237
Azcón-Bieto, J., and Osmond, C. B. (1983). Relationship between photosynthesis and respiration: the effect of carbohydrate status on the rate of CO(2) production by respiration in darkened and illuminated wheat leaves. Plant Physiol. 71, 574–581. doi: 10.1104/pp.71.3.574
Berry, J., and Björkman, O. (1980). Photosynthetic response and adaptation to temperature in higher plants. Annu. Rev. Plant Physiol. 31, 491–543. doi: 10.1146/annurev.pp.31.060180.002423
Bouma, T. (2005). “Understanding plant respiration: separating respiratory components versus a process- based approach,” in Plant Respiration From Cell to Ecosystem, eds H. Lambers and M. Ribas- Carbó (Dordrecht: Springer), 177–194. doi: 10.1007/1-4020-3589-6_10
Criddle, R., Smith, B. N., and Hansen, L. D. (1997). A respiration based description of plant growth rate responses to temperature. Planta 201, 441–445. doi: 10.1007/s004250050087
Criddle, R. S., Hopkin, M. S., McArthur, E. D., and Hansen, L. D. (1994). Plant distribution and the temperature coefficient of metabolism. Plant Cell Environ. 17, 233–243. doi: 10.1111/j.1365-3040.1994.tb00289.x
Evans, J. R. (1989). Photosynthesis and nitrogen relationships in leaves of C3 plants. Oecologia 78, 9–19. doi: 10.1007/BF00377192
Evans, J. R. (1996). “Developmental constraints on photosynthesis: effects of light and nutrition,” in Photosynthesis and the Environment ed N. R. Baker (Dordrecht: Kluwer), 281–304.
Evans, J. R., and Poorter, H. (2001). Photosynthetic acclimation of plants to growth irradiance: the relative importance of specific leaf area and nitrogen partitioning in maximizing carbon gain. Plant Cell Environ. 24, 755–767. doi: 10.1046/j.1365-3040.2001.00724.x
Field, C. B., and Mooney, H. A. (1986). “The photosynthesis – nitrogen relationship in wild plants,” in On the Economy of Plant Form and Function, ed T. J. Givnish (New York, NY: Cambridge University Press), 22–55.
Foyer, C. H., and Rennenberg, H. (2000). “Regulation of gluthatione synthesis and its role in abiotic and biotic stress defense,” in Sulfur Nutrition and Sulfur Assimilation in Higher Plants, eds C. Brunold, H. Rennenberg, L. J. De Kok, I. Stulen, and J.-C. Davidian (Bern: Paul Haupt), 127–153.
Frak, E., Le Roux, X., Millard, P., Dreyer, E., Jaouen, G., Saint-Joanis, B., et al. (2001). Changes in total leaf nitrogen and partitioning of leaf nitrogen drive photosynthetic acclimation to light in fully developed walnut leaves. Plant Cell Environ. 24, 1279–1288. doi: 10.1046/j.0016-8025.2001.00784.x
Gifford, R. M. (2003). Plant respiration in productivity models: conceptualization, representation and issues for global terrestrial carbon-cycle research. Funct. Plant Biol. 30, 171–186. doi: 10.1071/FP02083
Hansen, L. D., Hopkin, M. S., Rank, D. R., Anekonda, T. S., Breidenbach, R. W., and Criddle, R. S. (1994). The relation between plant growth and respiration: a thermodynamic model. Planta 194, 77–85. doi: 10.1007/BF00201037
Heskel, M. A., Atkin, O. K., O'Sullivan, O. S., Reich, P., Tjoelker, M. G., Weerasinghe, L. K., et al. (2016a). Reply to Adams et al.: empirical versus process-based approaches to modeling temperature responses of leaf respiration. Proc. Natl. Acad. Sci. U.S.A. 113, E5996–E5997. doi: 10.1073/pnas.1612904113
Heskel, M. A., O'Sullivan, O., Reich, P. B., Tjoelker, M. G., Weerasinghe, L. K., Penillard, A., et al. (2016b). Convergence in the temperature response of leaf respiration across biomes and plant functional types. Proc. Natl. Acad. Sci. U.S.A. 113, 3832–3837. doi: 10.1073/pnas.1520282113
Hikosaka, K., and Terashima, I. (1996). Nitrogen partitioning among photosynthetic components and its consequence in sun and shade plants. Funct. Ecol. 10, 335–343. doi: 10.2307/2390281
Hirose, T., and Werger, M. J. A. (1987). Maximizing daily canopy photosynthesis with respect to leaf nitrogen allocation pattern in the canopy. Oecologia 72, 520–526. doi: 10.1007/BF00378977
Hobbs, J. K., Jiao, W., Easter, A. D., Parker, E. J., Schipper, L. A., and Arcus, V. L. (2013). Change in heat capacity for enzyme catalysis determines temperature dependence of enzyme catalyzed rates. ACS Chem. Biol. 8, 2388–2393. doi: 10.1021/cb4005029
Kitajima, K. (1994). Relative importance of photosynthetic traits and allocation patterns as correlates of seedling shade tolerance of 13 tropical species. Oecologia 98, 419–428. doi: 10.1007/BF00324232
Körner, C. (2008). “Grundlagen der Pflanzenökologie,” in Strasburger - Lehrbuch der Botanik, eds A., Bresinsky, C., Körner, J. W., Kadereit, G., Neuhaus, and U. Sonnewald (Berlin: Springer-Verlag), 949–1120.
Kruse, J., and Adams, M. A. (2008a). Sensitivity of respiratory metabolism and efficiency to foliar nitrogen during growth and maintenance. Glob. Change Biol. 14, 1233–1251. doi: 10.1111/j.1365-2486.2008.01566.x
Kruse, J., and Adams, M. A. (2008b). Three parameters comprehensively describe the temperature response of respiratory oxygen reduction. Plant Cell Environ. 31, 954–967. doi: 10.1111/j.1365-3040.2008.01809.x
Kruse, J., Adams, M. A., Kadinov, G., Arab, L., Kreuzwieser, J., Schulze, W., et al. (2017). Characterization of photosynthetic acclimation in Phoenix dactylifera by a modified Arrhenius equation originally developed for leaf respiration. Trees 31, 623–644. doi: 10.1007/s00468-016-1496-0
Kruse, J., Alfarraj, S., Rennenberg, H., and Adams, M. A. (2016). A novel mechanistic interpretation of instantaneous temperature responses of leaf net photosynthesis. Photosynth. Res. 129, 43–58. doi: 10.1007/s11120-016-0262-x
Kruse, J., Gao, P., Honsel, A., Kreuzwieser, J., Burzlaff, T., Alfarraj, S., et al. (2014). Strategy of nitrogen acquisition and utilization by carnivorous Dionaea muscipula. Oecologia 174, 839–851. doi: 10.1007/s00442-013-2802-9
Kruse, J., Hopman, P., and Adams, M. A. (2008). Temperature responses are a window to the physiology of dark respiration: differences between CO2 release and O2 reduction shed light on energy conservation. Plant Cell Environ. 31, 901–914. doi: 10.1111/j.1365-3040.2008.01808.x
Kruse, J., Rennenberg, H., and Adams, M. A. (2011). Steps towards a mechanistic understanding of respiratory temperature responses. New Phytol. 189, 659–677. doi: 10.1111/j.1469-8137.2010.03576.x
Kruse, J., Rennenberg, H., and Adams, M. A. (2018). Three physiological parameters capture variation in leaf respiration of Eucalyptus grandis, as elicited by short-term changes in ambient temperature, and differing nitrogen supply. Plant Cell Environ. 41, 1369–1382. doi: 10.1111/pce.13162
Kruse, J., Turnbull, T., and Adams, M. A. (2012). Disentangling respiratory acclimation and adaptation to growth temperature by Eucalyptus spp. New Phytol. 195, 149–163. doi: 10.1111/j.1469-8137.2012.04155.x
Kull, O., and Kruijt, B. (1999). Acclimation of photosynthesis to light: a mechanistic approach. Funct. Ecol. 13, 24–36. doi: 10.1046/j.1365-2435.1999.00292.x
Lambers, H., Chapin, F. S., and Pons, T. L. (1998). Plant Physiological Ecology. New York, NY: Springer Verlag.
Le Roux, X., Sinoquet, H., and Vandame, M. (1999). Spatial distribution of leaf dry weight per area and leaf nitrogen concentration in relation to local radiation regime within an isolated tree crown. Tree Physiol. 19, 181–188. doi: 10.1093/treephys/19.3.181
Leuning, R., Cromer, R. N., and Rance, S. (1991). Spatial distributions of foliar nitrogen and phosphorus in crowns of Eucalyptus grandis. Oecologia 88, 504–510.
Liang, L. L., Arcus, V. L., Heskel, M. A., O'Sullivan, O. S., Weerasinghe, L. K., Creek, D., et al. (2018). Macromolecular Rate Theory provides a thermodynamics rationale to underpin the convergent temperature response in plant leaf respiration. Glob. Change Biol. 24, 1538–1547. doi: 10.1111/gcb.13936
Lloyd, J., Bloomfield, K., Domingues, T. F., and Farquhar, G. D. (2013). Photosynthetically relevant foliar traits correlating better on a mass vs an area basis: of ecophysiological relevance or just a case of mathematical imperatives and statistical quicksand? New Phytol. 199, 311–321. doi: 10.1111/nph.12281
MacFarlane, C., Hansen, L. D., Florez-Sarasa, I., and Ribas-Carbo, M. (2009). Plant mitochondria electron partitioning is independent of short-term temperature changes. Plant Cell Environ. 32, 585–591. doi: 10.1111/j.1365-3040.2009.01953.x
Marshall, B., and Biscoe, P. V. (1980). A model for C3 leaves describing the dependence of net photosynthesis on irradiance. I. Derivation. J. Exp. Bot. 31, 29–39. doi: 10.1093/jxb/31.1.29
Medhurst, J. L., and Beadle, C. L. (2005). Photosynthetic capacity and foliar nitrogen distribution in Eucalyptus nitens is altered by high-intensity thinning. Tree Physiol. 25, 981–991. doi: 10.1093/treephys/25.8.981
Meziane, D., and Shipley, B. (2001). Direct and indirect relationships between specific leaf area, leaf nitrogen and leaf gas exchange. Effects of irradiance and nutrient supply. Ann. Bot. 88, 915–927. doi: 10.1006/anbo.2001.1536
Millar, A. H., Whelan, J., Soole, K. L., and Day, D. A. (2011). Organization and regulation of mitochondrial respiration in plants. Annu. Rev. Plant Biol. 62, 79–104. doi: 10.1146/annurev-arplant-042110-103857
Mitchell, R. A. C., and Barber, J. (1986). Adaptation of photosynthetic electron-transport rate to growth temperature in pea. Planta 169, 429–436. doi: 10.1007/BF00392141
Niinemets, Ü. (2007). Photosynthesis and resource distribution through plant canopies. Plant Cell Environ. 30, 1052–1071. doi: 10.1111/j.1365-3040.2007.01683.x
Niinemets, Ü., Keenan, T. F., and Hallik, L. (2015). A worldwide analysis of within-canopy variations in leaf structural, chemical and physiological traits across plant functional types. New Phytol. 205, 973–993. doi: 10.1111/nph.13096
Noguchi, K., Nakajima, N., and Terashima, I. (2001). Acclimation of leaf respiratory properties in Alocasia odora following reciprocal transfers of plants between high- and low-light environments. Plant Cell Environ. 24, 831–839. doi: 10.1046/j.1365-3040.2001.00728.x
Noguchi, K., Yamori, W., Hikosaka, K., and Terashima, I. (2015). Homeostasis of the temperature sensitivity of respiration over a range of growth temperatures indicated by a modified Arrhenius model. New Phytol. 207, 34–42. doi: 10.1111/nph.13339
O'Leary, B. M., and Plaxton, W. C. (2017). “Mechanisms and functions of post-translational enzyme modifications in the organization and control of plant respiratory metabolism,” in Plant Respiration: Metabolic Fluxes and Carbon Balance, Vol. 43, eds G. Tcherkez and J. Ghashghaie (Springer International Publishing AG), 261–284.
Osnas, J. L. D., Lichstein, J. W., Reich, P. B., and Pacala, S. W. (2013). Global leaf trait relationships: mass, area and the leaf economics spectrum. Science 340, 741–744. doi: 10.1126/science.1231574
Penning de Vries, F. W. T. (1975). The cost of maintenance processes in plant cells. Ann. Bot. 39, 77–92. doi: 10.1093/oxfordjournals.aob.a084919
Pigliucci, M. (2005). Evolution of phenotypic plasticity: where are we going now? Trends Ecol. Evol. 20, 481–486. doi: 10.1016/j.tree.2005.06.001
Pons, T. L., and de Jong-van Berkel, Y. E. M. (2004). Species-specific variation in the importance of the spectral quality gradient in canopies as a signal for photosynthetic resource partitioning. Ann. Bot. 94, 725–732. doi: 10.1093/aob/mch197
Poorter, H., Lambers, H., and Evans, J. R. (2014). Trait correlation networks: a whole-plant perspective on the recently criticized leaf economic spectrum. New Phytol. 201, 378–382. doi: 10.1111/nph.12547
Poorter, H., Niinemets, Ü., Poorter, L., Wright, I. J., and Villar, R. (2009). Causes and consequences of variation in leaf mass per are (LMA): a meta-analysis. New Phytol. 182, 565–588. doi: 10.1111/j.1469-8137.2009.02830.x
Poorter, H., Pepin, S., Rijkers, T., de Jong, Y., Evans, R. R., and Körner, C. (2006). Construction costs, chemical composition and payback time of high- and low- irradiance leaves. J. Exp. Bot. 57, 355–371. doi: 10.1093/jxb/erj002
Raison, J. K., Berry, J. A., Armond, P. A., and Pike, C. S. (1980). “Membrane properties in relation to the adaptation of plants to temperature stress,” in Adaptation of Plants to Water and High Temperature Stress, eds N. C. Turner and P. J. Kramer (New York, NY: John Wiley & Sons), 261–273.
Rasmusson, A. G., Soole, K. L., and Elthon, T. E. (2004). Alternative NAD(P)H dehydrogenases of plant mitochondria. Ann. Rev. Plant Biol. 55, 23–39. doi: 10.1146/annurev.arplant.55.031903.141720
Reich, P. B., Ellsworth, D. S., Walters, M. B., Vose, J. M., Gresham, C., Volin, J. C., et al. (1999). Generality of leaf trait relationships: a test across six biomes. Ecology 80, 1955–1969. doi: 10.1890/0012-9658(1999)080[1955:GOLTRA]2.0.CO;2
Reich, P. B., Oleksyn, J., and Tjoelker, M. G. (1996). Needle respiration and nitrogen concentration in Scots Pine populations from a broad latitudinal range: a common garden test with field-grown trees. Funct. Ecol. 10, 768–776. doi: 10.2307/2390512
Reich, P. B., Sendall, K. M., Stefanski, A., Wei, X., Rich, R. L., and Montgomery, R. A. (2016). Boreal and temperate trees show strong acclimation of respiration to warming. Nature 531, 633–636. doi: 10.1038/nature17142
Reich, P. B., Tjoelker, M. G., Pregitzer, K. S., Wright, I. J., Oleksyn, J., and Machado, J-L. (2008). Scaling of respiration to nitrogen in leaves, stems and roots of higher plants. Ecol. Lett. 11, 793–801. doi: 10.1111/j.1461-0248.2008.01185.x
Ryan, M. G., Hubbart, R. M., Pongracic, S., Raison, R. J., and McMurtrie, R. E. (1996). Foliage, fine-root, woody tissue and stand respiration in Pinus radiata in relation to nitrogen status. Tree Physiol. 16, 333–343. doi: 10.1093/treephys/16.3.333
Schulze, E. D., Kelliher, F. M., Körner, C., Lloyd, J., and Leuning, R. (1994). Relationships among maximum stomatal conductance, ecosystem surface conductance, carbon assimilation rate, and plant nitrogen nutrition – a global ecology scaling exercise. Ann. Rev. Ecol. Syst. 25, 629–660. doi: 10.1146/annurev.es.25.110194.003213
Sharkey, T. D., Bernacchi, C. J., Farquhar, G. D., and Singsaas, E. L. (2007). Fitting photosynthetic carbon dioxide response curves for C3 leaves. Plant Cell Environ. 30, 1035–1040. doi: 10.1111/j.1365-3040.2007.01710.x
Shipley, B., Lechowicz, M. J., Wright, I., and Reich, P. B. (2006). Fundamental trade-offs generating the worldwide leaf economics spectrum. Ecology 87, 535–541. doi: 10.1890/05-1051
Slot, M., and Kitajima, K. (2015). General patterns of leaf respiration to elevated temperatures across biomes and plant types. Oecologia 177, 885–900. doi: 10.1007/s00442-014-3159-4
Sweetlove, L. J., Beard, K. F. M., Nunes-Nesi, A., Fernie, A. R., and Ratcliffe, R. G. (2010). Not just a circle: flux modes in the plant TCA cycle. Trends Plant Sci. 15, 462–470. doi: 10.1016/j.tplants.2010.05.006
Tcherkez, G. (2017). “Tracking the orchestration of the Tricarboxylic Acid Pathway in plants, 80 years after the discovery of the Krebs Cycle,” in Plant Respiration: Metabolic Fluxes and Carbon Balance (Springer International Publishing AG), Vol. 43, eds G. Tcherkez and J. Ghashghaie, 285–298.
Tcherkez, G., Gauthier, P., Buckley, T., Busch, F. A., Barbour, M. M., Bruhn, D., et al. (2017). Leaf day respiration: low CO2 flux but high significance for metabolism and carbon balance. New Phytol. 216, 986–1001. doi: 10.1111/nph.14816
Thornley, J. H. M., and Cannel, M. R. G. (2000). Modeling the components of plant respiration: representation and realism. Ann. Bot. 85, 55–67. doi: 10.1006/anbo.1999.0997
Thornley, J. H. M., and Johnson, I. R. (1990). Plant and Crop Modelling: A Mathematical Approach to Plant and Crop Physiology. Oxford: Oxford Science Publications.
Vanderwel, M. C., Slot, M., Lichstein, J. W., Reich, P. B., Kattge, J., Atkin, O. K., et al. (2015). Global convergence in leaf respiration from estimates of thermal acclimation across time and space. New Phytol. 207, 1026–1037. doi: 10.1111/nph.13417
Vanlerberghe, G. C., and McIntosh, L. (1997). Alternative oxidase: from gene to function. Ann. Rev. Plant Physiol. Plant Mol. Biol. 48, 703–734. doi: 10.1146/annurev.arplant.48.1.703
Warren, C. R., and Adams, M. A. (2004). What determines rates of photosynthesis per unit nitrogen in Eucalyptus seedlings? Funct. Plant Biol. 31, 1169–1178. doi: 10.1071/FP04115
Westoby, M., Falster, D. S., Moles, A. T., Vesk, P. A., and Wright, I. J. (2002). Plant ecological strategies: some leading dimensions of variation between species. Ann. Rev. Ecol. Syst. 33, 125–159. doi: 10.1146/annurev.ecolsys.33.010802.150452
Westoby, M., Reich, P. B., and Wright, I. J. (2013). Understanding ecological variation across species: area-based vs mass-based expression of leaf traits. New Phytol. 199, 322–323. doi: 10.1111/nph.12345
Wright, I. J., Reich, P. B., Atkin, O. K., Lusk, C. H., Tjoelker, M. G., and Westoby, M. (2006). Irradiance, temperature and rainfall influence leaf dark respiration in woody plants: evidence from comparisons across 20 sites. New Phytol. 169, 309–319. doi: 10.1111/j.1469-8137.2005.01590.x
Keywords: acclimation, adaptation, Arrhenius equation, flux control, leaf photosynthetic traits, nitrogen—respiration relationships
Citation: Kruse J, Turnbull T, Rennenberg H and Adams MA (2020) Plasticity of Leaf Respiratory and Photosynthetic Traits in Eucalyptus grandis and E. regnans Grown Under Variable Light and Nitrogen Availability. Front. For. Glob. Change 3:5. doi: 10.3389/ffgc.2020.00005
Received: 22 September 2019; Accepted: 13 January 2020;
Published: 06 February 2020.
Edited by:
Mike Aspinwall, University of North Florida, United StatesReviewed by:
Lahcen Benomar, Laval University, CanadaMartijn Slot, Smithsonian Tropical Research Institute (SI), Panama
Copyright © 2020 Kruse, Turnbull, Rennenberg and Adams. This is an open-access article distributed under the terms of the Creative Commons Attribution License (CC BY). The use, distribution or reproduction in other forums is permitted, provided the original author(s) and the copyright owner(s) are credited and that the original publication in this journal is cited, in accordance with accepted academic practice. No use, distribution or reproduction is permitted which does not comply with these terms.
*Correspondence: Jörg Kruse, am9lcmcua3J1c2VAY3RwLnVuaS1mcmVpYnVyZy5kZQ==
†These authors have contributed equally to this work