 Maryam Salehi1
 Lorenz Walthert1
 Stephan Zimmermann1
 Peter Waldner1
 Maria Schmitt1
 Patrick Schleppi1Käthi Liechti1
 Mohsen Ahmadi2
 Ghavamuddin Zahedi Amiri3
 Ivano Brunner1
 Anne Thimonier1*
- 1WSL – Swiss Federal Institute for Forest, Snow and Landscape Research, Birmensdorf, Switzerland
- 2Department of Natural Resources, Isfahan University of Technology, Isfahan, Iran
- 3Department of Forestry and Forest Economics, Faculty of Natural Resources, University of Tehran, Karaj, Iran
Climate change and the expected increase in frequency of dry summers are likely to affect the growth of important tree species. We investigated relationships between morphological and chemical leaf traits of European beech (Fagus sylvatica L.) and environmental factors along a water availability gradient consisting of 12 sites located throughout Switzerland. We found that leaf dry mass and leaf area tended to decrease with increasing long-term mean annual precipitation (MAP) and actual to potential transpiration (AT/PT), two correlated variables that form the water availability gradient. These results contrast with those of several other studies, and might be explained by favorable temperature and humidity conditions during leaf formation in spring at the dry sites. Although the relationship was not linear over the whole gradient, the drier sites were characterized by beech with a lower specific leaf area, along with higher foliar potassium (K) and lower foliar nitrogen (N) concentrations. These patterns likely reflect strategies developed as an adaptation to reduced water availability, but they also result from variation in the availability of nutrients in soil across our sites. In the case of N, there are indications that atmospheric deposition plays a role in foliar concentrations.
Introduction
Temperature and precipitation are major factors that determine both the occurrence and growth of plant species in forests (Hansen et al., 2001; Morecroft and Paterson, 2006). These two factors have changed and are expected to change further as the global climate warms in response to increased greenhouse gas emissions (IPCC, 2014). The higher temperatures and reduced summer precipitation expected for Europe (Rowell and Jones, 2006; Christensen et al., 2007; Jacob et al., 2014; Stanturf, 2015) are likely to result in drier soils over longer periods (Bell et al., 2010; Karmakar et al., 2016). In forest ecosystems, productivity is expected to be altered, either directly through reduced water availability (Gholz et al., 1990) or through changes in soil biological activity and its effects on nutrient availability (Kreuzwieser and Gessler, 2010).
As the active interface between the forest ecosystem and the atmosphere, leaves play a major role in the carbon, nutrient and water cycle of forests (Jarvis and Leverenz, 1983). The response of leaf functional traits to varying environmental conditions (e.g., light and nutrient availability) is part of the strategies that enable plant species to occupy different environmental niches (Poorter et al., 2009; Wang et al., 2017). Major functional traits include leaf size, which determines water use efficiency and the amount of light intercepted for photosynthesis (Xu et al., 2009; Whitman and Aarssen, 2010; Zhang et al., 2016), and specific leaf area (SLA), the ratio between leaf area and leaf dry mass (Poorter et al., 2009). SLA has been shown to correlate positively with the relative growth rate of plants (Poorter and Remkes, 1990; Cornelissen et al., 1996). It reflects the potential rate of return on investment in a leaf for intercepting light, as SLA increases with decreasing dry matter allocation to leaf tissue for a given leaf area (Cunningham et al., 1999). SLA (or its inverse value, the leaf mass per area LMA) has been shown to vary across annual temperature and precipitation gradients (Wright et al., 2004; Poorter et al., 2009). For example, as a means of reducing water loss, the leaves of species growing in dry environments are often smaller and thicker than those of species growing under wetter conditions, resulting in a lower SLA.
Reduced water availability or dry conditions can impact other leaf traits such as chemistry. Foliar nutrient concentrations can be particularly affected by reduced soil water availability during drought periods through impaired soil-borne uptake of essential nutrients such as nitrogen (Cunningham et al., 1999; Gessler et al., 2004; Villar-Salvador et al., 2015). Finally, environmental factors such as temperature and rainfall can affect the phenolic compounds in leaves (Monteiro et al., 2006). In particular, drought can result in cell wall tightening through the cross-linking of phenolics and lignin monomers to wall polymers, which improves water transport and the mechanical support of aerial structures (Moore et al., 2008; Cabane et al., 2012).
In Switzerland, near-surface air temperature rose by about 2.0°C (compared to 0.9°C globally) between 1864 and 2017, with the largest increase occurring after 1980 (CH2018, 2018). Heatwaves have also become more frequent, and the frequency of summer droughts is expected to increase (CH2018, 2018). European beech (Fagus sylvatica L.) is one of the most abundant broadleaved tree species in Switzerland and elsewhere in Europe, and it plays an important economic and ecological role in sustainable forest management (Hlásny et al., 2014). Owing to its sensitivity to drought (van der Maaten, 2012), beech may be negatively affected in its physiological performance, growth and competitive ability under drier conditions (Peuke et al., 2002).
The goal of this study was to assess the response of foliage properties (nutrient concentrations, morphological traits) of beech trees to changes in water availability and soil properties in 12 forest stands distributed along a precipitation gradient across the main regions of Switzerland. For this purpose, we sampled beech leaves in summer 2017 and assessed how leaf traits were related to stand and environmental factors. We hypothesized that (1) morphological parameters such as leaf size and SLA increase with increasing water availability, while biochemical parameters such as the phenol and lignin concentrations are higher under low availability; and (2) the nutrient status of beech leaves is less favorable at sites with lower water availability. Testing these hypotheses will improve our knowledge of how environmental factors influence plant ecological strategies. This gradient study should further shed light on the extent to which beech trees have adapted to conditions of low water availability, and thus how likely they are to adapt to future climate conditions.
Materials and Methods
Site Description
Foliage, soil and climatic data were collected from 12 forest sites located in the main geographical regions of Switzerland (Figure 1 and Table 1). Eight of the sites are part of the Swiss Long-term Forest Ecosystem Research programme (LWF, Schaub et al., 2011) and of the pan-European Level II plot network of ICP Forests1. The elevation of the study sites ranged from 470 (Vordemwald) to 1210 m a.s.l. (Isone). Except at Vordemwald, beech was either the main tree species or one of the main tree species at the study sites.
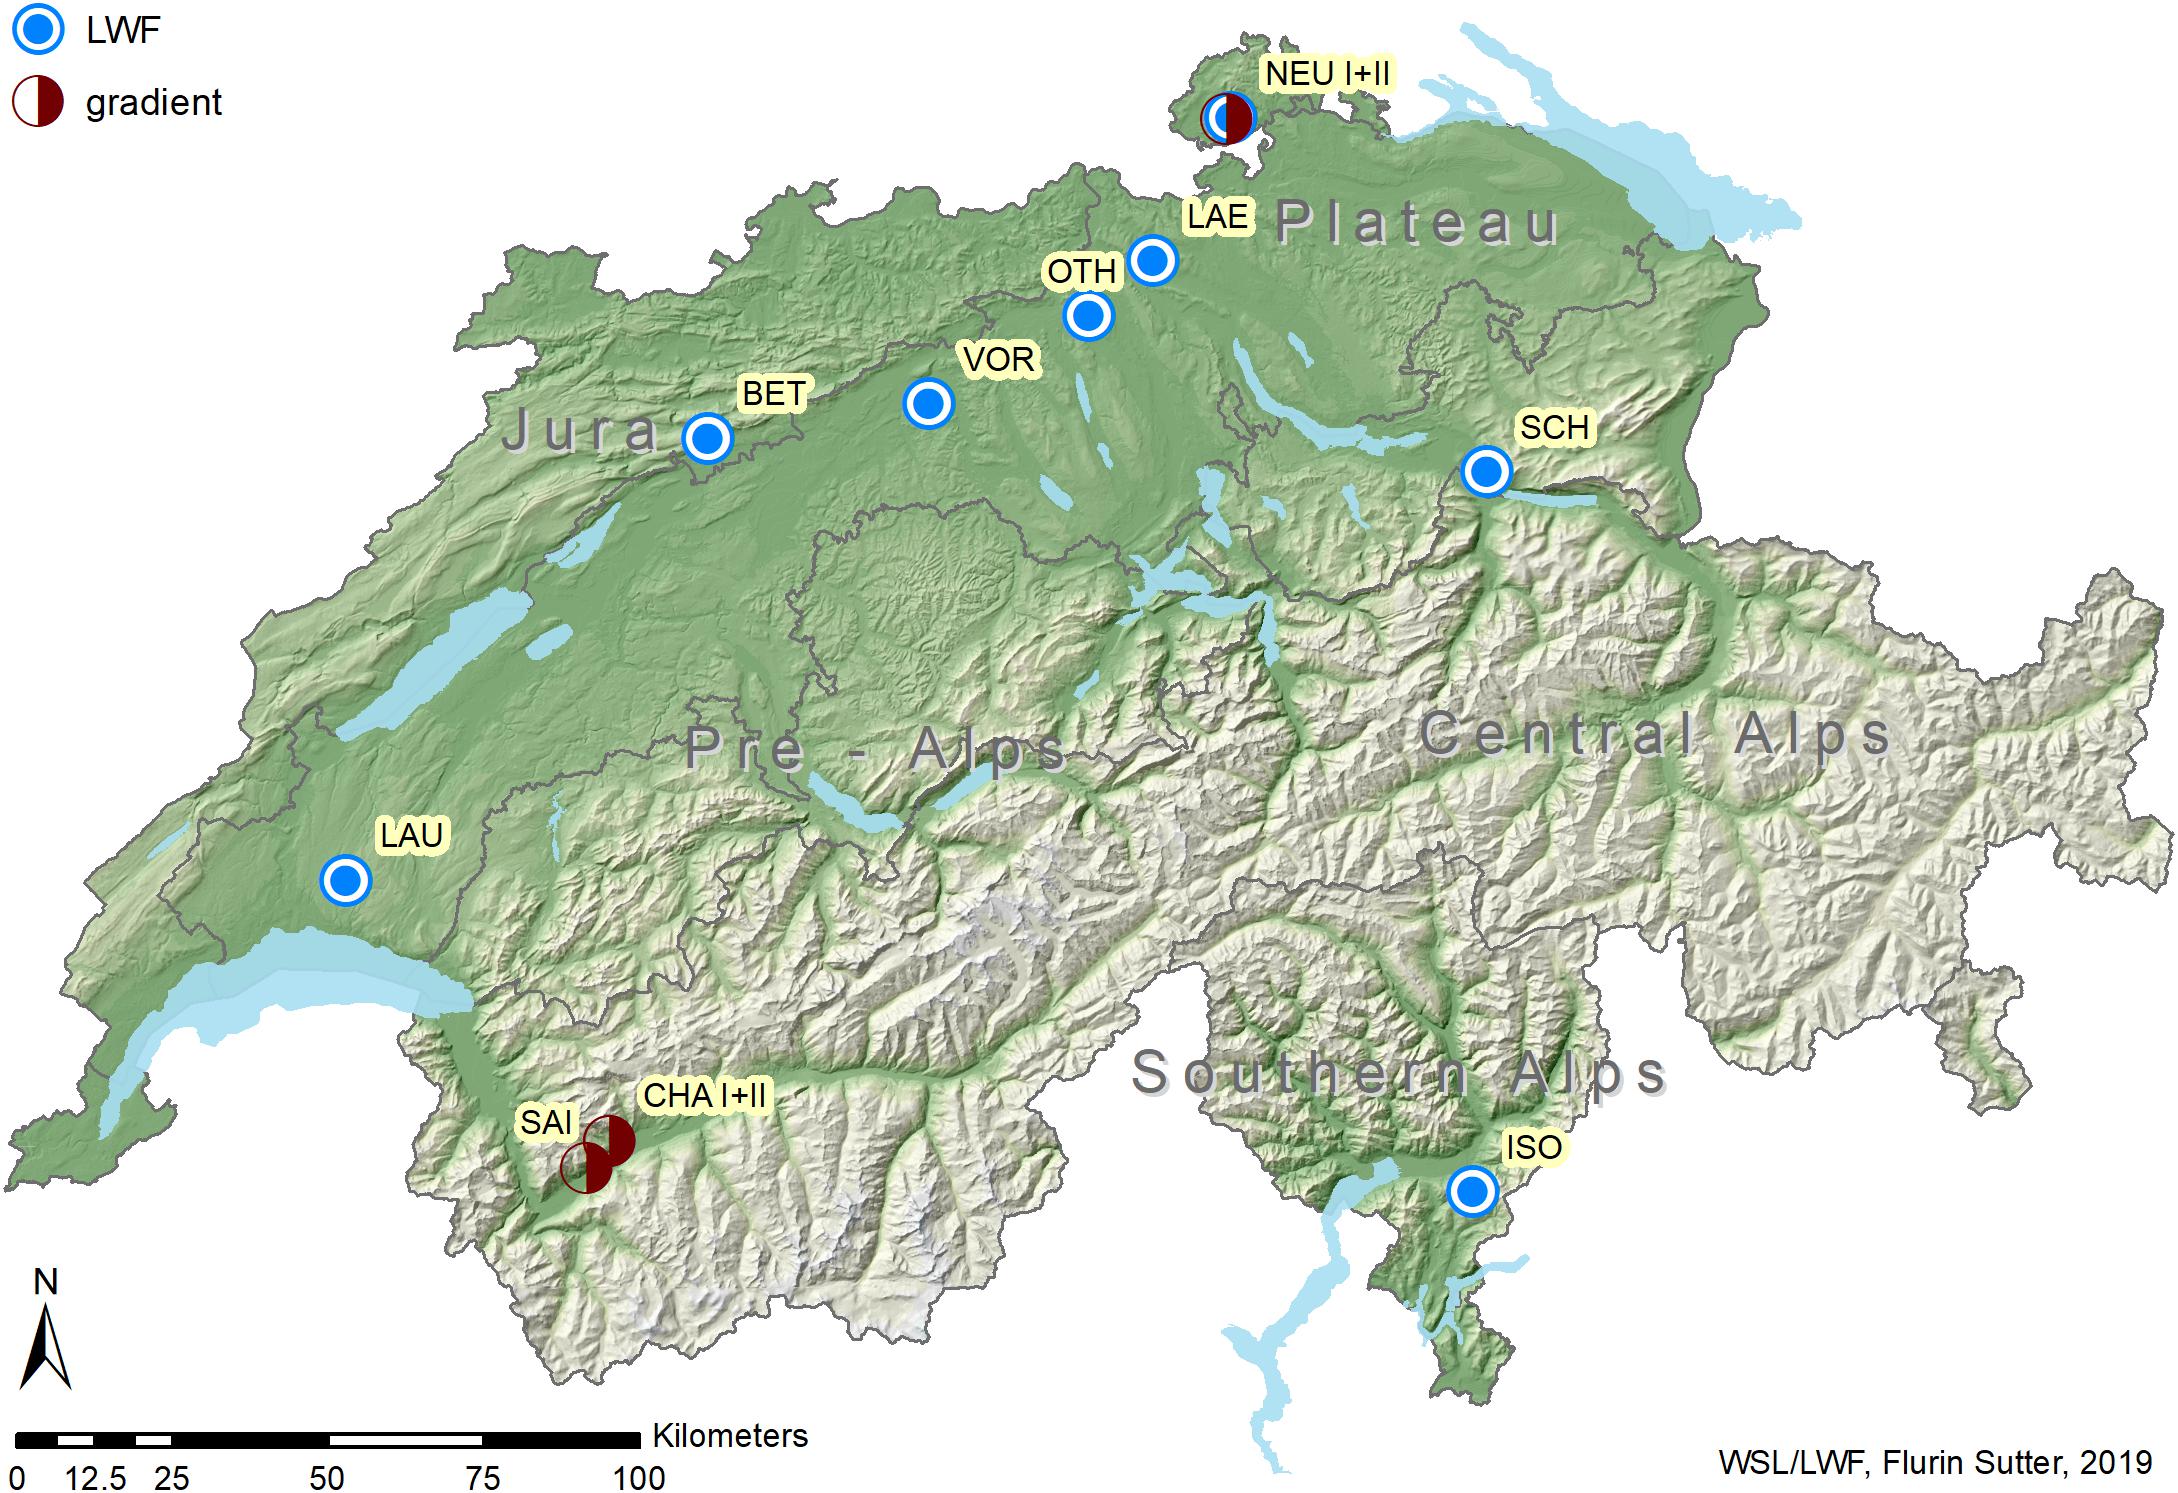
Figure 1. Locations of the 12 study sites distributed across Switzerland. Source for production regions: Swiss Federal Institute for Forest, Snow and Landscape Research (WSL)/Swiss Federal Office for the Environment (FOEN), Swiss National Forest Inventory (NFI).
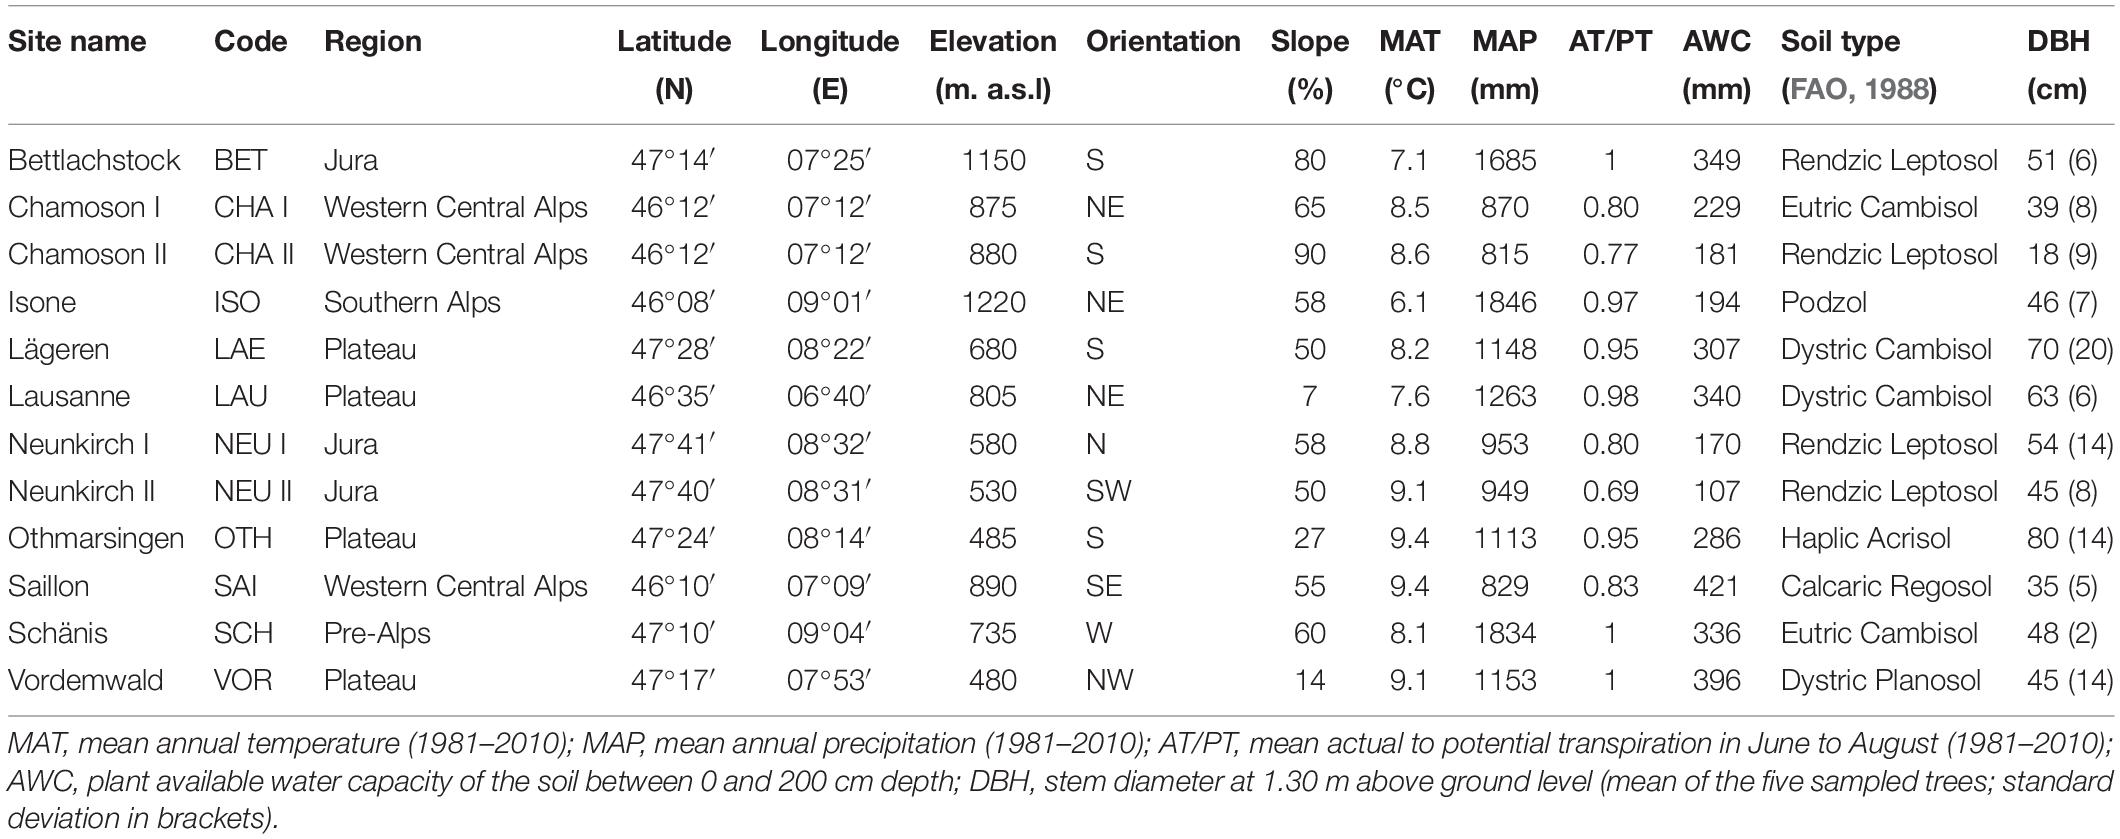
Table 1. Site and tree characteristics of the 12 pure or mixed stands of European beech (Fagus sylvatica L.).
Foliage Data
Sampling in the Field
Five beech trees belonging to the dominant or predominant classes were selected on each plot. One to two sun-exposed branches per tree were cut from the upper third of the crown in mid-August 2017, before the onset of autumnal yellowing (Thimonier et al., 2010; Rautio et al., 2016). The cut branches were transported to the WSL and stored at 2°C until further processing.
Processing in the Laboratory
For each sample tree, 100 leaves were clipped from the branches, put in paper bags, and stored again at 2°C. Subsamples of 30 leaves per tree were weighed then scanned by transparency with a 200 dpi resolution, using a flatbed scanner (Epson Perfection V800, Seiko Epson Corporation, Japan). The acquired images were automatically processed by the software WinSeedle (winSeedle 2006, Régent Instruments, Quebec, QC, Canada) to obtain the area, length and width of individual leaves. The leaves were not rehydrated before scanning, and it is possible that they shrank slightly during processing and storage. However, as all samples were handled in the same way, comparability of the obtained values was ensured.
Immediately after scanning, all 100 leaves were weighed. The dry mass of 100 leaves was then determined after drying at 65°C until a constant weight was reached. SLA was calculated as the leaf area of the 30 scanned leaves divided by their dry mass. As we did not dry separately the 30 leaves that had been scanned, their dry mass was estimated by taking the proportion of dry matter in all 100 leaves and applying it to the mass of 30 leaves as determined just before scanning. A subsample of ca. 4 g of whole leaves (dried at 65°C) was ground with a mixer mill (MM400, Retsch GmbH, Haan, Germany) for chemical analysis.
Chemical Analysis
A CN element analyzer (NA 2500, CE Instruments, Wigan, United Kingdom) was used to analyze total carbon (C) and total nitrogen (N). Concentrations of the macronutrients sulfur (S), phosphorus (P), potassium (K), calcium (Ca) and magnesium (Mg), and the microelements aluminum (Al), boron (B), copper (Cu), iron (Fe), manganese (Mn), nickel (Ni), zinc (Zn) and barium (Ba) were determined by microwave digestion with 5 M nitric acid (HNO3) and 0.5 M fluoric acid (HF), followed by analysis with ICP-AES (Optima 3000, Perkin-Elmer, Waltham, Massachusetts, United States). All samples were analyzed in duplicate with accredited methods (ISO 17025) by the WSL laboratory, which regularly participates in international ring tests (e.g., Fürst, 2018). The carbon (δ13C) and nitrogen (δ15N) isotope ratios were measured simultaneously during a combustion process with additional oxygen in an elemental analyzer (EA3000, EuroVector, Milano, Italy) connected to an isotope mass spectrometer (Delta V, Thermo Fisher, Bremen, Germany).
Water extractables were determined by extracting 1 g of milled sample three times with 25 ml of hot (85 ± 5°C) water and once with water at room temperature. Extraction times were 15 min at each step. Phenolic compounds in the water extracts were determined by the Folin-Denis colorimetric method (Swain and Hillis, 1959). Klason lignin was determined by hydrolyzing 0.3 g of pre-extracted (hot water and ethanol) sample with 3 ml of 72% sulfuric acid (1 h at 30°C) and, after addition of 48 ml H2O, autoclaving for 1 h at 121°C. Soluble lignin was determined by UV absorption (205 nm) of the hydrolyzate (Dence, 1992). Total lignin was calculated as the sum of Klason lignin and soluble lignin (Heim and Frey, 2004).
Environmental Data
Climatic Data
Mean annual temperature (MAT) and precipitation sum (MAP) for the period 1981–2010 were derived specifically for the coordinates of each site, by interpolating weather data from the meteorological network of MeteoSwiss. These data were provided by Remund et al. (2014) (Table 1).
To compare the meteorological conditions of 2016 and 2017 with the long-term climatic conditions at the 12 study sites (see “Water availability gradient”), data from the following MeteoSwiss grid-data products were used: interpolated fields of monthly mean temperatures (TabsM), of monthly and annual precipitation sums (RhiresM and RhiresY), of monthly mean temperatures for the norm period of 1981–2010 (TnormM8110), and of mean monthly and annual precipitation sums for the norm period of 1981–2010 (RnormM8110 and RnormY8110). MeteoSwiss calculated these grid data products over the area of Switzerland by interpolating high resolution meteorological station data to a geographical grid (longitude, latitude) with a spacing of ca. 2.2 km. Details about the interpolation methods and the accuracy of the products can be found in MeteoSwiss (2016a, b). For this study the data from the grid points closest to the 12 sites were extracted. The spatial resolution of these climatic data is coarser than that of the site-specific MAP and MAT values provided by Remund et al. (2014), and there are occasionally some substantial differences between the two sources of data. However, deviations of single years from the long-term means are expected to be in the same range.
Soil Data
Soils were described morphologically from soil pits dug down to an average depth of 2.1 m. Criteria such as color, structure, volumetric stone content and the occurrence of redoximorphic features were used to differentiate between pedogenetic horizons (Walthert et al., 2004). For chemical analyses, an average of eight soil samples per soil profile was taken at various depths depending on the depths of the horizons. Organic horizons were also sampled in cases where a forest floor was present. Additionally, to determine the density of the soil, volumetric samples were collected at selected soil depths using steel cylinders 1000 cm3 in volume. In stony soils, soil samples were excavated and the hole volume was determined by refilling it with quartz sand. Soil samples for chemical analyses were dried at 40–60°C until reaching a constant weight and sieved to 2 mm. An aliquot of each sample was ground for 3 min using a vibrating ball mill (MM2000, Retsch GmbH, Haan, Germany) with zircon-grinding tools. The volumetric samples for the determination of soil density were dried at 105°C for 48 h.
Plant available water (AWC), i.e., the amount of water between field capacity and permanent wilting point, was calculated according to Teepe et al. (2003) to a depth of 200 cm considering soil texture, soil density, humus and stone contents. The water balance was modeled in daily time steps for the period 1981–2010 to estimate the drought index AT/PT, i.e., the ratio of actual to potential transpiration, with lower AT/PT values indicating more severe water shortage (maximum value = 1). In our study, the drought index AT/PT represents an average long-term yearly summer drought, as it was calculated by dividing the sum of all daily values of AT by the sum of all daily values of PT from June to August 1981–2010. The water balance was modeled with the Coup Model (Jansson and Karlberg, 2011), a coupled heat and mass transfer model for soil–plant–atmosphere systems, after calibrating the model with data from LWF plots. Model performance, as assessed by means of goodness of fit (PBIAS and wR2) between modeled and measured soil water potential time series was judged to be satisfactory (Walthert et al., 2015; for more details see Walthert and Meier, 2017).
Total P (Ptot) and organic P (Porg) were analyzed (in triplicate) using the ignition method of Saunders and Williams (1955). A fraction of each soil sample was ignited at 550°C. The ignited residue and an equivalent fraction of unignited soil were then extracted with 0.5 M H2SO4. The extracted orthophosphates from the ignited and unignited soil samples, corresponding to Ptot and inorganic P (Pinorg), respectively, were quantified by colorimetry. The organic fraction Porg was calculated as the difference between Ptot and Pinorg.
Total carbon (Ctot) and total nitrogen (Ntot) were determined with a CN analyzer NC 2500 (CE Instruments, Italy). The content of organic carbon (Corg) of samples with a pH (CaCl2) < 6.0 was assumed to be equal to the content of Ctot. Samples with a pH > 6.0 were assumed to potentially contain carbonates and were thus fumigated with HCl vapor prior to the CN analysis (Walthert et al., 2010).
Exchangeable cations were extracted (in triplicate) from the 2-mm-sieved soil in an unbuffered solution of 1 M NH4Cl. The element concentrations in the extracts were determined by ICP-OES (Optima 3000, Perkin–Elmer, Waltham, Massachusetts, United States). In samples with a pH (CaCl2) < 6.5, the contents of exchangeable protons were calculated as the difference between the total and the Al-induced exchangeable acidity, as determined by the KCl method (Thomas, 1982). In samples with a higher pH, the contents of exchangeable protons were assumed to be negligible. The effective cation-exchange capacity (CEC) was obtained by summing the charge equivalents of exchangeable Na, K, Mg, Ca, Mn, Al, Fe and H. The base saturation (BS) was calculated as the ratio of the sum of exchangeable Na, K, Mg and Ca to the CEC.
Pools (molc ha–1) and mean contents (mmolc kg–1) of elements were calculated for different depths (0–10, 0–20, 0–40 and 0–80 cm, including organic layers when present) by considering the amount of fine earth in the involved pedogenetic horizons. In a preliminary analysis, we tested all depths for both the pools and mean contents of elements in order to determine which variant provided the best correlations between foliage nutrient concentrations and soil data. However, none of the variants clearly out-performed the others. Therefore, we used only the element contents from 0–80 cm depth in the further analyses, except in the cases of Porg, Pinorg, Ptot, Corg, Ntot and C/N, for which we used values from 0–10 cm depth, where the organic carbon content and biological activity are highest.
Further Data
Further environmental data used in our analysis included information on the trees and the stand structure, the indicator value of ground vegetation with respect to site conditions, and atmospheric deposition of nitrogen.
The tree stem circumference at 1.30 m above ground level (Table 1) was measured with a measuring tape on the day of foliage sampling. The age of the stand was determined by taking increment cores from a few dominant trees in the buffer zone of the sites. The leaf area index (LAI) of the stands was obtained using a regression model developed by Schleppi et al. (2011), using tree height and the coverage of the herb, shrub and tree layers assessed during vegetation surveys (Thimonier et al., 2011) as predictors.
Synthetic indices of the ecological conditions at the sites, based on these same vegetation surveys (Thimonier et al., 2011), were calculated by averaging the Landolt indicator values (Landolt, 1977) of all species recorded in the herb layer. Landolt’s values indicate the ecological range of species of the Swiss flora along gradients of soil nutrient (mostly nitrogen) availability (N), soil pH (R), soil moisture (F), light (L), and temperature (T) using an ordinal five-point scale (1 to 5; Table 2). Hereafter the ecological values per site are presented with Landolt in subscript.
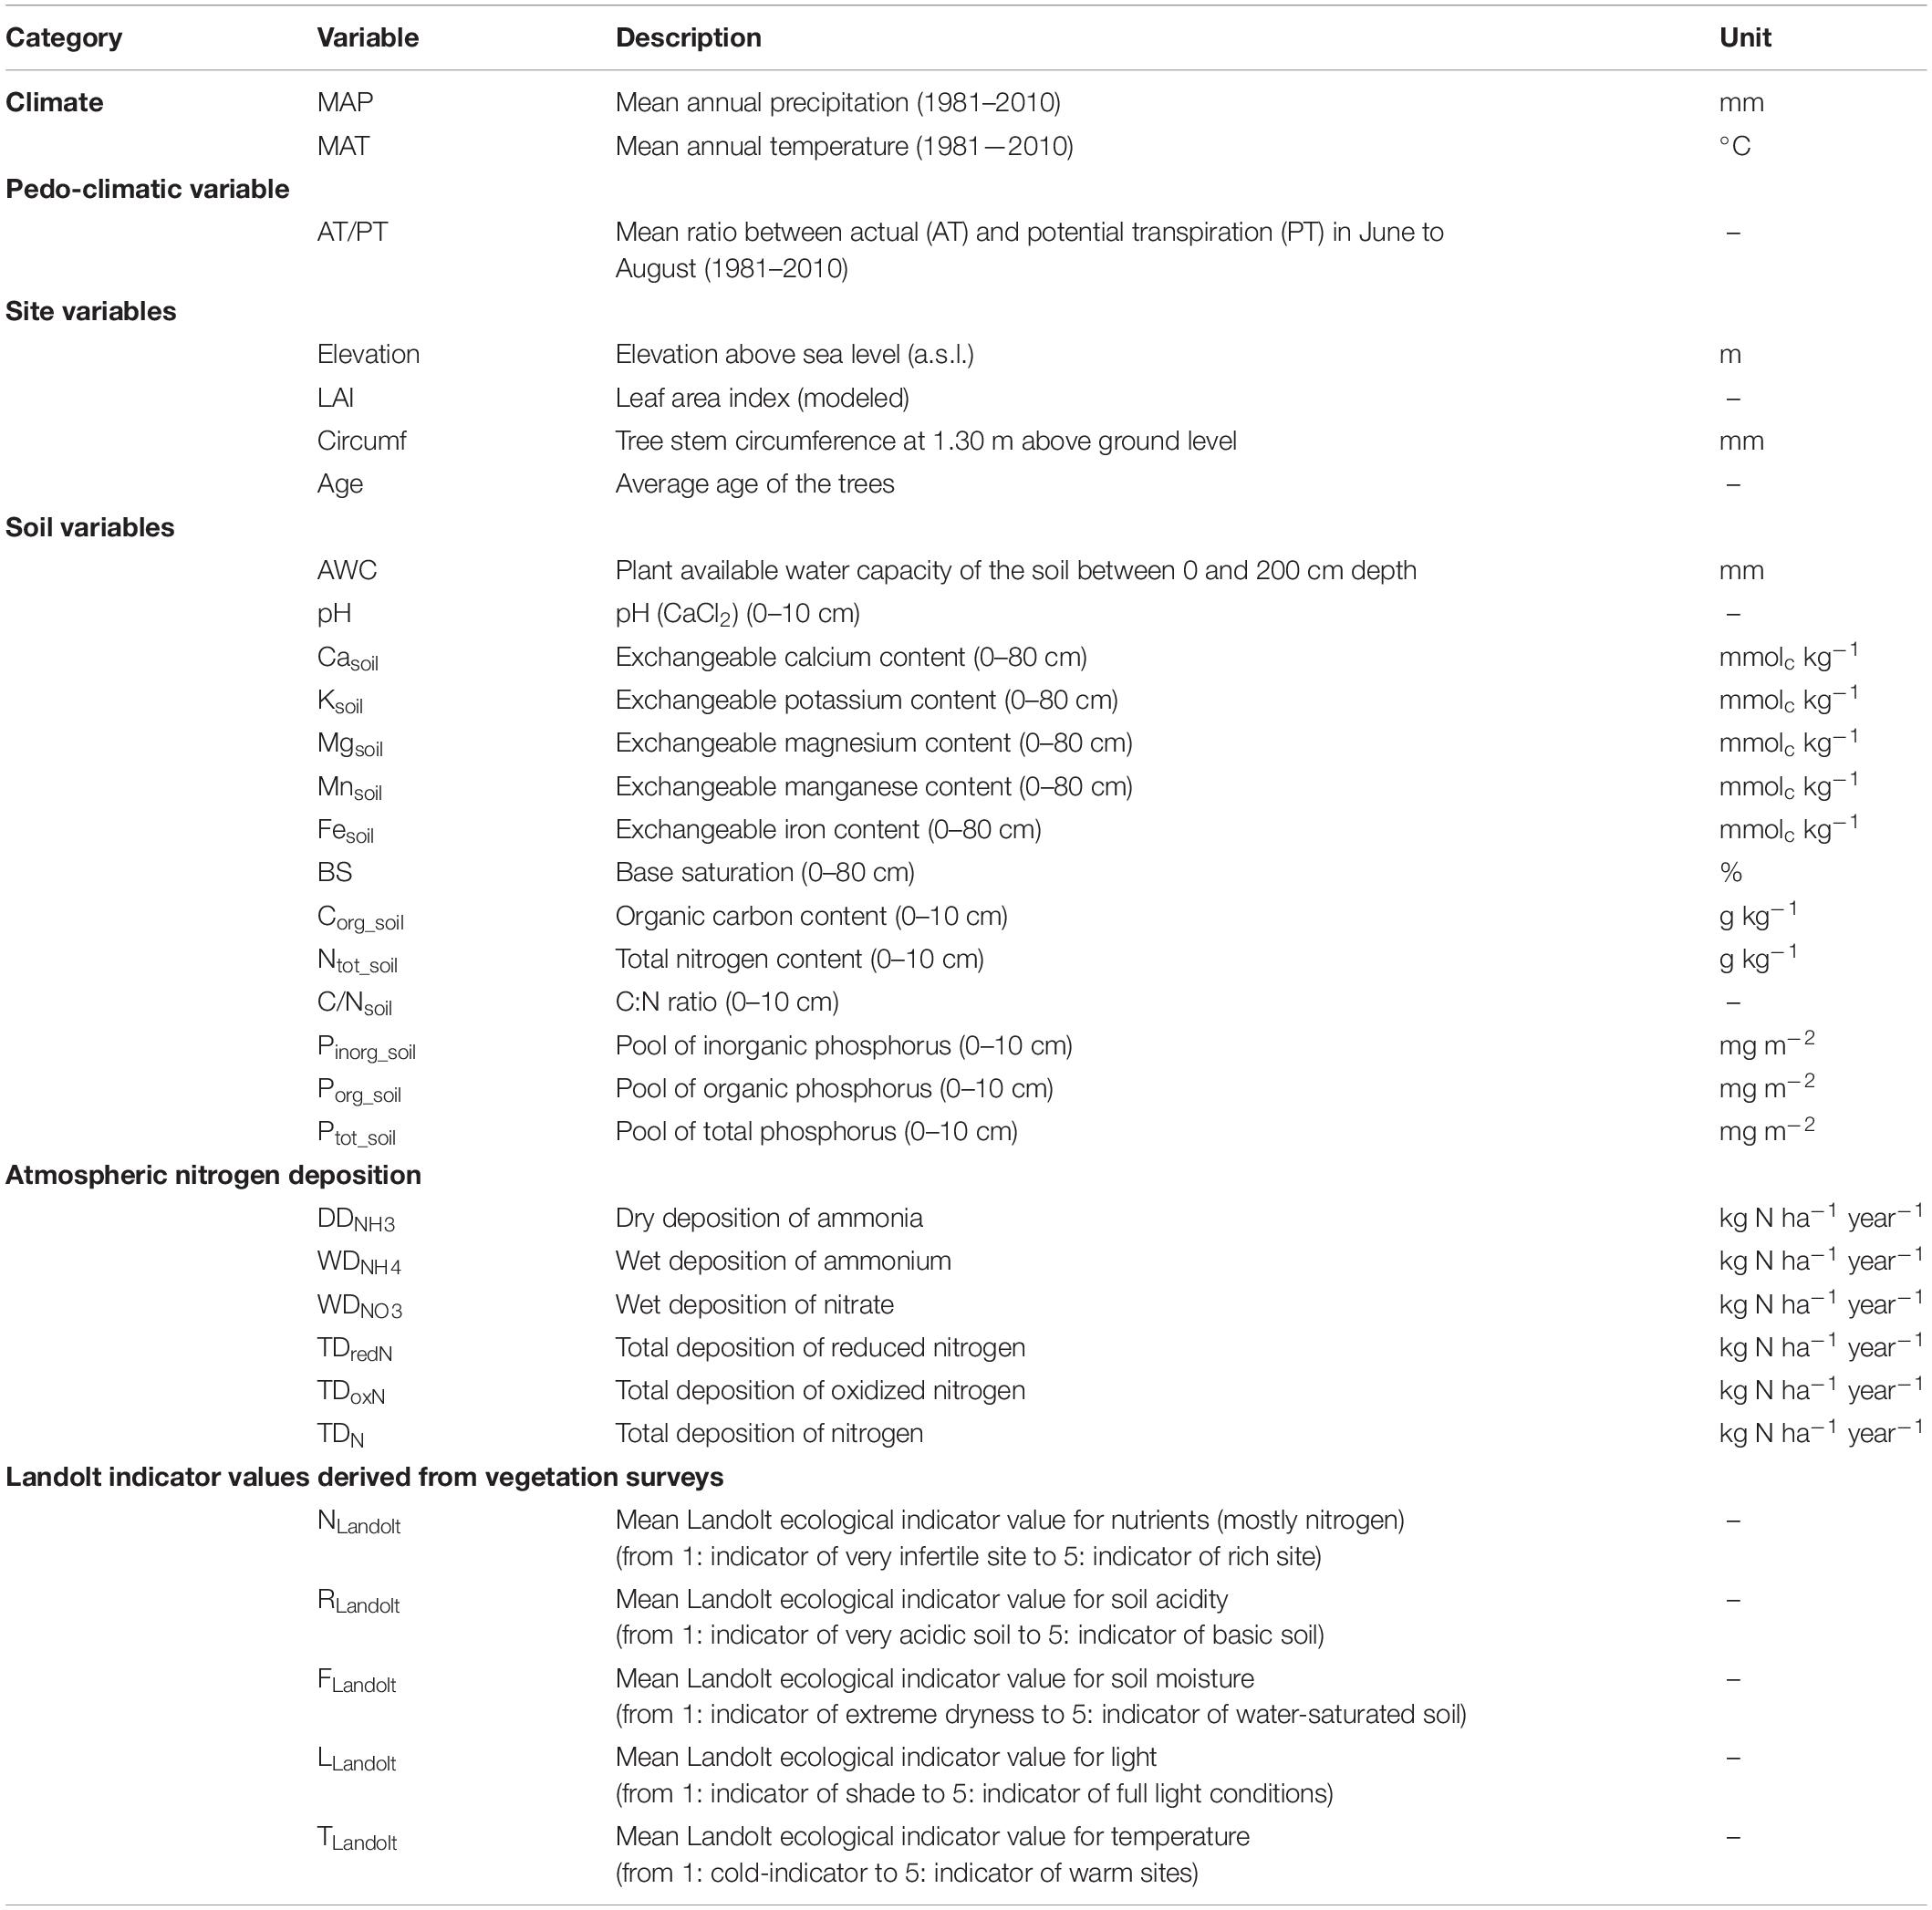
Table 2. List of environmental variables used in this study.
The annual atmospheric deposition of the reduced and oxidized forms of nitrogen (N) was modeled for the coordinates of each site using the emission based model developed for Switzerland at a high spatial resolution (1 × 1 km2 grid or finer), run for the period 2013–2017 (Rihm and Achermann, 2016). Both the wet deposition pathway (input via rain, snow or hail) and the dry deposition pathway (deposition of gases and aerosols) were quantified. As variables in our analysis, we selected wet deposition (WD) of ammonium (NH4+) and nitrate (NO3–) and dry deposition (DD) of ammonia (NH3), as single factors and in combination, and the total deposition of N (TD). Table 2 provides an overview of the environmental variables used in this study.
Water Availability Gradient
The water availability gradient was built by ordering the 12 sites either according to the purely climatic factor MAP (1981–2010) or according to the pedo-climatic drought index AT/PT (ratio of actual transpiration (AT) to potential transpiration (PT) in June to August 1981–2010) (Table 1). The precipitation gradient was related to the temperature gradient, with a negative correlation emerging between MAP and MAT (Spearman r = −0.69, p < 0.05; Supplementary Figure 1A and Supplementary Table 1). Furthermore, the AT/PT ratio and MAP were positively and significantly correlated (r = 0.83, p < 0.001; Supplementary Figure 1B).
Our water availability gradient is based on long-term climatic or pedo-climatic averages, but foliage was sampled during a particular year only, and foliage traits are likely to be affected by weather conditions in the current year (2017) or the year preceding leaf formation (2016). We therefore evaluated how these 2 years compared with long-term means.
The year 2017 was generally drier, while 2016 was generally wetter than average at our sites (Supplementary Figure 2A). Because there were no marked regional differences in precipitation patterns, the water availability gradient was maintained, i.e., the precipitation distribution across sites in 2017 reflected fairly well the long-term water availability gradient. The year 2017 was not only drier but also markedly warmer (by 0.8 ± 0.2°C) than average at all sites, notably during the March-August period (Supplementary Figure 2B). The year 2016 showed no particular deviations for temperature, but it should be noted that the temperature at the warm and dry sites in Valais (CHA I, CHA II, SAI), was higher by ca. 1°C in 2016 compared to the average.
Data Analysis
We calculated the site averages of leaf nutrient concentrations and leaf morphological traits and used Spearman correlation analyses in SPSS (version 25) to quantify how foliar variables were related to each other and with environmental factors. Foliar nutrient concentrations and ratios were compared to the available reference values indicating the adequate to optimal range of nutrition for beech (Mellert and Göttlein, 2012). We calculated linear regressions between variables by applying a robust regression method (ROBUSTREG procedure in SAS 9.4; SAS Institute Inc., Cary, NC, United States). This method makes the estimation of the slope and intercept less sensitive to extreme values (e.g., Gonsamo et al., 2018).
We further conducted a principal component analysis (PCA) of the data set with individual values for each tree using the ade4 (Dray and Dufour, 2007) package in R version 3.5.1 (R Core Team, 2015) to extract orthogonal multivariate axes of leaf variables. The PCA was run using 13 variables including all macronutrients, leaf area, SLA and isotopes ratios. Microelements were included as supplementary variables only. We then overlaid the environmental factors (climatic data, elevation, N deposition, Landolt values and soil chemical parameters), also as supplementary variables, on the correlation plots. Further, we built linear regression models using the GLM procedure in SAS 9.4 to explore the influence of the environmental variables on selected leaf traits, by introducing manually (stepwise) up to three explanatory variables out of those listed in Table 2.
Results
Description of Leaf Traits and Relationships Between Foliar Variables
At the plot level, the dry mass of 100 leaves ranged from 9.9 g (in ISO) to 15.7 g (in CHA I; Table 3; see Table 1 for site abbreviations) and was, as expected, positively correlated with the average leaf area (r = 0.64, p < 0.05; see Supplementary Table 2 for all correlations). Leaf area was lowest in ISO (10.8 cm2 per leaf) and highest in NEU II (19.1 cm2 per leaf), and correlated positively with foliar Ca (r = 0.74, p < 0.01) and Mg (r = 0.59, p < 0.05) concentrations. SLA varied from 102 cm2 g–1 (in SAI) to 141 cm2 g–1 (in LAU), and increased with increasing N (r = 0.65, p < 0.05) and B (r = 0.62, p < 0.05) concentrations in foliage. It was negatively correlated with the foliar C/N ratio (r = −0.78, p < 0.01).
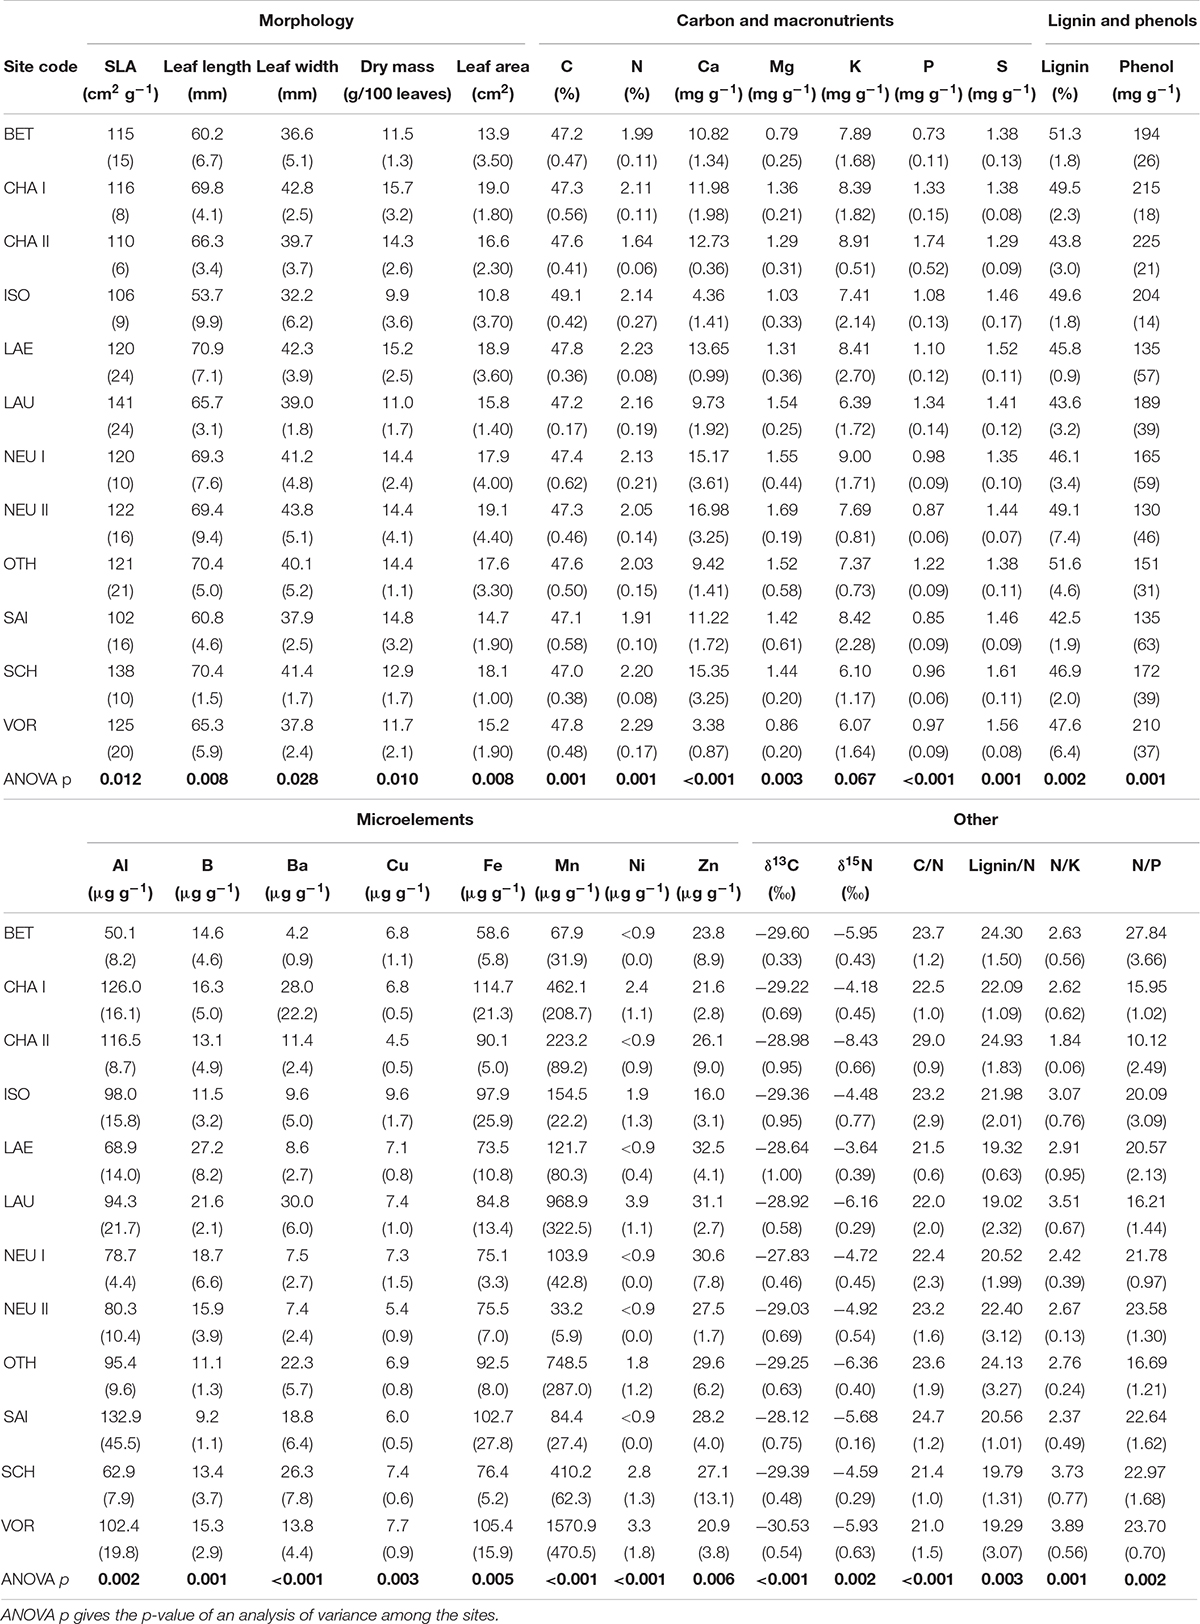
Table 3. Leaf morphological and nutritional characteristics (average of five trees and standard deviation in brackets) at the 12 sites.
Foliar N concentrations (Nfol) ranged from 16.4 mg g–1 (in CHA II) to 22.9 mg g–1 (in VOR). The comparison of Nfol with the reference value range for adequate to optimal nutrition (18.7–23.2, Mellert and Göttlein, 2012) suggests that N is not limiting at our sites except in CHA II. Foliar N concentrations were positively correlated with foliar S (r = 0.64, p < 0.05), Cu (r = 0.80, p < 0.01) and Ni (r = 0.66, p < 0.05) concentrations.
Foliar P concentrations (Pfol) ranged from 0.73 mg g–1 (in BET) to 1.74 mg g–1 (in CHA II). Pfol was lower than the lower bound of the range for adequate to optimum nutrition (1.2 – 1.9, Mellert and Göttlein, 2012) at the majority of our sites, indicating that P is a limiting factor. The foliar N/P ratio was higher than the optimum range at all sites except LAU, OTH, CHA I and CHA II. At CHA II, Pfol was particularly high, Nfol low, and N/Pfol the lowest of all sites. Foliar Mg (Mgfol) varied from 0.79 mg g–1 (in BET) to 1.69 mg g–1 (in NEU II), and was below the range for optimum nutrition (1.1 – 2.3, Mellert and Göttlein, 2012) at BET, VOR and ISO. VOR and ISO were also the sites with the lowest foliar Ca concentrations (Cafol < 5 mg g–1, i.e., below the lower bound of the range for optimum nutrition of 6.7–14 mg g–1 according to Mellert and Göttlein, 2012). In contrast, Cafol was above the upper threshold at SCH, NEU I and NEU II. Foliar K concentrations (Kfol) ranged from 6.1 mg g–1 (in VOR and SCH) to 9.0 mg g–1 (in NEU I) and were mostly in the optimum nutrition range (6.1–9.7 mg g–1, Mellert and Göttlein, 2012), as was the N/K ratio. Foliar Al and Fe concentrations were closely related to each other (r = 0.89, p < 0.001) and were particularly high at the three sites in Valais (SAI, CHA I and CHA II).
The phenol and lignin concentrations varied considerably, from 130–225 mg g–1 phenol and 42.5–51.6% lignin (Table 3). The lignin content was negatively correlated with δ13C (r = −0.68, p < 0.05). Foliar δ13C ranged from −30.5‰ (VOR) to −27.8‰ (NEU I) and correlated positively with Kfol (r = 0.72, p < 0.01) and the foliar Zn concentration Znfol (r = 0.73, p < 0.01). Foliar δ15N ranged from −8.4‰ (CHA II) to −3.6‰ (LAE) and was weakly positively correlated with Nfol (r = 0.50, p < 0.10).
The PCA synthesized the correlations between variables fairly well and determined the leaf variables that differentiated the sites most clearly (Figure 2). The first two components of the PCA (Dim1 and Dim2) explained a major part of the leaf variables’ variance in our data set (41.7%). Together with the following two components, 63.5% of the total variance was explained. Dim1 was related to Cafol, Mgfol and leaf area, and it separated ISO and VOR, two sites on acidic soils with low Cafol, from the other sites. Dim2 was related to the N status of the leaves (Nfol, δ15N) and to Sfol, and mostly discriminated the CHA II site from the others.
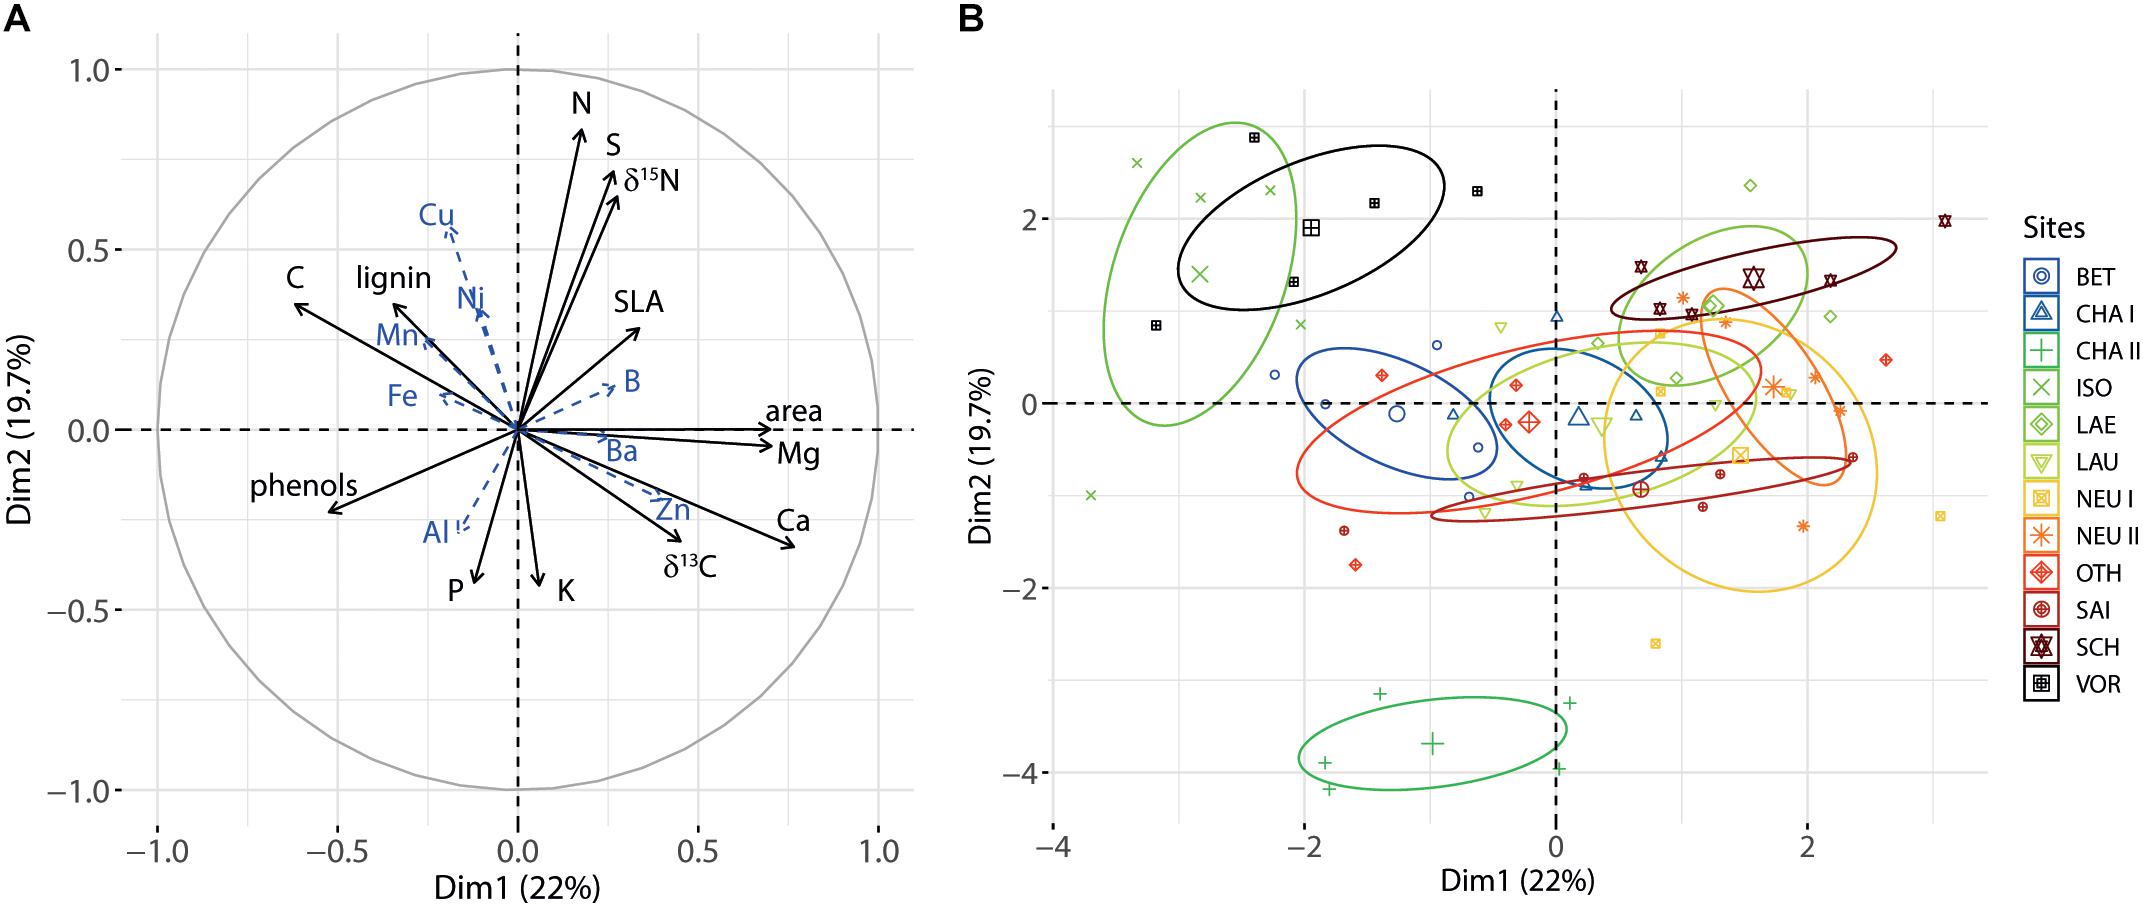
Figure 2. (A) Correlation plot of the PCA for axes 1 and 2 for foliar variables. Microelements were treated as supplementary variables and are shown in blue with dashed arrows. (B) Distribution of the individual trees, grouped by site, along axes 1 and 2.
Relationships Between Leaf Traits and Environmental Variables
Leaf Morphological Traits
The dry mass of 100 leaves was negatively correlated with MAP (r = −0.70, p < 0.05; Figure 3A; see also Supplementary Table 3 for all correlations) and AT/PT (r = −0.59, p < 0.05; Figure 3B). It tended to increase from low to high MAT (r = 0.55, p < 0.10; Figure 3C). The average leaf area was not correlated with MAP (r = −0.38, n.s.) or MAT (r = 0.27, n.s.) but tended to decrease with increasing AT/PT (r = −0.52, p < 0.10; Figure 3D) and increasing elevation (r = −0.53, p < 0.10; Figure 3E). Likewise, leaf width tended to negatively correlate with AT/PT (r = −0.56, p < 0.10) and leaf length tended to decrease with increasing elevation (r = −0.59, p < 0.05). SLA showed no significant correlation with MAP (r = 0.34, n.s.), AT/PT (r = 0.34, n.s.) or MAT (r = 0.01, n.s.). However, SLA decreased significantly with increasing elevation (r = −0.70, p < 0.05; Figure 3F).
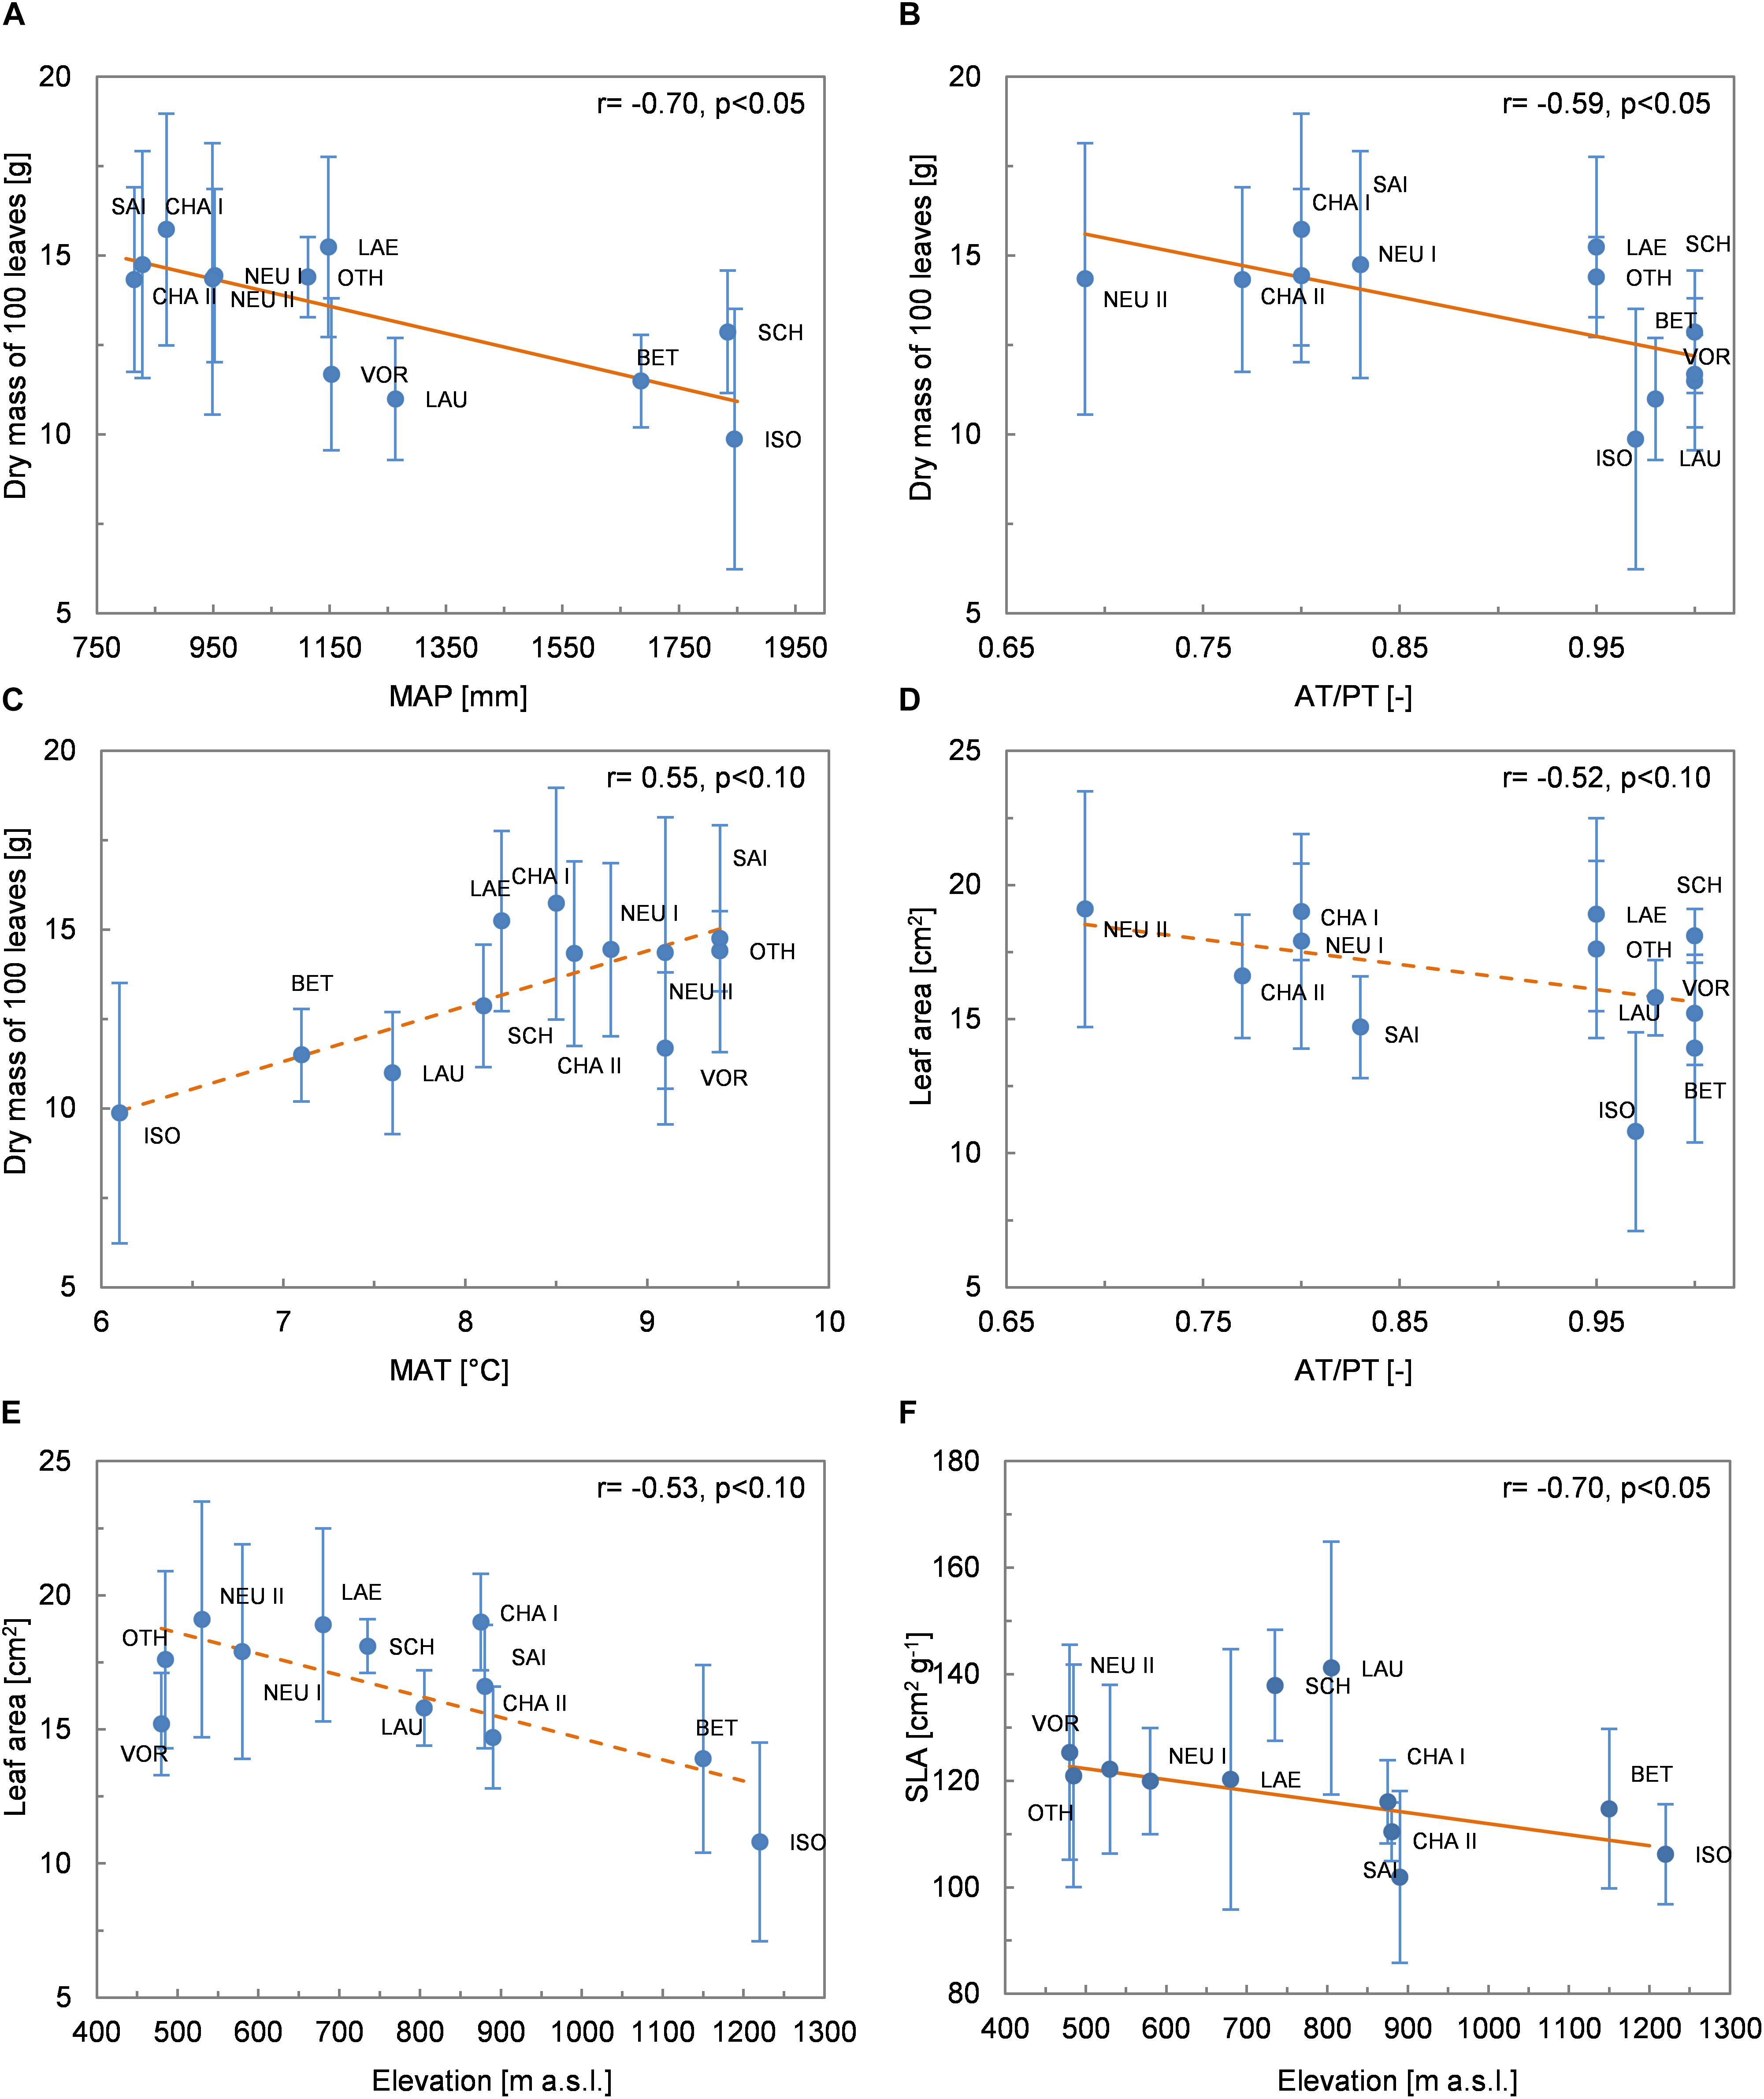
Figure 3. Relationships between leaf morphological traits (mean values per site ± 1 standard deviation) and environmental variables. (A) Leaf dry mass and MAP; (B) leaf dry mass and AT/PT; (C) leaf dry mass and MAT; (D) leaf area and AT/PT; (E) leaf area and elevation; (F) SLA and elevation. The Spearman coefficient of correlation and the regression line (solid line: p < 0.05, dashed line: p < 0.10) derived from robust regression are shown.
Leaf Carbon and Nutrients
Foliar C concentrations showed no correlation with climatic variables (Supplementary Table 3). Nfol was positively correlated with MAP (r = 0.59, p < 0.05; Figure 4A) and also tended to increase with increasing AT/PT (r = 0.52, p < 0.10). It showed no significant relationship with established indicators of N availability for the vegetation, such as the C/N ratio of the topsoil (r = −0.34, n.s) or the vegetation-based indicator value NLandolt (r = 0.23, n.s). Nfol was, however, negatively correlated with soil pH (r = −0.63, p < 0.05; Figure 4B) and the indicator value LLandolt for light (r = −0.69, p < 0.05; Figure 4C), and positively correlated with the indicator value FLandolt for soil humidity (r = 0.77, p < 0.01; Figure 4D). CHA II, with its particularly low foliar N concentrations, was the driest (lowest FLandolt value across all sites) and most open site (highest LLandolt value) according to the species composition of ground vegetation. Finally, Nfol tended to increase with increasing N deposition (r = 0.58, p < 0.05 with WDN, r = 0.59, p < 0.05 with TDN). The closest relationship between foliar N and N deposition was found when the total deposition of the oxidized form of N (TDoxN) was considered (r = 0.68, p < 0.05).
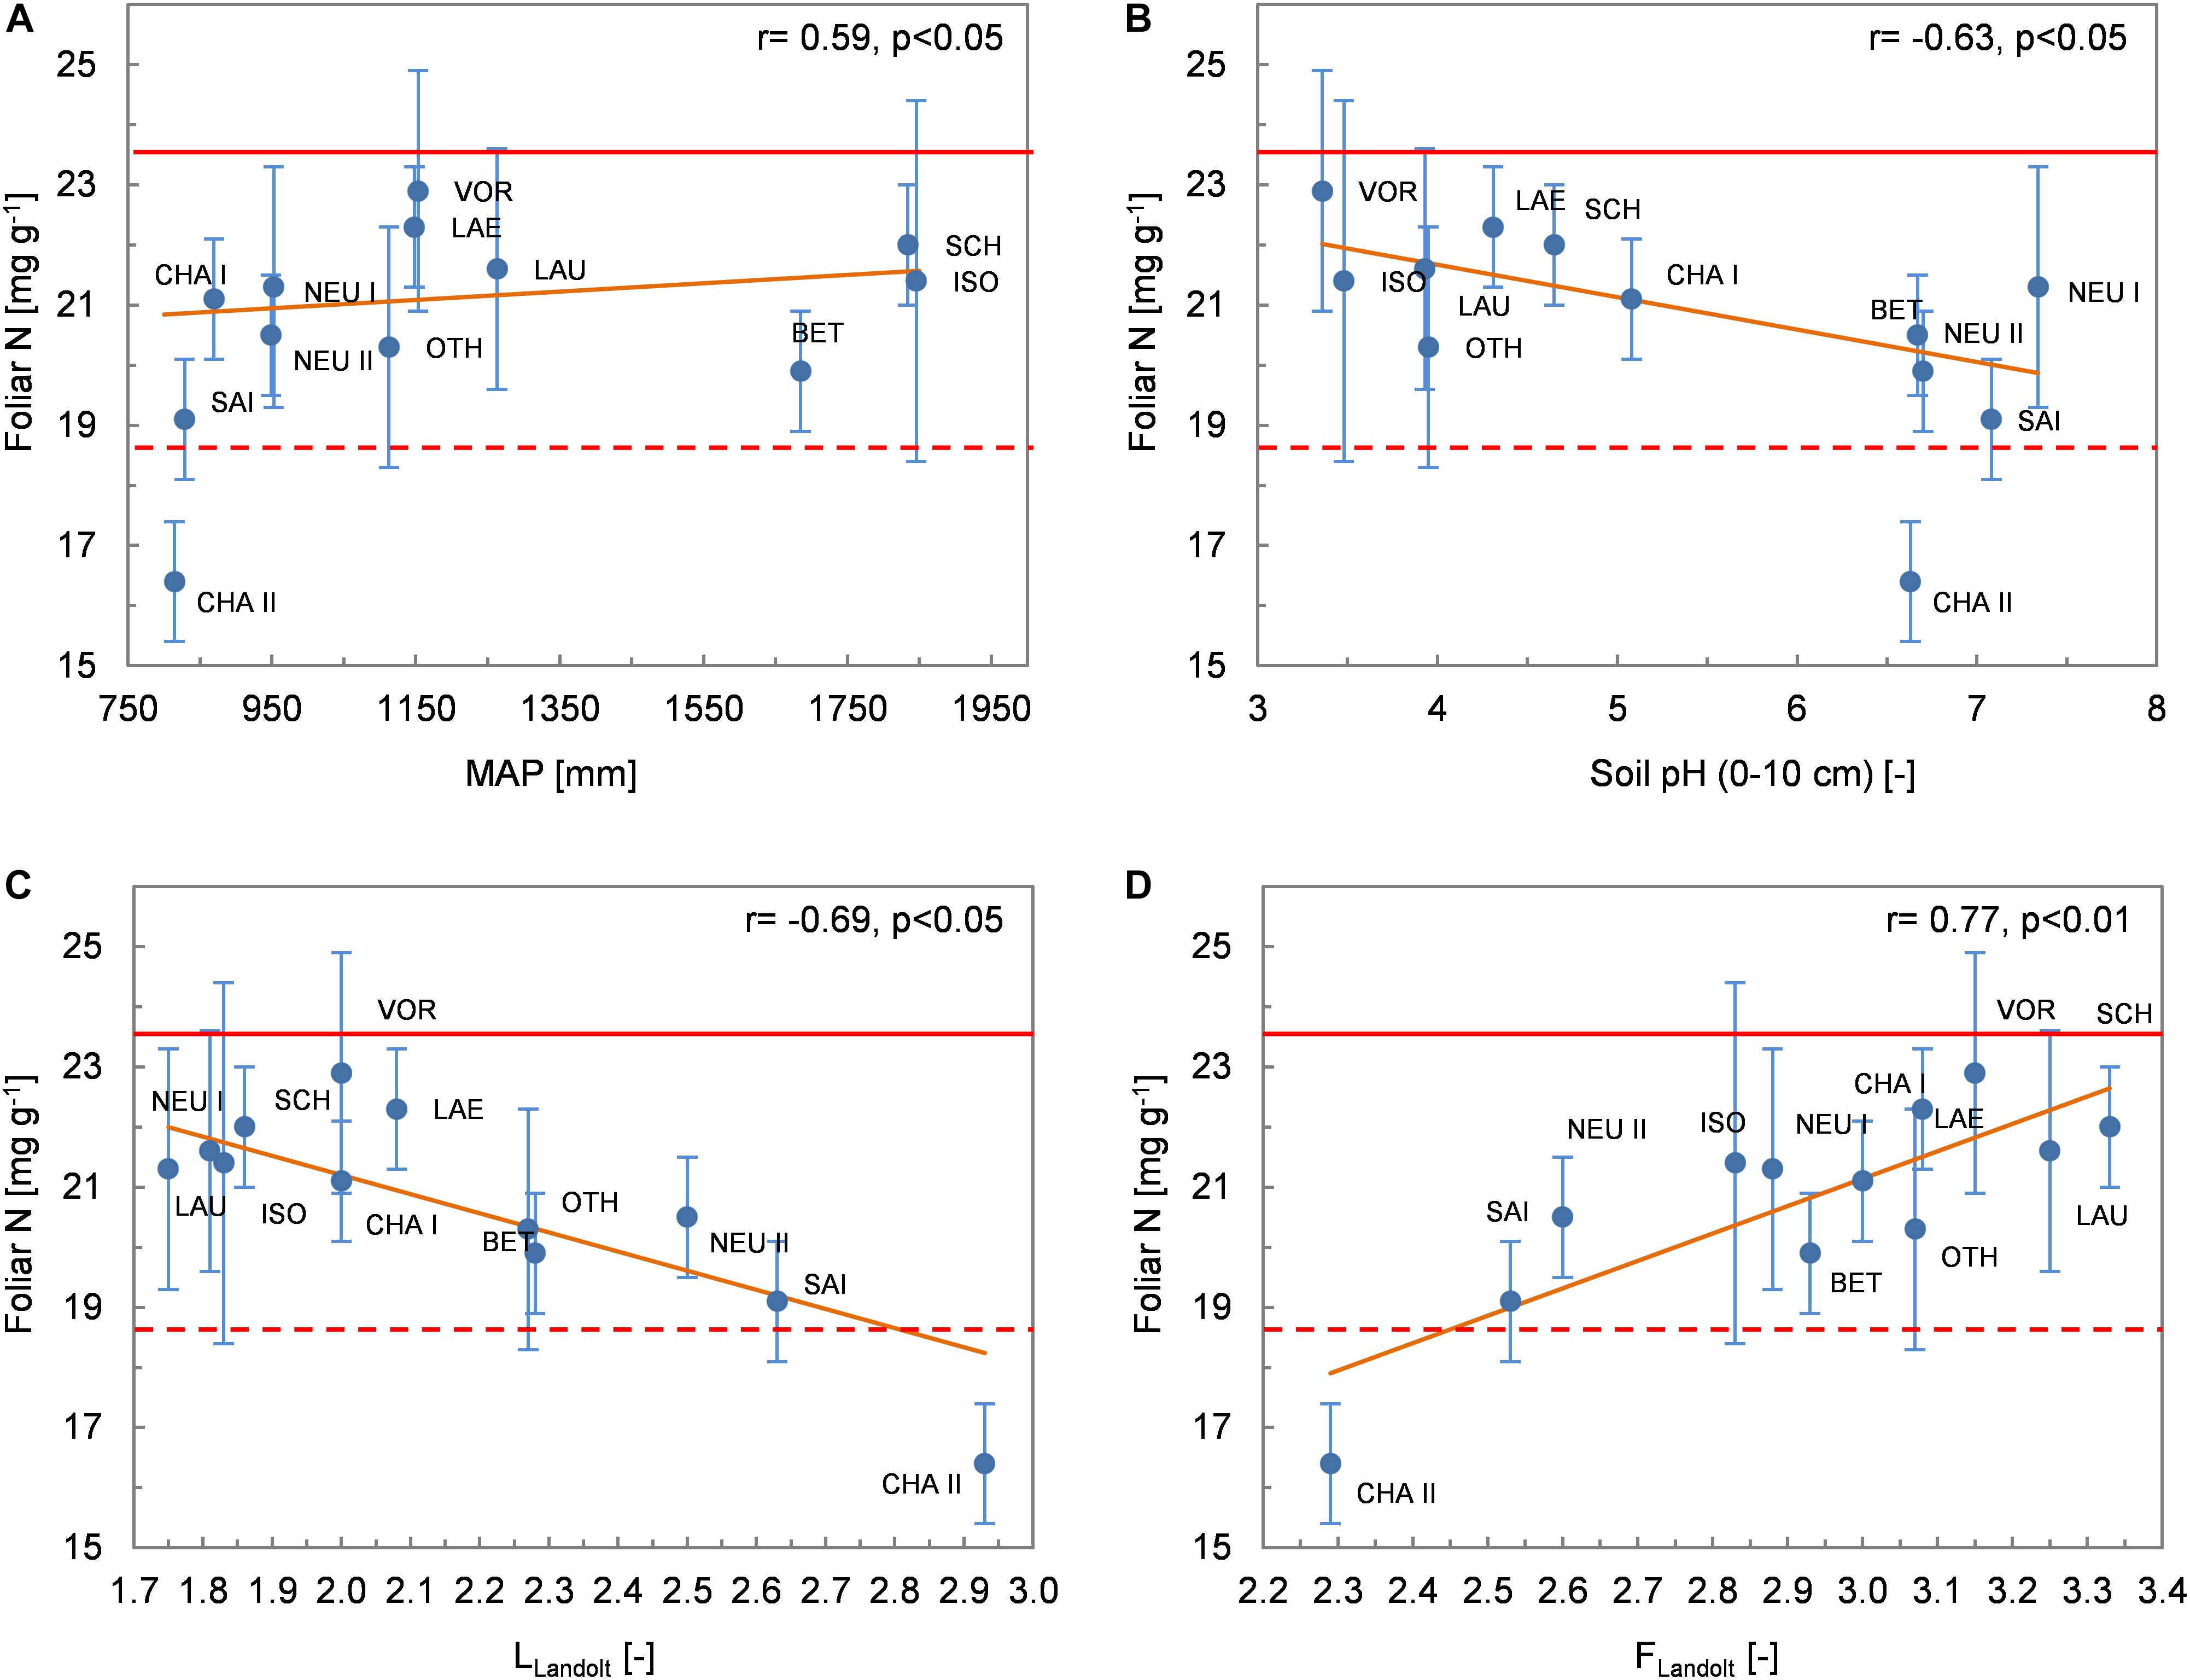
Figure 4. Relationships between foliar N concentrations (mean values per site ± 1 standard deviation) and environmental variables. (A) MAP; (B) soil pH; (C) Landolt indicator value L (light); (D) Landolt indicator value F (humidity). The Spearman coefficient of correlation and the regression line derived from robust regression are shown. The dashed and solid lines delimit the range of optimum nutrition for N according to Mellert and Göttlein (2012).
Pfol was not correlated with any of the (pedo-)climatic variables (MAP, MAT or AT/PT). There were few significant correlations between Pfol and the other environmental variables (r = −0.52, p < 0.10 with Nsoil, r = 0.68, p < 0.05 with Pinorg_soil; Figure 5A). The foliar N/P ratio was also negatively correlated with Pinorg_soil (r = −0.82, p < 0.01 Figure 5B). None of the tested relationships between Mgfol and environmental variables was significant. In particular, there was no correlation between Mgfol and Mgsoil. There was a weak negative relationship between Cafol and AT/PT (r = −0.51, p < 0.10; Figure 6A). Foliar K concentrations (Kfol) were higher at drier than at wetter sites (r = −0.69, p < 0.05 with AT/PT, Figure 6C; r = −0.66, p < 0.05 with MAP). Cafol and Kfol increased significantly with increasing soil pH (Figures 6B,D), base cation concentrations and base saturation, and were negatively correlated with Alsoil and Fesoil.
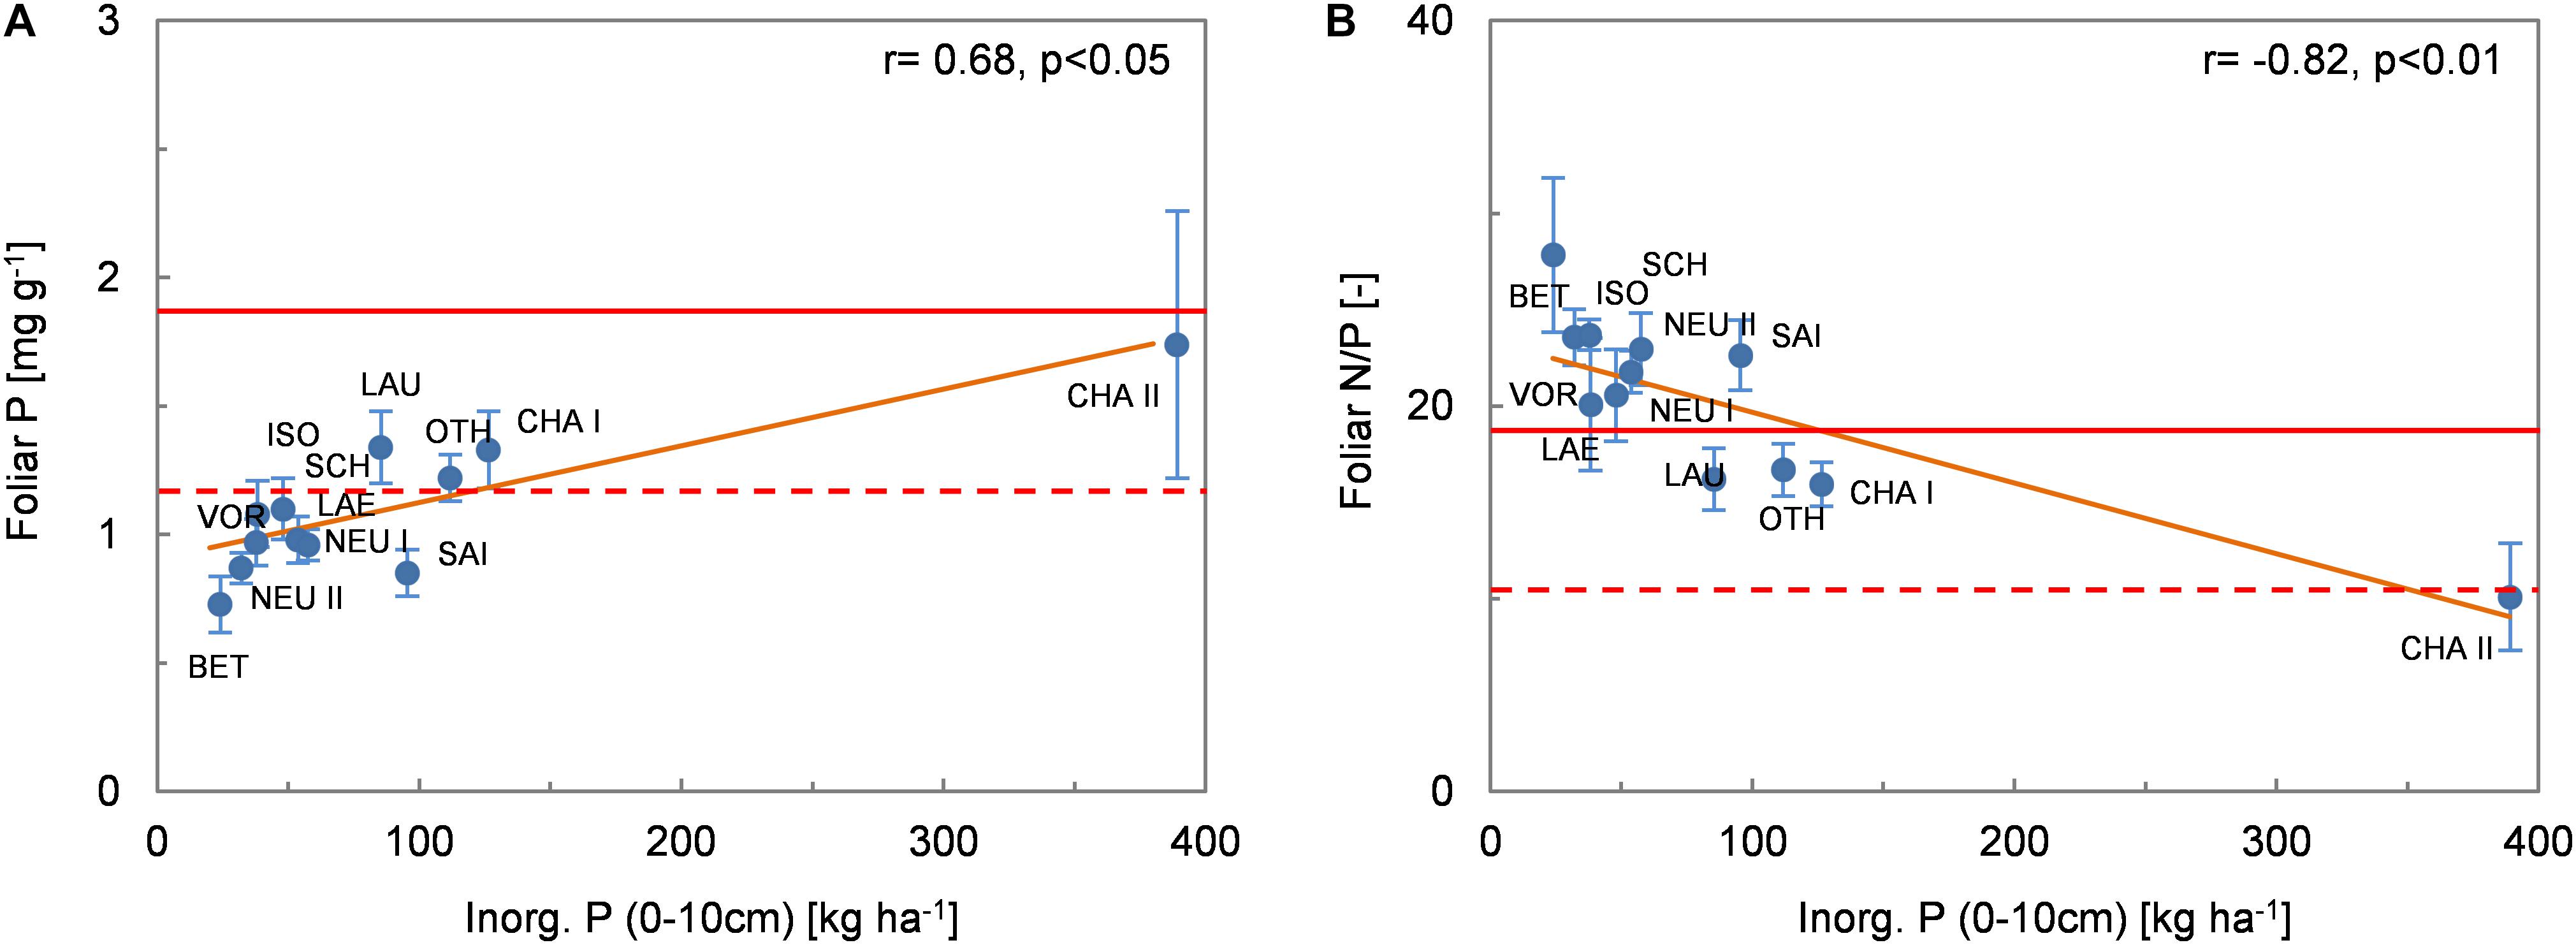
Figure 5. (A) Foliar P concentration and (B) N/P ratio (mean values per site ± 1 standard deviation) as a function of the pool of inorganic P in the top 10 cm of soil. The Spearman coefficient of correlation and the regression line (solid orange line) derived from robust regression are shown. The dashed and solid red lines delimit the range of optimum nutrition for P and N/P according to Mellert and Göttlein (2012).
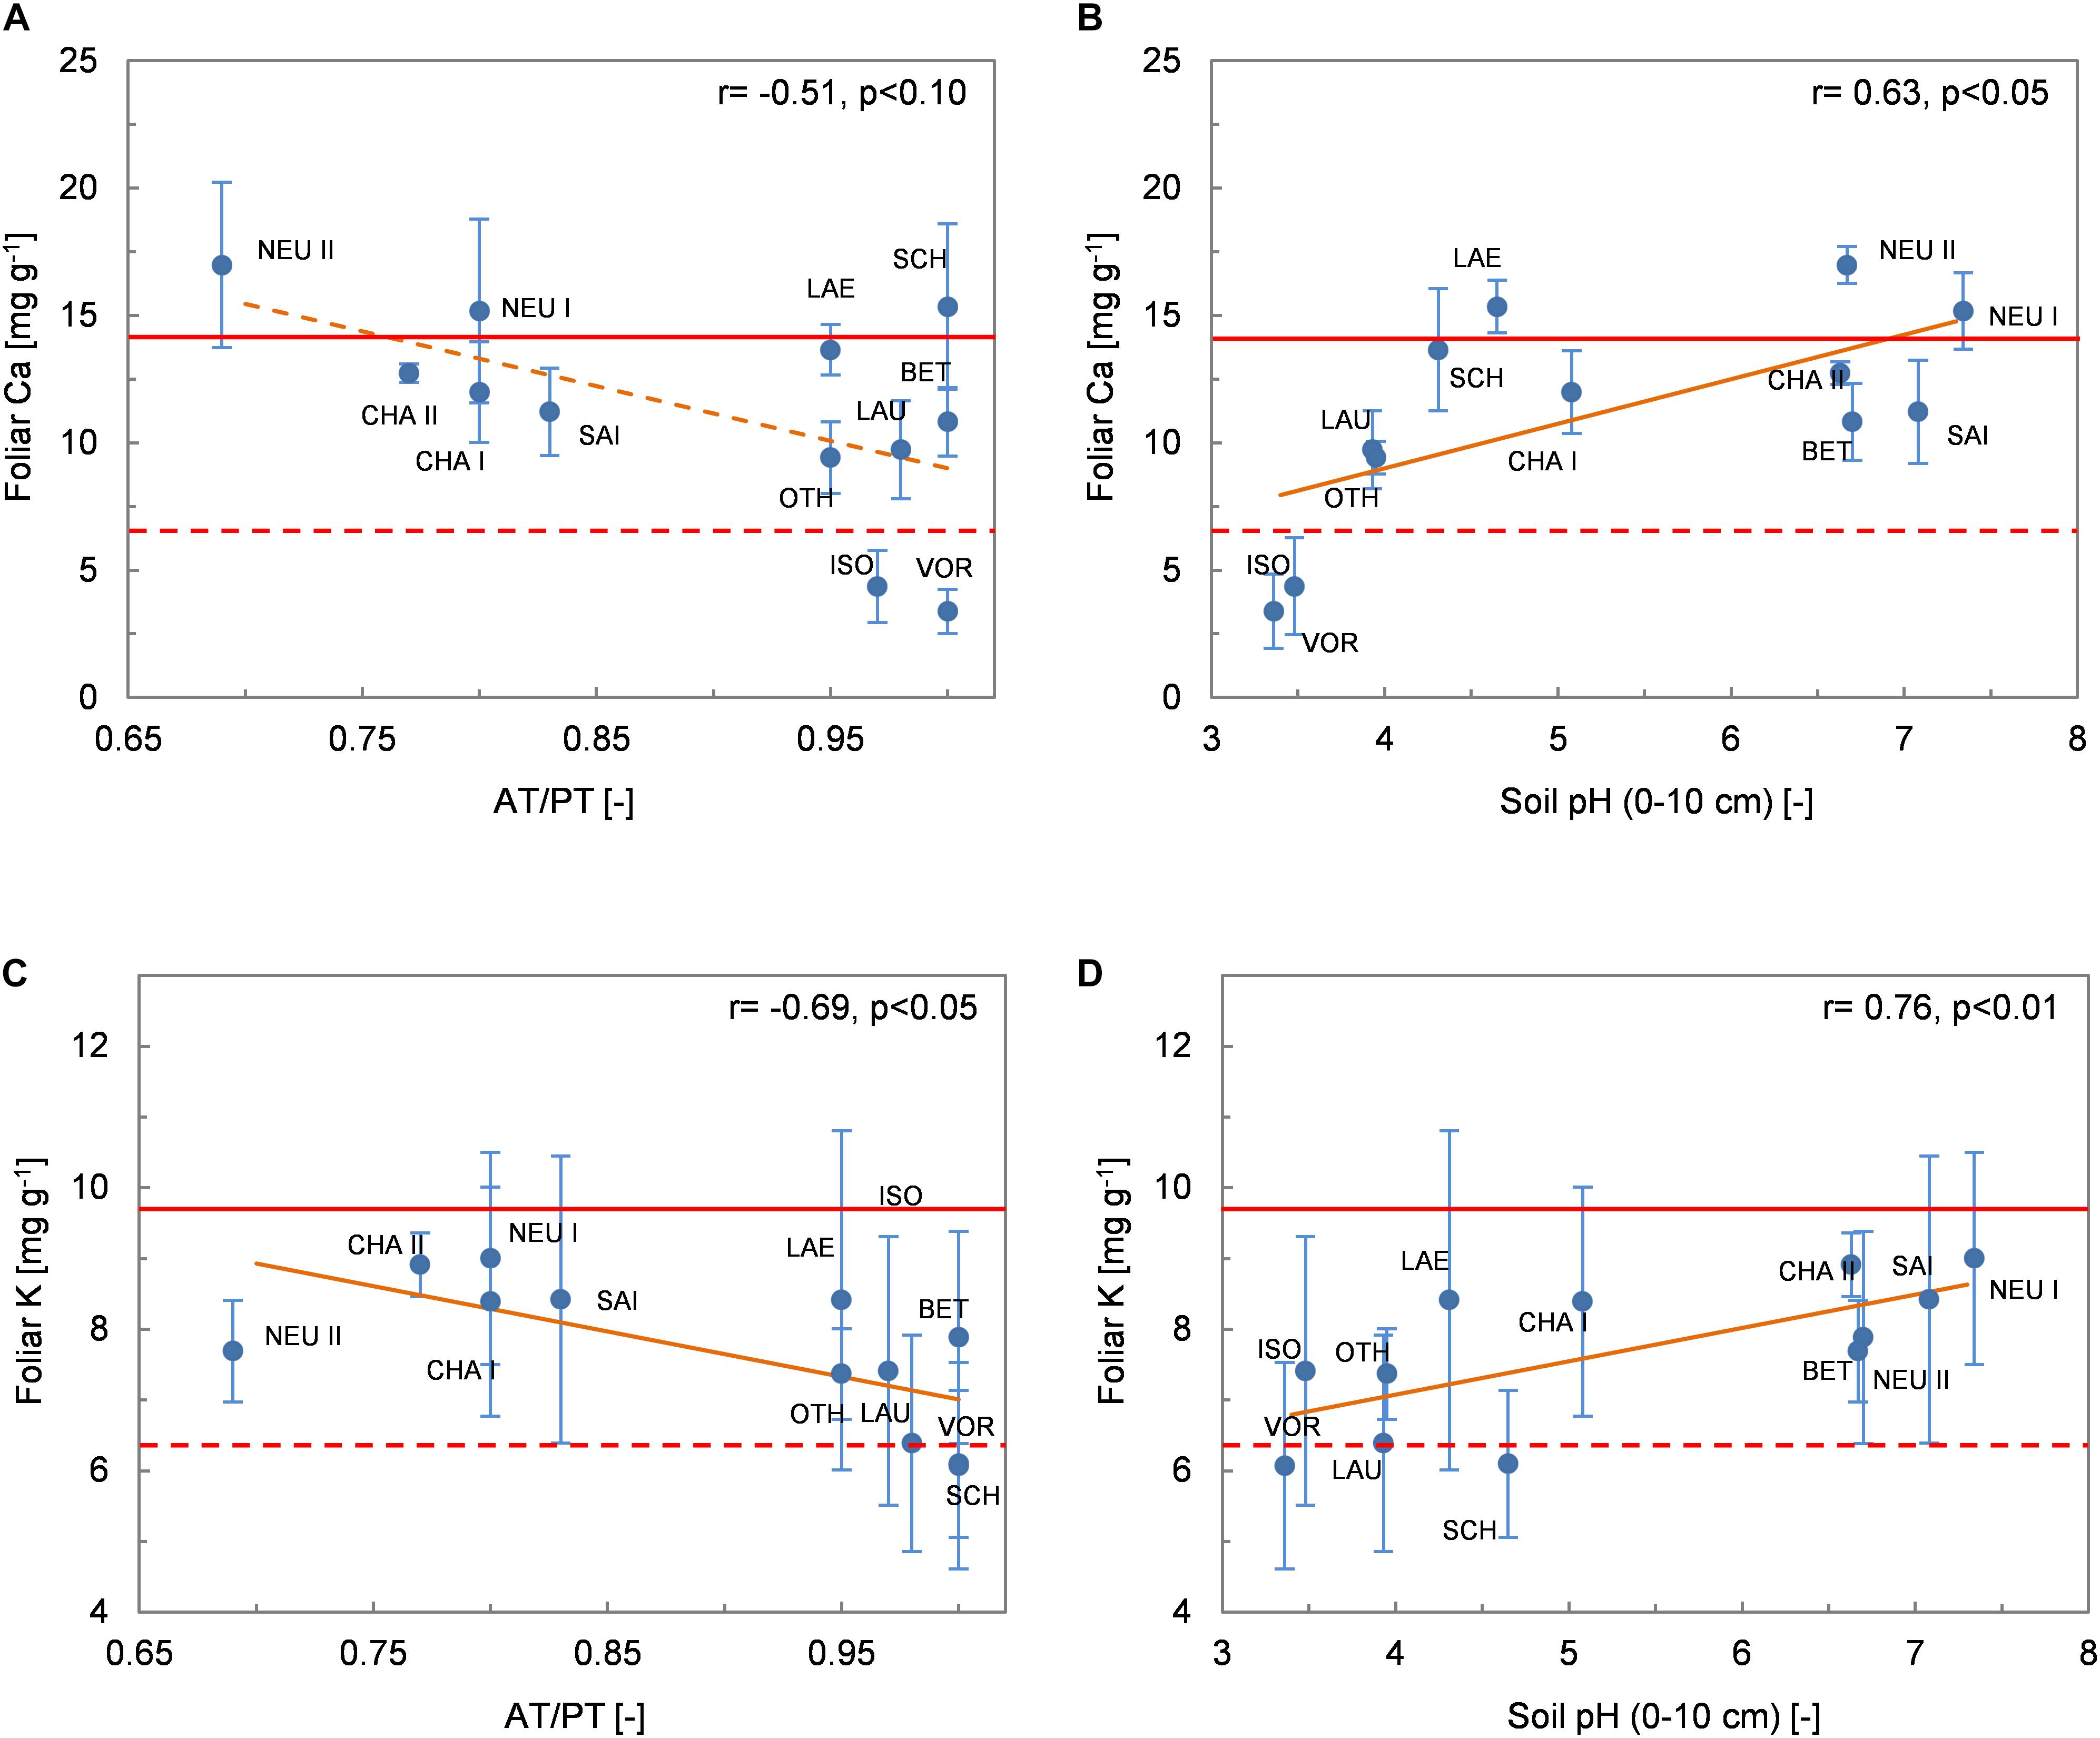
Figure 6. Relationships between foliar Ca and K concentrations (mean values per site ± 1 standard deviation) and environmental variables. (A) Foliar Ca and AT/PT; (B) foliar Ca and soil pH; (C) foliar K and AT/PT; (D) foliar K and soil pH. The Spearman coefficient of correlation and the regression line (solid orange line: p < 0.05, dashed orange line: p < 0.10) derived from robust regression are shown. The dashed and solid red lines delimit the ranges of optimum nutrition for Ca and K according to Mellert and Göttlein (2012).
The foliar N/K ratio (N/Kfol) increased with increasing MAP (r = 0.78, p < 0.01) and AT/PT (r = 0.73, p < 0.01; Figure 7A), as a result of increasing Nfol and decreasing Kfol along these gradients. N/Kfol was strongly and negatively correlated with soil pH (Figure 7B), base cation content and base saturation. Correlations with the indicator value of ground vegetation revealed consistent patterns, with increasing N/Kfol with increasing indicator value FLandolt (Figure 7C) and decreasing N/Kfol with increasing RLandolt. Consistent with the trends of increasing Nfol and decreasing Kfol along the N deposition gradient, N/Kfol increased with increasing N deposition (r = 0.75, p < 0.01 with WDN, r = 0.73, p < 0.01 with TDN; Figure 7D).
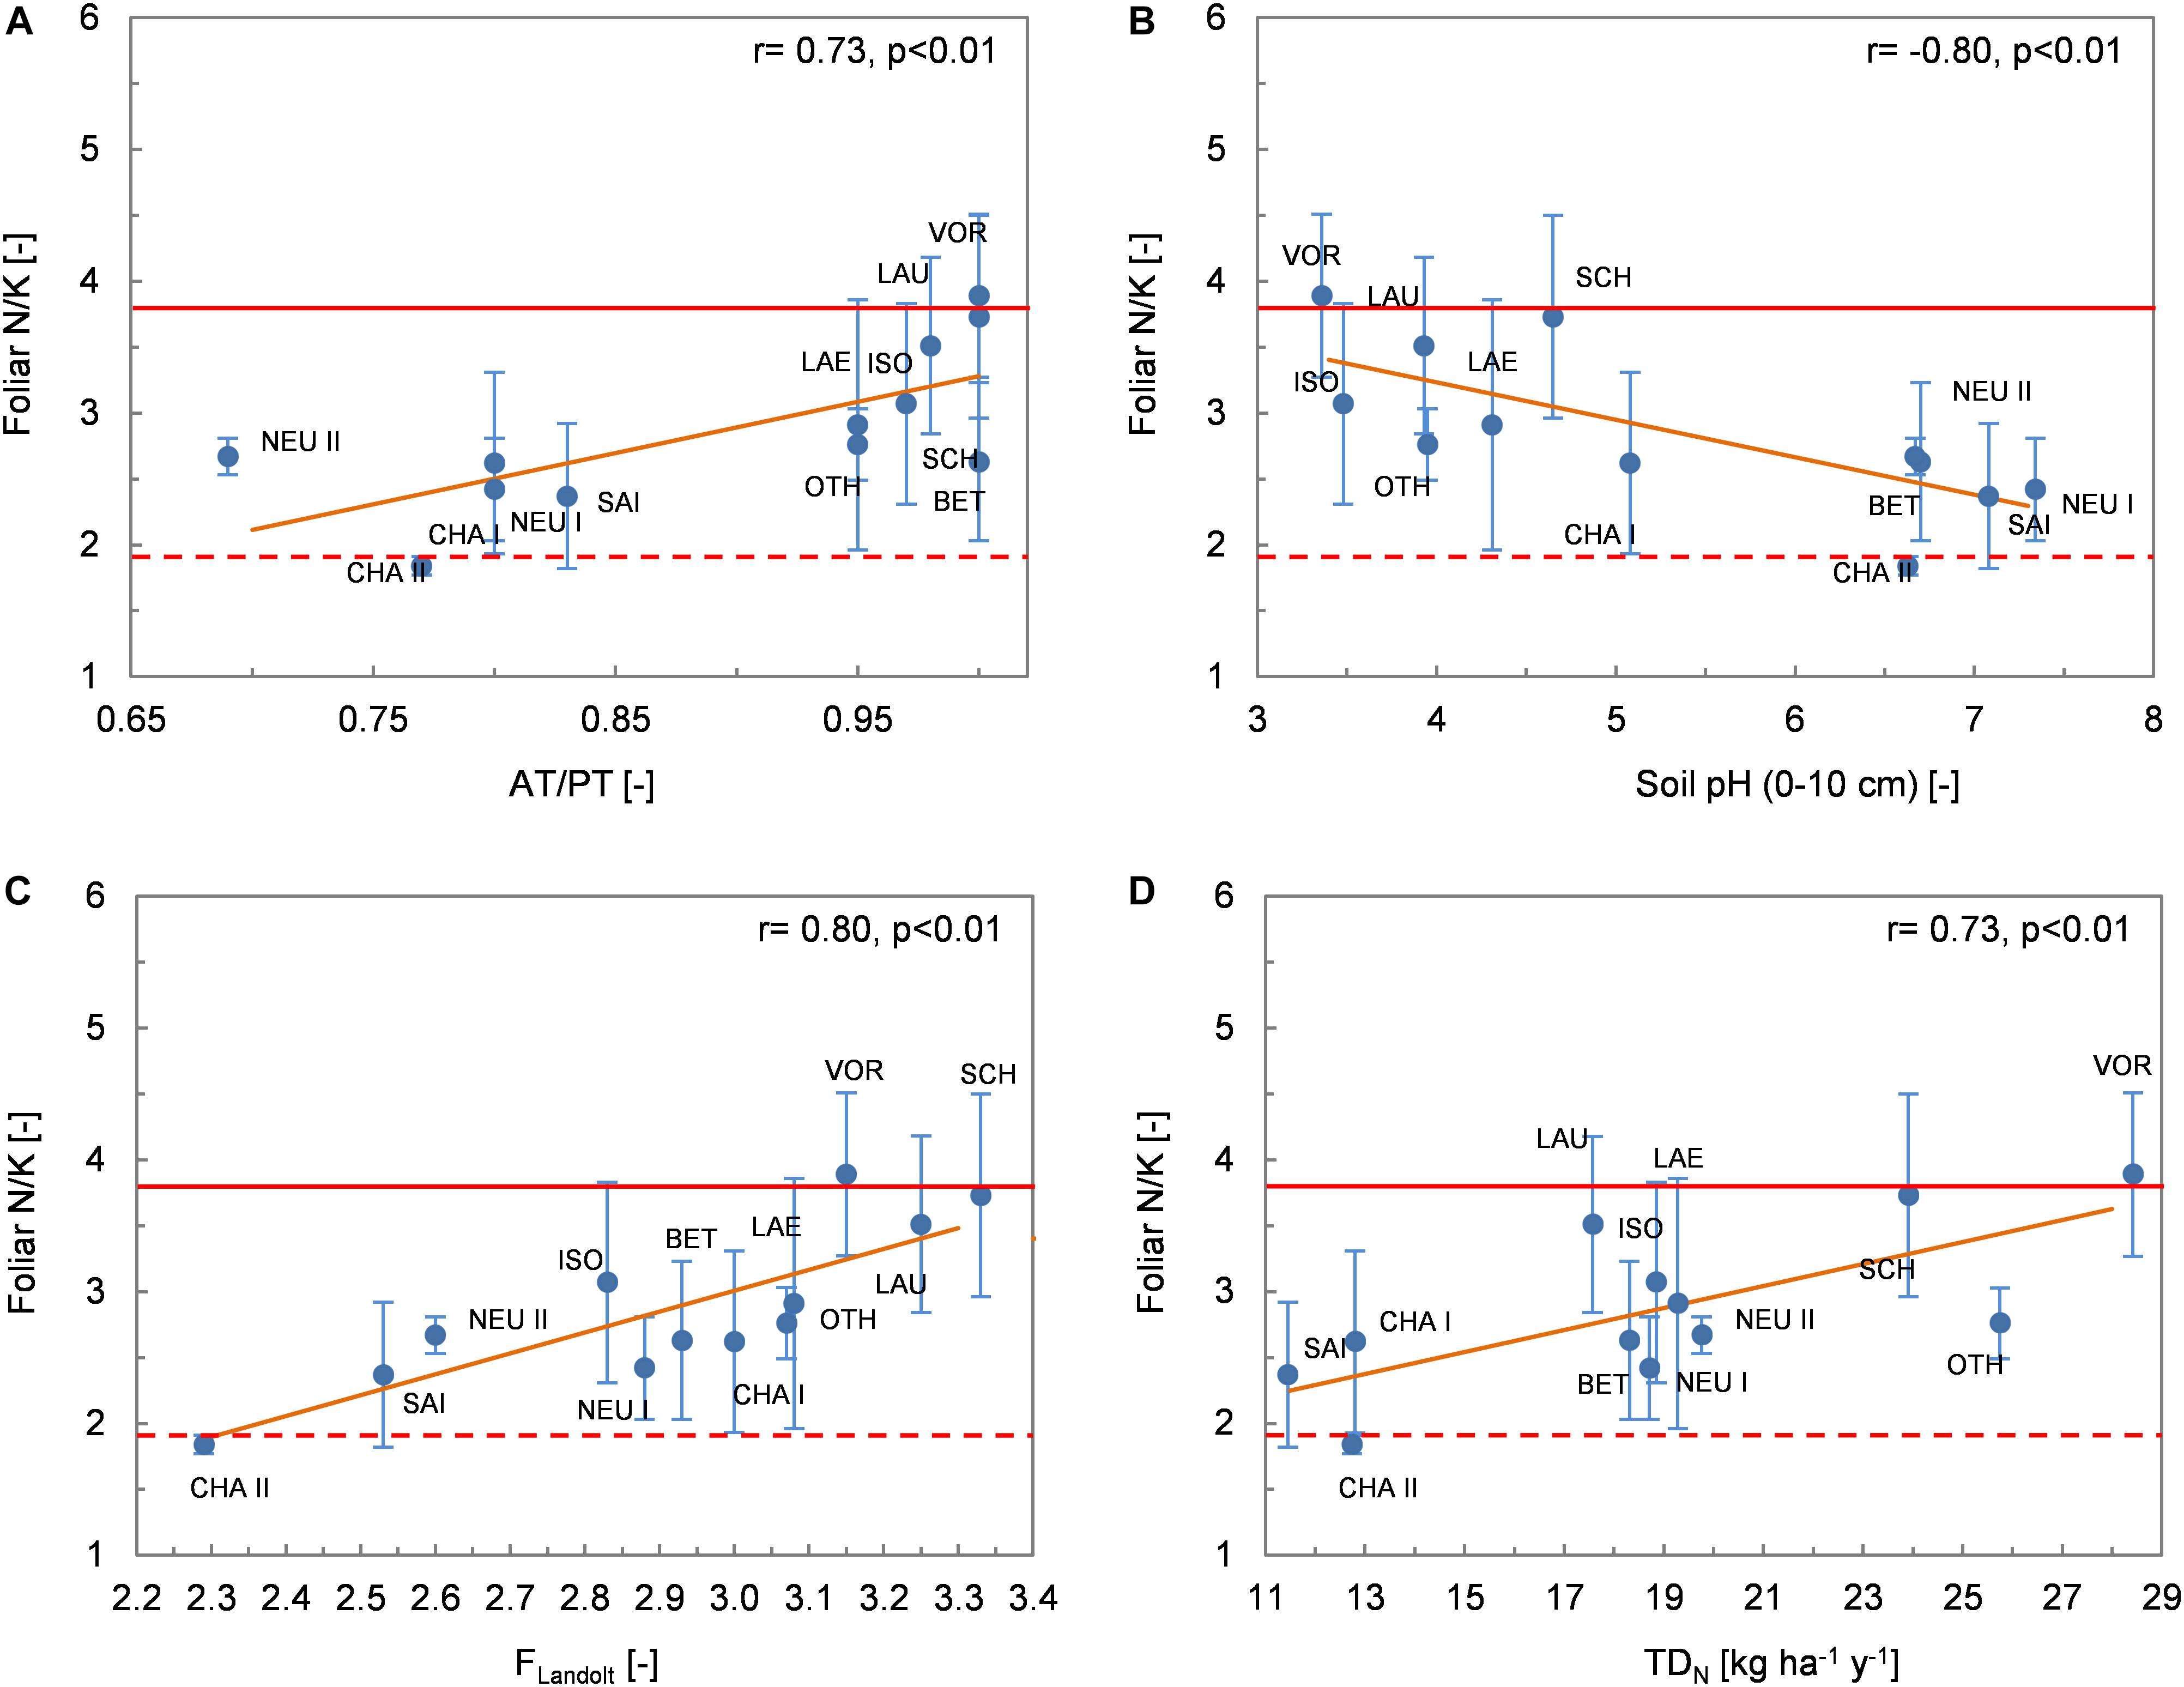
Figure 7. Relationship between the foliar N/K ratio (mean values per site ± 1 standard deviation) and environmental variables. (A) AT/PT; (B) soil pH; (C) Landolt indicator value F (humidity); (D) total deposition of N. The Spearman coefficient of correlation and the regression line (solid orange line) derived from robust regression are shown. The dashed and solid red lines delimit the ranges of optimum nutrition for N/K according to Mellert and Göttlein (2012).
Among microelements, foliar Cu concentrations (Cufol) were positively correlated with AT/PT (r = 0.72, p < 0.01) and MAP (r = 0.83, p < 0.001). Cufol was also negatively correlated with soil pH, soil Ca concentrations and base saturation, and positively with soil Al. Cufol was positively correlated with WDN (r = 0.72, p < 0.01).
Additional Leaf Traits
The phenol and lignin concentrations were not correlated with any of the environmental variables considered here (Supplementary Table 3). The δ15N signature showed no significant correlation with climate, soil properties, indicator values of vegetation or N deposition. Along the precipitation gradient, the highest δ13C values were found on dry sites (r = −0.63, p < 0.05 with AT/PT, r = −0.57, p < 0.10 with MAP). δ13C was also positively correlated with the temperature indicated by the ground vegetation TLandolt (r = 0.58, p < 0.05), and negatively with WDN (r = −0.64, p < 0.05).
Multivariate Analyses
Plotting the environmental variables as supplementary variables on the first two PCA axes (Figure 8) synthesized the correlations between foliar and environmental variables and illustrated the superposition of the soil acidity and water availability gradient: soil base saturation (BS) or soil Ca content and MAT are plotted close to each other and in the opposite direction compared with MAP and AT/PT.
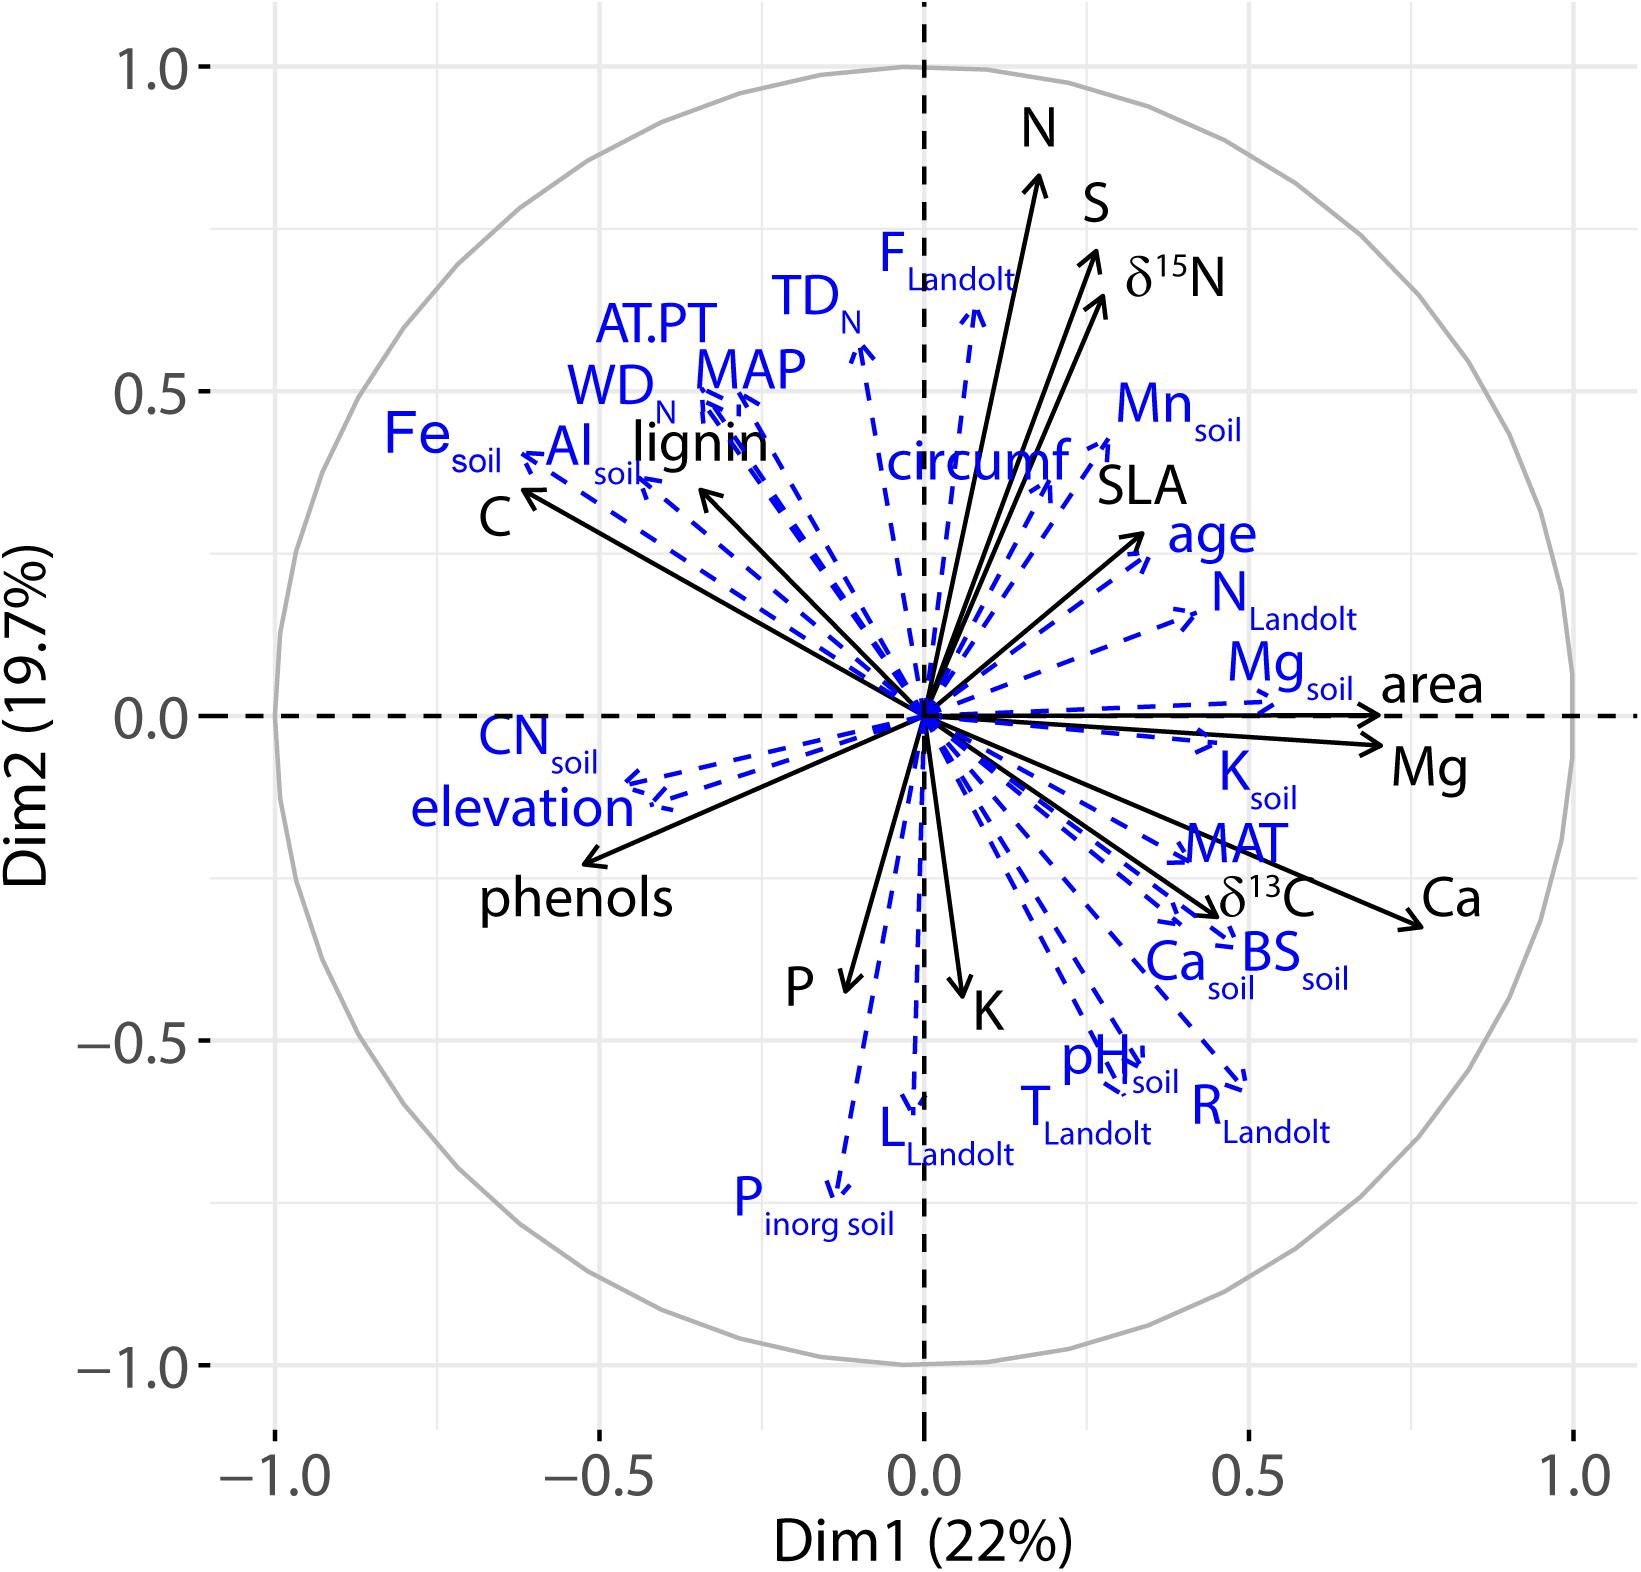
Figure 8. Variable correlation plots of the PCA for axes 1 and 2. Environmental variables (soil, climate, N deposition, Landolt indicator values) were treated as supplementary variables and are shown in blue with dashed arrows.
Exploratory linear regression models that included two or three predictors were found for two leaf traits only. The dry mass of 100 leaves was best explained by the base saturation of the soil (positive effect) and MAP (negative effect), while leaf area was best determined by the C/N ratio of the topsoil (negative effect) and MAT (positive effect) (Table 4).
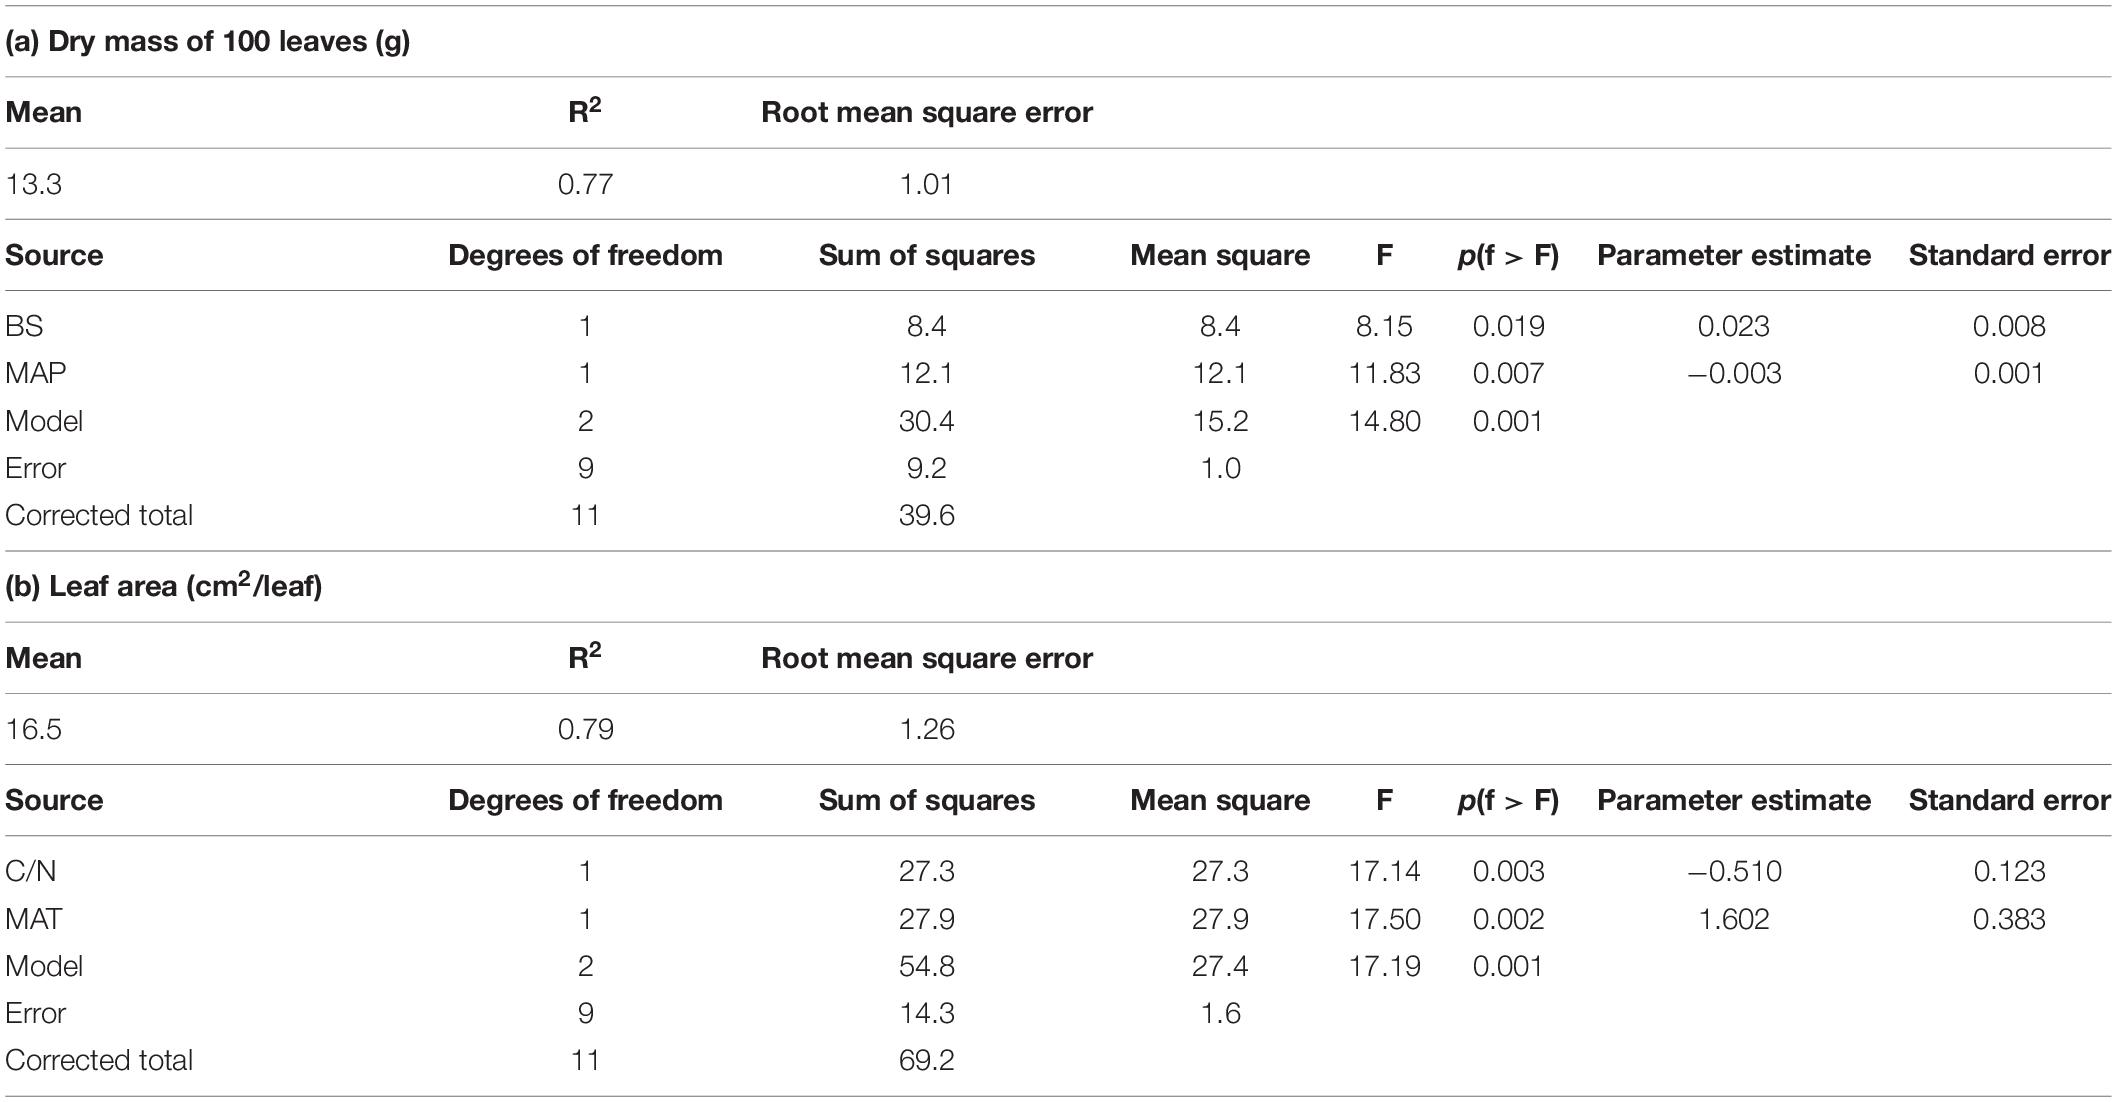
Table 4. Results of significant linear regression models run on foliar traits (for abbreviations of variables see Table 2).
Discussion
In view of the predicted increase in frequency and intensity of summer drought for Switzerland, the responses of foliage properties (nutrient concentrations, leaf size and specific leaf area) of beech trees to changes in water availability and soil properties along an MAP (or AT/PT) gradient were investigated based on 12 forest stands distributed throughout the country. It has already been reported that beech is comparatively vulnerable to summer drought and to rising temperatures (Geßler et al., 2007; Packham et al., 2012; Hanewinkel et al., 2013; Zimmermann et al., 2015). Higher temperatures and reduced precipitation during recent years have been identified as main contributors of a recent growth decline in beech forest stands (Knutzen et al., 2017). The vulnerability of beech trees to such climatic changes might be associated with their large crowns and high water consumption (Leuschner and Ellenberg, 2017).
The results of the present study suggest that water availability, as assessed using long-term proxy variables, has effects on leaf morphology. We observed a significant reduction in leaf dry mass with higher precipitation (MAP) and AT/PT (Figure 3). A similar pattern, yet only marginally significant (p < 0.10), was observed for leaf area. These results seem contradictory with the trend of reduced leaf size with decreasing MAP reported in meta-studies (e.g., McDonald et al., 2003; Peppe et al., 2011; Moles et al., 2014) or with responses to water shortage observed in experiments using potted tree saplings (e.g., Knutzen et al., 2015). Our findings, on the other hand, show some consistency with the results reported by Meier and Leuschner (2008) in a precipitation gradient study comparable to ours, with 14 mature beech forest stands. These authors found that the average leaf size (area) was greater in dry stands than in moist stands. They argued that higher air temperature in May at the drier sites, in a period when soil water reserves are sufficient, stimulated leaf expansion, i.e., the phase of development that contributes most to the leaf surface area (Van Volkenburgh, 1999). The full size of the leaves is thus reached before the onset of drought conditions in summer. Favorable temperatures in spring could likewise explain the relatively large leaf size of beech trees at our driest sites. Using the long-term average of mean air temperature in April and May did not improve the correlation between leaf area and temperature (r = 0.28, n.s., data not shown, compared with r = 0.27 for MAT). More importantly, however, continuous measurements of soil water potential at the driest sites of our sample set, which are also among the warmest sites, indicate non-limiting water availability in spring, in contrast to during the summer period (for an example, see the results for site SAI in Figure 4 of Walthert and Schleppi, 2018). Another explanation could be that leaf growth has adapted to drought experienced in the past and that it can therefore be better maintained under conditions of low water availability (Knutzen et al., 2015).
We found no statistically significant relationships between SLA and climatic factors, although decreasing SLA with decreasing precipitation or water availability (Bussotti et al., 2000; Niinemets, 2001; McDonald et al., 2003; Poorter et al., 2009) and relationships with mean annual temperature (Moles et al., 2014) or soil fertility (Cunningham et al., 1999) have been reported in several studies. The interaction among environmental factors and the covariation of gradients in our data set (e.g., soil acidity and water availability) make it difficult to detect systematic patterns. It is also much more difficult to identify clear relationships when a single species is considered rather than a large number of species over larger gradients, as is the case in the studies cited above. However, the relatively low SLA values at the dry and warm sites of CHA I, CHA II and SAI, in the Valais, are consistent with the hypothesis that species growing in dry environments often produce thicker leaves to minimize water loss (Wright et al., 2004). In addition, the low SLA value of the beech trees at the ISO site, with the highest MAP but also the lowest MAT across our gradient, could be explained by an increased thickness or density of the leaves as an adaptation to cold conditions (Körner et al., 2016). The high foliar C concentrations at ISO (Table 3) might be related to a particular chemical composition of the leaves, such as an increase in structural C compounds as a strategy to overcome cold-related stress, but this was not analyzed further within the present study. SLA and leaf length showed negative correlations with elevation in our data set (Figure 3), in line with findings from the literature (e.g., Hovenden and Vander Schoor, 2004). Ecological changes along elevational gradients are mostly interpreted as being driven by variations in temperature, which generally decreases linearly with increasing elevation. However, the fact that SLA and leaf length correlate more closely with elevation than with MAT across our beech stands suggests that other environmental factors, co-varying with elevation, might also play a role (e.g., irradiance, Hovenden and Vander Schoor, 2006). Furthermore, in our study, elevation is very closely and negatively correlated with dry deposition of N, in particular in its reduced form (NH3) (r = −0.94, p < 0.001; Supplementary Table 1).
Specific leaf area was positively correlated with foliar N concentrations in our data set, and this relationship has been widely observed in the literature, together with a positive relationship of SLA and Nfol with the photosynthetic capacity of the leaves (e.g., Reich et al., 1999). We found that foliar N concentrations increased from dry to moist sites, along a gradient of increasing MAP and increasing Landolt indicator value F for soil humidity (Figure 4). Lower nutrient concentrations in foliage at sites with reduced water availability could be explained by a lower supply of nutrients to the roots due to reduced mass flow and diffusion in the pedosphere, or to reduced microbial activity and a lower decomposition rate (see review by Kreuzwieser and Gessler, 2010). However, we observed the inverse pattern for foliar K, which decreased with increasing MAP and AT/PT (Figure 6), and we found no significant correlation between foliar P or Mg and climatic factors. Nfol is clearly influenced by multiple factors, among which atmospheric deposition of N seems to play a role, as indicated by the correlation analysis and the results of the PCA. A considerable fraction of N in trees is taken up through the roots, but NH4+ and NO3– dissolved in precipitation (wet deposition) and gaseous forms of N, in particular NH3 (dry deposition), can be directly taken up by the forest canopy (e.g., Harrison et al., 2000) and contribute significantly to the annual N requirement for growth (e.g., Sievering et al., 2007). Some other studies have shown a positive relationship between N deposition and foliar N concentrations of trees (Waldner et al., 2015), although this relationship is usually less clear for beech than for coniferous species such as Norway spruce (e.g., Braun et al., 2018). We further speculate that the negative correlation observed between Nfol and LLandolt, the indicator for light conditions below the forest canopy, might be explained by better growth and denser foliage at sites well supplied with N. The positive effect of a lower soil C/N ratio on leaf area observed in the linear regression analysis (Table 4) tends to support this hypothesis. On the other hand, we observed no significant relationship between the LAI of the forest stand and Nfol (Supplementary Table 3), but this could be due to the use of modeled rather than measured LAI values in our analysis.
While Nfol tended to be positively influenced by N deposition, Kfol decreased and N/Kfol increased along the N deposition gradient (Figure 7). This pattern might be ascribed to the negative effect of increased N on the mycorrhizal communities reported in several studies (e.g., de Witte et al., 2017; van der Linde et al., 2018) and the resulting impaired nutrient uptake. Braun et al. (2018), for example, observed a significant decrease in K concentration in beech foliage with decreasing diversity of ectomycorrhizal root tips. However, as N deposition is very closely related to climatic variables (e.g., r = 0.94, p < 0.001 between WDN and MAP), it is difficult to single out the effect of N deposition on nutrient foliar concentrations in our data set. Nevertheless, knowing that N and S deposition are often correlated, the rather close relationship between Nfol and Sfol might be supportive of an influence of deposition on foliar concentrations.
Although Kfol changes across various gradients, K nutrition is, according to the optimum range of foliar concentrations available from the literature, satisfactory at practically all of our sites. Satisfactory K nutrition helps to alleviate drought stress at dry sites through the role of K+ in stomatal regulation and the importance of this cation for the osmotic potential in the vacuoles (Marschner, 1995). This could explain why beech can maintain its presence at the driest sites of our gradient. On the other hand, except where pools of inorganic P in the top 10 cm of soil were large, we measured foliar P concentrations indicative of P limitation at most of our sites. This observation is in line with other studies in Switzerland (Braun et al., 2018) and elsewhere in Europe (Jonard et al., 2015; Talkner et al., 2015). Pfol was correlated with very few variables and, in particular, did not show a significant correlation with N deposition in our data set. A widespread hypothesis is, however, that N in excess due to atmospheric deposition contributes to impaired P uptake by trees through changes in the mycorrhizal community (Talkner et al., 2015).
Regarding microelements, one of the strongest correlations between climatic factors and foliar concentrations was observed for Cu (positive correlation between Cufol and MAP or AT/PT, Supplementary Table 3). We suspect that this correlation was a consequence of the superposition of the soil acidity and water availability gradients (negative correlation between soil pH and MAP or AT/PT), as copper availability is known to be substantially affected by soil pH, decreasing 99% for each unit increase in pH (Mortvedt, 2000).
Lastly, no clear pattern was found between foliar δ15N and climatic factors. In particular, the positive correlation observed by Meier and Leuschner (2014) between δ15N and MAP was not apparent in our dataset. Furthermore, foliar δ15N is expected to increase with increasing N deposition and decreasing C/N ratio of the forest floor, and it is expected to be a comprehensive indicator of the N status of the ecosystem (Pardo et al., 2006). However, in our data set, the only variable that was significantly correlated with foliar δ15N was Nfol. This correlation has been observed in several earlier studies (Craine et al., 2009). Regarding δ13C, the negative relationship with AT/PT and MAP that we observed is in line with findings from the literature. Drought stress caused by low precipitation or high evaporation results in stomatal closure, which results in a less efficient discrimination of 13C and finally in a less negative δ13C value (Garten and Taylor, 1992; Wang et al., 2013).
Conclusion
In our study, the average leaf dry mass and leaf area tended to decrease with increasing water availability (using MAP or AT/PT as indicators), in contrast to what we expected. We found no linear relationship between SLA and long-term (pedo-)climatic factors. At our driest sites, however, SLA tended to be lower, which partially supports our initial hypothesis. Regarding macronutrients, a positive correlation was found between foliar N and MAP, while the opposite was true for K. Our second hypothesis (less favorable foliar nutrient status at sites with lower water availability) was therefore not supported for all nutrients. Owing to the small number of sites relative to the number of variables studied, correlation analyses have a limited statistical power and must be interpreted with caution. Furthermore, collinearities between environmental factors in our data set make it difficult to single out the effect of water availability on leaf traits, as e.g., the gradient in soil acidity is more or less overlaid on our MAP and AT/PT gradient. We therefore suggest testing our findings using additional sites, such as those of the ICP Forests Level II network in other European countries. Still, a major advantage of our data set is the broad gradient of water availability covered: at Schänis and Isone, water availability is generally high, also in the context of Europe as a whole, while at two of our sites (Saillon and Chamoson II) at the dry end of the gradient, water shortage happened to be so severe that some of the beech trees died in late summer 2017.
Data Availability Statement
The datasets generated for this study are available on request to the corresponding author.
Author Contributions
IB, AT, and MSa conceived and designed the study. LW, SZ, KL, PW, and MSc provided data and input for the data evaluations. AT, MSa, PS, and MA analyzed the data. All authors contributed to the writing of the manuscript.
Funding
This project has been supported by a postdoctoral fellowship granted to MSa by the Swiss Government Excellence Scholarship. The LWF measurements are mainly financed by WSL, with additional support from the Canton of St. Gallen and the City of Lausanne, with the kind permission of land owners.
Conflict of Interest
The authors declare that the research was conducted in the absence of any commercial or financial relationships that could be construed as a potential conflict of interest.
Acknowledgments
We thank Beat Rihm from Meteotest AG, Berne, for carrying out the modeling of nitrogen deposition (with financial support from the Federal Office for the Environment FOEN) and providing the data. We also thank Jan Remund for preparing meteorological input data and Martin Scherler for running the CoupModel, in the framework of a FOEN supported project. We acknowledge MeteoSwiss for providing station data and derived products. We further thank Markus Gysin, Anja Erni, Pierre Pages, Christian Rutschmann, Corentin Gaillard, and Sylvain Braito for tree climbing, Yuk Ying Cheung-Tang, Anna Brechbühl, Jules Peter and Loïc Rickenmann for preparation of foliar samples, Dominik Brödlin, Dani Christen and Alois Zürcher for help with laboratory work, the WSL Central Laboratory for chemical analyses, and Oliver Schramm, Roger Köchli and Marco Walser for field work. Roger Köchli and Marco Walser also prepared soil samples. Lastly, we thank Flurin Sutter for GIS support, Simpal Kumar for database support and Melissa Dawes for linguistic corrections.
Supplementary Material
The Supplementary Material for this article can be found online at: https://www.frontiersin.org/articles/10.3389/ffgc.2020.00019/full#supplementary-material
Footnotes
References
Bell, J. E., Sherry, R., and Luo, Y. (2010). Changes in soil water dynamics due to variation in precipitation and temperature: an ecohydrological analysis in a tallgrass prairie. Water Resour. Res. 46:W03523. doi: 10.1029/2009WR007908
Braun, S., Hopf, S., and de Witte, L. C. (2018). Wie Geht es Unserem Wald? 34 Jahre Walddauerbeobachtung. Bericht 5, 2013–2017. Schönenbuch: Institut für Angewandte Pflanzenbiologie.
Bussotti, F., Borghini, F., Celesti, C., Leonzio, C., and Bruschi, P. (2000). Leaf morphology and macronutrients in broadleaved trees in central Italy. Trees 14, 361–368. doi: 10.1007/s004680000056
Cabane, M., Afif, D., and Hawkins, S. (2012). “Chapter 7- Lignins and Abiotic Stresses,” in Advances in Botanical Research, eds L. Jouanin, and C. Lapierre, (London: Academic Press), 219–262. doi: 10.1016/b978-0-12-416023-1.00007-0
CH2018 (2018). Climate Scenarios for Switzerland, Technical Report. Zurich: National Centre for Climate Services.
Christensen, J. H., Hewitson, B., Busuioc, A., Chen, A., Gao, X., Held, R., et al. (2007). “Regional climate projections,” in Climate Change: The Physical Science Basis. Contribution of Working group I to the Fourth Assessment Report of the Intergovernmental Panel on Climate Change, eds S. D. Solomon, M. Qin, Z. Manning, M. ChenMarquis, K. B. Averyt, M. Tignor, et al. (Cambridge: Cambridge University Press), 847–940.
Cornelissen, J. H. C., Castro Diez, P., and Hunt, R. (1996). Seedling growth, allocation and leaf attributes in a wide range of woody plant species and types. J. Ecol. 84, 755–765. doi: 10.2307/2261337
Craine, J. M., Elmore, A. J., Aidar, M. P. M., Bustamante, M., Dawson, T. E., Hobbie, E. A., et al. (2009). Global patterns of foliar nitrogen isotopes and their relationships with climate, mycorrhizal fungi, foliar nutrient concentrations, and nitrogen availability. New Phytol. 183, 980–992. doi: 10.1111/j.1469-8137.2009.02917.x
Cunningham, S. A., Summerhayes, B., and Westoby, M. (1999). Evolutionary divergences in leaf structure and chemistry, comparing rainfall and soil nutrient gradients. Ecol. Monogr. 69, 569–588. doi: 10.1890/0012-9615(1999)069[0569:edilsa]2.0.co;2
de Witte, L. C., Rosenstock, N. P., van der Linde, S., and Braun, S. (2017). Nitrogen deposition changes ectomycorrhizal communities in Swiss beech forests. Sci. Total Environ. 605, 1083–1096. doi: 10.1016/j.scitotenv.2017.06.142
Dence, C. W. (1992). “The determination of lignin,” in Methods in Lignin Chemistry, eds S. Y. Lin, and C. W. Dence, (Berlin: Springer), 33–61. doi: 10.1007/978-3-642-74065-7_3
Dray, S., and Dufour, A.-B. (2007). The ade4 package: implementing the duality diagram for ecologists. J. Stat. Softw. 22, 1–20. doi: 10.18637/jss.v022.i04
FAO (1988). FAO/Unesco Soil Map of the World, Revised Legend, With Corrections and Updates. World Soil Resources Report 60 (Reprinted With Updates as Technical Paper 20, ISRIC, Wageningen, 1997). Rome: FAO.
Fürst, A. (2018). 20th Needle/Leaf Interlaboratory Comparison Test 2017/2018. Vienna: Foliar Co-ordinating Centre.
Garten, C., and Taylor, G. (1992). Foliar δ13C within a temperate deciduous forest: spatial, temporal, and species sources of variation. Oecologia 90, 1–7. doi: 10.1007/BF00317801
Gessler, A., Keitel, C., Nahm, M., and Rennenberg, H. (2004). Water shortage affects the water and nitrogen balance in Central European beech forests. Plant Biol. 6, 289–298. doi: 10.1055/s-2004-820878
Geßler, A., Keitel, C., Kreuzwieser, J., Matyssek, R., Seiler, W., and Rennenberg, H. (2007). Potential risks for European beech (Fagus sylvatica L.) in a changing climate. Trees 21, 1–11. doi: 10.1007/s00468-006-0107-x
Gholz, H. L., Ewel, K. C., and Teskey, R. O. (1990). Water and forest productivity. For. Ecol. Manag. 30, 1–18. doi: 10.1016/0378-1127(90)90122-R
Gonsamo, A., Walter, J.-M., Chen, J. M., Pellikka, P., and Schleppi, P. (2018). A robust leaf area index algorithm accounting for the expected errors in gap fraction observations. Agric. For. Meteorol. 248, 197–204. doi: 10.1016/j.agrformet.2017.09.024
Hanewinkel, M., Cullmann, D. A., Schelhaas, M.-J., Nabuurs, G.-J., and Zimmermann, N. E. (2013). Climate change may cause severe loss in the economic value of European forest land. Nat. Clim. Chang. 3, 203–207. doi: 10.1038/nclimate1687
Hansen, A. J., Neilson, R. P., Dale, V. H., Flather, C. H., Iverson, L. R., Currie, D. J., et al. (2001). Global change in forests: responses of species, communities, and biomes: interactions between climate change and land use are projected to cause large shifts in biodiversity. Bioscience 51, 765–779.
Harrison, A. F., Schulze, E. D., Gebauer, G., and Bruckner, G. (2000). “Canopy uptake and utilization of atmospheric pollutant nitrogen,” in Carbon and Nitrogen Cycling in European Forest Ecosystems, ed. E.-D. Schulze, (Berlin: Springer), 171–188. doi: 10.1007/978-3-642-57219-7_8
Heim, A., and Frey, B. (2004). Early stage litter decomposition rates for Swiss forests. Biogeochemistry 70, 299–313. doi: 10.1007/s10533-003-0844-5
Hlásny, T., Mátyás, C., Seidl, R., Kulla, L., Merganičová, K., Trombik, J., et al. (2014). Climate change increases the drought risk in Central European forests: what are the options for adaptation? Cent. Eur. For. J. 60, 5–18. doi: 10.2478/forj-2014-0001
Hovenden, M. J., and Vander Schoor, J. K. (2004). Nature vs nurture in the leaf morphology of Southern beech, Nothofagus cunninghamii (Nothofagaceae). New Phytol. 161, 585–594. doi: 10.1046/j.1469-8137.2003.00931.x
Hovenden, M. J., and Vander Schoor, J. K. (2006). The response of leaf morphology to irradiance depends on altitude of origin in Nothofagus cunninghamii. New Phytol. 169, 291–297. doi: 10.1111/j.1469-8137.2005.01585.x
IPCC (2014). Climate change: synthesis report. Contribution of Working Groups I, II and III to the Fifth Assessment Report of the Intergovernmental Panel on Climate Change. Geneva: IPCC.
Jacob, D., Petersen, J., Eggert, B., Alias, A., Christensen, O. B., Bouwer, L. M., et al. (2014). EURO-CORDEX: new high-resolution climate change projections for European impact research. Reg. Environ. Change 14, 563–578. doi: 10.1007/s10113-013-0499-2
Jansson, P.-E., and Karlberg, L. (2011). CoupModel: Coupled Heat and Mass Transfer Model for Soil-Plant-Atmosphere Systems. Technical Manual for the CoupModel. Available at: https://www.coupmodel.com/documentation (accessed February 13, 2020).
Jarvis, P. G., and Leverenz, J. W. (1983). “Productivity of temperate, deciduous and evergreen Forests,” in Physiological Plant Ecology IV. Encyclopedia of Plant Physiology (New Series), eds O. L. Lange, P. S. Nobel, C. B. Osmond, and H. Ziegler, (Berlin: Springer).
Jonard, M., Fürst, A., Verstraeten, A., Thimonier, A., Timmermann, V., Potočić, N., et al. (2015). Tree mineral nutrition is deteriorating in Europe. Glob. Chang. Biol. 21, 418–430. doi: 10.1111/gcb.12657
Karmakar, R., Das, I., Dutta, D., and Rakshit, A. (2016). Potential effects of climate change on soil properties: a review. Sci. Int. 4, 51–73. doi: 10.17311/sciintl.2016.51.73
Knutzen, F., Dulamsuren, C., Meier, I. C., and Leuschner, C. (2017). Recent climate warming-related growth decline impairs European beech in the center of its distribution range. Ecosystems 20, 1494–1511. doi: 10.1007/s10021-017-0128-x
Knutzen, F., Meier, I. C., and Leuschner, C. (2015). Does reduced precipitation trigger physiological and morphological drought adaptations in European beech (Fagus sylvatica L.)? Comparing provenances across a precipitation gradient. Tree Physiol. 35, 949–963. doi: 10.1093/treephys/tpv057
Körner, C., Basler, D., Hoch, G., Kollas, C., Lenz, A., Randin, C. F., et al. (2016). Where, why and how? Explaining the low-temperature range limits of temperate tree species. J. Ecol. 104, 1076–1088. doi: 10.1111/1365-2745.12574
Kreuzwieser, J., and Gessler, A. (2010). Global climate change and tree nutrition: influence of water availability. Tree Physiol. 30, 1221–1234. doi: 10.1093/treephys/tpq055
Leuschner, C., and Ellenberg, H. (2017). Ecology of Central European Forests – Vegetation Ecology of Central Europe. Cham: Springer International Publishing.
McDonald, P. G., Fonseca, C. R., Overton, J. M., and Westoby, M. (2003). Leaf-size divergence along rainfall and soil-nutrient gradients: is the method of size reduction common among clades? Funct. Ecol. 17, 50–57. doi: 10.1046/j.1365-2435.2003.00698.x
Meier, I. C., and Leuschner, C. (2008). Leaf size and leaf area index in Fagus sylvatica forests: competing effects of precipitation, temperature, and nitrogen availability. Ecosystems 11, 655–669. doi: 10.1007/s10021-008-9135-2
Meier, I. C., and Leuschner, C. (2014). Nutrient dynamics along a precipitation gradient in European beech forests. Biogeochemistry 120, 51–69. doi: 10.5194/bgd-10-11899-2013
Mellert, K., and Göttlein, A. (2012). Comparison of new foliar nutrient thresholds derived from van den Burg’s literature compilation with established central European references. Eur. J. For. Res. 131, 1461–1472. doi: 10.1007/s10342-012-0615-8
MeteoSwiss (2016a). Documentation of MeteoSwiss Grid-Data Products, Monthly and Yearly Mean Temperature: TabsM and TabsY. Available at: https://www.meteoschweiz.admin.ch/content/dam/meteoswiss/de/service-und -publikationen/produkt/raeumliche-daten-temperatur/doc/ProdDoc_TabsM. pdf (accessed December 11, 2018).
MeteoSwiss (2016b). Documentation of MeteoSwiss Grid-Data Products, Monthly and Yearly Precipitation: RhiresM and RhiresY. Available at: https://www.meteoschweiz.admin.ch/content/dam/meteoswiss/de/service-und -publikationen/produkt/raeumliche-daten-niederschlag/doc/ProdDoc_Rhires M.pdf (accessed December 11, 2018).
Moles, A. T., Perkins, S. E., Laffan, S. W., Flores-Moreno, H., Awasthy, M., Tindall, M. L., et al. (2014). Which is a better predictor of plant traits: temperature or precipitation? J. Veg. Sci. 25, 1167–1180. doi: 10.1111/jvs.12190
Monteiro, J. M., Albuquerque, U. P., Lins Neto, E. M., Araújo, E. L., Albuquerque, M. M., and Amorim, E. L. (2006). The effects of seasonal climate changes in the Caatinga on tannin levels in Myracrodruon urundeuva (Engl.) Fr. All. and Anadenanthera colubrina (Vell.) brenan. Rev. Bras. Farmacogn. 16, 338–344. doi: 10.1590/S0102-695X2006000300010
Moore, J. P., Vicré-Gibouin, M., Farrant, J. M., and Driouich, A. (2008). Adaptations of higher plant cell walls to water loss: drought vs desiccation. Physiol. Plant 134, 237–245. doi: 10.1111/j.1399-3054.2008.01134.x
Morecroft, M. D., and Paterson, J. S. (2006). “Effects of temperature and precipitation changes on plant communities,” in Plant Growth and Climate Change, eds J. I. L. Morison, and M. D. Morecroft, (Oxford: Blackwell Publishing Ltd), 146–164. doi: 10.1002/9780470988695.ch7
Mortvedt, J. J. (2000). “Bioavailability of micronutrients,” in Handbook of Soil Science, ed. M. E. Sumner, (Boca Raton, FL: CRC Press).
Niinemets, Ü (2001). Global-scale climatic controls of leaf dry mass per area, density, and thickness in trees and shrubs. Ecology 82, 453–469. doi: 10.1890/0012-9658(2001)082[0453:gsccol]2.0.co;2
Packham, J. R., Thomas, P. A., Atkinson, M. D., and Degen, T. (2012). Biological flora of the British Isles: Fagus sylvatica. J. Ecol. 100, 1557–1608. doi: 10.1111/j.1365-2745.2012.02017.x
Pardo, L. H., Templer, P. H., Goodale, C. L., Duke, S., Groffman, P. M., Adams, M. B., et al. (2006). Regional assessment of N saturation using foliar and root δ15N. Biogeochemistry 80, 143–171. doi: 10.1007/s10533-006-9015-9
Peppe, D. J., Royer, D. L., Cariglino, B., Oliver, S. Y., Newman, S., Leight, E., et al. (2011). Sensitivity of leaf size and shape to climate: global patterns and paleoclimatic applications. New Phytol. 190, 724–739. doi: 10.1111/j.1469-8137.2010.03615.x
Peuke, A. D., Schraml, C., Hartung, W., and Rennenberg, H. (2002). Identification of drought-sensitive beech ecotypes by physiological parameters. New Phytol. 154, 373–387. doi: 10.1046/j.1469-8137.2002.00400.x
Poorter, H., Niinemets, Ü, Poorter, L., Wright, I. J., and Villar, R. (2009). Causes and consequences of variation in leaf mass per area (LMA): a meta-analysis. New Phytol. 182, 565–588. doi: 10.1111/j.1469-8137.2009.02830.x
Poorter, H., and Remkes, C. (1990). Leaf area ratio and net assimilation rate of 24 wild species differing in relative growth rate. Oecologia 83, 553–559. doi: 10.1007/bf00317209
R Core Team (2015). R: A language and environment for statistical computing. Vienna: R Foundation for Statistical Computing.
Rautio, P., Fürst, A., Stefan, K., Raitio, H., and Bartels, U. (2016). “Part XII: sampling and analysis of needles and leaves,” in Manual on Methods and Criteria for Harmonized Sampling, Assessment, Monitoring and Analysis of the Effects of Air Pollution on Forests, Vol. 19, ed. UNECE ICP Forests Programme Co-ordinating Centre (Eberswalde: Thünen Institute of Forest Ecosystems).
Reich, P. B., Ellsworth, D. S., Walters, M. B., Vose, J. M., Gresham, C., Volin, J. C., et al. (1999). Generality of leaf trait relationships: a test across six biomes. Ecology 80, 1955–1969. doi: 10.1890/0012-9658(1999)080[1955:goltra]2.0.co;2
Remund, J., Rihm, B., and Huguenin−Landl, B. (2014). Klimadaten für die Waldmodellierung für das 20. und 21. Jahrhundert. Schlussbericht des Projektes im Forschungsprogramm Wald und Klimawandel. Birmensdorf: Swiss Federal Research Institute WSL.
Rihm, B., and Achermann, B. (2016). Critical Loads of Nitrogen and their Exceedances: Swiss Contribution to the Effects-Oriented work Under the Convention on Long-Range Transboundary Air Pollution (UNECE). Bern: Federal Office for the Environment.
Rowell, D. P., and Jones, R. G. (2006). Causes and uncertainty of future summer drying over Europe. Clim. Dyn. 27, 281–299. doi: 10.1007/s00382-006-0125-9
Saunders, W. M. H., and Williams, E. G. (1955). Observations on the determination of total organic phosphorus in soils. J. Soil Sci. 6, 254–267. doi: 10.1111/j.1365-2389.1955.tb00849.x
Schaub, M., Dobbertin, M., Kräuchi, N., and Dobbertin, M. K. (2011). Preface—long-term ecosystem research: understanding the present to shape the future. Environ. Monit. Assess 174, 1–2. doi: 10.1007/s10661-010-1756-1
Schleppi, P., Thimonier, A., and Walthert, L. (2011). Estimating leaf area index of mature temperate forests using regressions on site and vegetation data. For. Ecol. Manag. 261, 601–610. doi: 10.1016/j.foreco.2010.11.013
Sievering, H., Tomaszewski, T., and Torizzo, J. (2007). Canopy uptake of atmospheric N deposition at a conifer forest: part I - canopy N budget, photosynthetic efficiency and net ecosystem exchange. Tellus B Chem. Phys. Meteorol. 59, 483–492. doi: 10.1111/j.1600-0889.2007.00264.x
Stanturf, J. A. (2015). Future landscapes: opportunities and challenges. New For. 46, 615–644. doi: 10.1007/s11056-015-9500-x
Swain, T., and Hillis, W. E. (1959). The phenolic constituents of Prunus domestica. I.—The quantitative analysis of phenolic constituents. J. Sci. Food Agric. 10, 63–68. doi: 10.1002/jsfa.2740100110
Talkner, U., Meiwes, K. J., Potočić, N., Seletković, I., Cools, N., De Vos, B., et al. (2015). Phosphorus nutrition of beech (Fagus sylvatica L.) is decreasing in Europe. Ann. For. Sci. 72, 919–928. doi: 10.1007/s13595-015-0459-8
Teepe, R., Dilling, H., and Beese, F. (2003). Estimating water retention curves of forest soils from soil texture and bulk density. J. Plant Nutr. Soil Sci. 166, 111–119. doi: 10.1002/jpln.200390001
Thimonier, A., Graf Pannatier, E., Schmitt, M., Waldner, P., Walthert, L., Schleppi, P., et al. (2010). Does exceeding the critical loads for nitrogen alter nitrate leaching, the nutrient status of trees and their crown condition at Swiss long-term forest ecosystem research (LWF) sites? Eur. J. For. Res. 129, 443–461. doi: 10.1007/s10342-009-0328-9
Thimonier, A., Kull, P., Keller, W., Moser, B., and Wohlgemuth, T. (2011). Ground vegetation monitoring in Swiss forests: comparison of survey methods and implications for trend assessments. Environ. Monit. Assess 174, 47–63. doi: 10.1007/s10661-010-1759-y
Thomas, G. W. (1982). “Exchangeable cations,” in Methods of Soil Analysis, Part 2: Chemical and Microbiological Properties, Vol. 9, 2nd Edn. ed. A. L. Page, (Madison, WI: American Society of Agronomy), 159–165.
van der Linde, S., Suz, L. M., Orme, C. D. L., Cox, F., Andreae, H., Asi, E., et al. (2018). Environment and host as large-scale controls of ectomycorrhizal fungi. Nature 558, 243–248. doi: 10.1038/s41586-018-0189-9
van der Maaten, E. (2012). Climate sensitivity of radial growth in European beech (Fagus sylvatica L.) at different aspects in southwestern Germany. Trees 26, 777–788. doi: 10.1007/s00468-011-0645-8
Van Volkenburgh, E. (1999). Leaf expansion – an integrating plant behaviour. Plant Cell Environ. 22, 1463–1473. doi: 10.1046/j.1365-3040.1999.00514.x
Villar-Salvador, P., Uscola, M., and Jacobs, D. F. (2015). The role of stored carbohydrates and nitrogen in the growth and stress tolerance of planted forest trees. New For. 46, 813–839. doi: 10.1007/s11056-015-9499-z
Waldner, P., Thimonier, A., Graf Pannatier, E., Etzold, S., Schmitt, M., Marchetto, A., et al. (2015). Exceedance of critical loads and of critical limits impacts tree nutrition across Europe. Ann. For. Sci. 72, 929–939. doi: 10.1007/s13595-015-0489-2
Walthert, L., Graf, U., Kammer, A., Luster, J., Pezzotta, D., and Zimmermann, S. (2010). Determination of organic and inorganic carbon, δ13C, and nitrogen in soils containing carbonates after acid fumigation with HCl. J. Plant Nutr. Soil Sci. 173, 207–216. doi: 10.1002/jpln.200900158
Walthert, L., and Meier, E. S. (2017). Tree species distribution in temperate forests is more influenced by soil than by climate. Ecol. Evol. 7, 9473–9484. doi: 10.1002/ece3.3436
Walthert, L., Scherler, M., Stähli, M., Huber, M., Baltensweiler, A., Ramirez-Lopez, L. et al. (2015). Böden und Wasserhaushalt von Wäldern und Waldstandorten der Schweiz Unter Heutigem und Zukünftigem Klima (BOWA-CH). Schlussbericht des Projektes. Zürich: Eidg. Technische Hochschule ETH.
Walthert, L., and Schleppi, P. (2018). Equations to compensate for the temperature effect on readings from dielectric Decagon MPS-2 and MPS-6 water potential sensors in soils. J. Plant Nutr. Soil Sci. 181, 749–759. doi: 10.1002/jpln.201700620
Walthert, L., Zimmermann, S., Blaser, P., Luster, J., and Lüscher, P. (2004). Waldböden der Schweiz. Bern: Hep Verlag.
Wang, C., Zhou, J., Xiao, H., Liu, J., and Wang, L. (2017). Variations in leaf functional traits among plant species grouped by growth and leaf types in Zhenjiang, China. J. For. Res. 28, 241–248. doi: 10.1007/s11676-016-0290-6
Wang, N., Xu, S., Jia, X., Gao, J., Zhang, W., Qiu, Y., et al. (2013). Variations in foliar stable carbon isotopes among functional groups and along environmental gradients in China–a meta–analysis. Plant Biol. 15, 144–151. doi: 10.1111/j.1438-8677.2012.00605.x
Whitman, T., and Aarssen, L. W. (2010). The leaf size/number trade-off in herbaceous angiosperms. J. Plant Ecol. 3, 49–58. doi: 10.1093/jpe/rtp018
Wright, I. J., Reich, P. B., Westoby, M., Ackerly, D. D., Baruch, Z., Bongers, F., et al. (2004). The worldwide leaf economics spectrum. Nature 428, 821–827. doi: 10.1038/nature02403
Xu, F., Guo, W., Xu, W., Wei, Y., and Wang, R. (2009). Leaf morphology correlates with water and light availability: What consequences for simple and compound leaves? Prog. Nat. Sci. 19, 1789–1798. doi: 10.1016/j.pnsc.2009.10.001
Zhang, S., Zhang, Y., and Ma, K. (2016). The association of leaf lifespan and background insect herbivory at the interspecific level. Ecology 98, 425–432. doi: 10.1002/ecy.1649
Keywords: beech forest, drought stress, gradient analysis, leaf functional trait, tree nutrition
Citation: Salehi M, Walthert L, Zimmermann S, Waldner P, Schmitt M, Schleppi P, Liechti K, Ahmadi M, Zahedi Amiri G, Brunner I and Thimonier A (2020) Leaf Morphological Traits and Leaf Nutrient Concentrations of European Beech Across a Water Availability Gradient in Switzerland. Front. For. Glob. Change 3:19. doi: 10.3389/ffgc.2020.00019
Received: 10 July 2019; Accepted: 05 February 2020;
Published: 25 February 2020.
Edited by:
Zuoqiang Yuan, Institute of Applied Ecology (CAS), ChinaReviewed by:
Heloise Bastiaanse, United States Forest Service (USDA), United StatesZhili Liu, Northeast Forestry University, China
Copyright © 2020 Salehi, Walthert, Zimmermann, Waldner, Schmitt, Schleppi, Liechti, Ahmadi, Zahedi Amiri, Brunner and Thimonier. This is an open-access article distributed under the terms of the Creative Commons Attribution License (CC BY). The use, distribution or reproduction in other forums is permitted, provided the original author(s) and the copyright owner(s) are credited and that the original publication in this journal is cited, in accordance with accepted academic practice. No use, distribution or reproduction is permitted which does not comply with these terms.
*Correspondence: Anne Thimonier, YW5uZS50aGltb25pZXJAd3NsLmNo