 Christina E. Wierenga1*
 Amanda Bischoff-Grethe1
 Grace Rasmusson1
 Ursula F. Bailer1,2
 Laura A. Berner1
 Thomas T. Liu3
 Walter H. Kaye1
- 1Department of Psychiatry, University of California San Diego, La Jolla, CA, United States
- 2Division of Biological Psychiatry, Department of Psychiatry and Psychotherapy, Medical University of Vienna, Vienna, Austria
- 3Department of Radiology, University of California San Diego, La Jolla, CA, United States
The etiology of pathological eating in anorexia nervosa (AN) remains poorly understood. Cerebral blood flow (CBF) is an indirect marker of neuronal function. In healthy adults, fasting increases CBF, reflecting increased delivery of oxygen and glucose to support brain metabolism. This study investigated whether women remitted from restricting-type AN (RAN) have altered CBF in response to hunger that may indicate homeostatic dysregulation contributing to their ability to restrict food. We compared resting CBF measured with pulsed arterial spin labeling in 21 RAN and 16 healthy comparison women (CW) when hungry (after a 16-h fast) and after a meal. Only remitted subjects were examined to avoid the confounding effects of malnutrition on brain function. Compared to CW, RAN demonstrated a reduced difference in the Hungry − Fed CBF contrast in the right ventral striatum, right subgenual anterior cingulate cortex (pcorr < 0.05) and left posterior insula (punc < 0.05); RAN had decreased CBF when hungry versus fed, whereas CW had increased CBF when hungry versus fed. Moreover, decreased CBF when hungry in the left insula was associated with greater hunger ratings on the fasted day for RAN. This represents the first study to show that women remitted from AN have aberrant resting neurovascular function in homeostatic neural circuitry in response to hunger. Regions involved in homeostatic regulation showed group differences in the Hungry − Fed contrast, suggesting altered cellular energy metabolism in this circuitry that may reduce motivation to eat.
Introduction
The motivation to eat in humans is a complex process influenced by intrinsic mechanisms relating to hunger and satiety, and extrinsic mechanisms based on the appetitive incentive value of food (1). Eating disorders defy homeostatic drives, suggesting that pathological eating may result from a disruption in these mechanisms. Anorexia nervosa (AN) is characterized by severe food restriction leading to significantly low body weight along with an intense fear of gaining weight and a distorted body image (2). The etiology of pathological eating in AN remains poorly understood, though recent research has implicated neural substrates underlying altered reward processing (3–5), cognitive control (6–8), and interoception (9, 10).
Appetite regulation involves the integration of multiple physiological signals regulating energy balance with cognitive processes supporting motivation and reward. Homeostatic and hedonic brain regions, including the hypothalamus, amygdala, striatum, orbitofrontal cortex, insula, and anterior cingulate cortex (ACC), are tightly interconnected and form a network that controls feeding behavior (1, 11, 12). The hypothalamus, a homeostatic center, regulates metabolic processes, including hunger and food intake, with motivation-reward systems associated with the hedonic drive to eat (1, 11). The insula, a key area in the neural control of intrinsic homeostatic processes, serves as the primary gustatory and interoceptive region in the human cortex (13). The striatum is involved in anticipation and detection of reward (14). It is activated in response to hunger (1) and less so in response to satiety (15–17), suggesting that one of its roles, along with areas such as the insula, is to motivate eating (17). The ventromedial prefrontal cortex (vmPFC), which includes the subgenual cingulate (sgACC; Brodmann area 25) and rostral ACC, acts as a visceromotor area (18–20) and governs the hypothalamus, amygdala, and insula. Together in a coordinated effort, these brain regions interpret the metabolic state of an individual and regulate appetite, motivation, and reward processing (11).
Cerebral blood flow (CBF) is tightly coupled with brain metabolism underlying cognition by increasing local delivery of oxygen and glucose to support neural function and remove metabolic by-products (21). This hemodynamic neurovascular coupling ensures a strong increase of CBF and neuronal glucose uptake with enhanced neural activity (22). Thus, CBF is an indirect marker of neuronal function and is most commonly measured with positron emission tomography (PET) 15O-labeled water, single-photon emission tomography (SPECT), and more recently, arterial spin labeling (ASL) functional magnetic resonance imaging (fMRI). Hunger and food intake are associated with localized changes in CBF. In healthy adults, PET 15O-labeled water studies reveal hunger increases CBF in homeostatic and gustatory brain regions including the hypothalamus, insula, striatum, ACC, amygdala, limbic/paralimbic regions (orbitofrontal cortex, parahippocampal gyrus, and hippocampus), thalamus, precuneus, and cerebellum (1, 12). Food intake, in contrast, produces significant decreases in CBF in several regions including the thalamus, insula, parahippocampal gyrus, temporal cortex, and cerebellum (11, 15, 23) and increases CBF in the prefrontal cortex (1, 12, 15, 16), which is thought to reflect inhibitory effects on the hypothalamus to promote the termination of a meal. Alterations in this pattern of increased neural function when hungry and generally decreased neural function when satiated may contribute to aberrant food intake regulation in eating disorders.
Recent evidence suggests homeostatic influences on reward processing may be altered in AN, which may contribute to disordered eating. Hunger and satiety have powerful effects on reward and inhibitory processes. Hunger makes rewards more enticing, and satiety increases self-control in healthy adults (24). Imaging studies report an altered role of striatal processes in the reward modulation of hunger or eating in AN, although the mechanisms remain to be fully elucidated (3, 4). Decreased sensitivity to the motivational drive of hunger may explain the ability of individuals with AN to restrict food when emaciated and may implicate dysfunction of the homeostatic control system in AN.
The majority of studies examining cerebral perfusion in ill AN compared to controls report hypoperfusion at rest in regions of the gustatory/homeostatic circuit (25–28). Findings in recovered AN are more discrepant, with one SPECT study reporting hypoperfusion in restricting-type AN (RAN) (29), and other ASL studies of weight-restored (30) and remitted AN (31) reporting no regional differences in CBF. The heterogeneity in methods used to quantify CBF may contribute to these discrepant findings, with higher perfusion reported in ASL than SPECT (32, 33) images. Few studies have controlled for hunger/satiety when measuring brain metabolism in AN; thus, the influence of homeostatic signaling on CBF in AN remains poorly understood (26, 34).
The purpose of this study was to determine whether women with a prior history of AN have a diminished CBF response when hungry, suggesting that altered homeostatic regulation might contribute to reduced motivation to eat in AN. This study used pulsed ASL fMRI and a region of interest analysis to investigate differential CBF response at rest in healthy comparison women (CW) and RAN when hungry (after a 16-h fast) and after a meal. We examined remitted subjects to avoid the confounding effects of malnutrition on neural function. We hypothesized that RAN would show less difference in CBF between hungry and fed states than CW in homeostatic and hedonic brain regions supporting feeding behavior. A better understanding of physiological changes in AN in response to hunger and satiety could provide a brain-specific marker relevant to treatment and outcome.
Materials and Methods
Participants
Twenty-one RAN women (13 pure restricting subtype, 8 who also endorsed purging) were compared (Table 1) to 16 age- and weight-matched healthy CW. Remittance was defined (35) as maintaining a weight above 85% of average body weight, regular menstrual cycles, and no binge eating, purging, or restrictive eating patterns for at least 1 year prior to the study. Current and lifetime (Table S1 in Supplementary Material) comorbid DSM-IV Axis I disorders were assessed using either the Structured Clinical Interview for DSM-IV Axis I disorders [SCID-I (36): 8 RAN, 8 CW] or the Mini International Neuropsychiatric interview [M.I.N.I. (37): 13 RAN, 8 CW]. Eating disorder diagnosis was established using Module H of the SCID. The M.I.N.I. has been validated against the full Structured Clinical Interview for DSM diagnoses (SCID-P) and is a more time-efficient alternative to the SCID-P (37). No participants had a current DSM-IV Axis I diagnosis or took psychotropic medication within 3 months prior to the study; a history of alcohol or drug abuse or dependence 3 months prior to study; medical or neurological concerns; or conditions contraindicative to MRI. The study and the protocol were reviewed and approved by the Institutional Review Board of the University of California San Diego. All research participants provided written informed consent.
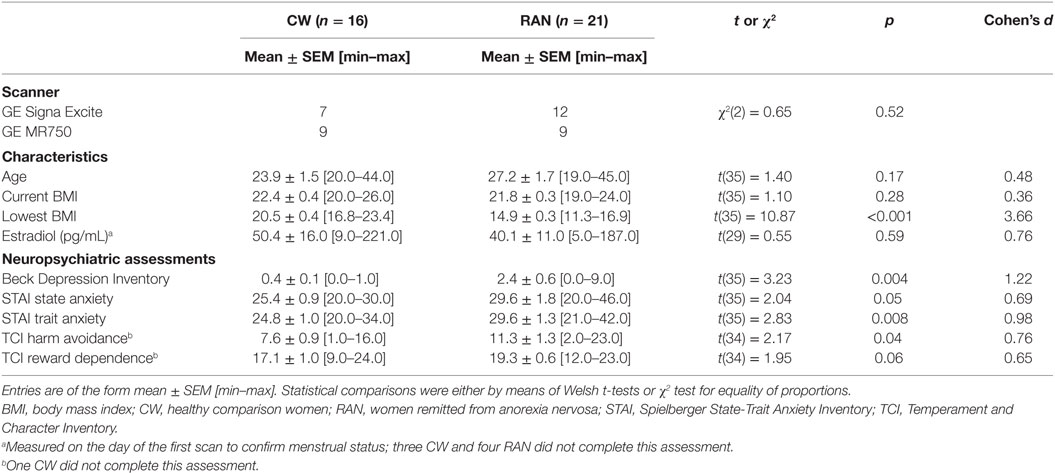
Table 1. Participant demographics and characteristics.
Assessments
Current symptoms were assessed using the State-Trait Anxiety Inventory (37–39), the Temperament and Character Inventory (37, 39), the Beck Depression Inventory (40, 41), and the Eating Disorders Inventory (41). Participants were studied within the first 10 days (early follicular phase) of their menstrual cycle based on their self-report. At 1:30 p.m. on the day prior to the first scan, blood samples were drawn to measure baseline levels of estradiol in order to confirm participants were in the follicular phase of their menstrual cycle. Samples were not collected for three CW and three RAN. Participants also completed Likert-type scales rating anxiety and hunger ranging from 0 (not at all) to 7 (extreme) at 3:00 p.m. the day before a scan visit (baseline), and at 6:45 a.m. (awakening), 8:45 a.m. (pre-scan), and 11:00 a.m. (post-scan) the day of a scan visit.
Experimental Design
Participants completed a resting-state whole-brain pulsed arterial spin labeling (pASL) MR scan on two visits, 24 h apart. For the hungry state, participants fasted for 16 h (i.e., starting at 4 p.m. the previous day, with ad libitum water permitted) prior to the scan session. During the fed state, participants consumed standardized meals on the day prior to study and a standardized breakfast [containing 30% of overall, individualized, total daily caloric needs calculated as 30 kcal/kg body weight, and averaging approximately 450–500 kcal, with a macronutrient distribution of 53% carbohydrates, 32% fat, and 15% protein (15)] 2 h prior to the 9 a.m. scan session. Participants were instructed to select food items that represented their typical breakfast, and study staff ensured the meal met the above macronutrient distribution. For the entire study, subjects were housed and provided meals by the UCSD Clinical & Translational Research Institute to ensure 100% compliance. The visit order was randomized across participants, and imaging data were collected on one of two 3-T GE scanners in the early follicular phase.
MRI Protocol
Resting brain blood perfusion was measured with pASL using a modified flow-sensitive alternating inversion recovery sequence with both presaturation pulses and PICORE QUIPSS 2 post-inversion saturation pulses and a spiral readout with four interleaves to reduce signal dropout due to susceptibility effects (42). Imaging data were collected on one of two scanners with an 8-channel head coil: a 3-T GE Signa HDx (GE Medical Systems, Milwaukee, WI, USA), or, due to a scanner upgrade, a 3-T GE Discovery MR 750 (GE Medical Systems, Milwaukee, WI, USA). Imaging parameters of the ASL scan for both systems were: 22 cm × 22 cm field of view, a 64 × 64 matrix, 3.2 ms echo time, 2,500 ms repetition time, post-saturation and inversion times of TI1 = 600 ms and TI2 = 1,600 ms, tag thickness 10 cm, tag to proximal slice gap 1 cm, 20 5 mm axial slices, and 40 volumes for 20 tag + control image pairs (43). A scan with the 90° excitation pulse turned off for the first eight repetitions was acquired to obtain the equilibrium magnetization of cerebrospinal fluid (CSF; a 36-s scan with TR = 4 s, TE = 3.4 ms, NEX = 9). The CSF signal was used to estimate the equilibrium magnetization of blood, which in turn was used to convert the perfusion signal into calibrated CBF units (mL/100 g tissue/min). A 32-s minimum contrast scan was acquired using an eight-shot acquisition with TR = 2,000 ms, TE = 11 ms, NEX = 2 to estimate the combined transmit and receive coil inhomogeneities (44). The two images were averaged to create the minimum contrast image. The ASL image was then divided by the minimum contrast image to remove the effect of coil inhomogeneity during the CBF quantification step (45). High-resolution T1-weighted FSPGR anatomical images (Signa HDx: TR = 7.7 ms, TE = 2.98 ms, flip angle = 8°, 192 × 256 matrix, 172 1 mm sagittal slices; MR 750: TR = 8.1 s, TE = 3.17 ms, flip angle = 8°, 256 × 256 matrix, 172 1 mm sagittal slices) were obtained for subsequent spatial normalization and activation localization. Multisite imaging studies suggest that inter-participant variance far outweighs site or magnet variance (46–48). However, to control for potential differences due to magnet hardware, groups were balanced across magnets (Table 1), each participant was scanned on the same scanner model for both imaging visits, and scanner was included as a covariate in group analyses.
MRI Preprocessing
Image processing was performed with Analysis of Functional NeuroImages (AFNI1) (49), FMRIB Software Library2 (FSL, Oxford, UK) (50), and locally created MatLab scripts. Each ASL dataset was reconstructed using the SENSE algorithm (51, 52) to reduce sensitivity to the modulations that occur between shots caused by physiological fluctuations or motion. An automated MatLab script was used to preprocess the ASL data using AFNI and FSL tools. The ASL time series was coregistered to the middle time point to minimize the effects of participant motion. For each subject, a mean ASL image was formed from the average difference of the control and tag images using surround subtraction to create an uncorrected perfusion time series, and slice timing delays were accounted for, making the inversion time (TI2) slice specific (53). This mean ASL image was then converted to absolute units of CBF (mL/100 g tissue/min) using an estimate of the equilibrium magnetization of CSF as a reference signal (54). This procedure resulted in a calibrated perfusion value for each voxel. Skull stripping of the high-resolution T1-weighted image was performed using Brain Surface Extractor (55, 56), shown to outperform other methods (57). Scans were manually edited to remove residual non-brain material when necessary. Tissue segmentation was performed using FSL’s Automated Segmentation Tool (FAST) algorithm to define CSF, gray matter (GM), and white matter (WM) regions. The high-resolution T1-weighted image and partial volume segmentations were registered to ASL space, and partial volume segmentations were downsampled to the resolution of the ASL data.
Corrections for Partial Volume Effects
To correct the CBF measures for partial volume effects and ensure that CBF values were not influenced by known decreased perfusion in WM or increased volume of CSF (58, 59), we used the method previously reported by Johnson and colleagues (60). These calculations assume that CSF has 0 CBF and that CBF in GM is 2.5 times greater than that in WM. The following formula was used to compute partial volume corrected CBF signal intensities: CBFcorr = CBFuncorr/(GM + 0.4 × WM). CBFcorr and CBFuncorr are corrected and uncorrected CBF values, respectively. GM and WM are GM and WM partial volume fractions, respectively. Information from the high-resolution structural image and the FSL FAST was used to determine the tissue content of each perfusion voxel. Using AFNI, a 4.0 -mm full-width, half-maximum Gaussian filter was applied to the CBFcorr data. Voxels with negative intensities were replaced with 0 (61). CBFcorr data were registered to the MNI-152 atlas using FMRIB’s Non-linear Image Registration Tool, part of FSL and resampled to a 3 mm × 3 mm × 3 mm resolution grid. Data were then screened for data quality, and outlying values deviating by more than 3 SDs of the mean were eliminated.
Definition of Search Regions of Interest
Restricting the search space to a small number of a priori ROIs is recommended for smaller clinical samples to improve power and reduce an inflated false discovery rate (62). Four bilateral ROIs associated with homeostatic regulation were selected based on prior findings (1, 11, 12) and included the hypothalamus, ventral striatum (VST), vmPFC, and insula (Figure S1 in Supplementary Material). The VST was based on known functional distinctions (63, 64) and was defined as the nucleus accumbens extending into the rostroventral caudate and ventrolateral putamen. The vmPFC was based on the Harvard-Oxford atlas and was composed of the rostral ACC, known to project to the limbic striatum (65) and subcallosal cortex (aka, sgACC). We distinguished rostral from caudal ACC by drawing a 45° line from the anterior commissure as described by Yucel et al. (66). The insula mask from the Harvard-Oxford atlas was used in its entirety. The hypothalamus was manually traced based on prior methods (67).
MRI Statistical Analyses
To investigate whether groups differ in the magnitude of CBF change when hungry versus fed, a difference measure (Hungry − Fed) was calculated for each individual. Student’s t-tests using AFNI’s 3dttest++ with the −Clustsim option were used to examine group differences in the relative change in CBF between the hungry and fed conditions within the VST, ACC, insula, and hypothalamus ROIs. Each ROI, with the exception of the hypothalamus, was treated as a search region. The 3dttest++ program performs randomization of the voxel-wise t-tests and then feeds these randomized t-statistic maps into 3dClustSim directly for cluster-size threshold determination without any spatial model for the autocorrelation function (ACF) and is the approach recommended by the AFNI group (68) to address the problem of inflated false-positive rates in prior software versions (69). A peak voxel of p < 0.001 with a cluster threshold of p < 0.05 was required for significance. At the ROI level, the required minimum cluster size was 27 µL (1 contiguous voxel) for the VST, 81 µL (3 contiguous voxels) for the vmPFC, and 81 µL (3 contiguous voxels) for the insula. Due to the small size of the hypothalamus, whole-ROI Hungry − Fed CBF was calculated for each subject, and these values were submitted to a Student’s t-test. A secondary exploratory whole-brain voxel-wise group comparison was also conducted. At the whole-brain level, a minimum cluster volume of 702 µL (26 contiguous voxels) was required to correct for multiple comparisons at p < 0.05 corresponding to a voxel-level threshold of p < 0.001.
Exploratory Associations with Clinical Variables
Mean CBF was extracted from significant clusters resulting from the between group t-test on the within-subject Hungry − Fed contrast. Within the RAN and CW groups, exploratory Huber robust regressions (70), Bonferroni corrected to control for family-wise error, were conducted in R to examine the relationship of pre-scan hunger ratings and CBF during the Hungry and Satiated visits within each ROI. Secondary analysis examined the relationship of CBF with other clinical variables [harm avoidance, state anxiety, trait anxiety, depression, age, current body mass index (BMI), and for RAN only, lowest post-pubertal BMI].
Results
Demographics and Baseline Clinical Assessments
Participants did not differ in terms of age or BMI (Table 1). Using standardized assessment instruments (5, 35), RAN had elevated levels of depression (though not clinically significant), trait anxiety, and harm avoidance relative to CW on admission to the study.
Self-Report Assessments when Hungry or Satiated
At the time of scan, RAN reported greater current anxiety on a 7-point Likert-type scale when hungry or satiated relative to CW (Figure 1A). All participants reported greater hunger during the Hungry condition relative to the Satiated condition (Figure 1B).
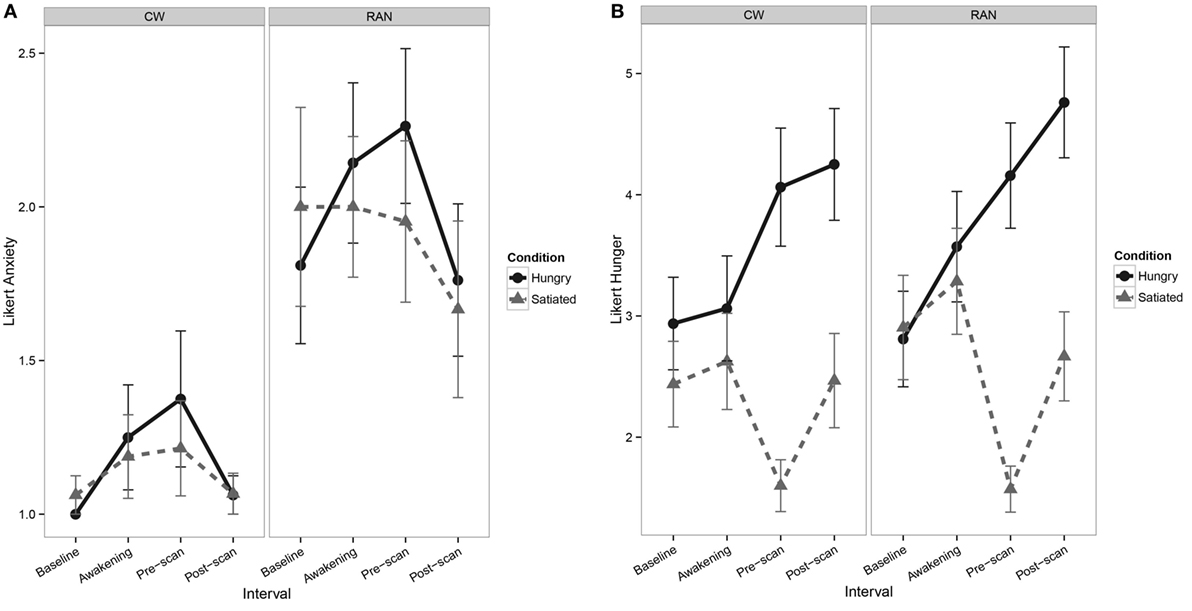
Figure 1. Line graphs depicting self-report Likert-type visual analog scale values. (A) Line graph of pre- and post-scan self-report measures of current anxiety show a main effect of Group [F(1,35) = 8.1, p = 0.007], with RAN reporting greater anxiety relative to CW [z = 2.56, p = 0.010] and interval [F(1,100) = 6.6, p = 0.011], although post hocs were not statistically significant. No main effect of Visit or any interactions of Group, Visit, and Interval were found. (B) Line graphs of pre- and post-scan self-report measures of hunger show a main effect of Visit [F(1,35) = 138.1, p = < 0.001], with participants reporting greater hunger in the Hungry condition relative to the Satiated condition [z = 6.04, p < 0.001], and a main effect of Interval [F(1,101) = 12.8, p < 0.001], although post hocs were not statistically significant. No main effect of Group or any interactions of Group, Visit, and Interval were found. CW, healthy comparison women; RAN, women remitted from anorexia nervosa.
ROI Analysis
Because statistical tests of group differences in Hungry − Fed CBF evaluated a priori hypotheses, we report all results and indicate whether or not the significant clusters survived adjustment to p-values for the small number of statistical tests performed (71, 72). Effect sizes are provided in addition to p-values (magnitude of d: small 0.2, medium 0.5, and large 0.8) (73). Within our ROI search regions, significant group differences in the Hungry − Fed CBF contrast measure were found in the right VST and right subgenual ACC (pcorr < 0.05), and in the left posterior insula (punc < 0.05) (Figure 2; Table 2). CW had greater CBF when hungry versus fed, whereas RAN had reduced response when hungry versus fed. No group differences were detected in the hypothalamus.
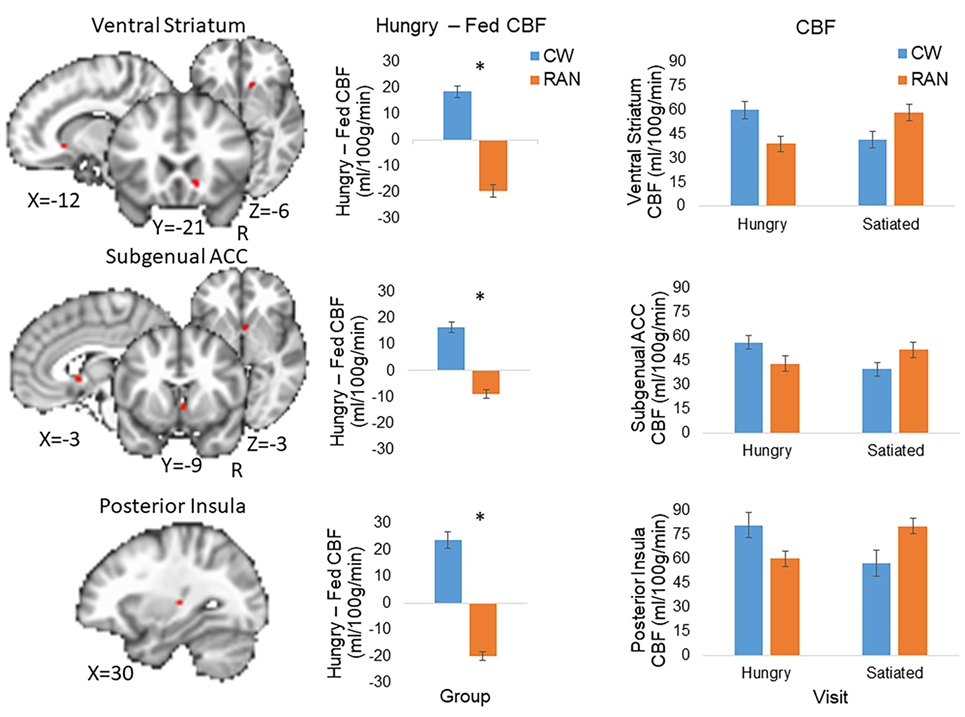
Figure 2. Altered CBF response to hunger in RAN. Student’s t-test results revealed between group differences in the Hungry − Fed contrast within regions of interest (voxel-wise threshold p < 0.001, cluster size corrected for multiple comparisons at p < 0.05). Error bars represent the SE for each group; *p < 0.05. Statistical maps are overlaid onto the MNI152 Harvard-Oxford Atlas 3 mm standard brain. CW, healthy comparison women; RAN, women remitted from anorexia nervosa; VST, ventral striatum; ACC, anterior cingulate cortex; CBF, cerebral blood flow; R, right.
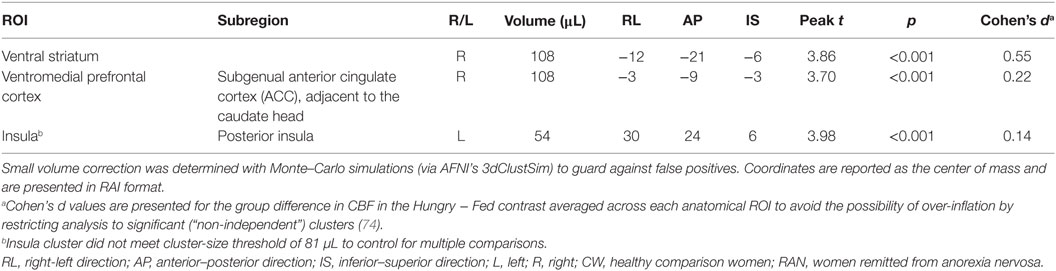
Table 2. T-test results within regions of interest demonstrating a group difference in the Hungry − Fed contrast for cerebral blood flow (CBF).
Voxel-Wise Analysis
Exploratory whole-brain voxel-wise analysis (voxel-wise threshold p < 0.001, cluster size >702 μL corrected for multiple comparisons at p < 0.05) did not detect any significant group differences in the Hungry − Fed CBF contrast.
Relation to Other Clinical Variables
Huber robust regression analysis revealed that greater pre-scan hunger ratings were associated with decreased CBF in the left insula (t = −2.67, p = 0.008) only in RAN when hungry, Bonferonni corrected for 2 conditions × 3 regions of interest (Figure 3; Table S2 in Supplementary Material). The interaction of the regression slopes for hunger ratings and insula CBF when hungry with group trended toward significance [F(2,36) = 3.2, p = 0.054], raising the possibility that this difference between RAN and healthy controls was driven by the hungry RAN women, which might reflect a disconnect between the hunger sensation and brain response in AN. None of the secondary analyses between CBF and other clinical variables reached significance after controlling for multiple comparisons (Table S2 in Supplementary Material).
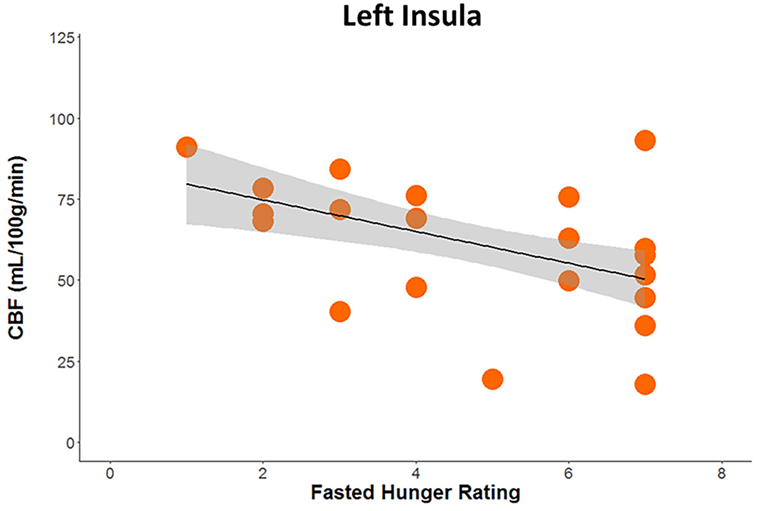
Figure 3. Plot demonstrating results of robust regression depicting the association between pre-scan hunger ratings and cerebral blood flow when hungry within the left posterior insula in women remitted from anorexia nervosa (p < 0.05, Bonferroni corrected for multiple comparisons).
Discussion
This represents the first study to show that women remitted from AN have aberrant CBF at rest in homeostatic and hedonic food motivation pathways in response to hunger. Using pulsed ASL, we reproduced previous PET findings (12) in a larger sample of healthy women and found that hunger was associated with increased CBF in regions involved in appetite regulation, including the right VST, subgenual ACC, and left posterior insula. In contrast, RAN showed reduced CBF when hungry relative to when satiated in these same regions. These regions have been implicated consistently in studies of AN (3–10). Interestingly, there was a suggestion that for the RAN group, diminished CBF in the left posterior insula when hungry was associated with increased ratings of hunger. Why hunger in RAN may be associated with reduced CBF in regions responsible for valuating rewarding and motivated behavior is not well understood, but this aberrant response may shed light on why RAN lack the ability to appropriately evaluate food reward or to eat when hungry.
Findings in RAN of a decreased Hungry − Fed CBF response in the posterior insula (uncorrected), VST, and subgenual ACC, and associations between diminished CBF in the posterior insula when hungry and increased hunger ratings further support the potential role of the insula in integrating homeostatic information (e.g., hunger) and reward value with feeding behavior (75). The dorsal posterior insula is the primary interoceptive representation of the body’s homeostatic sensations, including hunger (13). This information is re-represented in the anterior insula, where interoceptive information is integrated with motivational and emotional processes, supporting feeling states, and giving rise to conscious visceral perception of homeostatic states (76, 77). Clinically, patients with AN report poor interoceptive awareness (78) and demonstrate interoceptive prediction errors during meal anticipation (10). Disturbed interoceptive awareness of hunger could play a role in assessing body states and responding to hunger cues. Findings of altered CBF in the posterior insula support the notion that AN might suffer from a fundamentally and physiologically altered sense of physical state, and that brain circuits may misperceive signals regarding hunger (78). This is consistent with several fMRI studies reporting altered insula function in RAN (9, 79, 80).
Between group CBF differences in the striatum, with reduced Hungry − Fed CBF for RAN, support the notion that alterations in metabolic function when hungry may contribute to food avoidance and/or impaired reward learning in AN (20). Many individuals with AN respond in a fearful or avoidant manner to salient rewards, such as highly palatable food, rather than experiencing pleasure, and computational modeling studies show increased learning from punishment as opposed to reward in RAN (81). We have previously proposed that individuals with AN may have an intrinsic sensitivity to coding salient stimuli, such as food, as aversive or risky, rather than rewarding, that overrides the influences of hunger (82). Abnormalities of structure and function within the extended “visceromotor” network (involving vmPFC and anatomically related limbic, striatal, thalamic, and basal forebrain structures) impair this network’s roles in cognitive processes such as reward learning and may dysregulate visceral, behavioral, and cognitive responses to emotional stimuli and stress (20). Prior fMRI studies of reward processing in RAN show underactive reward valuation circuitry (e.g., VST) to immediate salient stimuli when hungry (3, 5, 82). Our results of CBF differences at rest suggest that food restriction in AN may be due to difficulty in appropriately binding, scaling, or discriminating emotionality and reward in response to salient stimuli due to homeostatic dysfunction. Our data, and those of others (83) suggest that AN can sense their hunger state when actively ill and recovered, and they can accurately assess palatability of foods and sweet taste (79, 84). Consistent with prior findings of an aberrant relationship between ghrelin signaling and neural reward response in AN, our data raise the intriguing hypothesis that AN may have difficulty translating homeostatic signals associated with energy balance into motivated eating behavior, and this may not normalize in recovery. In other words, while RAN appear to experience hunger accurately, it is possible that hunger is less effective at stimulating brain mechanisms supporting the adaptive drive to eat. This suggests that individuals who recover may rely on other strategies to motivate eating (e.g., cognitive control or external guides).
What is the meaning of altered CBF in this study? Because vascular supply is varied locally in the brain in correspondence with local variations of functional activity, CBF is generally thought to be a surrogate marker of energy delivery and use that is coupled with neuronal activity and metabolism. ASL measures CBF in the capillary bed, and thus changes in CBF may also reflect the function of astrocytes, given their critical role in mediating the coupling of neuronal activity with metabolic and vascular responses (85). Astrocytic end feet wrap around the endothelium of capillaries and via this contact, they can influence CBF and control the transport of nutrients, such as glucose, in and out of the brain to ensure proper brain homeostasis and support neurons metabolically (85, 86). Recent evidence suggests astrocytes, similar to neurons, respond directly to multiple nutrient and endocrine signals and, in turn, contribute to adjusting central nervous system control of systemic metabolism according to nutrient availability (87). This raises the question of whether our findings reflect an aberrant neural-astrocyte response to peptides, enzymes, or metabolic hormones that disrupt energy balance or hunger signaling in AN. Although we were unable to collect plasma glucose, insulin, or hormones (e.g., leptin, ghrelin) on a sufficient number of participants, there is evidence in women with AN of altered fMRI activation of neural circuits involved in food motivation that is associated with abnormal levels of appetite-regulating hormones (88).
Decreased CBF at rest in RAN when hungry compared to when satiated may contribute to the decreased fMRI blood oxygenation level dependent (BOLD) response to food and money rewards associated with hunger in AN (3, 5). Generally interpreted as an indirect qualitative measure of neuronal activity, the fMRI BOLD signal reflects local changes in deoxyhemoglobin content, which in turn exhibits a complex dependence on changes in CBF, cerebral blood volume, and cerebral metabolic rate of oxygen consumption (22). Of these quantities, CMRO2 is thought to be most tightly linked to neural activity, reflecting the notion that neurons necessarily expend energy to accomplish their work (89). The positive BOLD response observed in most fMRI experiments reflects the fact that CBF increases relatively more than CMRO2, so that local capillary and venous blood are more oxygenated during increased brain activity. In general, the actual amplitude of the BOLD response reflects a delicate balance between the relative increases in CBF and CMRO2 (21). Thus, decreased BOLD response to hunger in AN may reflect impaired CBF response and/or altered CBF/CMRO2 coupling or a decrease in neural activity with normal CBF/CMRO2 coupling. However, without a quantitative estimate of functional changes in CMRO2, which can be obtained by simultaneously acquiring functional BOLD and CBF data during a cognitive task and a hypercapnic challenge (a.k.a., calibrated fMRI) (90), the impact of CBF on BOLD response in AN is not well understood.
This study has several strengths, including quantification of CBF, rigorous control of hunger and satiety, and studying well-characterized remitted subjects to avoid potential confounds of malnutrition. While 15O-labeled water PET is the gold standard for CBF measurement, ASL fMRI has been shown to be as reliable a technique (91, 92) with equivalent accuracy and precision and has many advantages over this invasive method that may make it preferable in clinical research. CBF measured with ASL refers to the rate of delivery of arterial blood to the capillary bed in brain tissue and is typically quantified in milliliters of blood per 100 g of tissue per minute (22). ASL is a non-invasive and reliable fMRI technique (58) that magnetically labels arterial water in the brain and uses it as an endogenous tracer to measure CBF. Because ASL fMRI provides a quantitative measure of CBF in the capillary bed, rather than a relative measure such as the venous BOLD fMRI signal, it has the potential to more accurately estimate the magnitude and location of neural function (21) and is less susceptible to artifactual image degradation from surrounding bony sinuses and poor spatial resolution that limits other methods (93).
Despite these strengths, limitations are important to acknowledge. ASL fMRI does not provide a direct measure of neuronal activity, and limitations in many of the existing pulse sequences (e.g., sensitivity to transit time effects, limited brain coverage, and low spatial resolution) may account for some of the discrepancies across studies. To limit multiple comparisons, we restricted our primary analyses a priori ROIs; it is important to recognize these regions are part of larger valuation and salience circuits involving complex cortical–striatal processes. In contrast to prior findings (15, 16), we did not find any regions of increased CBF for satiety in the control women. Methodological differences between studies could account for discrepant findings. For example, we fed participants 30% of their individualized daily caloric needs whereas others (12) have fed 50% of daily resting energy expenditure, and our participants fasted for 16 versus 36 h in other studies (15, 16). However, our methods may be more ecologically valid, as others (12) induced rather extreme states of hunger and satiation. Because difference contrasts can be difficult to interpret, we also conducted a 2 group × 2 condition linear mixed-effect model in R. Although we replicated our t-test results at a voxel-level p < 0.01 and cluster-corrected p < 0.05, results did not survive at the recommended per-voxel p-threshold of 0.001 using AFNI’s new ACF modeling approach, suggesting the study may not be sufficiently powered at the group level for this stringent correction. Follow-up studies with larger cohorts are certainly needed. Finally, without premorbid data we cannot determine whether low CBF in response to hunger is a vulnerability factor/biomarker for weight loss or whether it reflects a scar of malnutrition. This is the first study to examine the effects of hunger and satiety on CBF in RAN.
Clinical Implications
Obesity has long been known to result from dysfunction of key biochemical, neural, and behavioral components of the homeostatic control system (94), emphasizing the physiological importance of this system in eating behavior and weight. Our data, and others, are beginning to reveal that dysfunction of the homeostatic control system may also contribute to AN. These findings offer new targets for psychological interventions. For example, developing strategies that incorporate an understanding of altered homeostatic sensitivity into behavioral management may improve treatment compliance and outcome by enhancing insight and reducing reliance on physiological signals to guide eating behavior.
Conclusion
The capacity to adjust food intake in response to changing energy requirements is essential for survival. Eating behavior is modulated by metabolic and ingestive factors in the service of homeostasis, and current results suggest possible metabolic dysfunction associated with homeostatic regulation may explain disordered eating in AN.
Ethics Statement
The study was conducted in compliance with the Code of Ethics of the World Medical Association (Declaration of Helsinki) and according to the IRB regulations of the University of California, San Diego, and written informed consent was obtained.
Author Contributions
The authors made substantial contributions to the conception or design of the work (CW, A-BG, UB, LB, and WK) or the acquisition (GR), analysis (CW), or interpretation of data (CW, A-BG, UB, LB, TL, and WK) for the work; drafting the work (CW) or revising it critically for important intellectual content (A-BG, GR, UB, LB, TL, and WK); provided final approval of the version to be published (CW, A-BG, GR, UB, LB TL, and WK); and agreed to be accountable for all aspects of the work in ensuring that questions related to the accuracy or integrity of any part of the work are appropriately investigated and resolved (CW, A-BG, GR, UB, LB, TL, and WK).
Conflict of Interest Statement
The authors declare that the research was conducted in the absence of any commercial or financial relationships that could be construed as a potential conflict of interest.
Funding
This study was supported by NIH grants R01-MH042984-17A1, R01-MH042984-18S1, and the Price Foundation.
Supplementary Material
The Supplementary Material for this article can be found online at http://journal.frontiersin.org/article/10.3389/fnut.2017.00032/full#supplementary-material.
Footnotes
References
1. Hinton E, Parkinson JA, Holland A, Arana F, Roberts A, Owen A. Neural contributions to the motivational control of appetite in humans. Eur J Neurosci (2004) 20(5):1411–8. doi:10.1111/j.1460-9568.2004.03589.x
2. American Psychiatric Association. Diagnostic and Statistical Manual of Mental Disorders (DSM-V). 5th ed. Washington, DC: American Psychiatric Association (2013).
3. Holsen L, Lawson E, Blum K, Ko E, Makris N, Fazeli P, et al. Food motivation circuitry hypoactivation related to hedonic and nonhedonic aspects of hunger and satiety in women with active anorexia nervosa and weight-restored women with anorexia nervosa. J Psychiatry Neurosci (2012) 37(5):322–32. doi:10.1503/jpn.110156
4. Frank G. Altered brain reward circuits in eating disorders: chicken or egg? Curr Psychiatry Rep (2013) 15(10):396. doi:10.1007/s11920-013-0396-x
5. Wierenga C, Bischoff-Grethe A, Melrose A, Irvine Z, Torres L, Bailer U, et al. Hunger does not motivate reward in women remitted from anorexia nervosa. Biol Psychiatry (2015) 77(7):642–52. doi:10.1016/j.biopsych.2014.09.024
6. Lock J, Garrett A, Beenhakker J, Reiss A. Aberrant brain activation during a response inhibition task in adolescent eating disorder subtypes. Am J Psychiatry (2011) 168(1):55–64. doi:10.1176/appi.ajp.2010.10010056
7. Oberndorfer T, Kaye W, Simmons A, Strigo I, Matthews S. Demand-specific alteration of medial prefrontal cortex response during an inhibition task in recovered anorexic women. Int J Eat Disord (2011) 44(1):1–8. doi:10.1002/eat.20750
8. Zastrow A, Kaiser S, Stippich C, Walthe S, Herzog W, Tchanturia K, et al. Neural correlates of impaired cognitive-behavioral flexibility in anorexia nervosa. Am J Psychiatry (2009) 166(5):608–16. doi:10.1176/appi.ajp.2008.08050775
9. Kerr K, Moseman S, Avery J, Bodurka J, Zucker N, Kyle Simmons W. Altered insula activity during visceral interoception in weight-restored patients with anorexia nervosa. Neuropsychopharmacology (2016) 41(2):521–8. doi:10.1038/npp.2015.174
10. Khalsa SS, Craske MG, Li W, Vangala S, Strober M, Feusner JD. Altered interoceptive awareness in anorexia nervosa: effects of meal anticipation, consumption and bodily arousal. Int J Eat Disord (2015) 48(7):889–97. doi:10.1002/eat.22387
11. Page K, Chan O, Arora J, Belfort-Deaguiar R, Dzuira J, Roehmholdt B, et al. Effects of fructose vs glucose on regional cerebral blood flow in brain regions involved with appetite and reward pathways. JAMA (2013) 309(1):63–70. Erratum in: JAMA (2013) 309(17):1773. doi:10.1001/jama.2012.116975
12. Tataranni PA, Gautier JF, Chen K, Uecker A, Bandy D, Salbe AD, et al. Neuroanatomical correlates of hunger and satiation in humans using positron emission tomography. Proc Natl Acad Sci U S A (1999) 96(8):4569–74. doi:10.1073/pnas.96.8.4569
13. Craig A. Interoception: the sense of the physiologial condition of the body. Curr Opin Neurobiol (2003) 13:500–5. doi:10.1016/S0959-4388(03)00090-4
14. Schultz W, Tremblay L, Hollerman JR. Reward processing in primate orbitofrontal cortex and basal ganglia. Cereb Cortex (2000) 10(3):272–84. doi:10.1093/cercor/10.3.272
15. Gautier J, Del Parigi A, Chen K, Salbe A, Bandy D, Pratley R, et al. Effect of satiation on brain activity in obese and lean women. Obes Res (2001) 9(11):676–84. doi:10.1038/oby.2001.92
16. Gautier J, Chen K, Salbe A, Bandy D, Pratley R, Heiman M, et al. Differential brain responses to satiation in obese and lean men. Diabetes (2000) 49(5):838–46. doi:10.2337/diabetes.49.5.838
17. Small D, Zatorre R, Dagher A, Evans A, Jones-Gotman M. Changes in brain activity related to eating chocolate: from pleasure to aversion. Brain (2001) 124(9):1720–33. doi:10.1093/brain/124.9.1720
18. Devinsky O, Morrell MJ, Vogt BA. Contributions of anterior cingulate cortex to behaviour. Brain (1995) 118(Pt 1):279–306. doi:10.1093/brain/118.1.279
19. Freedman LJ, Insel TR, Smith Y. Subcortical projections of area 25 (subgenual cortex) of the macaque monkey. J Comp Neurol (2000) 421:172–88. doi:10.1002/(SICI)1096-9861(20000529)421:2<172::AID-CNE4>3.3.CO;2-#
20. Price J, Drevets W. Neural circuits underlying the pathophysiology of mood disorders. Trends Cogn Sci (2012) 16(1):61–71. doi:10.1016/j.tics.2011.12.011
21. Brown G, Clark C, Liu T. Measurement of cerebral perfusion with arterial spin labeling. Part 2. Applications. J Int Neuropsychol Soc (2007) 13:526–38. doi:10.1017/S1355617707070634
22. Buxton R. Introduction to Functional Magnetic Resonance Imaging: Principles and Techniques, Second. New York: Cambridge University Press (2009).
23. Frank S, Linder K, Kullmann S, Heni M, Ketterer C, Cavusoglu M, et al. Fat intake modulates cerebral blood flow in homeostatic and gustatory brain areas in humans. Am J Clin Nutr (2012) 95(6):1342–9. doi:10.3945/ajcn.111.031492
24. Wang X, Dvorak R. Sweet future: fluctuating blood glucose levels affect future discounting. Psychol Sci (2010) 21(2):183–8. doi:10.1177/0956797609358096
25. Kojima S, Nagai N, Nakabeppu Y, Muranaga T, Deguchi D, Nakajo M, et al. Comparison of regional cerebral blood flow in patients with anorexia nervosa before and after weight gain. Psychiatry Res (2005) 140:251–8. doi:10.1016/j.pscychresns.2005.08.002
26. Naruo T, Nakabeppu Y, Deguchi D, Nagai N, Tsutsui J, Nakajo M, et al. Decreases in blood perfusion of the anterior cingulate gyri in anorexia nervosa restricters assessed by SPECT image analysis. BMC Psychiatry (2001) 1:2. doi:10.1186/1471-244X-1-2
27. Takano A, Shiga T, Kitagawa N, Koyama T, Katoh C, Tsukamoto E, et al. Abnormal neuronal network in anorexia nervosa studied with I-123-IMP SPECT. Psychiatry Res (2001) 107(1):45–50. doi:10.1016/S0925-4927(01)00093-2
28. Lask B, Gordon I, Christie D, Frampton I, Chowdhury U, Watkins B. Functional neuroimaging in early-onset anorexia nervosa. Int J Eat Disord (2005) 37(Suppl):S49–51; discussion S87–9. doi:10.1002/eat.20117
29. Rastam M, Bjure J, Vestergren E, Uvebrant P, Gillberg IC, Wentz E, et al. Regional cerebral blood flow in weight-restored anorexia nervosa: a preliminary study. Dev Med Child Neurol (2001) 43(4):239–42. doi:10.1017/S0012162201000457
30. Sheng M, Lu H, Liu P, Thomas B, McAdams C. Cerebral perfusion differences in women currently with and recovered from anorexia nervosa. Psychiatry Res (2015) 23(2):175–83. doi:10.1016/j.pscychresns.2015.02.008
31. Frank G, Bailer UF, Meltzer CC, Price J, Mathis C, Wagner A, et al. Regional cerebral blood flow after recovery from anorexia and bulimia nervosa. Int J Eat Disord (2007) 40(6):488–92. doi:10.1002/eat.20395
32. Takahashi H, Ishii K, Hosokaw C, Hyodo T, Kashiwagi N, Matski M, et al. Clinical application of 3D arterial spin-labeled brain perfusion imaging for Alzheimer disease: comparison with brain perfusion SPECT. AJNR Am J Neuroradiol (2014) 35(5):906–11. doi:10.3174/ajnr.A3780
33. Iwanga T, Harada M, Kubo H, Funakoshi Y, Kunikane Y, Matsuda T. Operator-bias-free comparison of quantitative perfusion maps acquired with pulsed-continuous arterial spin labeling and single-photon-emission computed tomography. Magn Reson Med Sci (2014) 13(4):239–49. doi:10.2463/mrms.2013-0117
34. Nozoe S, Naruo T, Yonekura R, Nakabeppu Y, Soejima Y, Nagai N, et al. Comparison of regional cerebral blood flow in patients with eating disorders. Brain Res Bull (1995) 36(3):251–5. doi:10.1016/0361-9230(94)00199-B
35. Wagner A, Barbarich N, Frank G, Bailer U, Weissfeld L, Henry S, et al. Personality traits after recovery from eating disorders: do subtypes differ? Int J Eat Disord (2006) 39(4):276–84. doi:10.1002/eat.20251
36. First M, Gibbon M, Spitzer R, Williams J, Benjamin L. User’s Guide for the Structured Clinical Interview for DSM-IV Axis II Personal Disorders (SCID-II). Washington, DC: American Psychiatric Press (1997).
37. Sheehan DV, Lecrubier Y, Sheehan KH, Amorim P, Janavs J, Weiller E, et al. The mini-international neuropsychiatric interview (M.I.N.I.): the development and validation of a structured diagnostic psychiatric interview for DSM-IV and ICD-10. J Clin Psychiatry (1998) 59(20):22–33; quiz 4–57.
38. Spielberger C, Gorsuch R, Lushene R. STAI Manual for the State Trait Anxiety Inventory. Palo Alto, CA: Consulting Psychologists Press (1970).
39. Cloninger C, Przybeck T, Svrakic D, Wetzel R. The Temperament and Character Inventory (TCI): A Guide to Its Development and Use. (Chap. 2, 4). St. Louis, MO: Center for Psychobiology of Personality, Washington University (1994). p. 19–28.
40. Beck AT, Ward M, Mendelson M, Mock J, Erbaugh J. An inventory for measuring depression. Arch Gen Psychiatry (1961) 4:561–71. doi:10.1001/archpsyc.1961.01710120031004
41. Garner DM. Eating Disorder Inventory-2 Professional Manual. Odessa, FL: Psychological Assessment Resources, Inc. (1991). 1990 p.
42. Wong E, Buxton R, Frank L. Quantitative imaging of perfusion using a single subtraction (QUIPSS and QUIPSS II). Magn Reson Med (1998) 39:702–8.
43. Wong E. Quantifying CBF with pulsed ASL: technical and pulse sequence factors. J Magn Reson Imaging (2005) 22(6):727–31. doi:10.1002/jmri.20459
44. Brumm K, Perthen J, Liu T, Haist F, Ayalon L, Love T. An arterial spin labeling investigation of cerebral blood flow deficits in chronic stroke survivors. Neuroimage (2010) 51(3):995–1005. doi:10.1016/j.neuroimage.2010.03.008
45. Shin D, Liu T, Wong E, Shankaranarayanan A, Jung Y. Pseudocontinuous arterial spin labeling with optimized tagging efficiency. Magn Reson Med (2012) 68(4):1135–44. doi:10.1002/mrm.24113
46. Gountouna V-E, Job D, McIntosh A, Moorhead T, Lymer G, Whalley H, et al. Functional magnetic resonance imaging (fMRI) reproducibility and variance components across visits and scanning sites with a finger tapping task. Neuroimage (2010) 49(1):552–60. doi:10.1016/j.neuroimage.2009.07.026
47. Suckling J, Ohlssen D, Andrew C, Johnson G, Williams SG, Graves M, et al. Components of variance in a multicentre functional MRI study and implications for calculation of statistical power. Hum Brain Mapp (2008) 29(10):1111–22. doi:10.1002/hbm.20451
48. Brown G, Mathalon D, Stern H, Ford J, Mueller B, Greve D, et al. Multisite reliability of cognitive BOLD data. Neuroimage (2011) 54(3):2163–75. doi:10.1016/j.neuroimage.2010.09.076
49. Cox R. AFNI: software for analysis and visualization of functional magnetic resonance neuroimages. Comput Biomed Res (1996) 29:162–73. doi:10.1006/cbmr.1996.0014
50. Smith S, Jenkinson M, Woolrich M, Beckmann C, Behrens T, Johansen-Berg H, et al. Advances in functional and structural MR image analysis and implementation as FSL. Neuroimage (2004) 23(S1):208–19. doi:10.1016/j.neuroimage.2004.07.051
51. Pruessmann K, Weiger MS, Scheidegger MB, Boesiger P. SENSE: sensitivity encoding for fast MRI. Magn Reson Med (1999) 42(5):952–62.
52. Weiger M, Pruessmann K, Osterbauer R, Bornert P, Boesiger P, Jezzard P. Sensitivity-encoded single-shot spiral imaging for reduced susceptibility artifacts in BOLD fMRI. Magn Reson Med (2002) 48(5):860–6. doi:10.1002/mrm.10286
53. Liu T, Wong E. A signal processing model for arterial spin labeling functional MRI. Neuroimage (2005) 24(1):207–15. doi:10.1016/j.neuroimage.2004.09.047
54. Chalela JA, Alsop DC, Gonzalez-Atavales JB, Maldjian JA, Kasner SE, Detre JA. Magnetic resonance perfusion imaging in acute ischemic stroke using continuous arterial spin labeling. Stroke (2000) 31(3):680–7. doi:10.1161/01.STR.31.3.680
55. Sandor S, Leahy R. Surface-based labeling of cortical anatomy using a deformable atlas. IEEE Trans Med Imaging (1997) 16(1):41–54. doi:10.1109/42.552054
56. Shattuck D, Sandor-Leahy S, Schaper K, Rottenberg D, Leahy R. Magnetic resonance image tissue classification using a partial volume model. Neuroimage (2001) 13(5):856–76. doi:10.1006/nimg.2000.0730
57. Fennema-Notestine C, Ozyurt I, Clark C, Morris S, Bischoff-Grethe A, Bondi M, et al. Quantitative evaluation of automated skull-stripping methods applied to contemporary and legacy images: effects of diagnosis, bias correction, and slice location. Hum Brain Mapp (2006) 27(2):99–133. doi:10.1002/hbm.20161
58. Parkes L, Rashid W, Chard D, Tofts P. Normal cerebral perfusion measurements using arterial spin labeling: reproducibility, stability, and age and gender effects. Magn Reson Med (2004) 51(4):736–43. doi:10.1002/mrm.20023
59. Hermes M, Hagemann D, Britz P, Lieser S, Rock J, Naumann E, et al. Reproducibility of continuous arterial spin labeling perfusion MRI after 7 weeks. MAGMA (2007) 20(2):103–15. doi:10.1007/s10334-007-0073-3
60. Johnson N, Jahng G, Weiner M, Miller B, Chiu H, Jagust W, et al. Pattern of cerebral hypoperfusion in Alzheimer disease and mild cognitive impairment measured with arterial spin-labeling MR imaging: initial experience. Radiology (2005) 234(3):851–9. doi:10.1148/radiol.2343040197
61. Brown G, Eyler Zorrilla L, Georgy B, Kindermann SW, Wong EC, Buxton RB. BOLD and perfusion response to finger-thumb apposition after acetazolamide administration: differential relationship to global perfusion. J Cereb Blood Flow Metab (2003) 23(7):829–37. doi:10.1097/01.WCB.0000071887.63724.B2
62. Poldrack R, Baker C, Durnez J, Gorgolewski K, Matthews P, Maunafo M, et al. Scanning the horizon: towards transparent and reproducible neuroimaging research. Nat Rev Neurosci (2017) 18(2):115–26. doi:10.1038/nrn.2016.167
63. Martinez D, Slifstein M, Broft A, Mawlawi O, Hwang D, Huang Y, et al. Imaging human mesolimbic dopamine transmission with positron emission tomography. Part II: amphetamine-induced dopamine release in the functional subdivisions of the striatum. J Cereb Blood Flow Metab (2003) 23:285–300. doi:10.1097/01.WCB.0000048520.34839.1A
64. Mawlawi O, Martinez D, Slifstein M, Broft A, Chatterjee R, Hwang D, et al. Imaging human mesolimbic dopamine transmission with positron emission tomography: I. Accuracy and precision of D(2) receptor parameter measurements in ventral striatum. J Cereb Blood Flow Metab (2001) 21(9):1034–57. doi:10.1097/00004647-200109000-00002
65. Haber S, Knutson B. The reward circuit: linking primate anatomy and human imaging. Neuropsychopharmacology (2010) 35:4–26. doi:10.1038/npp.2009.129
66. Yucel M, Wood S, Fornito A, Riffkin J, Velakoulis D, Pantelis C. Anterior cingulate dysfunction: implications for psychiatric disorders? J Psychiatry Neurosci (2003) 28(5):350–4.
67. Arnow B, Desmond J, Banner L, Glover G, Solomon A, Lake Polan M, et al. Brain activation and sexual arousal in healthy, heterosexual males. Brain (2002) 125(Pt 5):1014–23. doi:10.1093/brain/awf108
68. Cox R, Reynolds R, Taylor P. AFNI and Clustering: False Positive Rates Redux. ioRxiv Preprint First Posted Online July 26. (2016). Available from: http://dx.doi.org/10.1101/065862
69. Eklund A, Nichols T, Knutsson H. Cluster failure: why fMRI inferences for spatial extent have inflated false-positive rates. Proc Natl Acad Sci U S A (2016) 113(28):7900–5. doi:10.1073/pnas.1602413113
70. Huber P. Robust estimation of location parameter. Ann Math Stats (1964) 35(1):73–101. doi:10.1214/aoms/1177703732
71. Rothman K. No adjustments are needed for multiple comparisons. Epidemiology (1990) 1(1):43–6. doi:10.1097/00001648-199001000-00010
72. Gelman A, Hill J, Yajima M. Why we (usually) don’t have to worry about multiple comparisons. J Res Educ Eff (2012) 5(2):189–211. doi:10.1080/19345747.2011.618213
73. Cohen J. Statistical Power Analysis for Behavioral Sciences. Hillsdale, NJ: Lawrence Erlbaum Associates, Inc (1988). 474 p.
74. Poldrack RA, Mumford JA. Independence in ROI analysis: where is the voodoo? Soc Cogn Affect Neurosci (2009) 4(2):208–13. doi:10.1093/scan/nsp011
75. Avery J, Kerr K, Ingeholm J, Burrows K, Bodurka J, Simmons W. A common gustatory and interoceptive representation in the human mid-insula. Hum Brain Mapp (2015) 36(8):2996–3006. doi:10.1002/hbm.22823
76. Craig A. How do you feel – now? The anterior insula and human awareness. Nat Rev Neurosci (2009) 10(1):59–70. doi:10.1038/nrn2555
77. Craig AD. How do you feel? Interoception: the sense of the physiological condition of the body. Nat Rev Neurosci (2002) 3(8):655–66. doi:10.1038/nrn894
78. Pollatos O, Kurz A-L, Albrecht J, Schreder T, Kleemann A, Schopf V, et al. Reduced perception of bodily signals in anorexia nervosa. Eat Behav (2008) 9:381–8. doi:10.1016/j.eatbeh.2008.02.001
79. Oberndorfer T, Frank G, Fudge J, Simmons A, Paulus M, Wagner A, et al. Altered insula response to sweet taste processing after recovery from anorexia and bulimia nervosa. Am J Psychiatry (2013) 214(2):132–41. doi:10.1176/appi.ajp.2013.11111745
80. Wagner A, Aizenstein H, Frank GK, Figurski J, May JC, Putnam K, et al. Altered insula response to a taste stimuli in individuals recovered from restricting-type anorexia nervosa. Neuropsychopharmacology (2008) 33(3):513–23. doi:10.1038/sj.npp.1301443
81. Filoteo J, Paul E, Ashby F, Frank G, Helie S, Rockwell R, et al. Simulating category learning and set shifting deficits in patients weight-restored from anorexia nervosa. Neuropsychology (2014) 28(5):741–51. doi:10.1037/neu0000055
82. Ely AV, Bischoff-Grethe A, Wierenga CE, Melrose AJ, Bailer U, Kaye WH. Fear of Food in Anorexia Nervosa: Harm Avoidance is Linked to Diminished Neural Response to Taste Reward. American College of Neuropsychopharmacology (abstract) (2015).
83. Holsen L, Lawson E, Christensen K, Klibanski A, Goldstein J. Abnormal relationships between the neural response to high-and low-calorie foods and endogenous acylated ghrelin in women with active and weight-recovered anorexia nervosa. Psychiatry Res (2014) 223(2):94–103. doi:10.1016/j.pscychresns.2014.04.015
84. Frank G, Shott M, Keffler C, Cornier M. Extremes of eating are associated with reduced neural taste discrimination. Int J Eat Disord (2016) 49(6):603–12. doi:10.1002/eat.22538
85. Magistretti P, Allaman I. A cellular perspective on brain energy metabolism and functional imaging. Neuron (2015) 86(4):883–901. doi:10.1016/j.neuron.2015.03.035
86. Zhang J, Badaut J, Tang J, Obenaus A, Hartman R, Pearce W. The vascular neural network – a new paradigm in stroke pathophysiology. Nat Rev Neurosci (2012) 8(12):711–6. doi:10.1038/nrneurol.2012.210
87. García-Cáceres C, Quarta CV, Varela L, Gao Y, Gruber T, Legutko B, et al. Astrocytic insulin signaling couples brain glucose uptake with nutrient availability. Cell (2016) 166(4):867–80. doi:10.1016/j.cell.2016.07.028
88. Lawson E, Holsen L, Desanti R, Santin M, Meenaghan E, Herzog D, et al. Increased hypothalamic-pituitary-adrenal drive is associated with decreased appetite and hypoactivation of food-motivation neurocircuitry in anorexia nervosa. Eur J Endocrinol (2013) 169(5):639–47. doi:10.1530/EJE-13-0433
89. Hyder F. Neuroimaging with calibrated FMRI. Stroke (2004) 35(11 Suppl 1):2635–41. doi:10.1161/01.STR.0000143324.31408.db
90. Davis T, Kwong K, Weisskoff R, Rosen B. Calibrated functional MRI: mapping the dynamics of oxidative metabolism. Proc Natl Acad Sci U S A (1998) 95:1834–9. doi:10.1073/pnas.95.4.1834
91. Zhang K, Herzog H, Mauler J, Filss C, Okell T, Kops E, et al. Comparison of cerebral blood flow acquired by simultaneous [15O]water positron emission tomography and arterial spin labeling magnetic resonance imaging. J Cereb Blood Flow Metab (2014) 34(8):1373–80. doi:10.1038/jcbfm.2014.92
92. Heijtel DM, Mutsaerts HJ, Bakker E, Schober P, Stevens M, Petersen E, et al. Accuracy and precision of pseudo-continuous arterial spin labeling perfusion during baseline and hypercapnia: a head-to-head comparison with 15O H2O positron emission tomography. Neuroimage (2014) 92:182–92. doi:10.1016/j.neuroimage.2014.02.011
93. Purnell J, Fair D. Fructose ingestion and cerebral, metabolic, and satiety responses. JAMA (2013) 309(1):85–6. doi:10.1001/jama.2012.190505
Keywords: anorexia nervosa, hunger, cerebral blood flow, homeostatic regulation, energy metabolism, arterial spin labeling
Citation: Wierenga CE, Bischoff-Grethe A, Rasmusson G, Bailer UF, Berner LA, Liu TT and Kaye WH (2017) Aberrant Cerebral Blood Flow in Response to Hunger and Satiety in Women Remitted from Anorexia Nervosa. Front. Nutr. 4:32. doi: 10.3389/fnut.2017.00032
Received: 22 March 2017; Accepted: 03 July 2017;
Published: 19 July 2017
Edited by:
Paul A. M. Smeets, Wageningen University & Research, NetherlandsReviewed by:
Cara Bohon, Stanford University, United StatesNils B. Kroemer, Technische Universität Dresden, Germany
Copyright: © 2017 Wierenga, Bischoff-Grethe, Rasmusson, Bailer, Berner, Liu and Kaye. This is an open-access article distributed under the terms of the Creative Commons Attribution License (CC BY). The use, distribution or reproduction in other forums is permitted, provided the original author(s) or licensor are credited and that the original publication in this journal is cited, in accordance with accepted academic practice. No use, distribution or reproduction is permitted which does not comply with these terms.
*Correspondence: Christina E. Wierenga, Y3dpZXJlbmdhQHVjc2QuZWR1