 Ruiying Li1†Zhongyan Tian1†Yanhua Wang2Xiaotian Liu1Runqi Tu1
 Yan Wang1Xiaokang Dong1Yikang Wang1Dandan Wei1Huiling Tian1
 Zhenxing Mao1Linlin Li1
 Wenqian Huo1
 Chongjian Wang1*Ronghai Bie1*
- 1Department of Epidemiology and Biostatistics, College of Public Health, Zhengzhou University, Zhengzhou, China
- 2Department of Prevention and Health Care, Military Hospital of Henan Province, Zhengzhou, China
Background: Obesity is an important risk factor for hypertension. Previous studies have explored the association between body fat percentage (BFP) and hypertension, but evidence on the consistency of the association remains uncertain and limited. The aim of this study was to explore the relationship between BFP and hypertension in a Chinese rural population.
Methods: The present cross-sectional study including 38,913 eligible individuals was conducted in rural areas of Henan province. BFP was measured by bioelectrical impedance methods using Omron body fat and weight measurement device. Logistic regression models and restricted cubic spline regression models were performed to investigate the relationship between BFP and hypertension. Receiver operating characteristic (ROC) analyses were used to compare the discriminating power of adiposity indices.
Results: The age-standard prevalence of hypertension was 23.74 and 17.87% in males and females, respectively. Compared with the first quartile of BFP, the adjusted odds ratios (ORs) and 95% confidence intervals (CIs) for hypertension in the highest BFP quartile were 3.30 (95% CI: 2.85, 3.83) in males and 2.66 (95% CI: 2.36, 2.99) in females, and the adjusted ORs increased along with increasing BFP levels. The areas under ROC and 95% CIs of BFP were 0.673 (0.665, 0.682) in males and 0.696 (0.689, 0.703) in females, respectively.
Conclusions: BFP was significantly positively associated with the prevalence of hypertension in both males and females in the Chinese rural population. Controlling of body fat should be emphasized in rural areas of China.
Clinical Trial Registration: Registration number: ChiCTR-OOC-15006699. http://www.chictr.org.cn/showproj.aspx?proj=11375
Introduction
Hypertension has become a significant health problem due to its rising prevalence and association with other diseases (1, 2). Studies indicated that the percentage of Chinese adults with hypertension increased from 20 to 31.2%in men and from 17 to 28.0% in women between 2002 and 2012 (3, 4). The prevalence of obesity, an important risk factor for chronic diseases, has also significantly increased over the last few decades (5, 6). For instance, a prior study including nearly 50,000 Chinese adults revealed that between 1993 and 2009, the prevalence of general obesity approximately tripled in males and doubled in females, that is, from 2.9 to 11.4% and from 5.0 to 10.1%, respectively (5).
Numerous studies have confirmed that obesity could increase the risk of hypertension (7, 8). For instance, a recent study published in 2019 reported that obesity was highly associated with hypertension (9) and was responsible for more than half of essential hypertension events (10). Early identification and control of individuals suffered from hypertension were, therefore, critical for improving the quality of life and reducing mortality in a high-risk population. Body fat percentage (BFP), as a more accurate and reliable indicator for evaluating general obesity compared to BMI, cannot be neglected (11, 12). Briefly, a previous study performed in southern Brazil showed that compared to individuals with lower BFP, individuals who were with higher BFP were prone to have a greater risk of hypertension (13). Moreover, Jiang et al. also reported that BFP was a better indicator for discriminating hypertension, regardless of gender (14). Recently, research conducted in South Korea indicated that increased BFP was associated with the high risk of hypertension even in non-obese subjects (12). However, Alvin Chandra et al. found that neither total nor subcutaneous adiposity was related to the onset of hypertension (15).
In summary, although some studies have explored the relationship between BFP and prevalent hypertension, evidence related to the actual association remains inconsistent and even controversial. Moreover, to date, information about this relationship in rural areas of China is also yet unclear. Hence, the aim of this study was to explore the relationship between BFP and risk of hypertension in the Chinese rural population.
Methods
Study Design
The Henan Rural Cohort Study (Registration number: ChiCTR-OOC-15006699), which was established in five rural areas of Henan province since July 2015, aimed to evaluate the prevalence as well as the risk factors of cardiometabolic disease in the Chinese rural population, as described previously (16, 17). Briefly, the study samples were selected as follows. First, via simple cluster sampling, we selected five rural counties, that is, Tongxu, Yima, Suiping, Xinxiang, and Yuzhou, respectively. Second, one to three townships were further selected based on some factors such as the compliance of the residents and medical conditions. After that, except for permanent residents with a severe physical or mental disease, those aged 18–79 years in the selected townships were enrolled into the large-scale study. A total of 39,259 people were included and signed the written informed consent. In the present study, individuals were excluded if they were missing information regarding BFP (n = 323) or diagnosis of hypertension (n = 23). As a result, 38,913 eligible individuals were retained for the present analysis. For the current study, approval of Zhengzhou University Life Science Ethics Committee was required, and written informed consent was obtained from all study subjects. In addition, this survey was also carried out in compliance with the guidelines of the Helsinki Declaration.
Data Collection and Anthropometric Measurements
Demographic characteristics, lifestyle behaviors, as well as the personal and family history of diseases were collected for each individual by well-trained investigators via face-to-face interviews. On the same day, anthropometric measurements such as blood pressure, body height, weight, and BFP were also collected by trained interviewers using calibrated equipment and according to standard operating procedure.
With a prohibition of taking exercise, smoking, as well as drinking caffeine for above half an hour, the blood pressure of all participants was determined using an electronic sphygmomanometer (HEM-770AFuzzy; Omron, Japan) and measured in three consecutive measurements together with a 30-s interval after above 5 min of rest; the average of three readings, after that, was calculated for analyses (8, 18). Body height, waist circumference (WC), hip circumference (HC), and weight were measured twice to the nearest 0.1, 0.1, 0.1 cm, and 0.1 kg, respectively, with the staff wearing light clothing and barefoot. Likewise, the average readings were used for analyses. In addition, Omron body fat and weight measurement device (V-body HBF-371; Omron, Kyoto, Japan), which relied on bioelectrical impedance analysis method, was determined to measure BFP and visceral fat index (VFI) in this study (19). Calculation of other adiposity measures was based on the following formulas: body mass index (BMI) = weight (kg)/[height (m)]2; waist-to-hip ratio (WHR) = WC (cm)/HC (cm); waist-to-height ratio (WHtR) = WC (cm)/height (cm).
Assessment of Potential Covariates
Education level was classified into three groups, that is, elementary school or below, junior high school, and high school or above. Marital status was grouped into unmarried/divorced/widowed as well as married/cohabitating. Socioeconomic status was evaluated based on the average monthly individual income. Current smoking was defined as smoking one or more cigarette per day for sequential or cumulative over a 6-month period (20). Current drinking was defined as consuming alcohol at least 12 times per year (8). Physical activity, as defined by the international physical activity questionnaire (IPAQ 2001), was classified into low, moderate, and high (21). Individuals whose parents or siblings had a history of hypertensive disorder were recorded as having a family history of hypertension.
Definition of Hypertension
Individuals with hypertension were defined as those who had a measured average systolic blood pressure (SBP) ≥ 140 mmHg, and/or diastolic blood pressure (DBP) ≥ 90 mmHg, or who already diagnosed with hypertension and currently using antihypertensive drugs (22).
Statistical Analysis
Continuous variables and categorical variables were presented as means ± standard deviations (SDs) and numbers (percentages), with a corresponding analysis using one-way analysis of variance as well as chi-square test, respectively. The age-standard prevalence of hypertension of this study was assessed according to the 2010 census data of the Chinese adult population. With the aid of the restricted cubic spline regression, which was along with three knots placed at the 25 (reference), 50, and 75th percentiles of BFP levels, respectively, the dose–response relationship of continuous BFP levels with the risk for hypertension could be examined. Binary logistic regression models were used to yield odds ratios (ORs) and 95% confidence intervals (CIs) for hypertension based on BFP quartiles and per 1-SD increment. Model 1 was unadjusted. Model 2 was only adjusted for age. Model 3 additionally adjusted for education level, average monthly individual income, marital status, smoking, alcohol consumption, physical activity, high-fat diet, more vegetable and fruit intake, type 2 diabetes (T2DM), family history of hypertension, triglyceride (TG), cholesterol (TC), fasting blood glucose (FBG), hypersensitive c-reactive protein (Hs-CRP), high-density lipoprotein cholesterol (HDL-C), and low-density lipoprotein cholesterol (LDL-C). Analyses of receiver operating characteristic (ROC) as well as the areas under the curves (AUCs) were conducted to compare the discriminating power for the risk of hypertension in terms of six adiposity indices and the DeLong et al. method (23) was used to test the differences in AUCs.
Statistical analyses of data were performed by SPSS 21.0 and MedCalc software, and figures of restricted cubic spline were produced using SAS 9.1 software package. Two-sided P < 0.05 were considered statistically significant.
Results
Characteristics of Study Participants
The final pooled study comprised 38,913 individuals, 60.6% of whom were females. The mean age of the total population, males, and females was 55.57 ± 12.18 years, 56.6 ± 12.30 years, and 54.9 ± 12.1 years, respectively. A total of 12,678 cases of hypertension (5,048 males and 7,630 females) were ascertained in the present study. Age-standard prevalence of hypertension for males and females was 23.74 and 17.87%, respectively. Compared to subjects without hypertension, subjects with hypertension had higher age, family history of hypertension, FBG, T2DM, Hs-CRP, TG, TC, LDL-C, BFP, VFI, BMI, WC, WHR, and WHtR, and had lower education level and average monthly individual income and physical activity in the total population, males and females (P < 0.001), while marital status in males (P = 0.051) and smoking status in females (P = 0.850) were not found to be related to hypertension (Table 1). In addition, the prevalence of hypertension gradually increased with the increase of BFP quartiles. In Figure 1, those who were in the highest BFP quartile also had highest hypertension prevalence (47.35% in the total population, 51.17% in males, and 52.83% in females).
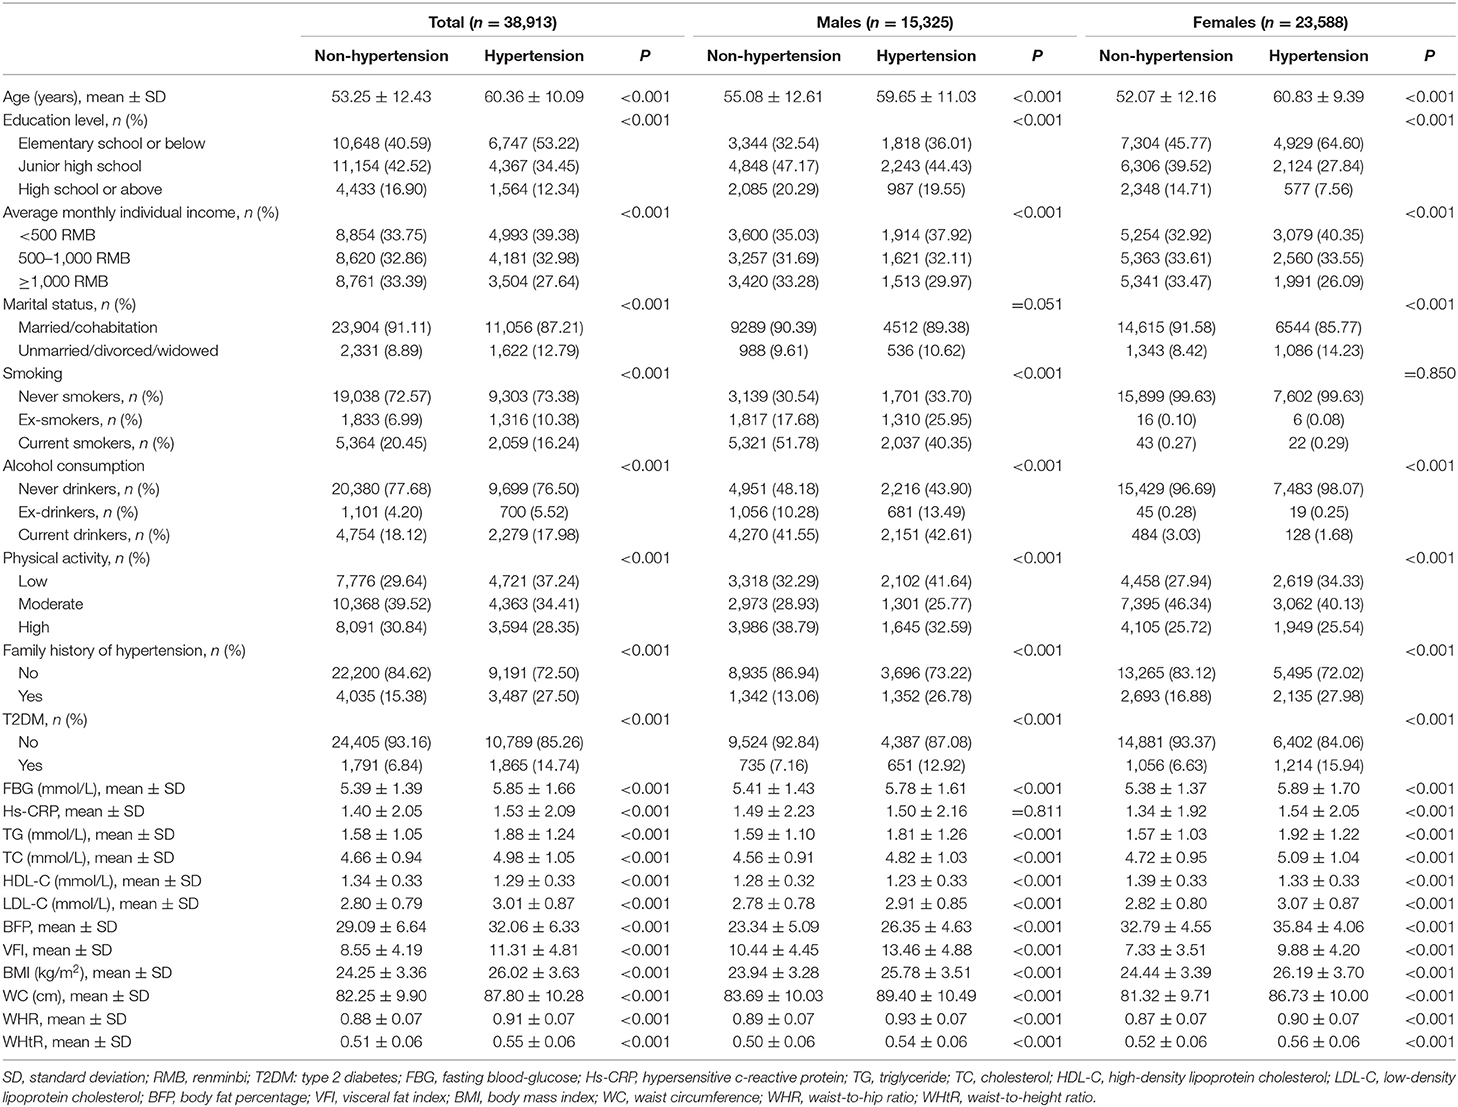
Table 1. Baseline characteristics of the study participants according to hypertension status.
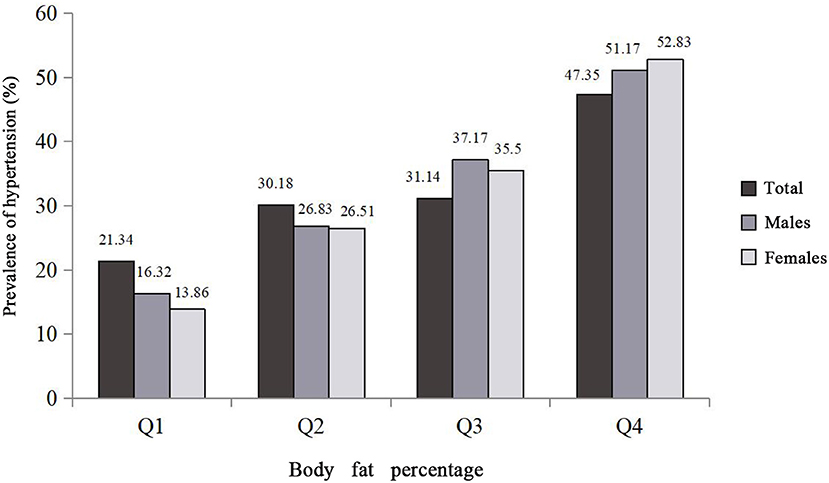
Figure 1. Prevalence of hypertension distributions among the study population and the quartiles of body fat percentage. Body fat percentage was divided into sex-specific quartiles (for total population: Q1: <25.5, Q2: 25.5–30.7, Q3: 30.7–35.1, Q4: ≥35.1; for males: Q1: <21.2, Q2: 21.2–24.6, Q3: 24.7–27.8, Q4: ≥27.9; for females: Q1: <31.0, Q2: 31.0–34.0, Q3: 34.1–36.8, Q4: ≥36.9).
Relationship Between Continuous BFP and Hypertension
Figure 2 presents restricted cubic spline curves with three knots located at the 25 (reference), 50, and 75 percentiles of BFP levels, respectively, to examine the relationships that linked continuous BFP with the hypertension in the total population, males, and females. As demonstrated, the risk of hypertension elevated steadily with continuously increasing BFP after adjusting for confounders. Also, dose–response relationships that linked BFP with the risk of hypertension were observed in both genders.
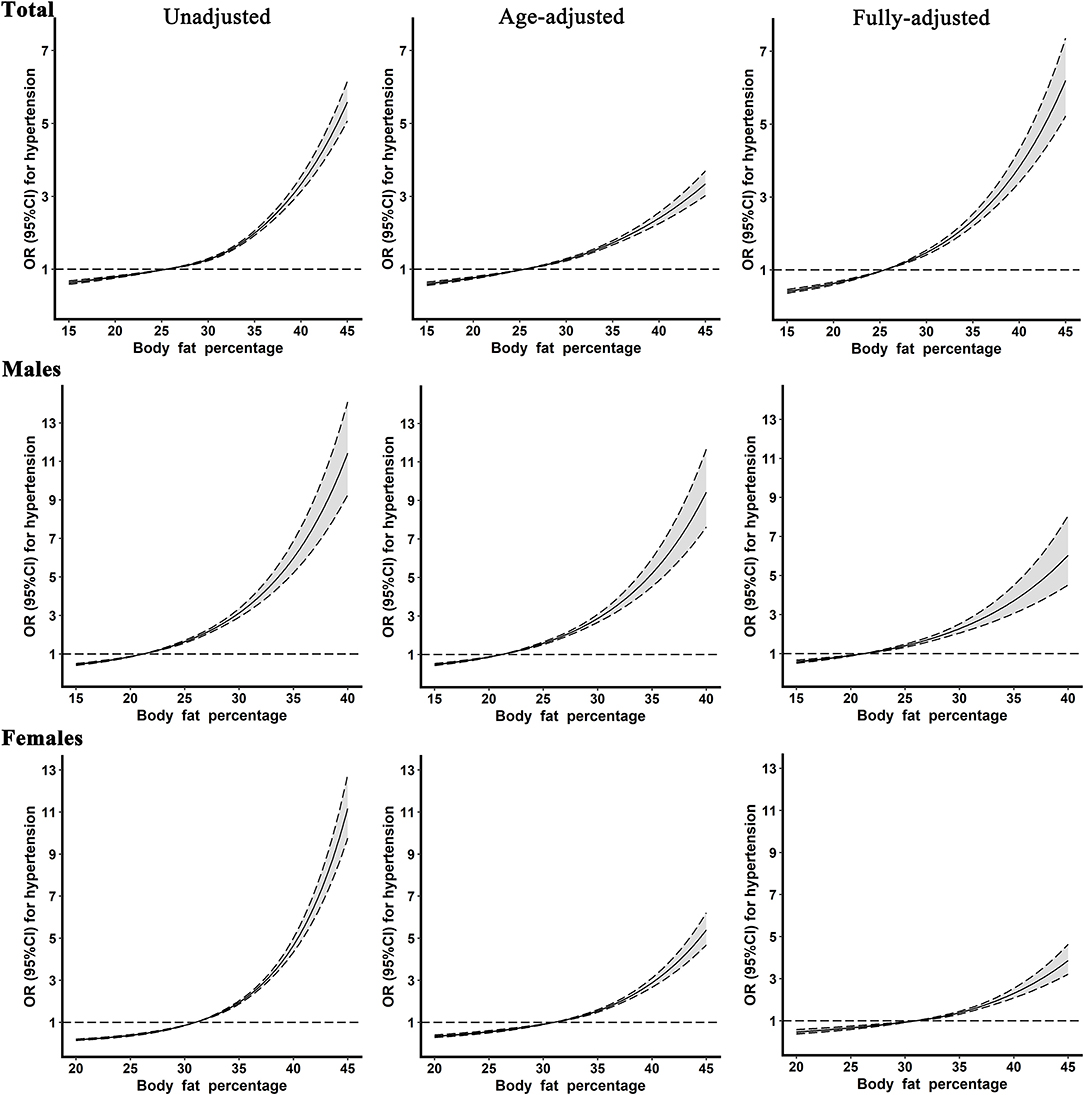
Figure 2. The restricted cubic spline for the relationship between body fat percentage levels and hypertension. Reference values for body fat percentage were set at the cutoff values of the first sex-specific quartiles. The fully adjusted model included age, gender (only in the total population), education level, average monthly individual income, marital status, smoking, alcohol consumption, physical activity, high-fat diet, more vegetable and fruit intake, family history of hypertension, type 2 diabetes, fasting blood glucose, hypersensitive c-reactive protein, triglyceride, cholesterol, high-density lipoprotein cholesterol, and low-density lipoprotein cholesterol.
Relationship Between Categorical BFP and Hypertension
As shown in Table 2, compared with participants in the lowest BFP quartile, the OR (95% CI) of the highest BFP quartile for hypertension was 3.31 (3.11, 3.53) in the total population, with a corresponding OR (95% CI) of 5.37 (4.83, 5.98), and 6.96 (6.37, 7.62) in males and females in model 1. After further adjustment of confounders, the OR (95% CI) of the highest BFP quartile for hypertension was 4.19 (3.69, 4.75), 3.30 (2.85, 3.83), and 2.66 (2.36, 2.99) in the total population, males, and females in model 3, respectively. Similarly, 1-SD increases in BFP were significantly associated with 87, 62, and 54% higher risks of hypertension in the total population, males, and females, respectively.
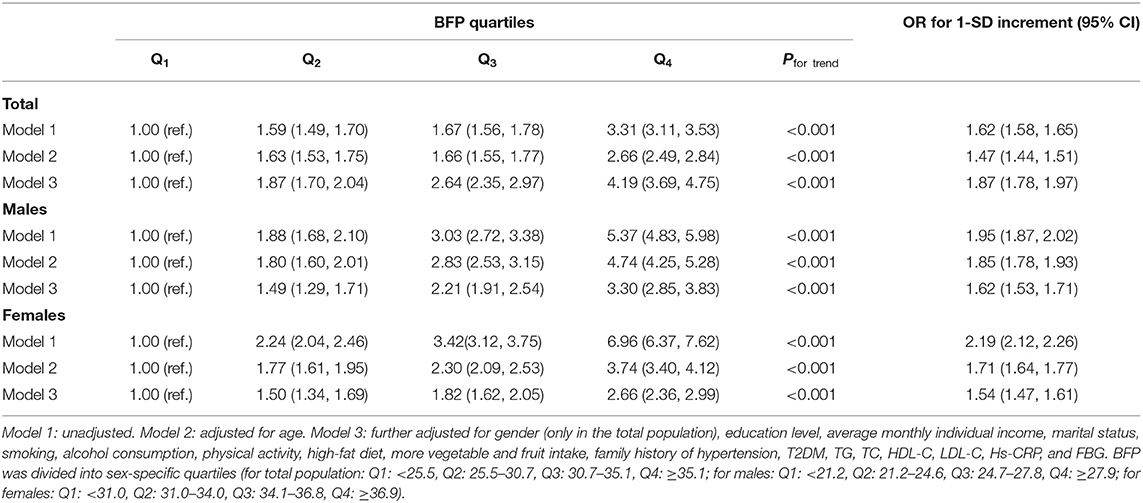
Table 2. Odds ratios (95% CIs) for hypertension according to BFP levels.
Comparison of BFP With Other Adiposity Measures
The ORs and 95% CIs for adiposity measures (BMI, WC, WHR, WHtR, and VFI) associated with hypertension were depicted in Figure S1. After adjusted potential confounders, similar to BFP, the risk of hypertension rose along with increasing adiposity measures quartile. The AUCs (95% CI) of BMI, WC, WHR, WHtR, VFI, and BFP were 0.642 (0.636, 0.647), 0.652 (0.646, 0.658), 0.641(0.635, 0.647), 0.667 (0.662, 0.673), 0.670 (0.664, 0.675), and 0.626 (0.620, 0.632) in the total population, respectively. BFP showed the lowest identifying power compared to other adiposity measures in the total population. However, after stratified by gender, BFP had the highest and second discriminatory capability for the risk of hypertension in females (AUCs: 0.696; 95% CI: from 0.689 to 0.703) and males (AUCs: 0.673; 95% CI: from 0.665 to 0.682), respectively (see Figure S2 and Table S1). In addition, the results suggested that VFI was the best discrimination index of hypertension risk in males, whereas the AUCs of VFI with BFP were not statistically significantly different.
Discussion
This study was carried out in a large rural population-based sample, and the relationship between BFP and hypertension was evaluated. We found that the prevalent hypertension increased with rising BFP quartiles in rural areas of Henan province, and a considerably stronger association of BFP and hypertension prevalence in the total population and both genders was observed by binary logistic regression models. In addition, significant dose–response relationships between continuous BFP levels and risk of hypertension in the total population and both males and females were also revealed by restricted cubic spline models. Moreover, ROC curve analysis demonstrated that BFP had the highest discrimination power for hypertension risk in females.
The crude prevalence of hypertension in this study was 32.58% (32.94% for males and 32.35% for females, respectively). A study (24) performed in the general population of China reported that the prevalence of hypertension was 32.5% (33.7% for males and 31.9% for females, respectively). Additionally, a systematic analysis (25) showed that the prevalence of hypertension in Henan province was 33.5% (32.5% for males and 34.0% for females, respectively), and the rural areas seemed to have higher prevalent hypertension compared to urban areas (30.8 vs. 26.9%). These studies aforementioned showed that the rural areas of Henan province had a high prevalence. Therefore, this study was implemented in such a rural area and might be more meaningful for controlling the prevalence of hypertension.
In the present study, we found a significantly positive association between BFP and prevalent hypertension in the total population, males, and females, and the risk of hypertension progressively elevated with increasing BFP. Similar findings were also observed in other studies. Previous studies (19, 26) in Southern China reported that high BFP was concerned with hypertension prevalence, as well as systolic pressure and diastolic pressure. Besides, a prior study (27) in Anhui province indicated that hypertension prevalence in children aged 7–17 years also increased along with the increase of BFP. Furthermore, a recent cohort study demonstrated that BFP was an important predictor of incident hypertension (28). Our study indicated that compared to participants in the lowest BFP quartile, the ORs (95% CIs) of the highest BFP quartile were 3.30 (2.85, 3.83) in males and 2.66 (2.36, 2.99) in females after adjusting for confounders, which was comparable to these studies. In addition, the relationships between continuous BFP and prevalent hypertension in different genders were further analyzed in this study, and dose–response relationships of BFP with prevalent hypertension were also observed irrespective of genders. However, in contrast to the above studies, Hu L et al. reported a cross-sectional study with individuals aged 15 or older in whom BFP had significant correlation with prehypertension rather than hypertension in Jiangxi Province of China (29). A cohort study, which included 903 participants and conducted in African-Americans aged 18–65 years, also reported that BFP, as a total adiposity index, was not related to the risk of hypertension, with a corresponding OR (95% CI) of 1.01 (0.83, 1.23) (15). These inconsistencies might be due to different demographic characteristics such as racial, age ranges, survey locations, sample size or some potentially undetected factors of study population (14, 30). For instance, a study conducted in Houston demonstrated that the association of obesity with hypertension was altered with different race [30]. In that study, compared to other adiposity measures, BFP showed better discriminatory capability for the risk of hypertension in both females and males. Likewise, a study (14) conducted in Henan province suggested that BFP had larger AUCs than other adiposity measures including BMI, WC, WHtR, and VFI, which were similar to our results. However, BFP had the lowest identifying power in the total population, which might be explained by great gender differences. Therefore, the relationship between BFP and hypertension is worth using prospective and multicenter designs for further validation.
There are some biologically plausible metabolic mechanisms that could illustrate how the speculated BFP–hypertension pathway might work. Excess energy can be stored in adipose tissue when people ingest too much, and individuals with excess body fat deposition can secrete more inflammatory cytokines than subjects with normal weight (31). On the other hand, the degree of sympathetic activation is higher in those who have greater body fat (32), which may affect metabolic alterations (33). In addition, body fat can induce the occurrence of kidney disease and finally contribute to glomerulosclerosis (34). Furthermore, insulin resistance is able to stimulate and increase the reabsorption of sodium in those with more body fat distribution (35) and the increase of renal tubular sodium reabsorption has a certain inhibitory effect on the pressure natriuretic and plays an important role in the development of hypertension. To date, the potential mechanisms have not been thoroughly cleared yet; therefore, further studies are needed to illuminate the exact mechanisms.
Despite this study including a relatively large representative sample size of the Chinese rural population, as well as adjusting a mass of confounders, some limitations also existed. First, in this study, BFP was derived from bioelectrical impedance methods. Although a bioelectrical impedance method is not as accurate as the gold standard, it is more suitable for a large-scale epidemiological investigation. Second, selection bias as well as residual confounding such as hemoglobin A1c (HbA1c) and other related biomarkers cannot be thoroughly ruled out, although we adjusted for a large number of covariates to minimize the effects of confounders. In addition, the cross-sectional study elucidated that a conclusive cause-and-effect relationship is limited. Therefore, further researches are warranted to confirm the extensibility of our results.
Conclusions
BFP was significantly positively associated with the prevalence of hypertension in the Chinese rural population. These findings indicated that BFP ≥ 24.85 in males and BFP ≥ 34.95 in females will increase the risk of hypertension. BFP may play a key role in early identification of hypertension, especially in females, and could provide some useful information to clinicians to remind patients of hypertension prevention via controlling BFP within a reasonable range, which, in the long run, may improve the health level and further reduce the disease burden in Chinese rural residents.
Data Availability Statement
The raw data supporting the conclusions of this article will be made available by the authors, without undue reservation, to any qualified researcher.
Ethics Statement
The studies involving human participants were reviewed and approved by Zhengzhou University Life Science Ethics Committee. The patients/participants provided their written informed consent to participate in this study.
Author Contributions
RL and ZT analyzed the data and wrote the manuscript. CW and RB designed the study. RL, ZT, YanhW, XL, RT, YanW, XD, YiW, DW, HT, ZM, LL, and WH conducted the collection of the data. XL corrected the manuscript. All authors read and approved this version of the article.
Funding
This research was supported by the National Key Research and Development Program of China (Grant No. 2016YFC0900803), the National Natural Science Foundation of China (Grant Nos. 81573243, 81602925, and U1304821), the Henan Provincial Science Fund for Distinguished Young Scholars (Grant No. 164100510021), the Science and Technology Innovation Talents Support Plan of Henan Province Colleges and Universities (Grant No. 14HASTIT035), and the High-level Personnel Special Support Project of Zhengzhou University (Grant No. ZDGD13001). The funders had no role in the study design, data collection, and analysis, decision to publish, or preparation of the manuscript.
Conflict of Interest
The authors declare that the research was conducted in the absence of any commercial or financial relationships that could be construed as a potential conflict of interest.
Acknowledgments
The authors would like to give great gratitude for the participants and all research staff of the current study.
Supplementary Material
The Supplementary Material for this article can be found online at: https://www.frontiersin.org/articles/10.3389/fpubh.2020.00070/full#supplementary-material
References
1. Kearney PM, Whelton M, Reynolds K, Muntner P, Whelton PK, He J. Global burden of hypertension: analysis of worldwide data. Lancet. (2005) 365:217–23. doi: 10.1016/S0140-6736(05)17741-1
2. GBDRF Collaborators. Global, regional, and national comparative risk assessment of 79 behavioural, environmental and occupational, and metabolic risks or clusters of risks, 1990-2015: a systematic analysis for the global burden of disease study 2015. Lancet. (2016) 388:1659–724. doi: 10.1016/S0140-6736(16)31679-8
3. Wang J, Zhang L, Wang F, Liu L, Wang HG. China National Survey of Chronic Kidney Disease Working Group. Prevalence, awareness, treatment, and control of hypertension in China: results from a national survey. Am J Hypertens. (2014) 27:1355–61. doi: 10.1093/ajh/hpu053
4. Wu Y, Huxley R, Li L, Anna V, Xie G, Yao C, et al. Prevalence, awareness, treatment, and control of hypertension in China: data from the China national nutrition and health survey 2002. Circulation. (2008) 118:2679–86. doi: 10.1161/CIRCULATIONAHA.108.788166
5. Liu X, Wu W, Mao Z, Huo W, Tu R, Qian X, et al. Prevalence and influencing factors of overweight and obesity in a Chinese rural population: the Henan rural cohort study. Sci Rep. (2018) 8:13101. doi: 10.1038/s41598-018-31336-2
6. Xi B, Liang Y, He T, Reilly KH, Hu Y, Wang Q, et al. Secular trends in the prevalence of general and abdominal obesity among Chinese adults, 1993-2009. Obes Rev. (2012) 13:287–96. doi: 10.1111/j.1467-789X.2011.00944.x
7. Seravalle G, Grassi G. Obesity and hypertension. Pharmacol Res. (2017) 122:1–7. doi: 10.1016/j.phrs.2017.05.013
8. Zhao Y, Zhang M, Luo X, Wang C, Li L, Zhang L, et al. Association of 6-year waist circumference gain and incident hypertension. Heart. (2017) 103:1347–52. doi: 10.1136/heartjnl-2016-310760
9. Brackmann LK, Buck C, Nyangasa MA, Kelm S, Sheikh M, Hebestreit A. Anthropometric and biochemical predictors for hypertension in a cross-sectional study in Zanzibar, Tanzania. Front Pub Health. (2019) 7:338. doi: 10.3389/fpubh.2019.00338
10. Henry SL, Barzel B, Wood-Bradley RJ, Burke SL, Head GA, Armitage JA. Developmental origins of obesity-related hypertension. Clin Exp Pharmacol Physiol. (2012) 39:799–806. doi: 10.1111/j.1440-1681.2011.05579.x
11. Zeng Q, Dong SY, Sun XN, Xie J, Cui Y. Percent body fat is a better predictor of cardiovascular risk factors than body mass index. Braz J Med Biol Res. (2012) 45:591–600. doi: 10.1590/S0100-879X2012007500059
12. Park SK, Ryoo JH, Oh CM, Choi JM, Chung PW, Jung JY. Body fat percentage, obesity, and their relation to the incidental risk of hypertension. J Clin Hypertens. (2019) 21:1496–504. doi: 10.1111/jch.13667
13. Santos Silva DA, Petroski EL, Peres MA. Is high body fat estimated by body mass index and waist circumference a predictor of hypertension in adults? A population-based study. Nutr J. (2012) 11:112. doi: 10.1186/1475-2891-11-112
14. Jiang J, Deng S, Chen Y, Liang S, Ma N, Xu Y, et al. Comparison of visceral and body fat indices and anthropometric measures in relation to untreated hypertension by age and gender among Chinese. Int J Cardiol. (2016) 219:204–11. doi: 10.1016/j.ijcard.2016.06.032
15. Chandra A, Neeland IJ, Berry JD, Ayers CR, Rohatgi A, Das SR, et al. The relationship of body mass and fat distribution with incident hypertension: observations from the Dallas heart study. J Am Coll Cardiol. (2014) 64:997–1002. doi: 10.1016/j.jacc.2014.05.057
16. Liu X, Mao Z, Li Y, Wu W, Zhang X, Huo W, et al. The Henan rural cohort: a prospective study of chronic non-communicable diseases. Int J Epidemiol. (2019) 48:1756. doi: 10.1093/ije/dyz039
17. Wang Y, Li Y, Liu X, Tu R, Zhang H, Qian X, et al. The prevalence and related factors of familial hypercholesterolemia in rural population of China using Chinese modified Dutch lipid clinic network definition. BMC Pub Health. (2019) 19:837. doi: 10.1186/s12889-019-7212-4
18. Chen Z, Wang X, Wang Z, Zhang L, Hao G, Dong Y, et al. Assessing the validity of oscillometric device for blood pressure measurement in a large population-based epidemiologic study. J Am Soc Hypertens. (2017) 11:730–6.e4. doi: 10.1016/j.jash.2017.09.004
19. Yang L, Yan J, Tang X, Xu X, Yu W, Wu H. Prevalence, awareness, treatment, control and risk factors associated with hypertension among adults in Southern China, 2013. PLoS ONE. (2016) 11:e0146181. doi: 10.1371/journal.pone.0146181
20. Wang D, Zhou Y, Guo Y, Zhang R, Li W, He M, et al. The effect of sleep duration and sleep quality on hypertension in middle-aged and older Chinese: the Dongfeng-Tongji cohort study. Sleep Med. (2017) 40:78–83. doi: 10.1016/j.sleep.2017.09.024
21. Hallal PC, Andersen LB, Bull FC, Guthold R, Haskell W, Ekelund U. Global physical activity levels: surveillance progress, pitfalls, and prospects. Lancet. (2012) 380:247–57. doi: 10.1016/S0140-6736(12)60646-1
22. Chobanian AV, Bakris GL, Black HR, Cushman WC, Green LA, Izzo JL Jr. The seventh report of the joint national committee on prevention, detection, evaluation, and treatment of high blood pressure. JAMA. (2003) 289:2560–72. doi: 10.1161/01.HYP.0000107251.49515.c2
23. DeLong ER, DeLong DM, Clarke-Pearson DL. Comparing the areas under two or more correlated receiver operating characteristic curves: a nonpara metric approach. Biometrics. (1988) 44:837–45 doi: 10.2307/2531595
24. Lewington S, Lacey B, Clarke R, Guo Y, Kong XL, Yang L, et al. The burden of hypertension and associated risk for cardiovascular mortality in China. JAMA Intern Med. (2016) 176:524–32. doi: 10.1001/jamainternmed.2016.0190
25. Wang Y, Peng X, Nie X, Chen L, Weldon R, Zhang W, et al. Burden of hypertension in China over the past decades: systematic analysis of prevalence, treatment and control of hypertension. Eur J Prev Cardiol. (2016) 23:792–800. doi: 10.1177/2047487315617105
26. Liu X, Gu W, Li Z, Lei H, Li G, Huang W. Hypertension prevalence, awareness, treatment, control, and associated factors in Southwest China: an update. J Hypertens. (2017) 35:637–644. doi: 10.1097/HJH.0000000000001203
27. Tao RW, Wan YH, Zhang H, Wang YF, Wang B, Xu L, et al. [Relationship between hypertension and percentage of body fat, in children of Anhui province]. Zhonghua Liu Xing Bing Xue Za Zhi. (2016) 37:178–82. doi: 10.3760/cma.j.issn.0254-6450.2016.02.005
28. Lee SB, Cho AR, Kwon YJ, Jung DH. Body fat change and 8-year incidence of hypertension: Korean genome and epidemiology study. J Clin Hypertens. (2019) 21:1849–57. doi: 10.1111/jch.13723
29. Hu L, Huang X, You C, Li J, Hong K, Li P, et al. Prevalence and risk factors of prehypertension and hypertension in Southern China. PLoS ONE. (2017) 12:e0170238. doi: 10.1371/journal.pone.0170238
30. Cheung EL, Bell CS, Samuel JP, Poffenbarger T, Redwine KM, Samuels JA. Race and obesity in adolescent hypertension. Pediatrics. (2017) 139:e20161433. doi: 10.1542/peds.2016-1433
31. Fain JN, Madan AK, Hiler ML, Cheema P, Bahouth SW. Comparison of the release of adipokines by adipose tissue, adipose tissue matrix, and adipocytes from visceral and subcutaneous abdominal adipose tissues of obese humans. Endocrinology. (2004) 145:2273–82. doi: 10.1210/en.2003-1336
32. Grassi GR, Dell'Oro Facchini A, Quarti Trevano F, Bolla GB, Mancia G. Effect of central and peripheral body fat distribution on sympathetic and baroreflex function in obese normotensives. J Hypertens. (2004) 22:2363–9. doi: 10.1097/00004872-200412000-00019
33. Grassi G, Seravalle G, Quarti-Trevano F, Dell'Oro R, Bolla G, Mancia G. Effects of hypertension and obesity on the sympathetic activation of heart failure patients. Hypertension. (2003) 42:873–7. doi: 10.1161/01.HYP.0000098660.26184.63
34. Hall JE, Brands MW, Henegar JR. Mechanisms of hypertension and kidney disease in obesity. Ann N Y Acad Sci. (1999) 892:91–107. doi: 10.1111/j.1749-6632.1999.tb07788.x
Keywords: hypertension, body fat percentage, dose–response relationship, prevalence, Chinese rural population
Citation: Li R, Tian Z, Wang Y, Liu X, Tu R, Wang Y, Dong X, Wang Y, Wei D, Tian H, Mao Z, Li L, Huo W, Wang C and Bie R (2020) The Association of Body Fat Percentage With Hypertension in a Chinese Rural Population: The Henan Rural Cohort Study. Front. Public Health 8:70. doi: 10.3389/fpubh.2020.00070
Received: 04 December 2019; Accepted: 24 February 2020;
Published: 20 March 2020.
Edited by:
Bryan Bassig, National Cancer Institute, National Institutes of Health (NIH), United StatesReviewed by:
Yeli Wang, Duke-NUS Medical School, SingaporeJose L. Flores-Guerrero, University Medical Center Groningen, Netherlands
Copyright © 2020 Li, Tian, Wang, Liu, Tu, Wang, Dong, Wang, Wei, Tian, Mao, Li, Huo, Wang and Bie. This is an open-access article distributed under the terms of the Creative Commons Attribution License (CC BY). The use, distribution or reproduction in other forums is permitted, provided the original author(s) and the copyright owner(s) are credited and that the original publication in this journal is cited, in accordance with accepted academic practice. No use, distribution or reproduction is permitted which does not comply with these terms.
*Correspondence: Chongjian Wang, dGp3Y2oyMDA1QDEyNi5jb20=; Ronghai Bie, YmllcmgyMDEyQDEyNi5jb20=
†These authors have contributed equally to this work