 Sarah E. Ogburn
 Eliza S. Calder
- 1Department of Geology, State University of New York at Buffalo, Buffalo, NY, United States
- 2School of Geosciences, University of Edinburgh, Edinburgh, United Kingdom
High concentration pyroclastic density currents (PDCs) are hot avalanches of volcanic rock and gas and are among the most destructive volcanic hazards due to their speed and mobility. Mitigating the risk associated with these flows depends upon accurate forecasting of possible impacted areas, often using empirical or physical models. TITAN2D, VolcFlow, LAHARZ, and ΔH/L or energy cone models each employ different rheologies or empirical relationships and therefore differ in appropriateness of application for different types of mass flows and topographic environments. This work seeks to test different statistically- and physically-based models against a range of PDCs of different volumes, emplaced under different conditions, over different topography in order to test the relative effectiveness, operational aspects, and ultimately, the utility of each model for use in hazard assessments. The purpose of this work is not to rank models, but rather to understand the extent to which the different modeling approaches can replicate reality in certain conditions, and to explore the dynamics of PDCs themselves. In this work, these models are used to recreate the inundation areas of the dense-basal undercurrent of all 13 mapped, land-confined, Soufrière Hills Volcano dome-collapse PDCs emplaced from 1996 to 2010 to test the relative effectiveness of different computational models. Best-fit model results and their input parameters are compared with results using observation- and deposit-derived input parameters. Additional comparison is made between best-fit model results and those using empirically-derived input parameters from the FlowDat global database, which represent “forward” modeling simulations as would be completed for hazard assessment purposes. Results indicate that TITAN2D is able to reproduce inundated areas well using flux sources, although velocities are often unrealistically high. VolcFlow is also able to replicate flow runout well, but does not capture the lateral spreading in distal regions of larger-volume flows. Both models are better at reproducing the inundated area of single-pulse, valley-confined, smaller-volume flows than sustained, highly unsteady, larger-volume flows, which are often partially unchannelized. The simple rheological models of TITAN2D and VolcFlow are not able to recreate all features of these more complex flows. LAHARZ is fast to run and can give a rough approximation of inundation, but may not be appropriate for all PDCs and the designation of starting locations is difficult. The ΔH/L cone model is also very quick to run and gives reasonable approximations of runout distance, but does not inherently model flow channelization or directionality and thus unrealistically covers all interfluves. Empirically-based models like LAHARZ and ΔH/L cones can be quick, first-approximations of flow runout, provided a database of similar flows, e.g., FlowDat, is available to properly calculate coefficients or ΔH/L. For hazard assessment purposes, geophysical models like TITAN2D and VolcFlow can be useful for producing both scenario-based or probabilistic hazard maps, but must be run many times with varying input parameters. LAHARZ and ΔH/L cones can be used to produce simple modeling-based hazard maps when run with a variety of input volumes, but do not explicitly consider the probability of occurrence of different volumes. For forward modeling purposes, the ability to derive potential input parameters from global or local databases is crucial, though important input parameters for VolcFlow cannot be empirically estimated. Not only does this work provide a useful comparison of the operational aspects and behavior of various models for hazard assessment, but it also enriches conceptual understanding of the dynamics of the PDCs themselves.
Introduction
Pyroclastic Density Currents
High concentration pyroclastic density currents (PDCs) are hot avalanches of volcanic rock and gas which, due to their ability to travel great distances at high speeds, are among the most destructive volcanic hazards. The transport of these flows has been a topic of much debate and research (e.g., Sparks, 1976; Francis and Baker, 1977; Dade and Huppert, 1998; Burgisser and Bergantz, 2002, etc.). They are conceptualized as complex dense-dilute coupled flows (Denlinger, 1987; Valentine, 1987; Burgisser and Bergantz, 2002; Sulpizio et al., 2014), with a dense, coarse-grained, basal undercurrent overridden by a dilute, turbulent cloud of ash and gas, called a surge, an ash cloud, or herein, an ash-cloud surge, which can detach from the basal flow and travel in unexpected directions (e.g., Yamamoto et al., 1993; Fisher, 1995; Bourdier and Abdurachman, 2001; Loughlin et al., 2002; Ogburn et al., 2014). An intermediate zone has also been proposed (Ishida et al., 1980; Denlinger, 1987; Fujii and Nakada, 1999) and observed in large scale experiments (Breard et al., 2016; Breard and Lube, 2017). Other conceptual models posit that end-members exist between forced-convection and inertia-dominated flows (Doronzo, 2012). Complexity, unsteadiness, and non-uniformity of PDCs also arise from variability of the collapse source through time (e.g., Mellors et al., 1988; Sato et al., 1992; Calder et al., 2002; Cole et al., 2002; Woods et al., 2002); the interaction of the flows with complex topography (e.g., Stinton, 2007; Charbonnier and Gertisser, 2012; Doronzo et al., 2012; Ogburn et al., 2014); erosion and sedimentation processes (e.g., Cole et al., 2002; Doronzo, 2012; Sulpizio et al., 2014); among other factors. Additionally, the rheology of PDCs changes through space and time (e.g., Iverson and Vallance, 2001; Dartevelle, 2004; Bursik et al., 2005; Iverson and George, 2012; Sulpizio et al., 2014; Dufek, 2016) due to the many of the factors that contribute to the unsteadiness of the flows, as listed previously. The complexity and limited understanding of many aspects of the physics of PDCs make predicting the behavior of these flows using empirical or physical models challenging, as every model must make simplifications. Determining which of these simplified models are useful for simulating different volume PDCs, in different environments, and with different operational constraints remains a problem.
Model Validation and Benchmarking
Mitigation of risk associated with PDCs depends upon accurate forecasting of possible flow paths or inundation areas, often using the distribution of past deposits, empirical models using various mobility metrics, or the application of geophysical flow models. Different models vary in their ability to reproduce the runout, inundated area, velocity, and local emplacement features of natural PDCs. Geophysical mass-flow models use simplified rheological laws that attempt to capture the bulk flow behavior in both time and space (e.g., TITAN2D, Pitman et al., 2003; Patra et al., 2005; VolcFlow, Kelfoun and Druitt, 2005; Kelfoun et al., 2009). Alternatively, empirical models use statistical relationships between flow volume and runout or area in order to forecast inundation (e.g., LAHARZ, Iverson et al., 1998; energy cone, Sheridan, 1979; Malin and Sheridan, 1982). While these popular models have been used to reproduce a variety of specific PDCs at different volcanoes (e.g., Widiwijayanti et al., 2008; Charbonnier and Gertisser, 2009; Kelfoun et al., 2009; Tierz et al., 2016), little work has been undertaken to compare models in a systematic way. The work that does exist compares a few models to a single, well-studied PDC (e.g., Charbonnier and Gertisser, 2012; Charbonnier et al., 2013).
This work expands upon single-deposit comparisons of models by validating and benchmarking popular models against each other to recreate all 13 mapped, dome-collapse PDCs that remained on land at Soufrière Hills Volcano (SHV), Montserrat, and were emplaced during the most recent eruption, with dates ranging from 1996 to 2010. Model validation is the comparison of model results to reality, while benchmarking involves the comparison of models that simulate the same physical processes using identical initial and boundary conditions. The purpose of this undertaking is not to rank or judge models, but rather to understand the extent to which the different modeling approaches can replicate reality in certain conditions, and to explore the dynamics of PDCs themselves (e.g., Charbonnier, 2013). Benchmarking exercises can inform users of the strengths and weaknesses of different models for their use in research and hazard management. In particular for the generation of hazard maps, model choices need to be defendable for each set of flow scenarios considered. Benchmarking can also constrain the circumstances under which each of these models performs best. The work presented herein is an example of benchmarking against natural cases, wherein the input parameters are estimated from any existing observations and field data and then adjusted in order to fit the inundation footprint of the actual PDC (Charbonnier, 2013). Importantly, this work also compares these best-fit, “tuned” model outputs and the input parameters used to achieve them with results and input parameters based on field measurements and empirically-derived relationships (e.g., friction-volume relationship) from the global FlowDat database of mass flows (Ogburn, 2012, 2014; Ogburn et al., 2016). This is an important advance because it avoids only evaluating highly “tuned” model results, and instead strives to also compare models' ability to forecast inundation using field- or statistically-derived input parameters.
PDC Modeling at Soufrière Hills Volcano
PDCs at SHV have been modeled using a variety of tools, including TITAN2D (Widiwijayanti et al., 2007; Hidayat et al., 2008; Ogburn, 2008), LAHARZ/PFZ (Widiwijayanti et al., 2008), PDAC (Esposti Ongaro et al., 2008), PYROFLOW (Wadge et al., 1998), and energy cones (Wadge and Isaacs, 1988). The Montserrat Volcano Observatory (MVO) and the Scientific Advisory Committee (SAC) have also used some of these models to simulate PDCs, usually for forward modeling and hazard management purposes, and multiple-model analysis of hazards. The SAC performed a limited comparison of these models for the simulation of the 8 January 2007 PDC (Scientific Advisory Committee, 2007), and found that PYROFLOW underestimated runout by 20%, while LAHARZ/PFZ and TITAN2D were able to replicate the runout. A follow-up study compared the performance of these models in replicating the 8 January 2010 and 11 February 2010 PDCs (Stinton et al., 2010; Scientific Advisory Committee, 2011; Wadge et al., 2014). The models produced relatively similar results, but were highly tuned (i.e., the input parameters were adjusted to produce the best outputs). Recent work has developed an advanced methodology for modeling PDCs, by using fast emulators of geophysical flow models in order to effectively simulate the ongoing hazard posed by PDCs on Montserrat as the situation at the volcano evolves (Bayarri et al., 2009; Spiller et al., 2014; Calder et al., submitted). Effectively combining multiple modeling techniques or the use of statistical emulators for hazard mapping requires that the limitations and strengths of each model be well understood.
SHV Deposits
The ongoing eruption (1995-present) at SHV is used as a case study throughout this work, due to the number and variety of PDC events, and the wealth of detailed studies of deposits and real-time observations of PDCs in motion. The eruption is characterized by the extrusion of a series of large lava domes and Vulcanian explosions. Volcanic mass flows have included dome-collapse block-and-ash flows (BAFs) (Calder et al., 1999; Cole et al., 2002), column-collapse pumice flows (Calder et al., 1999; Cole et al., 2002, 2014), ash-cloud surges (Calder et al., 1999; Cole et al., 2002, 2014; Ogburn et al., 2014), surge-derived PDCs (Calder et al., 1999; Druitt et al., 2002), hydro-volcanic flows generated by PDCs interacting with seawater (Edmonds and Herd, 2005), debris avalanches (Sparks et al., 2002), and frequent lahars (Sparks and Young, 2002; Wadge et al., 2014). The eruption has produced many thousands of rockfalls and PDCs; however, there are 20 mapped, dome-collapse BAFs, ranging in volume from 0.2 to 210 × 106 m3, 13 of which remained on land. These 13 PDCs (Table 1) are modeled using TITAN2D, VolcFlow, LAHARZ, and ΔH/L cones. While modeling was performed using all 13 events, three main BAFs will serve as examples:
• 5 June 1997 (Figure 1A, Table 1) was a smaller-volume, discrete, channelized BAF with a minimal ash-cloud surge component (Cole et al., 2002).
• 25 June 1997 (Figure 1B, Table 1) was a larger-volume, sustained dome collapse, and the only PDC to cause fatalities at SHV. It was well documented by eyewitnesses, seismic signals, photographs and video footage (Loughlin et al., 2002). It consisted of three main flow pulses, successively overrunning the deposits of previous pulses and produced an extensive, detached ash-cloud surge. This PDC also produced a surge-derived flow (included in the figures herein to avoid distortion of the deposit maps), which exhibited a unique generation mechanism and different flow dynamics to the rest of the surge (Druitt et al., 2002; Loughlin et al., 2002).
• 8 January 2010 (Figure 1C, Table 1) was a medium-volume PDC, which was recorded in detail via HD and thermal video (Molle, 2012), and which entered the Belham Valley (Molle, 2012; Cole et al., 2014). This PDC was included despite being associated with a Vulcanian explosion because it exhibited characteristics that were transitional in nature between typical pumice flows from Vulcanian fountain collapse and typical dome-collapse BAFs: while an eruption column reached 8.3 km, the PDC was largely sourced from the dome summit (Cole et al., 2014), possibly as a result of a small blast or boiling-over dome-collapse, and pumice clasts accounted for only 5 wt% by volume of the deposits. Furthermore, the morphology of the flow deposit resembled the BAFs from other dome-collapse events. This PDC also represents one of only three mapped flows to inundate the Belham Valley, which, from a hazards perspective, is especially important to investigate, as it is the only valley that directs PDCs toward currently inhabited areas.
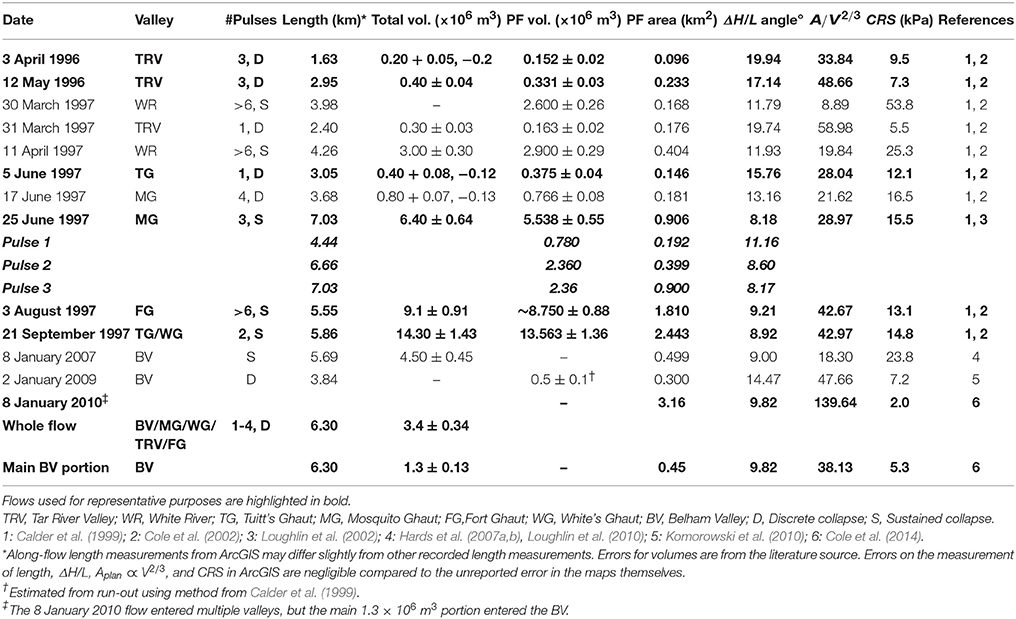
Table 1. Dome-collapse pyroclastic density currents from Soufrière Hills Volcano, Montserrat, 1996–2010.
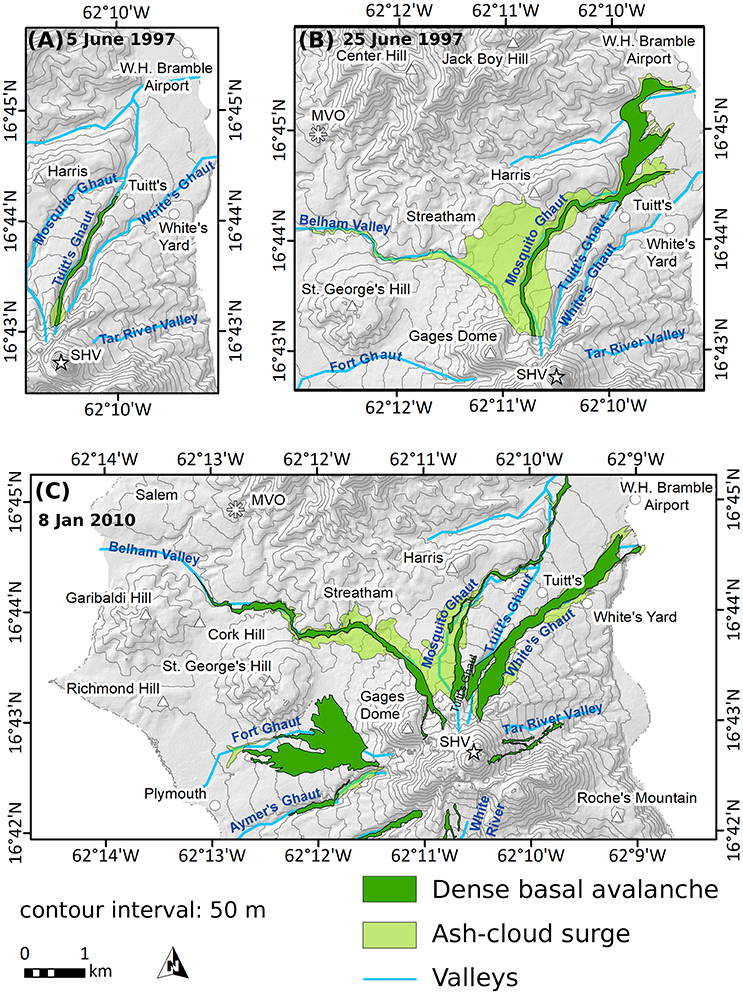
Figure 1. (A) 5 June 1997 PDC deposit map, showing the complete confinement of the dense-basal avalanche inside of the valley, with limited ash-cloud surge deposits around valley bends, and slightly overrunning the dense-basal avalanche at the flow front. (B) 25 June 1997 PDC deposit map, showing the distal spreading of the dense-basal avalanche. The surge-derived flow sourced from the detached surge can be seen traveling down the Belham River Valley toward the west. (C) 8 January 2010 PDC deposit map, showing the full extent of the explosively generated dome-collapse event. The largest volume (1.3 × 10⁶ m3) traveled down the Belham River Valley toward the west, while smaller volumes of material traveled down most major drainages. Despite the radial distribution, the flow itself was closer in nature to a block-and-ash flow, although there was a small blast component and perhaps a small amount of low-altitude column-collapse. The last 250 m of the dense-basal avalanche deposit may be a surge-derived flow. Rivers and valleys are labeled in blue.
Three other flows, 3 April 1996, 3 August 1997, and 21 September 1997, are examined more briefly and represent a wide range of emplacement characteristics (Cole et al., 2002). The 3 April 1996 PDC was a smaller-volume, discrete collapse, which propagated down the steepest valley on Montserrat, the Tar River Valley, with an average slope of >10°. The 3 August 1997 PDC was a larger-volume dome-collapse, which traveled down the wide Fort Ghaut. This flow represents one of the only flows on Montserrat to have a significant portion of the flow that traveled unchannelized. The 21 September 1997 PDC was a larger-volume event, which mainly traveled down Tuitt's Ghaut, but with some volume also traveling down White's Ghaut, and thus represents the only flow with significant volume in multiple valleys. These factors (high slope, lack of channelization, and multiple valley emplacements) are useful conditions under which to test the behavior of the models.
Mass Flow Models and Methods
Energy Cone or ΔH/L Models
Early modeling of PDCs was based on the Heim coefficient, or ΔH/L ratio, where ΔH is the fall height traversed by a flow and L is the runout length, a mobility metric established by the debris avalanche community (Heim, 1932). ΔH/L is equivalent to the coefficient of friction (or basal friction angle) in a sliding-block or Coulomb friction model (Shreve, 1968; Scheidegger, 1973), in which shear stress at the initiation of failure is proportional to the normal stress. ΔH/L exhibits a roughly linear inverse relationship with PDC volume on a log-log plot (Hayashi and Self, 1992).
To apply the concept to PDC runout forecasting, Sheridan (1979) used the ΔH/L vs. volume relationship to create an “energy line,” which intersects topography and predicts the stopping location of flows. Malin and Sheridan (1982) expanded this concept to an “energy-cone” and incorporated computer image-processing techniques to make simple volcanic hazard maps at Mount St. Helens. The energy-cone or ΔH/L cone concept has been used successfully at a variety of volcanoes (e.g., Sheridan and Malin, 1983; Sheridan and Macías, 1995; Alberico et al., 2002; Sheridan et al., 2004; Tierz et al., 2016), including SHV (Wadge and Isaacs, 1988). Validation tests of the energy cone model at Vesuvius and Campi Flegrei volcanoes (Italy) showed that the energy cone model performed as well as or better than other mass flow models (Tierz et al., 2016). An ΔH/L cone can be drawn by hand using nothing but a paper contour map, but this can be time consuming. Many software packages (Vhub Energy Cone, Palma, 2013; LAHARZ) have built-in tools to automatically generate ΔH/L cones over a digital elevation model (DEM).
In this work, ΔH/L cones were produced using ΔH/L values from two ΔH/L vs. volume (V, in km3) regressions from FlowDat (Ogburn, 2012, 2014; Ogburn et al., 2016); one ΔH/L vs. volume regression is derived from just the 13 mapped SHV BAFs that remained on land (Figure 2):
or
with R2 = 0.93.
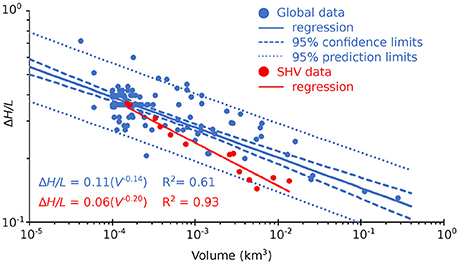
Figure 2. Global PDC mobility data (blue) illustrating the linear regression (solid blue line) between flow volume and ΔH/L, with confidence (dashed blue line) and prediction (dotted blue line) intervals. SHV data (red) and the SHV-only regression (solid red line) are also shown. Error bars, where reported, are smaller than the symbols. Data are from FlowDat (Ogburn, 2012), collected from Nakada and Fujii (1993); Calder et al. (1999); Nakada et al. (1999); Bourdier and Abdurachman (2001); Cole et al. (2002, 2014); Loughlin et al. (2002); Saucedo et al. (2002, 2004, 2005, 2010); Macias et al. (2006); Hards et al. (2007a,b); Thouret and Lavigne (2007); Charbonnier and Gertisser (2008, 2011); Coombs et al. (2010); Komorowski et al. (2010, 2013); Vallance et al. (2010); Charbonnier et al. (2013); Kripner et al. (in review); Takarada (pers. commun).
The other ΔH/L vs. volume regression used is derived from the global FlowDat database of over 120 BAFs with ΔH/L and volume data that remained on land (Figure 2):
or
with R2 = 0.61 (reflecting the scatter in mobility of PDCs at different volcanoes).
These equations for ΔH/L vs. volume are used for ΔH/L cones, but are also used to calculate empirically-derived apparent basal friction angles (for TITAN2D).
TITAN2D
TITAN2D is a geophysical model that simulates dry granular mass-flows over DEMs of natural terrain in time and space. The model assumes that mass flows behave as shallow, incompressible flows (Patra et al., 2005). Following Savage and Hutter (1989, 1991), Iverson and Denlinger (2001) and Denlinger and Iverson (2001), TITAN2D employs depth-averaged shallow-water equations for the conservation of mass and momentum. The newest, two-phase, version of TTIAN2D (4.0.0) now allows the user to select from various material models (Mohr-Coulomb, Voellmy, or Pouliquen-Forterre). In this work, the Mohr-Coulomb friction terms are used for both the grain–grain interactions within the flow (internal friction) and grain–surface interactions (basal friction). TITAN2D outputs flow depth, velocity, and momentum through time. These products can be used to map inundation area, run-up height, and velocity of the modeled flow using a GIS. A full description of the governing equations, and solution and computational methods employed by TITAN2D can be found elsewhere (Pitman et al., 2003; Patra et al., 2005). More information can also be found on the TITAN2D Users group (https://vhub.org/groups/titan2dusers) and User's Guides (https://vhub.org/resources/titan2d/supportingdocs).
Comparisons of TITAN2D with both experimental granular flows and real PDCs have shown success. Patra et al. (2005) and Bursik et al. (2005) performed extensive verification of the TITAN2D code, as well as validation against experimental sand flows and the 1991–1999 PDCs at Colima Volcano, Mexico. Since its development, TITAN2D has been used by numerous workers to simulate PDCs (Procter et al., 2004a; Bursik et al., 2005; Rupp et al., 2006; Widiwijayanti et al., 2007; Hidayat et al., 2008; Macías et al., 2008; Ogburn, 2008, 2014; Charbonnier and Gertisser, 2009; Murcia et al., 2010; Charbonnier et al., 2013); debris avalanches (Sheridan et al., 2005; Grieco and Capra, 2007; Groppelli et al., 2008); and lahars (Munoz et al., 2004; Procter et al., 2004b; Delaite et al., 2005; Darnell et al., 2008). However, most of these studies involve modeling PDCs in a forecasting capacity; only a few have validated the model against known deposits: at Colima (Bursik et al., 2005; Patra et al., 2005; Rupp et al., 2006) and Merapi, Indonesia (Charbonnier and Gertisser, 2009, 2012; Charbonnier et al., 2013). Charbonnier and Gertisser (2009) used TITAN2D to simulate both discrete and sustained dome-collapse BAFs from the June 2006 eruption of Merapi, using a collapsing pile and a variable bed friction. The simulated results were comparable to the actual deposits in terms of runout distance, inundated area, and thickness. They also found that TITAN2D closely reproduced local features such as run-up over obstacles and super-elevation around bends. Most importantly for modeling hazards, TITAN2D predicted areas where the flows debouched from main channels and formed overbank deposits. Flow velocity and duration of runout, however, were not well replicated by TITAN2D.
TITAN2D can be run as a stand-alone Linux program or as a web-app through Vhub.org, using collapse-pile or volume flux source geometries. In this work, pile parameters are taken from observations of collapse scar location and shape, where available. No initial velocity is used, unless the particular flow had a recognized blast component. Volume flux sources are also used, with fluxes estimated from the deposit volume and any available information on active collapse duration.
In TITAN2D, the internal and basal friction angles must be supplied by the user. TITAN2D is fairly insensitive to changes in internal friction angle, as long as the value falls within a reasonable range (25–45°) (Sheridan et al., 2005; Ogburn, 2008; Dalbey, 2009). Larger values provide resistance to lateral spreading. Basal friction, however, has a major effect on modeled flows (Stinton et al., 2004; Rupp et al., 2006). The ΔH/L values of the deposits themselves, converted to degrees, are used for the basal friction angles for deposit-derived model runs. Then, the basal friction parameter is varied in order to produce the best-fit results (Table 1). Both the deposit-derived and best-fit input parameters are then compared to basal friction angles derived from empirical ΔH/L vs. volume relationships from FlowDat (i.e., Equations 1 and 2), which can be used for forward modeling.
LAHARZ and PFZ
Other researchers (Dade and Huppert, 1998; Iverson et al., 1998; Iverson, 2003; Kelfoun and Druitt, 2005) have disputed the appropriateness of the constant friction models described by ΔH/L ratios and used for energy cones and TITAN2D for simulating mass flows. Iverson et al. (1998) derived a simple physical scaling argument for the observed relationship between the area and volume of lahars, where planimetric area, Aplan, is proportional to volume to the 2/3 power, V2/3. Calder et al. (1999) applied this metric to PDCs at Montserrat.
Schilling (1998) and Iverson et al. (1998) developed LAHARZ, a method of predicting lahar inundation zones that uses the A ∝V2/3 relationship directly using two equations with a physical basis derived from scaling analysis:
where Aplan is planimetric area, Axs is cross-sectional area, V is volume, and c and C are empirical calibrating coefficients derived from statistical analysis of field data. LAHARZ has been used mainly for simulating lahars, for which it was originally designed (Iverson et al., 1998). However, Griswold and Iverson (2007) performed the same analysis for debris flows and rockfalls and recalibrated the coefficients.
LAHARZ is implemented through an ArcGIS toolbox, consisting of tools that create surface hydrology grids, define a proximal hazard zone boundary, and model the inundation area. The proximal-hazard zone boundary is created by specifying parameters for an ΔH/L energy cone. The user chooses the coefficients C and c (Equation 3) by selecting the type of mass flow (lahar, debris flow, or rock avalanche) they wish to model. In modified versions of LAHARZ, such as PFZ (Widiwijayanti et al., 2008), and in this work, additional options have been added to this menu in order to model PDCs. Starting from either a user-selected upstream cell (usually the head of a valley), or the intersection of the stream and the proximal hazard zone boundary, LAHARZ fills in topography along the drainage, using the calculated cross-sectional area for a user-specified volume (Equation 3). The resultant planimetric area filled is added to a running tally, and LAHARZ uses the flow direction grid to move to the next downstream cell along the stream until the appropriate planimetric area is reached (from Equation 3).
Widiwijayanti et al. (2008) collected planimetric area and cross-sectional area measurements for the dense-basal avalanche component of BAFs. They recalibrated coefficients for BAFs and for a subset of data from SHV, Montserrat, calling the modified code “PFZ.” For start locations, they chose cells at what they deemed to be prominent breaks in slope of the valleys. In this way, they were able to recreate BAF deposit inundation areas at SHV (1996-1999 PDCs) and Merapi (2006 PDCs) with modest success. Lee et al. (2015) applied the same method to Merapi 2010 PDCs and achieved a 56% agreement between model results and actual inundation.
In this work, analysis of variance (ANOVA) was performed following Iverson et al. (1998) on parameters from the FlowDat mass flows database (Ogburn, 2012, 2014) to test and calibrate the relationship between Aplan and Axs and V2/3 (Equation 3) for PDCs. In addition to the FlowDat coefficients for all global BAFs, coefficients were also calculated for several subsets for comparison (Table 2). These subsets include BAFs from SHV only, BAFs < 2 × 10⁶ m3 in volume, and BAFs > 2 × 10⁶ m3 in volume. Coefficients used by Widiwijayanti et al. (2008) are also included for comparison. Coefficients from Table 2, and the exact coefficients for specific flows, are then used to run the model and these results are compared to produce best-fit results. Flows are started at the head of appropriate valleys, and at prominent breaks in slope, after Widiwijayanti et al. (2008). The best-fit results are compared to results using the globally-derived FlowDat coefficients.
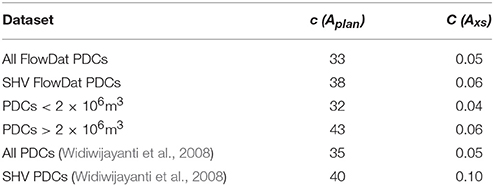
Table 2. Coefficients c and C for Aplan and Axs vs. V2/3 relationship calculated from the 2/3-slope regression model and ANOVA analysis of FlowDat data, compared to coefficients calculated by Widiwijayanti et al. (2008).
While the relationship between planimetric area and volume of PDCs has been explored, it is important to note that measurements of the cross-sectional area Axs for PDCs are somewhat problematic. Unlike lahars or debris flows for which LAHARZ is intended, the thickness and therefore Axs of PDCs in motion is much more difficult to ascertain from the field, and PDC deposit thickness is poorly correlated with flow thickness. The appropriateness of using LAHARZ, an empirical (but physically based) topography-filling algorithm for PDCs is debatable, even if the resultant inundation footprints are similar to the real flows.
VolcFlow
Dade and Huppert (1998) derived an energy balance argument for the area and runout of debris flows that also used the A ∝V2/3 relationship, and argued that their analysis implied a constant resisting shear stress. Kelfoun and Druitt (2005), Kelfoun (2008), and Kelfoun et al. (2009) have argued that constant friction models are ill-suited for reproducing pyroclastic flows and instead built on the conceptual model of Dade and Huppert (1998) to create VolcFlow, a model that can use a constant retarding stress (CRS), which is independent of flow velocity or volume. Under this model, the ratio of the driving to retarding stresses is not constant as in a frictional model, but rather decreases with increasing thickness (Kelfoun et al., 2009). Flows are able to move when thicker than a certain threshold as the driving stresses dominate; and when below this thickness threshold, CRS dominates and flows slow down (Kelfoun et al., 2009).
VolcFlow runs inside MATLAB and solves depth-averaged equations of mass and momentum using a topography-linked coordinate system in time and space, much like TITAN2D. The stress parameter in VolcFlow is not fixed to a frictional model, but instead can be used to simulate a variety of rheologies. Internal and basal friction, cohesion, viscosity, and coef_u2 (a dimensionless parameter that defines turbulent or collisional stress) form the basis of the rheological law chosen (frictional, viscous, Bingham, Voellmy, etc.) in the input files, which must be modified by the user. Cohesion is defined by the CRS in kPa. The CRS condition is a rheological law derived from the energy balance analysis of Dade and Huppert (1998) that states that the retarding stress is constant and independent of any other flow parameter (Kelfoun and Druitt, 2005; Kelfoun et al., 2009). Reasonable values for CRS were empirically determined by Kelfoun and Druitt (2005) and Kelfoun et al. (2009), and ranged from 5 to 50 kPa for PDCs, with larger-volume, thicker flows requiring higher CRS values (Kelfoun et al., 2009). Kelfoun et al. (2009) could not provide a physical basis for this relationship however, and cited this as the main weakness of the VolcFlow CRS model. More information can also be found on the VolcFlow model webpage (Kelfoun, 2009; http://wwwobs.univ-bpclermont.fr/lmv/perso/Kelfoun_Karim/VolcFlow/VolcFlow.html)
VolcFlow has shown success in replicating experimental results, including shocks, rarefaction waves, and granular jumps for debris avalanche deposits using the CRS condition (Kelfoun and Druitt, 2005). Kelfoun and Druitt (2005) reproduced the inundated area, surface features, and thickness of the Socompa avalanche in Chile using VolcFlow with a CRS between 50 and 100 kPa. Kelfoun et al. (2009) also used VolcFlow (CRS 5 kPa) to replicate the inundated area, thickness, lobe shape, and velocity of the 2006 PDCs at Tungurahua volcano, Ecuador. These pyroclastic flows were sustained currents formed by the gravitational collapse of material being continuously deposited on the upper flanks of the volcano by volcanic fountaining (Kelfoun et al., 2009), making these flows somewhat unusual in their source conditions. The emplacement of the VolcFlow simulations progressed as a series of pulses, as mass accumulated at the crater rim until reaching a critical thickness, at which point it began to flow, and then accumulate again (Kelfoun et al., 2009), behavior not usually observed during other dome-collapse events. While VolcFlow has also been used to successfully replicate three PDCs from Merapi Volcano, (Charbonnier and Gertisser, 2012; Charbonnier et al., 2013), it has only been validated using a small sample of natural deposits.
In this work, VolcFlow is used to replicate the selected SHV PDCs using a CRS parameter and a bulk density estimate. CRS is estimated using SHV deposit parameters from FlowDat following Dade and Huppert (1998), where:
where λ is a plan shape factor, equal to the ratio of the average width to the length of a flow; ρ is flow bulk density; g is gravity; H is the fall height traversed by a flow; V is volume; and Aplan is planimetric area. CRS values calculated from deposit parameters are used as a starting point, and varied to produce best-fit simulation results. VolcFlow bulk density is roughly estimated, taking deposit bulk density and values used by Kelfoun et al. (2009) into account. Minimum, maximum, and average estimates of bulk density are used for different model runs, but only average estimates are discussed herein as the final results did not differ greatly.
VolcFlow outputs flow depth, velocity, and position of center of mass for each time step. The output files can be imported into GIS software for further analysis.
Digital Elevation Models
It is important that the DEM be as close to a “pre-mass flow” condition as possible when recreating past deposits, and as close to current topography when forward modeling, as changes to valley carrying capacity can have profound effects on modeled flows (Ogburn, 2014; Ogburn et al., 2014). Four DEMs were used for this work (Supplementary Table 1), depending on the date of the flow to be modeled. The dome areas of the DEMs were especially important for the TITAN2D, VolcFlow, and ΔH/L cone model runs starting from the dome summit.
Model Output Processing and Analysis
Two major post-processing considerations are required for TITAN2D and VolcFlow: (1) determining the stopping criteria and thus the stop time, and (2) creating a map that can be suitably compared to real flow deposit maps. Neither TITAN2D nor VolcFlow can stop a flow independent of a user defined maximum time limit, as the velocities will never reach zero. Instead, the user must decide upon reasonable criteria to consider the flows stopped. For this work, the stopping criteria of Yu et al. (2008) were applied in conjunction with other measures, including visual examination of maximum velocity plots. While the problem of unrealistically thin material at simulated flow margins propagating with high velocities in TITAN2D, i.e., the “thin layer problem,” has been largely reduced by Dalbey (2009), results still indicate high-velocity, unrealistically thin areas. Filtering the simulated thicknesses to exclude flows less than 10 cm eliminates these areas, but removes less than 5% of the total flow volume. This method of thickness filtering was employed by Charbonnier and Gertisser (2009, 2012) and Charbonnier et al. (2013).
Goodness of fit between model runs and PDC deposits was determined using a combination of methods. Inundated area and runout were compared to PDC maps, along with specific features, such as areas where a flow over-spilled a channel. Velocity, flow thickness, and duration were also compared to field measurements and observations where available.
Not all of these parameters can be compared between models, or directly between models and actual flow parameters (Table 3). For instance, although VolcFlow and TITAN2D are both time domain models, VolcFlow does not output total maximum velocities reached in each cell, while TITAN2D does. LAHARZ and ΔH/L only compute inundated area or runout limits respectively, with no velocity or thickness information. Both TITAN2D and VolcFlow produce a continuous record of maximum velocities at each time-step, but not flow front velocities. Flow front velocities are most commonly recorded for actual PDCs (e.g., Calder, 1999; Loughlin et al., 2002; Molle, 2012), and there can be significant differences between flow front and maximum velocities within a flow. Simpson (1999) reported that experimental flow front velocities were only 60% of maximum velocities reached by other parts of the flow. For these reasons, it is necessary to compare the models quantitatively wherever possible, but also to qualitatively examine circumstances under which each model performs well, or fails to reproduce the natural examples. It is also important to reiterate that these models only simulate the dense-basal avalanche component of the PDCs, and not the coupled, dilute, ash-cloud surge. Additionally, none of the models simulate deposition and thus do not produce deposit maps; final time-step inundation and thickness maps are compared with actual deposits in the figures.
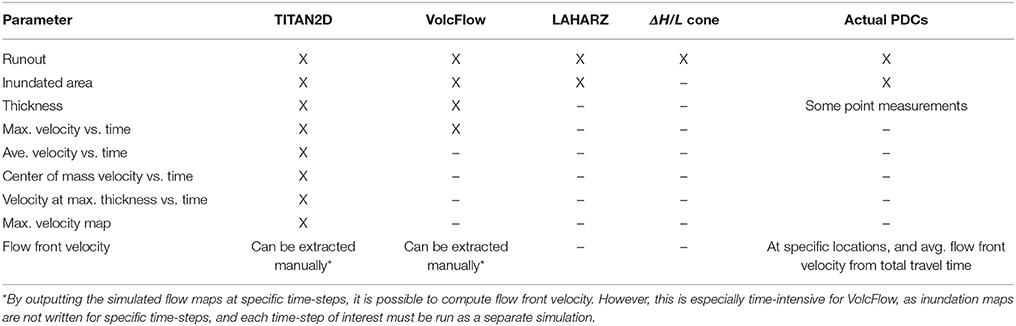
Table 3. Output parameters by model compared to parameters obtainable for PDCs in nature.
Model Comparison Results
To produce best-fit model runs, basal friction is varied in TITAN2D, CRS is varied in VolcFlow, and the coefficients C and c and starting locations are varied for LAHARZ. For the best-fit ΔH/L cones, the SHV-only ΔH/L vs. volume regression was used. Best-fit results are compared with “non-calibrated” deposit-derived results obtained using only observed PDC data as input parameters; namely, deposit-derived basal friction (ΔH/L), deposit-derived CRS, globally-derived LAHARZ coefficients, and the global ΔH/L vs. volume regression. This allows a comparison of TITAN2D, VolcFlow, LAHARZ, and ΔH/L cones from both a fully calibrated or “best-fit” perspective, and from the perspective of a modeler using only past deposits (or empirically-derived global mobility relationships from FlowDat) to estimate model inputs. For TITAN2D and VolcFlow, best-fit, deposit-derived, and both global and local empirically-derived input parameters from FlowDat are later compared.
In the following figures, only TITAN2D flux sources are compared to the other models, although TITAN2D collapsing-pile sources were also investigated. In general, simulations using TITAN2D with a collapsing pile often show considerable spread outside of the intended direction, with significant volumes entering other valleys. This is caused by the problem of the collapse pile geometry itself, as a pile of the appropriate volume can be quite large (both planimetrically and in height) relative to the dome summit. Tall pile sources also produce extremely high velocities on steep proximal slopes. These factors tend to produce decreased runout as compared to the actual deposit, as the volume is subsequently partitioned between multiple valleys. This issue poses significant problems when modeling smaller-volume flows, which are usually completely channelized in nature. This can be partially compensated for by slicing the summit topography in such a way as to direct the collapsing pile more readily (Ogburn, 2008), carefully selecting starting coordinates and initial directions through trial and error, or introducing a varying basal friction component for different slopes in order to slow the simulation on steep slopes (Charbonnier and Gertisser, 2012; Charbonnier et al., 2013). Alternatively, a volume flux starting geometry can be used instead, and is used here for the model comparisons in this work.
5 June 1997
Figure 3 and Table 4 shows the comparison between TITAN2D (Figures 3A,B), VolcFlow (Figures 3C,D), LAHARZ (Figures 3E,F), and ΔH/L cone (Figures 3G,H) model outputs of the 5 June 1997 event. The left column shows the best-fit results, while the right column shows the non-calibrated deposit-derived (TITAN2D and VolcFlow) or globally-derived (LAHARZ and ΔH/L cone) results. All models were able to replicate the runout of the 5 June 1997 event reasonable well (< 100 m error, within 3% for best-fit model runs). TITAN2D best-fit results (Figure 3A) simulate some material entering White's Ghaut, and VolcFlow best-fit results (Figure 3C) simulate material that travels down the Tar River Valley to the east, and Mosquito Ghaut to the northwest, which was not observed in reality. TITAN2D fails to model any final thickness in the proximal area of the channel, but simulated flows did travel through this area. Conversely, the final time-step of VolcFlow unrealistically shows material on the slopes of the dome. VolcFlow final time-step thicknesses do a better job in replicating the morphology of the deposit front, with a more sharply defined, steeper margin; while TITAN2D final time-step thicknesses show more gradual tapering than was seen in the field. Deposit-derived TITAN2D input parameters underestimate the runout of the flow (Figure 3B) by 380 m (12%), while deposit-derived VolcFlow input parameters severely underestimate runout by 1.43 km (45%). LAHARZ also replicates this flow well (runout within 100 m, or 3%), using the values for Montserrat PDCs (Table 2) as calculated by Widiwijayanti et al. (2008) (Figure 3E), while globally-derived FlowDat input coefficients slightly overestimate runout (Figure 3F) by 260 m (8%). The SHV-only ΔH/L cone estimates runout within 100 m (3%) (Figure 3G), while the globally-derived ΔH/L cone underestimates flow runout by 650 m (20%) (Figure 3H).
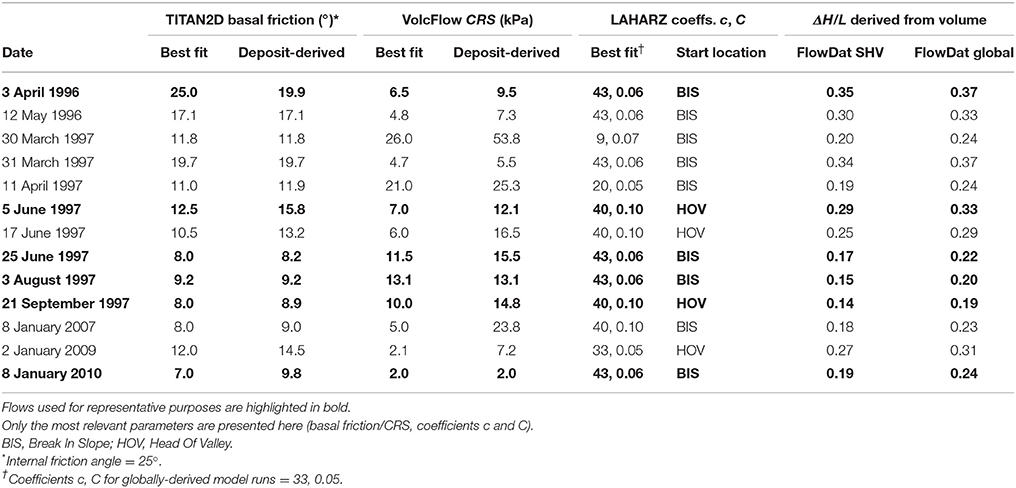
Table 4. Best fit vs. non-calibrated input parameters for TITAN2D, VolcFlow, and LAHARZ modeling of Soufrière Hills Volcano dome-collapse PDCs.
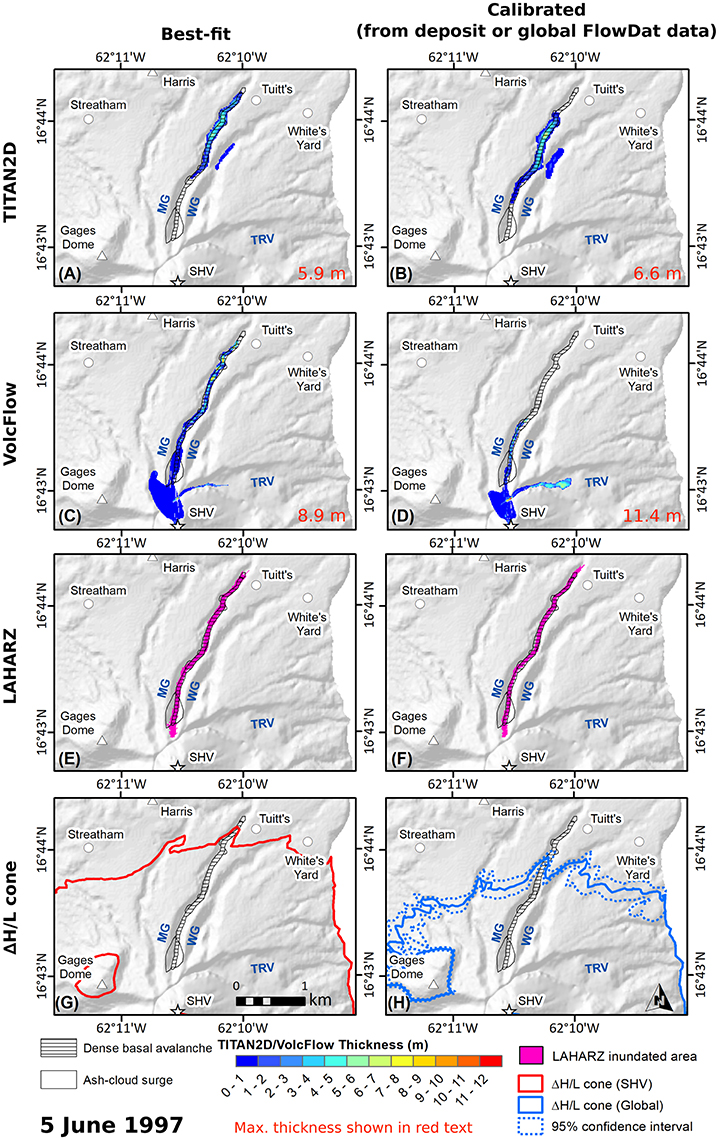
Figure 3. Comparison between TITAN2D (A) best-fit and (B) deposit-derived simulations; VolcFlow (C) best-fit and (D) deposit-derived simulations; LAHARZ (E) best-fit and (F) globally-derived coefficient model results; the (G) SHV-only ΔH/L cone and the (H) globally-derived ΔH/L cone for the 5 June 1997 PDC. Maximum final time-step thicknesses are displayed in red text for TITAN2D and VolcFlow results. Actual dense-basal avalanche (hatched) and ash-cloud surge (hollow) deposits are shown for comparison. Rivers and valley names are shown in blue (MG, Mosquito Ghaut; WG, White's Ghaut; TRV, Tar River Valley).
Plots of maximum velocities from TITAN2D flux and pile sources and VolcFlow (Figure 4A) are over 50 m·s−1, whereas the highest observed flow front velocity was about 30 m·s−1. Again, maximum velocities can be up to 60% higher than flow front velocities (Simpson, 1999), so this may not represent a serious mismatch in simulated velocity.
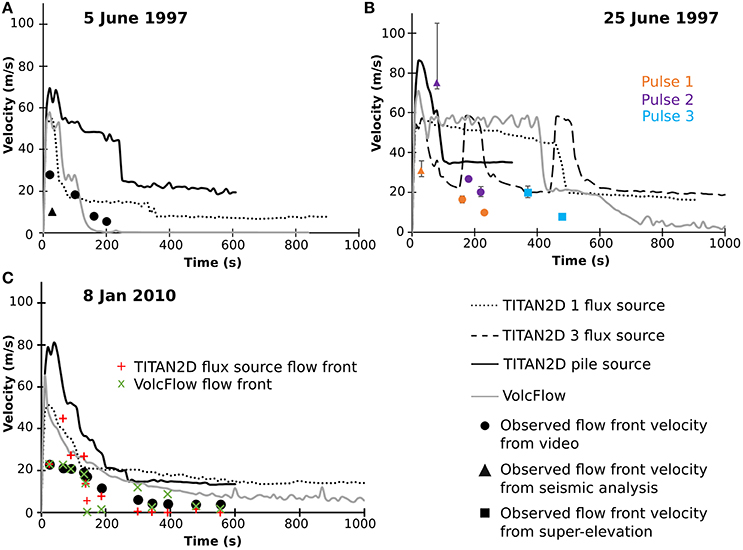
Figure 4. Comparison of maximum velocities through time from TITAN2D and VolcFlow compared to observed flow-front velocities for the (A) 5 June 1997. Flow front velocities are from Calder (1999), with error bars smaller than the symbols; (B) 25 June 1997. Flow front velocities are from Calder (1999), except velocities for pulse 3, which are from Loughlin et al. (2002); and (C) 8 January 2010. Flow front velocities are from Molle (2012), with error bars smaller than the symbols.
25 June 1997
Because the 25 June 1997 event was comprised of 3 distinct flow pulses, with known volumes, run-outs, velocities, and deposit footprints (Loughlin et al., 2002), TITAN2D simulations were performed using both 1 flux source and 3 different flux sources from the head of the valley using the known pulse volumes and initial velocities. However, the results did not show significant differences when varying the number of pulses, probably because the subsequent simulated flow pulses do not interact with previous simulated pulses in the way they do in reality, with the first pulses smoothing the topography as they deposit, and subsequent pulses bulking up as they traveled over and possibly entrained the earlier pulses. In fact, the 3 flux source simulation resulted in even more material escaping the channel and traveling north into uninvolved areas, due to the higher initial velocities used for the second and third flow pulses. For these reasons, only the single pulse source TITAN2D simulations were compared with VolcFlow. All models produced the runout of the 25 June 1997 event well (Figure 5, Table 4) (< 240 m error, within 3% for best-fit model runs), except the TITAN2D flux source (Figures 5A,B), which underestimated the runout by 0.6 km (9%). The TITAN2D pile source performed better in this regard (replicated the exact runout), but for comparison with VolcFlow (which uses flux sources), only the TITAN2D flux source is displayed. For both TITAN2D and VolcFlow, the non-calibrated, deposit-derived input parameters produced the best-fit model runs (Figures 5A–D), thus an identical simulation is shown for the best-fit and deposit-derived simulations for each model. Both the LAHARZ best-fit and globally-derived model runs produced similar results (Figures 5E,F), capturing the inundated area and runout well (within 0 and 36 m or 0 and 0.5%, respectively). The ΔH/L cone produced from SHV-only data slightly overestimated runout (Figure 5G) by 240 m (3%); while the ΔH/L cone derived from the complete global FlowDat dataset underestimated the flow runout (Figure 5H) by 1.6 km (23%).
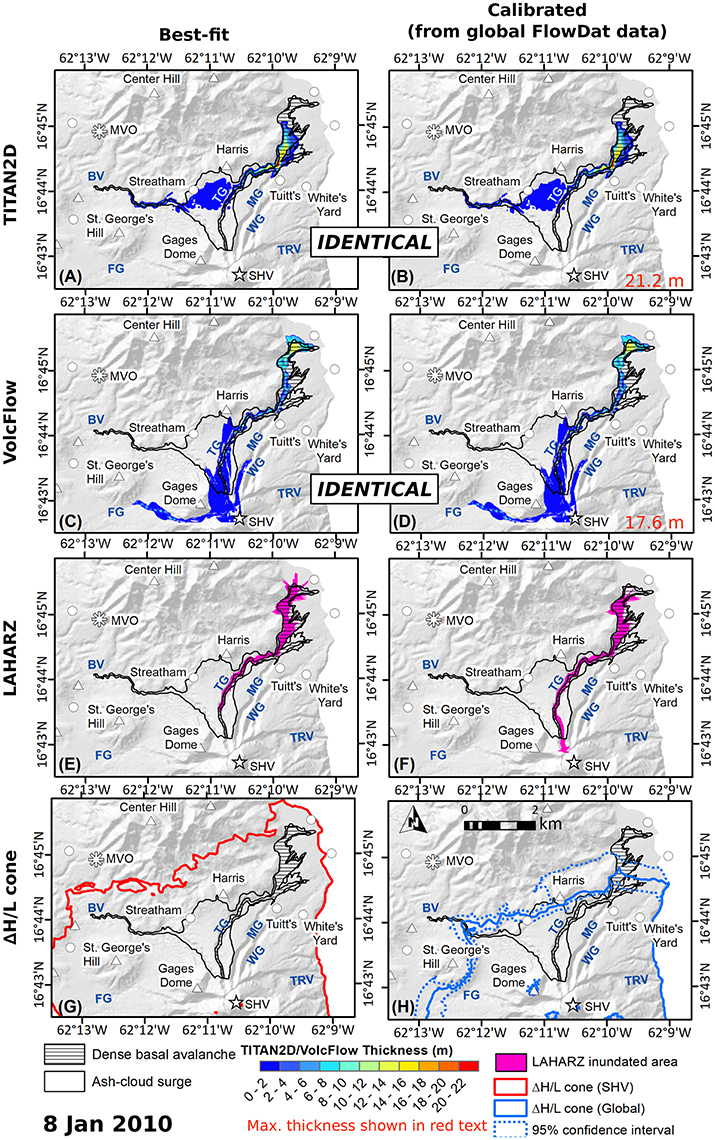
Figure 5. Comparison between TITAN2D (A) best-fit and (B) deposit-derived simulations (same in A,B); VolcFlow (C) best-fit and (D) deposit-derived simulations (same in C,D) (for both TITAN2D and VolcFlow, the non-calibrated, deposit-derived input parameters produced the best-fit model runs, thus identical simulations are shown for each); LAHARZ (E) best-fit and (F) global FlowDat coefficient model results; the (G) SHV-only ΔH/L cone and the (H) globally-derived ΔH/L cone for the 25 June 1997 PDC. Maximum final time-step thicknesses are displayed in red text for TITAN2D and VolcFlow results. Actual dense-basal avalanche (hollow and hatched) and ash-cloud surge (hollow) deposits are shown for comparison. Rivers and valley names are shown in blue (BV, Belham Valley; FG, Fort Ghaut; TG, Tuitt's Ghaut; MG, Mosquito Ghaut; WG, White's Ghaut; TRV, Tar River Valley).
As the 25 June 1997 flow debouched from the valley, it spread out onto the plain and gradually sheared out, forming poorly-defined margins. TITAN2D final time-step thicknesses capture this gradual thinning better than VolcFlow, which retains the well-defined, steep snout seen only in smaller-volume flows on Montserrat. TITAN2D simulations of the 25 June 1997 event sent material toward Streatham and into the Belham Valley, recreating the deposit map of the surge-derived PDC. The surge-derived flow is thought to have formed from rapid sedimentation from the ash-cloud surge as it traversed a break in slope and topographic barriers at the head of the Belham Valley (Calder et al., 1999; Druitt et al., 2002), and thus had a very fine-grained dense basal avalanche. While VolcFlow (Figures 5C,D) reproduced the runout within 30 m (0.4%) and the proximal to medial morphology well, it failed to recreate the lateral spreading and tapering of the flow in the distal reaches where the flow spilled out of the valley onto the plain. LAHARZ is also able to capture some of this spreading, as it continues to follow the stream network across the plain, filling a wider planimetric area as the channel shallows and widens. Similar to the 5 June 1997 results, the final time steps of TITAN2D fail to maintain thicknesses for the proximal 2 km of the flow, while VolcFlow unrealistically retains final time-step thicknesses on the slopes of the dome.
Velocities (Figure 4B) of the TITAN2D pile source were very high, approaching 90 m·s−1. However, seismic analysis of the flow front arrival times did point to relatively high velocities (~75 m·s−1) for the second flow pulse (Calder, 1999), so this may not be entirely unrealistic. The TITAN2D flux source and the VolcFlow simulation both produce similar maximum velocity records (Figure 4), with long plateaus that indicate the approximate duration that the modeled flux was active.
8 January 2010
It is important to note that the very thin distal end of the actual 8 January 2010 deposit is somewhat ambiguous in origin, representing either a very sheared portion of the basal avalanche, a portion of ash-cloud surge that overran the main flow, or possibly a surge-derived flow. With this in mind, each model performs reasonably well (within 5%) at reproducing the runout of the main flow (Figure 6, Table 4). It is also of note that TITAN2D, VolcFlow, and the ΔH/L cones were set to simulate the entire 3.4 × 10⁶ m3 dense-basal avalanche component of the BAF, which entered multiple valleys; whereas LAHARZ was set to model only the main 1.3 × 10⁶ m3 portion of the flow in the Belham Valley. In order to start LAHARZ runs in each of the inundated valleys, we would need to know how the volume was partitioned between those valleys; however, only the total flow volume and the volume that entered the Belham Valley are known.
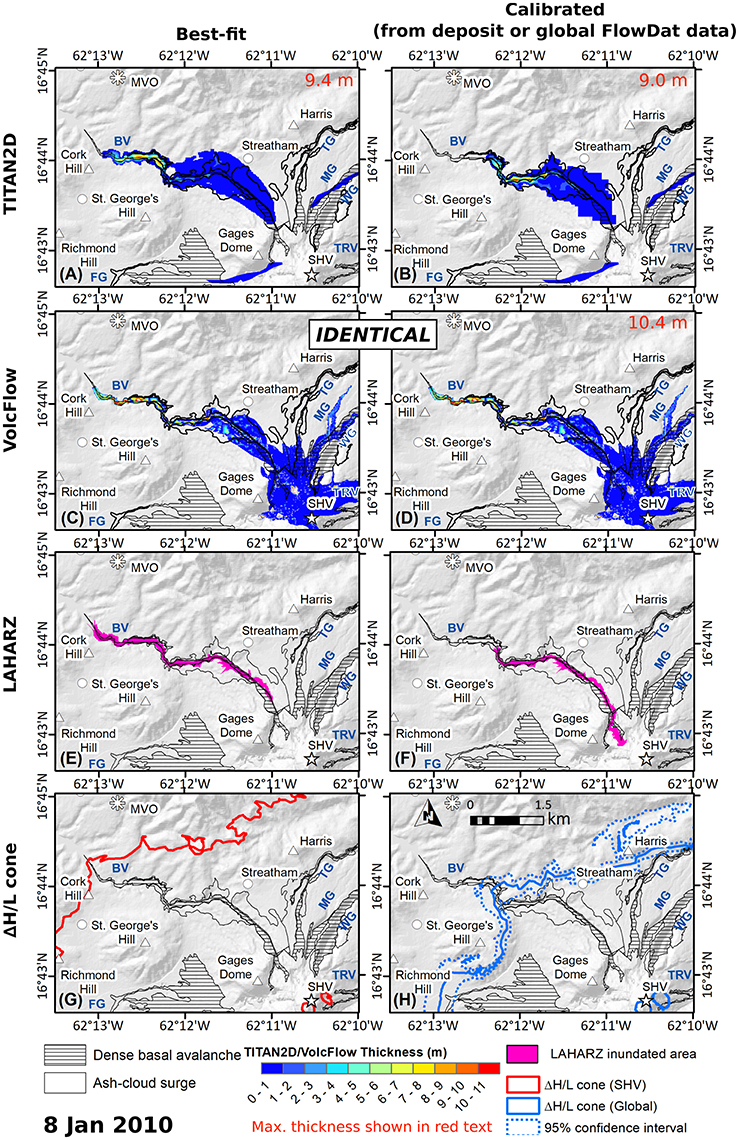
Figure 6. Comparison between TITAN2D (A) best-fit and (B) deposit-derived simulations; VolcFlow (C) best-fit and (D) deposit-derived simulations (same in C,D); LAHARZ (E) best-fit and (F) globally-derived coefficient model results; the (G) SHV-only ΔH/L cone and the (H) globally-derived ΔH/L cone for the 8 January 2010 PDC. Maximum final time-step thicknesses are displayed in red text for TITAN2D and VolcFlow results. Actual dense-basal avalanche (hatched) and ash-cloud surge (hollow) deposits are shown for comparison. Rivers and valley names are shown in blue (BV, Belham Valley; FG, Fort Ghaut; TG, Tuitt's Ghaut; MG, Mosquito Ghaut; WG, White's Ghaut; TRV, Tar River Valley).
All best-fit model runs are able to replicate this flow within 280 m, or 5% (Figure 6 left column). TITAN2D and LAHARZ both perform poorly when only using deposit-derived or globally-derived variables (Figures 6B,F), greatly underestimating runout by 1.3 km (22%) and 1.6 km (26%), respectively, perhaps because this flow was unusual in nature due to its somewhat explosive initiation mechanism. The same is true for the globally-derived ΔH/L cone (Figure 6H), which underestimates runout by 1.4 km (22%). The SHV-only ΔH/L cone reproduces the runout well, however, within 90 m (1.5%). Non-calibrated deposit-derived input parameters provided the best-fit model run for VolcFlow (Figures 6C,D, which are identical) and replicated the PDC runout (within 80 m or 1.3%) and inundated area well.
Velocities for both TITAN2D and VolcFlow (Figure 4C) are similar, with VolcFlow having slightly lower velocities. The observed velocities do not include the blast component, which was estimated at 70–100 m·s−1. The detailed flow front map produced by Molle (2012) for the 8 January 2010 event allows for the extraction of TITAN2D and VolcFlow flow front velocities (Figure 4C) by measuring the location of the simulated flow at the same time-steps recorded by Molle (2012). TITAN2D flow front velocities are higher than observed in proximal areas at early time-steps, but slightly lower than observed velocities in distal reaches and later time-steps (Figure 4C). VolcFlow flow front velocities match remarkably well in proximal areas and early time-steps, but are higher than observed flow front velocities in some distal locations and later time-steps (Figure 4C). These flow front velocities can also be compared to the maximum flow front velocities from each model. TITAN2D flow front velocities are about 42% of the maximum velocities, while VolcFlow flow front velocities are ~47% of the maximum velocities (Figure 4C), both of which are less than the 60% of maximum velocity recorded by Simpson (1999).
Other Selected Examples
While few PDC deposits have the associated level of recorded dynamical information (velocity, video, etc.) as the previous example events, it is useful to compare the models' ability to reproduce PDCs under different emplacement conditions. Figure 7A shows TITAN2D, Figure 7B VolcFlow, and Figure 7C LAHARZ model outputs of the 3 April 1996, 3 August 1997, the 21 September 1997 events. ΔH/L cone results are not compared here because they do not model flows down channels and therefore are not sensitive to these different emplacement conditions.
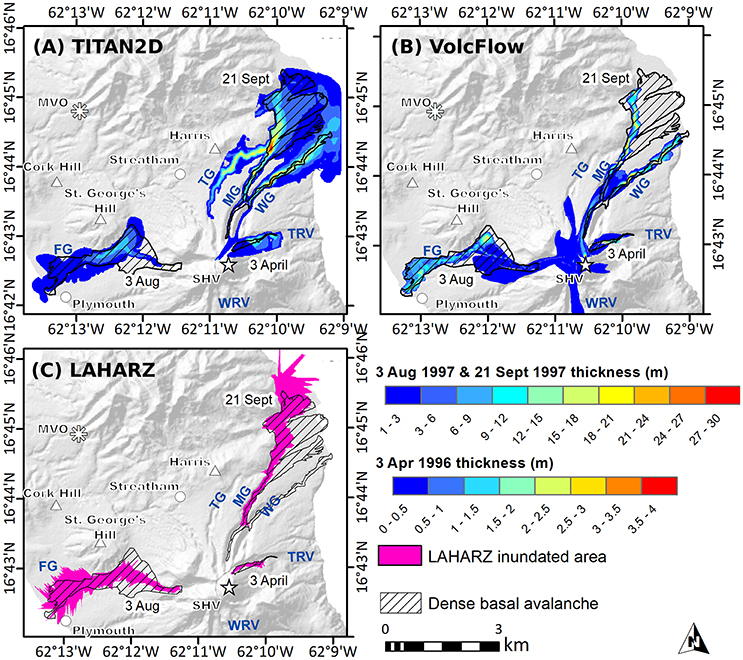
Figure 7. Comparison of (A) TITAN2D, (B) VolcFlow, and (C) LAHARZ model results for a selection of different PDCs, including the smaller-volume 3 April 1996 PDC in the Tar River Valley; the larger-volume, largely unchannelized, 3 August 1997 PDC in Fort Ghaut; and the larger-volume 21 September 1997 PDC, which entered both Tuitt's Ghaut and the White River, with an unknown volume distribution. Actual dense-basal avalanche (hatched) and ash-cloud surge (hollow) deposits are shown for comparison. Rivers and valley names are shown in blue (FG, Fort Ghaut; TG, Tuitt's Ghaut; MG, Mosquito Ghaut; WG, White's Ghaut; TRV, Tar River Valley; WRV, White River Valley).
TITAN2D and VolcFlow replicate the very small-volume 3 April 1996 event well (runout within 150 and 40 m or 9 and 2%, respectively), although the TITAN2D simulation exhibits more lateral spread than the actual flow. LAHARZ globally-derived coefficients greatly underestimate the runout of this flow by 450 m (28%), and to produce a better fit, the simulation must be run from a break in slope using coefficients calculated for larger-volume flows (Table 4). This PDC was moderately confined, but traveled down the steepest valley on Montserrat (Tar River Valley), making its planimetric area vs. volume ratio somewhat unusual compared to similar volume PDCs. Because the deposit map is also somewhat cruder than other maps, we consider the proximal lateral extent of the flow to be overestimated, perhaps contributing to this effect.
The 3 August 1997 PDC was channelized in the upper reaches of Fort Ghaut, was strongly deflected by St. George's Hill, and spread out in more distal areas to form a broad deposit. Both TITAN2D and VolcFlow reproduce the runout of this flow well (within 160 and 80 m or 3 and 1%, respectively), but both fail to completely capture the true amount of lateral spreading. VolcFlow captures the proximal spreading very well, whereas TITAN2D captures more of the deflection and spreading around St. George's Hill. VolcFlow, however, replicates the deposit front more accurately than TITAN2D. VolcFlow produces a moderate amount of material that travels to the south into the White River Valley, which was not observed for the actual event. LAHARZ is unable to capture any of the proximal spreading, as it can only infill the stream network. It overestimates the distal spreading, but replicates the flow runout within 90 m (2%).
The results for the 21 September 1997 PDC illustrate one of the major problems with using LAHARZ to model PDC inundation. While the empirical coefficients are often able to reproduce channelized flow runout reasonably well, LAHARZ cannot automatically diverge from a single stream network. In this case, LAHARZ (using globally-derived coefficients) greatly overestimates the runout of the 21 September 1997 event (by 1.3 km or 19%) because the entire modeled volume must travel down one valley, instead of two. Usually overspill into one stream network from another is handled manually in LAHARZ; that is, if a model run from one stream network intersects a previously unselected stream network, the user would start an additional model run down the intersected stream network. Volume partitioning can only be estimated in these cases, however. TITAN2D and VolcFlow do a better job of simulating this flow, although only TITAN2D is able to capture the full runout (within 180 m or 3%) and the lateral spreading as the flow exits the valley in the most distal areas. VolcFlow fails to reproduce the extent of the runout (by 560 m or 8%), as well as the distal spreading. TITAN2D, however, unrealistically sends a large amount of material to the north down Mosquito Ghaut.
Discussion
Implications for Hazard Modeling
The results of this modeling are important for hazard assessment in a number of ways. They illustrate the importance of appropriate selection of both models and model inputs, and demonstrate the utility of deriving model input parameters from global databases, such as FlowDat (Ogburn, 2012, 2014; Ogburn et al., 2016).
This work has focused on retrospective modeling of known PDCs, where the best-fit model runs are “tuned,” that is, input parameters are adjusted until the results replicate real flows. The need to fit parameters is a weakness of many geophysical models and is especially problematic for forward modeling. For this reason, the models were also tested using non-calibrated, deposit-derived or globally-derived input parameters. To this end, Figure 8 compares the deposit-derived and best-fit input parameters for TITAN2D and VolcFlow, and provides the equations for calibrating deposit-derived input parameters.
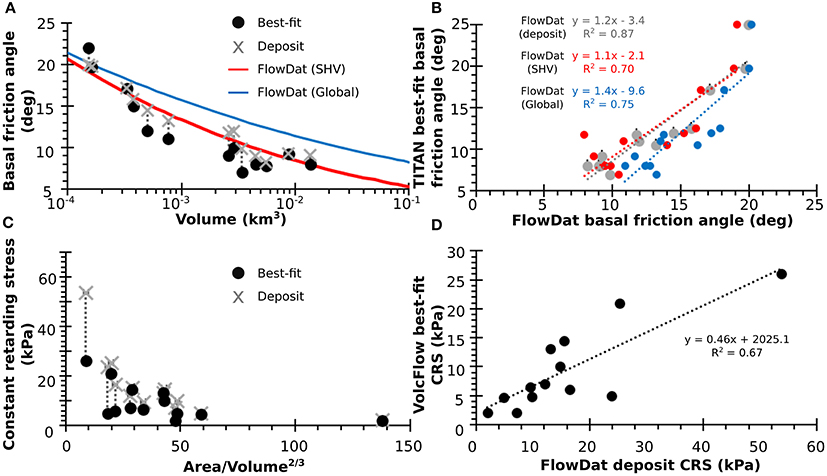
Figure 8. (A) FlowDat global mobility relationships (blue line), FlowDat SHV-only mobility relationships (red line), and deposit measurements (gray x's) compared to best-fit model inputs (black circles) for ΔH/L (converted to degrees, basal friction) vs. volume. (B) The calibration between the deposit-derived model inputs (gray), the FlowDat SHV-based (red), the global FlowDat based (blue), and the best-fit model inputs is shown for basal friction angle for TITAN2D. (C) Deposit measurements (gray x's) compared to best-fit model inputs (black circles) for CRS for VolcFlow. Note that no relationship is known for deriving CRS for forward modeling purposes. (D) The calibration between the FlowDat deposit-derived model inputs and the best-fit model inputs is shown for CRS for VolcFlow.
The well-characterized relationship of ΔH/L with PDC volume makes it easy to estimate empirically-derived basal friction angles for given simulation volumes for TITAN2D forward modeling purposes (Figure 8A). Empirically-derived ΔH/L values (converted to basal friction) can be calculated from either the entire global FlowDat dataset (Figure 8A, blue; Equation 2) or from the SHV-only subset (Figure 8A, red; Equation 1). Deposit-derived and empirically-derived input parameters work especially well for smaller-volume flows, but for larger-volume flows, best-fit TITAN2D simulations required a lowering of the basal friction angle (Figure 8A). This is because TITAN2D generally tends to overestimate the spread of flows, often inundating (“splashing” into) uninvolved valleys. If too much of the simulated volume enters other valleys, the overall runout is reduced.
The CRS parameter for VolcFlow can be calculated from existing PDC deposits using data from FlowDat (Figure 8C), but requires more calibration than TITAN2D to produce best-fit results (Figure 8D). CRS has been shown to relate to flow thickness (Kelfoun et al., 2009), which is difficult to estimate for forward modeling applications; and, in contrast to PDC volumes, statistical distributions of flow thicknesses are unknown. CRS must therefore be varied within a reasonable range of values (i.e., 5–50 kPA, Kelfoun et al., 2009) for forward modeling purposes.
Iverson (2003) and Sparks and Aspinall (2004) assert that the limitations and uncertainties involved with physically-based models may make statistically calibrated models, such as LAHARZ or ΔH/L cones, an alternative and complimentary approach to multi-parameter physical models. However, for PDCs, the LAHARZ calibration coefficients for the planimetric and cross-sectional area-volume relationships are based on relatively few observations, and should ideally represent the total inundated areas rather than just associated deposit areas, as were used in Widiwijayanti et al. (2008). There are also uncertainties introduced when selecting the starting location for LAHARZ model runs (Table 4). LAHARZ cannot diverge from a single stream network, which is problematic from a forecasting perspective, although new model runs can be started in any valley intersected by a previous run.
ΔH/L cones worked reasonably well at recreating deposit runout, but only when using the SHV subset of the data. This is due to the fact the most PDCs in FlowDat are less mobile than those at SHV (see Figures 2, 8A), possibly because of channelization and topography (Ogburn, 2014; Ogburn et al., 2016). Thus, when the entire global dataset of PDCs is used, the runout of the more mobile SHV PDCs is underestimated. This reliance on local data poses challenges for forward modeling using ΔH/L cones or empirically-derived basal friction angles for TITAN2D at volcanoes with sparse data. However, Ogburn et al. (2016) investigated the use of hierarchical Bayesian models for ΔH/L estimation from PDC volume that allow one to “borrow strength” from the global record of PDCs while retaining characteristics of local data (namely the intercepts), and greatly reduce the uncertainty inherent in traditional linear regression models of sparse data.
Other workers have investigated the sensitivity of these models (included in Table 5) in detail (Sheridan et al., 2005; Kelfoun et al., 2009; Charbonnier and Gertisser, 2012). Charbonnier and Gertisser (2012) showed that TITAN2D was most sensitive to initial collapse volume, starting coordinates, and basal friction angle while VolcFlow was most sensitive to initial collapse volume, CRS, and bulk density. For TITAN2D, small changes in input parameters affected larger-volume simulations more than smaller-volume simulations, while for VolcFlow, the opposite was true (Charbonnier and Gertisser, 2012).
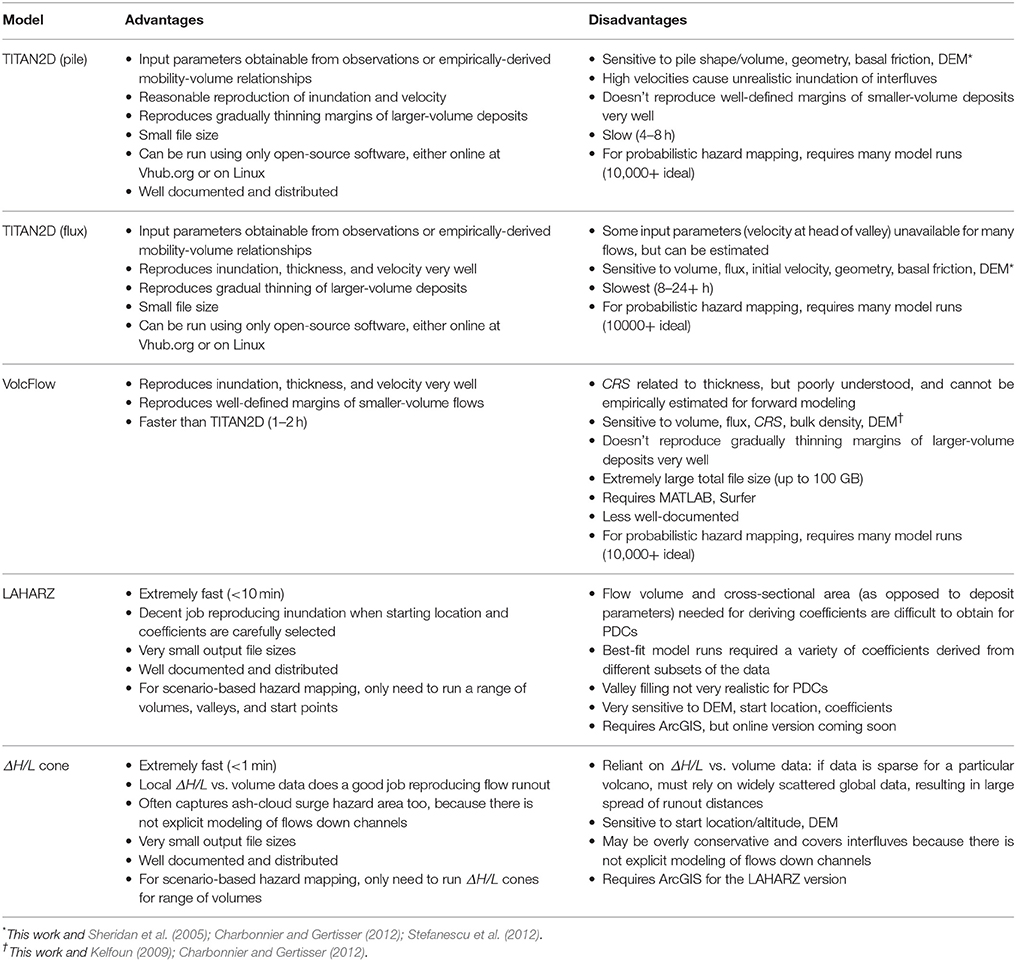
Table 5. Operational comparison of TITAN2D, VolcFlow, LAHARZ, and the ΔH/L cone model.
However, when simulating PDCs over natural terrain (DEMs), the sensitivity analysis, as discussed above, is not only testing the sensitivity of the model itself to input parameters, but also the sensitivity of the topography of individual channels to input parameters. For example, when modeling the 25 June 1997 PDC, the runout increases as basal friction is lowered from 20° to 8°. However, when basal friction is lowered below 7°, runout actually decreases, because the low basal friction leads to higher velocities in proximal areas, which causes material to spill out of the channel at the first channel bend. Subsequently, there is less volume in the relevant channel, and the runout decreases. Therefore, simulations in each valley would have different sensitivities to input parameters, which could prove useful for hazard analysis. The sensitivity analysis performed by other workers (e.g., Sheridan et al., 2005; Charbonnier and Gertisser, 2012), involved simulations in only one channel, and thus did not encounter this.
The models also differ in their sensitivity to the resolution and error of the DEM. Capra et al. (2011) and Stefanescu et al. (2012) showed that the type of DEM (e.g., TOPSAR, ASTER, SRTM), the interpolation scheme, and the resolution of the DEM (e.g., 10 m vs. 90 m) had significant impacts on geophysical mass flow simulations. DEMs of 30 m resolution or better are usually sufficient for modeling purposes, though 10 m resolution or better is preferred (Capra et al., 2011). Very high resolution DEMs (10 m or better) can significantly increase simulation time, however. DEMs are also rarely accurate for long at active volcanoes as strong depositional and erosional processes rapidly change the landscape. TITAN2D and VolcFlow are extremely sensitive to initial geometries and starting locations. Rapidly changing volcanic summits and domes thus pose a significant challenge for using geophysical models. LAHARZ is sensitive to channel geometry as it is essentially a valley-filling algorithm; DEM resolution greatly affects the cross-sectional areas of channels. However, because LAHARZ is started within valleys, it is easier to avoid issues with DEM errors at the summit. ΔH/L cones are perhaps the least sensitive to DEM issues, as the start height of the cone does not need to be located on the DEM surface; and, thus, the cone height can be easily adjusted to reflect the most recent measurement of dome height, for example.
Another concern for using these models for hazard mapping is the ease of use. The operational aspects of these models are summarized in Table 5. For example, TITAN2D is available as a Linux program, or through a web interface, and uses open-source software, while VolcFlow uses proprietary software. LAHARZ requires the proprietary ArcGIS software, but has a (soon to be public) online interface. ΔH/L cones can be produced using free standalone tools such as the Vhub Energy Cone tool (Palma, 2013) or within the LAHARZ toolbox. ΔH/L cones take seconds to produce, LAHARZ takes 5–20 min, while VolcFlow averages around 5 h, and TITAN2D pile sources take around 8–10 h using a single processor on a personal computer. Unfortunately, some TITAN2D flux sources can take a long time (24 h+) to complete, unless super-computing resources are available. The computing time per model run and the output file sizes are important considerations when using modeling for both scenario-based hazard assessment or implementing a probabilistic modeling scheme that samples input parameter space for forecasting purposes.
In light of these results, it is clear that LAHARZ should be used cautiously for PDC hazard mapping, perhaps as a very quick initial investigation, and with a range of input coefficients. TITAN2D could be considered as a maximum estimate of lateral spreading of the dense-basal avalanche and a good estimate of runout, especially if there are abundant local data on which to base the regression between basal friction (ΔH/L) and volume (see Figures 2, 8A,B), or if a hierarchical Bayesian approach is used to improve upon global regressions (Ogburn et al., 2016). VolcFlow may be considered a minimum estimate of spreading and a good estimate of runout, provided many model runs are produced with different CRS values, as these cannot be estimated from volume. ΔH/L cones provide quick estimates of runout that, provided abundant local data exists from which to derive the inputs, match deposits as well as the other models (similar to the findings of Tierz et al., 2016 for Campi Flegrei and Vesuvius). Relying solely on global data, however, led to poor results for the mobile SHV PDCs. While ΔH/L cones cannot model flows down valleys, and thus potentially provide over-estimates of hazards on interfluves or in unlikely flow directions, common sense approaches exist to modify the cone into more reasonable maps of inundation. Finally, none of these models is able to explicitly capture the behavior of the accompanying ash-cloud surge, which is able to detach from the dense-basal avalanche and travel in unexpected directions, primarily at channel constrictions and bends (Ogburn, 2014; Ogburn et al., 2014). The overestimation of inundation on interfluves by ΔH/L cones may, however, provide a rough estimate of the total proximal hazard zone, including overriding ash-cloud surges in interfluves, ballistics, and other proximal hazards. Some simulation tools exist for modeling coupled dense-dilute flows using Lagrangian methods (e.g., Dobran et al., 1993; Takahashi and Tsujimoto, 2000; Todesco et al., 2002; Neri et al., 2003; Dartevelle, 2004; Esposti Ongaro et al., 2007; Valentine et al., 2011a), but these models are complex and too computationally expensive to use for operational hazard mapping purposes at this time.
Implications for PDC Behavior
In general, all the models reproduce smaller-volume flows better than larger-volume flows, but differ in their ability to reproduce specific deposit features in different emplacement environments (Table 6). TITAN2D final time-step inundation and thickness maps are able to replicate the lateral spread (controlled largely by the internal friction angle) and gradual thinning of larger-volume PDCs as they exit valleys onto broad plains. TITAN2D simulations require basal friction angles lower than those measured for materials themselves (typically ~31° for granular material; Bagnold, 1966), and instead correspond roughly to the ΔH/L of measured deposits (Figures 8A,B). Because of these low basal frictions, TITAN2D simulations often produce very high initial velocities when sourced from the steep topography of the dome summit, especially when using a pile source, which adds to the initial height. As a result, the final time-steps of TITAN2D fail to retain material on higher slopes, whereas thin deposits are often recorded in these areas. Flux sources positioned on the dome summit or the heads of valleys with a slower release of material remain more channelized. TITAN2D recreates smaller-volume, channelized flows very well, but can underestimate the runout of larger-volume flows by sending material into valleys that were uninvolved in reality, thus reducing the volume available in the channel of interest. Charbonnier and Gertisser (2012) and Charbonnier et al. (2013) were not able to reproduce deposits using a single basal friction angle, but the use of a varying bed friction was able to reproduce flows at Merapi. While TITAN2D velocities were also found to overestimate those calculated from super-elevation measurements, TITAN2D reproduced the overall inundation area and runout well, although it could not produce the steep, narrow flow front of the smaller-volume 2006 Merapi BAFs. TITAN2D was, however, able to simulate the four areas where the dense-basal avalanche escaped the main channel and traveled down adjacent ones, a process of extreme concern for hazard mapping at Merapi (Charbonnier and Gertisser, 2012). The use of a variable bed friction was not necessary to produce flows in this work perhaps because Montserrat has less-extreme slope variations than Merapi, or because the deep channels on Montserrat prevent even very high-velocity simulations from escaping channels. Ogburn (2014) and Ogburn et al. (2014, 2016) explored the effects of channel geometry on PDC mobility, and showed that Merapi flows were generally less channelized than those on Montserrat, which may exacerbate the effects of overly-high TITAN2D simulated velocities.
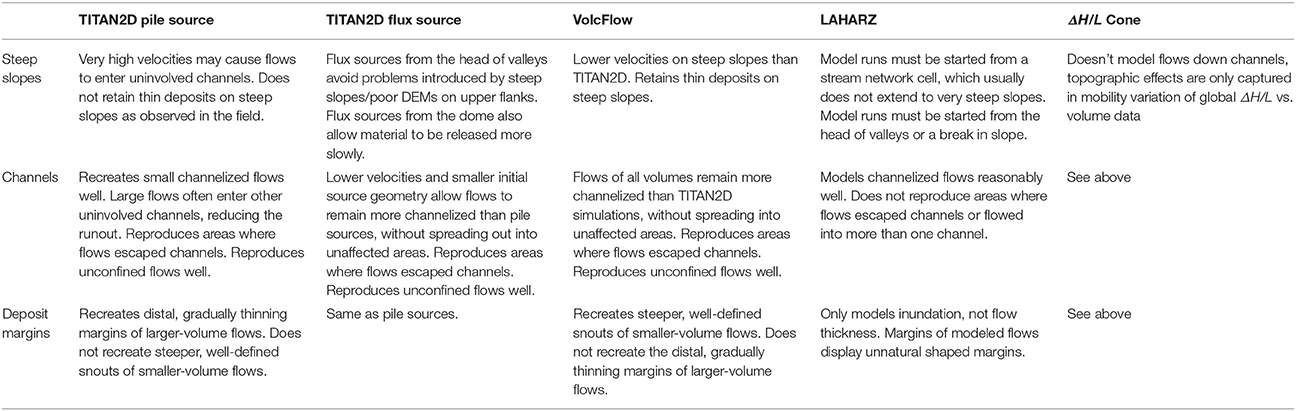
Table 6. Summary of model behavior in selected emplacement environments.
VolcFlow final time-step inundation and thickness maps tend to exhibit margins that are steeper and more defined, and the model recreates smaller-volume flows better than larger-volume ones. Steep, well-defined margins are more common for smaller-volume or valley-confined flows on Montserrat (Cole et al., 2002). These steep, defined margins in VolcFlow thickness maps are generated by the CRS rheology, in that only flows thicker than a certain threshold continue to move, while those thinner than this threshold come to an abrupt stop (Kelfoun et al., 2009). Both Kelfoun et al. (2009) and Charbonnier and Gertisser (2012) noted that VolcFlow reproduced the margins of PDC deposits better than TITAN2D, but they were simulating flows that remained largely channelized. Charbonnier and Gertisser (2012) also found that VolcFlow did not simulate the overbanking of the large volume 2006 Merapi PDCs as well as TITAN2D. However, VolcFlow performed better than TITAN2D in replicating the larger-volume 2010 Merapi PDCs (Charbonnier et al., 2013). Simulations of larger-volume flows using VolcFlow tend to reproduce the runout, but not the expansive distal thinning and spreading seen for larger-volume flows on Montserrat. Kelfoun and Druitt (2005) note that VolcFlow does not necessarily describe an alternative rheology to the frictional model employed by TITAN2D and other frictional geophysical mass flow models. Instead, the constant retarding shear stress is inferred to represent an average, approximately constant value of retarding stresses of all types that individually can vary through time and space, although the behavior may remain frictional.
In essence, all these models are averaging a number of variables that are actually highly unsteady and non-uniform in nature, especially in sustained, larger-volume flows with significant ash-cloud surge components. Smaller-volume, discrete PDCs may, therefore, be more readily replicated by models that average aspects of flow behavior. This unsteadiness and non-uniformity results from a number of factors including:
1. The variability from the source through time. Dome-collapse PDCs, especially if larger in volume, are often produced by the retrogressive collapse of pressurized domes. Initial pulses of material are often smaller in volume and consist of largely degassed dome carapace, with successive pulses resulting from the excavation of the pressurized dome interior (Cole et al., 2002; Woods et al., 2002). This can result in the explosive fragmentation, or auto-brecciation, of particles, generating large amounts of ash and gas, and has been proposed as a major factor in the generation of large ash-cloud surges (Sato et al., 1992; Fink and Kieffer, 1993; Woods et al., 2002). Auto-brecciation has been observed directly at Montserrat (Calder et al., 2002; Woods et al., 2002), Unzen (Sato et al., 1992), and Mt. St. Helens (Mellors et al., 1988).
2. The interaction of the dense-basal undercurrent with the overriding ash-cloud surge. Segregation processes within the flow mean that flows become density stratified, with a high-concentration, dense-basal undercurrent and a dilute ash-cloud surge (Denlinger, 1987; Valentine, 1987; Burgisser and Bergantz, 2002). The mass partitioning between these layers may change in space and time (Fisher and Heiken, 1982; Denlinger, 1987; Fisher, 1995; Takahashi and Tsujimoto, 2000; Burgisser and Bergantz, 2002; Doyle et al., 2010). Indeed, recent large-scale experimental work by Breard et al. (2016) and Breard and Lube (2017) identified the existence of an intermediate zone between the dense and dilute layers that contains mesoscale turbulence structures, which are known to reduce locally drag and counter aerodynamic resistance, leading to a high particle settling rate and considerable mass flux from the ash-cloud to the dense undercurrent. This kinematic coupling between layers causes the flow to enter a state of “forced super-criticality,” but with reduced entrainment, sedimentation, and dilution, and is thus proposed be a major contributor to the high mobility of granular PDCs (Breard and Lube, 2017).
3. The interaction of the PDC with topography. Larger-volume flows are more likely to be affected by topographic constrictions and to surmount barriers, and can also overwhelm topography. Topography can induce changes in the elutriation, entrapment, ingestion of air, and comminution of ash (Branney and Kokelaar, 2002; Dufek and Manga, 2008; Doronzo et al., 2012). Charbonnier and Gertisser (2012) justified the use of a spatially varying basal friction for TITAN2D simulations of the 2006 Merapi PDCs because of field data showing a decrease in median diameter and increase in ash content with larger-volume PDCs and longer runout distances, indicating increased effects of fragmentation and fluidization during emplacement (Charbonnier and Gertisser, 2012). These observed changes in deposit granulometry were closely linked with abrupt changes in the topography, including slope breaks, and changes in channel cross-sectional area and morphology (Charbonnier and Gertisser, 2012). Stinton (2007) posited that channel constrictions can help keep flows energized by increasing the frequency of grain collisions as grain concentration increases.
4. Erosion and sedimentation. Larger-volume flows on Montserrat are highly erosive, and result in both flow bulking and the lowering of flow temperature (Cole et al., 2002). The 25 June 1997 flow traveled over areas not inundated by the eruption to date, and eroded into the hydrothermally altered prehistoric deposits (Cole et al., 2002). The 21 September 1997 flow eroded and incorporated pumice from the August 1997 column-collapse flows, trees, and material from houses. Larger-volume flows remained erosive on slopes as low as 6–8° (Cole et al., 2002). Other workers have also investigated sedimentological differences between PDCs of different sizes (e.g., Charbonnier and Gertisser, 2011; Doronzo, 2012).
5. The polydispersity of grain sizes, shapes, and densities. Clasts are supported differently within a flow, which leads to segregation and stratification of flows, and thus variations in flow rheology. Grain size variations also affect sedimentation and erosion. The polydispersity of PDCs has also been shown to greatly affect runout (Phillips et al., 2006).
Calder et al. (2002) identified a number of flow properties that differed between passively generated (gravitational collapse of the degassed dome carapace) and more actively generated (collapse of the growing lava dome) PDCs. Similarly, Charbonnier and Gertisser (2011) classified PDCs at Merapi into small-medium runout BAFs and long-runout BAFs. Combining these classifications results in Table 7: Larger-volume flows are characterized by factors that promote high degrees of unsteadiness, including: sustained, actively generated collapse sources often lasting tens of minutes to hours and high velocity, highly erosive fine ash-rich flows that are often unconfined and accompanied by large ash-cloud surges. This may indicate why TITAN2D and VolcFlow tend to simulate smaller-volume flows more readily than larger-volume flows, as smaller-volume, discrete, PDCs may be easier to replicate with models that utilize flow-average behavior through time and space.
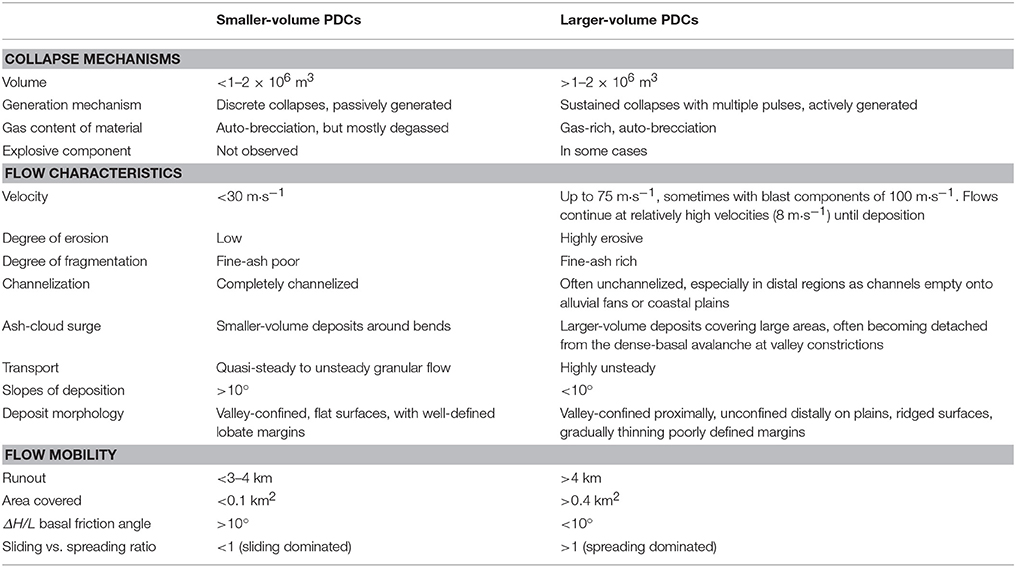
Table 7. Summary of smaller- vs. larger-volume PDCs on Montserrat, after discussion in Calder et al. (2002) and Charbonnier and Gertisser (2011).
While both models can simulate pulses as a series of fluxes through time, they cannot capture the effects of increasing excavation of pressurized dome material, the smoothing effects of initial pulses on the topography, or the erosion and incorporation of previous pulses by subsequent ones during a sustained collapse event, which can last for hours (Cole et al., 2002). TITAN2D simulations using multiple fluxes do not differ in runout from those using single fluxes. Charbonnier et al. (2013) showed similar results using both TITAN2D and VolcFlow.
Additionally, TITAN2D and VolcFlow are single-phase and depth-averaged, and thus only simulate the dense-basal undercurrent. None of the interplay between dense-basal undercurrent and ash-cloud surge (e.g., Breard et al., 2016; Breard and Lube, 2017) can be captured. Creating coupled two-phase flow models with an ash-cloud surge component and simple sedimentation laws is an active area of development for both TITAN2D (Pitman et al., 2013; Sheridan et al., 2013) and VolcFlow (Kelfoun, 2017).
It is well-known that mass flows such as PDCs and debris flows do not behave as simple materials with fixed rheologies (e.g., Iverson and Vallance, 2001; Dartevelle, 2004; Bursik et al., 2005; Iverson and George, 2012; Sulpizio et al., 2014; Dufek, 2016). Instead, the rheology of the flows changes through space and time due to many factors that contribute to the unsteadiness of the flows, as listed previously. Iverson and George (2012) propose that Coulomb friction forces may vary with the pore-fluid pressure and granular temperature (a measure of granular vibration), which would better capture the complex rheologies of these flows. The resultant numerical model has shown success in replicating both experimental and observed debris flows without calibration (George and Iverson, 2011; Iverson and George, 2012) but has not yet been tested for PDCs.
While the models compared herein have been tested against natural examples from SHV, Montserrat, and previously against small bench-top experiments (Kelfoun and Druitt, 2005; Patra et al., 2005), it may also be pertinent to test them against other comprehensive field-based datasets at other volcanoes. Ogburn et al. (2016) showed that differences in mobility of PDCs at different volcanoes may be due to differences in channelization of flows, which could, in turn, affect model selection. It would also be interesting to compare these models against more controlled and measured, large-scale experimental results using natural materials (Iverson, 2003). Large-scale granular flow experiments at the PELE experimental apparatus (Lube et al., 2015) have revealed important insights into the dynamic behavior of PDCs (Lube et al., 2015; Breard et al., 2016; Breard and Lube, 2017); and alongside other proposed endeavors (e.g. Valentine et al., 2011b) could provide an important benchmarking case for geophysical mass flow models. With more benchmarking studies, PDC modeling best-practices for hazard assessment purposes could be developed by the PDC modeling community and could provide an important resource for using these models operationally.
Conclusions
The geophysical and empirical models investigated here are able to reproduce the inundated area and runout of smaller- and larger-volume, confined and unconfined dense-basal avalanche components of PDCs with varying degrees of accuracy.
• TITAN2D and VolcFlow are both able to recreate a variety of PDCs, although they perform better when simulating discrete, single pulse, smaller-volume flows.
• Larger-volume flows are often sustained, pulsatory and thus highly unsteady, and density stratified, and the simple rheological models of TITAN2D and VolcFlow are not able to recreate all features of these flows.
• Empirically-based LAHARZ and ΔH/L cones can be quick, first-approximations of flow runout, provided a database of similar flows, e.g., FlowDat, is available to properly calculate ΔH/L or the coefficients for planimetric and cross-sectional area.
• For TITAN2D and VolcFlow, field measurements of real PDCs can provide estimates for input parameters, with the best-fit model runs only requiring a slight and systematic calibration of input parameters (Figure 8), and thus avoiding the necessity of using completely fitted parameters, a weakness of many geophysical models (Iverson, 2003). For many PDCs, the deposit-derived model run results were roughly comparable to the best-fit results.
• For forward modeling purposes, TITAN2D basal friction can be estimated from the empirical relationship between the basal friction angle (ΔH/L) and volume (Figures 2, 8). However, VolcFlow CRS cannot be empirically-estimated, and instead must be varied within a reasonable range (5–50 kPA, Kelfoun et al., 2009).
• Operational aspects of these models should also be taken into account when deciding on a choice of models for use in hazard mapping (e.g., Table 5). For example, geophysical models like TITAN2D and VolcFlow can be useful for producing both scenario-based or probabilistic hazard maps, but must be run many times (indeed, many thousands of times for true probabilistic maps) with varying input parameters. LAHARZ and ΔH/L cones can be used to produce simple modeling-based hazard maps when run with a variety of input volumes, but do not explicitly consider the probability of occurrence of different volumes.
Author Contributions
SO performed the modeling, analyzed and interpreted the data, and drafted the work. SO and EC designed the work, acquired the data, revised the work, and approved of the final version.
Funding
SO and EC were supported by NSF grants EAR-0809543 and NSF DMS-0757367 during the completion of this research. EC was additionally supported by NERC RiftVolc NE/L013932/1. SO was supported by the USGS/USAID Volcano Disaster Assistance Program during the revision and submission of this work.
Conflict of Interest Statement
The authors declare that the research was conducted in the absence of any commercial or financial relationships that could be construed as a potential conflict of interest.
Acknowledgments
Without the dedication of numerous MVO scientists and staff, who originally created and compiled many of the deposit maps, this work would not have been possible. The authors are very grateful for their work and willingness to share data. This research was completed under a Memorandum of Understanding between the MVO and SUNY University at Buffalo. Furthermore, the authors would like to thank our three reviewers, Dr. Domenico Doronzo, Dr. Gert Lube, and the USGS internal reviewer, Dr. Mary Benage for their constructive feedback.
Supplementary Material
The Supplementary Material for this article can be found online at: https://www.frontiersin.org/articles/10.3389/feart.2017.00083/full#supplementary-material
References
Alberico, I., Lirer, L., Petrosino, P., and Scandone, R. (2002). A methodology for the evaluation of long-term volcanic risk from pyroclastic flows in Campi Flegrei (Italy). J. Volcanol. Geother. Res. 116, 63–78. doi: 10.1016/S0377-0273(02)00211-1
Bagnold, R. A. (1966). An Approach to the Sediment Transport Problem from General Physics. U.S. Geological Survey Professional Paper, 422.
Bayarri, M. J., Berger, J. O., Calder, E. S., Dalbey, K., Lunagomez, S., Patra, A. K., et al. (2009). Using statistical and computer models to quantify volcanic hazards. Technometrics 51, 402–413. doi: 10.1198/TECH.2009.08018
Bourdier, J.-L., and Abdurachman, E. K. (2001). Decoupling of small-volume pyroclastic flows and related hazards at Merapi volcano, Indonesia. Bulle. Volcanolo. 63, 309–325. doi: 10.1007/s004450100133
Branney, M. J., and Kokelaar, B. P. (2002). Pyroclastic Density Currents and the Sedimentation of Ignimbrites. Geological Society of London, Memoirs, 27.
Breard, E. C. P., and Lube, G. (2017). Inside pyroclastic density currents – uncovering the enigmatic flow structure and trasport behaviour in large-sclae experiments. Earth Planet. Sci. Lett. 458, 22–36. doi: 10.1016/j.epsl.2016.10.016
Breard, E. C. P., Lube, G., Jones, J. R., Dufek, J., Cronin, S. J., Valentine, G. A., et al. (2016). Coupling of turbulent and non-turbulent flow regimes within pyroclastic density currents. Nat. Geosci. 9, 767–771. doi: 10.1038/ngeo2794
Burgisser, A., and Bergantz, G. W. (2002). Reconciling pyroclastic flow and surge: the multiphase physics of pyroclastic density currents. Earth Planet. Sci. Lett. 202, 405–418. doi: 10.1016/S0012-821X(02)00789-6
Bursik, M. I., Patra, A. K., Pitman, E. B., Nichita, C., Macias, J. L., Saucedo, R., et al. (2005). Advances in studies of dense volcanic granular flows. Rep. Prog. Phys. 68, 271–301. doi: 10.1088/0034-4885/68/2/R01
Calder, E. S. (1999). Dynamics of Small to Intermediate Volume Pyroclastic Flows. Ph.D., dissertation, University of Bristol.
Calder, E. S., Cole, P. D., Dade, W. B., Druitt, T. H., Hoblitt, R. P., Huppert, H. E., et al. (1999). Mobility of pyroclastic flows and surges at the Soufrière Hills Volcano, Montserrat. Geophys. Res. Lett. 26, 537–540. doi: 10.1029/1999GL900051
Calder, E. S., Luckett, R., Sparks, R. S. J., and Voight, B. (2002). “Mechanisms of lava dome instability and generation of rockfalls and pyroclastic flows at Soufrière Hills Volcano, Montserrat,” in The Eruption of Soufrière Hills Volcano, Montserrat from 1995 to 1999, Vo. 21, eds T. H. Druitt and B. P. Kokelaar (London: Geological Society), 173–190.
Capra, L., Manea, V. C., Manea, M., and Norini, G. (2011). The importance of digital elevation model resolution on granular flow simulations: a test case for Colima volcano using TITAN2D computational routine. Nat. Hazards 59, 665–680. doi: 10.1007/s11069-011-9788-6
Charbonnier, S. J. (2013). A Benchmarking Exercise to Promote Inter-Comparison for Numerical Models of Volcanic Mass Flows. 2013 IAVCEI W06 workshop. Available online at: https://vhub.org/resources/2733
Charbonnier, S. J., Germa, A., Connor, C. B., Gertisser, R., Preece, K., Komorowski, J.-C., et al. (2013). Evaluation of the impact of the 2010 pyroclastic density currents at Merapi volcano from high-resolution satellite imagery, field investigations and numerical simulations. J. Volcanol. Geother. Res. 261, 295–315. doi: 10.1016/j.jvolgeores.2012.12.021
Charbonnier, S. J., and Gertisser, R. (2008). Field observations and surface characteristics of pristine block-and-ash flow deposits from the 2006 eruption of Merapi Volcano, Java, Indonesia. J. Volcanol. Geother. Res. 177, 971–982. doi: 10.1016/j.jvolgeores.2008.07.008
Charbonnier, S. J., and Gertisser, R. (2009). Numerical simulations of block-and-ash flows using the Titan2D flow model: examples from the 2006 eruption of Merapi Volcano, Java, Indonesia. Bull. Volcanol., 71, 953–959. doi: 10.1007/s00445-009-0299-1
Charbonnier, S. J., and Gertisser, R. (2011). Deposit architecture and dynamics of the 2006 block-and-ash flows of Merapi Volcano, Java, Indonesia. Sedimentology 58, 1573–1612. doi: 10.1111/j.1365-3091.2011.01226.x
Charbonnier, S. J., and Gertisser, R. (2012). Evaluation of geophysical mass flow models using the 2006 block-and-ash flows of Merapi Volcano, Java, Indonesia: towards a short-term hazard assessment tool. J. Volcanol. Geother. Res. 231–232, 87–108. doi: 10.1016/j.jvolgeores.2012.02.015
Cole, P. D., Calder, E. S., Sparks, R. S. J., Clarke, A. B., Druitt, T. H., Young, S. R., et al. (2002). “Deposits from dome-collapse and fountain-collapse pyroclastic flows at Soufrière Hills Volcano, Montserrat,” in The Eruption of Soufrière Hills Volcano, Montserrat from 1995 to 1999, Vol. 21, eds T. H. Druitt and B. P. Kokelaar (London: Geological Society), 231–262.
Cole, P. D., Smith, P. J., Stinton, A. J., Odbert, H. M., Bernstein, M. L., Komorowski, J.-C., et al. (2014). “Vulcanian explosions at Soufrière Hills Volcano, Montserrat between 2008 and 2010,” in The Eruption of Soufrière Hills Volcano, Montserrat from 2000 to 2010, Vol. 39, eds G. Wadge, R. E. Robertson, and B. Voight (London: Geological Society), 93–109.
Coombs, M. L., Bull, K. F., Vallance, J. W., Schneider, D. J., Thoms, E. E., Wessels, R. L., et al. (2010). “Timing, distribution, and volume of proximal products of the 2006 eruption of Augustine Volcano,” in The 2006 Eruption of Augustine Volcano, Alaska, eds J. A. Power, M. L. Coombs, and J. T. Freymueller (U.S. Geological Survey Professional Paper, 1769), 145–185.
Dalbey, K. R. (2009). Predicitive Simulation and Model Based Hazard Maps of Geophysical Mass Flows. Ph.D. dissertation, State Univeristy of New York at Buffalo.
Darnell, A., Barclay, J., Herd, R. A., and Lovett, A. (2008). “Hydrological flow routing vs. existing lahar models for mapping hyperconcentrated lahar extent,” in IAVCEI General Assembly (Reykjavik).
Dartevelle, S. (2004). Numerical modeling of geophysical granular flows: 1. A comprehensive approach to granular rheologies and geophysical multiphase flows. Geochem. Geophys. Geosyst. 5:Q08003. doi: 10.1029/2003GC000636
Delaite, G., Thouret, C.-J., Sheridan, M., Labazuy, P., Stinton, A., Souriot, T., et al. (2005). Assessment of volcanic hazards of El Misti and in the city of Arequipa, Peru, based on GIS and simulations, with emphasis on lahars. Z. Geomorpjol. (Suppl. 140), 209–231.
Denlinger, R. P. (1987). A model for generation of ash clouds by pyroclastic flows, with application to the 1980 eruptions at Mount St. Helens, Washington. J. Geophys. Res. 92, 10284–10298. doi: 10.1029/JB092iB10p10284
Denlinger, R. P., and Iverson, R. M. (2001). Flow of variably fluidized granular masses across three-dimensional terrain: 2. Numerical predictions and experimental tests. J. Geophys. Res. 106:553. doi: 10.1029/2000JB900330
Dobran, F., Neri, A., and Macedonio, G. (1993). Numerical simulation of collapsing volcanic columns. J. Geophys. Res. 98, 4231–4259. doi: 10.1029/92JB02409
Doronzo, D. M. (2012). Two new end members of pyroclastic density currents: forced convection-dominated and inertia-dominated. J. Volcanol. Geother. Res. 219–220, 87–91. doi: 10.1016/j.jvolgeores.2012.01.010
Doronzo, D. M., Martí, J., Sulpizio, R., and Dellino, P. (2012). Aerodynamics of stratovolcanoes during multiphase processes. J. Geophys. Res. 117:B01207. doi: 10.1029/2011JB008769
Doyle, E. E., Hogg, A. J., Mader, H. M., and Sparks, R. S. J. (2010). A two-layer model for the evolution and propagation of dense and dilute regions of pyroclastic currents. J. Volcanol. Geother. Res. 190, 365–378. doi: 10.1016/j.jvolgeores.2009.12.004
Druitt, T. H., Calder, E. S., Cole, P. D., Hoblitt, R. P., Loughlin, S. C., Norton, G. E., et al. (2002). “Small-volume, highly mobile pyroclastic flows formed by rapid sedimentation from pyroclastic surges at Soufrière Hills Volcano, Montserrat: an important volcanic hazard,” in The Eruption of Soufrière Hills Volcano, Montserrat from 1995 to 1999, Vol. 21, eds T. H. Druitt and B. P. Kokelaar (London: Geological Society), 263–279.
Dufek, J. (2016). The fluid mechanics of pyroclastic density currents. Annu. Rev. Fluid Mech. 48, 459–485. doi: 10.1146/annurev-fluid-122414-034252
Dufek, J., and Manga, M. (2008). In situ production of ash in pyroclastic flows. J. Geophys. Res. 113, 1–17. doi: 10.1029/2007JB005555
Edmonds, M., and Herd, R. (2005). Inland-directed base surge generated by the explosive interaction of pyroclastic flows and seawater at Soufrière Hills volcano, Montserrat. Geology 33:245. doi: 10.1130/G21166.1
Esposti Ongaro, T. E., Cavazzoni, C., Erbacci, G., Neri, A., and Salvetti, M. V. (2007). A parallel multiphase code for the 3D simulation of explosive volcanic eruptions. Parallel Comput. 33, 541–560. doi: 10.1016/j.parco.2007.04.003
Esposti Ongaro, T., Clarke, A. B., Neri, A., Voight, B., and Widiwijayanti, C. (2008). Fluid dynamics of the 1997 Boxing Day volcanic blast on Montserrat, West Indies. J. Geophys. Res. 113:B03211. doi: 10.1029/2006JB004898
Fink, J. H., and Kieffer, S. W. (1993). Estimate of pyroclastic flow velocities resulting from explosive decompression of lava domes. Nature 363, 612–615. doi: 10.1038/363612a0
Fisher, R. V. (1995). Decoupling of pyroclastic currents: hazards assessments. J. Volcanol. Geother. Res. 66, 257–263. doi: 10.1016/0377-0273(94)00075-R
Fisher, R. V., and Heiken, G. (1982). Mt. Pelée, Martinique: May 8 and 20, 1902, pyroclastic flows and surges. J. Volcanol. Geother. Res. 13, 339–371. doi: 10.1016/0377-0273(82)90056-7
Francis, P. W., and Baker, M. C. W. (1977). Mobility of pyroclastic flows. Nature 270, 164–165. doi: 10.1038/270164a0
Fujii, T., and Nakada, S. (1999). The 15 September 1991 pyroclastic flows at Unzen Volcano (Japan): a flow model for associated ash-cloud surges. J. Volcanol. Geother. Res. 89, 159–172. doi: 10.1016/S0377-0273(98)00130-9
George, D. L., and Iverson, R. M. (2011). “Computing debris-flow mobilization and run-out with a two-phase depth-averaged model,” in American Geophysical Union, Fall Meeting (San Fransisco, CA).
Grieco, F., and Capra, L. (2007). “Numerical modeling of debris avalanches at Nevado de Toluca (Mexico): implications for hazard evaluation and mapping,” in American Geophysical Union, Spring Meeting (Acapulco: American Geophysical Union).
Griswold, J. P., and Iverson, R. M. (2007). Mobility Statistics and Automated Hazard Mapping for Debris Flows and Rock Avalanches. U.S. Geological Survey Scientific Investigations Report, 2007-5276, 62.
Groppelli, G., Capra, L., Norini, G., and Savi, S. (2008). “Volcanic Collapse at Jocotitlan Volcano (México): analogue modeling and flow simulation,” in IAVCEI General Assembly (Reykjavik).
Hards, V., De Angelis, S., Ryan, G., and Christopher, T. (2007a). 8 January 2007 Partial Collapse Event-Summary Report. Montserrat Volcano Observatory Open File Report, OFR 07-02. Montserrat Volcano Observatory, Flemmings, Montserrat.
Hards, V., Strutt, M., De Angelis, S., Ryan, G., Christopher, T., Syers, T., et al. (2007b). Report to the Scientific Advisory Committee on Activity at Soufrière Hills Volcano, Montserrat, 9th Meeting, 1-3 October 2007. Montserrat Volcano Observatory Open File Report, OFR 07-03. Montserrat Volcano Observatory, Flemmings, Montserrat.
Hayashi, J. N., and Self, S. (1992). A comparison of pyroclastic flow and debris avalanche mobility. J. Geophys. Res. 97:9063. doi: 10.1029/92JB00173
Hidayat, D., Widiwijayanti, C., Voight, B., Patra, A. K., and Pitman, E. B. (2008). “TITAN2D based modeling of dome-collapse pyroclastic flows for crisis assessments on Montserrat,” in IAVCEI General Assembly (Reykjavik).
Ishida, M., Hatano, H., and Shirai, T. (1980). The flow of solid particles in an aerated inclined channel. Powder Technol. 27, 7–12. doi: 10.1016/0032-5910(80)85035-2
Iverson, R. M. (2003). “How should mathematical models of geomorphic processes be judged?” in Prediction in Geomorphology, Vol. 135, eds P. R. Wilcock and R. M. Iverson (Washington, DC: Geophysical Monograph Series, American Geophysical Union), 83–94.
Iverson, R. M., and Denlinger, R. P. (2001). Flow of variably fluidized granular masses across three-dimensional terrain: 1. Coulomb mixture theory. J. Geophys. Res. 106:537. doi: 10.1029/2000JB900329
Iverson, R. M., and George, D. L. (2012). “Granular dilatancy and its effect on debris-flow dynamics” in American Geophysical Union, Fall Meeting (San Fransisco, CA).
Iverson, R. M., Schilling, S. P., and Vallance, J. W. (1998). Objective delineation of lahar-inundation hazard zones. Geol. Soc. Am. Bull. 110, 972–984.
Iverson, R. M., and Vallance, J. W. (2001). New views of granular mass flows. Geology, 29:115. doi: 10.1130/0091-7613(2001)029<0115:NVOGMF>2.0.CO;2
Kelfoun, K. (2008). “Rheological behaviour of volcanic granular flows,” in International Congress on Environmental Modelling and Software Society (iEMSs) (Barcelona), 1508–1515.
Kelfoun, K. (2009). VolcFlow Simulation of Volcanic Flows. Available online at: http://wwwobs.univ-bpclermont.fr/lmv/perso/Kelfoun_Karim/VolcFlow/VolcFlow.html
Kelfoun, K. (2017). A two-layer depth-averaged model for both the dilute and the concentrated parts of pyroclastic currents. J. Geophys. Res. Solid Earth 122, 4293–4311. doi: 10.1002/2017JB014013
Kelfoun, K., and Druitt, T. H. (2005). Numerical modeling of the emplacement of Socompa rock avalanche, Chile. J. Geophys. Res. 110, 1–13. doi: 10.1029/2005JB003758
Kelfoun, K., Samaniego, P., Palacios, P., and Barba, D. (2009). Testing the suitability of frictional behaviour for pyroclastic flow simulation by comparison with a well-constrained eruption at Tungurahua volcano (Ecuador). Bull. Volcanol. 71, 1057–1075. doi: 10.1007/s00445-009-0286-6
Komorowski, J.-C., Jenkins, S., Baxter, P. J., Picquout, A., Lavigne, F., Charbonnier, S., et al. (2013). Paroxysmal dome explosion during the Merapi 2010 eruption: processes and facies relationships of associated high-energy pyroclastic density currents. J. Volcanol. Geother. Res. 261, 260–294. doi: 10.1016/j.jvolgeores.2013.01.007
Komorowski, J.-C., Legendre, Y., Christopher, T., Bernstein, M., Stewart, R. B., Joseph, E., et al. (2010). Insights into processes and deposits of hazardous vulcanian explosions at Soufrière Hills Volcano during 2008 and 2009 (Montserrat, West Indies). Geophys. Res. Lett. 37, 1–6. doi: 10.1029/2010GL042558
Lee, S.-K., Lee, C.-W., Lee, S. (2015). A comparison of the Landsat image and LAHARZ-simulated lahar inundation hazard zone by the 2010 Merapi eruption. Bull. Volc. 77:46. doi: 10.1007/s00445-015-0920-4
Loughlin, S. C., Calder, E. S., Clarke, A. B., Cole, P. D., Luckett, R., Mangan, M. T., et al. (2002). “Pyroclastic flows and surges generated by the 25 June 1997 dome collapse, Soufrière Hills Volcano, Montserrat,” in The Eruption of Soufrière Hills Volcano, Montserrat from 1995 to 1999, eds T. H. Druitt and B. P. Kokelaar (London: Geological Society), Vol. 21, 191–209.
Loughlin, S. C., Luckett, R., and Ryan, G. A. (2010). An overview of lava dome evolution, dome collapse and cyclicity at Soufrière Hills Volcano, Montserrat, 2005-2007. Geophys. Res. Lett. 37, 4–9. doi: 10.1029/2010GL042547
Lube, G., Breard, E. C. P., Cronin, S. J., and Jones, J. (2015). Synthesizing large-sclae pyroclastic flows: experimental design, scaling, and first results from PELE. J. Geophys. Res. Solid Earth 120, 1487–1502. doi: 10.1002/2014011666
Macías, J. L., Capra, L., Arce, J. L., Espíndola, J. M., García-Palomo, A., and Sheridan, M. F. (2008). Hazard map of El Chichón volcano, Chiapas, México: constraints posed by eruptive history and tcomputer simulations. J. Volcanol. Geother. Res. 175, 444–458. doi: 10.1016/j.jvolgeores.2008.02.023
Macias, J. L., Saucedo, R., Gavilanes, J. C., Varley, N., García, S. V., Bursik, M. I., et al. (2006). Flujos piroclásticos asociados a la actividad explosiva del Volcán de Colima y perspectivas futuras. GEOS 25, 340–351. Available online at: http://ugm.org.mx/site/geos-vol-25-no-3/
Malin, M. C., and Sheridan, M. F. (1982). Computer-assisted mapping of pyroclastic surges. Science 217, 637–640. doi: 10.1126/science.217.4560.637
Mellors, R. A., Waitt, R. B., and Swanson, D. A. (1988). Generation of pyroclastic flows and surges by hot-rock avalanches from the dome of Mount St. Helens volcano, USA. Bul. Volcanol. 50, 14–25. doi: 10.1007/BF01047505
Molle, A. (2012). Video Analysis of the January 8th 2010 Pyroclastic Flow from Soufrière Hills Volcano (Montserrat): Flow Dynamics and Modeled Evolution. M.S. thesis, State University of New York at Buffalo and Universite Blaise-Pascal.
Munoz, E., Palacios, D., Namikawa, L., Sheridan, M. F., and Renschler, C. S. (2004). “Contrast between computer simulations and field observations of Popocatepetl lahars,” in Geophysical Research Abstracts (Nice), 6.
Murcia, H. F., Sheridan, M. F., Macías, J. L., and Cortés, G. P. (2010). TITAN2D simulations of pyroclastic flows at Cerro Machín Volcano, Colombia: Hazard implications. J. South Am. Earth Sci. 29, 161–170. doi: 10.1016/j.jsames.2009.09.005
Nakada, S., and Fujii, T. (1993). Preliminary report on the activity at Unzen Volcano (Japan), November 1990-November 1991: dacite lava domes and pyroclastic flows. J. Volcanol. Geother. Res. 54, 319–333. doi: 10.1016/0377-0273(93)90070-8
Nakada, S., Shimizu, H., and Ohta, K. (1999). Overview of the 1990–1995 eruption at Unzen Volcano. J. Volcanol. Geother. Res. 89, 1–22. doi: 10.1016/S0377-0273(98)00118-8
Neri, A., Esposti Ongaro, T., Macedonio, G., and Gidaspow, D. (2003). Multiparticle simulation of collapsing volcanic columns and pyroclastic flows. J. Geophys. Res. 108, B42202. doi: 10.1029/2001JB000508
Ogburn, S. E. (2008). Potential Hazards at Soufrière Hills Volcano, Montserrat: Northwards-Directed Dome-Collapses and Major Explosive Eruptions. M.S. thesis, State Univeristy of New York at Buffalo.
Ogburn, S. E. (2012). FlowDat—Mass flow database: Vhub Database. Available online at https://vhub.org/groups/massflowdatabase
Ogburn, S. E. (2014). Reconciling Field Observations of Pyroclastic Density Currents with Conceptual and Computational Analogs Using a GIS and a Newly Developed Global Database. Ph.D., Dissertation, State University of New York at Buffalo, 317 pp.
Ogburn, S. E., Berger, J., Calder, E. S., Lopes, D., Patra, A., Pitman, A. B., et al. (2016). Pooling strength amongst limited datasets using Hierarchical Bayesian analysis, with application to pyroclastic density current mobility metrics. Stat. Volcanol. 2, 1–26. doi: 10.5038/2163-338X.2.1
Ogburn, S. E., Calder, E. S., Cole, P. D., and Stinton, A. J. (2014). “The effect of topography on ash-cloud surge generation and propagation,” in The Eruption of Soufrière Hills Volcano, Montserrat from 2000 to 2010, Vol. 39, eds G. Wadge, R. E. Robertson, and B. Voight (London: Geological Society), 179–194.
Palma, J. (2013). Energy Cone. Available online at: https://vhub.org/resources/econe
Patra, A. K., Bauer, A. C., Nichita, C. C., Pitman, E. B., Sheridan, M. F., Bursik, M. I., et al. (2005). Parallel adaptive numerical simulation of dry avalanches over natural terrain. J. Volcanol. Geother. Res. 139, 1–21. doi: 10.1016/j.jvolgeores.2004.06.014
Phillips, J. C., Hogg, A. J., Kerswell, R. R., and Thomas, N. H. (2006). Enhanced mobility of granular mixtures of fine and coarse particles. Earth Planet. Sci. Lett. 246, 466–480. doi: 10.1016/j.epsl.2006.04.007
Pitman, E. B., Nichita, C. C., Sheridan, M. F., Patra, A. K., Bauer, A. C., and Bursik, M. I. (2003). Computing granular avalanches and landslides. Phys. Fluids 15:3638. doi: 10.1063/1.1614253
Pitman, E. B., Patra, A. K., Kumar, D., Nishimura, K., and Komori, J. (2013). Two phase simulations of glacier lake outburst flows. J. Comput. Sci. 4, 71–79. doi: 10.1016/j.jocs.2012.04.007
Procter, J., Cronin, S., Patra, A., Dalbey, K., Sheridan, M., and Platz, T. (2004a). Utilising TITAN2D to Forecast Dome-Collapse Block-and-Ash Flow (BAFs) Hazards from Mount Taranaki - New Zealand. Pucón: IAVCEI General Assembly.
Procter, J. N., Cronin, S. J., Sheridan, M. F., and Patra, A. K. (2004b). “Application of TITAN2D massflow modelling to assessing hazards from a potential lake-breakout lahar at Ruapehu Volcano, New Zealand,” in IAVCEI General Assembly (Pucon).
Rupp, B., Bursik, M. I., Namikawa, L. M., Webb, A., Patra, A. K., Saucedo, R., et al. (2006). Computational modeling of the 1991 block and ash flowsat Colima Volcano, Mexico. Geol. Soc. Am. Spec. Paper 402, 223–237. doi: 10.1130/2006.2402(11)
Sato, H., Fujii, T., and Nakada, S. (1992). Crumbling of dacite dome lava and generation of pyroclastic flows at Unzen volcano. Nature 360, 664–666. doi: 10.1038/360664a0
Saucedo, R., Macías, J. L., and Bursik, M. I. (2004). Pyroclastic flow deposits of the 1991 eruption of Volcán de Colima, Mexico. Bul. Volcanol. 66, 291–306. doi: 10.1007/s00445-003-0311-0
Saucedo, R., Macias, J. L., Bursik, M. I., Mora, J. C., Gavilanes, J. C., and Cortes, A. (2002). Emplacement of pyroclastic flows during the 1998–1999 eruption of Volcán de Colima, México. J. Volcanol. Geother. Res. 117, 129–153. doi: 10.1016/S0377-0273(02)00241-X
Saucedo, R., Macías, J. L., Gavilanes, J. C., Arce, J. L., Komorowski, J. C., Gardner, J. E., et al. (2010). Eyewitness, stratigraphy, chemistry, and eruptive dynamics of the 1913 Plinian eruption of Volcán de Colima, México. J. Volcanol. Geother. Res. 191, 149–166. doi: 10.1016/j.jvolgeores.2010.01.011
Saucedo, R., Macías, J. L., Sheridan, M. F., Bursik, M. I., and Komorowski, J.-C. (2005). Modeling of pyroclastic flows of Colima Volcano, Mexico: implications for hazard assessment. J. Volcanol. Geother. Res. 139, 103–115. doi: 10.1016/j.jvolgeores.2004.06.019
Savage, S. B., and Hutter, K. (1989). The motion of a finite mass of granular material down a rough incline. J. Fluid Mech. 199, 177–215. doi: 10.1017/S0022112089000340
Savage, S. B., and Hutter, K. (1991). The dynamics of avalanches of granular materials from initiation to runout. Part I: Analysis. Acta Mech. 86, 201–223. doi: 10.1007/BF01175958
Scheidegger, A. E. (1973). On the prediction of the reach and velocity of catastrophic landslides. Rock Mech. 5, 231–236. doi: 10.1007/BF01301796
Schilling, S. P. (1998). LAHARZ : GIS Programs for Automated Mapping of Lahar-Inundation Hazard Zones. U.S. Geological Survey Open-File Report, OFR 98-638, Vancouver, Washington.
Scientific Advisory Committee (2007). Assessment of the Hazards and Risks Associated with the Soufrière Hills Volcano, Montserrat: Part II Technical Report. Eighth Report of the Scientific Advisory Committee on Montserrat Volcanic Activity, Flemmings, Montserrat.
Scientific Advisory Committee (2011). Assessment of the Hazards and Risks Associated with the Soufrière Hills Volcano, Montserrat: Part II Technical Report. Fifteenth Report of the Scientific Advisory Committee on Montserrat Volcanic Activity, Flemmings, Montserrat.
Sheridan, M. F. (1979). Emplacement of pyroclastic flows: a review. Geol. Soc. Am. Bull. Spec. Paper 180, 125–136. doi: 10.1130/SPE180-p125
Sheridan, M. F., Cordoba, G. A., Viramonte, J. G., Folch, A., Villarosa, G., and Delgado, H. (2013). “Using the New Two-Phase-Titan to Evaluate Potential Lahar Hazard at Villa la Angostura, Argentina,” in AGU Meeting of the Americas (Cancun).
Sheridan, M. F., Hubbard, B., Carrasco-Núñez, G., and Siebe, C. (2004). Pyroclastic flow hazard at Volcán Citlaltépetl. Nat. Hazards 33, 209–221. doi: 10.1023/B:NHAZ.0000037028.89829.d1
Sheridan, M. F., and Macías, J. L. (1995). Estimation of risk probability for gravity-driven pyroclastic flows at Volcan Colima, Mexico. J. Volcanol. Geotherm. Res. 66, 251–256. doi: 10.1016/0377-0273(94)00058-O
Sheridan, M. F., Stinton, A. J., Patra, A. K., Pitman, E. B., Bauer, A., and Nichita, C. C. (2005). Evaluating Titan2D mass-flow model using the 1963 Little Tahoma Peak avalanches, Mount Rainier, Washington. J. Volcanol. Geother. Res. 139, 89–102. doi: 10.1016/j.jvolgeores.2004.06.011
Sheridan, M., and Malin, M. (1983). Application of computer-assisted mapping to volcanic hazard evaluation of surge eruptions: Vulcano, Lipari, and Vesuvius. J. Volcanol. Geother. Res. 17, 187–202. doi: 10.1016/0377-0273(83)90067-7
Shreve, R. L. (1968). Leakage and fluidization in air-layer lubricated avalanches. Geol. Soc. Am. Bull. 79, 653–658. doi: 10.1130/0016-7606(1968)79[653:LAFIAL]2.0.CO;2
Simpson, J. E. (1999). Gravity Currents: In the Environment and the Laboratory. Cambridge: Cambridge University Press.
Sparks, R. S. J. (1976). Grain size variations in ignimbrites and implications for the transport of pyroclastic flows. Sedimentology 23, 147–188. doi: 10.1111/j.1365-3091.1976.tb00045.x
Sparks, R. S. J., and Aspinall, W. P. (2004). “Volcanic activity: frontiers and challenges in forecasting, prediction and risk assessment,” in The State of the Planet: Frontiers and Challenges in Geophysics, eds R. S. J. Sparks and C. J. Hawkesworth (Washington, DC: American Geophysical Union). doi: 10.1029/150GM28
Sparks, R. S. J., Barclay, J., Calder, E. S., Herd, R. A., Komorowski, J.-C., Lucket, R., et al. (2002). “Generation of a debris avalanche and violent pyroclastic density current on 26 December (Boxing Day) 1997 at Soufrière Hills Volcano, Montserrat,” in The Eruption of Soufrière Hills Volcano, Montserrat from 1995 to 1999, Vol. 21, eds T. H. Druitt and B. P. Kokelaar (London: Geological Society), 45–69.
Sparks, R. S. J., and Young, S. R. (2002). “The eruption of Soufrière Hills Volcano, Montserrat (1995-1999): overview of scientific results,” in The Eruption of Soufrière Hills Volcano, Montserrat from 1995 to 1999, Vol. 21, eds T. H. Druitt and B. P. Kokelaar (London: Geological Society), 45–69.
Spiller, E. T., Bayarri, M. J., Berger, J. O., Calder, E. S., Patra, A. K., Pitman, E. B., et al. (2014). Automating emulator construction for geophysical hazard maps. J. Uncertain. Quant. 2, 126–152. doi: 10.1137/120899285
Stefanescu, E. R., Bursik, M. I., and Patra, A. K. (2012). Effect of digital elevation model on Mohr-Coulomb geophysical flow model output. Nat. Hazards 62, 635–656, doi: 10.1007/s11069-012-0103-y
Stinton, A. J. (2007). Effects of Changes in Valley Geomorphology on the Behavior of Volcanic Mass-Flows. Ph.D., dissertation, State University of New York at Buffalo.
Stinton, A. J., Cole, P., and Ogburn, S. E. (2010). “Appendix B: pyroclastic flow modelling in the Belham Valley using Titan2D,” in Report to the Scientific Advisory Committee on Volcanic Activity at Soufriere Hills Volcano Montserrat, Montserrat Volcano Observatory Open File Report, OFR 10-02b. Montserrat Volcano Observatory, Flemmings, Montserrat.
Stinton, A. J., Sheridan, M. F., Patra, A. K., Dalbey, K. R., and Namikawa, L. M. (2004). Incorporation of variable bed friction into TITAN2D mass-flow model: application to the Little Tahoma Peak Avalanche (Washington). Acta Vulcanol. 16, 1–11.
Sulpizio, R., Dellino, P., Doronzo, D. M., and Sarocchi, D. (2014). Pyroclastic density currents: state of the art and perspectives. J. Volcanol. Geother. Res. 283, 36–65. doi: 10.1016/j.jvolgeores.2014.06.014
Takahashi, T., and Tsujimoto, H. (2000). A mechanical model for Merapi-type pyroclastic flow. J. Volcanol. Geother. Res. 98, 91–115. doi: 10.1016/S0377-0273(99)00193-6
Thouret, J.-C., and Lavigne, F. (2007). Volcanic hazards at Mount Semeru, East Java (Indonesia), with emphasis on lahars. Bull. Volcanol. 70, 221–244. doi: 10.1007/s00445-007-0133-6
Tierz, P., Sandri, L., Costa, A., Zaccarelli, L., Di Vito, M. A., Sulpizio, R., et al. (2016). Suitability of energy cone for probabilistic volcanic hazard assessment: validation tests at Somma-Vesuvius and Campi Flegrei (Italy). Bull. Volcanol. 78:79. doi: 10.1007/s00445-016-1073-9
Todesco, M., Neri, A., Esposti, T. O., Papale, P., Macedonio, G., Santacroce, R., et al. (2002). Pyroclastic flow hazard assessment at Vesuvius (Italy) by using numerical modeling. I. Large-scale dynamics. Bull. Volcanol. 64, 155–177. doi: 10.1007/s00445-001-0189-7
Valentine, G. A. (1987). Stratified flow in pyroclastic surges. Bull. Volcanol. 49, 616–630. doi: 10.1007/BF01079967
Valentine, G. A., Bonadonna, C., Manzella, I., Clarke, A., and Dellino, P. (2011b). Large-scale experiments on volcanic processes. Eos Trans. AGU 92, 89–90. doi: 10.1029/2011EO110001
Valentine, G. A., Doronzo, D. M., Dellino, P., and de Tullio, M. D. (2011a). Effects of volcano profile on dilute pyroclastic density currents: numerical simulations. Geology 39, 947–950. doi: 10.1130/G31936.1
Vallance, J. W., Bull, K. F., and Coombs, M. L. (2010). “Pyroclastic-flow, lahar, and mixed-avalanche deposits generated during the 2005-2006 eruption of Augustine Volcano, Alaska” in The 2006 Eruption of Augustine Volcano, Alaska, eds J. A. Power, M. L. Coombs, and J. T. Freymueller (U.S. Geological Survey Professional Paper, 1769), 219–267.
Wadge, G., and Isaacs, M. C. (1988). Mapping the volcanic hazards from Soufrière Hills Volcano, Montserrat, West Indies using an image processor. J. Geol. Soc. London. 145, 541–551. doi: 10.1144/gsjgs.145.4.0541
Wadge, G., Voight, B., Sparks, R. S. J., Cole, P. D., Loughlin, S. C., and Roberstson, R. E. A. (2014). “An overview of the eruption of Soufrière Hills Volcano, Montserrat from 2000 to 2010,” in The Eruption of Soufrière Hills Volcano, Montserrat from 2000 to 2010, Vol. 39, eds G. Wadge, R. E. Robertson, and B. Voight (London: Geological Society), 1–39.
Wadge, G., Woods, A. W., and Calder, E. S. (1998). Computer simulations of pyroclastic flows from dome collapse. Geophys. Res. Lett. 25, 3677–3680. doi: 10.1029/98GL00710
Widiwijayanti, C., Hidayat, D., Voight, B., Patra, A. K., and Pitman, E. B. (2007). “Modelling dome-collapse pyroclastic flows for crisis assessments on Montserrat with TITAN2D,” in Cities Volcanoes 5 (Shimabara).
Widiwijayanti, C., Voight, B., Hidayat, D., and Schilling, S. P. (2008). Objective rapid delineation of areas at risk from block-and-ash pyroclastic flows and surges. Bull. Volcanol. 71, 687–703. doi: 10.1007/s00445-008-0254-6
Woods, A. W., Sparks, R. S. J., Ritchie, L. J., Batey, J., Gladstone, C., and Bursik, M. I. (2002). “The explosive decompression of a pressurized volcanic dome: the 26 December 1997 collapse and explosion of Soufrière Hills Volcano, Montserrat,” in The Eruption of Soufrière Hills Volcano, Montserrat from 1995 to 1999, Vol. 21, eds T. H. Druitt and B. P. Kokelaar (London: Geological Society), 457–465.
Yamamoto, T., Takarada, S., and Suto, S. (1993). Pyroclastic flows from the 1991 eruption of Unzen volcano, Japan. Bull. Volcanol. 55, 166–175. doi: 10.1007/BF00301514
Keywords: pyroclastic density currents, pyroclastic flows, model comparison, TITAN2D, VolcFlow, LAHARZ, energy cone, geohazards
Citation: Ogburn SE and Calder ES (2017) The Relative Effectiveness of Empirical and Physical Models for Simulating the Dense Undercurrent of Pyroclastic Flows under Different Emplacement Conditions. Front. Earth Sci. 5:83. doi: 10.3389/feart.2017.00083
Received: 12 May 2017; Accepted: 02 October 2017;
Published: 17 November 2017.
Edited by:
Roberto Sulpizio, Università degli Studi di Bari Aldo Moro, ItalyReviewed by:
Domenico M. Doronzo, Consejo Superior de Investigaciones Científicas (CSIC), SpainGert Lube, College of Health, Massey University, New Zealand
Copyright © 2017 Ogburn and Calder. This is an open-access article distributed under the terms of the Creative Commons Attribution License (CC BY). The use, distribution or reproduction in other forums is permitted, provided the original author(s) or licensor are credited and that the original publication in this journal is cited, in accordance with accepted academic practice. No use, distribution or reproduction is permitted which does not comply with these terms.
*Correspondence: Sarah E. Ogburn, c29nYnVybkB1c2dzLmdvdg==
†Present Address: Sarah E. Ogburn, Volcano Disaster Assistance Program, USGS/USAID, Vancouver, WA, United States