- 1Basins Research Group, Department of Earth Science and Engineering, Imperial College, London, United Kingdom
- 2School of Earth and Environmental Sciences, University of Manchester, Manchester, United Kingdom
Layer-bound, low-displacement normal faults, arranged into a broadly polygonal pattern, are common in many sedimentary basins. Despite having constrained their gross geometry, we have a relatively poor understanding of the processes controlling the nucleation and growth (i.e., the kinematics) of polygonal fault systems. In this study we use high-resolution 3-D seismic reflection and borehole data from the northern North Sea to undertake a detailed kinematic analysis of faults forming part of a seismically well-imaged polygonal fault system hosted within the up to 1,000 m thick, Early Palaeocene-to-Middle Miocene mudstones of the Hordaland Group. Growth strata and displacement-depth profiles indicate faulting commenced during the Eocene to early Oligocene, with reactivation possibly occurring in the late Oligocene to middle Miocene. Mapping the position of displacement maxima on 137 polygonal faults suggests that the majority (64%) nucleated in the lower 500 m of the Hordaland Group. The uniform distribution of polygonal fault strikes in the area indicates that nucleation and growth were not driven by gravity or far-field tectonic extension as has previously been suggested. Instead, fault growth was likely facilitated by low coefficients of residual friction on existing slip surfaces, and probably involved significant layer-parallel contraction (strains of 0.01–0.19) of the host strata. To summarize, our kinematic analysis provides new insights into the spatial and temporal evolution of polygonal fault systems.
Introduction
Polygonal fault systems have been documented in over 100 basins worldwide and comprise large numbers of layer-bound, low-displacement (<100 m throw), normal faults, which in plan-view have a polygonal arrangement and cover areas of up to 2,000,000 km2 (Figure 1 and review by Cartwright, 2011). These polygonal fault systems occur within fine-grained sedimentary successions, which commonly form seals for hydrocarbon reservoirs (e.g., Cartwright et al., 2007; Jackson et al., 2014), CO2 storage sites (e.g., Arts et al., 2004), and nuclear waste disposal sites (e.g., Dehandschutter et al., 2005a). Because polygonal fault systems have the potential to reduce or enhance the sealing capacity of such fine-grained sedimentary successions (e.g., Gay and Berndt, 2007; Huuse et al., 2010), it is critical to understand their kinematics.
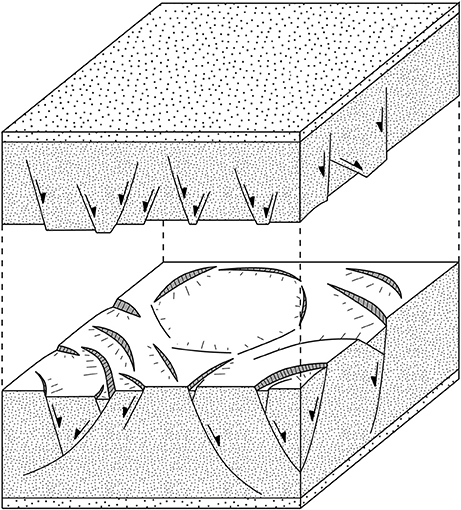
Figure 1. Schematic diagram of a polygonal fault system comprised of a large numbers of layer-bound, low-displacement (<100 m throw) normal faults, which have a more-or-less polygonal arrangement in plan-view.
In general, polygonal faulting appears linked to dewatering and compaction of fine-grained sediments (e.g., Cartwright et al., 2003), although the exact driving mechanism(s) remain(s) unclear. Several mechanisms have been proposed including: (1) density inversion by differential compaction between the host succession and the overlying strata (Henriet et al., 1988; Watterson et al., 2000); (2) internal layer-parallel extension of the host succession driven by gravitational sliding (Higgs and McClay, 1993; Clausen et al., 1999); (3) hydraulic fracturing due to differential compaction and overpressure build-up (Cartwright, 1994a,b); (4) syneresis (i.e., spontaneous contraction of a sediment-water gel (Dewhurst et al., 1999); (5) low coefficients of residual friction that are too low to sustain in situ stresses along the fault plane (Goulty, 2001, 2002, 2008); (6) particle dissolution during diagenesis, which induces tensile stresses of sufficient magnitude for normal faulting (Shin et al., 2008; Cartwright, 2011); and (7) yielding, which describes behavior of clays not captured by classic Mohr-Coulomb or Drucker-Prager criteria (Laurent et al., 2012). There is thus clearly a lack of consensus on the mechanism driving polygonal faulting, reflecting, at least in part, our poor understanding of their kinematics.
This study examines the kinematics of a polygonal fault system developed in the Cenozoic succession of the northern North Sea. The area of interest covers ~740 km2 and contains >1,500 faults, forming part of a significantly larger, basin-scale system (Cartwright and Lonergan, 1996). Due to the availability of comprehensive lithological and mineralogical data, and high-quality 3-D seismic reflection data, the northern North Sea provides an ideal natural laboratory to study the geometry and kinematics of polygonal fault systems. We extract detailed stratigraphic thickness variations throughout the host succession to constrain the timing of faulting and map the geometry and displacement distributions of 137 polygonal faults in this system. This approach allows us to constraining polygonal fault kinematics, including their nucleation sites and growth history. Finally, we obtain accurate 1-D and 2-D strain estimates to investigate the effect of this fault system on the compaction of the host strata.
Geological Setting
The North Viking Graben formed during the Middle Jurassic to Early/Middle Cretaceous in response to crustal extension (Figure 2). Jurassic rifting was characterized by rapid tectonic subsidence and formation of large-displacement normal faults that bounded graben and half-graben (Badley et al., 1988; Yielding, 1990; Faerseth et al., 1997). The post-rift sag phase began in the Early Cretaceous, marking the transition from fault- to thermally-controlled subsidence (Joy, 1993; Jordt et al., 2000; Kyrkjebø et al., 2001; Faleide et al., 2002). Subsequently, the North Viking Graben has undergone two major uplift events: (1) an early Palaeocene phase related to rifting, magmatism, and the break-up of the NE Atlantic (e.g., Nadin and Kusznir, 1995); and (2) a middle Miocene phase, possibly related to long-wavelength doming during regional compression (e.g., Løseth et al., 2013).
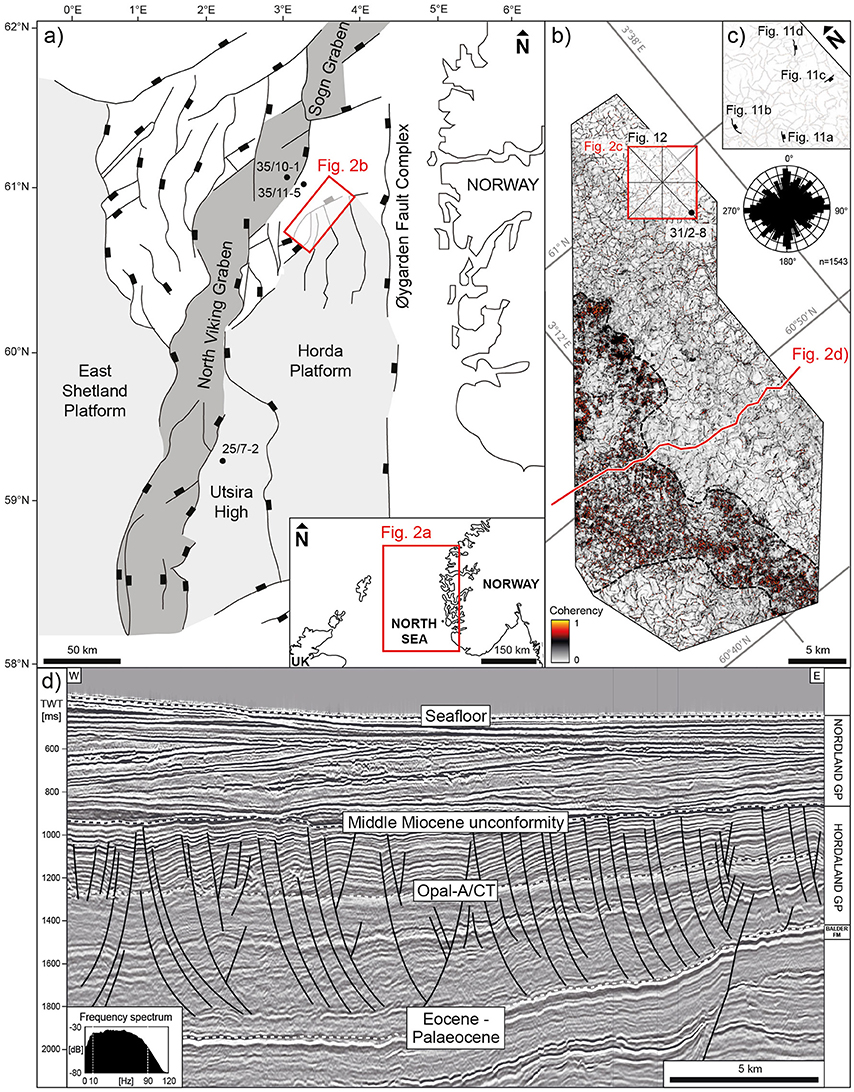
Figure 2. (a) Simplified structural map of the North Viking Graben, North Sea, highlighting major faults; the Horda, East Shetland Platform and Utsira High (after Holgate et al., 2013) and the outline of the 3-D seismic survey (b) in red; (b) Outline of 3-D seismic survey (MN9201_R05) with coherency attribute map of seismic reflection of the opal-A/CT transformation in the Hordaland Group showing the characteristic polygonal fault pattern with more-or-less uniform distribution of fault strikes; the outline of the sub-cube (c), the location of exploration well 31/2-8 and the position of the key seismic section (d) are also indicated; (c) coherency attribute map of sub-crop showing the position of polygonal faults used for detailed displacement extraction (Figure 12); (d) Arbitrary, fault-perpendicular seismic section showing listric polygonal faults that are confined to the Hordaland Group in the North Viking Graben.
During the sag phase, the North Viking Graben was filled by sediment derived from the uplifted basin margins, with up to 5 km of predominantly fine- to very fine-grained, marine mudstones deposited (i.e., Shetland, Rogaland, Hordaland, and Nordland groups; Figure 2d; Rundberg, 1989; Jordt et al., 2000; Anell et al., 2012). This study focusses on a regionally-extensive polygonal fault system hosted within the Early Palaeocene-to-Middle Miocene Hordaland Group. The Hordaland Group is underlain by the Balder Formation (Rogaland Group), which primarily consists of poorly-consolidated mudstone and volcanic tuff (Knox and Holloway, 1992; Graham et al., 2003). The top of the Hordaland Group and the polygonally faulted succession is marked by the mid-Miocene unconformity, a regional unconformity formed by non-deposition and erosion that spans ~10 Ma (e.g., Eidvin and Rundberg, 2001; Løseth et al., 2013). This erosional event was followed in the Late Miocene to Early Pliocene by deposition of the sandy Utsira Formation and, during the Pliocene and Pleistocene, by marine mudstones of the Nordland Group (e.g., Jordt et al., 1995; Rundberg and Eidvin, 2005).
After deposition, the Hordaland Group, which hosts the polygonal fault system of interest, has undergone the first stage of silica diagenesis, i.e., the transformation of amorphous, biogenic silica (opal-A) to cristobalite/tridymite lepispheres (opal-CT), which changed the density and acoustic properties of the host sequence, thereby giving rise to a discrete, mappable seismic reflection (Wrona et al., 2017a,b). The co-existence of silica diagenesis and polygonal fault systems in other basins (Davies et al., 2006) has led some authors to suggest a genetic link between polygonal faulting and diagenesis (Shin et al., 2008; Davies et al., 2009; Cartwright, 2011; Davies and Ireland, 2011). It is thus worth noting that the transformation from opal-A to opal-CT probably migrated upward through the lower Hordaland Group, initiating in the Middle or Late Eocene and continuing, potentially, to the present (Wrona et al., 2017a). Apart from the opal-A/CT transformation, the Hordaland Group shows no other significant compositional and diagenetic changes affecting physical rock properties (Wrona et al., 2017b).
Data
Well Data
This study uses well data from exploration well 35/10-1 and 35/11-5, which constrain the age, composition, and diagenetic state of the Hordaland Group mudstones in the North Viking Graben (Wrona et al., 2017a). Moreover, we use checkshot data from exploration well 31/2-8 to convert a sub-volume of the 3-D seismic volume from time- to depth domain (Figure S1). For the depth conversion, we defined four intervals: (1) water column; (2) Nordland Group; (3) Hordaland Group (i.e., the interval containing the polygonal fault system); and (4) sub-Hordaland Group strata. We derive best-fit linear velocity-depth functions for each interval using checkshot data of exploration well 31/2-8, converting two-way traveltimes (milliseconds) to depths (meters) (Figure S1).
3-D Seismic Data
We use a 3-D seismic volume (MN9201_R05) volume covering an area of ~1,440 km2 (Figures 2a,b). The data were recorded using a series of 3,600 m long streamers with 144 groups. This setup results in a nominal 36-fold coverage with a line spacing of 25 m. These multi-channel data were recorded with a vertical sampling of 4 ms. The seismic volume is time-migrated and zero-phase processed with SEG reverse polarity; i.e., an acoustic impedance increase with depth is represented by a negative reflection event (black), and a decrease in acoustic impedance with depth is represented by a positive reflection event (white) (e.g., Figure 2d).
Vertical seismic resolution describes the ability to image a geological feature (e.g., a bed or fault) and is, to a first degree, a function of the dominant frequency and seismic velocity in the interval of interest (Brown, 2004). Seismic resolution can be defined as the limit of separability, i.e., the thickness below which reflections from two successive interfaces start to interfere and appear as a tuned reflection package, and the limit of visibility, i.e., the minimum thickness at which reflections from two successive interfaces can be imaged (Brown, 2004). Using the dominant frequency of our seismic reflection data (50 Hz) (Figure 2d) and the average p-wave velocity of the Hordaland Group (~2,000 m s−1) (Figure S1), the limit of separability (i.e., a quarter of the wavelength) is ~10 m, whilst the limit of visibility can be as low as ~1 m (i.e., a thirtieth of the wavelength) depending on the signal-to-noise ratio of the data and the acoustic impedance contrasts at the interfaces (Brown, 2004). The data are thus of sufficient quality to allow us to map fault displacements and stratigraphic thickness variations as small as 10 m.
Methods
Seismic Interpretation
We map seismic reflections bounding the top and base of the polygonal fault system over an area of ~740 km2 (mid Miocene unconformity and top Balder Formation; Figure 2d). We also map a high-amplitude seismic reflection produced by the opal-A/CT transformation (Wrona et al., 2017a), calculating the coherency attribute (sensu Bahorich and Farmer (1995), along this horizon to highlight the geometry and extent of the polygonal fault system (Figure 2b). Because the polygonal fault system contains >1,500 faults in the study area (Figure 2b), we select a representative sub-volume (7.5 × 6.2 × 1.8 km) in which to conduct a quantitative geometric and displacement analysis (Figure 3). We consider the sub-volume to be representative because the polygonal faults inside and outside its extent are all bound to the Hordaland Group; display uniform distributions of fault strikes consistently, and exhibit similar planar-to-listric cross-sectional geometries (Figure 2).
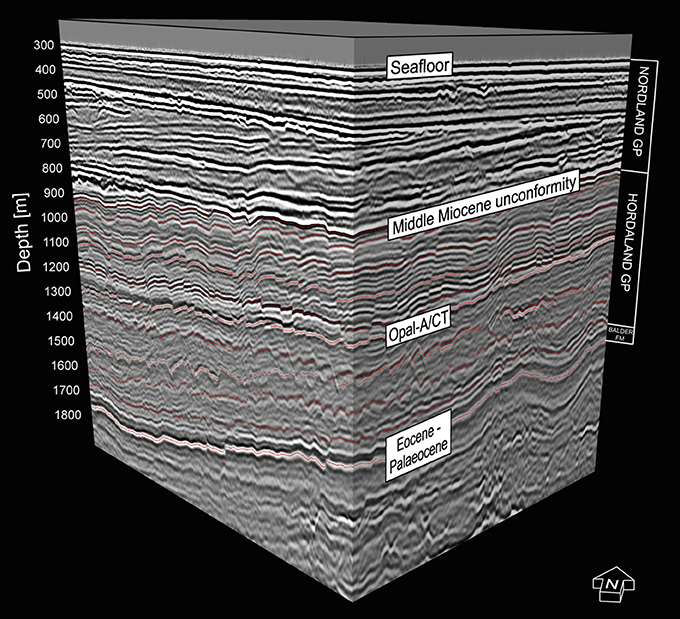
Figure 3. 3-D visualization of depth-converted seismic sub-volume used for comprehensive seismic interpretation of 11 stratigraphic horizons (red dotted lines) within the interval hosting the studied polygonal fault system.
To constrain the timing of faulting, we map thickness variations in faulted host strata. In particular, we identify hanging wall wedges that expand toward bounding faults, and cross-fault thickening, i.e., thickness increases from foot- to hanging wall (e.g., McLeod et al., 2000; Childs et al., 2003; Bell et al., 2014). To reveal these detailed stratigraphic thickness variations, we map 11 horizons (including the top and base of the polygonally faulted succession) within the depth-converted sub-volume, thereby defining 10 stratigraphic packages (Figure 3), allowing to generate high-resolution structural and thickness (isopach) maps (Figures 4, 5). The structural maps are complemented by length-weighted rose diagrams of polygonal faults developed at that particular structural level (Figure 4). The thickness maps shown on Figure 5 are calculated between adjacent horizons, such that Figure 5A shows thicknesses between the horizons shown on Figures 4A,B. Note that we chose the number of horizons so that the thickness maps depict values well above the (vertical) seismic resolution, i.e., the limit of separability (~10 m).
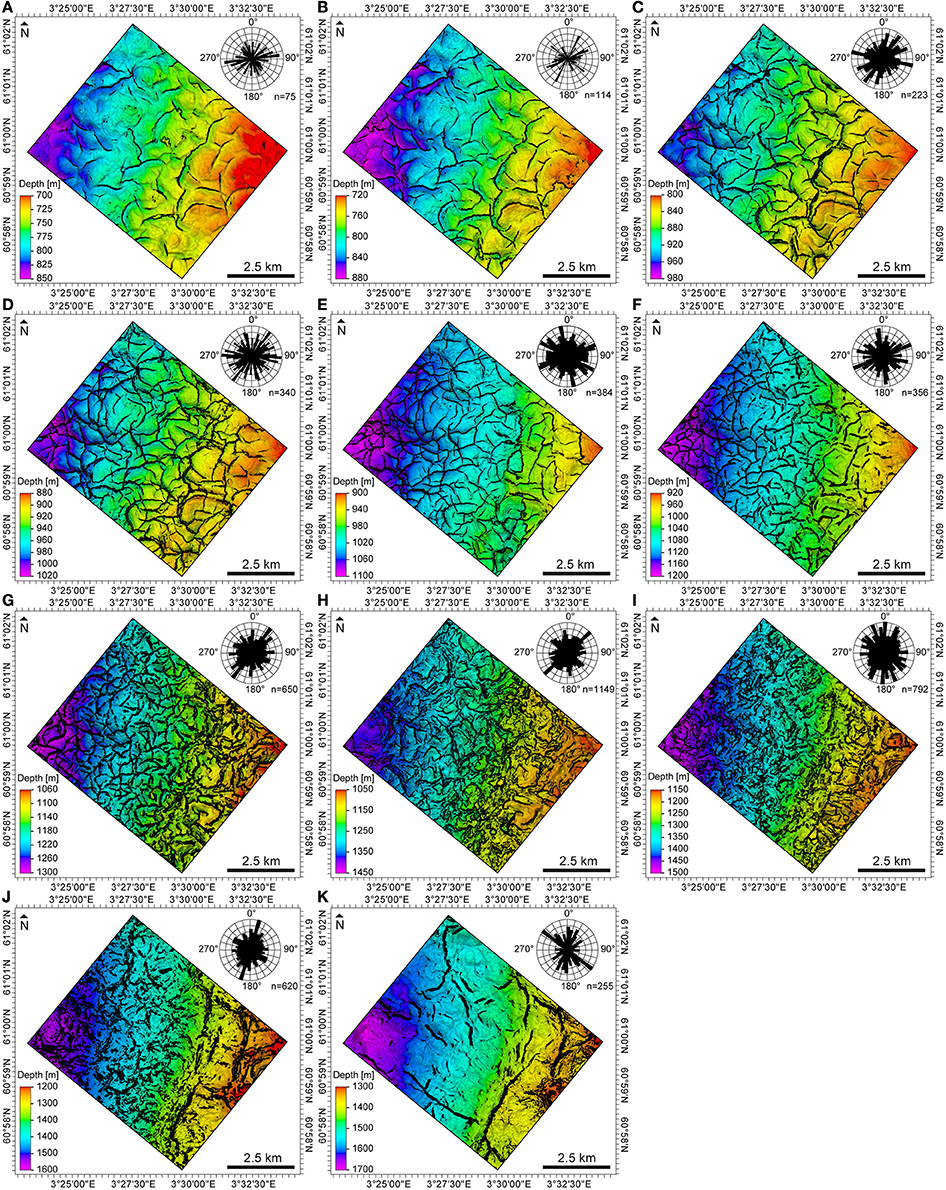
Figure 4. Structural maps of stratigraphic horizons (A–K) showing the polygonal fault systems at different depth levels. Length-weighted rose diagrams extracted with NetworkGT (Nyberg et al., in review), show a more-or-less uniform distribution of fault strikes (A–I).
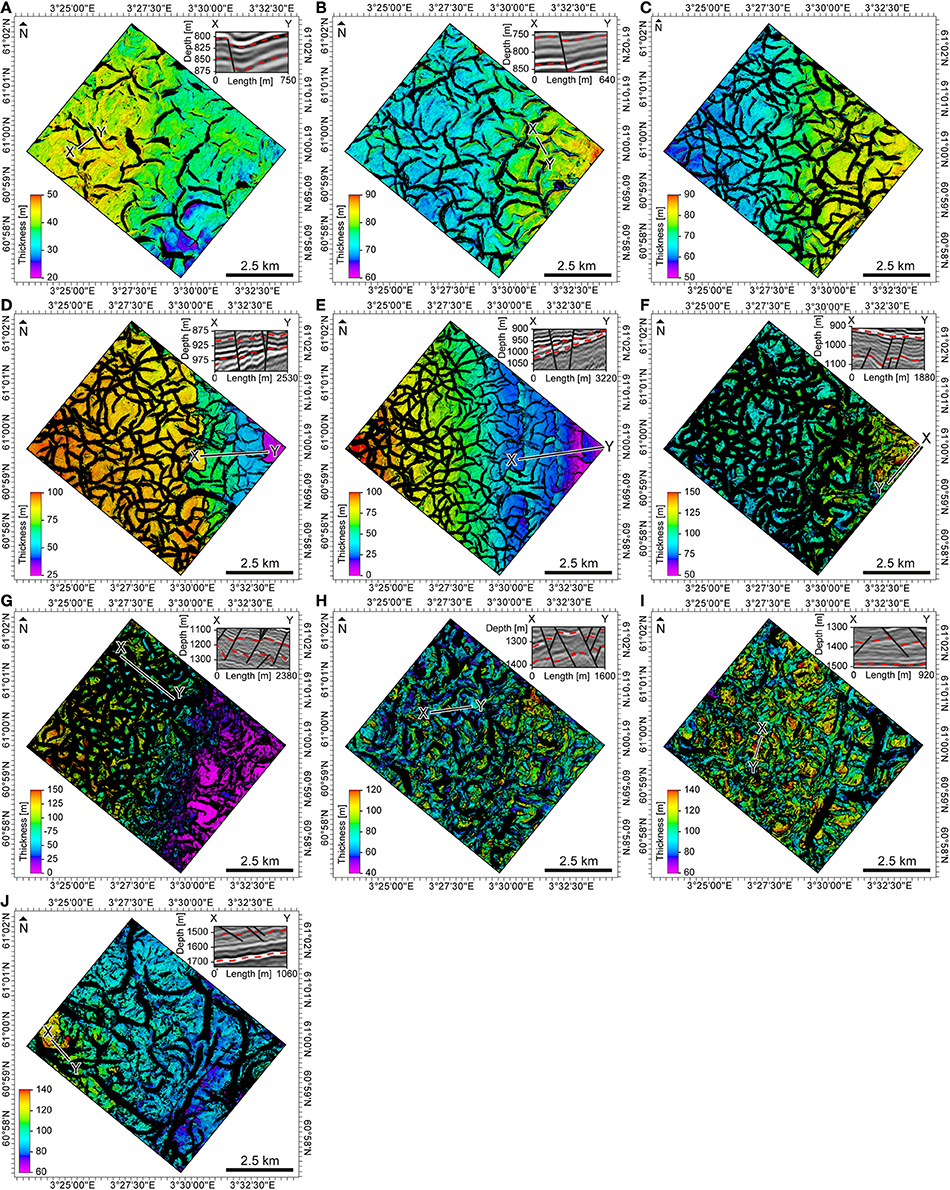
Figure 5. Thickness maps between stratigraphic horizons (Figure 4) with example seismic sections (X-Y). On these maps, hanging wall wedges appear as gradual color changes toward the fault (A,B,E), while across fault thickening appears as discrete color jumps across faults (D–J). These changes are also shown on representative strike-perpendicular seismic sections, inserted in the top right corner of these maps. Note that map (C) contains no fault-related thickness changes and therefore is no accompanied by a seismic section.
The use of seismic stratigraphically defined thickness variations to constrain the timing of faulting comes with several uncertainties. First, it is worth noting that, although the observed thickness variations are sometimes small (10–20 m; see Figure 5), they are above the seismic resolution, i.e., the limit of separability of ~10 m. Second, it may be argued that the observed thickening is strain related, merely being an artifact of complex fault interaction or differential compaction. However, based on the observation that: (1) thickness changes occur away from fault branchlines; and (2) the difference in burial between the hanging wall and footwall strata is relatively small due to the small fault throws, fault geometry-induced strain and differential compaction appear less likely to cause the observed across-fault thickness changes.
Fault Analysis
To understand the kinematics of the polygonal fault system, we map 137 faults imaged in the selected area using strike-perpendicular seismic sections and coherency time slices (Bahorich and Farmer, 1995). We extract the height and length, as well as the average strike and dip of these faults (Figure 6). We also extract displacement-depth profiles and strike-projections to understand the kinematics of these faults (e.g., Walsh and Watterson, 1989; Nicol et al., 1996). Displacement-depth profiles are extracted from each fault using strike-perpendicular seismic sections that intersect the high-displacement centers of the faults. To extract fault displacement, we: (1) correlate multiple seismic reflections across the fault plane; (2) identify the foot and hanging wall cut-offs of these reflections, i.e., the intersection points of the reflections and the fault; (3) measure the fault throw (t) and heave (h) as the vertical or horizontal distance between foot and hanging wall cut-offs, respectively; and (4) calculate the dip-parallel fault displacement (d) from the throw and have using Pythagoras' theorem (Figures 7, 8):
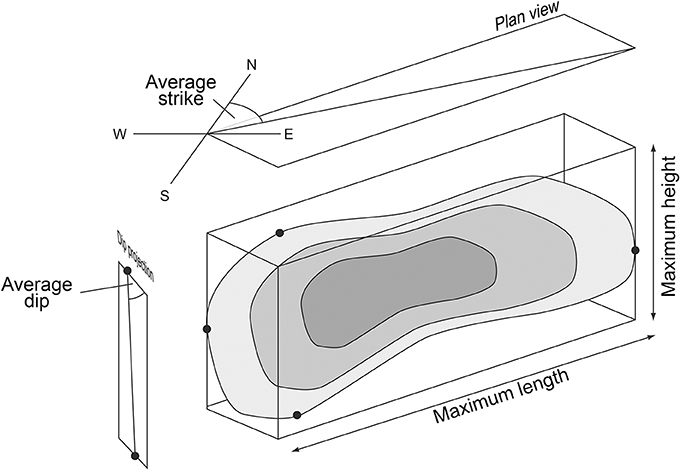
Figure 6. 3-D diagram of displacement distribution on normal fault illustrating the key fault properties (average strike, -dip, maximum length and -height) measured.
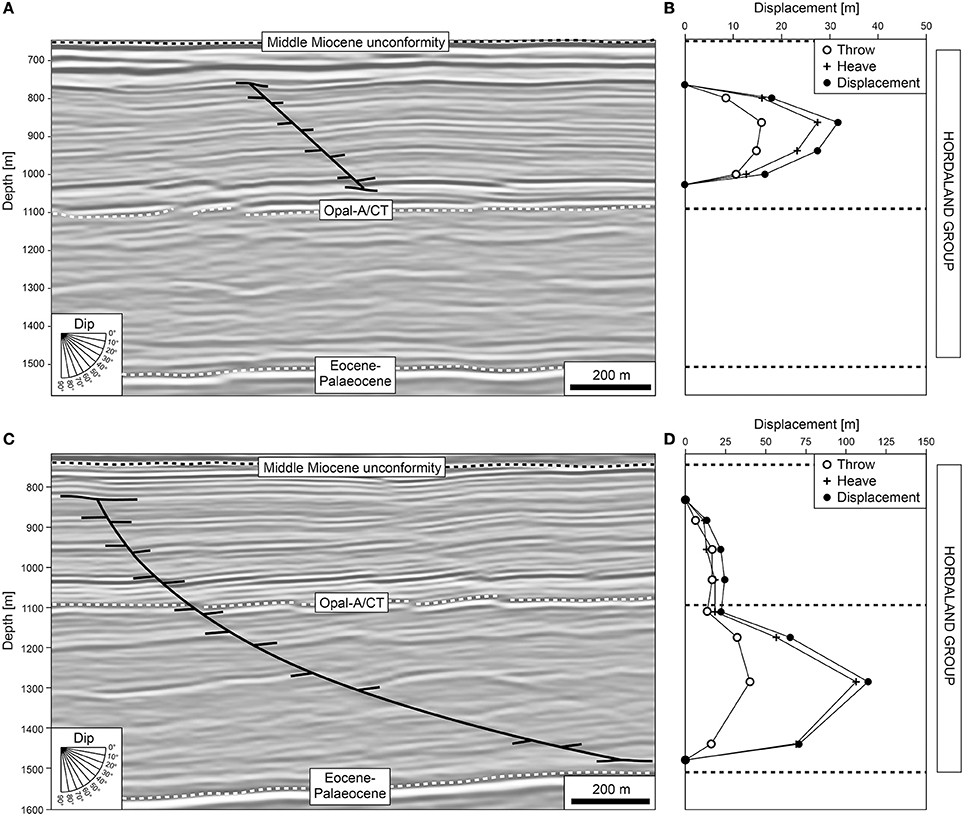
Figure 7. Example of a planar polygonal fault (A) with c-type displacement-depth profile (B) in comparison with an example of a listric polygonal fault (C) with b-type displacement-depth profile (D).
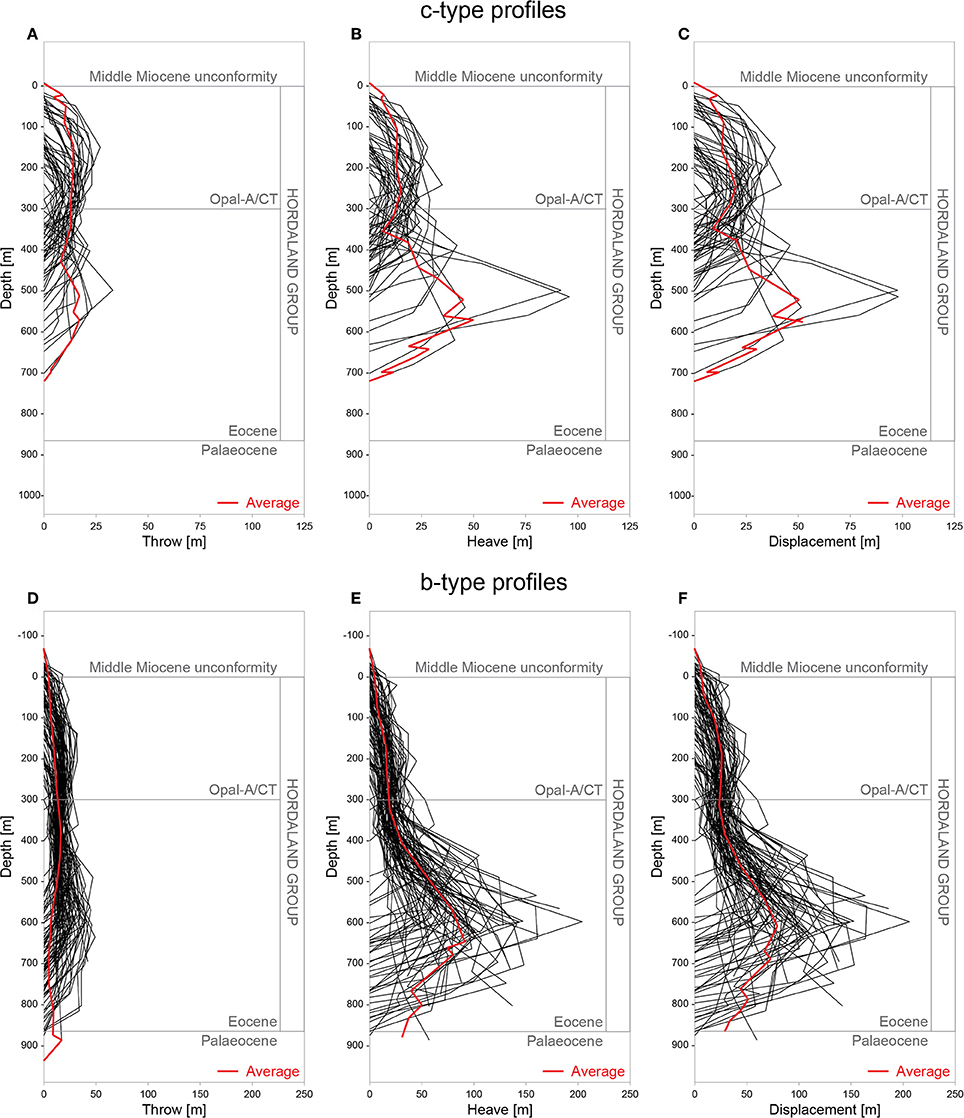
Figure 8. Throw-, heave- and displacement-depth profile of c-type (A–C) and b-type faults (D–F). Note the bulk displacement accumulated in the lower Hordaland Group.
While the extraction does not include a strike-slip component, the polygonal faults studied here show no independent evidence of strike-slip displacement either (e.g., lateral offset of pre-kinematic depositional systems). Displacement-projections are extracted from four randomly-selected faults using strike-perpendicular seismic sections (Figure 9, Figure S2). Finally, we map the geometry these faults in dip section (Figure 10) and cross-plot the extracted geometric data, such as fault height and dip (Figure 11).
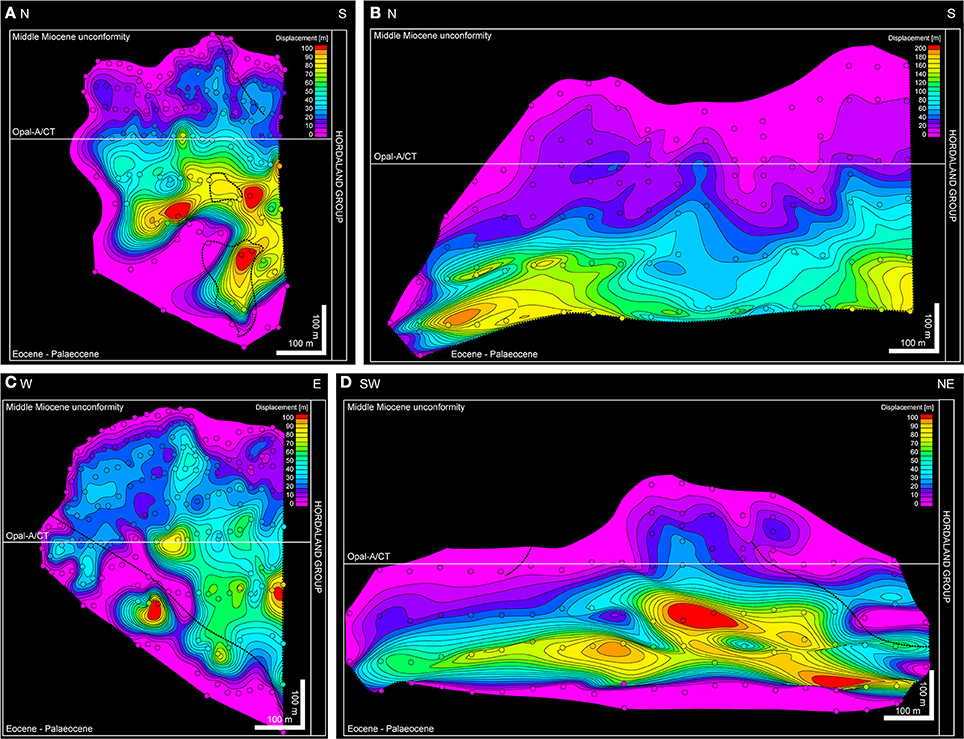
Figure 9. Displacement-strike-projection of four polygonal faults (A–D). (1) The bulk displacement has been accumulated in the lower Hordaland Group; (2) these faults show multiple displacement maxima at similar depth levels and (3) that they have low displacement gradients (<1) at the top. Branch lines are shown as dotted lines.
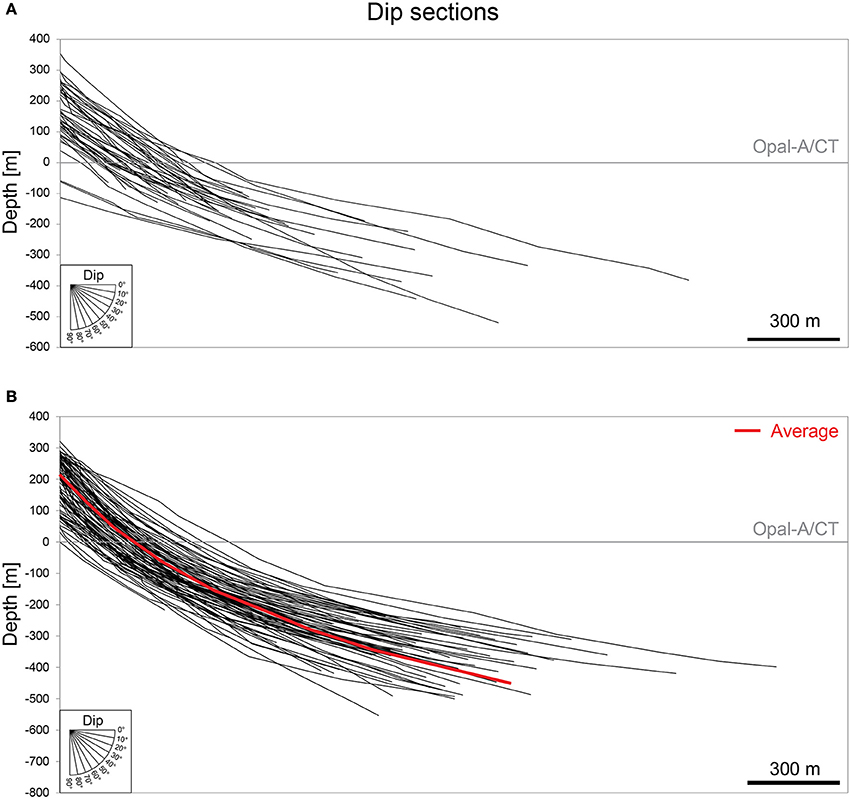
Figure 10. (A) Planar (i.e., constant dip) geometries of faults with c-type displacement-depth profiles and (B) listric (i.e., downward decreasing dip) geometries of faults with b-type displacement-depth profiles in strike-perpendicular cross-section.
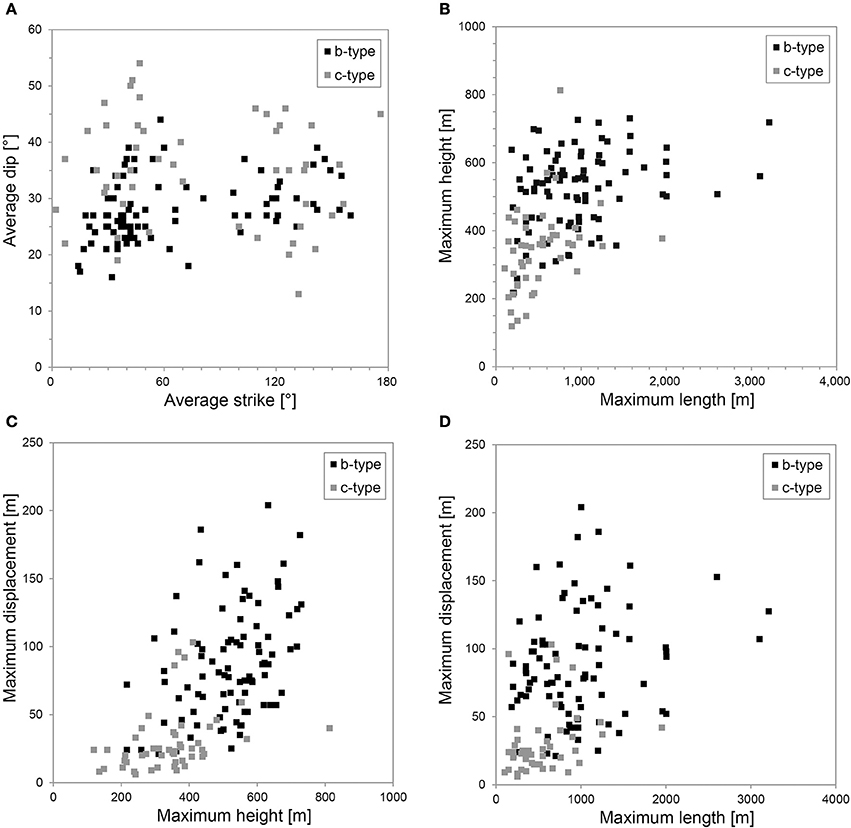
Figure 11. Cross-plots of (A) average strike and dip, (B) maximum length and height, (C) maximum height and displacement, and (D) maximum length and displacement for 137 polygonal faults with b-type and c-type displacement depth profiles (Figure 3). Note that these faults show no preferred orientation (A) and that b-type faults are longer, higher and accommodate more displacement than c-type faults (B–D).
Strain Estimation
To understand strain variability in polygonal fault systems, we use line and area measurements to estimate the layer-parallel strain at various structural levels in this system. The linear strain (εr) describes the change in length (Δr = r0 − r1) relative to the initial length (r0) of a previously unstrained marker:
We approximate the initial length by the length of the section under consideration. The change in length is calculated as the sum of the fault heaves. The bed segments and fault heaves are extracted from 5.4 km long seismic sections located within the sub-volume, in four orientations and at multiple depths (Figure 12). Because seismic sections oblique to normal faults may overestimate the measured strain, we also calculate strains from stratigraphic horizons. The areal strain of a surface ϵA describes the change in area (ΔA = A0 − A1) relative to an initial area (A0) of a previously unstrained marker:
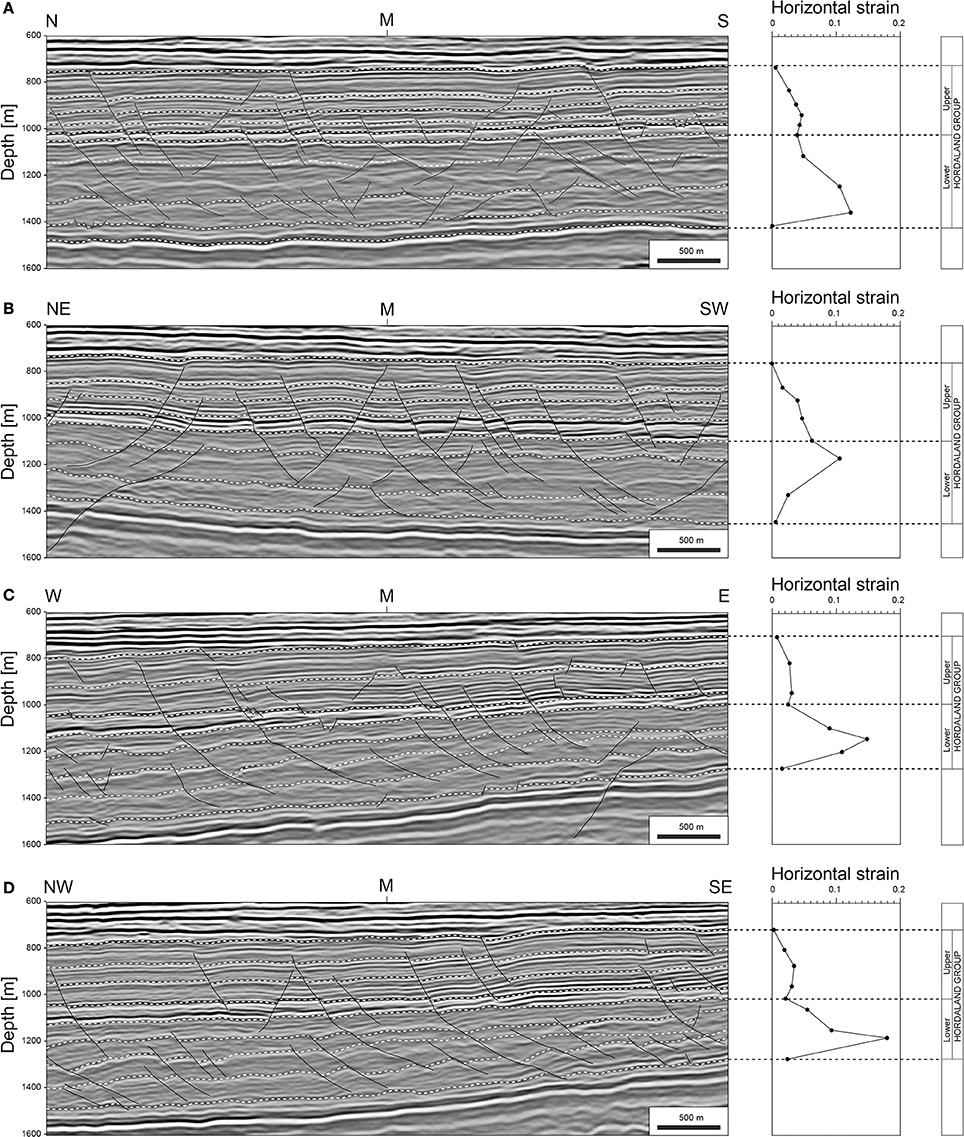
Figure 12. Seismic sections with lateral strain discretized onto polygonal faults. Strain was extracted from seismic sections in four directions (A–D). Note that the bulk strain has been accumulated in the lower Hordaland Group. See Figure 2b for location of sections.
To estimate this strain, we approximate the initial area (A0) by the extent of the map and the final area (A1) by the extent of the horizon without faults (Table 1). To allow a comparison to previous studies, we also convert areal to linear strains, assuming horizontal isotropy (Table 1), by relating area and length:

Table 1. Area measurements and strain calculation for horizons shown on Figure 4.
While these techniques capture visible deformation, it is worth noting that these estimates do not include sub-seismic deformation. Previous studies of tectonic faults, for instance, suggest that sub-seismic faults accommodate 25–60% of the total strain (Marrett and Allmendinger, 1992). While previous studies suggest that polygonal faults can have displacements below the seismic resolution of this study contributing small amounts of strain (Henriet et al., 1988, 1991), it is possible that the above calculation underestimates the layer-parallel strain in the system (see Discussion). Finally, it is worth noting that, since these estimates are based on 3-D surfaces (rather than 2-D maps), the effect of folding is explicitly considered in our strain estimates. Folding a 3-D surface with constant area can result in an apparent area reduction when comparing 2-D maps before and after folding. This apparent area reduction would contribute to lateral strain estimates. To remove this artificial effect, we use 3-D surfaces (rather than 2-D maps) to estimate areal strains. Contractive strains are positive in our notation.
Results
Fault Geometries
The Hordaland Group-hosted fault system displays the characteristic polygonal pattern, including numerous fault segments linked in plan-view (Lonergan et al., 1998). The faults displace the opal-A/CT reflection, with fault heights varying between 100 and 800 m and lengths from 100 to 3,300 m (Figures 2, 10). The faults strikes show no dominant direction (Figures 2, 4, 11). We identify a single tier that tips out upward and downwards onto the top Balder and mid-Miocene unconformity reflections, respectively. Fault geometries ranging from planar to listric in cross-section (Figure 10). The planar faults have average dips of c. 20–50° (Figure 10A), whilst the dips of the listric faults decrease from c. 50–20° with depth (Figure 10B). Planar faults are commonly antithetic to listric faults (e.g., Figure 2d).
Stratigraphic Thickness Variations
We observe prominent across-fault thickening (by up to 80 m) in the lower Hordaland Group (Figures 5F–H) and more subtle across-fault thickening (10–30 m) in the middle (Figures 5D,E) and upper Hordaland Group (Figures 5A,B). The percentage of faults showing across-fault thickness changes varies from ~10% in the upper (Figure 5B) to ~50% in the lower Hordaland Group (Figure 5G).The system also changes from isolated fault traces in the upper Hordaland Group (Figures 5A,B) to a densely connected network in the middle Hordaland Group (Figure 5F) back to isolated fault traces in the lower Hordaland Group (Figure 5H).
Fault Displacement
Overall, 36% (49 of 137) of the mapped faults have symmetric, cone-shaped, c-type (Figures 8A–C) displacement profiles (cf. Muraoka and Kamata, 1983), whereas 64% (88 out of 137) display asymmetric, b-type profiles, with the bulk of displacement occurring below their mid-point (Figures 8D–F). Faults with b-type profiles show the highest displacements (up to 200 m) in the lower Hordaland Group, i.e., strata that were likely undergoing the opal-A/CT transformation (Wrona et al., 2017a; Figure 8F). Whereas fault heaves are relatively high (up to 200 m) (Figure 8E), throws are only slightly higher (up to 50 m) in these strata than observed at shallow depths (Figure 8D). Strike-projections of fault displacement highlight that multiple displacement maxima occur on the fault surface, typically occurring at broadly similar structural depths (Figure 9). These projections also show relatively low displacement gradients (<0.2) near the upper (compared to the lower) tips of the faults (>0.2), and predominantly inclined upper tip lines and displacement contours. We note a correlation between the style of displacement-depth profile and fault geometry, with the majority of planar and listric faults having c- and b-type profiles, respectively (Figures 8, 9). We also note that faults with b-type displacement-depth profiles are longer (~800 m), taller (~200 m) and accommodate more displacement (~60 m) than those with c-type profiles (Figures 11C,D).
Strain Estimates
Linear layer-parallel strains calculated from seismic sections resemble the b-type displacement profiles in that they show an asymmetric depth-dependent increase from 0.01 to 0.18 (Figure 12). This pattern is persistent, occurring irrespective of the orientation of the seismic sections used for measurement. Linear layer-parallel strains calculated from structural maps show the same pattern; an asymmetric depth-dependent increase from 0.02 to 0.19 (Table 1).
Discussion
Fault Nucleation Sites
This section infers the sites of fault nucleation from displacement data of 137 polygonal faults in the system. Displacement data of normal faults provide insights into their nucleation (and growth), particularly where they nucleate (e.g., Barnett et al., 1987; Walsh et al., 2003; Baudon and Cartwright, 2008; Jackson and Rotevatn, 2013). Displacement distributions were first used to study the growth of blind faults, i.e., faults that do not interact with the surface (Watterson, 1986; Barnett et al., 1987). According to the ideal model for the growth of a blind fault, displacement decreases from a maximum at the center of the fault to zero at the tip line of the fault. The model predicts fault growth by radial tip-line propagation without migration of the position of maximum displacement. For an ideal blind fault, the point of maximum displacement therefore coincides with the point of fault nucleation. Displacement maxima may, however, move away from the point of nucleation due to segment linkage (e.g., Peacock and Sanderson, 1991; Cartwright et al., 1995), mechanical heterogeneity (e.g., Gross, 1995; Wilkins and Gross, 2002), and/or mechanical interactions with adjacent structures (e.g., Nicol et al., 1996; Maerten et al., 1999; Morgan et al., 2015).
Displacement data extracted from 3-D seismic reflection data have been used to study the kinematics of polygonal faulting. For example, Neagu et al. (2010) extracted throw-depth profiles for 40 faults in a polygonal fault system in the Vøring and Møre basins, offshore mid-Norway and showed that throw maxima, typically indicating fault nucleation sites, occur both above and below the opal-A/CT transformation. These measurements do not however include fault heaves, which means that they probably underestimate displacement in the lower, shallow-dipping part of these broadly listric faults where fault heaves contribute a significant component to the total displacement. As such, their conclusion that the displacement maxima (i.e., nucleation sites) are also above the opal-A/CT transformation may be somewhat uncertain. Davies and Ireland (2011) extract three displacement-depth profiles from a polygonal fault system in the Vøring Basin and argue that the observed increase in fault displacement above the opal-A/CT transformation shows that differential subsidence due to silica diagenesis occurred in the hanging wall of these faults, and that this drove upward fault propagation (Figure 8A in Davies and Ireland, 2011). However, Davies and Ireland (2011) do not document: (1) how displacement was measured; (2) how throw measurements in time were converted into meters; and (3) whether these profiles are representative for the large number of faults in the system. Another study by Laurent et al. (2012) extracts throws for 30 faults in a polygonal fault system imaged in 3D seismic reflection data in the Vøring Basin using a sequential stratigraphy analysis (Pauget et al., 2009). The analyzed faults are planar, suggesting that throw measurements are broadly representative of the overall displacement. Despite having a larger number of faults than Davies and Ireland (2011) and although they do not suffer from measurement issues related to a listric fault-dominated systems (Neagu et al., 2010), Laurent et al. (2012) do not use their throw measurements, which show maxima above and below the opal-A/CT transformation, to infer polygonal fault kinematics. To summarize, the application of displacement data to understand the kinematics of polygonal faulting has thus far been inconclusive.
In this study, we find that 64% (88 of 137) of the analyzed faults have b-type displacement depth-profiles with displacement maxima located in the lower Hordaland Group, below the opal-A/CT transformation (Figure 8). This suggests that faults nucleated at this structural level, an interpretation supported by our observation of growth strata indicating fault activity in the lower Hordaland Group (see section Timing of Fault Activity).
Fault Mechanics
We now discuss the mechanics of polygonal fault nucleation and growth. Fault nucleation is commonly explained by initial failure of the host strata, which can be predicted from the friction angle (ϕ) of the host strata and the effective horizontal and vertical stress. A friction angle of 17° for the lower Hordaland Group is determined by Wensaas et al. (1998) using triaxial testing of side-wall cores from exploration well 25/7-2 (Figure 2A). While this friction angle describes the current consolidated state of the host strata, the angle was probably lower during fault nucleation, which likely occurred during shallow burial of these sediments, based on the observation that the faults reached the seabed and controlled the accumulation of growth strata. For example, Moore and Lockner (2007) indicate that the angle of friction can be as low as 3.4° in water saturated smectitc clays, such as those characterizing the Hordaland Group mudstones. While it is difficult to determine the exact angle of friction of these sediments prior to fault nucleation, we can discuss the mechanics underlying fault nucleation, which are independent of a particular angle of friction.
First, we calculate the effective vertical stress (), which is the difference between the lithostatic vertical stress (σv) and the pore fluid pressure (pf):
with the lithostatic vertical stress (σv) being:
where g is the gravitational acceleration (9.81 m s−2), ρs is the average (bulk) density of the lower Hordaland Group (~2,000 kg m−3; Wrona et al., 2017a) and z is the depth (0–1 km). The pore fluid pressure can be expressed as the sum of the hydrostatic (ph) and excess pore fluid pressure (pe):
With
where ρw is the salt water density (1,146 kg m−3) (Rider and Kennedy, 2011). The effective horizontal stress () can now be calculated by:
where K0 is the coefficient of earth pressure at rest. The coefficient of earth pressure at rest for normally consolidated clays that have not been pre-compressed or pre-sheared (Terzaghi, 1996), such as the mudstones of the Hordaland Group (Wensaas et al., 1998), can be calculated from the friction angle using Jaky's (1948) equation:
Possible angles of friction of 3.4–17° translate into earth pressures at rest of 0.7–0.94, which are in line with reported values for normally consolidated clays (Mayne and Kulhawy, 1982; Jones, 1994; Craig, 2013).
Under these conditions, the stresses follow the K0-path leading to 1-D compaction without sediment failure and fault nucleation (Figures 13A,B). However, it is clear that failure and faulting occurred in the Hordaland Group. An early mechanical explanation for failure focussed on pore fluid overpressure (Cartwright, 1994a,b). This hypothesis has subsequently been challenged by Goulty (2002), who argued that pore fluid overpressure causes the differential stress to decrease as the Mohr circle moves to the left (Engelder and Fischer, 1994; Miller, 1995), therefore avoiding failure or causing failure to occur in the tensile regime. A second mechanical explanation for fault nucleation invokes a reduction of the horizontal stresses (Cartwright and Lonergan, 1996). To induce sediment failure and fault nucleation, the horizontal stress would need to be reduced to at least:
where Ka refers to the active earth pressure for non-cohesive sediments (Figure 13D):
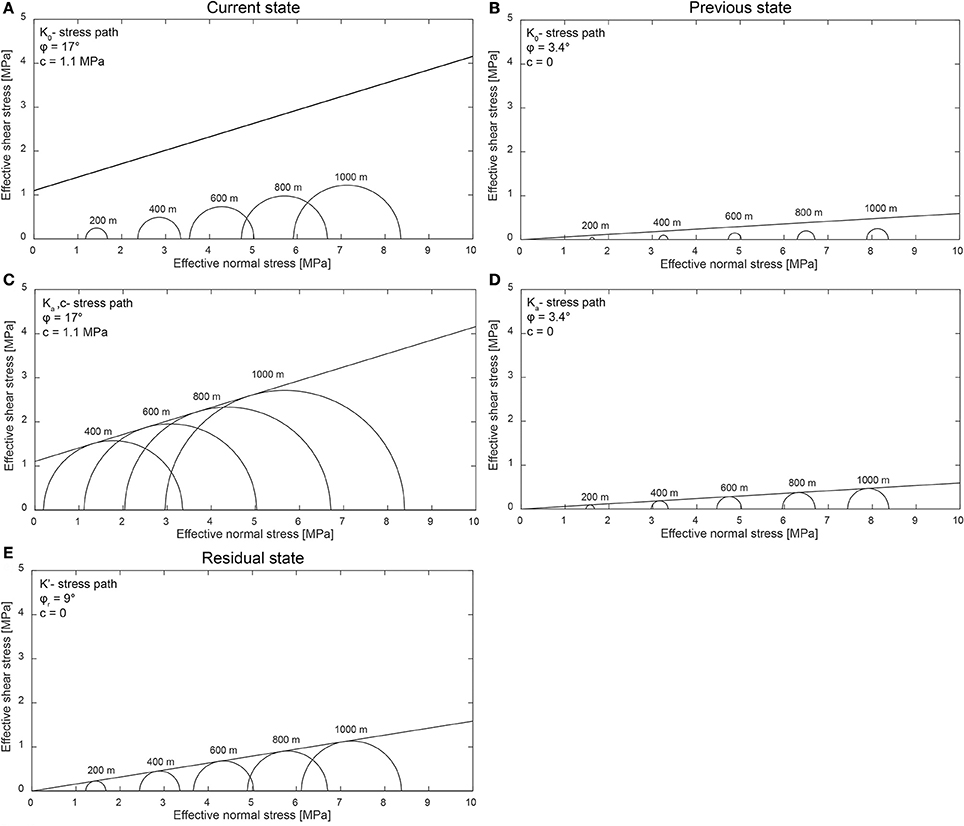
Figure 13. (A) Mohr circles of effective stresses for burial under earth pressure at rest (K0) relative to Coulomb failure envelope based on current mechanical properties of the lower Hordaland Group (Wensaas et al., 1998); (B) Mohr circles of effective stresses for burial under earth pressure at rest (K0) relative to Coulomb failure envelope based on mechanical properties of “weak” clays (Moore and Lockner, 2007), as expected during shallow burial; (C) Mohr circles of effective stresses for burial for active earth pressure (Ka) relative to Coulomb failure envelope with cohesion and friction angle of the lower Hordaland Group (Wensaas et al., 1998); (D) Mohr circles of effective stresses for burial for active earth pressure (Ka) relative to Coulomb failure envelope based on mechanical properties of “weak” clays (Moore and Lockner, 2007), as expected during shallow burial; (E) Mohr circles of effective stresses for burial for earth pressure (K′) relative to Coulomb failure envelope for low coefficients of residual friction (ϕr ≈ 9°; Bishop et al., 1971).
For cohesive sediments, the horizontal stress would need to be reduced to (Figure 13C; Bell, 1915):
Subsequent suggestions for causes of horizontal stress reduction include syneresis (Dewhurst et al., 1999) and diagenesis (Shin et al., 2008; Cartwright, 2011). There are, however, open questions regarding the plausibility of these processes; e.g., can syneresis and/or diagenesis reduce the horizontal effective stress to the point of shear failure at shallow depths (i.e., <100 m), as required for the syneresis model, and at low transformation rates, as required for diagenetic model? In our opinion, additional experimental studies, specifically designed to quantify the horizontal stress reduction in sediments and sedimentary rocks during syneresis and diagenesis, are required to decide if these two processes truly offer plausible explanations for the nucleation of polygonal fault systems.
After discussing the mechanics of fault nucleation, we can examine the mechanism driving fault growth. In general, slip along polygonal faults has been explained by low coefficients of residual friction (Goulty, 2001, 2002, 2008). Rock mechanics predicts slip when the shear stresses at the fault overcome the residual shear strength. Although residual shear strengths of the Hordaland Group mudstones have not been determined, measurements on the stratigraphically equivalent London Clay indicate low angles of residual friction (ϕr ≈ 9°; Bishop et al., 1971). Under these conditions, the following equation (Jaeger et al., 2009):
predicts that earth pressures of (K′ ≈ 0.9) would suffice for these faults to slip (Figure 13E). As this values (0.9) lies within the range of possible values of earth pressures at rest (K0 ≈ 0.7−0.94), low coefficients of residual friction offer a plausible explanation for the growth of these fault. Moreover, it is possible to speculate whether polygonal fault growth is more generally controlled by coefficients of friction. Or, to put it another way, do polygonal fault systems exclusively grow in sediments that show a significant reduction in coefficients of friction during deformation? Note that this hypothesis could be tested by measuring coefficients of residual friction for a significant number of stratigraphic successions hosting polygonal fault systems.
Timing of Fault Activity
This section infers the timing of fault activity using high-resolution stratigraphic thickness maps. Previous studies constrain the timing of polygonal faulting by observing growth strata in 2-D seismic sections (Cartwright, 1994a,b; Cartwright and Lonergan, 1996) and/or stratigraphic thickness maps (Watterson et al., 2000; Stuevold et al., 2003; Morgan et al., 2015). As thickness maps are more robust than 2-D sections, we use stratigraphic thickness maps to constrain the timing of polygonal faulting in the northern North Sea. In the Hordaland Group-hosted polygonal fault system, thickness changes are most pronounced in the lower Hordaland Group (Figures 5F–H), indicating that the main period of syn-depositional faulting occurred in the Eocene to Early Oligocene. Minor thickness changes (10–30 m) in the overlying, middle (Figures 5D,E) and upper Hordaland Group (Figures 5A,B) may result from continued activity until the late Oligocene-to-Miocene, or displacement decreases toward the upper fault tips.
Fault Growth
After nucleation, normal faults grow in size and displacement, with the former typically involving tip-line propagation and segment linkage. In this study, fault growth was examined using a series of displacement-depth profiles and strike-projections (Figures 8, 11). The analysis shows two types of displacement-depth profiles: 64% (88 of 137 faults) have asymmetric b-type profiles with the bulk displacement in their lower halves and 36% (49 of 137 faults) have symmetric, cone-shaped c-type profiles (Figure 8). Because faults with c-type profiles are generally: (1) smaller than the ones with b-type profiles (Figure 11B); (2) have planar as opposed to listric geometries; and (3) are antithetic fault with b-type profiles (e.g., Figure 2D), we suggest that the small planar faults accommodate bending stresses generated during hanging wall rollover of the large listric faults. Hence, the primary faults in this system are probably the larger ones defined by b-type displacement-depth profiles.
As outlined in section Fault Mechanics, slip along these faults can, to a first degree, be explained by low coefficients of residual friction (Goulty, 2001, 2002, 2008). Second order displacement (i.e., cumulative slip) variations may however help us understand the growth of this system. The primary faults show b-type displacement-depth profiles with high values in the lower Hordaland Group (Figure 8F). Since the lower Hordaland Group has undergone silica diagenesis, it may be argued that displacement accumulation was driven by opal-A/CT transformation (e.g., by repeated slip due to horizontal stress reductions during opal-A dissolution). Irrespective of the problems associated with this argument (see section Fault Mechanics), it is also possible to explain high displacement values by continues slip along the fault segments that nucleated first, i.e., the ones that nucleated in the lower Hordaland Group. It is thus not necessary to invoke silica diagenesis as a driver of fault growth to explain the observed displacement profiles and fault kinematics.
Orientation
Clausen et al. (1999) suggest that, based on their recognition of a dominant NW-SE strike within a broadly polygonal array, faults within the Hordaland Group developed due to westward-directed gravitational sliding influenced by a far-field tectonic stresses. In contrast, our analysis of fault strikes along a horizon close to the intra-Oligocene unconformity mapped by Clausen et al. (1999) reveals a more-or-less uniform distribution of fault strikes (Figure 2B). This observation is confirmed by extracting fault orientations along 11 horizons (Figure 4) and by 3-D mapping of 137 polygonal faults within the sub-volume (Figure 11A). The NW-SE strike we observe along only the deepest horizon reflects the orientation of major tectonic faults, rather than the polygonal fault system (Figure 4K). We therefore conclude that this polygonal fault system shows no dominant fault strike, suggesting gravitational sliding and far-field tectonics played no or an imperceptible role in the growth of this system.
Strain
Polygonal fault systems consist of large numbers of normal faults with variable strike orientations and displacements of up to 200 m (Figure 8). Early studies have suggested that the layer-parallel displacement of these faults is accommodated by regional extension of the host succession (e.g., Higgs and McClay, 1993; Clausen et al., 1999); a hypothesis further developed by recent field studies suggesting polygonal faults form due to radial extension (Antonellini and Mollema, 2015; Petracchini et al., 2015). As outlined above, it is difficult to explain the observed uniform distribution of fault strikes in this system by unidirectional gravity-driven or tectonic extension, but could radial extension of the host succession explain the observed fault displacement? Cartwright and Lonergan (1996) demonstrate that observed layer-parallel displacement on polygonal faults in the North Sea could be explained by: (1) external extension or (2) internal contraction of the host strata. External extension of these layer-bound fault systems requires strains of ~0.06–0.19 (Cartwright and Lonergan, 1996), which would need to be accommodated by compression or extrusion of host strata on the basin margins. Since there is still no evidence for either of these processes in the North Sea, we conclude that the argument of Cartwright and Lonergan (1996) relating the observed layer-parallel fault displacement primarily to internal contraction of the host strata, is still valid.
To estimate the contractive strain in the system, we apply zero lateral strain boundary conditions to the host succession (sensu Cartwright and Lonergan, 1996). Previous studies estimate layer-parallel strains of 0.06–0.19 (Cartwright and Lonergan, 1996) and ~0.01 (Watterson et al., 2000) in polygonal fault systems. Using the same method as these studies, we measure linear layer-parallel strains of 0.01–0.18 (Figure 12). Since seismic sections oblique to normal faults may overestimate these strains, we also calculate areal strains of 11 horizons and subsequently derive linear strains of 0.02–0.19, assuming horizontal isotropy (Figure 4 and Table 1). Our estimates suggest that the Cenozoic polygonal fault system, we study here, accommodated layer-parallel strains of 0.01–0.19 depending on the depth of observation, which lies within the range of previously reported values for this system (Cartwright and Lonergan, 1996).
At this point it is worth noting that, based on recent field studies, we may underestimate the total amount of strain in this system. A brief summary of field studies reveals that polygonal fault systems have been documented in: (1) Paleogene mudstones in Belgium (Henriet et al., 1988, 1991; Verschuren, 1992; Dehandschutter et al., 2004, 2005a,b); (2) Cretaceous chalk in France and the UK (Hibsch et al., 2003); (3) Cretaceous chalk in Egypt (Tewksbury et al., 2014); (4) Jurassic sandstones in the US (Antonellini and Mollema, 2015); and (5) Cretaceous to Paleogene carbonates, cherts, and marls in Italy (Petracchini et al., 2015). Whilst earlier studies examining polygonal fault systems in the field mapped faults as discrete slip surfaces (Henriet et al., 1988, 1991; Verschuren, 1992; Dehandschutter et al., 2004, 2005a,b), recent work suggests that “individual” polygonal faults actually consist of dense clusters of slip surfaces (Tewksbury et al., 2014; Antonellini and Mollema, 2015; Petracchini et al., 2015). If the polygonal faults mapped in this study consist of slip surfaces with displacements below the seismic resolution (<10 m), we would underestimate the total strain in the system. Previous studies of tectonic faults suggest that sub-seismic faults can accommodate 25–60% of the total strain (Marrett and Allmendinger, 1992). This highlights that layer-parallel contractive strains could as high as 0.32 in the Hordaland Group system presented here.
Comparing layer-parallel strains with those resulting from conventional compaction is important to understand the overall deformation of the succession hosting the polygonal fault system. To estimate strains resulting from compaction, it is necessary to constrain on the initial and current porosity of the host strata. While the current porosity of these strata is ~0.35 (Wrona et al., 2017a,b), the initial porosity is poorly constrained. Considering initial porosities of 0.45–0.85, the predicted volumetric strains vary between 0.22 and 0.59. This simple estimate highlights that this polygonal fault system accommodates layer-parallel contractive strains (0.01–0.19) on the same order of magnitude as conventional compaction (0.22–0.59).
Conclusions
We examine the kinematic evolution of polygonal faulting in the northern North Sea using high-resolution 3-D seismic reflection and borehole data. Stratigraphic thickness variations suggest the fault system initiated in the Eocene to Early Oligocene, and was likely reactivated in the Late Oligocene to Middle Miocene. Displacement data indicate most (64%) faults nucleated in the lower part of the host succession. The exact trigger for polygonal fault system initiation remains elusive, although fault growth can be explained by low coefficients of residual friction. In contrast, the wide range of fault strikes suggest basin-tilting and associated gravity-driven tectonics played no significant role in the initiation of this system, and that far-field tectonic stresses did not perturb the seemingly radially isotropic stress field. Strain estimates demonstrate that polygonal faulting resulted in significant layer-parallel contraction (strains: 0.01–0.19), approaching the same order of magnitude as conventional compaction.
Author Contributions
This research was part of the PhD project of TW. The research plan was thus developed between the PhD candidate (TW), the supervisors (CA-LJ, MH, and KT) and a colleague (CM). The seismic data used in this study was acquired by Norsk Hydro AS in 1992 and subsequently made publicly available, together with the well data, by the Norwegian Petroleum Directorate. The data analysis and interpretation was conducted by all authors. The manuscript was also developed, written and revised by all authors. All authors approved the final version of the manuscript and thus agree to be accountable for this work.
Conflict of Interest Statement
The authors declare that the research was conducted in the absence of any commercial or financial relationships that could be construed as a potential conflict of interest.
Acknowledgments
We would like to thank the journal editor (Andrea Billi) and the two reviewers (Marco Antonellini and Barbara J. Tewksbury) for their extremely constructive and helpful comments, which significantly improved this manuscript. Moreover, we would like to thank the Department of Earth Science and Engineering, Imperial College for the Janet Watson scholarship that made this research possible. We thank Statoil and the Norwegian Petroleum Directorate for seismic and well data, and Schlumberger and Senergy for software licenses (Petrel, PetroMod and Interactive Petrophysics). We would like to thank Richard Jardine for explanations on the basic mechanics of sediment failure, Jens Jahren, Cedric John, Christian Berndt, and Neil Goulty for helpful comments on previous versions of the manuscript, as well as Matthew Reeve, Johan Claringbould, Matthew Andrews and Sebastian Wolf for insightful discussions on the subject.
Supplementary Material
The Supplementary Material for this article can be found online at: https://www.frontiersin.org/articles/10.3389/feart.2017.00101/full#supplementary-material
Figure S1. Plot showing check-shot data of exploration well 31/2-8 (orange) and linear velocity-depth functions (black), derived to convert seismic sub-cube from time to depth domain. Location of exploration well 31/2-8 is displayed on Figure 2b.
Figure S2. Seismic sections with fault displacement data used for the generation of the strike projection shown on Figure 11C. The 24 seismic sections are shown in order from east to west according to the strike projection. Note that the sections are five times vertically exaggerated.
References
Anell, I., Thybo, H., and Rasmussen, E. (2012). A synthesis of Cenozoic sedimentation in the North Sea. Basin Res. 24, 154–179. doi: 10.1111/j.1365-2117.2011.00517.x
Antonellini, M., and Mollema, P. N. (2015). Polygonal deformation bands. J. Struct. Geol. 81, 45–58. doi: 10.1016/j.jsg.2015.10.003
Arts, R., Eiken, O., Chadwick, A., Zweigel, P., van der Meer, B., and Kirby, G. (2004). Seismic monitoring at the Sleipner underground CO2 storage site (North Sea). Geol. Soc. Lond. 233, 181–191. doi: 10.1144/GSL.SP.2004.233.01.12
Badley, M. E., Price, J. D., Rambech Dahl, C., and Agdestein, T. (1988). The structural evolution of the northern Viking Graben and its bearing upon extensional modes of basin formation. J. Geol. Soc. 145, 455–472. doi: 10.1144/gsjgs.145.3.0455
Bahorich, M., and Farmer, S. (1995). 3-D seismic discontinuity for faults and stratigraphic features: the coherence cube. Lead. Edge 14, 1053–1058. doi: 10.1190/1.1437077
Barnett, J. A. M., Mortimer, J., Rippon, J. H., Walsh, J. J., and Watterson, J. (1987). Displacement geometry in the volume containing a single normal-fault. Bull. Am. Assoc. Petrol. Geol. 71, 925–937.
Baudon, C., and Cartwright, J. (2008). The kinematics of reactivation of normal faults using high resolution throw mapping. J. Struct. Geol. 30, 1072–1084. doi: 10.1016/j.jsg.2008.04.008
Bell, A. L. (1915). “The lateral pressure and resistance of clay and the supporting power of clay foundations,” in Minutes of the Proceedings of the Institution of Civil Engineers (London, UK: Thomas Telford-ICE Virtual Library), 233–272.
Bell, R. E., Jackson, C. A. L., Whipp, P. S., and Clements, B. (2014). Strain migration during multiphase extension: observations from the northern North Sea. Tectonics 33, 1936–1963. doi: 10.1002/2014TC003551
Bishop, A. W., Green, G., Garga, V. K., Andresen, A., and Brown, J. (1971). A new ring shear apparatus and its application to the measurement of residual strength. Geotechnique 21, 273–328. doi: 10.1680/geot.1971.21.4.273
Brown, A. R. (2004). Interpretation of Three-Dimensional Seismic Data. Tulsa, OK: The American Association of Petroleum Geologists and the Society of Exploration Geophysicists.
Cartwright, J. (2011). Diagenetically induced shear failure of fine-grained sediments and the development of polygonal fault systems. Mar. Petrol. Geol. 28, 1593–1610. doi: 10.1016/j.marpetgeo.2011.06.004
Cartwright, J. A. (1994a). Episodic basin-wide fluid expulsion from geopressured shale sequences in the north-sea basin. Geology 22, 447–450. doi: 10.1130/0091-7613(1994)022<0447:EBWFEF>2.3.CO;2
Cartwright, J. A. (1994b). Episodic basin-wide hydrofracturing of overpressured early cenozoic mudrock sequences in the north-sea basin. Mar. Petrol. Geol. 11, 587–607. doi: 10.1016/0264-8172(94)90070-1
Cartwright, J. A., and Lonergan, L. (1996). Volumetric contraction during the compaction of mudrocks: a mechanism for the development of regional-scale polygonal fault systems. Basin Res. 8, 183–193, doi: 10.1046/j.1365-2117.1996.01536.x
Cartwright, J. A., Trudgill, B. D., and Mansfield, C. S. (1995). Fault growth by segment linkage - an explanation for scatter in maximum displacement and trace length data from the canyonlands grabens of Se Utah. J. Struct. Geol. 17, 1319–1326. doi: 10.1016/0191-8141(95)00033-A
Cartwright, J., Huuse, M., and Aplin, A. (2007). Seal bypass systems. Am. Assoc. Pet. Geol. Bull. 91, 1141–1166. doi: 10.1306/04090705181
Cartwright, J., James, D., and Bolton, A. (2003). The genesis of polygonal fault systems: a review. Subsurf. Sedim. Mobilizat. 216, 223–243. doi: 10.1144/GSL.SP.2003.216.01.15
Childs, C., Nicol, A., Walsh, J. J., and Watterson, J. (2003). The growth and propagation of synsedimentary faults. J. Struct. Geol. 25, 633–648. doi: 10.1016/S0191-8141(02)00054-8
Clausen, J., Gabrielsen, R., Reksnes, P., and Nysaether, E. (1999). Development of intraformational (Oligocene–Miocene) faults in the northern North Sea: influence of remote stresses and doming of Fennoscandia. J. Struct. Geol. 21, 1457–1475. doi: 10.1016/S0191-8141(99)00083-8
Davies, R. J., Huuse, M., Hirst, P., Cartwright, J., and Yang, Y. S. (2006). Giant clastic intrusions primed by silica diagenesis. Geology 34, 917–920. doi: 10.1130/G22937A.1
Davies, R., Ireland, M., and Cartwright, J. (2009). Differential compaction due to the irregular topology of a diagenetic reaction boundary: a new mechanism for the formation of polygonal faults. Basin Res. 21, 354–359. doi: 10.1111/j.1365-2117.2008.00389.x
Davies, R. J., and Ireland, M. T. (2011). Initiation and propagation of polygonal fault arrays by thermally triggered volume reduction reactions in siliceous sediment. Mar. Geol. 289, 150–158. doi: 10.1016/j.margeo.2011.05.005
Dehandschutter, B., Gaviglio, P., Sizun, J.-P., Sintubin, M., Vandycke, S., Vandenberghe, N., et al. (2005a). Volumetric matrix strain related to intraformational faulting in argillaceous sediments. J. Geol. Soc. Lond. 162, 801–813. doi: 10.1144/0016-764904-093
Dehandschutter, B., Vandycke, S., Sintubin, M., Vandenberghe, N., Gaviglio, P., Sizun, J.-P., et al. (2004). Microfabric of fractured Boom Clay at depth: a case study of brittle–ductile transitional clay behaviour. Appl. Clay Sci. 26, 389–401. doi: 10.1016/j.clay.2003.12.013
Dehandschutter, B., Vandycke, S., Sintubin, M., Vandenberghe, N., and Wouters, L. (2005b). Brittle fractures and ductile shear bands in argillaceous sediments: inferences from Oligocene Boom Clay (Belgium). J. Struct. Geol. 27, 1095–1112. doi: 10.1016/j.jsg.2004.08.014
Dewhurst, D. N., Cartwright, J. A., and Lonergan, L. (1999). The development of polygonal fault systems by syneresis of colloidal sediments. Mar. Petrol. Geol. 16, 793–810. doi: 10.1016/S0264-8172(99)00035-5
Eidvin, T., and Rundberg, Y. (2001). Late Cainozoic stratigraphy of the Tampen area (Snorre and Visund fields) in the northåm North Sea, with emphasis on the chronology of early Neogene sands. Nor. J. Geol. 81, 119–160. Available online at: http://njg.geologi.no/vol-81-90/details/17/458-458
Engelder, T., and Fischer, M. P. (1994). Influence of poroelastic behavior on the magnitude of minimum horizontal stress, Sh in overpressured parts of sedimentary basins. Geology 22, 949–952. doi: 10.1130/0091-7613(1994)022<0949:IOPBOT>2.3.CO;2
Faerseth, R. B., Knudsen, B. E., Liljedahl, T., Midboe, P. S., and Soderstrom, B. (1997). Oblique rifting and sequential faulting in the Jurassic development of the northern North Sea. J. Struct. Geol. 19, 1285–1302. doi: 10.1016/S0191-8141(97)00045-X
Faleide, J. I., Kyrkjebo, R., Kjennerud, T., Gabrielsen, R. H., Jordt, H., Fanavoll, S., et al. (2002). Tectonic impact on sedimentary processes during Cenozoic evolution of the northern North Sea and surrounding areas. Geol. Soc. Lond. 196, 235–269. doi: 10.1144/GSL.SP.2002.196.01.14
Gay, A., and Berndt, C. (2007). Cessation/reactivation of polygonal faulting and effects on fluid flow in the Vøring Basin, Norwegian Margin. J. Geol. Soc. Lond. 164, 129–141. doi: 10.1144/0016-76492005-178
Goulty, N. (2001). Polygonal fault networks in fine-grained sediments–an alternative to the syneresis mechanism. First Break 19, 69–73. doi: 10.1046/j.1365-2397.2001.00137.x
Goulty, N. (2002). Mechanics of layer-bound polygonal faulting in fine-grained sediments. J. Geol. Soc. Lond. 159, 239–246. doi: 10.1144/0016-764901-111
Goulty, N. (2008). Geomechanics of polygonal fault systems: a review. Petrol. Geosci. 14, 389–397. doi: 10.1144/1354-079308-781
Graham, C., Armour, A., Bathurst, P., Evans, D., and Petroleumsforening, N. (2003). The Millennium Atlas: Petroleum Geology of the Central and Northern North Sea. London, UK: Geological Society of London.
Gross, M. R. (1995). Fracture partitioning: failure mode as a function of lithology in the Monterey Formation of coastal California. Geol. Soc. Am. Bull. 107, 779–792. doi: 10.1130/0016-7606(1995)107<0779:FPFMAA>2.3.CO;2
Henriet, J., De Batist, M., Van Vaerenbergh, W., and Verschuren, M. (1988). Seismic facies and clay tectonic features of the Ypresian clay in the southern North Sea. Bull. Belgische Veren. Geol. 97, 457–472.
Henriet, J., De Batist, M., and Verschuren, M. (1991). “Early fracturing of Palaeogene clays, southernmost North Sea: relevance to mechanisms of primary hydrocarbon migration,” in Generation, Accumulation and Production of Europe's Hydrocarbons, Vol. 1, ed A. M. Spencer (Special Publication of the European Association of Petroleum Geologists), 217–227.
Hibsch, C., Cartwright, J., Hansen, D., Gaviglio, P., André, G., Cushing, M., et al. (2003). Normal faulting in chalk: tectonic stresses vs. compaction-related polygonal faulting. Geol. Soc. Lond. 216, 291–308. doi: 10.1144/GSL.SP.2003.216.01.19
Higgs, W., and McClay, K. (1993). Analogue sandbox modelling of Miocene extensional faulting in the Outer Moray Firth. Geol. Soc. Lond. 71, 141–162. doi: 10.1144/GSL.SP.1993.071.01.07
Holgate, N. E., Jackson, C. A.-L., Hampson, G. J., and Dreyer, T. (2013). Sedimentology and sequence stratigraphy of the middle–upper jurassic krossfjord and fensfjord formations, Troll Field, northern North Sea. Petrol. Geosci. 19, 237–258. doi: 10.1144/petgeo2012-039
Huuse, M., Jackson, C. A. L., Van Rensbergen, P., Davies, R. J., Flemings, P. B., and Dixon, R. J. (2010). Subsurface sediment remobilization and fluid flow in sedimentary basins: an overview. Basin Res. 22, 342–360. doi: 10.1111/j.1365-2117.2010.00488.x
Jackson, C. A.-L., Carruthers, D. T., Mahlo, S. N., and Briggs, O. (2014). Can polygonal faults help locate deep-water reservoirs? Am. Assoc. Pet. Geol. Bull. 98, 1717–1738. doi: 10.1306/03131413104
Jackson, C. A.-L., and Rotevatn, A. (2013). 3D seismic analysis of the structure and evolution of a salt-influenced normal fault zone: a test of competing fault growth models. J. Struct. Geol. 54, 215–234. doi: 10.1016/j.jsg.2013.06.012
Jaeger, J. C., Cook, N. G., and Zimmerman, R. (2009). Fundamentals of Rock Mechanics. Malden, MA: John Wiley and Sons.
Jaky, J. (1948). “Pressure in silos,” in Proceedings of the 2nd International Conference on Soil Mechanics and Foundation Engineering (London, UK), 103–107.
Jones, M. (1994). Mechanical principles of sediment deformation. Geol. Deform. Sedim. 37–71. doi: 10.1007/978-94-011-0731-0_2
Jordt, H., Faleide, J. I., Bjørlykke, K., and Ibrahim, M. T. (1995). Cenozoic sequence stratigraphy of the central and northern North Sea Basin: tectonic development, sediment distribution and provenance areas. Mar. Petrol. Geol. 12, 845–879. doi: 10.1016/0264-8172(95)98852-V
Jordt, H., Thyberg, B. I., and Nottvedt, A. (2000). Cenozoic evolution of the central and northern North Sea with focus on differential vertical movements of the basin floor and surrounding clastic source areas. Geol. Soc. Lond. 167, 219–243, doi: 10.1144/GSL.SP.2000.167.01.09
Joy, A. M. (1993). Comments on the pattern of post-rift subsidence in the Central and Northern North Sea Basin. Geol. Soc. Lond. 71, 123–140, doi: 10.1144/GSL.SP.1993.071.01.06
Knox, R. W. O. B., and Holloway, S. (1992). 1. Paleogene of the Central and Northern North Sea. Nottingham: British Geological Survey Nottingham.
Kyrkjebø, R., Kjennerud, T., Gillmore, G., Faleide, J., and Gabrielsen, R. (2001). Cretaceous-Tertiary palaeo-bathymetry in the northern North Sea; integration of palaeo-water depth estimates obtained by structural restoration and micropalaeontological analysis. Nor. Petrol. Soc. Spec. Publ. 10, 321–345. doi: 10.1016/S0928-8937(01)80020-5
Laurent, D., Gay, A., Baudon, C., Berndt, C., Soliva, R., Planke, S., et al. (2012). High-resolution architecture of a polygonal fault interval inferred from geomodel applied to 3D seismic data from the Gjallar Ridge, Vøring Basin, Offshore Norway. Mar. Geol. 332, 134–151. doi: 10.1016/j.margeo.2012.07.016
Lonergan, L., Cartwright, J., and Jolly, R. (1998). The geometry of polygonal fault systems in Tertiary mudrocks of the North Sea. J. Struct. Geol. 20, 529–548, doi: 10.1016/S0191-8141(97)00113-2
Løseth, H., Raulline, B., and Nygård, A. (2013). Late Cenozoic geological evolution of the northern North Sea: development of a Miocene unconformity reshaped by large-scale Pleistocene sand intrusion. J. Geol. Soc. Lond. 170, 133–145. doi: 10.1144/jgs2011-165
Maerten, L., Willemse, E. J., Pollard, D. D., and Rawnsley, K. (1999). Slip distributions on intersecting normal faults. J. Struct. Geol. 21, 259–272. doi: 10.1016/S0191-8141(98)00122-9
Marrett, R., and Allmendinger, R. W. (1992). Amount of extension on“ small” faults: an example from the Viking graben. Geology 20, 47–50. doi: 10.1130/0091-7613(1992)020<0047:AOEOSF>2.3.CO;2
Mayne, P. W., and Kulhawy, F. H. (1982). Ko- OCR relationships in soil. J. Soil Mech. Found. Div. 108, 851–872.
McLeod, A. E., Dawers, N., and Underhill, J. (2000). The propagation and linkage of normal faults: insights from the Strathspey–Brent–Statfjord fault array, northern North Sea. Basin Res. 12, 263–284. doi: 10.1046/j.1365-2117.2000.00124.x
Miller, T. W. (1995). New insights on natural hydraulic fractures induced by abnormally high pore pressures. Am. Assoc. Pet. Geol. Bull. 79, 1005–1018.
Moore, D. E., and Lockner, D. A. (2007). “Friction of the smectite clay montmorillonite,” in The Seismogenic Zone of Subduction Thrust Faults, eds T. Dixon and C. Moore (New York, NY: Columbia University Press), 317–345.
Morgan, D., Cartwright, J., and Imbert, P. (2015). Perturbation of polygonal fault propagation by buried pockmarks and the implications for the development of polygonal fault systems. Mar. Petrol. Geol. 65, 157–171. doi: 10.1016/j.marpetgeo.2015.03.024
Muraoka, H., and Kamata, H. (1983). Displacement distribution along minor fault traces. J. Struct. Geol. 5, 483–495. doi: 10.1016/0191-8141(83)90054-8
Nadin, P., and Kusznir, N. (1995). Palaeocene uplift and Eocene subsidence in the northern North Sea Basin from 2D forward and reverse stratigraphic modelling. J. Geol. Soc. Lond. 152, 833–848. doi: 10.1144/gsjgs.152.5.0833
Neagu, R. C., Cartwright, J., and Davies, R. (2010). Measurement of diagenetic compaction strain from quantitative analysis of fault plane dip. J. Struct. Geol. 32, 641–655. doi: 10.1016/j.jsg.2010.03.010
Nicol, A., Watterson, J., Walsh, J. J., and Childs, C. (1996). The shapes, major axis orientations and displacement patterns of fault surfaces. J. Struct. Geol. 18, 235–248. doi: 10.1016/S0191-8141(96)80047-2
Pauget, F., Lacaze, S., and Valding, T. (2009). “A global approach in seismic interpretation based on cost function minimization,” in 2009 SEG Annual Meeting (Tulsa, OK: Society of Exploration Geophysicists).
Peacock, D., and Sanderson, D. (1991). Displacements, segment linkage and relay ramps in normal fault zones. J. Struct. Geol. 13, 721–733. doi: 10.1016/0191-8141(91)90033-F
Petracchini, L., Antonellini, M., Billi, A., and Scrocca, D. (2015). Syn-thrusting polygonal normal faults exposed in the hinge of the Cingoli anticline, northern Apennines, Italy. Front. Earth Sci. 3:67. doi: 10.3389/feart.2015.00067
Rider, M. H., and Kennedy, M. (2011). The Geological Interpretation of Well Logs. Sutherland: Rider-French consulting LTD.
Rundberg, Y. (1989). Tertiary Sedimentary History and Basin Evolution of the Norwegian North Sea between 60 -62 N: An Integrated Approach. Trondheim: Universititet i Trondheim, Norges Tekniske Høgskole.
Rundberg, Y., and Eidvin, T. (2005). “Controls on depositional history and architecture of the Oligocene-Miocene succession, northern North Sea Basin,” in Norwegian Petroleum Society Special Publications, eds T. G. Bjørn, J. P. N. E. E. Wandås, and G. Felix (Amsterdam: Elsevier), 207–239.
Shin, H., Santarnarina, J. C., and Cartwright, J. A. (2008). Contraction-driven shear failure in compacting uncemented sediments. Geology 36, 931–934. doi: 10.1130/G24951A.1
Stuevold, L. M., Faerseth, R. B., Arnesen, L., Cartwright, J., and Möller, N. (2003). Polygonal faults in the Ormen Lange field, Møre basin, offshore mid Norway. Geol. Soc. Lond. Spec. Publ. 216, 263–281. doi: 10.1144/GSL.SP.2003.216.01.17
Tewksbury, B. J., Hogan, J. P., Kattenhorn, S. A., Mehrtens, C. J., and Tarabees, E. A. (2014). Polygonal faults in chalk: insights from extensive exposures of the Khoman Formation, Western Desert, Egypt. Geology 42, 479–482. doi: 10.1130/G35362.1
Verschuren, M. (1992). An Integrated 3D Approach to Clay Tectonic Deformation and the Development of a New 3D Surface Modelling Method. Gent: University of Gent.
Walsh, J. J., Bailey, W. R., Childs, C., Nicol, A., and Bonson, C. G. (2003). Formation of segmented normal faults: a 3-D perspective. J. Struct. Geol. 25, 1251–1262. doi: 10.1016/S0191-8141(02)00161-X
Walsh, J. J., and Watterson, J. (1989). Displacement gradients on fault surfaces. J. Struct. Geol. 11, 307–316. doi: 10.1016/0191-8141(89)90070-9
Watterson, J. (1986). Fault dimensions, displacements and growth. Pure Appl. Geophys. 124, 365–373. doi: 10.1007/BF00875732
Watterson, J., Walsh, J., Nicol, A., Nell, P., and Bretan, P. (2000). Geometry and origin of a polygonal fault system. J. Geol. Soc. Lond. 157, 151–162. doi: 10.1144/jgs.157.1.151
Wensaas, L., Aagaard, P., Berre, T., and Roaldset, E. (1998). Mechanical properties of North Sea Tertiary mudrocks: investigations by triaxial testing of side-wall cores. Clay Miner. 33, 171–183. doi: 10.1180/000985598545354
Wilkins, S. J., and Gross, M. R. (2002). Normal fault growth in layered rocks at Split Mountain, Utah: influence of mechanical stratigraphy on dip linkage, fault restriction and fault scaling. J. Struct. Geol. 24, 1413–1429. doi: 10.1016/S0191-8141(01)00154-7
Wrona, T., Jackson, C. A.-L., Huuse, M., and Taylor, K. G. (2017a). Silica diagenesis in Cenozoic mudstones of the North Viking Graben: physical properties and basin modelling. Basin Res. 29, 556–575. doi: 10.1111/bre.12168
Wrona, T., Taylor, K. G., Jackson, C. A. L., Huuse, M., Najorka, J., and Pan, I. (2017b). Impact of silica diagenesis on the porosity of fine-grained strata: An analysis of Cenozoic mudstones from the North Sea. Geochem. Geophys. Geosyst. 18, 1537–1549. doi: 10.1002/2016GC006482
Keywords: polygonal faults, normal faults, fine-grained sediments, diagnesis, silica, compaction, fluid flow, rock mechanics
Citation: Wrona T, Magee C, Jackson CA-L, Huuse M and Taylor KG (2017) Kinematics of Polygonal Fault Systems: Observations from the Northern North Sea. Front. Earth Sci. 5:101. doi: 10.3389/feart.2017.00101
Received: 05 September 2017; Accepted: 17 November 2017;
Published: 04 December 2017.
Edited by:
Andrea Billi, Consiglio Nazionale Delle Ricerche (CNR), ItalyReviewed by:
Marco Antonellini, Università di Bologna, ItalyBarbara J. Tewksbury, Hamilton College New York, United States
Copyright © 2017 Wrona, Magee, Jackson, Huuse and Taylor. This is an open-access article distributed under the terms of the Creative Commons Attribution License (CC BY). The use, distribution or reproduction in other forums is permitted, provided the original author(s) or licensor are credited and that the original publication in this journal is cited, in accordance with accepted academic practice. No use, distribution or reproduction is permitted which does not comply with these terms.
*Correspondence: Thilo Wrona, dGhpbG8ud3JvbmFAdWliLm5v
†Present Address: Thilo Wrona, Department of Earth Science, University of Bergen, Bergen, Norway
 Thilo Wrona
 Craig Magee1
 Christopher A-L. Jackson
 Mads Huuse