 Luigi Passarelli1*
 Nova Heryandoko1,2Simone Cesca1
 Eleonora Rivalta1Rasmid1,2
 Supriyanto Rohadi2Torsten Dahm1Claus Milkereit1
- 1German Research Centre for Geosciences, Potsdam, Germany
- 2Badan Meteorologi Klimatologi dan Geofisika, Jakarta, Indonesia
Seismic swarms close to volcanoes often signal the onset of unrest. Establishing whether magma is the culprit and the unrest can be flagged as magmatic may be challenging. Here we analyze the spatio-temporal pattern of a seismic swarm that occurred in November 2015–February 2016 around Jailolo volcano, a long-dormant and poorly studied volcano located on Halmahera island, North Moluccas, Indonesia. The swarm included four Mw > 5 earthquakes and hundreds of events were felt by the population. We relocate the earthquakes using both the Indonesian Seismic Network and single-station location techniques. We find that the earthquakes cluster in a narrow strip, stretching 5 km E–W and 20 km N–S, migrating southward away from Jailolo volcano at ~10 km/d. We investigate the source mechanisms of the largest earthquakes via full moment tensor inversion. The non-double-couple component is around 50%, such that the earthquakes, besides normal faulting, included a relatively large opening component. After a thorough examination of the possible causes of the Jailolo swarm we conclude that a laterally propagating dike of tens of millions of cubic meters is the triggering mechanism for the seismicity. The swarm marks the first documented magmatic unrest at Jailolo. We find that there is a probability >0.1 that the unrest will last for more than 2 years. This magmatic unrest calls for the classification of Jailolo volcano as active, and for an urgent assessment of the associated volcanic hazard.
Introduction
Earthquake swarms are sequences of earthquakes lacking an apparent temporal order in terms of magnitude and seismic rate. The seismicity rate during swarms fluctuates over time and the largest earthquakes are usually delayed with respect to the swarm onset (Utsu, 2002; Hainzl, 2004; Vidale and Shearer, 2006; Passarelli et al., 2015a, 2018). They are thought to originate in response to stress histories more complex than a sudden stress change, e.g., due to a large earthquake, producing typical aftershock sequences (Mogi, 1967). High pore-pressure diffusion (Talwani and Acree, 1984), pressurization of fluid-filled reservoirs (Simpson et al., 1988), man-made or natural hydrofractures (including magmatic diking) (Dahm et al., 2010; Passarelli et al., 2015b), and slow-slip events (Lohman and McGuire, 2007; Peng and Gomberg, 2010; Fukuda, 2018) have all been identified as trigger mechanisms of seismic swarms.
At volcanoes, brittle-failure earthquakes are commonly termed volcano-tectonic (VT) earthquakes (McNutt, 2005). Swarms of VT earthquakes have been extensively investigated for their association to the eruptive cycle of volcanoes (Benoit and McNutt, 1996). They do not always signal an impending eruption (Moran et al., 2011; Newhall et al., 2017), yet most eruptions are preceded by seismic swarms (Benoit and McNutt, 1996; Passarelli and Brodsky, 2012). Thus, when a VT swarm is observed, it is critical to discriminate what process caused it, especially if the swarm has affected an inhabited area (Barberi et al., 1984). In many cases, discerning the cause of a seismic swarm in a volcanic area may be challenging, since the full range of magmatic and tectonic mechanisms are plausible. This is especially true in areas lacking dedicated monitoring and in the absence of observations complementary to seismology, in particular crustal deformation (Sparks, 2003; Moran et al., 2011).
The source mechanisms and migration patterns of the hypocenters of volcanic and tectonic swarm earthquakes have helped to discern between different swarm-triggering processes, such as hydrofracturing, magmatic intrusion, pore-pressure diffusion, and slow-slip events (Brandsdóttir and Einarsson, 1979; Patanè et al., 2003; Wolfe et al., 2007; Roland and McGuire, 2009; Gardine et al., 2011; Hainzl et al., 2012; Jay et al., 2012; Mattia et al., 2015; Gudmundsson et al., 2016; Alpala et al., 2017; Cattania et al., 2017; Passarelli et al., 2018).
In November 2015, an intense seismic swarm occurred near Jailolo volcano, Halmahera, Indonesia. The swarm lasted for several weeks and faded out by the end of February 2016. The earthquake swarm was energetic enough to be recorded by global seismic networks, registering four Ml ≥ 5 events and 13 Ml > 4 earthquakes (GEOFON Data Center, 1993; Ekström et al., 2012; ANSS catalog, 2016). The population around Jailolo volcano felt shaking for the entire duration of the swarm, suggesting that the earthquakes were shallow. The largest events caused damage to private and public buildings (Gunawan et al., 2017).
The Jailolo volcanic complex, located in the middle section of the West Halmahera volcanic arc, is not categorized among the Indonesian active volcanoes since it has no documented eruption in historical records and no surface manifestation of fumarolic activity (Venzke, 2013; see https://magma.vsi.esdm.go.id/). No seismic unrest in the Jailolo region can be recognized for the 40 years prior to the 2015–2016 swarm (ANSS catalog, 2016; see Figure 1a and Supplementary Figures S1–S4), so the question arises whether the swarm had a tectonic or magmatic origin. Investigating the seismicity in the Jailolo region is challenging due to the sparse station coverage in the North Moluccas archipelago (Figure 1b). Fortunately, the broadband station TNTI on Ternate island (Figures 1a,b) has run almost continuously since 2007. Recordings at TNTI (an example is given in Supplementary Figure S5) show a swarm-like sequence, with several bursts of seismic activity and no clear mainshock–aftershock pattern.
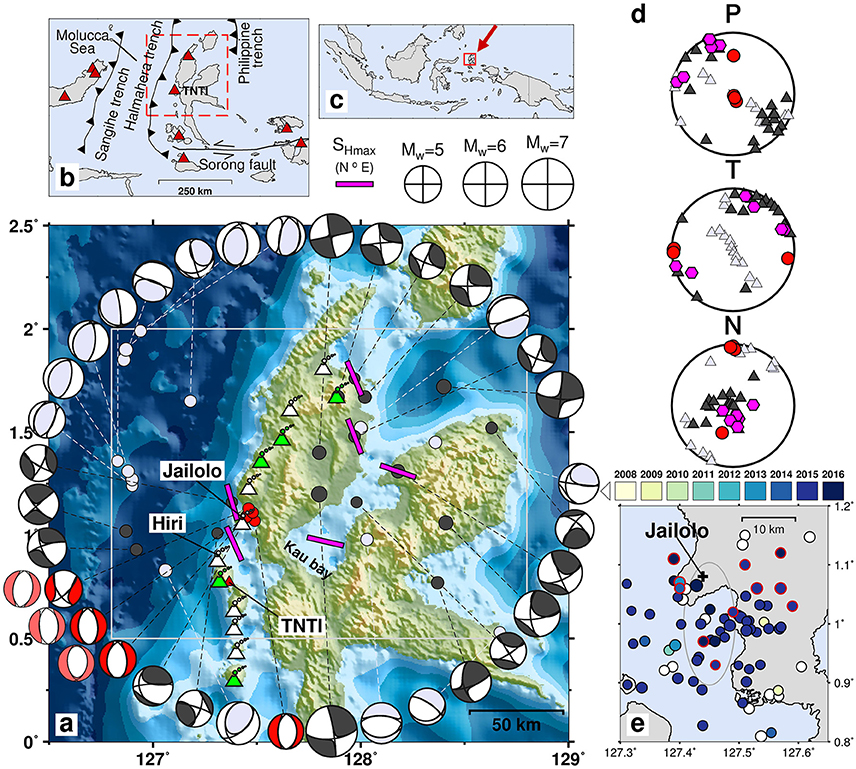
Figure 1. Map of Halmahera, tectonics, and strain/stress field. (a) Map of northern part of Halmahera island with topography and bathymetry from GEBCO_2014 grid version 20150318, www.gebco.net (Weatherall et al., 2015), where the highest and lowest points are 1,550 m a.s.l. and −3,550 m b.s.l., respectively. Colored circles are the epicenters of the FMs reported in the GCMT catalog, selected within the region indicated by the light gray box and with < 50 km hypocentral depth. Dark gray beach balls have P- and T-axes plunging < 45°. Light red beach balls are the four largest events that occurred during the November 2015 – February 2016 seismic swarm at Jailolo volcano, which are paired with the available pale red FMs listed in the GEOFON earthquake catalog. Light gray beach balls are the remaining FMs. Beach ball and epicentral circle sizes scale with magnitude as shown in the legend. Magenta bars indicate the azimuth and location of the maximum horizontal stress SHmax listed in the World stress Stress Map. Volcanoes are indicated with volcano symbols: green-colored symbols indicate Holocene eruptions while white-colored symbols indicate unknown Holocene eruptions (Global Volcanism Program). The red triangle shows the TNTI seismic station. (b) Larger map indicating the main regional tectonic structures of the Molucca Sea and Halmahera region. Red triangles are the seismic stations of the Indonesian (IA) and GEOFON (GE) networks used in this study. The red box indicates the area plotted in (a). (c) Map of Indonesia highlighting the Halmahera region plotted in (a). (d) Stereographic plot of the P-, T-, and N-axes of the FMs and the regional stress field as color-coded in panel (a). Triangles are the strike-slip (gray) and other FMs (light gray), red circles are the FMs of the Jailolo seismic swarm, and magenta hexagons are the stress axis orientation from the World Stress Map database. (e) Seismicity in the epicentral area of the 2015–2016 swarm at Jailolo (gray ellipse) listed in the USGS ANSS (black outlined circles) and GEOFON (red outlined circles) catalogs with hypocentral depth shallower than 50 km. The color code is the year from 2008 and the symbol size scales with magnitude as in (a).
Here, we use data recorded by the Indonesian Seismic Network (Figure 1b) to identify and relocate earthquakes that occurred during the 2015–2016 swarm as well as prior to it. In order to detect more events, we use a template matching technique, relying on the closest broadband seismic station. Next, we locate the earthquakes using the Indonesian regional seismic network and, finally, we refine the locations using a double-difference relocation algorithm. We investigate the earthquake source parameters of the largest events in the swarm through moment tensor analysis, and the smaller events via waveform similarity. Finally, we test different models to reveal the process that generated the swarm based on the earthquake migration pattern and source mechanics, and discuss the implications for Jailolo volcano.
Geology and Seismo-Tectonic Setting of Halmahera Island and the Jailolo Region
Tectonic Setting of North Halmahera
The island of Halmahera is situated in the northern part of the Moluccas archipelago in eastern Indonesia; the island has a characteristic four-armed K shape (Figure 1). Halmahera bounds to the east the Molucca Sea collision complex, which extends westward for ~250 km to the Sangihe Trench offshore Sulawesi island (Figure 1b). The present-day convergence within the Molucca Sea produces westward and eastward thrusting over the Sangihe and Halmahera volcanic arcs, respectively (Hamilton, 1979; Cardwell et al., 1980; Hinschberger et al., 2005). The shortening of this unique arc–arc collision complex results from the large-scale relative convergence of the Philippine Sea Plate (PSP) with the Eurasian plate margin (Hall, 1987; Hinschberger et al., 2005).
The Molucca Sea Plate has been efficiently consumed by the bilateral and asymmetric subduction; younger (Pliocene, ~5 Ma) and shallower (<200 km) underneath the Halmahera arc, and older (Oligocene, ~30 Ma) and deeper (>600 km) underneath the Sangihe arc (Figure 1b; Hinschberger et al., 2005). The other major tectonic structures adjacent to Halmahera are the PSP subduction zone in the north and the Sorong Fault Zone (SFZ), a major left-lateral fault system, in the south (Figure 1b).
The two western arms of the K-shaped Halmahera island form a volcanic arc system developed as a narrow belt of Quaternary volcanic centers. The volcanic centers trend southwestward in the NW arm of Halmahera, before gradually curving and forming a N–S elongated string of volcanic islands located offshore (Figure 1a). The onshore volcano-chain segment overlies the graben-like median zone of an anticline and it is bordered to the east by a series of steep NNW–SSE trending faults, which have been identified using aerial photography (Verstappen, 1964). Further east in Kau Bay, located in between the NW and NE arms of Halmahera, Hall et al. (1988) identified a series of steep faults trending NE–SW and presumably active since the Pliocene with dip-slip and strike-slip motion.
The Molucca Sea region is active at deep, intermediate, and crustal depths (Cardwell et al., 1980; Supplementary Figures S1–S4). Halmahera is seismically active along the subducted slab with earthquakes as deep as 200 km (Supplementary Figures S1–S4). At intermediate to shallow depths (<50 km) the seismicity is concentrated mainly in the NW and NE branches of the island (Figure 1a and Supplementary Figures S1–S4). The focal mechanisms (FMs), with depth <50 km and for the time period 1976–2016, available in the Global Centroid Moment Tensor catalog (GCMT) (Ekström et al., 2012) predominantly show thrust faulting (light gray beach balls in Figure 1) offshore in the Molucca Sea and strike-slip (dark gray beach balls in Figure 1) onshore, suggesting a transcurrent tectonic regime for the NW and NE arms of Halmahera island (Figure 1a). The largest strike-slip event had Mw~7 and occurred in 1994 ~40 km ENE of Jailolo volcano (Figure 1a). The stress field inversion for the region from the World Stress Map project (Heidbach et al., 2016) classifies the tectonic regime as strike-slip and shows a coherent NNW–SSE orientation of the maximum compressive stress σ1 (SHmax and magenta symbols in Figures 1a,d) for the NW arm of Halmahera island. The orientations of the P-axes from the FMs as well as from the stress field inversion show a consistent NW–SE trend, which is almost parallel to the N289°E convergence direction of the PSP with respect to the Eurasian Plate (DeMets et al., 1994), while the orientations of the T-axes scatter more between the N–S and NE–SW directions (Figure 1d). The NE–SW trending strike-slip faults identified in the region by geological investigation (Hall et al., 1988) are compatible, within the uncertainties of the FM inversion, with one of the two focal planes of the GCMT solution (Figure 1a dark gray beach balls).
Halmahera Volcanism and Jailolo Volcano
Recent volcanism in the NW branch of Halmahera started 1–3 Ma ago, forming the present-day Quaternary volcanic arc (Figure 1a; Hall et al., 1988; Baker and Malaihollo, 1996). The volcanoes are located ~100 km above the slab and have a chemical composition characteristic of intraoceanic arc magmas with no contamination by continental crust. Lava compositions range from basalt to dacite with a marked predominance of basaltic andesite and andesite (Morris et al., 1983; Waltham et al., 2008). The chemical composition of the mafic parental magma of the erupted lavas, non-identical along the arc, allows a further sub-division of the Halmahera volcanoes into two groups, specifically north and south of Hiri island (Figure 1a; Morris, 1984).
The Jailolo (or Djailolo or Gilolo) volcanic complex sits at the southern end of the onshore part of the Halmahera volcanic arc (Figure 1a). There is limited information in the literature on the geology and petrology of Jailolo volcano as well as its past eruptive activity. The Global Volcanism Program classifies Jailolo volcano as active, meaning that it could have erupted in the Holocene (Venzke, 2013). No written record of eruptions has resulted in Jailolo not being categorized among the Indonesian potentially active volcanoes (see https://magma.vsi.esdm.go.id/); to date no studies have been carried out on the eruptive deposits to constrain the timing of past eruptions. However, it is widely accepted that the Indonesian catalog of volcanic eruptions is almost complete after 1800 CE (Bebbington, 2014), such that Jailolo has probably been quiescent for at least the last 200 years.
The name Jailolo refers to the dominant stratocone, which stands at ~1,200 m a.s.l.; a caldera ~2 km in diameter, called Idamdehe, lies to the west of the main cone and is probably a relic of a twin cone that eventually collapsed (Verstappen, 1964; Figure 2). South of Idamdehe, there are two other structures: a half-submerged crater, called Bobo, and a small cone named Pajo (Figure 2). Adjacent to Bobo stands another larger cone, referred to as Kailupa hill by Verstappen and previous authors, but also named Saria by the local population (Figure 2; Verstappen, 1964). Young (but not dated) lava flows are located on the east and south flanks of the Jailolo edifice and to the north of the Idamdehe caldera (Verstappen, 1964). Along the shore around Bobo crater and Kailupa hill, and all the way up to the NW flank of the Jailolo edifice, several hot springs are present and hot steaming ground is found on the NW rim of Idamdehe caldera. The volcano complex has no fumarolic activity.
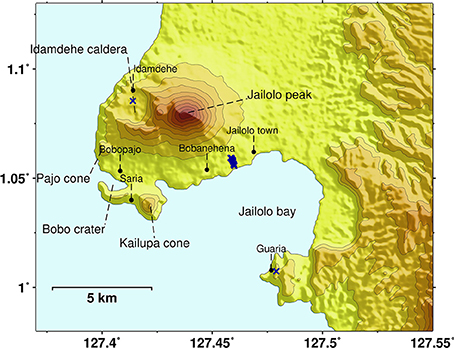
Figure 2. Map of Jailolo volcano with the main structures indicated. The black circles indicate the larger villages and Jailolo town Topography is the SRTM 90 m DEM (Jarvis et al., 2008) resampled at 30 m and contour lines are 100 m spaced. Blue crosses indicate the locations of the opening fractures in November 2015.
Verstappen (1964) suggested that Jailolo is the youngest feature of the volcanic complex, while Idamdehe, Bobo, and Pajo formed earlier. The author is uncertain about the relative age of Kailupa hill. Previous studies indicated that Jailolo Bay is an old and large caldera, of which the Jailolo complex is the youngest eruption point, but Verstappen excluded that possibility (see reference in Verstappen, 1964). The Jailolo lavas span the SiO2 range 50–59 wt%, ranging therefore from basaltic to andesitic lavas (Morris et al., 1983; Morris, 1984). The latter studies map Jailolo as one of the active volcanoes within the Halmahera volcanic arc but do not give any direct explanation for this.
The November 2015–February 2016 Seismic Sequence Around Jailolo Volcano
In November 2015, local authorities of the West Halmahera Regency in the capital Jailolo town alerted the Indonesian Climatological, Meteorological, and Geophysical Agency (BMKG) of intense seismicity occurring around Jailolo volcano. The seismic activity lasted until the end of December 2015 with renewed activity in February 2016. The repeated ground shaking caused concern in the population, and severe damage as well as collapse of houses and public buildings. The greatest damage occurred in the villages located on the southern flank of the volcano (Saria and Bobanehena) and Jailolo town, and minor damage also occurred in the Idamdehe caldera (Figure 2; Gunawan et al., 2017). During the seismic sequence, a hundred-meter-long crack opened up in the ground close to the village of Bobanehena on the southern flank of Jailolo volcano (Figure 2). Smaller cracks also appeared in the villages of Idamdehe and Guaria, the latter of which is located at the southwestern tip of Jailolo Bay (Figure 2). The cracks on the southern flank of the volcano (Figure 2) showed a N–S trend, normal slip dipping to the west, and a pronounced opening component (Basri Kamarrudin, BMKG Ternate, personal communication, 2016). Gunawan et al. (2017) reported that a new hot spring formed along the crack at the shoreline close to Bobanehena (Figure 2) and that a similar long crack opened close to Saria.
The largest events of the seismic sequence comprised two earthquakes with Mw 5.0 and Mw 4.8 on 20 and 21 November 2015, respectively, an additional Mw 5.1 earthquake on 1 December 2015, and a Mw 5.1 event 2 months later on 23 February 2016 (Ekström et al., 2012). All of these events were recorded by global seismic networks and their deviatoric moment tensor (MT) solutions are available in the GCMT and GEOFON catalogs (Figure 1a, red beach balls) (GEOFON Data Center, 1993; Ekström et al., 2012). The GCMT solutions show normal faulting with minor positive (opening) compensated linear vector dipole (CLVD) for the November–December events and a strike-slip mechanism with large positive CLVD for the February event (Figure 1a, light red beach balls); all events show a coherent E–W T-axis trend. The GEOFON MTs show normal mechanisms not only for the November–December events but also for the February Mw 5.1 earthquake (Figure 1a, pale red beach balls).
Some of the events of the seismic sequence are listed in global earthquake catalogs, such as the USGS ANSS and GEOFON catalogs (Figure 1e). In particular, the ANSS catalog reports, for the time frame between 8 November 2015 and 29 February 2016, 39 events with magnitude >3.9, scattered in the southern part of Jailolo Bay. For the same period, the GEOFON catalog includes 11 M > 4.5 events; their epicentral locations appear shifted to the east compared to the ANSS events. All of the events have shallow depths of < 20 km. The November 2015 activity stands out from the otherwise very low-rate seismicity in the area (20 events with Ml between 4 and 5 in ~40 years in the ANSS catalog, Figure 1e).
The ~10 km uncertainty on the epicentral locations and the poor depth accuracy of the global catalogs prevent any detailed analysis using globally determined hypocentral locations. We thus proceed first to enhance the catalog of seismicity. We use a standard location/relocation procedure relying on the Indonesian Seismic Network, and single-station locations relying on the TNTI station ~30 km away from the swarm focal area.
Seismological Investigation
Enhancing the Catalog
We used a template matching technique to scan the seismic records at TNTI from 2007 to April 2016. As master events we took the four largest earthquakes and cross-correlated all three components after filtering the signals in the frequency band 0.04–0.08 Hz. We retained all detections with correlation coefficient >0.70. The final template matching catalog has 734 events, of which 500 are from the years 2015–2016. It is difficult to estimate the completeness magnitude of the resulting catalog, but by visually inspecting the continuous waveform data at TNTI we found confirmation that no large local event (i.e., Ml > 4) during the swarm period was missed by this search procedure. Next, we manually picked and located the events using the stations of the Indonesian Seismic Network shown in Figure 1b. We processed the earthquakes whose signals were recorded at least at three stations with four phases clearly visible (i.e., three P- and one S-phase). This reduced the template matching catalog to 97 events, of which 69 belong to the 2015–2016 swarm activity. For only four events we relied on just three P- and two S-phase arrivals; the remaining 93 earthquakes were characterized by more than four P- and two S-phases. Our enhanced swarm catalog (i.e., 69 events) includes all the earthquakes listed in the official Indonesian seismic bulletin routinely produced by BMKG (http://inatews.bmkg.go.id/).
We used the LocSat location algorithm from the SeisComP3 software (http://www.seiscomp3.org/) and the IASP91 global velocity model (Kennett and Engdahl, 1991) because no local velocity model is available for the area. For some events we could not resolve the depth and we therefore fixed it to 1 km. Due to the sparse seismic station coverage these absolute locations are affected by large uncertainties, estimated to be ~5 km for both the horizontal and vertical coordinates. The magnitude of events is calculated as local magnitude using the vertical component only. We further refined the locations using teleseismic double-difference relocation (teleseismicDD) (Pesicek et al., 2010) and the 1D IASP91 velocity model with only 19 layers (Supplementary Figure S6). We stopped the relocation algorithm after three iterations in order to avoid overfitting the velocity model and introducing artifacts in the relocation. The earthquake location errors are in the order of hundreds of meters up to one kilometer.
Our enhanced catalog suggests that the 2015–2016 swarm started underneath Jailolo volcano and propagated southward for ~20 km during a few weeks (Figure 3). The activity was concentrated at depths shallower than 15 km (Figures 3b,c), consistent with the persistent shaking felt by the population during the swarm (Basri Kamarrudin, BMKG Ternate, personal communication, 2016). The poor resolution of the hypocentral depths, due to a lack of seismic stations close to the focal area, hinders a further investigation on the depth distribution of the seismicity.
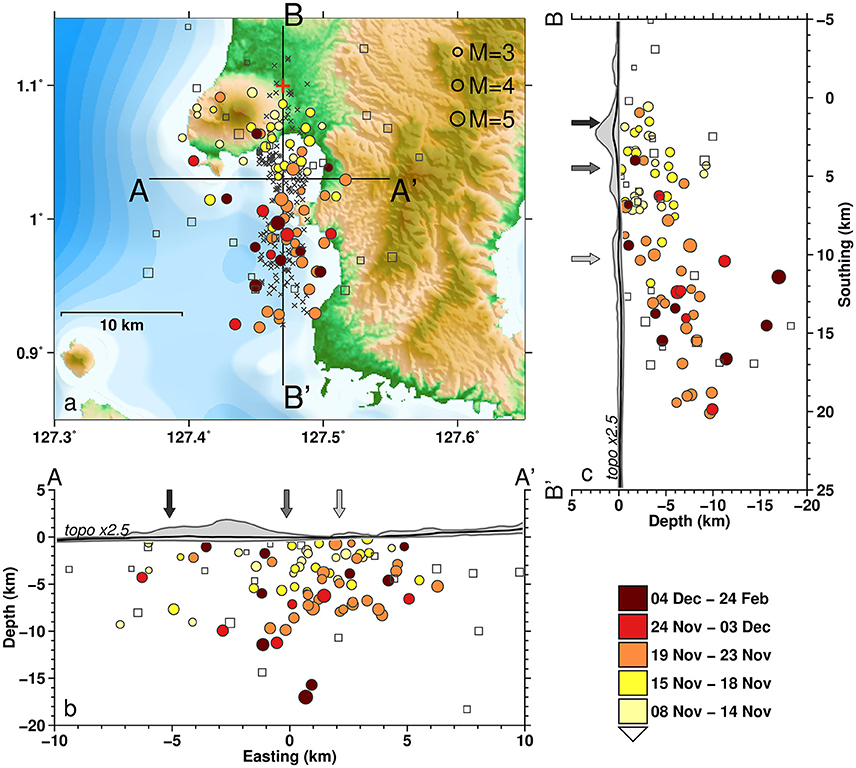
Figure 3. Map view and cross-sections of the relocated seismicity during the seismic swarm around Jailolo. (a) Map view of the region around Jailolo, with circles indicating the 69 earthquakes that occurred during the swarm activity and are relocated using the regional network. The color code refers only to the circles and has uneven time windows, which are labeled in the color palette, from November 2015 to February 2016. Empty squares are the events that occurred before 8 November 2015. AA' and BB' represent the two profiles used to project the seismicity at depth as represented in panels (b,c). Gray crosses indicate single-station locations, which are randomly scattered at 2 km for visibility. The red plus symbol on the BB' line is the origin of the Cartesian coordinate system used in panels (b,c) and in Figures 8, 9. (b) Depth projection of the seismicity along the east–west AA' profile. The gray shaded area represents the topography swath profile measured along AA' with a width of 10 km; the dark solid line is the average height and the upper and lower solid gray lines are the maximum and minimum height across the profile. Arrows indicate the positions of surface cracks as shown in Figure 2 and are color-coded according to their longitude in (a). Topographic profile is magnified as indicated. (c) Same as panel (b) but for the north–south BB' profile.
For the swarm period (i.e., November 2015–February 2016), we additionally relied on a single-station location procedure. We manually inspected the seismic waveforms of the events obtained via the template matching filter technique, identifying 294 events with clear P- and S-phases. Their signals at TNTI are characterized by differential S–P times of ~3–5 s. A single-station location requires the differential tS-tP time and the back-azimuth from the P-wave polarization analysis. Unfortunately, signals at TNTI are often noisy and we were not able to robustly estimate the back-azimuth for all events. Fortunately, most signals with a clearly determined back-azimuth come from the N–NE quadrant. In order to constrain the seismic wave velocity we used the 69 well-relocated events and their tS-tP times recorded at TNTI: we estimated the epicentral distances of these events from TNTI and plotted them against their tS-tP differential times at TNTI (Figure 4). The events, at least during the most active swarm period, show decreasing S–P differential times, which implies that the seismic activity gradually moved toward TNTI (Figure 4). This is consistent with a southward migration from Jailolo volcano. We calculated the apparent seismic velocity from the epicentral distance–tS-tP time data in Figure 4 as the slope of the best-fitting regression line with no intercept. The least-squares fit returns an apparent velocity of va = 6.8 km/s. Together with the tS-tP times, we used va to calculate the epicenters of the earthquakes (i.e., distances from TNTI) by inverting for the latitude only, with longitude fixed at 127.4703°E so the epicenters lie on a north–south straight line (Figure 3a).
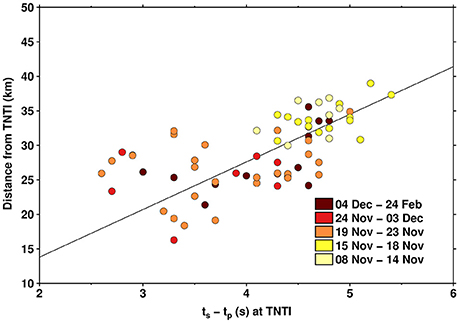
Figure 4. Manually picked tS-tP times plotted against the epicentral distance from TNTI station for the 69 events of the swarm well-relocated using the regional seismic network. Color code is the time from November 2015 – February 2016 as in Figure 3. The decrease of the tS-tP differential times during the most active swarm period (8–23 November) in the seismic signals recorded at TNTI station is compatible with southward migration of the seismicity. The scatter is likely due to the fact that we neglect the hypocentral depths to calculate the distances. The best-fitting regression line with slope va = 6.8 km/s is reported.
Moment Tensor Inversion
Next, we investigated the source geometry of the largest earthquakes by means of regional MT inversion. We followed the full waveform approach of Cesca et al. (2010, 2013) to determine regional MT both under a pure double-couple (DC) constraint and full MT. The MT inversion is performed by fitting full waveform displacements and their amplitude spectra for the vertical and horizontal components of broadband stations from the GEOFON (GE) and IRIS/USGS (IU) networks with epicentral distances up to 1000 km. The waveform and spectral fits are computed in the frequency range 0.02–0.04 Hz. We iteratively repeat the inversion of DC and full MT sources for centroid depths of 1–15 km, every 1 km, in order to verify the stability of the MT solution for different depths. Figure 5 illustrates the result of the MT inversion for the 20 November 2015 Mw 5.0 event at 14:50:39 UTC; similar results for all of the Ml > 5 events are summarized in the Supplementary Material (Supplementary Figure S7).
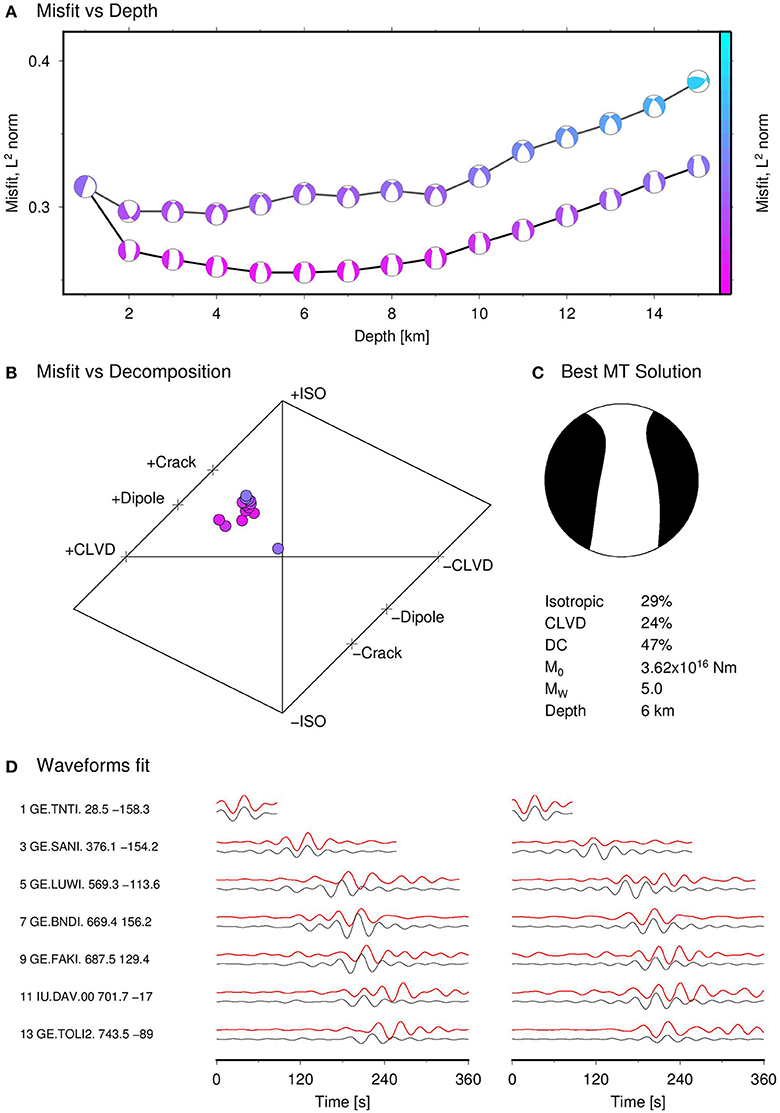
Figure 5. Moment tensor inversion results for the 20 November 2015, 14:50:39 UTC, Mw 5.0 event at Halmahera. (A) Full waveform amplitude spectra L2 norm misfit assuming a DC source (gray line and beach-ball) and full MT source (black line and beach-balls), for different depths, showing a clear minimum at 6 km, and a substantial improvement assuming a full MT mode. (B) Decomposition of full MT solutions for different depths (colored according to the misfit scale) show in most cases a positive tensile crack component. (C) Focal sphere of the best MT solution (deviatoric term) and list of MT parameters. (D) Comparison of full waveform displacements at regional broadband stations for vertical (left) and transverse (right) components. Station names, distance (km), and azimuth (deg) are listed on the left-hand side. Observed (red lines) and synthetic (black lines) are plotted normalized per station and component and aligned according to cross-correlation.
All of the best MT solutions are characterized by the combination of a DC, a positive CLVD component, and a positive isotropic term. The non-DC term is a stable result of the inversions with respect to hypocentral depth: the family of FM solutions obtained by varying the hypocentral depth cluster in a high non-DC component region in the Hudson diagram (Figure 5 and Supplementary Figure S7). The DC components of the best full MT solutions show N–S oblique normal faulting, and focal depths of 6–7 km for the November–December events and 9 km for the February event (Figure 5 and Supplementary Figure S7). A few FM solutions in the depth range considered show a larger strike-slip component with E–W oriented T-axis, similar to the GCMT solution of the 23 February 2016 Mw 5.2 earthquake (Figure 1).
The DC solutions are consistent with N–S trending normal faulting, in agreement with the published solutions (Figure 1b). We find that full MT solutions provide a significant improvement of the data fit with respect to DC solutions, both in the frequency and time domain. Based on the Bayesian Information Criterion (i.e., BIC; Kass and Raftery, 1995), which we applied following the procedure in Cesca et al. (2013), we found that the full MT model is to be preferred over the DC one for all four inversions (Supplementary Table S1 and Supplementary Figure S7).
The large inter-distances and non-optimal configuration of stations make FM inversion possible only for the largest events in the swarm sequence. However, by comparing filtered velocity waveforms, we find that the focal mechanisms of several small events during the swarm activity resemble those of the four previously inverted (Figure 6 and Supplementary Figure S8), and only for the noisy signals the correlation worsens. This suggests similarity of the seismic processes throughout the entire swarm sequence. By extending the same analysis to the data from 2007 to 2015, we found a few other events in 2009 showing similarity in the waveforms (Figure 6).
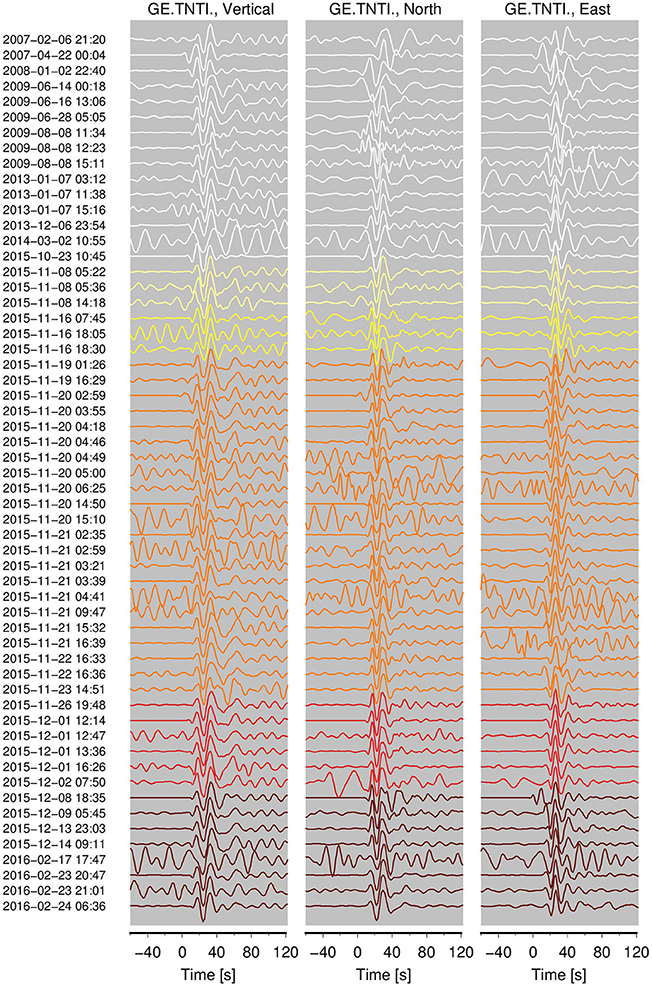
Figure 6. Waveform signals at TNTI station for relocated events between 2007 and 2016. The signals are band-pass filtered in the range 0.04–0.08 Hz. Color code as in Figure 3.
Characteristics of the Seismicity During the 2015–2016 Swarm
Once the seismicity catalog is enhanced, we proceed to analyze the details of the sequence. The daily earthquake occurrence during the Jailolo swarm shows four distinct peaks of activity in November and December 2015 (Figures 7, 8), suggesting that the swarm activity underwent different phases. The local seismicity prior to November 2015 does not show marked signs of clustering underneath or around the volcano, neither in global catalogs (Figure 1e) nor in our relocated M > 3 events after 2007 (empty squares in Figure 3). The earthquake activity started on 8 November 2015 with a 1-day-long isolated burst of low-magnitude events (Figures 7–9). Some of the shallow (<5 km) hypocenters (Figures 3a,b) are scattered around the volcanic edifice while others cluster in the middle of Jailolo Bay (Figure 3) with a possible southeastward elongation of 5 km over time (visible in the BB' axis in Figure 3 and the y-axis in Figure 8 used thereafter as a reference). After a hiatus of almost a week, the seismic activity ramped up again on 16 November, showing a clearer southward migration of 8 km in 1 day (Figures 3, 8) with magnitudes as large as Ml 3.5 (Figure 8). The migration stalled in the middle of Jailolo Bay (Figure 3 and at ~8 km in Figures 8, 9) before resuming on 19 November, with a ~10 km distance covered between 19 and 21 November (Figure 3 and at ~8 km in Figures 8, 9). The event magnitude increased as seen in the large steps in the cumulative plot of the Benioff strain release (Figure 7, see caption for definition). On 20 November at 14:50:39 UTC, the first large normal faulting event occurred with Ml 4.7 (Mw 5.0), followed 12 h later by a second normal faulting event with Ml 4.5 (Mw = 4.8). Both events were located off the southern end of Jailolo Bay, i.e., at ~7–9 km in Figures 8, 9. At this point the focal depth increased, maintaining between 5 and 10 km (Figures 3a,b). The migration halted on 22 November with activity persisting in the region illuminated by the 19–21 November migration, i.e., the segment between 8 and 20 km in Figures 8, 9. On 1 December at 12:14:21 UTC, a normal faulting earthquake of Ml 4.7 (Mw = 5.0) occurred at 12.5 km (Figures 8, 9) and 5 km depth followed by a flurry of small-magnitude events extending N–S for ~10 km. 1 week later a Ml 4.4 event occurred in the middle of the seismic cloud (Figure 8), together with widespread lower-magnitude events (Ml < 3.5). Subsequently, the seismicity rate and magnitude gradually decreased with no Ml > 3 events from the middle of December until the middle of February. Finally, a small cluster of low-magnitude events marked a renewal of the activity, which culminated on 23 February 2016 at 20:47:35 UTC with a Ml 5.0 event (Mw = 5.2) ~12 km south of Jailolo at ~14 km depth (Figures 3, 8).
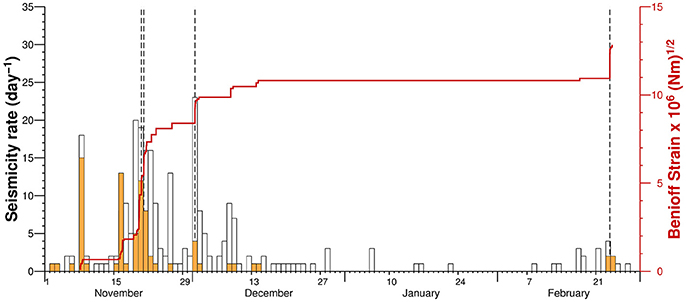
Figure 7. Daily rate and Benioff strain of the earthquakes during the swarm activity in November 2015–February 2016. Orange bars are the daily rate of events relocated using the regional seismic network, and white bars are the same but through single-station location (see Figure 3); vertical dashed lines mark the largest events that occurred during the swarm. Red solid line is the cumulative Benioff strain [∑B(t)] defined as the square root of the radiated seismic energy Es expressed in Nmand calculated as log10(Es) = 1.5M + 4.8 (Grandin et al., 2011).
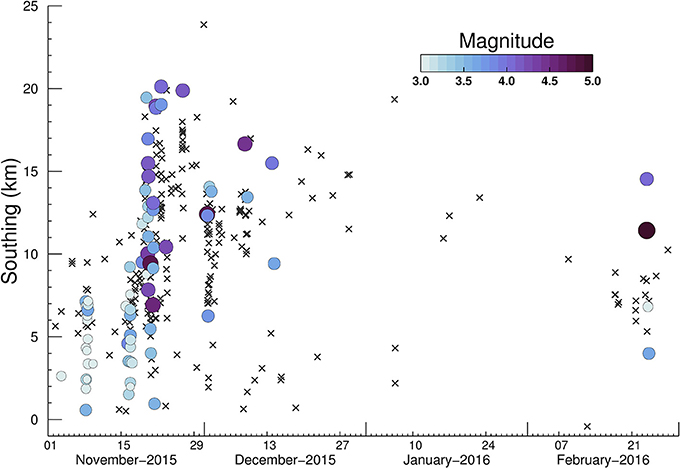
Figure 8. Time–distance plot for the events relocated using the regional network (colored circles) and single-station location (crosses). The distance is measured along the BB' axis shown in Figure 3, and the color code and circle size scale with local magnitude calculated on the vertical displacement (Mlv).
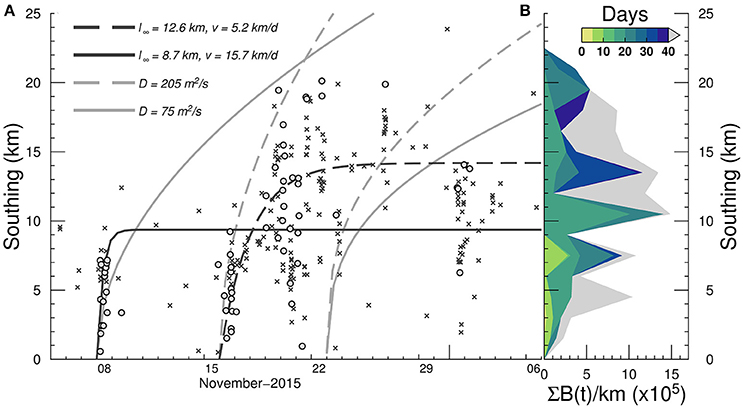
Figure 9. (A) Same as in Figure 8 but restricted to the time between 5 November and 7 December 2015 to highlight the earthquake migration and the fit of the models. Shaded circles and cross symbols are the same as in Figures 3, 8. Black solid line is the fit of the dike model from 8 November to 22 November, black dashed line is the dike model fit from 16 November to 22 November. Solid and dashed gray lines are the fit of the pore-pressure diffusion model, i.e., front and back-front, performed on the same time span as the two dike models. The 95% confidence levels for the parameter fits are given in Supplementary Table S2. (B) Distribution of cumulative Benioff strain ∑B(t) per unit distance calculated in 1.5 km bins and cumulated every 3-day window starting from 8 November 2015 and color-coded accordingly.
Origin of the Seismic Swarm: “Magmatic” or “Not Magmatic” – That is the Question
Models for the Mechanisms Underlying the Jailolo Swarm
We now seek a physical model to comprehensively explain the observations associated with the 2015–2016 Jailolo seismic swarm: i) the southward migration of the seismicity for ~20 km; ii) the relatively high migration speed of ~10 km per day; iii) the occurrence of predominantly normal faulting mechanisms with a large tensile component in the otherwise strike-slip regional tectonic regime of NW Halmahera; and iv) the opening fractures observed in the field during the seismic episode.
As already discussed, focal mechanisms of seismicity before the 2015–2016 swarm and geological investigations suggest a regional strike-slip tectonic regime in NW Halmahera with a NNW–SSE principal compressive axis σ1 and a WSW–ENE least compressive axis σ3 (section Geology and Seismo-Tectonic Setting of Halmahera Island and the Jailolo Region and Figure 1). However, the geological investigation of Verstappen (1964) indicated that the volcanic chain sits on a low-land graben-like structure. Intra-arc extension is a feature present in other subduction zones (Phipps Morgan et al., 2008).
The transient evolution and source parameters of the earthquakes and the migration of activity away from the volcano may naturally suggest that the swarm was induced by the lateral propagation of a dike sourced from underneath Jailolo (hypothesis that we call “magmatic”). However, high pore-pressure diffusion due to a localized fluid pressurization event can also cause hypocenter migration (hypothesis that we call “tectonic”), with totally different implications for the hazard in the area. In both hypotheses, one part of earthquake production could also be ascribed to earthquake-earthquake triggering mechanism via static stress transfer. Temporal decay characteristic of aftershocks can be seen in the seismicity rate after the occurrence of the largest magnitude events (Figure 7). Unfortunately, the resolution of our seismicity catalog does not allow us to further quantify the role of static stress transfer during the sequence. However, we would like to remark that static stress changes alone cannot explain the hypocenter migration at earlier stage of the Jailolo swarm.
Information on any crustal deformation would be helpful but the lush vegetation and the mainly offshore nature of the episode make such an analysis difficult. In this study we evaluate the likeliest scenario based on the observations available to us. We first review what would be expected in terms of source properties and migration pattern for the two general scenarios (i.e., magmatic vs tectonic) mentioned above and then discuss the likelihood of each.
Tectonic Hypothesis
In both volcanic and tectonic areas, a deep pressurization event can produce a propagating high pore-pressure front that can trigger seismicity in the form of swarms (Jolly and McNutt, 1999; Saccorotti et al., 2002). As pore pressure diffuses, the earthquake migration proceeds with the square root of time, with typical velocities of meters per day (Talwani and Acree, 1984; Chen et al., 2012). Higher speeds of up to 1 km per day have been also documented in aftershock migration studies (e.g., Antonioli et al., 2005) but are deemed unphysical because they require very high values of permeability (>>10−13 m2), which would promote advective fluid flow leading to a pressure drop instead of increase and diffusion of pore pressure (Talwani et al., 2007). The hypocenter migration pattern can show a back-front marking inhibition of the seismicity (Hummel and Shapiro, 2016). Usually the source mechanics of earthquakes triggered by a pore-pressure increase are well-described by DC mechanisms compatible with the regional tectonic stress regime (Simpson et al., 1988; Valoroso et al., 2009; Stabile et al., 2014). Non-DC components are generally very small or negligible (Vavryčuk and Hrubcová, 2017).
The first-order approximation of a 1D pore-pressure p diffusion problem can be written as , where t, z, and D are time, distance, and hydraulic diffusivity, respectively. The solution of this equation gives the evolution of the pore pressure in time and space with the migration speed depending mostly on the hydraulic diffusivity (Talwani and Acree, 1984). We assume that the injection/pressurization started at t0, and upon observation of earthquakes at a distance r from the injection point after the time t = t−t0 it is possible to estimate the hydraulic diffusivity D = r2/t of the system by fitting the envelope of the migrating front of the seismicity (Talwani and Acree, 1984; Saccorotti et al., 2002; Valoroso et al., 2011). For the Jailolo swarm, as we discuss in the next section for the dike model, we consider two possible onsets of diffusion, i.e., 8 November and 16 November. The fitting procedure yields two values of the hydraulic diffusivity, i.e., D = 75 m2/s and D = 205 m2/s. We show in Figure 9 the two diffusion curves for the front and the back-front, the latter calculated using the formula given by Parotidis et al. (2004), assuming that the fluid injection/pore-pressure pulse ends on the 22 November. The best-fitting parameters and the 95% confidence bounds are provided in Supplementary Table S2.
Magmatic Hypothesis
Propagating fluid-filled cracks fracture the host rocks and at the same time trigger earthquakes on favorably oriented faults via static stress transfer (Hill, 1977; Roman and Cashman, 2006; Passarelli et al., 2015b). Magmatic dikes tend to open against the least compressive stress σ3 and propagate parallel to the maximum compressive stress σ1 (Anderson, 1938). Therefore, a N–S oriented intrusion at Jailolo would be compatible with the regional stress field (Figure 1) within the uncertainties in the inverted stress direction, FM inversion and orientation of the dike. Magmatic intrusions sometimes induce a large stress field that overprints the local tectonic stress. As a consequence, the swarm focal mechanisms may not match those usually observed in the area (Roman, 2005; Passarelli et al., 2015b). During dike intrusions, normal faulting with strike parallel to the dike strike as well as pure strike-slip off the dike tip are expected (Hill, 1977). Passarelli et al. (2015b) showed that 3D dike geometry can explain oblique normal faulting sometimes observed in the region crowning a dike from the top to the side. The orientations of the pressure (P-) or tension (T-) axes derived from focal mechanism inversion support a model resulting often sub-perpendicular to the intrusion plane (Ukawa and Tsukahara, 1996; Roman and Cashman, 2006; Gardine et al., 2011). Dike-induced earthquakes generally show non-negligible non-DC components (Julian, 1983; Dahm and Brandsdóttir, 1997; Minson et al., 2007; Ruppert et al., 2011; Belachew et al., 2013).
A simple model in which an over-pressurized magma chamber feeds a laterally propagating dike with no additional magma input from below predicts that the dike volume growth rate will decrease over time due to pressure loss at the magma chamber. The dike volume increases following asymptotic exponential growth (Rivalta, 2010). The earthquakes induced around the dike tip migrate with a similar asymptotic exponential growth of the distance to the magma chamber at speeds of the order of a few kilometers to tens of kilometers per day (Ukawa and Tsukahara, 1996; Keir et al., 2009; Gardine et al., 2011; Grandin et al., 2011; Ruppert et al., 2011; Maccaferri et al., 2016). On a distance–time graph the migrating seismicity often comprises two curves marking the migrating front and the line where the seismicity switches off, sometimes called the back-front (Brandsdóttir and Einarsson, 1979; Belachew et al., 2011; Grandin et al., 2011). The lack of seismicity behind the back-front is the effect of a negative Coulomb stress (stress shadow) on optimally oriented planes exerted by the closing of the propagating crack tail (Dahm et al., 2010; Segall et al., 2013). Some dike intrusions, e.g., from the 2005–2010 Manda–Hararo diking sequence as well as the 2014 dike at Bárdarbunga, experienced multiple migration and stall phases (Grandin et al., 2011; Ruch et al., 2016).
As discussed above, the lengthening of a laterally propagating dike can be approximated with an exponential law of the form , where l(t) is the dike length measured from the location of the onset of seismicity at time t0, l∞ is the final asymptotic dike length, and τ is a scale time of the propagation (Rivalta, 2010; Grandin et al., 2011). From the equation above, it is possible to calculate a characteristic velocity v1/2 = l∞/(2τln2) defined as the time for the dike to reach its half-length (Grandin et al., 2011).
We fit the parameters l(t) and τ of the exponential model to the linear distribution of earthquake epicenters for two possible dike emplacement onsets: 1) on 8 November, coinciding with the first migrating burst of activity; and 2) on 16 November, coinciding with the second burst of activity. For both cases, we consider the end of the propagation on 22 November, which coincides with the seismic cloud reaching its maximum length. We use both the relocated events and the single-station locations for the model fit. A least-squares fit returns physically plausible parameters for the two periods: 1) l∞ = 8.7 km and v1/2 = 15.7 km; and 2) l∞ = 12.6 km and v1/2 = 5.2 km. In the fit we use the southing Cartesian coordinates of the earthquake epicenters, as in Figure 9, but the results do not change substantially considering the Euclidean 3D distance instead. We report the results of the best-fit parameters in Supplementary Table S2 together with their 95% confidence bounds.
Discussion of the Most Physically Sound Source of the Seismic Swarm
The source mechanisms of the earthquakes, predominantly oblique normal faulting with some possible larger strike-slip component, are all compatible with the faulting style induced by a N–S lateral dike migration (Hill, 1977; Passarelli et al., 2015b): E–W oriented T-axes and vertical P-axes are difficult to explain as they are flipped ~90° with respect to the horizontal regional σ1 (Figures 1, 5). A similar over-printing of the regional tectonic field was documented for the Miyakejima dike in 2000 (Passarelli et al., 2015b). Large opening non-DC mechanisms have often been documented in seismicity triggered by a dike intrusion (Minson et al., 2007; Belachew et al., 2013). In addition, our MT solutions show that the positive CLVD is a robust feature of the inversion; we recall that the CLVD model is the force-equivalent representation of an opening crack filled by a fixed volume of fluid (Julian, 1983).
The cracks observed at the surface on the west and south flanks of Jailolo volcano, with both opening and normal component, are compatible with graben faulting induced by dikes (Rubin and Pollard, 1988). The velocity estimated above, in the range 5–20 km/d, is similar to dike velocities inferred for other lateral dike intrusions (Grandin et al., 2011; Maccaferri et al., 2013; Rivalta et al., 2015). Thus, a lateral dike intrusion is consistent with all available observations.
Concerning pore-pressure diffusion, high values of hydraulic diffusivity are required, i.e., D = 75–205 m2/s when using the estimation by Talwani and Acree (1984) or reduced by a factor π if using the formula by Shapiro et al. (1997). These values are at least one order of magnitude larger than the range D = 0.01–10 m2/s obtained in studies of seismicity induced by pore-pressure diffusion (Scholz, 2002).
The fracture permeability k is proportional to the hydraulic diffusivity according to the formula k = Dη(Φβf + (1 − Φ)βr), where η is the fluid viscosity, βf, r are the fluid and rock compressibility, and Φ is the porosity (Talwani et al., 2007). Assuming standard values η = 10−4 Pa s, βf = 10−10 Pa−1, βr = 10−10 Pa−1, and Φ = 10−3 we obtain a value of permeability k = 10−13 m2, which is one order of magnitude higher than the maximum permeability values of k = 10−17-10−14 m2 found for fractures in the seismogenic crust using a large database of pore-pressure diffusion examples (Townend and Zoback, 2000; Talwani et al., 2007). For values of permeability higher than this range, i.e., D>>10 m2/s, Talwani et al. (2007) suggested that fluids will be able to flow along fractures such that the advective fluid velocity will be high and the large fluid-flow gradient will reduce the rate of increase in pore pressure, resulting in a lack of seismicity. In addition, the Darcy approximation behind the solution to the 1D pore-pressure diffusion problem no longer holds. Finally, the high value of hydraulic diffusivity we infer for the Jailolo swarm is very similar to the value of diffusivity required to explain the fast migration of isolated earthquake clusters belonging to the Miyakejima dike in 2000, where pore-pressure diffusion has been ruled out (Cattania et al., 2017).
Pore-pressure diffusion requires earthquakes to occur within an already established network of faults, here normal faults and qualify the swarm as of tectonic origin. However, large normal faulting events are absent in the catalogs of focal mechanisms of past seismicity in the area (Cardwell et al., 1980; Ekström et al., 2012), although with our waveform similarity study we could find some small-magnitude events (i.e., Ml < 4) before 2015 that are compatible with a normal faulting style. Finally, earthquakes triggered by a high pore-pressure front are expected to have a minor or negligible non-DC component in their MT solutions (Vavryčuk and Hrubcová, 2017). Therefore, within the pore-pressure diffusion model it is difficult to explain the occurrence of the large (>40%) non-DC component we observe in all our MT solutions.
We conclude that a laterally propagating dike sourced from Jailolo volcano can best explain the observations associated with the 2015–2016 Jailolo swarm. The dike propagation/growth may have occurred in multiple steps, since the migration of earthquakes started and stalled on the 8, 16, and 19 November, although the seismicity data are not high enough resolution to unambiguously assess these fine-scale dynamics. The progressive increase in the average earthquake magnitude (Figure 8) and the late occurrence of the three Mw~5.0 earthquakes indicate a delayed increase of the intruded volume (Grandin et al., 2011). Concerning the isolated activity recorded at the end of February 2016, which included the largest event of the swarm, it is more difficult to constrain whether it was due to continued magma supply, or rheological weakening of the host rocks (Rivalta and Dahm, 2004), or whether it was still a response to the stress change induced by the November–December dike intrusion (Passarelli et al., 2013).
Estimate of Dike Length and Volume
Notwithstanding the large uncertainties in the earthquake locations, the final distribution of the earthquake epicenters constrains relatively well the dike final length to ~10–15 km (Figure 9). A similar result derives from the best-fit estimate of l∞ of the two dike models discussed above. The length and quasi-triangular shape of the cumulative Benioff strain per unit length shown in Figure 9B also supports this dike-length estimation. The energy released by dike-induced earthquakes at its inflating edges has been empirically and theoretically linked to an approximately triangular shape of the cumulative Benioff strain (Grandin et al., 2011; Passarelli et al., 2015b).
We finally provide a rough estimation of the volume of the intrusion by using two independent approaches: (1) We know that dikes release most moment aseismically and that the dike seismic efficiency ε, i.e., the ratio between the seismic and geodetic moment of a dike, varied for previous dikes between ~10−3 and ~0.4 (Pedersen et al., 2007; Grandin et al., 2011). The dike seismic efficiency is defined as , where MS is the total seismic moment released by earthquakes. We take MG = EV for the geodetic moment of the dike, where E is the Young's modulus and ΔV is the dike volume (Grandin et al., 2011). (2) We may use the formula proposed by White and McCausland (2016) linking the volume of an intrusion with the cumulative seismic moment released by the seismicity according to log(V) = 0.71log(MS)−5.32, where the volume is taken in m3 and the moment in Nm.
The cumulative seismic moment for the Jailolo dike is dominated by the Mw >5 events. From our MT inversions we estimate MS = 1.6 × 10¹⁷ Nm. Method (1) returns ΔV = 1.3 × 10⁷-5.3 × 10⁹ m3 assuming E = 30 GPa (Grandin et al., 2011), while method (2) returns ΔV = 8 × 10⁶ m3. Although a dike volume as large as 5 km3 seems unrealistic, a volume around tens of millions of cubic meters is plausible.
How Long Could Volcanic Unrest at Jailolo Volcano Last?
We try now to estimate the probability of a long unrest at Jailolo volcano by assuming that the volcanic unrest cannot potentially be exhausted once the seismic unrest is over. Previous statistical studies on the time scales of long- and short-term eruptive behavior can help us to infer the probability that the duration of unrest at Jailolo volcano is longer than a certain time interval, e.g., more than 2 years, that is roughly the time elapsed since the onset of the 2015–2016 swarm. These studies are based on the assumption that magma mobility, and thus the time from the last eruption and the duration of unrest, scale with magma composition (White et al., 2006; Passarelli and Brodsky, 2012).
White et al. (2006) (WCS) and Passarelli and Brodsky (2012) (PB) independently obtained a power-law scaling of the silica content (SiO2 wt%, as a proxy for magma composition) and the repose time, i.e., the time between two consecutive eruptions, using two independent datasets of volcanic eruptions. For the SiO2 range of the Jailolo lavas, ~50–59 wt%, the estimation of the average repose time using the WCS model is 65 and 1,650 years, respectively. The PB model instead produces shorter repose times of [0.04–36] years for SiO2 = 50 wt%, and [0.7–625] years for SiO2 = 59 wt%, both at a 95% confidence level. We know that the Indonesian catalog of volcanic eruptions is considered almost complete after 1800 AD (Bebbington, 2014), so ~200 years should represent the lower limit of the Jailolo repose time.
Passarelli and Brodsky (2012) also found a positive correlation between the repose time and the unrest length, defined as the magma run-up time. We can use the linear regression model between unrest duration and repose time and calculate the probability of an unrest duration > = 2 years (i.e., the time from the November–December swarm, seen as the start of the magmatic unrest, to the time of writing) given a repose time length. For a repose time of 1,500 years the probability of witnessing a volcanic unrest duration of ≥2 years is 0.1. This probability decreases to 10−5 for a repose time shorter than 500 years and increases to 0.35 for a 2,000 year-long repose time. In summary, there is a non-negligible probability that the unrest at Jailolo volcano is still ongoing at the time of writing. On 27 September 2017, a new seismic swarm occurred at Jailolo volcano and lasted for several days (see for example 1 day of recordings at TNTI, http://geofon.gfz-potsdam.de/waveform/liveseis.php?station=TNTI&date=2017-09-27), again raising concern among the local population and authorities of risk associated with the seismic activity and a re-awakening of the volcano.
However, these probabilities have to be taken with a grain of salt since the empirical models used for the inference have large aleatoric and epistemic uncertainties and are calibrated on datasets of volcanic unrest biased toward instances where the unrest ended in an eruption with juvenile magma involved. Therefore, it is also possible that the magmatic unrest at Jailolo may be isolated and no eruption will occur in the following years (Newhall et al., 2017).
Conclusions
Our analysis suggests that the 2015–2016 seismic swarm at Jailolo volcano likely had a magmatic origin. We propose a laterally propagating dike as the most likely source of the swarm, based on consistency with the following observations:
1. Duration, extent, and speed of the hypocenter migration;
2. Source mechanisms of the earthquakes;
3. Non-DC tensile component of the MTs inferred for the largest events of the swarm;
4. Appearance and orientation of opening cracks at the surface;
5. Finally, such a hypothesis reconciles the occurrence of four large normal faulting events within the regional strike-slip tectonic regime of West Halmahera.
The most likely alternative model, i.e., a migrating tectonic earthquake swarm triggered by high pore-pressure diffusion, fails to explain the speed and extent of the seismicity, since it would require unrealistically high hydraulic diffusivity and permeability, as well as the MT solutions derived for the largest events, in particular the presence of a non-negligible tensile component.
At present there seems to be no indication that the volcano might erupt after renewed and intense seismic activity occurred in September 2017. However, the new seismic swarm calls for continued investigation of Jailolo volcano. Ideal complements to this study would be the analysis of remote sensing crustal deformation data, i.e., InSAR imagery, for the pre-, co-, and post-swarm periods, which could demonstrate or reject unequivocally the magmatic nature of the unrest, as well as field studies around Jailolo to help constrain the age and style of previous eruptive activity. This integrated information will provide the fundamental ingredients to inform probabilistic models for volcanic hazard assessment at the Jailolo volcanic complex.
Data Availability
The relocated seismic catalogs of the present study are available upon request to the authors. The waveform data of the Indonesian Seismic Network are available upon formal request to BMKG Badan Meteorologi Klimatologi dan Geofisika, Jakarta.
Author Contributions
LP wrote the paper and performed the statistical modeling of the data. ER and SC contributed to writing and revising the paper. NH and SC performed the seismological analysis and LP performed the statistical analysis. LP, SC, CM, ER, and TD conceived the study and participated in the seismological and volcanological interpretation of the results. All authors contributed to the discussion.
Funding
This work has been funded by the German Federal Foreign Office through the German Humanitarian Assistance program, grant S05-41-321.50 IDN 03/16.
Conflict of Interest Statement
The authors declare that the research was conducted in the absence of any commercial or financial relationships that could be construed as a potential conflict of interest.
Acknowledgments
The authors thank the GEOFON data center at GFZ for the continuous technical support to access the waveform data. The comments of three reviewers and of the chief editor Valerio Acocella helped to improve the manuscript.
Supplementary Material
The Supplementary Material for this article can be found online at: https://www.frontiersin.org/articles/10.3389/feart.2018.00079/full#supplementary-material
References
Alpala, J., Alpala, R., and Battaglia, M. (2017). Monitoring remote volcanoes: the 2010–2012 unrest at Sotará volcano (Colombia). J. Volcanol. Geotherm. Res. 344, 224–231. doi: 10.1016/j.jvolgeores.2017.05.021
Anderson, E. M. (1938). The dynamics of sheet intrusion. Proc. R. Soc. Edinburgh 58, 242–251. doi: 10.1017/S0370164600011159
ANSS catalog (2016). USGS-ANSS Comprehensive Earthquake Catalog (ComCat). Available online at: https://earthquake.usgs.gov/earthquakes/search/ (Accessed June 1, 2016).
Antonioli, A., Piccinini, D., Chiaraluce, L., and Cocco, M. (2005). Fluid flow and seismicity pattern: evidence from the 1997 Umbria-Marche (central Italy) seismic sequence. Geophys. Res. Lett. 32, 1–4. doi: 10.1029/2004GL022256
Baker, S., and Malaihollo, J. (1996). Dating of Neogene igneous rocks in the Halmahera region: arc initiation and development. Geol. Soc. Lond. Spec. Publ. 106, 499–509. doi: 10.1144/GSL.SP.1996.106.01.31
Barberi, F., Corrado, G., Innocenti, F., and Luongo, G. (1984). Phlegraean fields 1982-1984: brief chronicle of a volcano emergency in a densely populated area. Bull. Volcanol. 47, 175–185. doi: 10.1007/BF01961547
Bebbington, M. S. (2014). Long-term forecasting of volcanic explosivity. Geophys. J. Int. 197, 1500–1515. doi: 10.1093/gji/ggu078
Belachew, M., Ebinger, C., and Coté, D. (2013). Source mechanisms of dike-induced earthquakes in the Dabbahu-Manda Hararo rift segment in Afar, Ethiopia: implications for faulting above dikes. Geophys. J. Int. 192, 907–917. doi: 10.1093/gji/ggs076
Belachew, M., Ebinger, C., Coté, D., Keir, D., Rowland, J. V., Hammond, J. O. S., et al. (2011). Comparison of dike intrusions in an incipient seafloor-spreading segment in Afar, Ethiopia: seismicity perspectives. J. Geophys. Res. 116:B06405. doi: 10.1029/2010JB007908
Benoit, J. P., and McNutt, S. R. (1996). Global volcanic earthquake swarm database and preliminary analysis of volcanic earthquake swarm duration. Ann. Di Geofis. 39, 221–229.
Brandsdóttir, B., and Einarsson, P. (1979). Seismic activity associated with the September 1977 deflation of the Krafla central volcano in northeastern Iceland. J. Volcanol. Geotherm. Res. 6, 197–212. doi: 10.1016/0377-0273(79)90001-5
Cardwell, R. K., Isacks, B. L., and Karig, D. E. (1980). “The spatial distribution of earthquakes, focal mechanism solutions, and subducted lithosphere in the Philippine and northeastern Indonesian Islands,” in The Tectonic and Geologic Evolution of Southeast Asian Seas and Islands, ed E. D. Hayes (Washington, DC: American Geophysical Union Monographs), 1–35.
Cattania, C., Rivalta, E., Hainzl, S., Passarelli, L., and Aoki, Y. (2017). A nonplanar slow rupture episode during the 2000 Miyakejima dike intrusion. J. Geophys. Res. Solid Earth 122, 2054–2068. doi: 10.1002/2016JB013722
Cesca, S., Heimann, S., Stammler, K., and Dahm, T. (2010). Automated procedure for point and kinematic source inversion at regional distances. J. Geophys. Res. Solid Earth 115:B06304. doi: 10.1029/2009JB006450
Cesca, S., Rohr, A., and Dahm, T. (2013). Discrimination of induced seismicity by full moment tensor inversion and decomposition. J. Seismol. 17, 147–163, doi: 10.1007/s10950-012-9305-8
Chen, X., Shearer, P. M., and Abercrombie, R. E. (2012). Spatial migration of earthquakes within seismic clusters in Southern California: evidence for fluid diffusion. J. Geophys. Res. Solid Earth 117:B04301. doi: 10.1029/2011JB008973
Dahm, T., and Brandsdóttir, B. (1997). Moment tensors of microearthquakes from the Eyjafjallajokull volcano in South Iceland. Geophys. J. Int. 130, 183–192. doi: 10.1111/j.1365-246X.1997.tb00997.x
Dahm, T., Hainzl, S., and Fischer, T. (2010). Bidirectional and unidirectional fracture growth during hydrofracturing: role of driving stress gradients. J. Geophys. Res. 115:B12322. doi: 10.1029/2009JB006817
DeMets, C., Gordon, R. G., Argus, D. F., and Stein, S. (1994). Effect of recent revisions to the geomagnetic reversal time scale on estimates of current plate motions. Geophys. Res. Lett. 21, 2191–2194. doi: 10.1029/94GL02118
Ekström, G., Nettles, M., and Dziewonski, A. M. (2012). The global CMT project 2004-2010: Centroid-moment tensors for 13,017 earthquakes. Phys. Earth Planet. Inter. 200–201, 1–9. doi: 10.1016/j.pepi.2012.04.002
Fukuda, J. (2018). Variability of the space-time evolution of slow slip events off the Boso Peninsula, Central Japan, from 1996 to 2014. J. Geophys. Res. Solid Earth 123, 732–760. doi: 10.1002/2017JB014709
Gardine, M., West, M. E., and Cox, T. (2011). Dike emplacement near Parícutin volcano, Mexico in 2006. Bull. Volcanol. 73, 123–132. doi: 10.1007/s00445-010-0437-9
GEOFON Data Center (1993). GEOFON Seismic Network, Deutsches GeoForschungsZentrum GFZ. Other/Seismic Network.
Grandin, R., Jacques, E., Nercessian, A., Ayele, A., Doubre, C., Socquet, A., et al. (2011). Seismicity during lateral dike propagation: Insights from new data in the recent Manda Hararo–Dabbahu rifting episode (Afar, Ethiopia). Geochem. Geophy. Geosy. 12:Q0AB08. doi: 10.1029/2010GC003434
Gudmundsson, M. T., Jónsdóttir, K., Hooper, A., Holohan, E. P., Halldórsson, S. A., Ófeigsson, B. G., et al. (2016). Gradual caldera collapse at Bárdarbunga volcano, Iceland, regulated by lateral magma outflow. Science 353:aaf8988. doi: 10.1126/science.aaf8988
Gunawan, E., Ghozalba, F., Syauqi Widiastomo, Y., Meilano, I., Hanifa, N. R., et al. (2017). Field investigation of the November to December 2015 earthquake swarm in West Halmahera, Indonesia. Geotech. Geol. Eng. 35, 425–432. doi: 10.1007/s10706-016-0117-4
Hainzl, S. (2004). Seismicity patterns of earthquake swarms due to fluid intrusion and stress triggering. Geophys. J. Int. 159, 1090–1096. doi: 10.1111/j.1365-246X.2004.02463.x
Hainzl, S., Fischer, T., and Dahm, T. (2012). Seismicity-based estimation of the driving fluid pressure in the case of swarm activity in Western Bohemia. Geophys. J. Int. 191, 271–281. doi: 10.1111/j.1365-246X.2012.05610.x
Hall, R. (1987). Plate boundary evolution in the Halmahera region, Indonesia. Tectonophysics 144, 337–352. doi: 10.1016/0040-1951(87)90301-5
Hall, R., Audley-Charles, M. G., Banner, F. T., Hidayat, S., and Tobing, S. L. (1988). Late Palaeogene-Quaternary geology of Halmahera, Eastern Indonesia: initiation of a volcanic island arc. J. Geol. Soc. Lond. 145, 577–590. doi: 10.1144/gsjgs.145.4.0577
Heidbach, O., Rajabi, M., Reiter, K., Ziegler, M., and Team, W. S. M. (2016). World Stress Map Database Release 2016. GFZ Data Services.
Hill, D. P. (1977). A model for earthquake swarms. J. Geophys. Res. 82, 1347–1352. doi: 10.1029/JB082i008p01347
Hinschberger, F., Malod, J.-A., Réhault, J.-P., Villeneuve, M., Royer, J.-Y., and Burhanuddin, S. (2005). Late Cenozoic geodynamic evolution of eastern Indonesia. Tectonophysics 404, 91–118. doi: 10.1016/j.tecto.2005.05.005
Hummel, N., and Shapiro, S. A. (2016). Back front of seismicity induced by non-linear pore pressure diffusion. Geophys. Prospect. 64, 170–191. doi: 10.1111/1365-2478.12247
Jarvis, A., Reuter, H. I., Nelson, A., and Guevara, E. (2008). Hole-Filled SRTM for the Globe Version 4, the CGIAR-CSI SRTM 90m Database. Available online at: http://srtm.csi.cgiar.org (Accessed June 1, 2016).
Jay, J. A., Pritchard, M. E., West, M. E., Christensen, D., Haney, M., Minaya, E., et al. (2012). Shallow seismicity, triggered seismicity, and ambient noise tomography at the long-dormant Uturuncu Volcano, Bolivia. Bull. Volcanol. 74, 817–837. doi: 10.1007/s00445-011-0568-7
Jolly, A. D., and McNutt, S. R. (1999). Seismicity at the volcanoes of Katmai National Park, Alaska; July 1995-December 1997. J. Volcanol. Geotherm. Res. 93, 173–190. doi: 10.1016/S0377-0273(99)00115-8
Julian, B. R. (1983). Evidence for dyke intrusion earthquake mechanisms near Long Valley caldera, California. Nature 303, 323–325. doi: 10.1038/303323a0
Kass, R. E., and Raftery, A. E. (1995). Bayes factors. J. Am. Stat. Assoc. 90, 773–795. doi: 10.1080/01621459.1995.10476572
Keir, D., Hamling, I. J., Ayele, A., Calais, E., Ebinger, C., Wright, T. J., et al. (2009). Evidence for focused magmatic accretion at segment centers from lateral dike injections captured beneath the Red Sea rift in Afar. Geology 37, 59–62. doi: 10.1130/G25147A.1
Kennett, B. L. N., and Engdahl, E. R. (1991). Traveltimes for global earthquake location and phase identification. Geophys. J. Int. 105, 429–465. doi: 10.1111/j.1365-246X.1991.tb06724.x
Lohman, R. B., and McGuire, J. J. (2007). Earthquake swarms driven by aseismic creep in the Salton Trough, California. J. Geophys. Res. Solid Earth 112:B04405. doi: 10.1029/2006JB004596
Maccaferri, F., Rivalta, E., Passarelli, L., and Aoki, Y. (2016). On the mechanisms governing dike arrest: insight from the 2000 Miyakejima dike injection. Earth Planet Sci. Lett. 434, 64–74. doi: 10.1016/j.epsl.2015.11.024
Maccaferri, F., Rivalta, E., Passarelli, L., and Jónsson, S. (2013). The stress shadow induced by the 1975–1984 Krafla rifting episode. J. Geophys. Res. Solid Earth 118, 1109–1121. doi: 10.1002/jgrb.50134
Mattia, M., Bruno, V., Caltabiano, T., Cannata, A., Cannavò, F., D'Alessandro, W., et al. (2015). A comprehensive interpretative model of slow slip events on Mt. Etna's eastern flank. Geochem. Geophy. Geosy. 16, 635–658. doi: 10.1002/2014GC005585
McNutt, S. R. (2005). Volcanic seismology. Annu. Rev. Earth Planet Sci. 33, 461–491. doi: 10.1146/annurev.earth.33.092203.122459
Minson, S. E., Dreger, D. S., Bürgmann, R., Kanamori, H., and Larson, K. M. (2007). Seismically and geodetically determined nondouble-couple source mechanisms from the 2000 Miyakejima volcanic earthquake swarm. J. Geophys. Res. Solid Earth 112:B10308. doi: 10.1029/2006JB004847
Mogi, K. (1967). Earthquakes and fractures. Tectonophysics 5, 35–55. doi: 10.1016/0040-1951(67)90043-1
Moran, S. C., Newhall, C., and Roman, D. C. (2011). Failed magmatic eruptions: late-stage cessation of magma ascent. Bull. Volcanol. 73, 115–122. doi: 10.1007/s00445-010-0444-x
Morris, J. D. (1984). Enriched Geochemical Signatures in Aleutian and Indonesian Arc Lavas: An Isotopic and Trace Element Investigation, Ph.D. thesis, Massachusetts Institute of Technology, Cambridge, MA.
Morris, J. D., Jezek, P. A., Hart, S. R., and Gill, J. B. (1983). The Halmahera island arc, Molucca Sea collision zone, Indonesia: a geochemical study. Tecton. Geol. Evol. Southeast Asian Seas Islands Part 2 27, 373–387. doi: 10.1029/GM027p0373
Newhall, C. G., Costa, F., Ratdomopurbo, A., Venezky, D. Y., Widiwijayanti, C., Win, N. T. Z., et al. (2017). WOVOdat – An online, growing library of worldwide volcanic unrest. J. Volcanol. Geotherm. Res. 345, 184–199. doi: 10.1016/j.jvolgeores.2017.08.003
Parotidis, M., Shapiro, S. A., and Rothert, E. (2004). Back front of seismicity induced after termination of borehole fluid injection. Geophys. Res. Lett. 31:L02612. doi: 10.1029/2003GL018987
Passarelli, L., and Brodsky, E. E. (2012). The correlation between run-up and repose times of volcanic eruptions. Geophys. J. Int. 188, 1025–1045. doi: 10.1111/j.1365-246X.2011.05298.x
Passarelli, L., Hainzl, S., Cesca, S., Maccaferri, F., Mucciarelli, M., Roessler, D., et al. (2015a). Aseismic transient driving the swarm-like seismic sequence in the Pollino range, Southern Italy. Geophys. J. Int. 201, 1553–1567. doi: 10.1093/gji/ggv111
Passarelli, L., Maccaferri, F., Rivalta, E., Dahm, T., and Boku, E. A. (2013). A probabilistic approach for the classification of earthquakes as “triggered” or “not triggered.” J. Seism. 17, 165–187. doi: 10.1007/s10950-012-9289-4
Passarelli, L., Rivalta, E., Cesca, S., and Aoki, Y. (2015b). Stress changes, focal mechanisms, and earthquake scaling laws for the 2000 dike at Miyakejima (Japan). J. Geophys. Res. B Solid Earth 120, 4130–4145. doi: 10.1002/2014JB011504
Passarelli, L., Rivalta, E., Jónsson, S., Hensch, M., Metzger, S., Jakobsdóttir, S. S., et al. (2018). Scaling and spatial complementarity of tectonic earthquake swarms. Earth Planet. Sci. Lett. 482, 62–70. doi: 10.1016/j.epsl.2017.10.052
Patanè, D., De Gori, P., Chiarabba, C., and Bonaccorso, A. (2003). Magma ascent and the pressurization of Mount Etna's volcanic system. Science 299, 2061–2063. doi: 10.1126/science.1080653
Pedersen, R., Sigmundsson, F., and Einarsson, P. (2007). Controlling factors on earthquake swarms associated with magmatic intrusions; Constraints from Iceland. J. Volcanol. Geotherm. Res. 162, 73–80. doi: 10.1016/j.jvolgeores.2006.12.010
Peng, Z., and Gomberg, J. (2010). An integrated perspective of the continuum between earthquakes and slow-slip phenomena. Nat. Geosci. 3, 599–607. doi: 10.1038/ngeo940
Pesicek, J. D., Thurber, C. H., Zhang, H., Deshon, H. R., Engdahl, E. R., and Widiyantoro, S. (2010). Teleseismic double-difference relocation of earthquakes along the Sumatra-Andaman subduction zone using a 3-D model. J. Geophys. Res. Solid Earth 115:B10303. doi: 10.1029/2010JB007443
Phipps Morgan, J., Ranero, C. R., and Vannucchi, P. (2008). Intra-arc extension in Central America: links between plate motions, tectonics, volcanism, and geochemistry. Earth Planet. Sci. Lett. 272, 365–371. doi: 10.1016/j.epsl.2008.05.004
Rivalta, E. (2010). Evidence that coupling to magma chambers controls the volume history and velocity of laterally propagating intrusions. J. Geophys. Res. Solid Earth 115:B07203. doi: 10.1029/2009JB006922
Rivalta, E., and Dahm, T. (2004). Dyke emplacement in fractured media: application to the 2000 intrusion at Izu islands, Japan. Geophys. J. Int. 157, 283–292. doi: 10.1111/j.1365-246X.2004.02193.x
Rivalta, E., Taisne, B., Bunger, A., and Katz, R. (2015). A review of mechanical models of dike propagation: schools of thought, results and future directions. Tectonophys 638, 1–42. doi: 10.1016/j.tecto.2014.10.003
Roland, E., and McGuire, J. J. (2009). Earthquake swarms on transform faults. Geophys. J. Int. 178, 1677–1690. doi: 10.1111/j.1365-246X.2009.04214.x
Roman, D. C. (2005). Numerical models of volcano-tectonic earthquake triggering on non-ideally oriented faults. Geophys. Res. Lett. 32:L02304. doi: 10.1029/2004GL021549
Roman, D. C., and Cashman, K. V. (2006). The origin of volcano-tectonic earthquake swarms. Geology 34, 457–460. doi: 10.1130/G22269.1
Rubin, A. M., and Pollard, D. D. (1988). Dike-induced faulting in rift zones of Iceland and Afar. Geology 16, 413–417. doi: 10.1130/0091-7613(1988)016<0413:DIFIRZ>2.3.CO;2
Ruch, J., Wang, T., Xu, W., Hensch, M., and Jónsson, S. (2016). Oblique rift opening revealed by reoccurring magma injection in central Iceland. Nat. Commun. 7:12352. doi: 10.1038/ncomms12352
Ruppert, N. A., Prejean, S., and Hansen, R. A. (2011). Seismic swarm associated with the 2008 eruption of Kasatochi Volcano, Alaska: earthquake locations and source parameters. J. Geophys. Res. Solid Earth 116, 1–18. doi: 10.1029/2010JB007435
Saccorotti, G., Ventura, G., and Vilardo, G. (2002). Seismic swarms related to diffusive processes: the case of Somma-Vesuvius volcano, Italy. Geophysics 67:199. doi: 10.1190/1.1451551
Scholz, C. H. (2002). The Mechanics of Earthquakes and Faulting. Cambridge: Cambridge University Press.
Segall, P., Llenos, A. L., Yun, S. H., Bradley, A. M., and Syracuse, E. M. (2013). Time-dependent dike propagation from joint inversion of seismicity and deformation data. J. Geophys. Res. Solid Earth 118, 5785–5804. doi: 10.1002/2013JB010251
Shapiro, S. A., Huenges, E., and Borm, G. (1997). Estimating the crust permeability from fluid-injection-induced seismic emission at the KTB site. Geophys. J. Int. 131, F15–F18. doi: 10.1111/j.1365-246X.1997.tb01215.x
Simpson, D. W., Leith, W. S., and Scholz, C. (1988). Two types of reservoir-induced seismicity. Bull. Seismol. Soc. Am. 78, 2025–2040.
Sparks, R. S. J. (2003). Forecasting volcanic eruptions. Earth Planet. Sci. Lett. 210, 1–15. doi: 10.1016/S0012-821X(03)00124-9
Stabile, T. A., Giocoli, A., Lapenna, V., Perrone, A., Piscitelli, S., and Telesca, L. (2014). Evidence of low-magnitude continued reservoir-induced seismicity associated with the Pertusillo Artificial Lake (Southern Italy). Bull. Seismol. Soc. Am. 104, 1820–1828. doi: 10.1785/0120130333
Talwani, P., and Acree, S. (1984). Pore pressure diffusion and the mechanism of reservoir-induced seismicity. Pure Appl. Geophys. 122, 947–965. doi: 10.1007/BF00876395
Talwani, P., Chen, L., and Gahalaut, K. (2007). Seismogenic permeability, ks. J. Geophys. Res. Solid Earth 112:B07309. doi: 10.1029/2006JB004665
Townend, J., and Zoback, M. D. (2000). How faulting keeps the crust strong. Geology 28, 399–402. doi: 10.1130/0091-7613(2000)28<399:HFKTCS>2.0.CO;2
Ukawa, M., and Tsukahara, H. (1996). Earthquake swarms and dike intrusions off the east coast of Izu Peninsula, central Japan. Tectonophysics 253, 285–303. doi: 10.1016/0040-1951(95)00077-1
Utsu, T. (2002). “Statistical features of seismicity,” in International Handbook of Earthquake & Engineering Seismology, eds W. H. Lee, P. Jennings, C. Kisslinger, and H. Kanamori (San Diego, CA: Academic Press), 719–732.
Valoroso, L., Improta, L., Chiaraluce, L., Di Stefano, R., Ferranti, L., Govoni, A., et al. (2009). Active faults and induced seismicity in the Val d'Agri area (Southern Apennines, Italy). Geophys. J. Int. 178, 488–502. doi: 10.1111/j.1365-246X.2009.04166.x
Valoroso, L., Improta, L., De Gori, P., and Chiarabba, C. (2011). Upper crustal structure, seismicity and pore pressure variations in an extensional seismic belt through 3-D and 4-D VP and VP/VS models: the example of the Val d'Agri area (southern Italy). J. Geophys. Res. Solid Earth 116, 1–21. doi: 10.1029/2010JB007661
Vavryčuk, V., and Hrubcová, P. (2017). Seismological evidence of fault weakening due to erosion by fluids from observations of intraplate earthquake swarms. J. Geophys. Res. Solid Earth 122, 3701–3718. doi: 10.1002/2017JB013958
Venzke, E. (2013). Global Volcanism Program, 2013. Volcanoes of the World, v.4.5.4. Smithson. Institution, Natl. Museum Nat. Hist.
Verstappen, H. T. (1964). Some volcanoes of Halmahera (Moluccas) and their geomorphological setting. K. Ned. Aardrijkskd. Genoot 81, 297–316.
Vidale, J. E., and Shearer, P. M. (2006). A survey of 71 earthquake bursts across southern California: exploring the role of pore fluid pressure fluctuations and aseismic slip as drivers. J. Geophys. Res. Solid Earth 111:B05312. doi: 10.1029/2005JB004034
Waltham, D., Hall, R., Smyth, H. R., and Ebinger, C. J. (2008). “Basin formation by volcanic arc loading,” in Formation and Applications of the Sedimentary Record in Arc Collision Zones, eds A. E. Draut, P. D. Clift, and D. W. Scholl (Boulder, CO: The Geological Society of America Special Paper 436), 11–26.
Weatherall, P., Marks, K. M., Jakobsson, M., Schmitt, T., Tani, S., Arndt, J. E., et al. (2015). A new digital bathymetric model of the world's oceans. Earth Sp. Sci. 2, 331–345. doi: 10.1002/2015EA000107
White, R., and McCausland, W. (2016). Volcano-tectonic earthquakes: a new tool for estimating intrusive volumes and forecasting eruptions. J. Volcanol. Geotherm. Res. 309, 139–155. doi: 10.1016/j.jvolgeores.2015.10.020
White, S. M., Crisp, J. A., and Spera, F. J. (2006). Long-term volumetric eruption rates and magma budgets. Geochem. Geophy. Geosy. 7:Q03010. doi: 10.1029/2005GC001002
Keywords: earthquake swarm, large positive CLVD, volcanic unrest, dike intrusion, unrest duration, Jailolo volcano, Halmahera volcanic arc
Citation: Passarelli L, Heryandoko N, Cesca S, Rivalta E, Rasmid, Rohadi S, Dahm T and Milkereit C (2018) Magmatic or Not Magmatic? The 2015–2016 Seismic Swarm at the Long-Dormant Jailolo Volcano, West Halmahera, Indonesia. Front. Earth Sci. 6:79. doi: 10.3389/feart.2018.00079
Received: 08 February 2018; Accepted: 25 May 2018;
Published: 12 June 2018.
Edited by:
Zhong Lu, Southern Methodist University, United StatesReviewed by:
Sigrún Hreinsdóttir, GNS Science, New ZealandEisuke Fujita, National Research Institute for Earth Science and Disaster Prevention, Japan
Helena Buurman, University of Alaska Fairbanks, United States
Copyright © 2018 Passarelli, Heryandoko, Cesca, Rivalta, Rasmid, Rohadi, Dahm and Milkereit. This is an open-access article distributed under the terms of the Creative Commons Attribution License (CC BY). The use, distribution or reproduction in other forums is permitted, provided the original author(s) and the copyright owner are credited and that the original publication in this journal is cited, in accordance with accepted academic practice. No use, distribution or reproduction is permitted which does not comply with these terms.
*Correspondence: Luigi Passarelli, bHVpZ2kucGFzc2FyZWxsaUBnZnotcG90c2RhbS5kZQ==