 Darin M. Schwartz
 S. Adam Soule
 V. Dorsey Wanless
 Max P. Jones2
- 1Department of Geosciences, Boise State University, Boise, ID, United States
- 2Geology and Geophysics Department, Woods Hole Oceanographic Institution, Woods Hole, MA, United States
Shallow seamounts at ocean island hotspots and in other settings may record emergence histories in the form of submarine erosional terraces. Exposure histories are valuable for constraining paleo-elevations and sea levels in the absence of more traditional markers, such as drowned coral reefs. However, similar features can also be produced through primary volcanic processes, which complicate the use of terraced seamounts as an indicator of paleo-shorelines. In the western Galápagos Archipelago, we utilize newly collected bathymetry along with seafloor observations from human-occupied submersibles to document the location and depth of erosional terraces on seamounts near the islands of Santiago, Santa Cruz, Floreana, Isabela, and Fernandina. We directly observed erosional features on 22 seamounts with terraces. We use these observations and bathymetric analysis to develop a framework to identify terrace-like morphologic features and classify them as either erosional or volcanic in origin. From this framework we identify 79 erosional terraces on 30 seamounts that are presently found at depths of 30 to 300 m. Although intermittent subaerial connectivity between the islands has been hypothesized, the depths of these erosional terraces in the Santiago region are the first direct evidence of paleo-connectivity in the modern archipelago. Collectively, the terraces have non-randomly distributed depths. We suggest that peaks in the distribution of terrace depths likely represent long durations of exposure (i.e., sea-level still or lowstands). By comparing these peaks to those of subsidence adjusted sea-level curves, we identify the average subsidence rate that best reproduces the observed terrace distributions. These rates are 0.2–0.4 m/ka for this portion of the central Galápagos, since the formation of the seamounts, consistent with previous independent estimates. Using these subsidence rates and evidence for erosional terraces at depths up to 300 m, we conclude that all islands in the central archipelago have been intermittently connected starting between 435 and 900 ka. Individual island pairs have likely been repeatedly subaerially connected for short intervals since that time.
Introduction
Volcanic seamounts generated at oceanic hotspots grow over short durations, compared to the subaerial islands that they typically surround (Clague et al., 2000). These volcanic landforms help to resolve the spatial and temporal variability of magmatism, which is largely obscured by superimposed lava flows exposed on polygenetic islands (e.g., Moore et al., 1982). Furthermore, the morphology and lithology of the seamounts record information about the conditions during and after their formation (e.g., Ramalho et al., 2013; Huppert et al., 2015; Casalbore, 2018). In other words, if individual seamounts are active for only short durations, but seamounts are generated throughout the volcanic life of the hotspot, they provide a semi-continuous record of magmatic and environmental conditions above a mantle plume. The scarcity of detailed bathymetric mapping and difficulty in making direct observations at these submarine features has previously limited their utility for this purpose. In this study, we utilize new multi-beam bathymetric data and observations of seamounts in the western Galápagos Archipelago to constrain models for ocean island evolution and theories related to natural selection, which are both a function of paleogeography. Although there is strong evidence for past subaerial connectivity between the islands via genetics (e.g., Ali and Aitchison, 2014), landforms that can explain these connections mostly sit at depths greater than would be exposed during glacial maxima over the past 1 Ma. Our investigation of the seamounts is used to corroborate claims that combined sea level changes and subsidence have resulted in subaerial connectivity between the islands in the archipelago's past.
We report on new bathymetric mapping in the Galápagos that has revealed > 100 seamounts with summit depths from near sea level to 1,000 m, many of which were not previously known (Figure 1). The new mapping reveals complex morphological characteristics of the seamounts that were previously unresolvable, including terraced summits and flanks (Figures 2, 3A). Preserved terraces and beach cobble deposits in ocean island systems and on continental margins are commonly interpreted to be the result of wave abrasion at the coastline during sea level still-stands (Trenhaile, 2000; Ramalho et al., 2013 and references therein; Zecchin et al., 2015; Casalbore et al., 2017). Wave action at the coastlines of volcanic islands creates shore platforms by quarrying and dislodgement of joint blocks and abrasion (Ramalho et al., 2013; Quartau et al., 2014, 2016). The effectiveness of these processes is thought to decrease rapidly at water depths of a few meters for bedrock and up to 50 m for clastic deposits (e.g., Menard and Ladd, 1963; Kokelaar and Durant, 1983; Romagnoli and Jakobsson, 2015). Seamounts large enough to reach the sea surface should, in theory, record the same coastal erosion processes, and provide useful constraints on ocean island paleogeographies and vertical motions in the absence of more traditional markers, such as drowned coral reefs (Campbell, 1984; Moore and Fornari, 1984; Rubin et al., 2000; Huppert et al., 2015). However, volcanic processes that are independent of depth can result in features that mimic erosional terraces, including submarine lava ponding (e.g., Clague et al., 2000), lava flows with primarily concave-out morphologies (Geist et al., 2006, 2008) and laminar spreading and deposition of near-surface pyroclastic deposits, which should be relatively smooth features with gentle upper flank slopes (Mitchell et al., 2012; Casalbore et al., 2015). Despite work toward characterizing morphologies associated with these processes (e.g., Chaytor et al., 2007), there is no systematic way to delineate seamount terraces as primary (volcanic) or secondary (erosional) features. From our observations, we develop a binary framework for determining the origins of terraces based on their morphology, which may be applicable to other seamount systems.
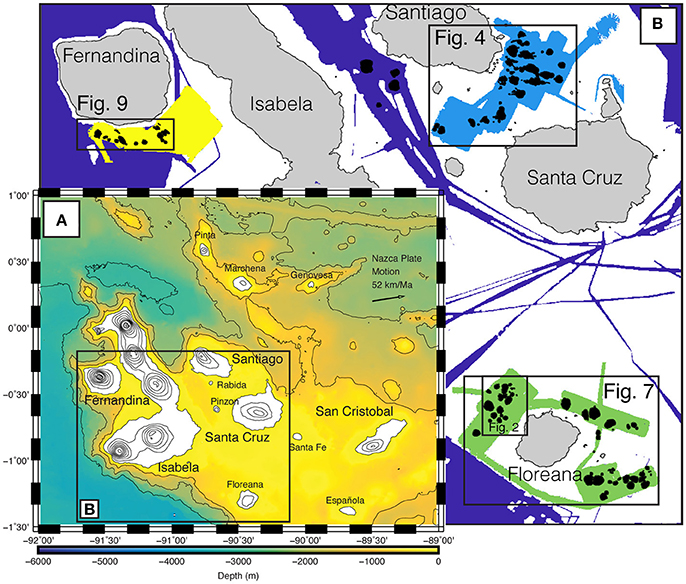
Figure 1. (A) Map of the Galápagos Archipelago. Subaerial contours show elevations at 200 m intervals (Weatherall et al., 2015). Submarine contours show bathymetry at 500 m intervals. Solid black box indicates location of (B) in this figure. (B) Mapped regions and seamounts. Gray polygons show island locations. Dark violet polygon shows previously collected bathymetry, other colored polygons (light blue, yellow, green) show mapping locations from this study and are shown in more detail in Figures 4, 7, 9. Solid black polygons show footprints of newly located seamounts.
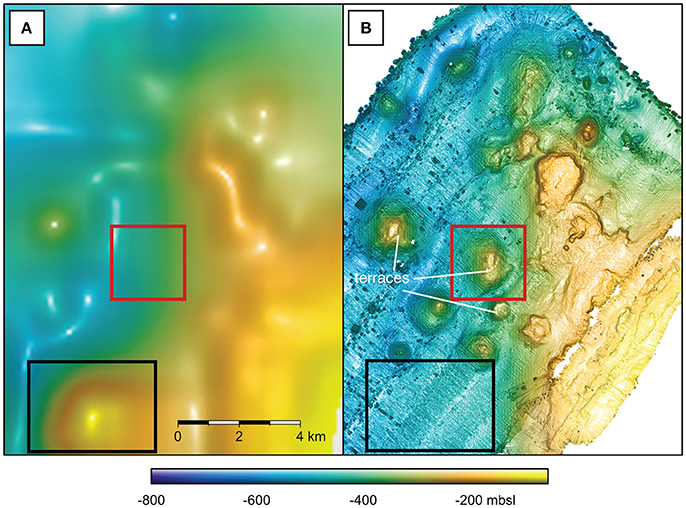
Figure 2. Comparison of global bathymetry to M/V Alucia multibeam NW of Floreana, location of figure is indicated in Figure 1. (A) Bathymetry derived from sparse sounding data and gravity anomalies calculated from satellite altimetry, gridded at ~900 m (Smith and Sandwell, 1997; Weatherall et al., 2015). (B) Mulitbeam bathymetry encompassing the identical area as in (A), data are gridded at 10 m. Note large anomaly in (A) (apparent seamount indicated by the black box) does not appear in (B). Numerous smaller features not visible in the altimetry-based data appear in the multibeam data, including seamounts (indicated by the red box) and terraces are identified in the multibeam data.
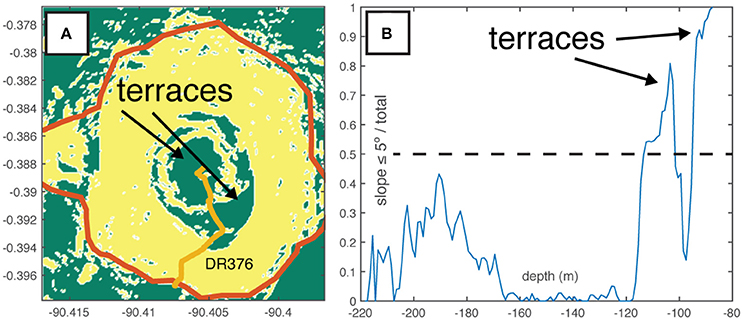
Figure 3. Example of terrace identification. (A) Slope map of a seamount where two terraces have been identified. Areas where slopes are ≤ 5°(terraces) are shown in green and slopes > 5° are shown in yellow. Seamount footprint is shown as a thick red line and was manually digitized as the break in slope ≥ 5°. Gold line shows the dive track for seamount DR376. (B) ratio of pixels with slope ≤ 5° to all pixels at that depth within the seamount footprint. Peaks in the distribution where ratio is > 50% are identified as terraces.
Background and Methods
Direct observations of paleo-elevations at some ocean islands are made possible through the dating of drowned coral reefs (e.g., Hawaii; Moore and Fornari, 1984; Ludwig et al., 1991) as well as transitions from subaerial to submarine lavas in boreholes (e.g., Ascension; Minshull et al., 2010). These measurements, along with sea level reconstructions, are used to constrain island vertical motions through time (e.g., Huppert et al., 2015). These vertical motions are primarily the combined result of topographic loading and flexure (e.g., Moore, 1970; Watts and Ten Brink, 1989), cooling and deepening of the lithosphere as it ages (e.g., Marty and Cazenave, 1989) and/or transport over and away from the hotspot swell (e.g., Detrick and Crough, 1978). However, a large number of ocean islands are devoid of large carbonate platforms despite supporting reefs, likely due to low average annual water temperatures (Kleypas et al., 1999; Couce et al., 2012), and lack borehole data, thus vertical motions cannot be constrained using these approaches.
The Galápagos Archipelago is a hotspot sourced volcanic island chain located in the equatorial Pacific ~1,000 km west of South America. The Galápagos consists of 13 major volcanic islands, numerous smaller islands, and volcanic seamounts (Figure 1; McBirney and Williams, 1969; Christie et al., 1992; Sinton et al., 2014; Schwartz et al., 2018). The central and eastern islands rise from a shallow volcanic platform that stands ~3,000 m above the surrounding seafloor (Geist et al., 2008) and comprises the majority of the archipelago's erupted volume. The hotspot center lies southwest of Fernandina volcano (Kurz and Geist, 1999; Villagómez et al., 2014), which is the westernmost and most active volcanic island in the Galápagos (Allan and Simkin, 2000). There is a general age progression and corresponding decrease in eruption rate from west to east across the archipelago (White et al., 1993). The youngest island in the archipelago is Fernandina, which emerged at ~70 ka (Kurz et al., 2014). Volcanoes get progressively older to the east, where the emergence of Santiago is ~1 Ma, Santa Cruz and Floreana ~2.3 Ma and San Cristobal ~6 Ma (Geist et al., 2014). There are numerous “drowned” islands, which lie to the southeast (Christie et al., 1992) and east (Sinton et al., 2014) of the present archipelago extending the age of emergence for the archipelago to at least 9 Ma.
Vertical motions in the Galápagos have been estimated based upon measurements of the maximum height of islands and large seamounts, as well as platform depth, as a function of distance from the plume center (Geist, 1984; Geist et al., 2014). Trends in subsidence rate derived from these measurements follow an exponential decrease, that peaks at 2 m/ka at Fernandina and rates asymptotically approach 0.4–0.5 m/ka at the distance of Santiago, Floreana, and Santa Cruz (Equation 8.6; Geist et al., 2014). These rates are comparable to those of the Hawaiian Islands for islands of similar ages (0–4 m/ka for islands younger than 1 Ma; Huppert et al., 2015). The estimate of Galápagos rates relies upon the assumption that the Galápagos plume flux has contributed uniformly to archipelago formation for the past several million years. This is uncertain due to clear evidence for variable plume-ridge interaction in the archipelago's past (e.g., Harpp and Geist, 2002; Harpp et al., 2003; Sinton et al., 2014). Moreover, the relative contribution of the plume to volcanism on the Nazca and Cocos plates has fluctuated through time due to variations in the relative position of the mantle plume to the ridge and position beneath respective plates (e.g., Werner et al., 2003) and continued ridge jumps (Mittelstaedt et al., 2012).
In 2015 we conducted a research cruise in the western Galápagos Archipelago aboard the M/V Alucia. During the cruise we conducted seafloor mapping with a ship-mounted Reson multibeam sonar (yellow, light-blue and green areas in Figure 1). In addition, we collected seafloor observations and samples with two 1,000-m rated human occupied vehicles (HOVs), Deep Rover 2 and Nadir (gold lines in Figures 4–9). Through a combination of morphology from seafloor mapping and direct seafloor observations we develop a framework to distinguish between morphological features resulting from coastal (i.e., erosional) processes and those resulting from primary volcanic (i.e., constructional) processes within the mapped region. With this framework we are able to identify erosional terraces across the study area to (1) provide the first direct observations of interisland connections via erosional features in the modern archipelago, and (2) document how the combination of sea-level change and island subsidence contribute to the paleogeography of the archipelago through the use of comparative statistics.
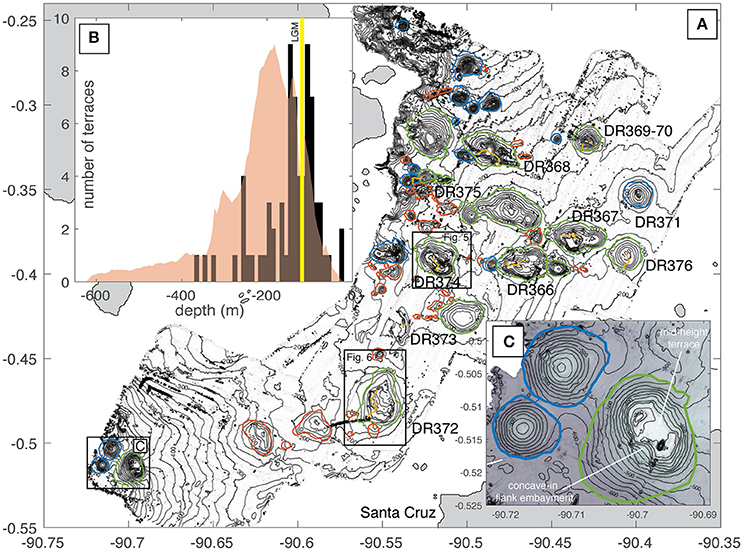
Figure 4. (A) Bathymetric map of the Santiago seamounts. Gray polygons locate islands. Bathymetric contour interval is 20 m. Green lines locate seamounts > 100 m of relief that have identified terraces. Blue lines locate other mapped seamounts > 100 m. Red lines locate mapped seamounts, which are < 100 m in relief. Gold lines indicate dive tracks. Locations of inset (C) and Figures 4, 5 are indicated by black boxes. (B) Black/gray bars are histogram of depths of all identified terraces. Semi-transparent red polygon shows the probability distribution of all depths within the mapped seamount footprints. Yellow bar indicates the depth of the last glacial maximum sea-level lowstand (Bintanja et al., 2005) (C) Seamount with summit depth ~300 m with identified terrace and summit embayment and irregular shaped summit features.
Mapping the Galápagos Platform and Seamounts
Bathymetric mapping focused on three regions on the Galápagos platform, east and south of Santiago Island, surrounding Floreana Island and south of Fernandina Island (between 20 and 2,000 m water depth; Figure 1). Surveys were conducted on M/V Alucia using a Reson 7160 44 kHz multibeam sonar with Reson SeaBat acquisition software and PDS2000 for real time viewing and adjustment of sonar settings to optimize data quality, including frequency, depth range, beam steering, and gain. Swath widths were typically 5x water depth, but decreased at depths greater than 1,500 m.
Data processing was conducted with Caris™ HIPS and SIPS. Navigation and attitude data were verified and a tide correction was applied based on observed tides from the Instituto Oceanográfico de la Armada (INOCAR) station at Baltra Island. Sound velocity corrections were applied based on XBT data, which were collected at least once every 12 h of multibeam operations. Sonar data was automatically filtered at beam angles > 65°, manually edited to remove outliers, and gridded at 10 m for analysis. Remarkably little of the Galápagos volcanic platform has been mapped prior to this study, thus the best available bathymetric data was from global data sets derived from sparse echo-soundings and global gravity anomalies derived from satellite altimetry (e.g., Smith and Sandwell, 1997). The new mulibeam bathymetry is 90x higher resolution than the existing global data (Figure 2; Geist et al., 2006; Weatherall et al., 2015) for the study area. As a result, the new bathymetry allows identification of seamounts with relief greater than 10 m, most of which were previously undetectable (Figure 2). Although correspondence of larger seamounts between satellite-derived bathymetry and the new multibeam data is good, we find numerous examples of both undetected and spurious seamounts in satellite-derived bathymetry when compared to the new multibeam data (Figure 2).
Using criteria of Bohnenstiehl et al. (2012), seamount extents were defined by the break in slope from the seafloor > 5° and their footprints were manually digitized using QGIS software. For seamounts with >100 m of relief, spatial statistics including summit and base depth, relief, and diameter were collected using MATLAB software and are summarized in Table 1 for seamounts visited by HOV. Seamount slopes were binned into two categories of ≤ 5°(terraces) and >5°(seamount flanks) and integrated as a function of depth. The ratio of pixels ≤ 5° and > 5° was then calculated for these depth distributions (e.g., Passaro et al., 2011). Terraces were identified as peaks in those final distributions where ≥ 50% of pixels at a given depth have slopes of ≤ 5° (Figure 3). Once identified, seamounts with terraces were manually evaluated for concave-in flank embayments, which have been interpreted as erosion-induced collapse in other volcanic seamounts (e.g., Chaytor et al., 2007) (Table 1). These and constructional features, such as summit craters (Clague et al., 2000; Chaytor et al., 2007), convex out lobes formed at lava flow boundaries (Geist et al., 2006) are corroborated with seafloor observations (e.g., Figures 5, 6, 8, 9). Although terraces were also identified on seamounts < 100 m in relief and seamounts in the older coarser resolution bathymetry, including one seamount visited by HOV (DR375; Figure 4A), we do not include these seamounts because sonar sounding density is insufficient to confidently discriminate between erosional and primary volcanic features. From our observations, we suggest that features should have relief of at least 10x the spatial resolution of the bathymetric data in order to confidently identify terraces.
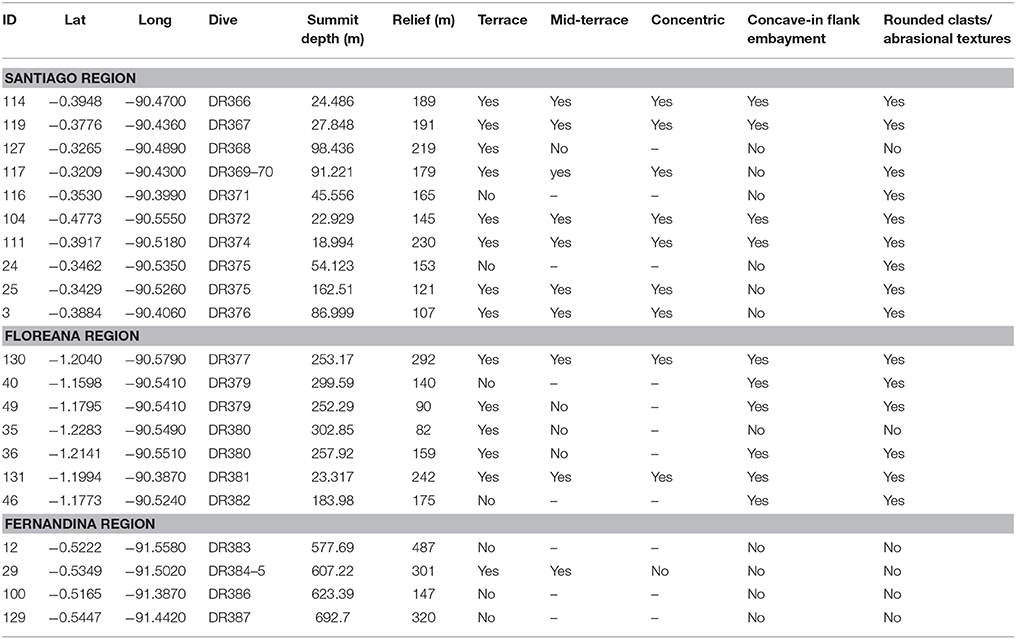
Table 1. Table of seamounts visited by HOV relating direct seafloor observations to bathymetric features.
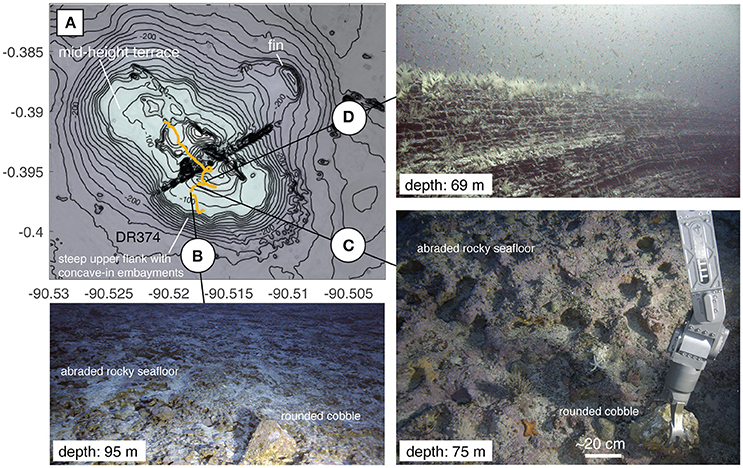
Figure 5. Map and images of DR374 seamount. (A) Bathymetric contour interval is 10 m. Gold line shows dive track for seamount DR374. The seamount has steep upper flanks and a broad mid-height terrace that is concentric about the seamount's summit (i.e., encircles the entire seamount). The contour of the terrace edge is irregular and includes flank embayments giving it a scalloped shape. There are multiple irregular spines and fins protruding from the seamount's flank and summit. NE-SW striking linear feature near the summit of the seamount is a data artifact. (B) Rounded boulder on smoothed bedrock material constituting the seamount's terrace. (C) Collection of rounded cobbles and detailed view of smoothed bedrock constituting the seamount's terrace. (D) Truncated outcrop of thinly bedded volcaniclastic material near the seamount's summit. Depths in photos indicate the depth of the seafloor at the point of image capture.
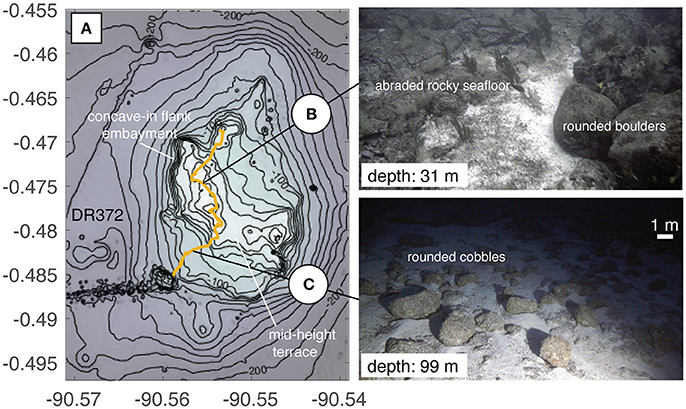
Figure 6. Map of DR372 seamount. (A) Bathymetric contour interval is 10 m. Gold line shows dive track for seamount DR372. This seamount is highly irregular in shape, with a N-S trending elongation at it's base and NW-SE elongation near it's summit. The seamount has steep upper flanks and is adorned by multiple irregular summit features. There are multiple terraces on this seamount, which are flanked by steep sides with flank embayments. ENE-WSW striking linear feature SW of the seamount is a data artifact. (B) Rounded boulder on smoothed bedrock material constituting the seamount's terrB The left portion of the image shows bulbous/rounded basaltic lava flow bedrock and the right side shows rounded basaltic boulders of a similar size and roundness. (C) Field of rounded cobble-boulder sized clasts on flat lying bedrock, which is mostly obscured by fine sediment. Depths in photos indicate the depth of the seafloor at the point of image capture.
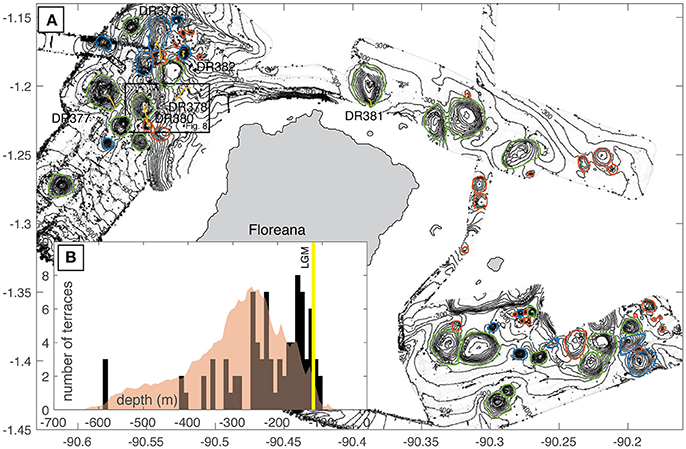
Figure 7. (A) Bathymetric map of the Floreana seamounts. Gray polygons locate islands. Bathymetric contour interval is 20 m. Green lines indicate footprints for seamounts > 100 m of relief that have identified terraces. Blue lines indicate other mapped seamounts > 100 m. Red lines indicate mapped seamounts, which are < 100 m in relief. Gold lines indicate dive tracks. Location of Figure 8 is indicated by a black box. (B) Black/gray bars are histogram of depths of all identified terraces. Semi-transparent red polygon shows the probability distribution of all depths within the mapped seamount footprints. Yellow bar indicates the depth of the last glacial maximum sea-level lowstand.
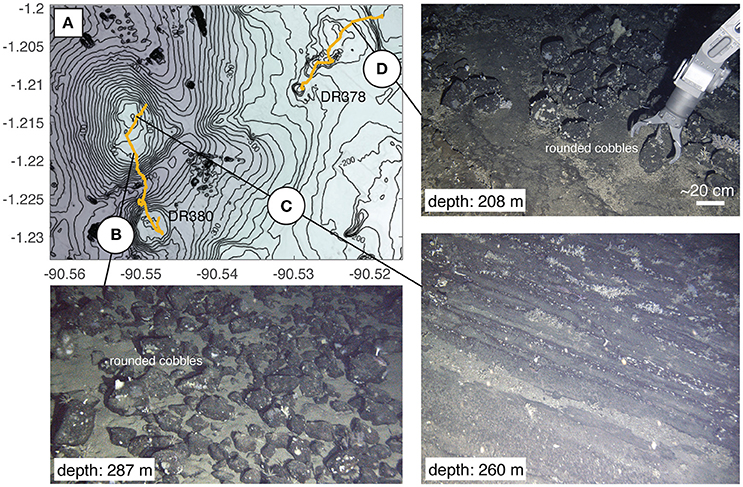
Figure 8. Map of DR378 and DR380 seamounts. (A) Bathymetric contour interval is 10 m. Gold lines shows dive tracks for seamounts DR378 and DR380. The two seamounts visited on seamount DR380 have terraced/flat summits. The northernmost of the two is irregular in plan view, with small embayments on the western flank and has a small summit spire. The southernmost is round with no irregular summit features, except for its flat top, and resembles seamounts found in the Fernandina region (Figure 9) (B) Field of rounded cobble-boulder sized clasts setting on a flat surface obscured by fine sediment. (C) Near vertical outcrop of sub-horizontally bedded volcaniclastic material. (D) Collection of rounded cobble from top of terrace. Depths in photos indicate the depth of the seafloor at the point of image capture.
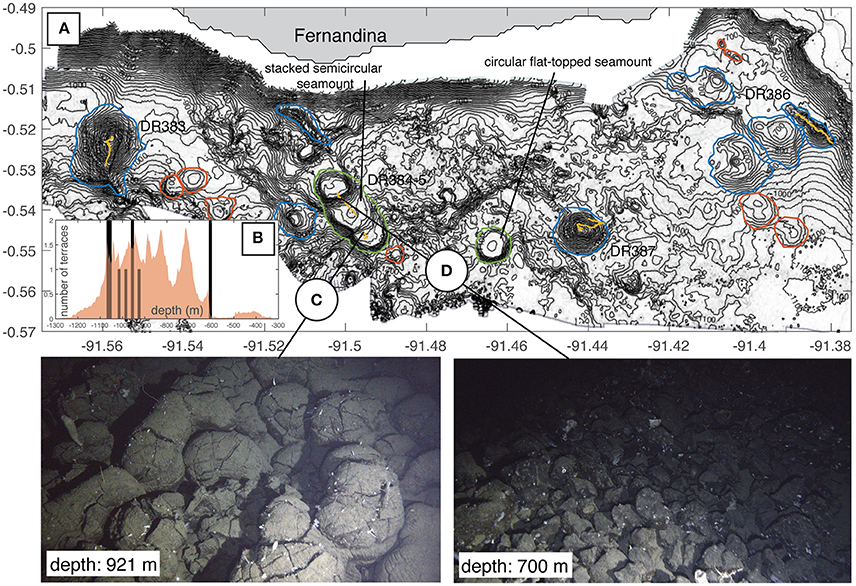
Figure 9. (A) Bathymetric map of the Fernandina seamounts. Gray polygon indicates island location. Bathymetric contour interval is 20 m. Green lines indicate footprints for seamounts > 100 m of relief that have identified terraces. Blue lines indicate other mapped seamounts > 100 m. Red lines indicate mapped seamounts, which are < 100 m in relief. Gold lines indicate dive tracks. (B) Histogram of depths of identified terraces. Semi-transparent red polygon shows the probability distribution of all depths within the mapped seamount footprints. (C) Pillow lavas, which serve as the bedrock for the lowermost terrace on this seamount. (D) Steep talus pile on the seamount's flank. Talus is comprised of pillow fragments retaining some of the curved sides of the original pillows and more blocky/polygonal interiors.
Seafloor Observations and Sample Collection
HOV dives were conducted on 25 seamounts in the three study regions (Table 1). Each dive consisted of tandem launches of the Nadir and Deep Rover 2 submersibles. Typically, dives started at or near the base of a target seamount and proceeded up to the seamount summit. Continuous HD video was collected throughout the dive and samples were collected where obvious changes in lithology were observed (Table 1; Supplementary Data). Following the cruise, the video data was classified based on the observed morphology and inferred lithology using the collected samples. Two additional seamounts were visited on a previous cruise and are included in our evaluation (Carey et al., 2016).
Results
Observational Results
From the 150 seamounts that were digitized from the new and existing multibeam bathymetry, 76 are > 100 m in relief, and 34 of these seamounts have terraces. Most terraces occur between the seamount base and summit (mid-height terraces; N = 24), the rest are found at or near (within 10 m) the summit (summit terraces; N = 10). Terraces are identified in all three mapping regions and range in depth from 15 to 1,100 m (Figures 4–9).
We recovered 147 rock samples from 22 dives on 25 seamounts. Of the samples collected, 127 are basaltic lavas and the remaining 20 are of lithified volcaniclastic deposits. The samples are correlated with seafloor morphology using continuous dive video (Table 1). We categorized seafloor morphology into primary volcanic features/textures formed during emplacement or secondary features/textures formed during exposure. Primary volcanic features include pillow lavas (e.g., Figure 9C) and rough aa-like lava flow textures (Supplementary Data; Image DR372-1655). Secondary features include rounded beach cobble deposits (Figures 5B,C, 6B,C, 8B,D), smoothed abrasional rocky surfaces (Figures 5B,C), erosional cliffs (Figure 5D), terraces (Figures 5B,C), and spires (Supplementary Data, Image 375–1558; e.g., Trenhaile, 1987). We use the presence of rounded cobbles on terraces to definitively identify exposure to abrasional processes at or near the sea surface (e.g., Ramalho et al., 2013; Table 1). Further, we equate variations in observed morphologic features from smooth to more bulbous rocky surfaces to be the result of abrasion by water-borne particles on various volcanic lithologies ranging from basalts to hyaloclastities and/or pyroclastic deposits (e.g., Ramalho et al., 2013). Bedded pyroclastic deposits were commonly observed (Figures 5D, 8C) and although we do not necessarily ascribe them to primary or secondary volcanic features, they are evidence of shallow eruption processes (e.g., Cas, 1992) or reworking of material at or near the sea surface (Ramalho et al., 2013).
Santiago Seamounts
In the Santiago region, terraces are present at water depths from 20 to 375 m and have principle modes at depths of 110 and 130 m (Figure 4B), with minor modes at greater depths. Typically, terraces in this region occur as mid-height features whose outer edges are concentric with contours on the seamount slope and about the seamount's midpoint (Figures 4A, 5A). Seamounts with terraces are irregular in plan view (Figures 5A, 6A) and are adorned by steep cliffs (Figure 5A) and vertical fins or spires, which are visible in the maps (e.g., Figure 5) and on smaller scales in photos collected from the submersibles (e.g., Supplemental Data; Image DR375-1558). On nine of the 10 seamounts visited in this region we observed rounded cobbles and smoothed and bulbous surfaces, indicative of exposure to waves at or near sea surface (Figures 5, 6). Of these nine seamounts, all but two have mid-height terraces and/or summit terraces. Only one seamount had a morphologically identified terrace (at its summit) but no obvious evidence for erosional features from direct seafloor observations (DR368). Intact pillow lavas were observed from the submersibles on this seamount's flanks, the only observation of pillows in the Santiago region (Supplementary Data; Images DR368-1502, 1520, 1524).
Floreana Seamounts
Similar features to those observed in the Santiago region were observed surrounding Floreana (Figure 7A). Terraces are present at water depths of 100–600 m and have a shallow mode at 150 m and a secondary mode at 250 m (Figure 7B), with minor modes at greater depths. Thinly bedded laminar deposits are observed at depths between 100 and 400 m (e.g., Figure 8C). Rounded cobbles are present at water depths up to 300 m (Figures 8B,D). These deep cobbles are similar in size and roundness to those observed at shallower depths and in the Santiago region (Figures 6B, 8D). Of note, the cobbles at 287 m water depth shown in Figure 8B were observed on a terrace at the seamount summit, excluding the possibility of downslope transport. Similar bathymetric features to those observed in the Santiago region are also observed in the Floreana region, including steep cliffs with scalloped and complex contour patterns (Figures 7, 8). Of the seven seamounts visited by HOV, all but one showed evidence of exposure to wave abrasion in the form of rounded cobbles or other abrasional surfaces. Of these six seamounts, five have summit terraces, and two of those five had mid-height terraces. Similar to the Santiago region, the only seamount with a morphologically-identified terrace that showed no obvious evidence for erosional features from direct seafloor observations (DR380 southern seamount), only had a summit terrace and had what appeared to be intact pillow lavas at its summit (Supplementary Data; Images DR380-1500).
Fernandina Seamounts
Terraces in the Fernandina region are observed at depths from 600 to 1,100 m, with no obvious depth modes. Terraces occur as circular and stepped semicircular features. As opposed to the terraces visited in the Santiago and Floreana regions, deep terraces in the Fernandina region were associated with pillow lavas (Figures 9A,B). Pillows were typically observed as intact, flat deposits (Figure 9C) and mounds as well as incised cliffs and associated talus slopes (Figure 9D). Talus slopes originating from these constructions contain sub-meter sized clasts with remnant outer pillow surfaces. These clasts are easily identified as pillow fragments, as opposed to reworked cobbles, due to their presence as steep deposits at the base of intact pillow cliffs and their polygonal and blocky sides. Other lava features are observed including columnar jointed flow interiors. No observations of laminar pyroclastic deposits, wave base erosional surfaces, or rounded clasts were observed in the Fernandina region.
Framework for Identifying Erosional Terraces
From our combined bathymetric analyses and direct seafloor observations we have developed a binary framework to delineate erosional terraces from those created from other processes (Figure 10). The seafloor observations and their relationships to terraces and flank embayments serve as the training dataset for the binary framework. The 21 visited seamounts (Table 1) are ultimately used to evaluate our interpretations (e.g., identify false positives and negatives). Visited seamounts with terraces constituting the training datasets (N = 14; Table 1) represent nearly half of all seamounts with terraces (N = 34), which we deem adequate for confidently assessing the accuracy of our classification scheme.
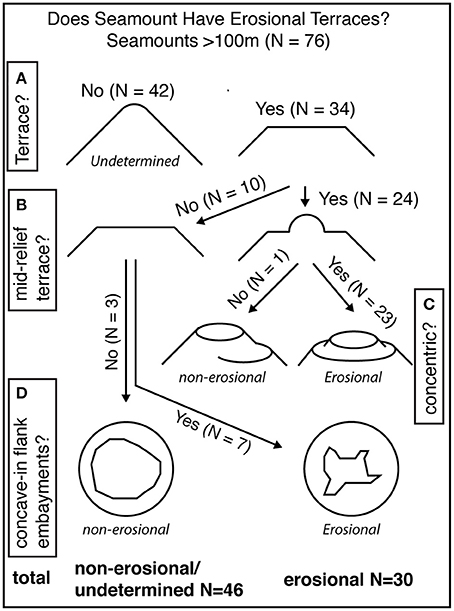
Figure 10. Flow chart for extrapolating mapped terraces as erosional terraces indicating observations leading to, and the number of seamounts within, each classification step. See section Framework for Identifying Erosional Terraces for more detailed description of each classification step and discussion of false positives and negatives. (A) Initially seamounts are discriminated by the presence of bathymetrically identified terraces. Seamounts without bathymetrically identified terraces (left) cannot be positively identified as erosional. (B) Seamounts terraces occur on summits (left) or at mid-level on the seamount +/− a summit terrace (right). (C) Of seamounts with mid-level terraces, terraces can either occur non-concentrically (left) or concentrically (right) about the seamount's summit. Seamounts with non-concentric terraces are classified as non-erosional, whereas seamounts with concentric terraces are classified as erosional. (D) For seamounts with summit terraces only seamounts are manually discriminated by the absence (left) or presence (right) of concave-in flank embayments. The former are classified as non-erosional and the later as erosional.
We take a conservative approach in our classification relying primarily on terrace characteristics (e.g., summit vs. mid-height terrace) in order to reduce false positives and the effect of human interpretation biases. We note that only 11 of the 14 seamounts visited by HOV with direct observations indicating erosion at or near the sea surface (e.g., beach cobbles), have identified terraces. This leads to an initial false negative rate of 21%. However, without direct seafloor observations the absence of bathymetrically identifiable terraces (e.g., Figure 3) for the remaining unvisited seamounts is an impasse that excludes further identification (N = 42; Figure 10A). Thus, all seamounts without bathymetrically identified terraces are excluded from analysis of island subsidence and paleogeography. Interestingly, seamounts with no terraces identified, but show direct seafloor evidence for erosion (N = 3; false negatives), are of comparable size and depth to the seamounts that are positively identified by both metrics. This may suggest that some seamounts are too young to have experienced the same lowstands as nearby seamounts, or that variations in lithology between seamounts may be a primary control on the formation and preservation of terraces.
When present, seamount terraces occur on summits (N = 10), or at mid-level on the seamount in the presence or absence of a summit terrace (N = 24; Figure 10B). If the seamount only has a summit terrace and the seamount does not possess any obvious erosional features such as concave-in scalloped flanks, then it cannot be positively identified as erosional (Figure 10D). Three seamounts with only summit terraces and lacking erosional features are observed and are found in all three mapping regions (Table 1) and include DR368 (Figure 4) and DR380 (southern seamount; Figure 8). Flat-topped seamounts are commonly observed seafloor features (e.g., Chaytor et al., 2007). These features are thought to form from the ponding of lavas at seamount summits, similar to subaerial volcanoes in the Galápagos (Clague et al., 2000; Naumann and Geist, 2000), or due to spreading of pyroclastic material due to shallow eruption processes without direct interaction with waves (Mitchell et al., 2012; Casalbore et al., 2015). Both of these mechanisms should result in circular seamounts with relatively gentle summit slopes (Clague et al., 2000; Mitchell et al., 2012). Both DR368 and DR380 only have summit terraces and do not show morphological or seafloor evidence for erosion. In fact, irregularities in extent of the summit of DR380 are convex-out, which more likely indicate volcanic constructional processes (e.g., Geist et al., 2006). There are no false positives or negatives identified in our training dataset for this classification step.
By contrast, we assert that summit terraces, on seamounts with concave-in, scalloped flanks, or steep upper slopes are most likely created by coastal erosional processes (N = 7; Figure 10D). Seven seamounts, which have only summit terraces, are accompanied by complex summit shapes as well as steep and scalloped flanks that lead up to terraces (Figure 10D). The seamounts that we mapped are all < 1 km in relief and thus should not be gravitationally unstable and therefore not have been significantly modified by large scale mass wasting (Mitchell, 2001). Similarly, these features would not be expected to result from lateral spreading of pyroclastic material or submarine lava ponding for volcanoes of this size (Clague et al., 2000; Mitchell et al., 2002, 2012). Direct seafloor observations of all seamounts in this group (N = 3; Table 1) indicate exposure at the sea surface, leading to no false positives or negatives.
Twenty-four seamounts have mid-level terraces (Figure 10B). These mid-level terraces occur either concentrically about the same mid-point (e.g., Figure 3) or non-concentrically (e.g., DR384-5; Figure 9A). If the seamount has a mid-level terrace, but the terraces do not occur concentrically (N = 1; Figure 10C) then the terrace may not be erosional. The most obvious example of non-concentric terracing is in the Fernandina region, where multiple overlapping flat-topped seamounts are built on a slope producing series of steps (e.g., DR384-5; Figure 9A). Seamounts with this morphology have been observed on the flanks of Hawaii at depths where there is no evidence for exposure (e.g., Clague et al., 2000). In addition, prevalent intact pillow lavas are observed on the Fernandina seamounts (e.g., Figure 9C), which are deeper than 600 m. These observations, as opposed to observations indicating coastal exposure, make sense, as it would be unreasonable to infer more than 500 m of subsidence for these seamounts, given their close proximity to the hotspot center.
If the mid-level terraces are predominately concentric about the summit of the seamount, then this provides evidence that the seamount has likely been affected by coastal erosional processes, such as the formation of insular shelves (N = 23; Quartau et al., 2010, 2014, 2015, 2016; Ramalho et al., 2013). This claim is supported unanimously by our training data set, where all seamounts with multiple, concentric terraces show direct seafloor evidence for modification by erosion near to the sea surface (Table 1). Based on the lack of false positives, we conclude that the presence of multiple concentric terraces alone is enough to positively identify a seamount as being modified by coastal processes. Of note however, all seamounts but one that we observed with mid-level terraces are also accompanied by concave-in scalloped flanks and irregular summit shapes (e.g., Figures 4C, 5, 6, 8). These observations could be used in tandem to strengthen the identification of erosional seamounts. However, we choose to end classification of these erosional seamounts at this stage because this further classification would require additional manual discrimination (e.g., summit shape), which may result in errors (Figure 10C).
After applying our classification to all of the newly mapped seamounts, and including those that we directly observed by HOV, we are able to positively identify 30 of the 74 as having erosional characteristics. This constitutes ~90% of all terraced seamounts (N = 34) in the study region. It would be expected that terraces formed from constructional processes should be randomly distributed about the depths within the seamount footprints, and correlated only with the summit heights of the seamounts. Although the data is sparse, this is what is observed at Fernandina (Figure 9B). In this region, there are no preferential depths of terraces, which support the interpretation that they are formed by constructional processes. By contrast, terraces formed through erosional processes should be clustered at similar water depths (i.e., paleo-sea level) and independent of seamount depths. This is observed in terrace depth distributions in both the Santiago and Floreana regions, which show prominent peaks in terrace depth and are skewed toward much shallower depths compared to seamount depth distributions (Figures 4B, 7B).
Discussion
Seamount Exposures and Terrace Formation During the Last Glacial Maximum
Early observations of features created by island vertical motions combined with sea-level fluctuations were identified in echosounder profiles of guyots and seamounts and coupled with observations of beach cobbles and gravels at the summits of these features (e.g., Carsola and Dietz, 1952; Schwartz, 1972; Lambeck, 1984). Similar terraces have been mapped on the upper 200 m of continental shelves in echosounder profiles, with the prevalence of terraces at a given depth taken to reflect the relative duration of stillstands at that level (e.g., Pratt and Dill, 1974; Wagle et al., 1994). However, uncertainty in sea level fluctuations at the time of these studies limited the appeal of using submarine terraces for reconstructing subsidence rates and/or sea level given the known instability of the oceanic lithosphere, foundering due to thermal contraction with time, and ambiguities arising from primary volcanic terraces (e.g., Chaytor et al., 2007). With established paleo-sea level reconstructions for the past 1,000 ka (e.g., Bintanja et al., 2005) along with improved dating methods and models of subsidence, this approach has been revisited (e.g., Kim et al., 2013; Romagnoli et al., 2018).
Sea-level curves for the past 500 ka have been well established from multiple methods and in various ocean basins (e.g., Shackleton, 1987; Siddall et al., 2003). This record has recently been extended to 1,000 ka by coupling sediment core and ice volume models (Bintanja et al., 2005). Over this interval there have been at least eight glacial and interglacial cycles, which have resulted in sea level lowstands comparable to that of the last glacial maximum (>100 m; Figure 11). Depth of shelf edge below −130 m has also been used by Quartau et al. (2014, 2015, 2016) to infer subsidence rates assuming that insular shelves formed immediately after the end of the volcanic phase and subsided afterwards. For ocean island systems that have not experienced uplift, we hypothesize that terraces formed during these lowstands and were preserved on seamounts by removal from wave action due to subsidence. We visited 10 seamounts with summit depths < 130 m and all show evidence for exposure at the sea surface. Further, five seamounts with summit depths of 130–300 m show evidence for exposure. These features include rounded beach cobbles that range in size from decimeter to meter scale. Thinly bedded deposits, which appear to be primarily pyroclastic in origin (Figures 5D, 8C), are observed at depths up to but no deeper than 300 m. Bedrock textures on summit terraces include smoothed lava flow surfaces (Figure 6B) and shorter wavelength undulating surfaces and cavities (Figures 5B,C). These are likely secondary textures due to abrasion at or within tens of meters of the sea surface (e.g., Santos et al., 2010; Romagnoli and Jakobsson, 2015). However, we assert that erosive conditions tend to be most vigorous at the sea surface (Quartau et al., 2010; Ramalho et al., 2013), and decrease significantly at depths greater than 20 m for rocky surfaces. These combined observations confirm that these terrace surfaces now 20–300 m deep must have once been at or near the sea surface.
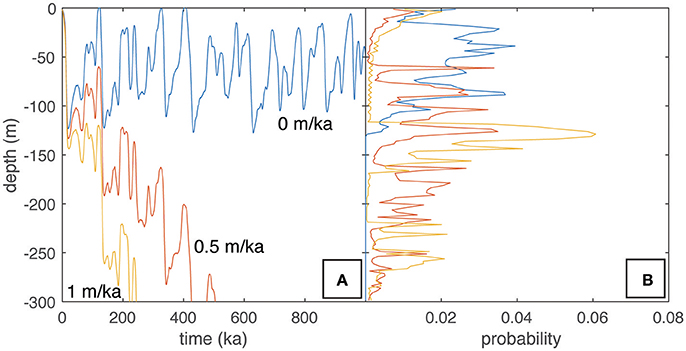
Figure 11. Examples of subsidence normalized sea level depth integrations. (A) Sea level as a function of time for the past 1,000 ka. Blue curve shows sea level assuming no subsidence (Bintanja et al., 2005). Red curve shows the same sea level data adjusted for a subsidence rate of 0.5 m/ka, representing relative sea level change at this rate. Orange curve shows the same sea level data adjusted for a subsidence rate of 1 m/ka, representing relative sea level change at this rate. (B) Probability distributions representing the time integrated durations of sea level at all depths for each subsidence rate. Colors shown as defined in (A).
The intersection of a seamount and the sea surface produces erosional terraces, the depth of these terraces is dependent on the vertical motions of the seamount (e.g., uplift, subsidence) and sea level changes since formation. In the absence of major vertical movements and on islands that have experienced at least one glacial/interglacial eustatic cycle, terrace depths should range from present sea level up to 120 m water depth (Quartau et al., 2010), assuming that similar eustatic conditions existed in the Galápagos. Thus, seamounts with terraces at these depths were present during the LGM at ~20 ka and have likely only experienced minor subsidence or uplift since that time. There is a prevalent peak in the number of terraces at both Santiago (Figure 4B) and Floreana (Figure 7B) around the depth of sea level during the LGM. These LGM terraces are nearly all associated with directly observed erosional features.
For terraces and erosional features at depths > 130 m, seamounts must be older than 20 ka and must have subsided since their exposure at the sea surface (Quartau et al., 2014, 2015, 2016). From the lack of terraces above 120 m water depth, despite the presence of numerous seamounts within that depth range, the formation of a terrace during a non-lowstand is much less prevalent (Figures 4B, 7B). This is most likely due to greater rates of sea level change (i.e., lack of stillstands) during non-lowstand periods. Nevertheless, it is reasonable to assume that erosional terraces occurring at depths > 130 m have either been exposed during earlier sea level still or lowstands and have been subsequently transported to their present depths. Evaluating the mechanism and timing of terrace formation for terraces deeper than 130 m will be discussed in the following section.
Evaluating Subsidence Rates and Paleogeography
Since Darwin's visit to the Galápagos in 1835, the archipelago has played a pivotal role in forming and testing the theory of evolution by natural selection (e.g., Darwin, 1859; Ali and Aitchison, 2014). The archipelago is in a geographical nexus ~1,000 km west of South America, which effectively isolates it from most biologic communication with the continental landmass, but is close enough to enable colonization by non-aquatic, non-volant vertebrates (e.g., Wyles and Sarich, 1983; Rassmann, 1997; Caccone et al., 2002). The Galápagos Islands are also far enough apart to isolate species and promote endemism (e.g., Ricklefs and Bermingham, 2007). Recent evolutionary models have been proposed that link speciation events with glacial maxima where, at extreme sea level lowstands, the islands have presumably been connected, allowing cross-colonization (e.g., Ali and Aitchison, 2014). However, sea level oscillations over the past 1,000 ka alone (< 130 m; Bintanja et al., 2005) cannot explain speciation trends between all of the major islands in the Galápagos that are separated by submarine bridges, which are presently > 300 m below sea level (Figure 1A).
We have confirmed the presence of erosional terraces at depths of 290 m through direct observations of beach cobbles and secondary bedrock morphologies, indicative of abrasion driven erosion by wave action (Figure 8B; e.g., Ramalho et al., 2013). We have expanded the observation of these terraces beyond those visited by HOV to include all terraces with similar morphologies (Figures 4C, 10). From this dataset it is clear that there are several depth ranges with significant terrace abundances that are deeper than sea level has reached in the past 1,000 ka. It is hypothesized that terrace width should be proportional to the duration of wave base erosion at a given depth (e.g., Pratt and Dill, 1974; Menard, 1983; Quartau et al., 2010). For any subsiding archipelago this duration is a function of the sea-level curve as well as the subsidence rate. Thus, with terraces present at the appropriate depths, within the range of predicted sea level variations, the distribution of the terraces provides an independent means by which to test proposed subsidence rates in the Galápagos. The appropriate depth range will be different for all archipelagos, and requires the formation and transport of seamounts for some duration of time appropriate for the subsidence rate. In summary, to relate the terrace distribution on seamounts to subsidence, seamounts must be produced somewhat continuously at the appropriate depth range in order to have a record of these processes.
Based on the emergence ages of Santiago (1 Ma), Santa Cruz and Floreana (2.3 Ma) and the range of ages of lavas on those islands we predict that the seamounts are also on the order of 1 Ma (Geist et al., 2014). Further, we assume that individual seamounts were produced over a relatively short time period, and thus have not been “repaved” and represent unobscured records of exposure since their formation (Schwartz et al., 2018). Assuming an average subsidence rate of 0.4 m/ka, which is the inferred value for the Galápagos in the vicinity of the seamounts (Geist et al., 2014) we predict that the oldest (~1 Ma) and thus deepest possible terraced seamounts, which may have formed during sea level lowstands of ~100 m could now have terraces at depths of ~600 m. Terraces that we positively identify as erosional range in depth from 0 to 300 m. This depth range is half that of the maximum expected depth range for terraces and thus should provide sufficient information on subsidence rates over at least the past 500 ka. Since we do not have independent age control on any of the erosional terraces we suggest that by using the combined seamount terrace depth distribution we should be able to assess subsidence rates.
In order to assess subsidence rates we have combined all bathymetric data within the seamount footprints, which have been positively identified as erosional (Figure 10) and determined the relative proportion of data with slopes < 5° at all depths as a proxy for the terrace distribution (Figure 3). Although the subsidence rates vary spatially over the archipelago, we assert that the study areas are aligned almost perpendicular to plate motion and have correspondingly similar emergence ages (Geist et al., 2014), so have similar loading histories. Moreover, the submarine platform that underlies Santiago and Floreana makes up a majority of the erupted volume of the archipelago is likely the largest contribution to the gravitational load and was presumably constructed simultaneously for both regions (Geist et al., 2008). We evaluate the subsidence modified sea-level curve that best reproduces the observed terrace distributions (Figure 11). This is done by comparing the terrace depth distribution to sea level depth distributions, which are first offset at a constant rate between 0 and 1 m/ka, which is reasonable for the archipelago of 1–2 Ma in age (Figure 12; Geist et al., 2014). These depth distributions are then time integrated to represent the probability that sea level has reached a given depth over the past 1 Ma. Similarity between the actual terrace depth distribution and that predicted from sea level history with an imposed subsidence rate are assessed using the Kullback-Leibler Divergence (DKL), which is a metric for assessing the amount of information that is lost by substituting the terrace distribution for the subsidence adjusted sea-level curve at each subsidence rate (Figures 12A,B). The lowest DKL is attained when the substituted distribution most closely matches that of the original distribution. The DKL is calculated from the following equation:
where x is depth in 1 m intervals, p(x) is the terrace depth distribution and q(x) is the distribution produced by the integration of the sea-level curve. We discretize depth in 1 m intervals. The summation is an approximation of the integral definition of the DKL (see MacKay (2003) for more details). In addition to the DKL we compare the cumulative density functions for the subsidence-corrected sea level distributions and terrace distributions using a Kilinogorov-Smirnov (k-s test), using the MATLAB function kstest2 to assess the similarity of the curves. The k-s test provides a p-value, which indicates the similarity of the curves; a p-value > 0.05 indicates that the curves are indistinguishable at the 95% confidence interval (Figures 12A,C). From the DKL for each subsidence rate there is a clear trend and minima at 0.2 m/ka. Similarly, the results from the k-s test indicate that the two cumulative probability density curves are indistinguishable between 0.2 and 0.4 m/ka. These subsidence rates are slightly lower than, but on the same order as estimates by other researchers (0.4–0.5 m/ka; Geist et al., 2014).
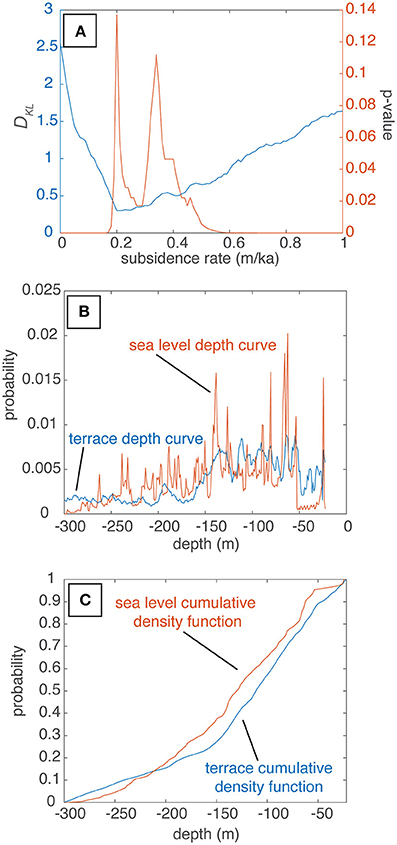
Figure 12. Comparison of sea level data with terrace depths at various subsidence rates. (A) Kullback-Leibler Divergence (DKL; blue line) and k-s test (red line) results comparing terrace to sea level distributions adjusted by subsidence rates between 0 and 1 m/ka. The minimum DKL between the two distributions is 0.2 m/ka, and the cumulative distribution function of the curves are indistinguishable at the 2-sigma confidence interval between about 0.2 and 0.4 m/ka. (B) Comparison of probability density functions for terrace distribution (blue line) and time integrated sea level distribution adjusted for a subsidence rate of 0.2 m/ka (red line) used for calculating the DKL. (C) Comparison of cumulative density functions for terrace distribution (blue line) and time integrated sea level distribution adjusted for a subsidence rate of 0.2 m/ka (red line) used for performing the k-s test.
Our calculated rate of subsidence of 0.2 m/ka is an order of magnitude faster than what is predicted for transport beyond a hotspot swell similar to that of Hawaii for young lithosphere (0.04 m/ka; Detrick and Crough, 1978), thus is more likely due to loading or aging of the underlying lithosphere. The subsidence rates are nearly identical to those determined for Ascension Island near the Mid-Atlantic Ridge (0.3 m/ka; Minshull et al., 2010), which is on similarly aged lithosphere (~6–10 Ma; Minshull and Brozena, 1997; Villagómez et al., 2007), and of approximately the same age (2–3 Ma; Minshull et al., 2010) as the islands of Floreana and Santiago. Minshull et al. (2010) invoke viscoelastic relaxation in response to loading of the volcanic edifice as the only mechanism able to produce the observed subsidence rates. Given that we only observe 200 m of subsidence in our dataset, it is possible that elastic loading (110 m; Minshull et al., 2010), and/or cooling of the lithosphere away from the Galápagos spreading center over the past 2 Ma (e.g., Marty and Cazenave, 1989) could together produce the observed subsidence (~150 m; Kane and Hayes, 1994). It is out of the scope of this study to determine the mechanisms of subsidence, but it seems likely that volcanic loading is important in the evolution of the Galápagos Archipelago.
We have mapped the area that would be exposed at two time intervals based on the sea-level curves of Bintanja et al. (2005) modified using our derived subsidence rates. Land between Isabela and Santa Cruz could be connected as early as the LGM (Figure 13A), but additional mapping is needed to prove this given that significant changes may have occurred in island volume due to volcanic activity over the past 20 ka. Further, given the current data, we have provided evidence that the central Galápagos Archipelago areas that are now at 290 m water depth were in the past at < 130 m water depth. This evidence includes rounded cobbles atop a terrace at that depth in the Floreana region (Figure 8) and seamounts with scalloped upper flanks and terraces resembling those exposed during the last glacial maximum in the Santiago region (Figure 4C). We estimate based on the range of subsidence rates that we determined (0.2–0.4 m/ka) that at 435–900 ka, these surfaces were at sea level during the lowstands (Figure 13B). Using the previously accepted value of 0.5 m/ka (Geist et al., 2014), these terraces were at lowstand sea levels of ~130 m water depth at 350 ka. During sea level lowstands in this time period it is conceivable that all islands in the central archipelago could be connected by present day bathymetric highs. This prediction hinges on limited modification of the potential bridges due to sedimentation, which at this point cannot be determined due to the lack of seismic data in the Galápagos. Future work should be targeted toward these drowned land bridges in search of evidence for their exposure history to confirm this speculation and search for evidence of deeper features that show evidence for exposure at the sea surface. These observations would provide a means to more rigorously assess the spatial and temporal variations in subsidence rate across the archipelago. Further, direct dating of terraces through micropaleontology or dating of sparse carbonates buried by beach cobbles on the deepest terraces may provide further age-depth relationships.
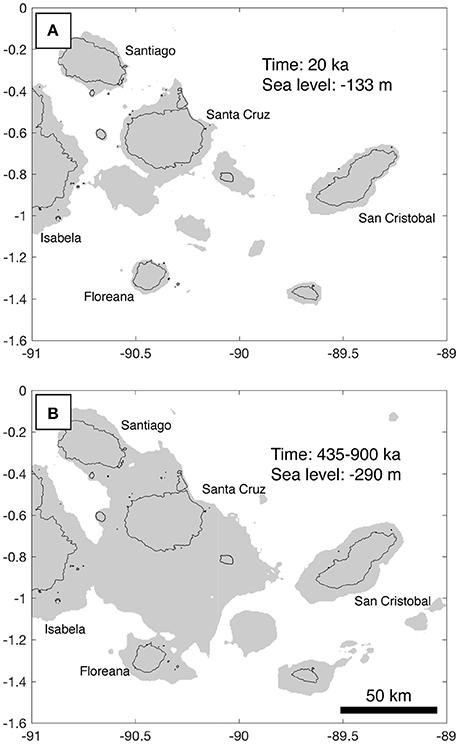
Figure 13. (A) Map of the central Galápagos Archipelago during the last glacial maximum assuming a subsidence rate of 0.2 m/ka. Black lines show modern shorelines. Gray area shows exposed areas adjusted for the combined sea level change and subsidence. (B) Map of the central Galápagos Archipelago that was emerged based on the max depth that rounded cobbles on erosional terraces were observed (290 m; Figure 8B). Black lines show modern shorelines. Gray area shows exposed areas adjusted for the combined sea level change and subsidence. Based on our best-fit subsidence rates of 0.2 to 0.4 m/ka this paleo-topography was first possible between 435 and 900 ka.
Conclusion
Through direct seafloor observations of seamounts and correlation with bathymetric data we have confirmed that the modern archipelago has experienced significant subsidence over the past ~1 Ma. We observed rounded cobbles and boulders in addition to other bedrock features, which we interpret to represent exposure of many seamounts at the sea surface. Bathymetric features, including submarine terraces, are correlated with direct seafloor observations of erosional features, which we use to create a framework to identify seamounts, which have experienced exposure at the sea surface. Seamounts with rounded cobble deposits and with similar morphologic features are observed to depths of 300 m in both the Santiago and Floreana regions. These are the first direct observations that indicate all islands in the central archipelago have subsided around ~200 m and could have been at least intermittently connected in the past. Without independent age data on the seamount terraces we are able to use their distribution and established sea-level curves to assess subsidence rates, and thus obtain approximate timing of potential inter-island connections. The comparison of these distributions leads us to conclude that since the formation of the seamounts the archipelago has been subsiding between 0.2 and 0.4 m/ka. We infer from these subsidence rates that the deepest observed terraces were formed between 435 and 900 ka during or within close proximity to lowstands. Extending this record to greater depths (and ages), will impact the interpretation of inter-island migration and speciation in the Galápagos. Combined seafloor observation and use of seamount terrace depth distributions have the potential to provide a more complete and robust understanding of paleogeography in ocean island systems. As the resolution of the timing and nature of sea level fluctuations increases, the interpretations resulting from terrace depth distributions on seamounts will only improve.
Author Contributions
All authors aided in the collection of shipboard data including submersible observations, video, rock samples and bathymetric mapping. DS conducted the primary data analysis and prepared the manuscript. SS contributed to the design of the study, facilitated shipboard and on-land data processing for bathymetric data, and aided in the preparation of the manuscript. VW contributed to the design of the study and aided in the preparation of the manuscript. MJ processed a majority of the shipboard bathymetric data and aided in the preparation of the manuscript.
Funding
This project was carried out with financial support from the NSF (OCE-1634685 to SS and OCE-1634952 to VW) and the Dalio Explore Fund.
Conflict of Interest Statement
The authors declare that the research was conducted in the absence of any commercial or financial relationships that could be construed as a potential conflict of interest.
Acknowledgments
We would first like to thank the captain and crew of the M/V Alucia for their hard work during the cruise upon which the data for this project were acquired. Further, we would like to acknowledge the skilled HOV pilots for their dedication to the safety and success of the dive operations over the course of the cruise. We acknowledge the Galápagos National Park directorate for permission to map and collect submarine rock samples (PC-44-15), and our colleagues at the Charles Darwin Foundation for facilitating scientific collaboration in the Galápagos. We are grateful to the Government of Ecuador and INOCAR for permission to operate in their territorial waters and marine protected areas. We thank Dan Fornari, Mark Richards, Pelayo Salinas de León for their assistance in data acquisition and scientific input on the cruise, as well as Hannah Bercovici for assistance with rock sample preparation and data processing. We appreciate Neil Mitchell, Rui Quartau and Daneiele Casalbore for their detailed and thoughtful reviews, which greatly improved the manuscript.
Supplementary Material
The Supplementary Material for this article can be found online at: https://www.frontiersin.org/articles/10.3389/feart.2018.00088/full#supplementary-material
References
Ali, J. R., and Aitchison, J. C. (2014). Exploring the combined role of eustasy and oceanic island thermal subsidence in shaping biodiversity on the Galápagos. J. Biogeogr. 41, 1227–1241. doi: 10.1111/jbi.12313
Allan, J. F., and Simkin, T. (2000). Fernandina volcano's evolved, well-mixed basalts: Mineralogical and petrological constraints on the nature of the Galápagos plume. J. Geophys. Res. 105, 6017–6041. doi: 10.1029/1999JB900417
Bintanja, R., van de Wal, R. S. W., and Oerlemans, J. (2005). Modelled atmospheric temperatures and global sea levels over the past million years. Nature 437, 125–128. doi: 10.1038/nature03975
Bohnenstiehl, D. R., Howell, J. K., White, S. M., and Hey, R. N. (2012). A modified basal outlining algorithm for identifying topographic highs from gridded elevation data, Part 1: motivation and methods. Comput. Geosci. 49, 308–314. doi: 10.1016/j.cageo.2012.04.023
Caccone, A., Gentile, G., Gibbs, J. P., Fritts, T. H., Snell, H. L., Betts, J., et al. (2002). Phylogeography and History of Giant Galapagos Tortoises. Evolution 56, 2052–2066. Available online at: http://www.jstor.org/stable/3094648
Campbell, J. F. (1984). Rapid subsidence of Kohala Volcano and its effect on coral reef growth. Geo Mar. Lett. 4, 31–36. doi: 10.1007/BF02237971
Carey, S., Fisher, C. R., de Leon, P. S., Roman, C., Raineault, N. A., Suarez, J., et al. (2016). Exploring the undersea world of the Galápagos Islands. Ocean. Mag. 29, 32–34.
Carsola, A. J., and Dietz, R. S. (1952). Submarine geology of two flat-topped northeast Pacific seamounts. Am. J. Sci. 250, 481–497. doi: 10.2475/ajs.250.7.481
Cas, R. A. F. (1992). Submarine volcanism: eruption styles, products, and relevance to understanding the host-rock successions to volcanic-hosted massive sulfide deposits. Econ. Geol. 87, 511–541. doi: 10.2113/gsecongeo.87.3.511
Casalbore, D. (2018). Volcanic Islands and Seamounts. Submarine Geomorphology Springer Geology. Cham: Springer, 333–347.
Casalbore, D., Falese, F., Martorelli, E., Romagnoli, C., and Chiocci, F. L. (2017). Submarine depositional terraces in the Tyrrhenian Sea as a proxy for paleo-sea level reconstruction: problems and perspective. Quat. Int. 439, 169–180. doi: 10.1016/j.quaint.2016.02.027
Casalbore, D., Romagnoli, C., Pimentel, A., Quartau, R., Casas, D., Ercilla, G., et al. (2015). Volcanic, tectonic and mass-wasting processes offshore Terceira Island (Azores) revealed by high-resolution seafloor mapping. Bull. Volcanol. 77:24. doi: 10.1007/s00445-015-0905-3
Chaytor, J. D., Keller, R. A., Duncan, R. A., and Dziak, R. P. (2007). Seamount morphology in the Bowie and Cobb hot spot trails, Gulf of Alaska. Geochem. Geophys. Geosyst. 8, 1–26. doi: 10.1029/2007GC001712
Christie, D. M., Duncan, R. A., McBirney, A. R., Richards, M. A., White, W. M., Harpp, K. S., et al. (1992). Drowned islands downstream from the Galápagos hotspot imply extended speciation times. Nature 355, 246–248. doi: 10.1038/355246a0
Clague, D. A., Moore, J. G., and Reynolds, J. R. (2000). Formation of submarine flat-topped volcanic cones in Hawai'i. Bull. Volcanol. 62, 214–233. doi: 10.1007/s004450000088
Couce, E., Ridgwell, A., and Hendy, E. J. (2012). Environmental controls on the global distribution of shallow-water coral reefs. J. Biogeogr. 39, 1508–1523. doi: 10.1111/j.1365-2699.2012.02706.x
Detrick, R. S., and Crough, S. T. (1978). Island subsidence, hot spots, and lithospheric thinning. J. Geophys. Res. Solid Earth 83, 1236–1244.
Geist, D. (1984). On the emergence and submergence of the Galápagos islands. Not. Galápagos 56, 5–9.
Geist, D., Diefenbach, B. A., Fornari, D. J., Kurz, M. D., Harpp, K., and Blusztajn, J. (2008). Construction of the Galápagos platform by large submarine volcanic terraces. Geochem. Geophys. Geosyst. 9, 1–27. doi: 10.1029/2007GC001795
Geist, D. J., Fornari, D. J., Kurz, M. D., Harpp, K. S., Adam Soule, S., Perfit, M. R., et al. (2006). Submarine Fernandina: Magmatism at the leading edge of the Galápagos hot spot. Geochem. Geophys. Geosyst. 7, 1–27. doi: 10.1029/2006GC001290
Geist, D., Snell, H., Snell, H., Goddard, C., and Kurz, M. D. (2014). A Paleogeographic Model of the Galápagos Islands and Biogeographical and Evolutionary Implications. Galápagos Nat. Lab. Earth Sci. Am. Geophys. Union, Washington DC, 145–166.
Harpp, K., and Geist, D. (2002). Wolf-Darwin lineament and plume-ridge interaction in northern Galápagos. Geochem. Geophys. Geosyst. 3, 1–19. doi: 10.1029/2002GC000370
Harpp, K. S., Fornari, D. J., Geist, D. J., and Kurz, M. D. (2003). Genovesa Submarine Ridge: A manifestation of plume-ridge interaction in the northern Galápagos Islands. Geochem. Geophys. Geosyst. 4, 1–27. doi: 10.1029/2003GC000531
Huppert, K. L., Royden, L. H., and Perron, J. T. (2015). Dominant influence of volcanic loading on vertical motions of the Hawaiian Islands. Earth Planet. Sci. Lett. 418, 149–171. doi: 10.1016/j.epsl.2015.02.027
Kane, K. A., and Hayes, D. E. (1994). A new relationship between subsidence rate and zero-age depth. J. Geophys. Res. Earth 99, 21759–21777. doi: 10.1029/94JB01747
Kim, G. B., Yoon, S. H., Sohn, Y. K., and Kwon, Y. K. (2013). Wave-planation surfaces in the mid-western East Sea (Sea of Japan): indicators of subsidence history and paleogeographic evolution of back-arc basin. Mar. Geol. 344, 65–81. doi: 10.1016/j.margeo.2013.07.008
Kleypas, J. A., Mcmanus, J. W., and Menez, L. A. B. (1999). Environmental limits to coral reef development : where do we draw the line? Am. Zoo. 39, 146–159. doi: 10.1093/icb/39.1.146
Kokelaar, B. P., and Durant, G. P. (1983). The submarine eruption and erosion of Surtla (Surtsey), Iceland. J. Volcanol. Geotherm. Res. 19, 239–246. doi: 10.1016/0377-0273(83)90112-9
Kurz, M. D., and Geist, D. (1999). Dynamics of the Galápagos hotspot from helium isotope geochemistry. Geochim. Cosmochim. Acta 63, 4139–4156. doi: 10.1016/S0016-7037(99)00314-2
Kurz, M. D., Rowland, S. K., Curtice, J., Saal, A. E., and Naumann, T. (2014). “Eruption rates for fernandina volcano: a new chronology at the galápagos hotspot center,” in The Galápagos: A Natural Laboratory for the Earth Sciences, eds K. S. Harpp, E. Mittelstaedt, N. d'Ozouville, and D. W. Graham (Washington, DC), 41–54. doi: 10.1002/9781118852538.ch4
Lambeck, K. (1984). Subsidence of a guyot west of Flores, Azores. Can. J. Earth Sci. 21, 960–963. doi: 10.1139/e84-100
Ludwig, K. R., Szabo, B. J., Moore, J. G., and Simmons, K. R. (1991). Crustal subsidence rates off Hawaii determined from 234U/238 ages of drowned coral reefs. Geology 19, 171–174. doi: 10.1130/0091-7613(1991)019<0171:CSROHD>2.3.CO;2
MacKay, D. J. C. (2003). Information Theory, Inference and Learning Algorithms. Cambridge: Cambridge University Press.
Marty, J. C., and Cazenave, A. (1989). Regional variations in subsidence rate of oceanic plates: a global analysis. Earth Planet. Sci. Lett. 94, 301–315. doi: 10.1016/0012-821X(89)90148-9
McBirney, A. R., and Williams, H. (1969). Geology and petrology of the Galápagos Islands. Geol. Soc. Am. Mem. 118, 1–197. doi: 10.1130/MEM118-p1
Menard, H. W. (1983). Insular erosion, isostasy, and subsidence. Science 220, 913–918. doi: 10.1126/science.220.4600.913
Menard, H. W., and Ladd, H. S. (1963). Oceanic islands, seamounts, guyots and atolls. Sea 3, 365–385.
Minshull, T. A., and Brozena, J. M. (1997). Gravity anomalies and flexure of the lithosphere at Ascension Island. Geophys. J. Int. 131, 347–360. doi: 10.1111/j.1365-246X.1997.tb01227.x
Minshull, T. A., Ishizuka, O., and Garcia-Castellanos, D. (2010). Long-term growth and subsidence of Ascension Island: constraints on the rheology of young oceanic lithosphere. Geophys. Res. Lett. 37, 3–7. doi: 10.1029/2010GL045112
Mitchell, N. C. (2001). Transition from circular to stellate forms of submarine volcanoes. J. Geophys. Res. Solid Earth 106, 1987–2003. doi: 10.1029/2000JB900263
Mitchell, N. C., Masson, D. G., Watts, A. B., Gee, M. J. R., and Urgeles, R. (2002). The morphology of the submarine flanks of volcanic ocean islands: a comparative study of the Canary and Hawaiian hotspot islands. J. Volcanol. Geotherm. Res. 115, 83–107. doi: 10.1016/S0377-0273(01)00310-9
Mitchell, N. C., Stretch, R., Oppenheimer, C., Kay, D., and Beier, C. (2012). Cone morphologies associated with shallow marine eruptions: east Pico Island, Azores. Bull. Volcanol. 74, 2289–2301. doi: 10.1007/s00445-012-0662-5
Mittelstaedt, E., Soule, S., Harpp, K., Fornari, D., McKee, C., Tivey, M., et al. (2012). Multiple expressions of plume-ridge interaction in the Galápagos: volcanic lineaments and ridge jumps. Geochem. Geophys. Geosyst. 13:Q05018. doi: 10.1029/2012GC004093
Moore, J. G. (1970). Relationship between subsidence and volcanic load, Hawaii. Bull. Volcanol. 34, 562–576. doi: 10.1007/BF02596771
Moore, J. G., Clague, D. A., and Normark, W. R. (1982). Diverse basalt types from Loihi seamount, Hawaii. Geology 10, 88–92. doi: 10.1130/0091-7613(1982)10<88:DBTFLS>2.0.CO;2
Moore, J. G., and Fornari, D. J. (1984). Drowned reefs as indicators of the rate of subsidence of the island of Hawaii. J. Geol. 92, 752–759. doi: 10.1086/628910
Naumann, T., and Geist, D. J. (2000). Volcano, Isabela Island, Galμpagos : implications for the development. Bull. Volcanol. 61, 497–514. doi: 10.1007/s004450050001
Passaro, S., Ferranti, L., and de Alteriis, G. (2011). The use of high-resolution elevation histograms for mapping submerged terraces: tests from the Eastern Tyrrhenian Sea and the Eastern Atlantic Ocean. Quat. Int. 232, 238–249. doi: 10.1016/j.quaint.2010.04.030
Pratt, R. M., and Dill, R. F. (1974). Deep eustatic terrace levels: Further speculations. Geology 2, 155–156. doi: 10.1130/0091-7613(1974)2<155:DETLFS>2.0.CO;2
Quartau, R., Hipólito, A., Romagnoli, C., Casalbore, D., Madeira, J., Tempera, F., et al. (2014). The morphology of insular shelves as a key for understanding the geological evolution of volcanic islands: insights from Terceira Island (Azores). Geochem. Geophys. Geosyst. 15, 1801–1826. doi: 10.1002/2014GC005248
Quartau, R., Madeira, J., Mitchell, N. C., Tempera, F., Silva, P. F., and Brandão, F. (2015). The insular shelves of the Faial-Pico Ridge: a morphological record of its geologic evolution (Azores archipelago). Geochem. Geophys. Geosyst. 16, 1401–1420. doi: 10.1002/2015GC005733
Quartau, R., Madeira, J., Mitchell, N. C., Tempera, F., Silva, P. F., and Brandão, F. (2016). Reply to comment by Marques et al. on “The insular shelves of the Faial-Pico Ridge (Azores archipelago): A morphological record of its evolution.” Geochem Geophys Geosyst. 17, 633–641. doi: 10.1002/2015GC006180
Quartau, R., Trenhaile, A. S., Mitchell, N. C., and Tempera, F. (2010). Development of volcanic insular shelves: insights from observations and modelling of Faial Island in the Azores Archipelago. Mar. Geol. 275, 66–83. doi: 10.1016/j.margeo.2010.04.008
Ramalho, R. S., Quartau, R., Trenhaile, A. S., Mitchell, N. C., Woodroffe, C. D., and Ávila, S. P. (2013). Coastal evolution on volcanic oceanic islands: a complex interplay between volcanism, erosion, sedimentation, sea-level change and biogenic production. Earth Sci. Rev. 127, 140–170. doi: 10.1016/j.earscirev.2013.10.007
Rassmann, K. (1997). Evolutionary age of the Galápagos iguanas predates the age of the present Galápagos Islands. Mol. Phylogenet. Evol. 7, 158–172. doi: 10.1006/mpev.1996.0386
Ricklefs, R. E., and Bermingham, E. (2007). The causes of evolutionary radiations in archipelagoes: passerine birds in the lesser antilles. Am. Nat. 169, 285–297. doi: 10.1086/510730
Romagnoli, C., Casalbore, D., Ricchi, A., Lucchi, F., Quartau, R., Bosman, A., et al. (2018). Morpho-bathymetric and seismo-stratigraphic analysis of the insular shelf of Salina (Aeolian archipelago) to unveil its Late-Quaternary geological evolution. Mar. Geol. 395, 133–151. doi: 10.1016/j.margeo.2017.10.003
Romagnoli, C., and Jakobsson, S. P. (2015). Post-eruptive morphological evolution of island volcanoes: surtsey as a modern case study. Geomorphology 250, 384–396. doi: 10.1016/j.geomorph.2015.09.016
Rubin, K. H., Fletcher, C. H., and Sherman, C. (2000). Fossiliferous Lana'i deposits formed by multiple events rather than a single giant tsunami. Nature 408, 675–681. doi: 10.1038/35047008
Santos, R. S., Tempera, F., Colaço, A., Cardigos, F., and Morato, T. (2010). Spotlight 11: Dom João de Castro Seamount. Oceanography 23, 200–201. doi: 10.5670/oceanog.2010.83
Schwartz, D. M., Wanless, V. D., Berg, R., Jones, M., Fornari, D. J., Soule, S. A., et al. (2018). Petrogenesis of alkalic seamounts on the Galápagos Platform. Deep Sea Res. Part II Top. Stud. Oceanogr. 150, 170–180. doi: 10.1016/j.dsr2.2017.09.019
Schwartz, M. (1972). Seamounts as sea-level indicators. Geol. Soc. Am. Bull. 83, 2975–2979. doi: 10.1130/0016-7606(1972)83[2975:SASI]2.0.CO;2
Shackleton, N. J. (1987). Oxygen isotopes, ice volume and sea level. Quat. Sci. Rev. 6, 183–190. doi: 10.1016/0277-3791(87)90003-5
Siddall, M., Rohling, E., Almogi-Labin, A., Hemleben, C., Meischner, D., Schmelzer, I., et al. (2003). Sea-level fluctuations during the last glacial cycle. Nature 423, 853–858. doi: 10.1038/nature01690
Sinton, C. W., Harpp, K. S., and Christie, D. M. (2014). A preliminary survey of the northeast seamounts, galápagos platform. Galápagos A Nat. Lab. Earth Sci. 335–362. doi: 10.1002/9781118852538.ch16
Smith, W. H. F., and Sandwell, D. T. (1997). Global sea floor topography from satellite altimetry and ship depth soundings. Science 277, 1956–1962. doi: 10.1126/science.277.5334.1956
Trenhaile, A. S. (2000). Modeling the development of wave-cut shore platforms. Mar. Geol. 166, 163–178. doi: 10.1016/S0025-3227(00)00013-X
Villagómez, D. R., Toomey, D. R., Geist, D. J., Hooft, E. E. E., and Solomon, S. C. (2014). Mantle flow and multistage melting beneath the Galápagos hotspot revealed by seismic imaging. Nat. Geosci. 7, 151–156. doi: 10.1038/ngeo2062
Villagómez, D. R., Toomey, D. R., Hooft, E. E. E., and Solomon, S. C. (2007). Upper mantle structure beneath the Galápagos Archipelago from surface wave tomography. J. Geophys. Res. 112:B07303. doi: 10.1029/2006JB004672
Wagle, B. G., Vora, K. H., Karisiddaiah, S. M., Veerayya, M., and Almeida, F. (1994). Holocene submarine terraces on the western continental shelf of India; Implications for sea-level changes. Mar. Geol. 117, 207–225. doi: 10.1016/0025-3227(94)90016-7
Watts, A. B., and Ten Brink, U. S. (1989). Crustal structure, flexure, and subsidence history of the Hawaiian Islands. J. Geophys. Res. Solid Earth 94, 10473–10500. doi: 10.1029/JB094iB08p10473
Weatherall, P., Marks, K. M., Jakobsson, M., Schmitt, T., Tani, S., Arndt, J. E., et al. (2015). A new digital bathymetric map of the world's oceans. Earth Space Sci. 2, 331–345. doi: 10.1002/2015EA000107
Werner, R., Hoernle, K., Barckhausen, U., and Hauff, F. (2003). Geodynamic evolution of the Galápagos hot spot system (Central East Pacific) over the past 20 m.y.: Constraints from morphology, geochemistry, and magnetic anomalies. Geochem. Geophys. Geosyst. 4. doi: 10.1029/2003GC000576
White, W. M., McBirney, A. R., and Duncan, R. A. (1993). Petrology and geochemistry of the Galápagos Islands: Portrait of a pathological mantle plume. J. Geophys. Res. Solid Earth 98, 19533–19563. doi: 10.1029/93JB02018
Wyles, J. S., and Sarich, V. M. (1983). “Are the Galápagos iguanas older than the Galápagos? Molecular evolution and colonization models for the archipelago,” in Patterns of Evolution in Galapagos Organisms, eds R. I. Bowman, M. Berson, and A. E. Levinton (San Francisco, CA: American Association for the Advancement of Science, Pacific Division), 177–185.
Keywords: erosional terraces, paleogeography, hotspot, ocean island, multibeam bathymetry, wave erosion
Citation: Schwartz DM, Soule SA, Wanless VD and Jones MP (2018) Identification of Erosional Terraces on Seamounts: Implications for Interisland Connectivity and Subsidence in the Galápagos Archipelago. Front. Earth Sci. 6:88. doi: 10.3389/feart.2018.00088
Received: 03 February 2018; Accepted: 12 June 2018;
Published: 03 July 2018.
Edited by:
Ricardo S. Ramalho, Universidade de Lisboa, PortugalReviewed by:
Neil Mitchell, University of Manchester, United KingdomDaneiele Casalbore, Sapienza Università di Roma, Italy
Rui Quartau, Instituto Hidrográfico, Portugal
Copyright © 2018 Schwartz, Soule, Wanless and Jones. This is an open-access article distributed under the terms of the Creative Commons Attribution License (CC BY). The use, distribution or reproduction in other forums is permitted, provided the original author(s) and the copyright owner(s) are credited and that the original publication in this journal is cited, in accordance with accepted academic practice. No use, distribution or reproduction is permitted which does not comply with these terms.
*Correspondence: Darin M. Schwartz, ZGFyaW5zY2h3YXJ0ekBib2lzZXN0YXRlLmVkdQ==