 Susanne Seitz1*
 Benita Putlitz1*
 Lukas Baumgartner1
 Anders Meibom1,2Stéphane Escrig2
 Anne-Sophie Bouvier1
- 1Institute of Earth Sciences, University of Lausanne, Lausanne, Switzerland
- 2Laboratory for Biological Geochemistry, Federal School of Technology Lausanne, Lausanne, Switzerland
Textural and chemical differences in coeval rhyolitic effusive and explosive eruptions are commonly observed, and numerical models predict different timescales for the eruption of crystal-rich mushes versus crystal-poor magmas. We compare quartz zonation and diffusion timescales of crystal-rich rhyolitic ignimbrites and crystal-poor rhyolitic lava flows from the Jurassic Chon Aike Province exposed in Patagonia (Argentina). The timescales are assessed by using diffusion modeling based on nanoscale secondary ion mass spectrometry (NanoSIMS) analysis of titanium (Ti) concentration profiles in quartz crystals oriented by image analysis using micro-tomography. Quantitative Ti-data were acquired by SIMS to estimate crystallization temperatures. The textural and geochemical analysis revealed clear differences between crystal-poor rhyolitic lava flows and crystal-rich rhyolitic ignimbrites. Quartz crystals from rhyolitic lava flows display simple oscillatory cathodoluminescence (CL) zoning interpreted to be magmatic and diffusion chronometry suggest a short timescale for quartz crystallization from 5.6 ± 2.2 to 41.6 ± 9.8 years. Resorption textures are rare, and hence crystals in rhyolitic lava flows recorded a simple, rapid extraction, transport and eruption history for these crystal-poor melts. Rhyolitic ignimbrites, in contrast, reveal complex zoning patterns, reflecting several episodes of partial resorption and growth throughout their crystallization history. The complex quartz zoning textures together with longer diffusion times (<350 years), rather suggest a storage in a mush with fluctuating pressure and temperature conditions leading to intermittent resorption. Yet, a final quartz overgrowth rim occurred over a much shorter timescale in the order of years (<3 years). This implies, that crystal-rich mushes can be re-mobilized very fast, as fast as crystal-poor magmas. The use of in-situ methods with a high spatial resolution, like NanoSIMS, is critical to resolve very short magmatic timescales.
Introduction
The understanding of silicic volcanic systems is constantly evolving. Nevertheless, many important questions as to the nature of crustal magma storage, including magma chamber geometry and dynamics, the “trigger” of large eruptions and the time of magma accumulation before eruption are still under discussion. To explain the commonly observed textural and chemical differences in coeval rhyolitic effusive and explosive eruptions, many studies propose a crystal mush extraction model (Bachmann and Bergantz, 2004, 2008; Hildreth, 2004; Allan et al., 2013; Cooper and Wilson, 2014). This model postulates that crystal-rich intermediate to silicic rocks represent reactivated crystal mushes and crystal-poor silicic magmas represent the extracted interstitial melt. Numerical models predict different timescales on which crystal-rich mushes and crystal-poor magmas can be erupted (Huber et al., 2012), e.g., 100–1,000 years for crystal-rich mushes and a few years for crystal-poor magmas. These short times cannot be resolved with conventional, absolute dating techniques at present, despite the remarkable advances made in the last decade (Michel et al., 2008; Leuthold et al., 2012; Barboni and Schoene, 2014; Wotzlaw et al., 2014). Diffusion chronometry, on the other hand, has provided new insights into these very short timescales of volcanic processes. Compositional profiles across zoned crystals can be acquired and transformed into time estimates using known diffusion rates and estimates for magmatic temperatures. It is essential, however, to measure an element or isotope concentration profile with a spatial resolution that is significantly better than the characteristic diffusion length scale of the element in question (Saunders et al., 2014; Till et al., 2015; Seitz et al., 2016; Bradshaw and Kent, 2017). So far, the majority of studies used either grayscale profiles, which were acquired from backscattered secondary electron (BSE) and cathodoluminescence (CL) images, or element profiles measured by electron microprobe (EPMA). A non-exhaustive review of diffusion chronometry to explore the timescale of magma chamber rejuvenation prior to large-scale eruptions is given here (Table 1). See also the review by Cashman and Giordano (2014). The intriguing results of these recent studies are the short timescale they report with the implication that large volumes of silicic melt may accumulate over a short period of time, in centuries or less, and that late stage crystallization immediately prior to eruption may occur at even shorter timescale of decades, years or months (Turner and Costa, 2007). Examples come from the Bishop Tuff (USA), where the last magma recharge event supposedly occurred < 100–150 years before eruption (Ti diffusion in quartz; Wark et al., 2007; Chamberlain et al., 2014). Similar timescales (< 100 years; Ti, Sr, Mg diffusion in plagioclase) were found for the “Minoan” caldera-forming eruption of Santorini volcano (Greece) by Druitt et al. (2012). Studies from the Taupo Volcanic Zone (New Zealand) report slightly shorter timescales of 10–85 years (Ti diffusion in quartz, Saunders et al., 2010; Matthews et al., 2012) for the magma recharge event before eruption. Finally, with the application of high-spatial-resolution analysis by NanoSIMS, Till et al. (2015) suggested ~10 months (Sr, Ba, Mg diffusion in sanidine) for the rejuvenation of the rhyolitic lava of the Yellowstone caldera (USA). We presented NanoSIMS data for quartz crystals from rhyolites from Patagonia (Argentina), which indicated similar short time scales of the order of a few years (Seitz et al., 2016). Even shorter times of only 1–14 weeks (Mg-Fe diffusion in orthopyroxene) were found for the final recharge event of 1912 Novarupta-Katmai (Alaska) rhyolite eruption (Singer et al., 2016). Note, that the advances in new analytical techniques with a sub-micrometer spatial resolution, e.g., NanoSIMS, TOF-SIMS, and FEG-EPMA are crucial to these studies (e.g., Hellebrand et al., 2005; Charlier et al., 2012; Lloyd et al., 2014; Saunders et al., 2014; Ferry et al., 2015; Till et al., 2015; Seitz et al., 2016).
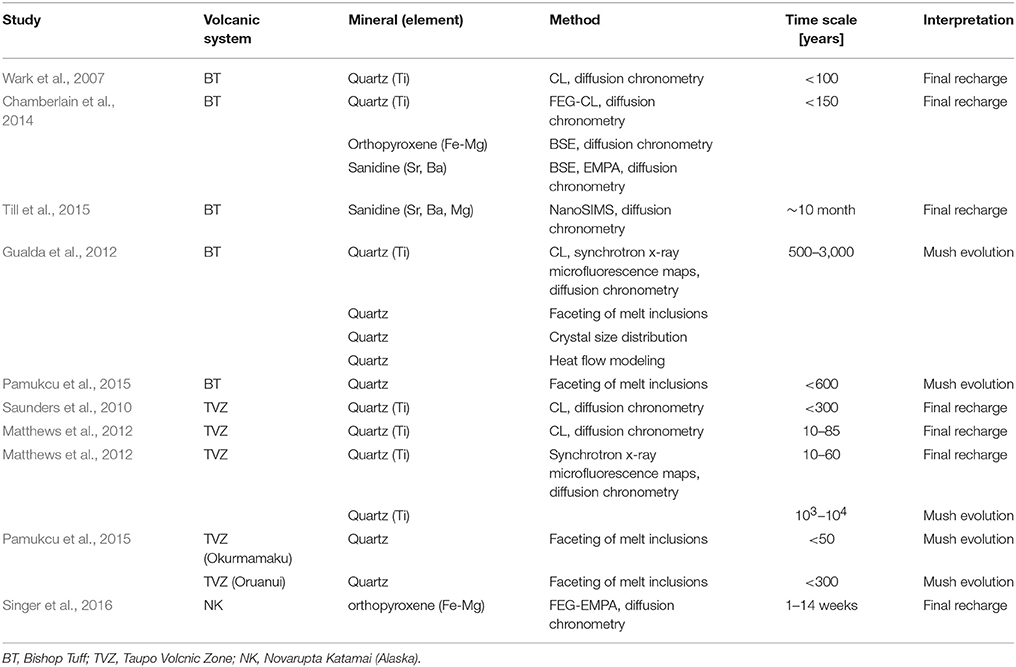
Table 1. Summary of magmatic timescales in silicic volcanic systems using diffusion chronometry.
Quartz is an important constituent in silicic systems. It resists alteration and it is often the best or only viable candidate for diffusion chronometry. Since the calibration of the Ti-in-quartz thermometer (Wark and Watson, 2006; see also Thomas et al., 2010; Huang and Audétat, 2012) and the experimental determination of the relevant diffusion parameters (Cherniak et al., 2007) quartz is thus increasingly used in diffusion studies. CL intensity in quartz has been shown to display a positive correlation with Ti-concentration (Wark and Spear, 2005). CL provides a practical method of observing Ti-zoning in quartz (Spear and Wark, 2009), and is now routinely used for textural analyses. Quartz often records a detailed growth history with small-scale zoning patterns, which can be linked to changes in temperature, pressure or chemistry of the magmatic system in response to processes such as magma recharge, mixing, assimilation or decompression (Streck, 2008). Nevertheless, other elements like aluminum for example, can also produce variation in CL intensity (Götze et al., 2001), making it imperative to prove that Ti is the sole element responsible for the CL pattern observed.
In this paper, we address the differences in estimated diffusion times and formation conditions between crystal-rich rhyolitic ignimbrites and crystal-poor rhyolitic lava flows. The studied silicic volcanic rocks belong to the Jurassic Chon Aike Province (Patagonia). The province, is one of the few silicic large igneous provinces, but so far, relatively little is known about magma storage conditions, magma extraction, and related timescales. This study provides novel results from well-characterized magmatic quartzes to highlight the difference between rhyolitic lava flows and rhyolitic ignimbrites based on systematic analyses of zoning textures as determined by CL. To determine diffusion timescales, we take advantage of the ultra-high spatial resolution of the NanoSIMS to obtain semi-quantitative Ti concentration profiles across quartz both from rhyolitic ignimbrites and rhyolitic lava flows. SIMS analyses complement the Ti-in-quartz analyses. We use those high-resolution Ti profiles in combination with petrographic arguments, rhyolite-MELTS modeling, and diffusion modeling to decode the archive stored in quartz.
Geological Setting
Chon Aike Province
The Chon Aike Province (Figure 1) is one of the world's largest silicic provinces (Pankhurst et al., 1998, 2000; Bryan et al., 2002) covering large parts of Patagonia and the Antarctic Peninsula. The volume is estimated at 235,000 km3 (Pankhurst et al., 1998). Volcanism occurred over about 40 Ma and partly coincides with the Karoo-Ferrar mafic magmatism. It is concentrated in three main volcanic episodes: the first episode (V1) occurred between 188 and 178 Ma, the second episode (V2) between 172 and 162 Ma and the third episode (V3) between 157 and 153 Ma (Pankhurst et al., 2000). Volcanism in Patagonia and Antarctic Peninsula developed in an overall extensional regime along the proto-Pacific margin of Gondwana during the initial stage of the continental break-up. The province has a bimodal composition, but is dominated by rhyolitic ignimbrites, which vary in their degree of welding from high-grade rheomorphic ignimbrites to volumetrically dominant non-welded lithic-rich ignimbrites. Intermediate compositions are rare (Pankhurst et al., 2000). Locally calderas could be identified as eruption centers (e.g., Aragón et al., 1996). The ignimbrites are intercalated with volumetrically less important rhyolitic lava flows and domes, fallout deposits, debris flow deposits and epiclastic deposits (e.g., Riley et al., 2010). In Patagonia, the province can be divided into two regions—eastern Patagonia and the Andean Cordillera. In eastern Patagonia, the ignimbrites are flat-lying and non-deformed. They overlie Precambrian to early Jurassic crystalline basement rocks and Lower Jurassic rift-related sediments. The narrow outcrops in the Andean Cordillera are locally deformed and tilted.
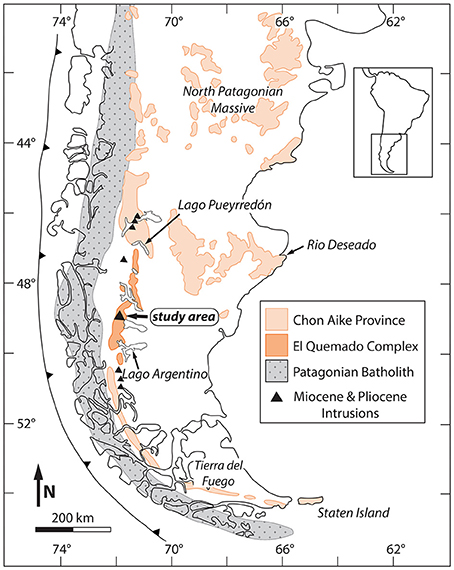
Figure 1. Map showing the main outcrop areas of the Jurassic Chon Ake Province and the El Quemado Complex in Patagonia. Also shown the Patagonian Batholith (after Pankhurst et al., 1998; Hervé et al., 2007; modified from Seitz et al., 2016). The study area is in the vicinity of the Fitz Roy Plutonic Complex, as indicated.
Study Area
Here we present data from the El Quemado Complex which was deposited during the V3 episode (Pankhurst et al., 2000; Fildani and Hessler, 2005). Outcrops of this formation cover a large area along the Patagonian Andes (Figure 1), from Lago Argentino in the south to Lago Pueyerredón in the North. The El Quemado Complex mainly consists of rhyolitic and dacitic ignimbrites, as well as air-fall tuffs intercalated with andesitic to rhyolitic lava flows, which overlie in some areas a basal breccia or conglomerate horizon (Llanos et al., 2003). The samples are from a small area (Figure 1) located around the Fitz Roy Plutonic Complex (Ramírez de Arellano et al., 2012), at the border between Chile and Argentina in Southern Patagonia.
We sampled km-size rhyolitic lava domes and flows (further referred to as flows). The several kilometer-long domes are build up from meters to tens of meter thick flows, locally intercalated with tuffs and breccia flows. The rhyolitic ignimbrites sampled (further referred to as ignimbrites) form meter to tens of meter thick units, which can be followed for several kilometers. No detailed maps exist at this point to fully estimate the instantaneous volumes erupted. Flows are folded together with the Cretaceous Rio Mayer Formation (Figure 2A). They preserved magmatic textures like flow banding and vesicles (Figure 2B). Samples come from three different localities (within a very restricted area). For sample localities see Supplementary Material. Figure 2A shows the Loma de las Pizarras ridge with two of the samples sites. Ignimbrites in the study area discordantly overly the Paleozoic clastic sequence of the Bahía de la Lancha Formation (Figure 2D). Ignimbrites can contain volcanic bombs and they often show lithic fragments and fiamme (Figure 2E). The investigated samples come from a single locality (Cerro Polo) as shown in Figure 2D.
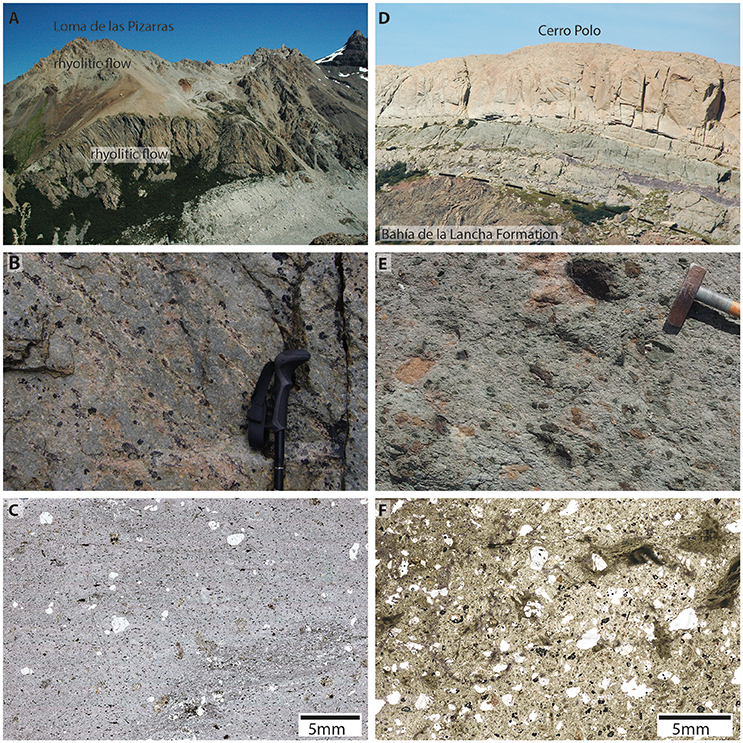
Figure 2. (A) View of the Loma de las Pizarras ridge showing the typical appearance of rhyolitic lava flows of the El Quemado Complex and the folded Cretaceous pelitic series. Sample rhyPN73 was taken from the outcrop building the top of the ridge, samples rhyB7 and rhyE5 come from the half-moon like outcrop forming the lower part of the ridge. (B) Rhyolitic lava flows typically preserved flow banding and vesicles. (C) Thin section image of a typical crystal-poor rhyolitic flow. (D) View of the Cerro Polo ridge with the multiple deposits of the Jurassic rhyolitic ignimbrites of the El Quemado Complex discordant overlying a Palaeozoic clastic sequence. Note trees for scale. The samples ignA5 and ignA6 were taken from the upper ignimbrite deposit. (E) Fiamme structures as often shown by the rhyolitic ignimbrites. (F) Thin section image of a typical crystal-rich rhyolitic ignimbrite.
Flows and ignimbrites are very similar with regard to their chemistry; they have a peraluminous character and a high silica content (75–82 wt% SiO2). They are distinct, however, in their crystal cargo. Flows are crystal-poor (4–10%) and ignimbrites are crystal-rich (25–40%; Figures 2C,F). The flows (Figures 2A–C) contain between 4 and 6% quartz and between 1 and 4% feldspar crystals in a very fine-grained matrix of quartz and feldspar interpreted to have been glass. Accessory minerals are biotite, zircon and secondary ilmenite. Some subhedral quartz crystals show embayments and contain recrystallized melt inclusions. Most quartz crystals show magmatic zoning, like oscillatory zoning, in CL images. Ignimbrites (Figures 2D–F) are crystal-rich and contain between 15 and 25% quartz and between 10 and 15% feldspar crystals in a very fine-grained matrix of quartz and feldspar. As accessory minerals biotite, zircon and secondary ilmenite occur. Quartz shows a greater variety in zoning patterns with oscillatory, normal and reverse zoning and internal dissolution textures. In total, we studied 261 quartz crystals from 16 samples of ignimbrites and flows by CL, SIMS, and NanoSIMS.
Analytical Methods
Sample Preparation Using X-ray Microtomography
All quartz samples for NanoSIMS analysis were cut perpendicular to the c-axis, as verified by X-ray micro-tomography at the Institute of Earth Sciences (University of Lausanne, Switzerland). See Skora et al. (2006) for additional details on the procedure. Before imaging, ~1.5 cm wide and ~3 cm long rock cores were marked with small saw cuts every millimeter. The rock cores were scanned for about 14–15 h with a SkyScan1173® instrument at the following conditions: 70 kV/140 nA or 80 kV/100 nA with a step size of 0.23° for a 360° rotation and a frame averaging of 40. For volume rendering and image analysis the SkyScan® software package was used. Finally, quartz crystals were chosen based on their shape and a 1 mm thick section of the rock core was cut a few tens of μm above the chosen crystal. The quartz crystals were then carefully extracted from the rock.
Several extracted quartz crystals were mounted together with a quartz standard grain (Audétat et al., 2014) for Ti analysis by SIMS in a 25 mm diameter epoxy mounts. The epoxy mounts were polished in several steps using a diamond paste with decreasing grain sizes, from 15 μm and to 0.5 μm until quartz cross-sections—corresponding to the central tomographic images—were exposed.
The CamScan MV2300 (Institute of Earth Sciences, University of Lausanne, Switzerland) was used in the panchromatic mode at an acceleration voltage of 20 kV to collected CL images of the crystal zoning. CL images have a resolution of 1,024 × 928 pixels.
Ti Concentration Measurements by SIMS
The Ti concentration was measured with the ion microprobe IMS 1280HR at the SwissSIMS laboratory (University of Lausanne, Switzerland). The sample surface, which was previously coated with a 40 nm thick layer of gold, was bombarded with an O− primary beam of 2 nA accelerated at 13 kV. The extracted secondary ions were accelerated at 10 kV into the mass spectrometer. Using the axial electron multiplier (EM) 30Si+ and 48Ti+ were analyzed on mono-collection mode, with the field aperture was set to 4,000 μm and the energy slit to 50 μm. To assure no interference from other masses with 30Si+ and 48Ti+ the entrance slit was closed to 61 μm and the exit slit to 405 μm.
Before each analysis, the sample surface was cleaned by a presputtering of 90 s using a raster beam of 40 μm. Just after the pre-sputtering and before each analysis, an automatic calibration on 30Si and centering of field aperture were made. Each analysis consists of 15 cycles of the peak-stepping sequence 30Si+ (2 s) and 48Ti+(10 s). The Ti count rate on the quartz standard (Audétat et al., 2014) was around 5.1 × 10³ counts/s. The background on the EM was less than 2 counts/h. The relative standard deviation for the runs typically varied between 2SD = 5% and 2SD = 10% on the quartz standard, which has a reported Ti concentration of 57 ± 4 ppm (Audétat et al., 2014).
High-Resolution Ti Analyses by NanoSIMS
High-resolution Ti profiles across the quartz crystals were obtained with the NanoSIMS 50L ion microprobe at the Center of Advanced Surface Analysis (CASA, Lausanne, Switzerland), by bombarding Au-coated (15 nm-thick layer) samples with a focused O− primary beam. Simultaneous collection of 30Si+ and 48Ti+ secondary ions with electron multipliers at a mass resolution of about 6,000, assured that any potential interference was eliminated. To remove the effect of local variation in the ionization and extraction processes, the data are reported as 48Ti/29Si ratio.
A two-step approach was used to quantify the relative change in titanium concentrations. First, a series of point analyses (Figure 7A) were obtained to identify the zones of interest, then high resolution line scans were made. The primary ion beam (beam current: 25 pA, beam size: 650 nm, 120 s pre-sputtering, 200 s data acquisition) was held stationary while the stage moved in 3 μm steps.
Second, high-resolution line scans (Figures 7b–v) were collected scanning continuously across the transitions identified by the point analysis data. Therefore, 30 × 30 to 60 × 60 μm images of the area of interest were first acquired (with a 256 × 256 pixel resolution) which helped to choose the precise location and orientation of the line scans using the NanoSIMS software. During 3 cycles (dwell time: 2 sec/pixel) a pre-sputtering was performed. The data were acquired (beam current: 23 pA, beam size: 650 nm, dwell time: 2 s/pixel) over 20 cycles and are reported as cumulated counts. The first 2.5 μm of each side of the scan were excluded to remove possible edge effects.
To identify any inclusions simultaneous measurements of 23Na and 27Al were performed. Spikes higher than 25% of the average variation in the 23Na+ and 27Al+ profile are considered as inclusions and the corresponding parts in the cumulated 48Ti+ profile are removed. Furthermore, we looked at each of the 20 cycles of the 48Ti+ profile to identify artifacts. Spikes higher than 25% of the average variation, which are not observed in all cycles are removed from the cumulated 48Ti+ profile. The absolute variations in the 48Ti/29Si ratio is entirely driven by variation in the 48Ti+ count rate (Figure 3).
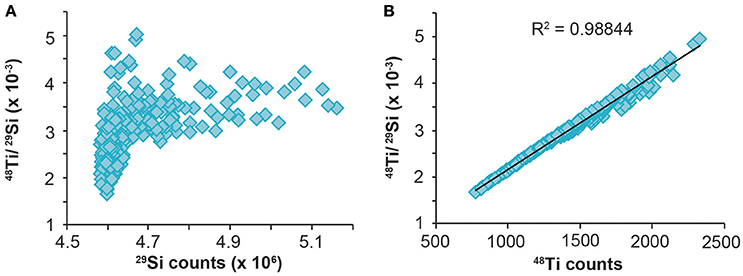
Figure 3. Plot of the 48Ti/29Si ratio vs. 29Si counts (A) and vs. 48Ti counts (B) of sample rhyPN73. There is no correlation between the 48Ti/29Si ratio and 29Si counts (A), but there is an excellent correlation between the 48Ti/29Si ratio and 48Ti counts (B). This demonstrates that the 48Ti/29Si ratio depends only on variations Ti concentration.
Modeling Parameters
An understanding of the geometry of the diffusion profiles is crucial. All profiles were measured perpendicular to the growth zoning and only cuts oriented perpendicular to the C-axis (and the zoning) were used. The following assumptions entered the diffusion calculations and fitting of the profiles: (1) each chemical zone is homogeneous at the beginning, with (2) a vertical interface between two zones, and (3) diffusion occurred only perpendicular to the interfaces. Diffusion coefficients were calculated by the Arrhenius relationship. We used the diffusion coefficient D0 = 7.01 × 10⁻⁸ m2/s, and the activation energy Ea = 273 ± 12 kJ/mol based on the diffusion experiments of Ti in quartz by Cherniak et al. (2007).
Profiles were normalized to the maximum value of each profile, before fitting error functions to the measured profiles using a weighted Marquardt fitting routine (Press et al., 1992). The uncertainty of the fits was estimated using residual χ2 of each profile and the uncertainty for each point estimated from the variation in the flat concentration parts adjacent to each profile. Uncertainties do not include those linked to the experimentally determined diffusion coefficient for Ti in quartz (Cherniak et al., 2007).
Results
Quartz Classification
Quartz crystals often record a complex growth history, which are linked to changes in temperature, pressure, magma chemistry, or growth velocity (see for example Wark et al., 2007; L'Heureux, 2013; Pamukcu et al., 2016). Those changes, in turn, are linked to different processes in a volcanic system, such as magma recharge, magma mixing or assimilation (Streck, 2008). Cathodoluminescence is an efficient way to visualize the history recorded in the magmatic zoning. We studied a total of 261 quartz crystals from 9 ignimbrites (nquartz = 150) and 7 flows (nquartz = 111). Based on the observed CL zoning pattern, we defined three classes (Figure 4).
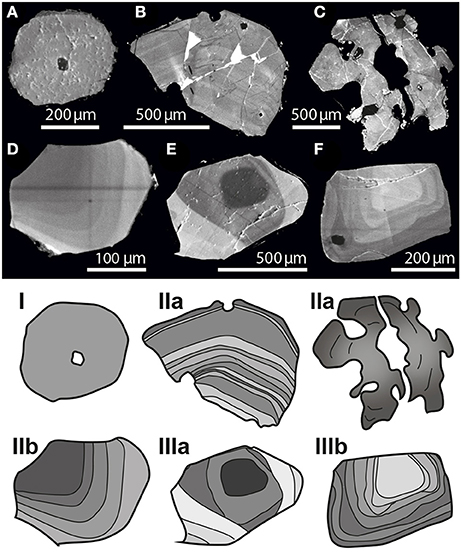
Figure 4. Representative quartz crystals from ignimbrites and flows on the top and the corresponding classification at the bottom. Quartz of type I show no visible zonation (A). Type II typically has embayment features (B–D) and recrystallized melt inclusions. It lacks internal dissolution textures and is either normally zoned (type IIa) or reversely zoned (type IIb). The crystals of type III show a clear zonation with internal dissolution textures (E + F), the rim might be zoned as well (E). Type III can be normally zoned (type IIIa) or reversely zoned (type IIIb).
Type I: These quartz crystals have no visible zonation (Figure 4A).
Type II: Quartz crystals are zoned but lack any indication of internal dissolution textures. Nevertheless, they commonly have embayment features (Figure 4C) emanating from the crystal surface, filled with recrystallized fined grained matrix interpreted to have been glass. Depending on the cut orientation, these embayments can be perceived as crystallized melt inclusions. They can either have light cores, with one or several darker rims (referred to as normally zoned, type IIa, Figures 4B,C), or they show reverse zonation (type IIb, Figure 4D), where a dark core is surrounded by several lighter rims.
Type III: Quartz crystals show clear internal dissolution textures, indicated by more or less complex intersecting zoning patterns. They are either normally (type IIIa, Figure 4E) or reversely (type IIIb, Figure 4F) zoned.
Quartz crystals from ignimbrites and flows show similar patterns, but the abundance of different quartz classes (Figure 5), especially the type III-zonation are significantly different.
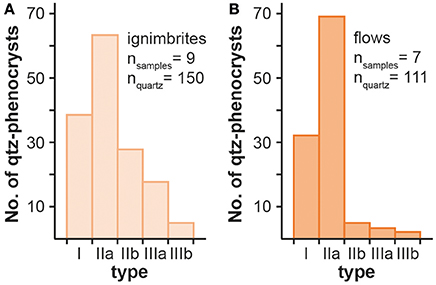
Figure 5. (A) Histogram of classification of quartz crystals from ignimbrites (9 samples, nquartz = 150). (B) Histogram of classification of quartz crystals from flows (7 samples, nquartz = 111). Note that type IIb, IIIa, and IIIb are almost not present in the flow samples.
Type IIa or normally zoned quartz crystals are the largest group in flows making up 62% of the population; type IIb represents only 4%. Embayment features of the crystal surface have been recognized in 40% of the quartz. Note that, just 5% of the quartz crystals in the flows belong to type III, i.e., are characterized by internal dissolution textures. Within the type III group we can further distinguish between: (a) crystals with embayment-like internal dissolution contacts, they contribute with 60% to this population, and (b) crystals with round cores; they make up 40% of the type III group.
Normally zoned (type IIa) crystals are dominant in ignimbrites as well; in addition, reversely zoned quartz crystals (type IIb) are important, making up 18% of the population. Embayment features at the crystal surfaces are less abundant in ignimbrites; they have been noted for 25% of all quartz crystals. Type III crystals are a notable quantity (15%) of the ignimbrite quartz population, a difference to flows (see above). Within the type III groups we recognize again (a) embayment-like internal dissolution contacts in 26% of the crystals and (b) round cores in 74% of the crystals. Note, that respective percentage (embayment vs. round) is distinct to flows.
Estimation of the Quartz Crystallization Temperature
Diffusion time estimates depend critically on the temperature-time history experienced by the crystal. Unfortunately, estimating temperatures for quartz growth is difficult for the rhyolitic flows, since no Ti-phases are present, making a direct application of Ti in quartz thermometry impossible without introducing arbitrary estimates on Ti activity (e.g., Wark and Watson, 2006). Below, we discuss alternative attempts to obtain temperatures. These include estimates using zircon saturation temperatures and temperatures estimated combining Ti-in-quartz thermometry and rhyolite-MELTS calculation (Gualda et al., 2012; Ghiorso and Gualda, 2015). Calculations are even more difficult for the ignimbrites, where we argue that most quartz crystals are ante- or even xenocrysts, making the melt composition elusive. A summary of all temperature estimates is given in Table 2. One should keep in mind that to calculate maximum diffusion times a minimum temperature for quartz crystallization should be used.
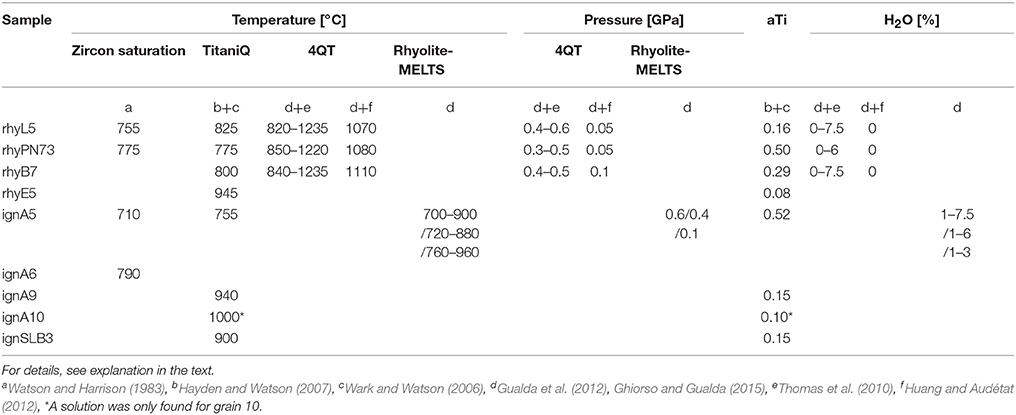
Table 2. Summary of temperature estimates based on zircon saturation, TitaniQ, 4vol%-quartz-temperature (4QT) and rhyolite-MELTS.
Zircon Saturation Temperature
We calculated the zircon saturation temperature using the zirconium (Zr) content of 29 whole rock analyses (Seitz, 2016) of ignimbrites and flows with the calibration of Watson and Harrison (1983). All samples have low Zr content between 60 ppm and 155 ppm. The Zr content for the samples discussed here are given in Table 3. The calculated temperatures vary between 710°C and 830°C. Zircons are small (<125 μm) and only two zircons from a flow preserved an inherited core. As argued by Miller et al. (2003), this indicates that the melt was Zr undersaturated during its formation, implying that the zircon saturation temperature represents a minimum estimate for melt generation. Hence quartz crystallization temperatures could be significantly higher. These temperatures are considered to be minimum values.
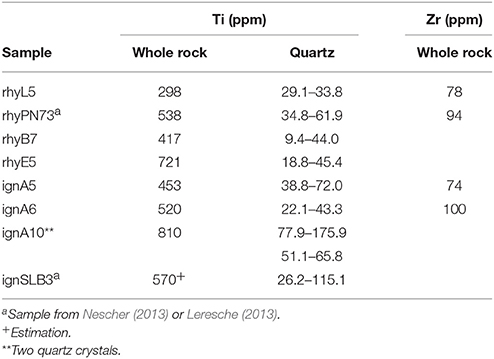
Table 3. Ti and Zr concentration for whole rock (XRF) and Ti concentration of quartz crystals (SIMS) from flows (rhy) and ignimbrites (ign) of the El Quemado Complex.
Ti-in-Quartz Thermometry Combined With Thermodynamic Estimates Based on the Whole Rock Ti-composition of Rhyolitic Flows
The Ti-activity is less than one in the flows, since no rutile is present. We attempted to estimate the Ti-activity in the melt using the measured Ti-content in flows and compare this to the rutile solubility values of Hayden and Watson (2007). We assumed an ideal mixing to calculate Ti activity (aTi). The Ti-concentrations are a good approximation for the Ti-content of the melt, because only minor amounts of quartz crystals (4–6%) are present. Ti concentrations of whole rocks range from 298 to 810 ppm, while those of quartz vary from 9 to 176 ppm (see Table 3). A simultaneous solution for the equilibration temperature was sought for the rutile activity, calculated with Ti-in-quartz thermometry (further referred to as TitaniQ) and the calculated rutile activity in the melt. This yields temperatures between 775°C and 945°C for the calibration of Wark and Watson (2006). The calculated activities of Ti in the melt varies between 0.08 and 0.50 for the flows (see Table 2). Neither the calibration of Wark and Watson (2006) for TitanQ, nor the rutile solubility of Hayden and Watson (2007) contain a pressure dependence. To investigate the sensitivity to pressure changes, we attempted to couple TitaniQ of Thomas et al. (2010) and Huang and Audétat (2012) with activities calculated from melts, using different pressures and water contents for the melts.
Ti-in-quartz thermometry can be combined with rhyolite-MELTS calculation (Gualda et al., 2012; Ghiorso and Gualda, 2015) to obtain temperature estimates. Whole rock geochemistry is given in the Supplementary Material. The results are given in Table 2. We again used the Ti-concentrations of the whole rock for the flows. Calculated Ti-activities will depend on pressure, water content and temperature. Hence the system is under-determined. Assuming the majority of the quartz crystals to be phenocrysts in the rhyolite flows, we can also use the modal abundance of quartz phenocrysts to further constrain these variables. In a first step the temperature was calculated corresponding to a crystallization of 4 vol% quartz (further referred to as 4QT) with rhyolite-MELTS as well as the Ti-activity (aTi). The obtained aTi was used for TitaniQ to calculate temperatures for the different calibrations (Thomas et al., 2010; Huang and Audétat, 2012). The solution for the equilibration temperature was sought by minimizing the difference between the temperature based on 4QT and TitaniQ (Figure 6).
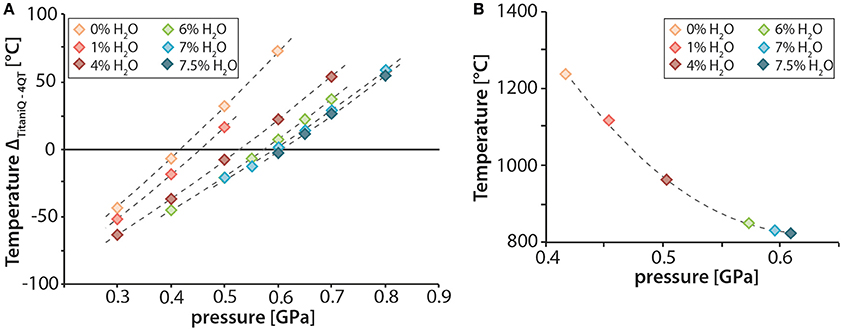
Figure 6. (A) Example for sample rhyL5 showing the differences between the temperature based on Ti-inquartz thermometry (calibration of Thomas et al., 2010) and rhyolite-MELTS (corresponding to crystallization of 4 vol% quartz) for different pressures and water contents in the rhyolitic melt. Ti-in-quartz thermometry and rhyolite-MELTS yield the same temperatures between 0.4 GPa and 0.6 GPa. (B) Corresponding equilibrium temperature for different pressures and water contents. For details, see explanations in the text.
Using the calibration for TitaniQ by Thomas et al. (2010) solutions were found between 1220°C and 850°C, 0.3 GPa and 0.5 GPa and a water content between 0 and 6% for sample rhyPN73 (Table 2) and between 1235°C and 820°C, 0.4–0.6 GPa and 0–7.5% H2O for sample rhyL5 (Figure 6). For sample rhyB7 temperatures were found between 840°C and 1235°C, with pressures of 0.4–0.6 GPa and 0–7.5% H2O. The calibration of Huang and Audétat (2012) yielded a narrow pressure range from 0.05 GPa to 0.1 GPa, and only for a water free melt yielding temperatures of 1080°C for sample rhyPN73, 1070°C for sample rhyL5 and 1110°C for sample rhyB7 (Table 2). Sample rhyE5 did not yield reliable results, as it shows late secondary alteration, notably replacement of the matrix by carbonate minerals. The minimum temperature of 820°C obtained from these calculations is about 50°C higher than the minimum temperature obtained for the zircon saturation. The two pressure sensitive calibrations yield a crystallization for quartz in two significantly different environments: either relatively deep (10–20 km) and hydrous at highly variable temperatures (between 820°C and 1235°C) depending on water content or very shallow (1.5–4 km) and dry in a narrow temperature range of 1070–1110°C. See below for an in-depth discussion of the consequences of these estimates.
Temperature Estimates for Rhyolitic Ignimbrites
A temperature estimate for the ignimbrites is more difficult as quartz crystals recorded multiple changes in the volcanic system and have likely seen different magmas during the evolution of the system. Quartz crystals commonly show internal dissolution textures; hence no information is recorded between the dissolution event and the overgrowth of a new quartz rim. As in all ignimbrite samples quartz crystals with various zonation textures are observed, it is clear that quartz crystals recorded complex magmatic histories, involving a changing magma system. In fact, the crystal charge in the ignimbrites precludes using whole rock composition to repeat the above calculations, and none of the ignimbrites has glass shards preserved, which could be used to estimate the composition of a remobilizing magma. Therefore, a temperature estimate based on TitaniQ and melt aTi is not a reliable approximation for the ignimbrites.
In light of this point, we estimate the minimum temperature based on rheological arguments. At a crystallinity of 50% it is unlikely that the magma would be erupted (Bachmann and Bergantz, 2008). We calculated the temperature that correspond to a 50% crystallinity threshold using rhyolite-MELTS. This estimate depends on the pressure and the water content of the melt. We obtained a temperature of about 700°C at 0.6 GPa for a water saturated melt (7.5% water). For a low water content in the melt (1% water) the temperature would rise to 900°C. At a slightly lower pressure of 0.4 GPa we obtain temperatures between 720°C (6% water) and 880°C (1% water), while at 0.1 GPa temperatures vary between 760°C (3% water) and 960°C (1% water). It is clear that if the quartz crystals were stored in a partially, or even completely solidified magma chamber as proposed by many authors (see e.g., Bachmann and Bergantz, 2008), temperature of storage could have been significantly lower, and hence residence times significantly longer. Nevertheless, we believe that these numbers give us a good estimate of temperature immediately prior to, and during, eruption. We believe that the storage of the mush occurred at shallow levels in accordance with most prevailing models (Bachmann and Bergantz, 2008), so that we will use a minimum temperature of 760°C for mush remobilization.
Diffusion Times
We measured profiles (Figure 7) over each major growth zone by NanoSIMS. The profiles cover representative quartz crystals of each classification type from flows and ignimbrites. The intensity in the CL images, in general, correlates well with the Ti variation in the NanoSIMS profiles, with the brighter zones having higher Ti concentration. Yet, slopes and concentration values are not always identical. A discussion of this topic can be found in Seitz et al. (2016). Indeed CL images have been found to reflect Al-differences in quartz (Götze et al., 2001) in some cases. Therefore, it is essential to establish the diffusing element through chemical analysis. Using the NanoSIMS allowed us to identify the diffusing element and to use the actual chemical data for diffusion modeling. Our NanoSIMS measurements determined Ti as the only diffusing element (Figure 3). Other trace elements, such as Na and Al, did not show any zonation.
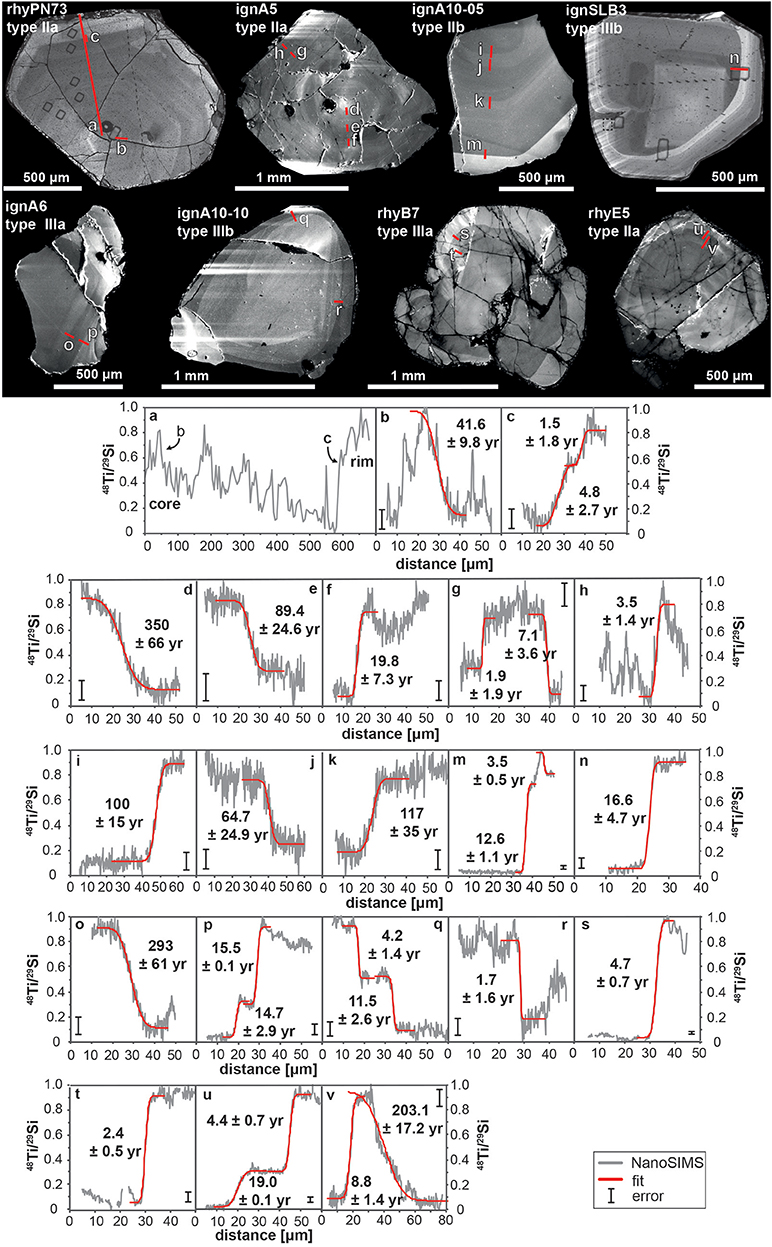
Figure 7. CL images of quartz from flows (rhy) and ignimbrites (ign) with the location of the measured NanoSIMS profiles (upper). The corresponding NanoSIMS line scans are shown in the lower (b–v). The orientation of the profiles is from core (left) to rim (right). The data are reported as normalized 48Ti/29Si ratio (gray line). For comparison (see explanation in text), a point profile is shown in (a) with the location of the corresponding line scans (b,c). Only line scans were used for diffusion modeling. The fitted diffusion profiles are represented with the red line. The calculated diffusion times are marked in all profiles. Error bars represent the errors of the fit and do not include uncertainties of the diffusion coefficient and activation energy. Sample rhyPN73 and ignSLB3 show also spots of SIMS analysis.
We used the measured Ti profiles to calculate diffusion times at the minimum temperature of 820°C based on 4QT for the crystals from rhyolite flows, and we used 760°C for the ignimbrite samples, which corresponds to the 50% crystal limit of magma at 0.1 GPa. Since temperature estimates are uncertain for the ignimbrites, we also calculated the diffusion times at 820°C, to allow for a rapid comparison of the data between ignimbrites and flows (Table 4). The shape of the pre-diffusion profile influences the time estimates. We assume a step-function for the initial profile, since this results in maximum diffusion times, despite the fact that pressure, temperature, or growth velocity changes will most likely result in smooth profiles for Ti-concentrations (e.g., Fowler et al., 2002; L'Heureux, 2013; Seitz et al., 2016; see section Discussion below).
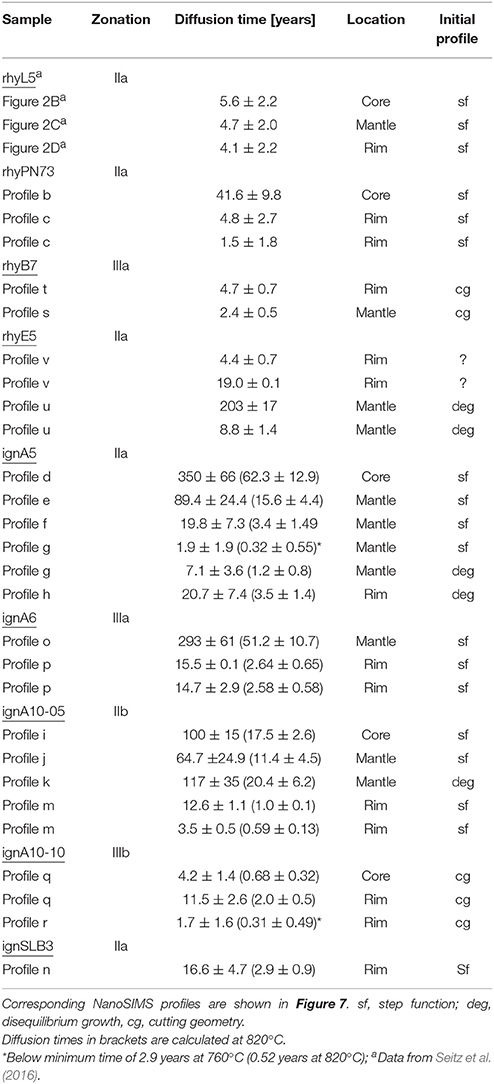
Table 4. Summary of calculated diffusion times at 820°C for flows (rhy) and at 760°C for ignimbrites (ign).
In the following paragraphs, we separately present the results for flows and ignimbrites. A summary of the diffusion times is given in Figure 8 and Table 4.
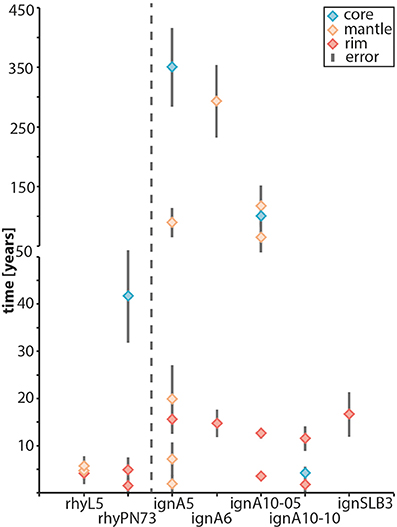
Figure 8. Summary of the calculated diffusion times for the flows (rhyL5 from Seitz et al., 2016) at 820°C and ignimbrites at 760°C. The diffusion time for the overgrowth rim of the ignimbrite samples are in good agreement with the quartz rims from the flows. Note the general trend of shorter diffusion times toward the rim. The deformed flow samples are not shown, as the measured profiles, do not represent clear diffusion profiles.
Rhyolite Flows
Only quartz crystals of type IIa were analyzed by NanoSIMS. The quartz from sample rhyPN73 (Figure 7) shows an undisturbed magmatic zoning. A lighter core is surrounded by several darker and lighter zones. The outermost zone is formed by a lighter rim. From core to rim (Figures 7a–c, Table 4) diffusion times are 41.6 ± 9.8, 4.8 ± 2.7, and 1.5 ± 1.8 yr. Seitz et al. (2016) obtained diffusion times of 5.6 ± 2.2, 4.7 ± 2.0, and 4.1 ± 2.2 yr (shorter diffusion times toward the rim) for sample rhyL5, which is in the same order of magnitude as the rim of sample rhyPN73. CL images from two slightly deformed flow samples reveal that they still preserve their magmatic zonation. The calculated diffusion times from core to rim for sample rhyB7 (Figures 7s,t, Table 4) are 2.4 ± 0.5 and 4.7 ± 0.7 yr. Diffusion calculation for sample rhyE5 (Figures 7u,v, Table 4) yields 8.8 ± 1.4, 203 ± 17.2, 19.0 ± 0.1, and 4.4 ± 0.7 yr (from core to rim).
Rhyolitic Ignimbrites
Quartz crystals from class IIa to IIIb were analyzed. Sample ignA5 (type IIa) shows undisturbed normal growth zoning with several lighter and darker zones. The outermost rim is formed by a light zone. We measured several profiles (Figures 7d–h) over each major growth zone. Calculation of diffusion times (at 760°C) yield from core to rim 350 ± 67, 89.4 ± 24.6, 19.8 ± 7.3, 1.9 ± 1.9, 7.1 ± 3.6, and 20.7 ± 7.4 yr (Table 4). Quartz crystal ignA10-05 and ignA10-10 are from the same sample. IgnA10-05 shows a type IIb quartz with reverse magmatic zonation, here a dark core surrounded by several lighter zones. Over each major zone, we measured a Ti profile (Figures 7i–m) and calculated the diffusion time at 760°C. From core to rim they result in 100 ± 15, 64.7 ± 24.9, 117 ± 35, 12.6 ± 1.1, and 3.5 ± 0.5 yr (Table 4). The type IIIb crystal (ignA10-10) preserved reverse magmatic zoning with resorption features. A complexly zoned light core is surrounded by a darker overgrowth rim. We measured several profiles (Figures 7q,r) over the core-rim interface. The measured profiles were used to calculated diffusion times, those are 4.2 ± 1.4, 11.5 ± 2.6, and 1.7 ± 1.6 yr (Table 4). The crystals from samples ignSLB3 and ignA6 belong to type IIIa. They show a more complex zoning with dissolution textures where a darker core is surrounded by a lighter overgrowth rim. The profile over the rim of sample ignSLB3 (Figure 7n, Table 4) gives a diffusion time of 16.6 ± 4.7 yr. For sample ignA6 the core (Figure 7o) yields 293 ± 61 yr, the rim (Figure 7p, Table 4) yields a diffusion time of 15.5 ± 0.1 and 14.7 ± 7.4 yr. For comparison, if the temperature of 820°C is used for diffusion modeling of the ignimbrites, the core profiles in Figures 7d,i yield diffusion times as short as 62.3 ± 12.9 and 17.5 ± 2.6 yr.
Discussion
The above textural results show that quartz crystals from ignimbrites have a prolonged and complex history. They often document multiple phases of growth and resorption. Quartz crystals from flows typically have a simpler, and likely shorter history. Most crystals show continuous growth, followed by a single, final stage of resorption. Ignimbrite quartz shows residence and crystallization times which are tens to hundreds of years, depending on the temperature used. Quartz crystallized in less than 5–40 years in flows. In light of the observed differences, we would like to further discuss potential uncertainties and their selective effect on the results from ignimbrites and flows.
A Critical Discussion of Diffusion Chronometry: Importance of Temperature Estimates, Geometry of Zoning Patterns and Spatial Resolution of the Analytical Technique
An important source of uncertainty in diffusion chronology is the temperature-time evolution experienced by the crystal. Temperature has an exponential effect on the diffusion times modeled via Equation (1). A temperature change of ±50°C would change the calculated diffusion time by about one order of magnitude (Spear, 2014). We therefor sought the most realistic estimation for the minimum temperature of quartz crystallization to obtain maximum diffusion times. The 4QT temperature estimation describe most accurately the quartz crystallization temperature as it accounts for textural observations (4% quartz crystals in flows). Additionally, it investigates the pressure sensitivity and the effect of the water content of the melt on the temperature. For this reason, we applied the latter temperature for the diffusion modeling. While we used conservative estimates for the temperature, it is clear that the absolute values of the residence and crystallization times might have a large uncertainty. Below we discuss additional factors that influence the obtained crystallization and residence times. We focus on the effects these have on the flows as compared to the ignimbrites.
Slow cooling of flows and ignimbrites after eruption could result in prolonged cooling times and broaden the diffusion profiles. The relatively small thickness of the flows resulted in fast cooling, which, together with the exponentially decreasing diffusion coefficient with temperature, will minimize the effect of cooling on the calculated diffusion times. The minimum temperature used (820°C) should be therefore a good approximation. The ignimbrites virtually cool instantaneously upon eruptions. Hence, the differences in timescales between flows and ignimbrites would be increasing, since quartz crystallization times of flows would be overestimated, while those of the ignimbrites would not change.
The rhyolite-MELTS modeling suggests that dissolution of quartz is either due to temperature increase, pressure decrease or decrease of the water activity (aH2O) in the melt. Typically those changes are thought to be caused by injection of new magma (e.g., Wark et al., 2007). Events of dissolution occurred in quite a few crystals in the ignimbrites. Looking at the differences in zoning textures in ignimbrites and flows, it is clear that many quartz crystals are antecrysts or xenocrysts. Hence estimating temperature of formation and storage of grains before incorporation into the magma which leads to the eruption is challenging. As such, diffusion times calculated for these grains are highly uncertain.
The 3D-geometry associated with the Ti-profile critically influences the slope due to intersection geometry (see e.g., Shea et al., 2015; Krimer and Costa, 2017). The use of micro-tomography permits cutting through the morphological center of quartz crystals to reduce the danger of oblique cuts through the Ti-zonation, which would artificially increase the diffusion times obtained. Finding the morphological center is quite feasible for crystals which show undisturbed magmatic growth zoning parallel to the crystal faces. Resorbed crystals, with dissolution and resorption textures, make it more difficult to interpret the initial geometry, hence the probability for oblique cuts is higher. We measured the depth of each NanoSIMS profile with a Bruker Contour GT 3D optical microscope (Figure 9). The acquisition depth varies between 10 and 100 nm. Thus, the ratio between profile depth and beam size (~650 nm) is small. Hence, in all but the most oblique cuts this should not influence the profile slopes in a significant way. Finally, cutting the crystals perpendicular to the c-axis permitted to reduce uncertainties due to diffusion directions in quartz.
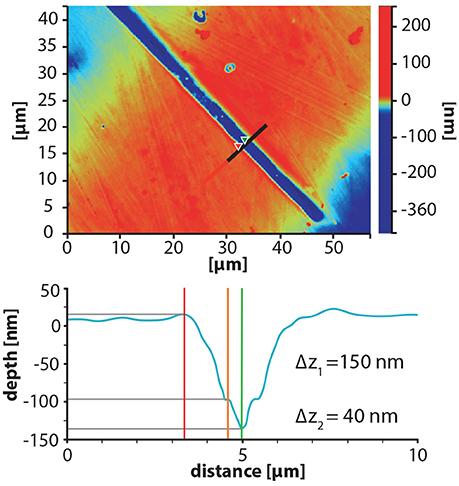
Figure 9. Typical depth profile of a NanoSIMS profile obtained with Bruker Contour GT 3D optical microscope. Δ = z1 is the total depth (pre-sputtering and acquisition), Δ = z2 is the depth of the acquisition.
Naturally, the spatial resolution of the analytical method is essential for a robust interpretation of diffusion data (e.g., Saunders et al., 2014; Ferry et al., 2015; Till et al., 2015; Seitz et al., 2016); namely to resolve magmatic processes at an annual timescale, a spatial resolution in the sub-micrometer scale is required. We measured Ti-in quartz transect with a spatial resolution of ~650 nm. This returns a minimum resolvable time interval of 0.52 yr at 820°C and 2.9 yr at 760°C (using the data from Cherniak et al., 2007).
The initial shape of a diffusion profile is essential for diffusion chronometry. Usually a step profile is taken to present the initial condition prior to diffusion (Costa et al., 2008; Zhang, 2010), since this results in a maximum diffusion time. This assumption might be suitable in cases where an instantaneous change of the melt composition occurs. Nevertheless, intrusion of a new magma, even close by, will result in dissolution, and subsequent cooling should result in a continuous profile. Similarly, a rapid pressure decrease at constant composition (due to an eruption) would likely result in dissolution, and a subsequent pressure increase in precipitation; this would also produce a continuous profile. Till et al. (2015) showed for example, that even for the formation of a new overgrowth rim, the assumption of a step profile might be the wrong choice. Oscillatory zoning of feldspar or zircon e.g., is proposed to be the result of disequilibrium growth as a result of variations in the growth rate and the self-regulation of the boundary layer (Allègre et al., 1981; Fowler et al., 2002; L'Heureux, 2013), and similar mechanisms were implied for quartz growth (e.g., Pamukcu et al., 2015, 2016; Seitz et al., 2016). This mechanism would cause exponential changes in elemental concentration, where the initial slope of the diffusion profile depends on the ratio between the growth rates and element diffusion rate in the melt. A growth-rate-dependent incorporation of trace elements in minerals crystallizing from a melt has been proposed (e.g., Ginibre et al., 2002; Shea et al., 2015) and experimentally observed by Huang and Audétat (2012) for quartz in a fluid. It is, thus, likely that initial profiles were smooth functions of distance, not step functions. Since the initial profiles were most likely flatter at the start of diffusion, times are overestimated. In some cases, it is possible to show that indeed no step function was present. Table 4 provides a summary of this discussion listing all investigated samples.
The quartz crystal from the ignimbrite sample ignA5 (Figure 7) shows undisturbed growth zoning. The fit for the profiles Figures 7d–f continuously resolve shorter diffusion times from core toward the rim (350 ± 66, 89.4 ± 24.6, and 19.8 ± 7.3 yr). The three outer profiles (Figures 7g–h), in contrast, show an inverse correlation. The calculated diffusion times are getting longer toward the rim with 1.9 ± 1.9 yr (this is below the resolvable minimum time of 2.9 yr at 760°C), 7.1 ± 3.6 and 20.7 ± 7.4 yr). Obviously, internal zones experienced diffusion before the outer zones were crystallized, along with the whole history experienced by the outer zones. We believe that the larger times obtained in the outer zones are due to concentration profiles which were no step functions, but most likely exponential, due to disequilibrium growth. The shortest calculated diffusion time is shorter than the resolvable minimum time due to spatial resolution of the NanoSIMS spots. Consequently, the rim grew less than 2.9 yr before eruption. Similar observation can be made by looking at sample ignA10-05. The diffusion time obtained for profile in Figure 7k is also overestimated (117 ± 35 yr). The diffusion times of 64.7 ± 24.9 and 12.6 ± 1.1 yr, as suggested by the profiles in Figures 7j,m represent the maximum growth and residence times.
The quartz crystal from sample ignA10-10 shows a complexly zoned light core with a darker rim. Dissolution texture can be observed at the core-rim interface. The diffusion times calculated for two traverses across the rim (Figures 7q,r) are not the same. They vary between 11.5 ± 2.6 and 1.7 ± 1.6 yr, which is below the resolvable minimum time (see above). In addition, for profile Figure 7q the diffusion time calculated for the innermost profile results in shorter times (4.2 ± 1.4 yr) than the outermost profile (11.5 ± 2.6 yr). This discrepancy could be either explained by an effect of the cutting geometry in relation to the core-rim interface or by the invalid assumption of a step profile as initial condition or a combination of both. It follows, that the rim grew in less than 4.2 yr before eruption.
Two samples, rhyB7 and rhyE5, are from slightly deformed flows. Nevertheless, they preserved the magmatic zonation. The crystal from sample rhyB7 belongs to class IIIa. We measured a profile over the interface of the two overgrowth rims (Figures 7s,t). The calculated diffusion times are increasing toward the rim, yielding 2.4 ± 0.5 and 4.7 ± 0.7 yr, respectively. As mentioned before, this could be either explained by an effect of the cutting geometry in relation to the core-rim interface or by exponential initial profiles or a combination of both. For sample rhyE5 we measured two profiles across the outer zones (Figures 7u,v). From the inner to the outer most profile the calculated diffusion times are 8.8 ± 1.4, 203 ± 17, 19.0 ± 0.1, and 4.4 ± 0.7 yr. The profile in Figure 7v is highly asymmetric and it is unlikely that the initial profile of the right part (yielding the longest diffusion times of 203.1 ± 17.2 yr) was a step function. The shape of the profile rather argues for disequilibrium growth.
Linking Quartz Zoning Patterns, P-T Constraints and Timescales
There are clear differences of quartz zoning observed between the flows and the ignimbrites of the El Quemado Complex in the study area. The flows are crystal poor; the majority of quartz crystals show uninterrupted rhythmic zoning, as well as a late stage dissolution along the rims. This indicates a “single stage crystallization” terminated by a single dissolution event. Crystallization and dissolution occurred rapidly, as indicated by the small diffusion times obtained. There is no indication of changing host magma around the crystal during growth. Given that the crystals erupted in a crystal poor magma, the simplest explanation is to attribute the dissolution features observed to decompression during eruption (see below). Hence the majority of the crystals document a simple, 1-stage cooling, followed by eruption.
On the other hand, ignimbrites are crystal-rich and contain quartz crystals that commonly display rhythmic zoning interrupted by dissolution, followed by additional rhythmic quartz precipitation. Dissolution textures in the interior part of the crystal lead to roundish cores, rarely to lobate textures. Hence dissolution was homogenous in ignimbrites, rather than lobate, as in flows, suggesting close to equilibrium dissolution. In addition, dissolution textures on the quartz surface are rare in ignimbrites. Residence and growth times for quartz crystals are difficult to estimate exactly, because of the uncertainty of the determination of quartz crystallization temperatures. Nevertheless, if times are calculated at the most likely temperature of remobilization of the crystals, e.g., 760°C, times obtained are significantly longer. Even if times are calculated at the same temperature as for the flows (820°C) the times obtained cluster toward the upper end of the times measured. We interpret the complex history to record repeated cooling and heating during a prolonged growth.
Depth and Geometry and of the Magmatic Reservoirs
It was possible to constrain pressure and temperature of quartz crystallization for the flows to either a pressure of 0.3–0.6 GPa or less than 0.1 GPa (Table 2), depending on the pressure calibration used for the Ti-content in quartz. The lowest pressures we obtained for quartz crystallization in flows range between 0.05 and 0.1 GPa for a water free melt, using rhyolite-MELTS and the calibration for TitaniQ of Huang and Audétat (2012). Temperatures are between 1070° and 1110°C (see Table 2). This crystallization environment is depicted as Model 1 in Figure 10.
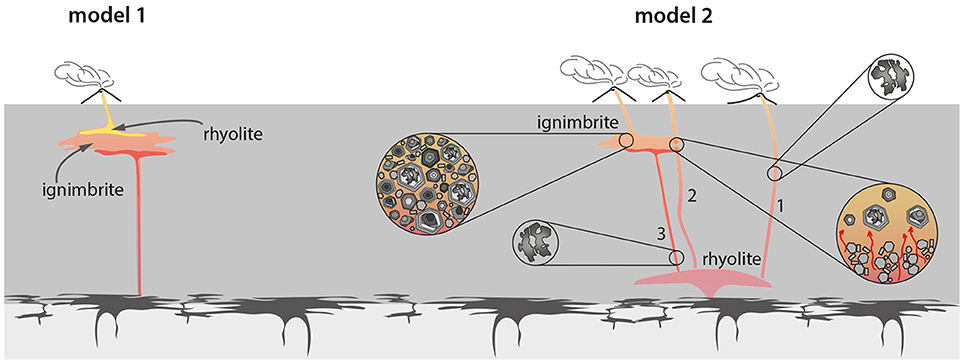
Figure 10. Proposed models for the generation of rhyolitic ignimbrites and flows. For a detailed description of the different models see discussion. Flows and ignimbrites are extracted from a single magma chamber in the upper crust (model 1) at pressures below 0.1 GPa. Flows and ignimbrites are extracted from two different magma chambers (model 2) at various depth. Flows crystallized in a magma chamber in the lower crust at pressures of 0.4–0.7 GPa. They can be either directly extracted (path 1) or interact with an upper magma chamber (path 2) where they picked up a notable amount of antecrysts. Rapid ascent resulted in embayments of the rim. Ignimbrites were extracted from a magma chamber, which experienced several rejuvenation events, resulting in roundish quartz dissolution textures. Recharge from a lower magma chamber (path 3) carried also quartz crystals with embayments textures. Sketch not to scale.
The idea of a shallow magma reservoir is compatible with many models and studies, which suggest the presence of a crystal-poor melt in the upper crust—either as pocket or more often as “melt cap” connected to an underlying mush (see review in Bachmann and Huber, 2016). The high temperature estimates we obtained (ca. 1100°C) require a virtually water free magma. In this model, the diffusion times reported in Table 4 for the flows have to be reduced by 2 orders of magnitude, requiring rapid crystallization of quartz, and the dissolution of the crystals would be due to heating just prior to eruption. However, vesicles are abundant in these rocks, suggesting that they contained a significant amount of water, released upon solidification.
In Model 2 (Figure 10) the higher pressures of 0.3–0.6 GPa (Table 4) using the pressure dependence proposed by Thomas et al. in 2010 requires crystallization of quartz in a deep-seated environment. As the magmas of the El Quemado Complex were generated in an extensional regime during the break-up of Gondwana (Pankhurst et al., 2000), the estimated depth of 10–20 km would correspond to depth of the lower crust. For example, the crustal thickness of the Afar depression, East African Rift system, is varying between 16 and 26 km with a normal thickness of the crust in this region outside the rift zone of about 35–45 km (e.g., Hammond et al., 2011). Quartz crystals would have to crystalize during a cooling initiated a few years prior to eruption, and final quartz dissolution would be the result of decompression during ascent for eruption.
A decision based on phase petrology criteria between the two models presented above will only be possible once improved thermodynamic data for the Ti-in quartz and activity models for Ti in melts becomes available. In addition, additional studies are required to better understand the reasons for oscillatory quartz growth, to be able to estimate potential disequilibrium during growth (L'Heureux, 2013; Pamukcu et al., 2016).
A reliable estimate of pressure-temperature conditions for the formation of quartz in ignimbrites could not be obtained since the complex growth/dissolution/regrowth history suggests that they are to a great extent antecrysts. The protracted, complicated growth history is most likely due to their residence in a mush environment. The lack of a pressure estimate makes it impossible to place the mush at a specific depth in the crust. Hence, we suggest to follow earlier proposals, and place the storage of the mush in the upper crust (e.g., Bachmann and Bergantz, 2008; Bachmann and Huber, 2016).
Figure 10 summarizes in a schematic model the results obtained. Model 1 depicts a single magma chamber with a crystal-rich mush at its base and the crystal-free cape. The majority of investigated quartz crystals in the rhyolites will be phenocrysts; they are unzoned or show simple zoning pattern (type I and type II), and dissolution is evident only at crystal surfaces due to heating before eruption. The few crystals with complex zoning would have been introduced into the flow from the mush below. Since both ignimbrites and flows originate from the magma chamber, it would be surprizing that only quartzes from flows experienced abundant quartz resorption during or immediately prior to eruption, while quartz crystals in ignimbrites escaped this dissolution. Alternatively, the dissolution could be due to decompression, in which case it would be even less comprehensible, that this was only experienced by the crystals in the flow.
It is simpler to explain the significant differences in textures using a multi-stage model as shown in model 2. The main difference is that we use the pressures obtained using the Thomas et al. (2010) Ti in quartz pressures dependence. These pressures are 0.3–0.6 GPa, (Table 2). Flows, show simple quartz textures suggesting a magma evolution dominated by one major quartz growth event before eruption (Figure 11). The ascent rate must have been rather fast without important cooling during magma ascent, as we observe late stage decompression driven quartz dissolution resulting in embayments of the rims. Such embayement texture is hence interpreted to be due to rapid decompression, as has also been argued by e.g., Girard et al. (2001) and Loewen et al. (2017). While most (95%) of the quartz crystals can be explained by this simple magma evolution (path 1 in model 2, Figure 10), there is a small amount of quartz crystals (5%) with internal dissolution textures, similar to those observed in ignimbrites (type III in Figures 4, 5), which must be considered antecrysts. Those crystals could have been picked up by the magmas passing the crystal mush in the upper crust, shortly before eruption. The amount of crystals studied, and especially the amount of rhyolite samples studied does not allow us to conclude if all magmas passed by the mush (path 2, model 2) or if some magmas arrived at the surface without interacting with the mush (path 1, model 2). The presence of these type III quartz antecrysts opens up the possibility that these crystal poor rhyolites might even represent the part of the magma which triggered ignimbrite eruption. At this point it is not possible to be more affirmative, since detailed maps and stratigraphic sections are lacking for the study area.
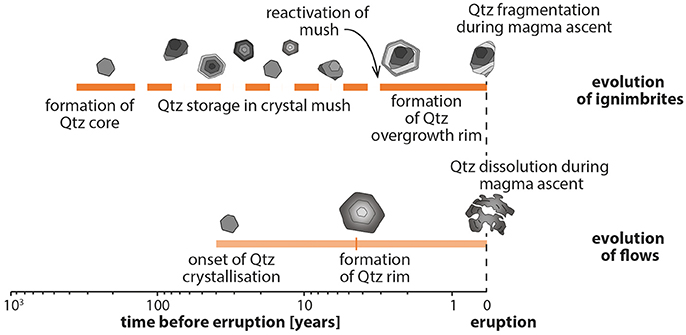
Figure 11. Timescales of the evolution of the rhyolitic ignimbrites and rhyolitic flows of the El Quemado Complex.
The crystal-rich ignimbrites contain quartz crystals with a great variability of zoning textures and many reveal internal dissolution textures in CL images. Dissolution and new phenocryst rim growth are commonly interpreted to reflect changes in temperature, pressure, or aH2O in response to heating, decompression, and/or addition of volatiles to the system (Bachmann et al., 2002; Wark et al., 2007; Cashman and Blundy, 2013). This is often thought to be linked to an intrusion of a new hot magma, which might be the marker of processes leading to the final eruption (Chamberlain et al., 2014) or the “trigger” itself (Wark et al., 2007). In both cases this indicates the rejuvenation of the crystal mush. We argue that a process of rejuvenation is recorded by over 70% of type III quartz crystals, as indicated by their roundish internal dissolution surfaces.
Timescales
Quartz crystals from rhyolitic lava flows display simple oscillatory CL zoning and diffusion chronometry suggest short timescale for quartz crystallization between 5.6 and 41.6 years. Since these were calculated using a minimum temperature, they are maximum crystallization times for these crystals. The timescales are indeed short and require growth for the zoned crystals only years before eruption. Nevertheless, there is a significant amount of quartz crystals (ca. 40%) which are not zoned. They could be crystals which grew homogeneously, in which case they contain no discernable information for diffusion chronology, or they were homogenized. In this case, they represent crystals which spend very long time at high temperatures in the magma, and they are the early crystallized crystals at depth during initial cooling.
Modeling of diffusion times is hampered in the ignimbrites by the challenging temperature estimations. It is difficult to account for temperature fluctuation expected in a crystal mush (for a discussion see Cooper and Kent, 2014). In fact, if crystals cooled significantly below 700°C, which would result in temporary solidification, this time interval would be barely recorded in the diffusion interval. The rejuvenation events, in contrast, would be preferentially recorded due to accelerated diffusion. However, it is reasonable to assume the formation of overgrowth rims occurred at temperatures above 700°C. Comparing diffusion times for the crystal-rich ignimbrite yields two disparate timescales: core values are significantly longer than the time allowed for the rim. This might indicate that crystals were stuck in a mush for hundreds to thousands of years, and then eruption occurred relatively fast. Actual times calculated depend on the temperatures used (see Table 4). At 760°C, storage could have been up to 350 years. Taking the 820°C minimum temperature of the rhyolite flows to represent an estimate for the mush reactivation temperature, the final quartz rims in ignimbrites would have to have grown not more than 2.9 yrs before eruption (Figure 11).
Interesting is the similarity in timescales for the final quartz growth event from ignimbrites and flows, as it implies reactivation of crystal-rich magma occurs at the same short timescales as the mobilization of crystal-poor magmas. However, numerical models predict different timescales for the reactivation of crystal-rich vs. crystal-poor magmas. Huber et al. (2012), for example, proposed 100–1,000 years for crystal-rich mushes and a few years for crystal-poor magmas. Yet, in conceptual models (e.g., Parmigiani et al., 2016) discussing the conditions that allow crystal-rich magmas to be evacuated, the predicted timescales for reactivation vary widely: from months to tens of years (Burgisser and Bergantz, 2012) to thousands of years (Huber et al., 2012), also depending on the mechanism of reactivation proposed and the size of the magma reservoir. Our data would support rapid reactivation but are not conclusive due to limited temperature estimates.
This study took advantage of the high resolution capacity of the NanoSIMS, and the quartz data from the EL Quemado Complex provide compelling evidence for sharp internal boundaries, providing a robust estimation of time scales. The here presented diffusion times corroborate evidence in support of short magmatic times scales (Table 4) in accordance with recent works from well investigated silicic systems (Table 1). For example, month to a few thousands of years were found for the Bishop Tuff, USA (Wark et al., 2007; Gualda et al., 2012; Chamberlain et al., 2014; Pamukcu et al., 2015; Till et al., 2015). Tens to ten-thousands of years for the Taupo Volcanic Zone, New Zealand (Saunders et al., 2010; Matthews et al., 2012; Pamukcu et al., 2015).
Our study highlights the potential of NanoSIMS techniques. A series of recent works review the applications, potential and limitations of using diffusion profiles to constrain times scales (Costa et al., 2008; Saunders et al., 2014; Shea et al., 2015; Bradshaw and Kent, 2017; Kohn and Penniston-Dorland, 2017; Krimer and Costa, 2017). These studies conclude that the analytical spatial resolution is the most important factor controlling the accuracy of short time scales obtained from diffusion modeling (Bradshaw and Kent, 2017). In addition, NanoSIMS permits analyses of a large range of trace elements (e.g., Till et al., 2015; Seitz et al., 2016; Manzini et al., 2017) and provides thus the potential number of elements that can be used for diffusion modeling (across and within minerals or samples). Importantly, it allows verification of the diffusing element(s). Testing the analytical capacities (and their limits) of in-situ techniques such as NanoSIMS will result in a better understanding of the often complex chemical patterns observed and offer new insights into the geological significance of short-duration events. Finally, this study attest to the robustness of quartz as magmatic tracer. Quartz - in absence of recrystallization—can be used to decipher magmatic time scales even in old volcanic formations—the El Quemado Complex is of Jurassic age—where most of the crystal cargo, such as feldspar or hornblende, might be altered and thus cannot be used for diffusion modeling.
Conclusion
Our results from the El Quemado Complex highlight the difference between crystal-poor rhyolitic lava flows and crystal-rich rhyolitic ignimbrites. The El Quemado rhyolitic flows provide good evidence for the rapid extraction from a deep reservoir, transport, and eruption predicted for a crystal-poor melt. Rhyolitic ignimbrites, have a more complex, and likely protracted history as would be expected for a crystal-rich magma or mush. We propose that the small- to medium-sized eruptions were generated by ascending isolated magma batches from low-crustal magma chambers, at pressures between 0.3 GPa and 0.6 GPa. The flows erupted shortly (5–40 years) after initial onset of quartz crystallization (Figure 11), though some early crystals might have been homogenized (group I crystals) indicating an early crystallization. Decompression-driven quartz dissolution occurred during magma ascent, resulting in the observed embayments on the rims of the crystals. During magma ascent, flows extracted minor amounts of quartz crystals with internal dissolution textures from an upper magma chamber. The ignimbrites were most likely extracted from a shallow magma chamber. Quartz zoning textures suggest that this magma chamber experienced several recharge and rejuvenation events. The whole evolution of the ignimbrite took at least 350 years, though prolonged storage in sub-solidus conditions can of course not be excluded. The formation of the quartz overgrowth rim, observed in ignimbrite samples, occurred at temperatures similar to the crystallization temperature of the flows. Accordingly, the last stage of the evolution of the ignimbrite took place within a few years (< 3 years), similar to the timescales observed for the flow. This implies that crystal-rich ignimbrites can be mobilized for eruption as fast as crystal poor flows.
Author Contributions
All authors were actively involved in this project, and participated in writing and editing of the presented manuscript. SS, as first author, obtained a Ph.D. at the University of Lausanne in 2016 and this manuscript is part of her thesis work on oxygen isotope data and magmatic timescales from the Chon Aike Province in Patagonia (Argentina). She has carried the major workload in sample preparation (starting from field work), analyses (CL, tomography, NanoSIMS, SIMS) and writing of the manuscript. BP was the Ph.D. director and principal PI of the project and is responsible for the design (and finances) of the project and gave support in divers analytical aspects (e.g., tomography). Diffusion modeling benefited especially from the expertise of LB (Co-PI of the project). As director of the SwissSIMS he also granted access to the laboratory. BP and LB were also very much involved in the discussion and manuscript editing. AM, as director of the NanoSIMS introduced us to the NanoSIMS and generously granted accesses to his laboratory. SE as his lab manager signed responsible for the technical aspects during the analytical sessions. A-SB, the SIMS-lab manager, carried out the Ti-concentration measurements at the SwissSIMS.
Conflict of Interest Statement
The authors declare that the research was conducted in the absence of any commercial or financial relationships that could be construed as a potential conflict of interest.
Acknowledgments
We thank the authorities of the Parque Nacional de los Glaciares (Argentina) for the permission to sample and the rangers in El Chaltén for their support. A special thank you goes to A. Kosmal (El Chaltén) for his hospitality, logistic support and geological insights. We also like to thank our field assistants N. Buchs and E. May for their help. We thank P. Vonlanthen for the introduction to the cathodoluminescence laboratory. We thank L. Caricchi and O. Müntener for discussions. We greatly acknowledge the constructive suggestions by T. Ubide and C. Deering, which have led to a significant improvement of the manuscript. We acknowledge funding by the Swiss National Science Foundation to BP and LB (200020_172513, 200021_153094) and KIP 6 funding for the Center for Advanced Surface Analysis (to LB and AM).
Supplementary Material
The Supplementary Material for this article can be found online at: https://www.frontiersin.org/articles/10.3389/feart.2018.00095/full#supplementary-material
References
Allan, A. S. R., Morgan, D. J., Wilson, C. J. N., and Millet, M.-A. (2013). From mush to eruption in centuries: assembly of the super-sized Oruanui magma body. Contrib. Mineral. Petrol. 166, 143–164. doi: 10.1007/s00410-013-0869-2
Allègre, C. J., Provost, A., and Jaupart, C. (1981). Oscillatory zoning: a pathological case of crystal growth. Nature 294, 223–228. doi: 10.1038/294223a0
Aragón, E., Rodriguez, A. M. I., and Benialgo, A. (1996). A calderas field at the Marifil Formation, new volcanogenic interpretation, Norpatagonian Massif, Argentina. J. S. Ame. Earth Sci. 9, 321–328. doi: 10.1016/S0895-9811(96)00017-X
Audétat, A., Garbe-Schönberg, D., Kronz, A., Pettke, T., Rusk, B., Donovan, J. J., et al. (2014). Characterisation of a natural quartz crystal as a reference material for microanalytical determination of Ti, Al, Li, Fe, Mn, Ga and Ge. Geostand. Geoanal. Res. 39, 171–184. doi: 10.1111/j.1751-908X.2014.00309.x
Bachmann, O., and Bergantz, G. W. (2004). On the Origin of crystal-poor rhyolites: extracted from batholithic crystal mushes. J. Petrol. 45, 1565–1582. doi: 10.1093/petrology/egh019
Bachmann, O., and Bergantz, G. W. (2008). Rhyolites and their Source Mushes across Tectonic Settings. J. Petrol. 49, 2277–2285. doi: 10.1093/petrology/egn068
Bachmann, O., Dungan, M. A., and Lipman, P. W. (2002). The Fish Canyon magma body, san juan volcanic field, colorado: rejuvenation and eruption of an upper-crustal batholith. J. Petrol. 43, 1469–1503. doi: 10.1093/petrology/43.8.1469
Bachmann, O., and Huber, C. (2016). Silicic magma reservoirs in the Earth's crust. Am. Mineral. 101, 2377–2404. doi: 10.2138/am-2016-5675
Barboni, M., and Schoene, B. (2014). Short eruption window revealed by absolute crystal growth rates in a granitic magma. Nat. Geosci. 7, 524–528. doi: 10.1038/ngeo2185
Bradshaw, R. W., and Kent, A. J. R. (2017). The analytical limits of modeling short diffusion timescales. Chem. Geol. 466, 667–677. doi: 10.1016/j.chemgeo.2017.07.018
Bryan, S. E., Riley, T. R., Jerram, D. A., Stephens, C. J., and Leat, P. T. (2002). “Silicic volcanism: an undervalued component of large igneous provinces and volcanic rifted margins,” in Volcanic Rifted Margins, eds M. A. Menzies, S. L. Klemperer, C. J. Ebinger, and J. Baker (Boulder, CO: Geological Society of America), 99–120.
Burgisser, A., and Bergantz, G. W. (2012). A rapid mechanism to remobilize and homogenize highly crystalline magma bodies. Nature 471, 212–215. doi: 10.1038/nature09799
Cashman, K. V., and Blundy, J. D. (2013). Petrological cannibalism: the chemical and textural consequences of incremental magma body growth. Contrib. Mineral. Petrol. 166, 703–729. doi: 10.1007/s00410-013-0895-0
Cashman, K. V., and Giordano, G. (2014). Calderas and magma reservoirs. J. Volcanol. Geothermal. Res. 288, 28–45. doi: 10.1016/j.jvolgeores.2014.09.007
Chamberlain, K. J., Morgan, D. J., and Wilson, C. J. N. (2014). Timescales of mixing and mobilisation in the bishop tuff magma body: perspectives from diffusion chronometry. Contrib. Mineral. Petrol. 168:1034. doi: 10.1007/s00410-014-1034-2
Charlier, B. L. A., Morgan, D. J., Wilson, C. J. N., Wooden, J. L., Allan, A. S. R., and Baker, J. A. (2012). Lithium concentration gradients in feldspar and quartz record the final minutes of magma ascent in an explosive supereruption. Earth Planet. Sci. Lett. 319–320, 218–227. doi: 10.1016/j.epsl.2011.12.016
Cherniak, D. J., Watson, E. B., and Wark, D. A. (2007). Ti diffusion in quartz. Chem. Geol. 236, 65–74. doi: 10.1016/j.chemgeo.2006.09.001
Cooper, G. F., and Wilson, C. J. N. (2014). Development, mobilisation and eruption of a large crystal-rich rhyolite: the ongatiti ignimbrite, New Zealand. Lithos 198–199, 38–57. doi: 10.1016/j.lithos.2014.03.014
Cooper, K. M., and Kent, A. J. R. (2014). Rapid remobilization of magmatic crystals kept in cold storage. Nature 506, 480–483. doi: 10.1038/nature12991
Costa, F., Dohmen, R., and Chakraborty, S. (2008). Time scales of magmatic processes from modeling the zoning patterns of crystals. Rev.Mineral. Geochem. 69, 545–594. doi: 10.2138/rmg.2008.69.14
Druitt, T. H., Costa, F., Deloule, E., Dungan, M. A., and Scaillet, B. (2012). Decadal to monthly timescales of magma transfer and reservoir growth at a caldera volcano. Nature 482, 77–80. doi: 10.1038/nature10706
Ferry, J. M., Stubbs, J. E., Xu, H., Guan, Y., and Eiler, J. M. (2015). Ankerite grains with dolomite cores: a diffusion chronometer for low- to medium-grade regionally metamorphosed clastic sediments. Ame. Mineral. 100, 2443–2457. doi: 10.2138/am-2015-5209
Fildani, A., and Hessler, A. M. (2005). Stratigraphic record across a retroarc basin inversion: rocas verdes–magallanes basin, patagonian andes, chile. Geol. Soc. Am. Bull. 117:1596. doi: 10.1130/B25708.1
Fowler, A. D., Prokoph, A., Stern, R. A., and Dupuis, C. (2002). Organization of oscillatory zoning in zircon: analysis, scaling, geochemistry, and model of a zircon from Kipawa, Quebec, Canada. Geochim. Cosmochim. Acta 66, 311–328. doi: 10.1016/S0016-7037(01)00774-8
Ghiorso, M. S., and Gualda, G. A. R. (2015). An H2O–CO2 mixed fluid saturation model compatible with rhyolite-MELTS. Contrib. Mineral. Petrol. 169, 1–30. doi: 10.1007/s00410-015-1141-8
Ginibre, C., Wörner, G., and Kronz, A. (2002). Minor- and trace-element zoning in plagioclase: implications for magma chamber processes at Parinacota volcano, northern Chile. Contrib. Mineral. Petrol. 143, 300–315. doi: 10.1007/s00410-002-0351-z
Girard, J.-P., Munz, I. A., Johansen, H., Hill, S., and Canham, A. (2001). Conditions and timing of quartz cementation in Brent reservoirs, Hild Field, North Sea: constraints from fluid inclusions and SIMS oxygen isotope microanalysis. Chem. Geol. 176, 73–92. doi: 10.1016/S0009-2541(00)00350-8
Götze, J., Plötze, M., and Habermann, D. (2001). Origin, spectral characteristics and practical applications of the cathodoluminescence (CL) of quartz – a review. Mineral. Petrol. 71, 225–250. doi: 10.1007/s007100170040
Gualda, G. A. R., Ghiorso, M. S., Lemons, R. V., and Carley, T. L. (2012). Rhyolite-MELTS: a modified calibration of MELTS optimized for Silica-rich, Fluid-bearing magmatic systems. J. Petrol. 53, 875–890. doi: 10.1093/petrology/egr080
Hammond, J. O. S., Kendall, J.-M., Stuart, G. W., Keir, D., Ebinger, C., Ayele, A., et al. (2011). The nature of the crust beneath the Afar triple junction: evidence from receiver functions. Geochem. Geophys. Geosyst. 12:Q12004. doi: 10.1029/2011GC003738
Hayden, L. A., and Watson, E. B. (2007). Rutile saturation in hydrous siliceous melts and its bearing on Ti-thermometry of quartz and zircon. Earth Planet. Sci. Lett. 258, 561–568. doi: 10.1016/j.epsl.2007.04.020
Hellebrand, E., Snow, J. E., Mostefaoui, S., and Hoppe, P. (2005). Trace element distribution between orthopyroxene and clinopyroxene in peridotites from the Gakkel Ridge: a SIMS and NanoSIMS study. Contrib. Mineral. Petrol. 150, 486–504. doi: 10.1007/s00410-005-0036-5
Hervé, F., Calderón, M., Massonne, H. J., and Theye, T. (2007). Metamorphic P-T conditions of Late Jurassic rhyolites in the Magallanes fold and thrust belt, Patagonian Andes, Chile. J. Iberian Geol. 33, 5–16. doi: 10.1016/j.lithos.2007.01.007
Hildreth, W. (2004). Volcanological perspectives on long valley, mammoth mountain, and mono craters: several contiguous but discrete systems. J. Volcanol. Geothermal Res. 136, 169–198. doi: 10.1016/j.jvolgeores.2004.05.019
Huang, R., and Audétat, A. (2012). The titanium-in-quartz (TitaniQ) thermobarometer: a critical examination and re-calibration. Geochim. Cosmochim. Acta 84, 75–89. doi: 10.1016/j.gca.2012.01.009
Huber, C., Bachmann, O., and Dufek, J. (2012). Crystal-poor versus crystal-rich ignimbrites: a competition between stirring and reactivation. Geology 40, 115–118. doi: 10.1130/G32425.1
Kohn, M. J., and Penniston-Dorland, S. C. (2017). Diffusion: obstacles and opportunities in petrochronology. Rev. Mineral. Geochem. 83, 103–152. doi: 10.1515/9783110561890-005
Krimer, D., and Costa, F. (2017). Evaluation of the effects of 3D diffusion, crystal geometry, and initial conditions on retrieved time-scales from Fe-Mg zoning in natural oriented orthopyroxene crystals. Geochim. Cosmochim. Acta 196, 271–288. doi: 10.1016/j.gca.2016.09.037
Leresche, S. (2013). Etude Structurale, Géochimique, Géochronologique et Pétrographique d'une Partie Des Roches Encaissantes à l'Est de l'Intrusion du Mt. Fitz Roy (Patagonie, Argentine). Lausanne: University of Lausanne.
Leuthold, J., Müntener, O., Baumgartner, L. P., Putlitz, B., and Chiaradia, M. (2012). A detailed geochemical study of a shallow arc-related laccolith; the torres del paine mafic complex (Patagonia). J. Petrol. 54, 273–303. doi: 10.1093/petrology/egs069
L'Heureux, I. (2013). Self-organized rhythmic patterns in geochemical systems. Philosophical Transactions R. Soc. A Mathematical, Phys. Eng. Sci. 371:20120356 doi: 10.1098/rsta.2012.0356
Llanos, M. P. I., Lanza, R., Riccardi, A. C., Geuna, S., Laurenzi, M. A., and Ruffini, R. (2003). Palaeomagnetic study of the El quemado complex and marifil formation, patagonian jurassic igneous province, argentina. Geophys. J. International. 154, 599–617. doi: 10.1046/j.1365-246X.2003.01923.x
Lloyd, A. S., Ruprecht, P., Hauri, E. H., Rose, W., Gonnermann, H. M., and Plank, T. (2014). NanoSIMS results from olivine-hosted melt embayments: magma ascent rate during explosive basaltic eruptions. J. Volcanol. Geothermal Res. 283, 1–18. doi: 10.1016/j.jvolgeores.2014.06.002
Loewen, M. W., Bindeman, I. N., and Melnik, O. E. (2017). Eruption mechanisms and short duration of large rhyolitic lava flows of yellowstone. Earth Planet. Sci. Lett. 458, 80–91. doi: 10.1016/j.epsl.2016.10.034
Manzini, M., Bouvier, A.-S., Baumgartner, L. P., Müntener, O., Rose-Koga, E. F., Schiano, P., et al. (2017). Weekly to monthly time scale of melt inclusion entrapment prior to eruption recorded by phosphorus distribution in olivine from mid-ocean ridges. Geology 45, 1059–1062. doi: 10.1130/G39463.1
Matthews, N. E., Pyle, D. M., Smith, V. C., Wilson, C. J. N., Huber, C., and van Hinsberg, V. (2012). Quartz zoning and the pre-eruptive evolution of the ~340-ka Whakamaru magma systems, New Zealand. Contrib. Mineral. Petrol. 163, 87–107. doi: 10.1007/s00410-011-0660-1
Michel, J., Baumgartner, L. P., Putlitz, B., Schaltegger, U., and Ovtcharova, M. (2008). Incremental growth of the patagonian torres del paine laccolith over 90 k.y. Geology 36, 459–462. doi: 10.1130/G24546A.1
Miller, C. F., McDowell, S. M., and Mapes, R. W. (2003). Hot and cold granites? Implications of zircon saturation temperatures and preservation of inheritance. Geology 31, 529–532. doi: 10.1130/0091-7613(2003)031<0529:HACGIO>2.0.CO;2
Nescher, P. (2013). Petrography, Structural Geology, Geochemistry and Metamorphism of the Rocks in the Eastern Fitz Roy Foothills in Patagonia, Argentina. Lausanne: University of Lausanne.
Pamukcu, A. S., Ghiorso, M. S., and Gualda, G. A. R. (2016). High-Ti, bright-CL rims in volcanic quartz: a result of very rapid growth. Contrib. Mineral. Petrol. 171, 1–9. doi: 10.1007/s00410-016-1317-x
Pamukcu, A. S., Gualda, G. A. R., Bégué, F., and Gravley, D. M. (2015). Melt inclusion shapes: timekeepers of short-lived giant magma bodies. Geology 43, 947–950. doi: 10.1130/G37021.1
Pankhurst, R. J., Leat, P. T., Sruoga, P., Rapela, C. W., Márquez, M., Storey, B. C., et al. (1998). The chon aike province of patagonia and related rocks in West Antarctica: a silicic large igneous province. J. Volcanol. Geothermal. Res. 81, 113–136. doi: 10.1016/S0377-0273(97)00070-X
Pankhurst, R. J., Riley, T. R., Fanning, C. M., and Kelley, S. P. (2000). Episodic silicic volcanism in patagonia and the antarctic peninsula: chronology of magmatism associated with the break-up of Gondwana. J. Petrol. 41, 605–625. doi: 10.1093/petrology/41.5.605
Parmigiani, A., Faroughi, S., Huber, C., Bachmann, O., and Su, Y. (2016). Bubble accumulation and its role in the evolution of magma reservoirs in the upper crust. Nature 532, 492–495. doi: 10.1038/nature17401
Press, W. H., Teukolsky, S. A., Vetterling, W. T., and Flannery, B. P. (1992). “Numerical recipes,” in The Art of Scientific Computing, 2nd Edn (New York, NY: Cambridge University Press), 1–1018.
Ramírez de Arellano, C., Putlitz, B., Müntener, O., and Ovtcharova, M. (2012). High precision U/Pb zircon dating of the Chaltén Plutonic Complex (Cerro Fitz Roy, Patagonia) and its relationship to arc migration in the southernmost Andes. Tectonics 31:TC400. doi: 10.1029/2011TC003048
Riley, T. R., Flowerdew, M. J., Hunter, M. A., and Whitehouse, M. J. (2010). Middle jurassic rhyolite volcanism of eastern Graham Land, Antarctic Peninsula: age correlations and stratigraphic relationships. Geol. Mag. 147, 581–595. doi: 10.1017/S0016756809990720
Saunders, K. E., Buse, B., Kilburn, M. R., Kearns, S., and Blundy, J. D. (2014). Nanoscale characterisation of crystal zoning. Chem. Geol. 364, 20–32. doi: 10.1016/j.chemgeo.2013.11.019
Saunders, K. E., Morgan, D. J., Baker, J. A., and Wysoczanski, R. J. (2010). The Magmatic evolution of the whakamaru supereruption, New Zealand, constrained by a microanalytical study of plagioclase and quartz. J. Petrol. 51, 2465–2488. doi: 10.1093/petrology/egq064
Seitz, S. (2016). Oxygen Isotope Data and Constraints on Magmatic Timescales From the Chon Aike Province (Patagonia, Argentina). dissertation, Université de Lausanne, Lausanne.
Seitz, S., Putlitz, B., Baumgartner, L. P., Escrig, S., Meibom, A., and Bouvier, A.-S. (2016). Short magmatic residence times of quartz phenocrysts in Patagonian rhyolites associated with Gondwana breakup. Geology 44, 67–70. doi: 10.1130/G37232.1
Shea, T., Lynn, K. J., and Garcia, M. O. (2015). Cracking the olivine zoning code: distinguishing between crystal growth and diffusion. Geology 43, 935–938. doi: 10.1130/G37082.1
Singer, B. S., Costa, F., Herrin, J. S., Hildreth, W., and Fierstein, J. (2016). The timing of compositionally-zoned magma reservoirs and mafic “priming” weeks before the 1912 novarupta-katmai rhyolite eruption. Earth Planet. Sci. Lett. 451, 125–137. doi: 10.1016/j.epsl.2016.07.015
Skora, S., Baumgartner, L. P., Mahlen, N. J., Johnson, C. M., Pilet, S., and Hellebrand, E. (2006). Diffusion-limited REE uptake by eclogite garnets and its consequences for Lu–Hf and Sm–Nd geochronology. Contrib. Mineral. Petrol. 152, 703–720. doi: 10.1007/s00410-006-0128-x
Spear, F. S. (2014). The duration of near-peak metamorphism from diffusion modelling of garnet zoning. J. Metamorph. Geol. 32, 903–914. doi: 10.1111/jmg.12099
Spear, F. S., and Wark, D. A. (2009). Cathodoluminescence imaging and titanium thermometry in metamorphic quartz. J. Metamorph. Geol. 27, 187–205. doi: 10.1111/j.1525-1314.2009.00813.x
Streck, M. J. (2008). Mineral textures and zoning as evidence for open system processes. Rev. Mineral. Geochem. 69, 595–622. doi: 10.2138/rmg.2008.69.15
Thomas, J. B., Bruce Watson, E., Spear, F. S., Shemella, P. T., Nayak, S. K., and Lanzirotti, A. (2010). TitaniQ under pressure: the effect of pressure and temperature on the solubility of Ti in quartz. Contrib. Mineral. Petrol. 160, 743–759. doi: 10.1007/s00410-010-0505-3
Till, C. B., Vazquez, J. A., and Boyce, J. W. (2015). Months between rejuvenation and volcanic eruption at Yellowstone caldera, Wyoming. Geology 43, 695–698. doi: 10.1130/G36862.1
Turner, S. P., and Costa, F. (2007). Measuring timescales of magmatic evolution. Elements 3, 267–272. doi: 10.2113/gselements.3.4.267
Wark, D. A., Hildreth, W., Spear, F. S., Cherniak, D. J., and Watson, E. B. (2007). Pre-eruption recharge of the Bishop magma system. Geology 35:235. doi: 10.1130/G23316A.1
Wark, D. A., and Spear, F. S. (2005). Ti in quartz: Cathodoluminescence and thermometry. Geochim. Cosmochim. Acta Suppl. 69:592.
Wark, D. A., and Watson, E. B. (2006). TitaniQ: a titanium-in-quartz geothermometer. Contrib. Mineral. Petrol. 152, 743–754. doi: 10.1007/s00410-006-0132-1
Watson, E. B., and Harrison, T. M. (1983). Zircon saturation revisited: temperature and composition effects in a variety of crustal magma types. Earth Planet. Sci. Lett. 64, 295–304. doi: 10.1016/0012-821X(83)90211-X
Wotzlaw, J.-F., Bindeman, I. N., Watts, K. E., Schmitt, A. K., Caricchi, L., and Schaltegger, U. (2014). Linking rapid magma reservoir assembly and eruption trigger mechanisms at evolved Yellowstone-type supervolcanoes. Geology 42, 807–810. doi: 10.1130/G35979.1
Keywords: NanoSIMS, diffusion chronometry, magma storage, Chon Aike Province, quartz zoning textures
Citation: Seitz S, Putlitz B, Baumgartner L, Meibom A, Escrig S and Bouvier A-S (2018) A NanoSIMS Investigation on Timescales Recorded in Volcanic Quartz From the Silicic Chon Aike Province (Patagonia). Front. Earth Sci. 6:95. doi: 10.3389/feart.2018.00095
Received: 08 December 2017; Accepted: 22 June 2018;
Published: 24 July 2018.
Edited by:
Olivier Bachmann, ETH Zürich, SwitzerlandReviewed by:
Teresa Ubide, The University of Queensland, AustraliaChad Deering, Michigan Technological University, United States
Copyright © 2018 Seitz, Putlitz, Baumgartner, Meibom, Escrig and Bouvier. This is an open-access article distributed under the terms of the Creative Commons Attribution License (CC BY). The use, distribution or reproduction in other forums is permitted, provided the original author(s) and the copyright owner(s) are credited and that the original publication in this journal is cited, in accordance with accepted academic practice. No use, distribution or reproduction is permitted which does not comply with these terms.
*Correspondence: Susanne Seitz, c3VzYW5uZS5zZWl0ekB1bmlsLmNo
Benita Putlitz, YmVuaXRhLnB1dGxpdHpAdW5pbC5jaA==