 Dario Bilardello
 William C. Callebert
 Joshua R. Davis
- 1Institute for Rock Magnetism, University of Minnesota, Minneapolis, MN, United States
- 2Department of Geology, Western Washington University, Bellingham, WA, United States
- 3Department of Mathematics and Statistics, Carleton College, Northfield, MN, United States
Paleomagnetism of South American Jurassic/Cretaceous rocks has been troubled by elongated distributions of poles which has led to contrasting interpretations. Moreover, many discordant paleomagnetic poles from the Carboniferous to the Triassic have also been recognized and systematically explained by a variety of processes, but this portion of the South American apparent polar wonder path (APWP) still remains problematic. To this end, we have conducted a paleomagnetic study of the sedimentary Permo-Carboniferous Itararé Group rocks and three intruding mafic sills of likely Cretaceous age within the state of São Paulo, Brazil. The site-mean VGP distributions obtained from the sedimentary rocks define elongations that include the VGPs of the mafic intrusions. We interpret these distributions as remagnetization paths toward the directions characteristic of the sills. Furthermore, we show that the remanence directions of the sills are partially overprinted by the present time-averaged and current Earth's magnetic field. Our interpretations are supported by extensive rock-magnetic data that provides a viable mechanism for the secondary magnetizations. The current study focuses on the paleomagnetism and rock-magnetism of the mafic intrusions and how they affected the paleomagnetic recording of the sedimentary rocks, however, careful analysis of the paleomagnetic data of the Itararé sedimentary rocks enables isolation of a primary VGP distribution that is consistent with the reference Carboniferous pole position. Extending our study to other Carboniferous to Triassic South American paleomagnetic records reveals that the majority of these data are elongated, similarly to the Itararé Group rocks. Regardless of the age of the rocks, the elongations systematically intersect at the location of the Late Cretaceous reference pole, and at a long- recognized “problematic” location observed in some Jurassic and Cretaceous rock formations. Based on multiple lines of evidence, we interpret the elongations to reflect remagnetizations from the primary VGP positions toward Jurassic-Cretaceous pole locations that occurred as a result of the widespread magmatic events associated with the opening of the South Atlantic. We suggest that the extent of the remagnetizations is formation-specific, and that other rock-formations should be carefully re-evaluated.
Introduction
The apparent polar wander path (APWP) of cratonic South America has long troubled paleomagnetists (e.g., Valencio and Vilas, 1976; Valencio et al., 1977; Geuna and Vizan, 1998). Many paleomagnetic poles from the stable part of the continent show elongated or streaked distributions of virtual geomagnetic poles (VGPs), which result in inconsistent paleopole locations and have resulted in different, often contrasting, geological interpretations. These elongations have been attributed to complex and rapid continental movements related to South Atlantic sea floor spreading (e.g., Valencio et al., 1983), inadequate data selection (Beck, 1988; Castillo et al., 1991; Cembrano et al., 1992), or block rotations in the Andes (e.g., Beck, 1988; Rapalini and Vilas, 1991; Beck et al., 1994; Somoza, 1994). Somoza and Zaffarana (2008) fit the observations with a change in tectonic style in the Andean margin during the mid- to Late Cretaceous associated to major plate reorganization in a moving hotspot reference frame. Noteworthy, discordant paleopoles have been replicated by subsequent studies [e.g., the Rio los Molinos (Linares and Valencio, 1975), and El Salto-Almafuerte (Mendia, 1978)], were dismissed on the basis of speculative observations like inadequate structural correction (Geuna and Vizan, 1998), and have not been considered reliable since, though they still feature in certain global studies (e.g., Torsvik et al., 2012).
Discordant paleomagnetic data, however, have plagued the South American literature for older, Carboniferous to Triassic, rocks too. Vertical-axis rotations have been invoked to reconcile many observations, leading Somoza (1994) to suggest that the Andes have a tectonic style that is distinct from any other orogen, without however providing a plausible explanation. Other authors have mitigated the problem by invoking incorrect tectonic corrections (e.g., Geuna and Vizan, 1998; Geuna and Escosteguy, 2004). Complex magnetization histories have also been recognized, for example associated with the San Rafael Orogeny, affecting many Paleozoic South American strata, and resulting in secondary and syn-tectonic magnetizations acquired during the Permian (e.g., Tomezzoli and Vilas, 1999; Tomezzoli, 2001; Fazzito and Rapalini, 2016). Other mechanisms that have been proposed include inclination shallowing in sedimentary rocks (e.g., Brandt et al., 2009; Franco et al., 2012), or remagnetizations associated with Jurassic-Cretaceous magmatic events (Pascholati, 1983; Brandt et al., 2009; Font et al., 2012). As of today no convincing argument has been put forward to justify such widespread observations.
Irrespective of rock-age, South American paleomagnetic data from igneous and sedimentary rocks thus present controversial elongations, discordant declinations, define an APWP that is not consistent with reasonable paleogeographic reconstructions, and are possibly contaminated by Jurassic-Cretaceous magnetizations. In fact, the conformation of the supercontinent Pangea has been at the center of a long-standing debate regarding the relative positioning of the individual continental masses. Carey (1958) discovered a disagreement in the positions of paleomagnetic poles, known as the Intra-Pangea Paleomagnetic (IPP) anomaly, which results in extensive overlap of the Laurentia and Gondwana continental blocks, and that could only be resolved by placing Gondwana to the east of Laurentia (e.g., Van Hilten, 1964; De Boer, 1965). Transformation to the commonly accepted Pangea position in the Triassic-Jurassic would be achieved by a ~5,000 km transcurrent event, the so-called “Tethys Twist” (Van Hilten, 1964).
Explanations to resolve the IPP anomaly have been proposed by introducing octupolar field contributions to the Earth's dipole moment (e.g., Briden et al., 1971; Van der Voo and Torsvik, 2001; Torsvik and Van der Voo, 2002), but this approach was later rejected on the basis of a lack of evidence for non-dipolar field components (Torsvik et al., 2008). Tectonic solutions have also been proposed, notably the Pangea A2 model (Van der Voo and French, 1974), involving a 20° clockwise rotation of Gondwana. This configuration was proposed to have existed from the Late Carboniferous through at least the Middle Triassic. Irving (1977) obtained the Pangea B model for the Early Permian by working back in small time increments from the classic Pangea (A1) model in the Early Jurassic. Pangea B lasted ~50 Ma and was hypothesized to have transformed to Pangea A1 by a 3,500 km dextral displacement along the line of the Appalachian-Variscan orogenic belt. The age of the displacement has been interpreted to be mostly Triassic (Morel and Irving, 1981; Muttoni et al., 1996, 2001; Torq et al., 1997) with a rate of ~10 cm/yr. Opponents of Pangea B, however, argued that there was a lack of geologic evidence for the megashear and found its displacement rate unrealistic (Livermore et al., 1986; Smith and Livermore, 1991; Van der Voo, 1993). Rochette and Vandamme (2001) also rejected Pangea B instead arguing that it is an artifact of inclination error. Bilardello and Kodama (2010) performed inclination corrections to Carboniferous North American sedimentary rock-data and exacerbated the overlap with South America, also precluding a Pangea A fit. However, they demonstrated that inclination corrections of South American paleopoles had the potential of eliminating the continental overlap.
Brandt et al. (2009) and Font et al. (2012), evaluated South American paleopoles and pointed out that the classic South American APWP includes a “loop” that is inconsistent with the Pangea A fit. They argue that the loop may be due to unremoved magnetic overprints (mostly Cretaceous) and to the overall quality of specific paleomagnetic poles. The Paraná Basin of Brazil and Chaco- Paraná Basin of Argentina were largely affected by widespread magmatism between the Triassic-Jurassic and the Early Cretaceous, in relation to the opening of the South Atlantic (e.g., Milani and Zalán, 1999; Araujo et al., 2000, 2005; Menezes and Travassos, 2000; Abbot and Isley, 2002; Thomaz Filho et al., 2008), which provides a likely process for such extensive remagnetization of older sedimentary rocks. In the Northern Paraná Basin, recent U-Pb ages for volcanic rocks suggest rapid magmatic pulses ~135 Ma (Janasi et al., 2011; Pinto et al., 2011; Baksi, 2018). Specific to the State of Sao Paulo, however, Ernesto et al. (1999) report extensive geochemical and geochronological (40Ar/39Ar) data from igneous rocks, including flows, dykes and sills, and determine that in this region the igneous activity lasted from 133 to 130 Ma, confirming the Early Cretaceous age for the magmatism in the area.
The Permo-Carboniferous Itararé Group sedimentary rocks from the state of São Paulo, intruded by the igneous rocks reported on by Ernesto et al. (1999) have provided key paleomagnetic poles (Valencio et al., 1975; Pascholati, 1983) that are in agreement with the South American APWP and thus considered reliable. However, Pascholati (1983) had identified some discordant VGPs that were used to calculate a second paleopole, which the authors ultimately attributed to Cretaceous remagnetizations. Likewise, Franco et al. (2012) studied the Itararé rhythmites in the states of São Paulo (Itu quarry, also sampled in the present study) and Santa Catarina (Rio do Sul). While for the Rio do Sul rhythmites they claimed to have isolated a primary Permo-Carboniferous magnetization, for the Itu quarry rhythmites a strongly elongated distribution was obtained, which the authors vaguely dismissed as anomalous.
We performed a detailed paleomagnetic study of the Itararé Group sedimentary sequence exposed throughout the state of São Paulo, for an inclination shallowing investigation [note that the Franco et al. (2012) study was unpublished at the time we performed our field work]. We also sampled three mafic sills that were encountered during field work to allow a direct comparison between igneous and sedimentary rock paleomagnetic data. Our goal was to test the effect of inclination shallowing on the paleogeography of South America by providing a broader-scale paleomagnetic study of the Itararé Group rocks than other previous studies. However, our results reveal discordant paleomagnetic behavior of the Itararé Group rocks that closely correlate to the paleomagnetism of the intruding sills analyzed by us and by Ernesto et al. (1999). The current study thus focuses on the paleomagnetic and rock-magnetic results of the igneous rocks and how these likely affected the paleomagnetic recording of the sedimentary rocks. A more detailed rock-magnetic study of the sedimentary rocks will be the topic of a dedicated article. A comparison to paleomagnetic results from other South American rock formations indicates that the discordant results are related, consequently challenging the validity of many paleopoles from South America, and bearing important implications for the continent's APWP at large, including the paleogeography of Pangea.
Materials and Methods
Geology
The Permo-Carboniferous of the Paraná Basin depicts a major transgressive-regressive cycle and comprises the Itararé, Guatá, and Passa Dois Groups, as well as the eolian Pirambóia Formation (e.g., Vesely and Assine, 2006; Delorenzo Nardi Dias and Scherer, 2008). The Itararé Group constitutes one of the most extensive units, reaching a thickness of up to 1,500 m in the central part of the basin, and thinning toward the northeast and southeast borders (França and Potter, 1988) where it crops out below the thick magmatic cover of the Early Cretaceous Serra Geral Formation (Santos et al., 1996; Rocha-Campos et al., 2008). Unlike its character in the southern part of the basin, there is no lateral continuity of the Itararé Group sedimentary facies to the north, particularly in the thick sequence within the state of São Paulo, hindering the establishment of formal stratigraphic subunits and regional correlations (Arab et al., 2009).
The Itararé Group was deposited under mostly marine glacial and periglacial conditions, comprising several sedimentary facies. From subsurface observations, França and Potter (1988) subdivided the Itararé Group into three formations. The lowermost Lagoa Azul comprises diamictites and marine postglacial transgressive shales. It is composed of different types of diamictites, sandstones, shales with dropstones, and some levels of conglomerates deposited within a glacial–postglacial succession (França and Potter, 1988, 1991; Santos et al., 1996; Limarino and Spalletti, 2006; Rocha-Campos et al., 2008). The Campo Mourão and Taciba formations instead comprise fining-upward cycles composed of subglacial tillites overlain by resedimented diamictites or conglomerates and sandstones.
In the northern part of the Paraná Basin the Itararé Group strata are red in color and are referred to as the Aquidauana Formation. However, subsurface data suggest that the two are equivalent (Milani et al., 1994, 1998). The correlation between outcrops and subsurface sections is not fully established (Rocha-Campos et al., 2008). Because of these reasons and the lack of a formal stratigraphy, paleomagnetic investigations of the Itararé Group in the State of Sao Paulo are particularly challenging. No magnetic stratigraphy exists for the Itararé Group within the northern Paraná Basin.
Franco et al. (2012) report U-Pb SHRIMP radiometric ages of 298.5 (±2.6) and ~323 Ma from the lower and upper parts of the Itararé Group, respectively. The latter age comes from a detrital zircon, therefore providing a maximum age-limit, indicating that the base of the Itararé cannot be older than the Upper Mississippian. Matos et al. (2001) report a U-Pb age of 267.1 (±3.4) from tonsteins from the overlying Rio Bonito Formation, and this represents a minimum limit to the age of the Itararé Group. Prior to these U-Pb dating efforts (Souza, 2006) had identified the oldest palynozone in the basal part of the Itararé Group as Late Bashkirian (~315–312 Ma), and (Holz et al., 2010) also reported the Itararé as Bashkirian/Moscovian (~312 Ma) to Early Sakmarian (~294 Ma). The palynologic age-estimates thus place the base of the Itararé as Early Pennsylvanian, whereas the absolute U-Pb ages could push the base into the Late Mississippian. The Itararé Group rocks were thus deposited almost entirely within the Kiaman reverse superchron which extended between ~318–313 Ma and ~262 Ma (Irving and Pullaiah, 1976; Opdyke et al., 2000; Cottrell et al., 2008). The Late Carboniferous age of the Itararé is further supported by palynological correlation with Upper Carboniferous strata in Argentina (e.g., Paganzo Basin), southern Africa and Australia (Holz et al., 2010).
Sampling
The Itararé Group rocks were sampled at thirty-six different sites that span the eastern part of the state of São Paulo from north to south, and into the southernmost part of the state of Minas Gerais. A detailed overview of the stratigraphy in the field was provided by Prof. Santos from the University of São Paulo. During a first season (March 2012), denoted “IT,” thirteen sedimentary sites (IT1-8, IT10-13, and IT16) were collected, including three mafic sills (IT9, IT14, and IT15) that intrude the sedimentary sequence. During the second field season (August-September 2012), denoted “II,” twenty sedimentary sites were collected. Geographic coordinates for the sampling sites are listed in Table 1 and shown in Figure 1.
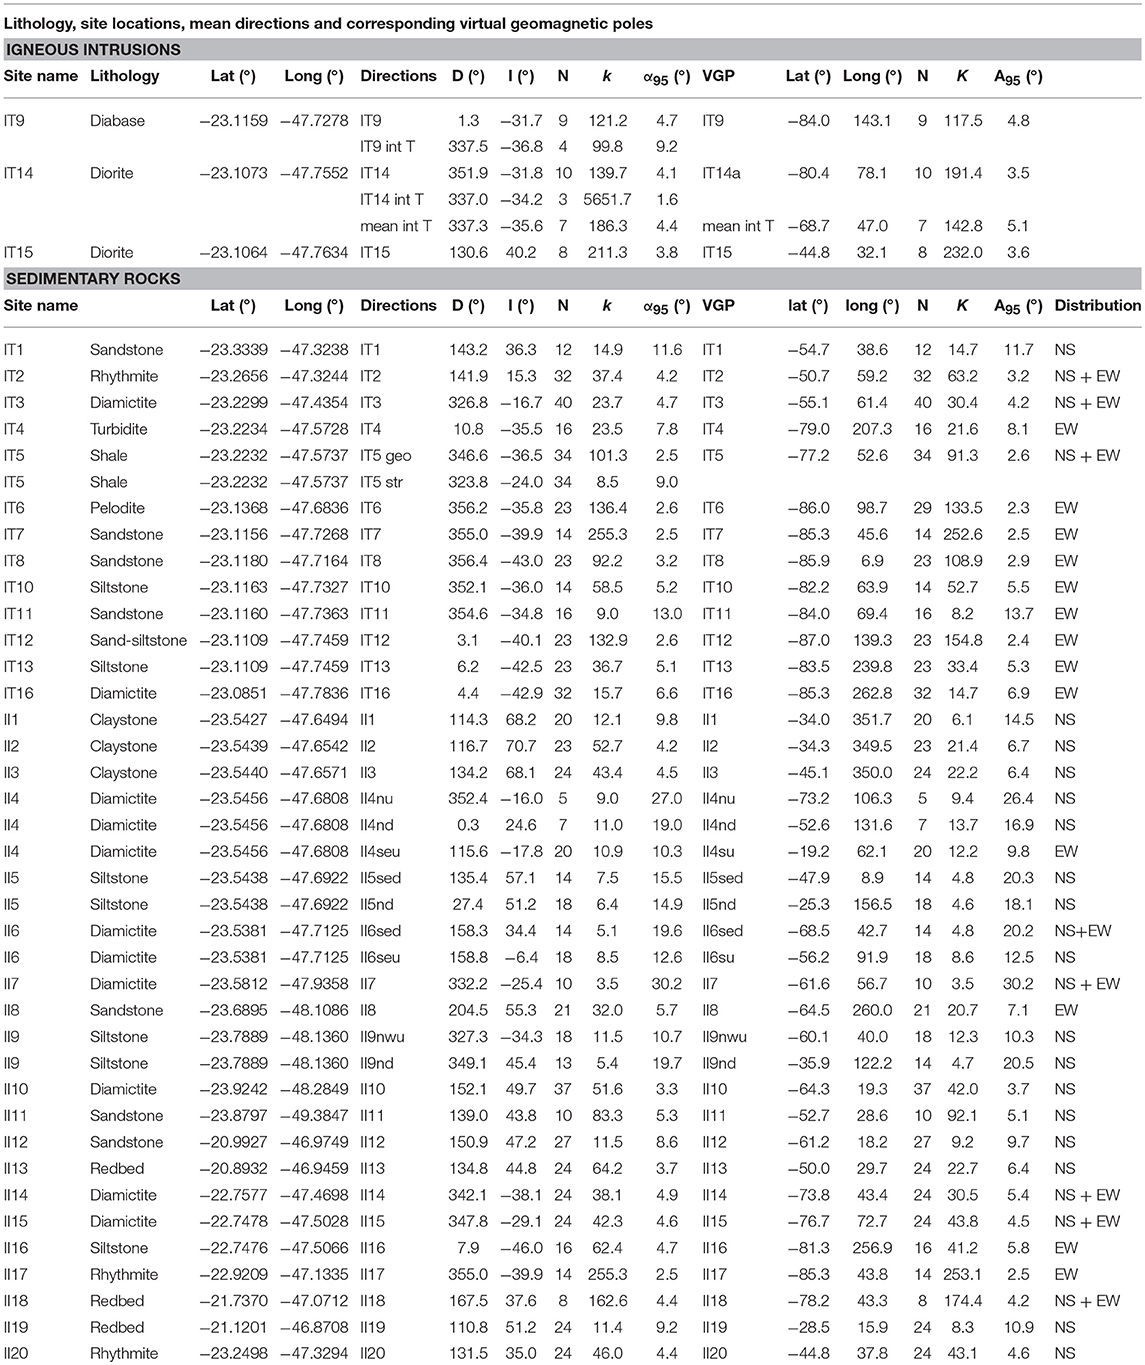
Table 1. Lithology, site locations, mean paleomagnetic directions and VGPs isolated from each sampling site: N and k are number of specimens and precision parameter, respectively; a95 and A95 are the 95% confidence circles for the directions and VGPs, respectively; for the sedimentary rocks it is also specified whether they are included in the NS, EW, or both distributions for the great circle analysis, see text for details.
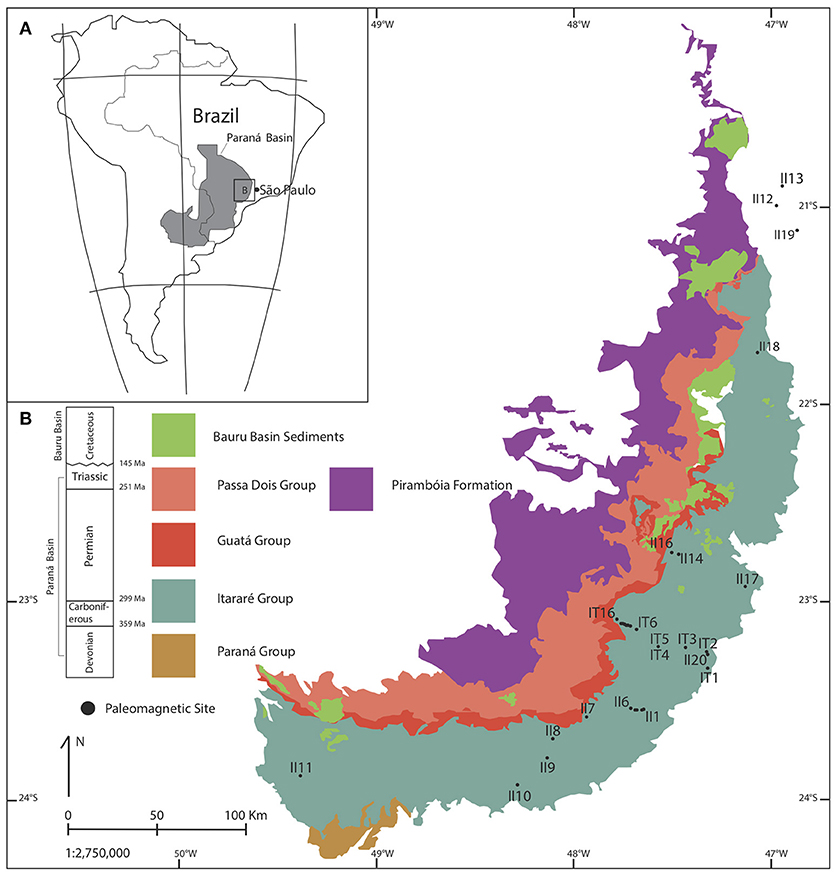
Figure 1. Study area: (A) location of the study area within the Paraná Basin; (B) Site locations and outcropping geological formations within the state of Sao Paulo, Brazil. Note that three sites of the Itararé Group rocks (II12, II13, and II19) were collected in the neighboring state of Minas Gerais.
The sedimentary rocks collected during both field campaigns are all subglacial deposits that range from gray to tan-colored diamictites, fine yellow sands and siltstones, thinly laminated gray rhythmites, red mudstones and red sandy mudstones. At three distinct sampling sites (II1, 2, and 3), the lithology stands out as unique: here, recent road work had exposed a hard buff and gray-colored claystone with conchoidal fractures, attesting to its fine grain-size and high competence (Supplementary Figure 1). All sampled strata are flat-lying except for site IT5 which displays complex folding resulting from slumping.
The igneous rocks that intrude the Itararé Group are a fine grained diabase sill (IT9), a diorite, with more traditionally intermediate texture (IT14), and a second diorite sill (IT15) with finer granular texture. The total thickness of each intrusion is unknown, but the outcrops are ~1 m thick (Supplementary Figure 2). More igneous rocks are known to crop out in the same study area, including sills, dykes, and basalt flows. A systematic paleomagnetic, geochemical and geochronological study of these igneous rocks was conducted by Ernesto et al. (1999), who determined an Early Cretaceous age (133–130 Ma), and refer to these as the Northern Paraná Basin (NPB) igneous intrusions and flows. In our study we refer to these results for comparison.
Procedures
Rock cores were drilled using a gasoline powered portable drill and oriented using a Pomeroy orienting fixture. Whenever possible both magnetic and sun-compass readings were taken to orient the cores. Most cores were large enough for ~3–4 standard-sized (2.5 × 2.2 cm) cylinders to be cut, yet for the more sandy lithologies shorter, often single-cylinder cores, were obtained. Rock-magnetic and paleomagnetic measurements were initiated at the Instituto de Geociencias, University of São Paulo, Brazil (IGc-USP) and continued at the Institute for Rock Magnetism, University of Minnesota, USA.
Specimens from sites IT-1 through IT-5 and the three igneous sites were measured at the IGc-USP. Magnetic moments were measured on an AGICO (Brno, Czech Republic) JR-6a spinning magnetometer in conjunction with thermal demagnetization conducted on an TD-48 ASC Scientific (Carlsbad, CA, USA) furnace, or in conjunction with alternating field (AF) demagnetization conducted on a Molspin (Oxon, England) shielded demagnetizer. Magnetization results are volume-normalized and reported in units of A/m.
The specimens from the remaining sites and the rock-magnetism of the mafic sills were measured at the Institute for Rock Magnetism. Magnetic measurements were conducted on a 2G Enterprises (Mtn. View, CA, USA) U-Channel DC SQUID with a built-in AF demagnetizer and on a 2G Enterprises RF SQUID magnetometers. Thermal demagnetization was conducted on a TD-48SC ASC Scientific (Carlsbad, CA, USA) furnace. Magnetization measurements performed at the IRM are mass-normalized and reported in units of Am2/kg. All paleomagnetic directions were determined using Principal Component Analysis following Kirschvink (1980) and analyzed using PuffinPlot (Lurcock and Wilson, 2012). Line-fits were anchored to the origin of the demagnetization axes where appropriate. Paleomagnetic directions isolated from each site were plotted on equal area stereonets to evaluate within-site consistency and to determine whether any obvious outliers were present using Stereonet3D (Cardozo and Allmendinger, 2013) and Pmag.Py (Tauxe et al., 2016b). Site mean statistics were evaluated using the Fisher (1953) distribution. Intersection of great circles and bootstrap confidence analysis was performed using geologyGeometry by Davis (2018). Lastly, paleopoles were plotted on a globe using GPlates (Boyden et al., 2011). Susceptibility measurements were conducted on a KLY-2 together with a CS4 furnace for evaluation of thermo-magnetic behavior between room temperature and 700°C (units of m3/kg) to evaluate the magnetic mineralogy. Additional rock-magnetic measurements performed to determine magnetic mineralogy, coercivity and domain state include hysteresis loops, backfield curves, and first order reversal curves (FORCs) measured on Princeton Measurements Corporation (Princeton, NJ, USA) model 3900 MicroMag Vibrating Sample Magnetometers (VSMs) to determine hysteresis parameters at ambient and high temperature. Hysteresis and backfield data, together with low-temperature rock-magnetic data were analyzed using the IRM database software. FORC data were processed using the FORCinel software package (Harrison and Feinberg, 2008) together with the VARIFORC module of Egli (2013). Coercivity spectra from back-field remanence curves and IRM acquisition curves acquired on a VSM were evaluated using the MaxUnmix software by Maxbauer et al. (2016). Magnetic remanence and frequency dependent susceptibility were also measured as a function of temperature on Quantum Design (San Diego, CA, USA) Magnetic Properties Measurement Systems (MPMSs) to evaluate magnetic mineralogy and grain size. Experiments included measuring magnetic remanence upon heating from 10 K to room temperature after cooling in a 2.5 T field (field cooled remanence, FC), and after cooling in zero field but applying a saturation isothermal remanent magnetization (SIRM) of 2.5 T at 10 K (zero-field cooled remanence, ZFC). A room temperature (RT) 2.5 T SIRM was also applied and the remanence measured upon cooling to 10 K and warming back to room temperature (RTSIRM). AC susceptibility as a function of temperature and frequency was also measured on the MPMS on specimens from the three mafic sills.
Results
Paleomagnetic directions obtained from this study are compared to the present day geomagnetic field direction determined using the Magnetic Field Calculator available at the NOAA website https://www.ngdc.noaa.gov/geomag/magfield.shtml. The present-day field (at the time the sampling was conducted) obtained for São Paulo, Brazil is oriented 339.4, −35.9°. The time-averaged dipole field direction calculated for the study area is oriented 360, −40.4°.
Igneous Rocks
The specimens collected from the three mafic sills (sites IT9, IT14, and IT15) have natural remanent magnetizations (NRMs) ranging between 1.67 and 7.03 A/m. Even though the diabase at site IT14 is coarser grained than the sills at IT9 and IT15, IT9 and IT14 reveal the same demagnetization styles and also yield very similar directions. IT15 instead has different demagnetization behavior, as shown below for both thermal and AF demagnetization. The site mean directions are reported in Table 1.
During thermal demagnetization, specimens from sites IT9 and IT14 reveal three components of magnetization. Below ~400°C the magnetization intensity decreases minimally upon heating, with a slight inflection around 350°C, and this component does not possess a consistent direction. The first consistent component is revealed between ~400 and 525°C and bears the same direction as the present field direction (Figures 2A,D; Table 1) and we refer to this as the intermediate temperature component of magnetization. A second, higher temperature component direction is typically isolated between ~525 and 580–600°C and is characterized by a sharp drop in magnetization. Such a narrow laboratory unblocking temperature range is indicative of a narrow grain-size distribution of magnetic carriers (Figures 2B,E). We have applied Watson's V test (e.g., Watson and Irving, 1957) to determine whether the mean directions for the lower and high temperature components are statistically distinct. For the sill at IT9, the V value is 36.3, whereas the critical value of V (Vcrit) is 7.5, while for the sill at IT14 V is 63.4 and Vcrit is 6.7. In both cases the two components can be statistically considered distinct.
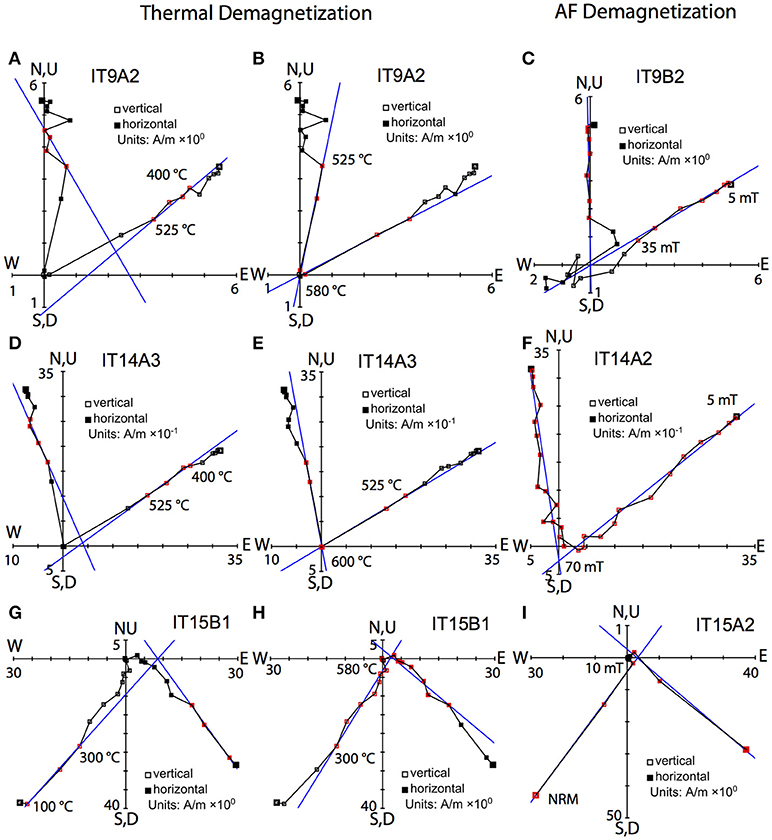
Figure 2. Zijderveld diagrams for selected specimens from the mafic sills: (A,D,G) intermediate temperature component of magnetization, typically isolated between 400 and 525°C; (B,E,H) high temperature component isolated in the same specimens as in (A,D,G) typically between 525 and 600°C; (C,F,I) AF demagnetization revealing one component of magnetization only. See text for details.
Site IT15 shows linear demagnetization behavior and in certain specimens two components can be isolated. The first component is isolated between ~100 and 300°C (Figure 2G), and has an orientation of opposite polarity to the Earth's magnetic field (Figure 2B). The high temperature component direction at site IT15 is isolated between ~300 and 580–600°C (Figure 2H). However, when performing Watson's V test to determine whether the two distributions share a common mean, the value of V obtained is 5.8, smaller than the Vcrit value of 9.4, indicating that the two directions are statistically indistinguishable. We can therefore disregard the lower temperature component for this sill.
AF demagnetization only isolates the directions corresponding to the high temperature components for the three sills. For site IT9 the only stable direction is isolated between 5–10 and ~35 mT (range 30–40 mT), while specimens from IT14 demagnetize between 5 and 45–70 mT, with demagnetization trends that go toward or close to the origin of orthogonal demagnetization diagrams (Zijderveld, 1967; Figures 2C,F). Specimens from site IT15 demagnetize in lower fields, with a sharp loss of intensity and complete removal of the remanence by ~30 mT. The stable component of IT15 is isolated between the NRM and ~15 mT (Figure 2I).
On a stereonet, the intermediate temperature magnetization component directions of IT9 and IT14 are indistinguishable from the present-day field direction. In particular the individual directions of IT9 are somewhat elongated between the present-day field direction and the time averaged field (Figure 3A), however the mean directions are indistinguishable from that of the present field (Figure 3B).
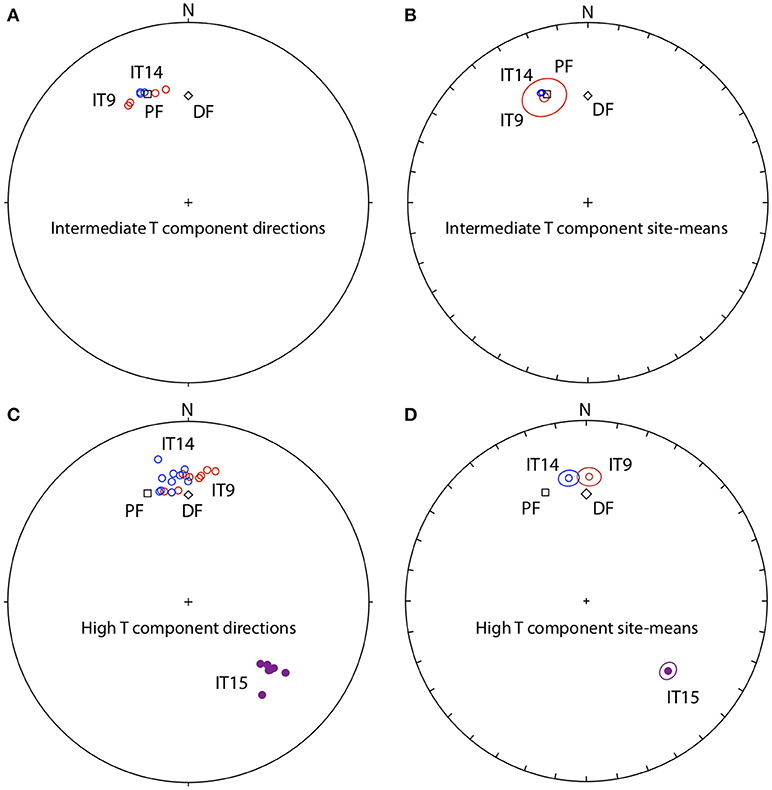
Figure 3. Directions isolated from the mafic sills: (A) intermediate temperature component directions isolated from sills at IT9 (red) and IT14 (blue), the present-day field direction (PF) and the time-averaged dipole field (DF) are the black square and diamond, respectively, open (closed) symbols are for upper (lower) hemisphere projections, respectively; (B) site-mean directions for the intermediate temperature-component magnetizations, symbols as in (A); (C) high-temperature component directions isolated from the mafic sills, symbols as in (A), site IT15 (purple); (D) site-mean directions for the high temperature-component magnetizations, symbols as in (A).
The high temperature component and AF directions for site IT9 are close to the time-averaged field direction or the present-day geomagnetic field direction, and yield a site-mean direction oriented: D = 1.3°, I = −31.7° (α95 = 4.7°, n = 9/10; Figures 3C,D). Specimens from site IT14 yield a similarly oriented site-mean direction D = 351.9°, I = −31.8° (α95 = 4.1°, n = 10/10), which we label IT14 (Figures 3C,D). Site IT15, also yields a mean high temperature component and AF direction toward the south and down, oriented: D = 130.6°, I = 40.2° (α95 = 3.8, n = 8/10; Figures 3C,D). The directions obtained from IT15 plot on the opposite hemisphere and are not antipodal to IT9 and IT14 (Figure 3C). The mean directions of IT9 and IT14 have confidence circles that barely overlap and are both distinct from the present and time-averaged field directions (Figure 3D).
The demagnetization patterns of the sills are consistent with the directional changes observed (Figures 4A,B). Thermal demagnetization of specimens from sites IT9 and IT14, possess a first decrease in NRM around 350–400°C (Figure 4A). Above this temperature the first stable direction, coincident with the present day magnetic field, is isolated, up to ~525°C. At temperatures higher than 525°C, the high temperature component is isolated, up to ~580°C (magnetite's Curie temperature), at which point the specimens are completely demagnetized.
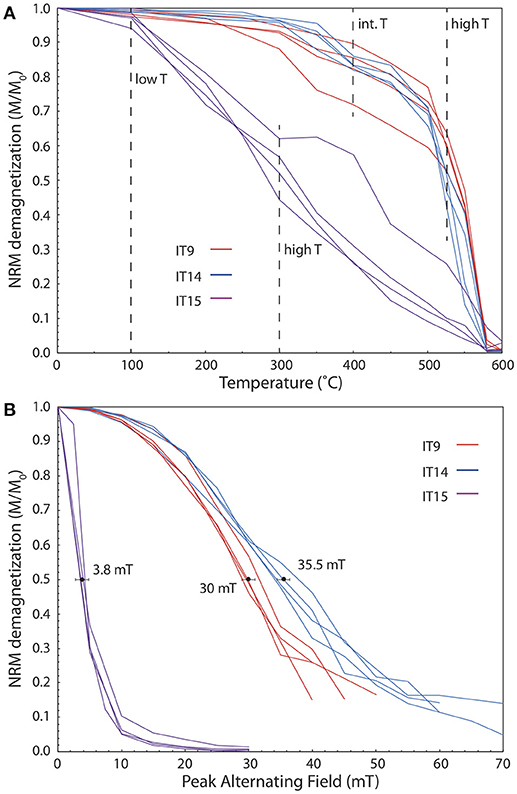
Figure 4. (A) Thermal demagnetization of the NRM of the mafic sills, specimens from IT9, IT14, and IT15 are the red, blue and purple curves, respectively; vertical dashed lines indicate the temperature ranges at which the intermediate and high temperature components were isolated; (B) AF demagnetization of the mafic sills, colors as in (A); the mean median destructive fields are reported with 1 standard deviation error bars. See text for details.
Specimens from site IT15 instead show a rather monotonic decrease in magnetization with temperature and only one specimen shows a break in slope at 300°C. Specimens from this site are also completely demagnetized by ~580°C, but the one specimen with the 300°C inflection point still carries 3.5% of the total remanence by 600°C (Figure 4A).
During AF demagnetization, specimens from sites IT9 and IT14 show an initial gentle loss of remanence up to ~20 mT, after which the loss becomes more abrupt. On average, specimens from both sites lose 50% of their remanence by 35.5 and 30.0 mT (the median destructive fields, MDFs), respectively (Figure 4B). Alternating fields are not capable of entirely cleaning the remanence of these mafic sills, and up to 16% of the NRM remains in certain specimens. Specimens from site IT15 instead lose remanence very rapidly and are completely demagnetized by 30 mT. The MDF is 3.7 mT (Figure 4B).
Rock-magnetic experiments were conducted to determine the magnetic mineralogy and domain-state of the remanence-carrying grains. Low temperature (T < 300 K) experiments conducted on the MPMS show prominent magnetite Verwey transitions (TV) at ~120 K for all specimens in all remanence curves (Supplementary Figure 3). Specimens from IT9 show the strongest remanent magnetizations, and for this sill the FC curve has higher magnetization than the ZFC curve, while the RTSIRM upon cooling and warming recovers the most magnetization (78%), consistent with smaller [single-domain (SD)/pseudo-single domain (PSD)] grains. The sill at site IT14 shows similar low temperature behavior; however, the FC-ZFC curves almost overlap, indicating larger magnetic grain sizes (Smirnov, 2009). The RTSIRM curves are similar to those from the previous site, but have lower magnetization and, through the temperature cycling, only 61% of the remanence is recovered. The sill at site IT15 has ZFC remanence curve higher than the FC curve, indicative of multi-domain (MD) grains, and loses all remanence through the TV. Cooling of the RTSIRM has a monotonic decrease until the TV and upon heating only 31% of the remanence is recovered.
In-phase magnetic susceptibility vs. temperature shows a peak at 120 K for all specimens, corresponding to the magnetite TV (Supplementary Figures 4A,D,G). Below ~75 K, however, a second peak displaying frequency dependence appears, centered at ~50, 35, and 40 K for IT9, IT14, and IT15, respectively. The lower temperature peak is most pronounced for IT14, and larger than the TV peak, unlike for the other specimens, in which magnetite clearly dominates the susceptibility response. At temperatures lower than 30 K, IT9 and less so IT15, show an increase in susceptibility corresponding to the paramagnetic fraction. Out-of-phase susceptibility (Supplementary Figures 4B,E,H) shows peaks that correspond to the low temperature in-phase peaks, and these are further replicated in their entire amplitude by the viscosity of out of phase susceptibility from Néel's (1949) single-domain theory and its derivations presented by Mullins and Tite (1973) (Supplementary Figures 4C,F,I). At these temperatures, and in the absence of iron sulfides, the out-of-phase susceptibility is entirely due to magnetic relaxation (i.e., time-dependent viscous behavior) of magnetite multi-domain grains present in the specimens (Moskowitz et al., 1998; Özdemir et al., 2009, and references therein).
Susceptibility curves measured while heating to 650°C and cooling back to room temperature show a prominent drop of susceptibility at 570°C (IT9), 560°C(IT14), 555°C (IT15), which is consistent with the Curie temperature of magnetite, possibly lowered by some Ti-substitution (Supplementary Figures 5A,C,D). Specimens from IT9 and IT14 also show an increase and decrease of susceptibility near ~150–300°C, which is most pronounced in IT9. Cooling curves reveal lowered Curie temperatures with respect to the heating curves, and the appearance of a second Curie temperature, possibly as a result of exsolution during heating. The prominent peaks of IT9 and IT14 below the Curie temperatures are broadened and shifted to lower temperatures, indicating that these are Hopkinson peaks. IT15 does not show such a pronounced behavior, but instead possesses a constant increase of susceptibility with temperature until the Curie point is reached.
A stepwise heating and cooling experiment of IT9 replicates all features of the single heating-cooling experiment (Supplementary Figure 5B). The initial increase in susceptibility near ~150°C is consistent with release of stress resulting from the diffusional homogenization of magnetite-maghemite core-shell structures, which reduces the grain's coercivity (Van Velzen and Dekkers, 1999). The subsequent drop at ~300°C instead reflects the inversion of maghemite to hematite (e.g., Dunlop and Özdemir, 1997). The repeated heating-cooling cycles also cause a lowering of the magnetite Curie temperature to ~550°C and ultimately, a suppression of the Hopkinson peak. However, the repeat heating causes annealing and reproducibility of the Curie temperature itself, which is not observed in the single-heating experiments (cf. Supplementary Figures 5A,B).
Room temperature hysteresis loops of representative specimens reveal higher coercivities for IT9 and IT14, than IT15 (Supplementary Figure 6), but heightened magnetization for the latter. The inverse relationship of remanent and in-field magnetizations (cf. Supplementary Figures 3, 6) is consistent with overall increasing grain size from IT9 and 14 to IT15.
Unmixing of backfield demagnetization and IRM acquisition curves acquired on a VSM (Figure 5) demonstrate that while the dominant coercivities for IT9 and IT14 are centered ~60 mT, lower coercivity distributions are also present, centered ~20–30 mT. The coercivity distributions are shifted toward lower coercivities for the backfield curves and toward higher coercivities for IRM acquisition. Curves for IT15 also possess two coercivity distributions, but centered at lower fields ~5 and 15 mT. IT15 also demagnetizes more easily (lower fields) than it magnetizes.
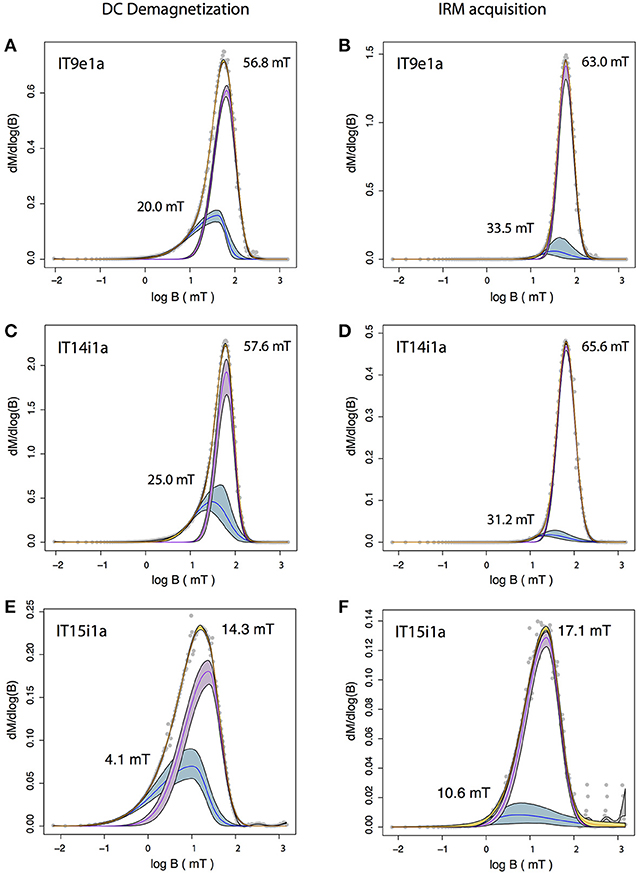
Figure 5. Unmixing of backfield DC demagnetization and IRM acquisition curves: (A,B) specimen from sill at IT9; (C,D) specimen from sill at IT14; (E,F) specimen from sill at IT15. Note how the coercivity distributions are systematically revealed at lower fields during demagnetization than acquisition. See text for details.
First order reversal curve (FORC) diagrams for the sills at IT9 and IT14 display similar features: distributions that are distinct from the origin and have a trace of a ridge along BC, up to ~150 mT, together with two lobes at positive and negative values of BU, similar to interacting SD grains (Supplementary Figures 7A,C). The sill at IT15 instead shows a dominant distribution at BC = 0 that extends toward positive and negative values of BU, typical of MD grains. Superimposed, however, is a faint ridge along BC that extends up to ~ 60 mT (Supplementary Figure 7D). Because the first stable magnetization component for IT9 and IT14 was isolated between 400 and 525°C, one FORC experiment was conducted at 400°C for a specimen from IT9 (Supplementary Figure 7B). Results show a very similar FORC distribution to that obtained at room temperature, yet somewhat shifted toward lower values of BC.
Sedimentary Rocks
An initial pilot study of the Itararé Group sedimentary rocks was conducted by performing both thermal and AF demagnetization experiments on select specimens from each site collected. Both techniques isolated the same components of magnetization. Thus, whenever possible AF demagnetization was preferred because of its rapidity. In certain sites, however, AF demagnetization was unable to fully demagnetize the remanence and therefore the specimens were subject to subsequent thermal treatment. The red sedimentary rocks and other sites with a pink coloration were thermally demagnetized directly, under the assumption that the characteristic remanent magnetization (ChRM) resided in hematite. The sedimentary rock specimens of the Itararé Group typically have weak NRM intensity between 10−5 and 10−7 Am2/kg, despite an overall broad range of magnetization intensities (10−3–10−8 Am2/kg).
AF demagnetization reveals different behavior even within the same sites (Figure 6). In most samples the ChRM is nearly fully demagnetized at fields greater than ~ 50 mT (e.g., II3E1), however in certain cases it is not erased until higher peak fields, between 60 and 100 mT (e.g., IT1A2, II8D3). Quite commonly, orthogonal demagnetization plots (Zijderveld, 1967) show a single component of magnetization that trends from the initial NRM toward the origin (e.g., IT1B2, II14A1) and is well-defined up to ~100 mT, though not always fully demagnetizing (e.g., IT2E1, II20A1). Different styles of demagnetization can be observed within the same site and maintain consistent directions of magnetization, indicating that the sedimentary rocks are heterogeneous in terms of the grain size (e.g., IT1A2 and IT1B2). It is noteworthy that the ChRM of the competent claystones is consistently isolated in the ~20–80 mT AF range (e.g., II1D1, II2C1, II3E1).
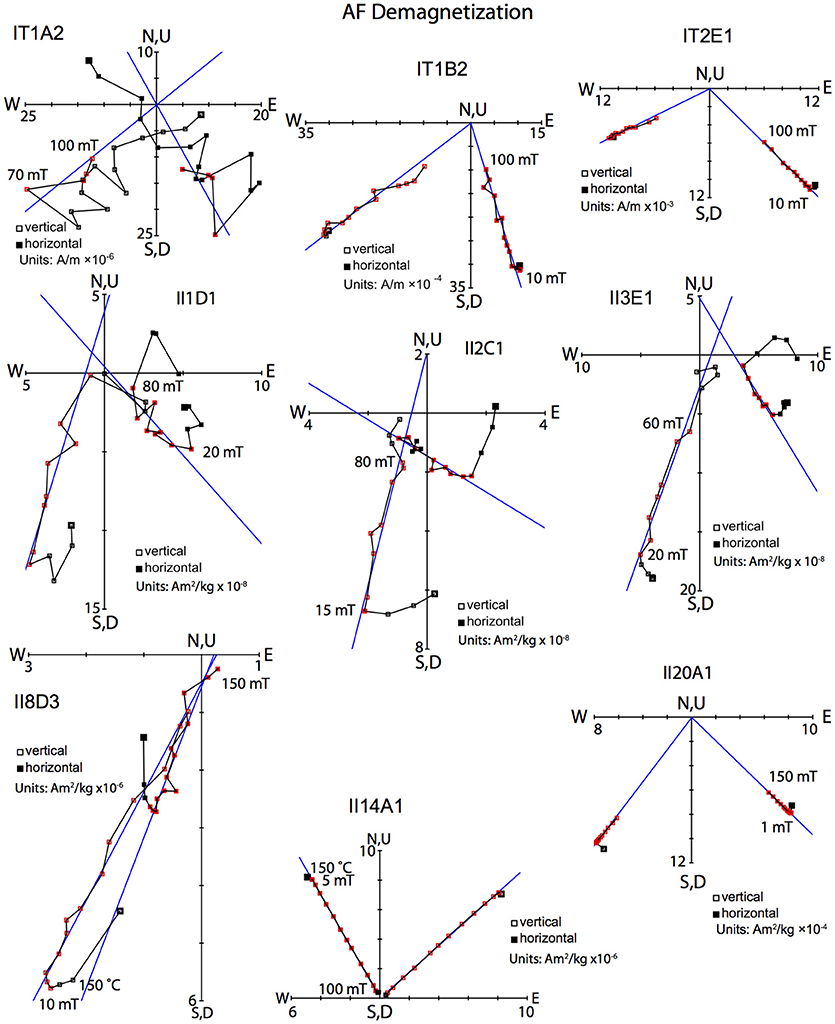
Figure 6. Orthogonal alternating field demagnetization diagrams of representative specimens from the sedimentary rocks of the Itararé Group. Solid (open) symbols represent projections on the horizontal (vertical) plane; red symbols are the demagnetization steps used for principal component analysis (PCA); blue lines are the PCA line-fits. See text for details.
Thermal demagnetization behavior also varies by site and specimen. The ChRM is isolated in variable laboratory unblocking temperature ranges, similarly to the results of the AF demagnetization experiments, confirming the heterogeneity of magnetic grain-sizes and thus coercivity spectra, which is responsible for the variable laboratory unblocking temperatures.
The gray and tan rhythmites (e.g., IT2C1, II20A2), brown diamictites (e.g., II10A1), yellow sandstones (e.g., II11D3) and the red (sometimes silty) mudstones (e.g., II13A1, II19E1) possess remanences that are not fully unblocked until ~675–680°C, indicating higher coercivity hematite as the ChRM carrier (Figure 7).
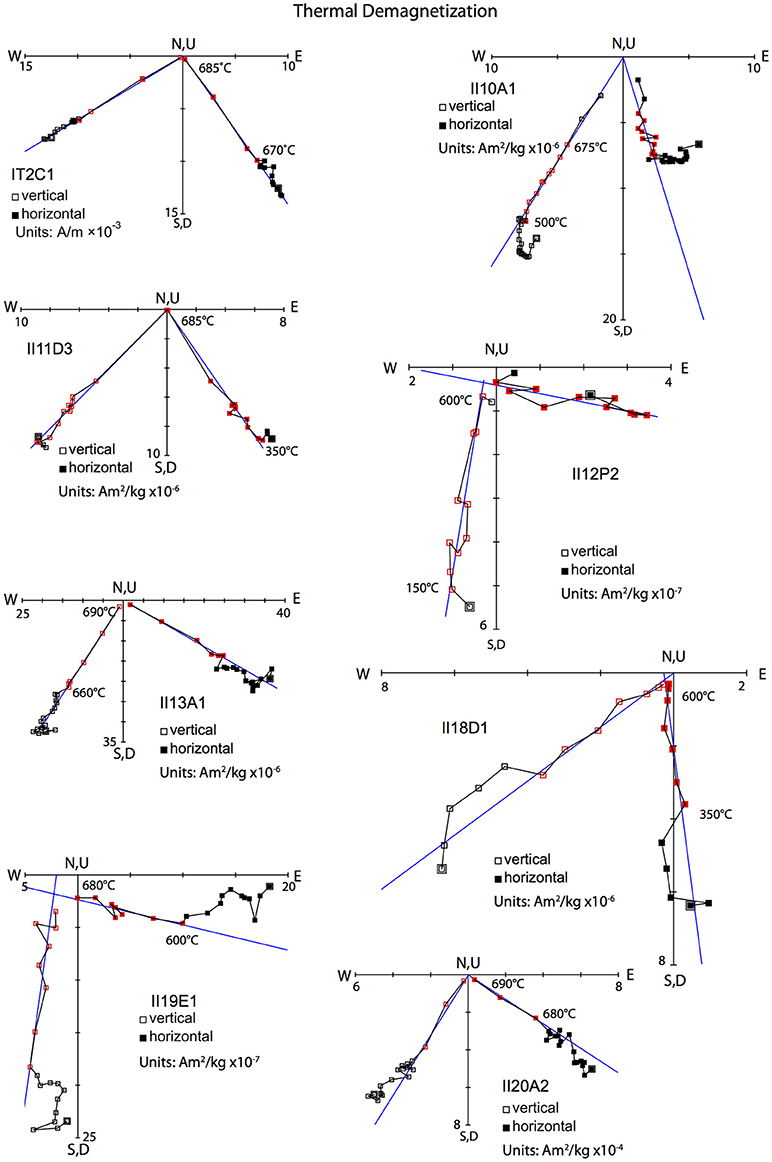
Figure 7. Orthogonal thermal demagnetization diagrams of representative specimens from the sedimentary rocks of the Itararé Group. Solid (open) symbols represent projections on the horizontal (vertical) plane; red symbols are the demagnetization steps used for principal component analysis (PCA); blue lines are the PCA line-fits. See text for details.
Demagnetization patterns of some specimens (e.g., II11D3) reveal two relatively narrow laboratory unblocking temperature intervals around 580 and 685°C, indicating both magnetite and hematite as the remanence carriers, with a coaxial magnetization isolated between ~350 and 685°C. Similarly, in other sites (e.g., IT2 and II20) the remanent directions isolated with AF (Figure 6) and thermal demagnetization up to 670°C (e.g., IT2C1 and II20A2, in Figure 7) are similar and trend toward the origin, indicating that both magnetite and hematite carry the same component of magnetization. In other sites that are also not red in color, however (e.g., II10) the stable ChRM direction is only isolated through thermal demagnetization starting at laboratory unblocking temperatures higher than ~500°C and is fully unblocked by 675–685°C, indicating hematite as the ChRM carrier.
Specimens from the red bed sites (II13, II18, and II19), and the pink arenite of site II12 were subject to thermal treatment because hematite was suspected as the remanence carrier. At site II12 the ChRM was isolated by 600°C, indicating that the remanence resides in magnetite and that the pink coloration is secondary (Figure 7). At sites II13 and II19, the ChRM was isolated between ~600 and 680°C, showing that the magnetization is carried by hematite (Figure 7). Specimens from site II18 lost over 90% of the remanence by 600°C and the ChRM was isolated between ~350 and 600°C (e.g., II18D1), thus the ChRM of site II18 is interpreted to reside in magnetite. The red coloration of the sediments from II18 is due to hematite pigment, but the hematite is not an important remanence carrier.
The dominant groups of site-mean directions are oriented north and upward or southeast and downward. However, ChRM directions isolated from certain sites (II4, II5, II6, and II9) define multiple and distinct groups of directions, which reflect the variation in grain size.
Site-mean directions and respective uncertainties calculated using Fisher (1953) statistics are reported in Table 1 and plotted in Figure 8 together with the high-temperature component mean directions isolated from the mafic sills. We note that some of the directions isolated have large scatter, and this observation will be discussed below. We also note that the slump-fold sampled at site IT5 displayed better clustering of directions in geographic than stratigraphic coordinates, and statistics are reported in Table 1. Wherever multiple directions have been isolated from a single site, the mean directions have been labeled according to the general orientation of the vector (e.g., II4nu, II4nd, II4su). Most of the north and up-oriented mean directions plot close to those isolated from the sills at IT9 and IT14 and around the present-day field and time-averaged dipole field directions (cf. Figure 3). A group of directions isolated from the sedimentary rocks, however, plots close to the direction from IT15, while other directions do not appear to correlated to those of the mafic sills (Figure 8).
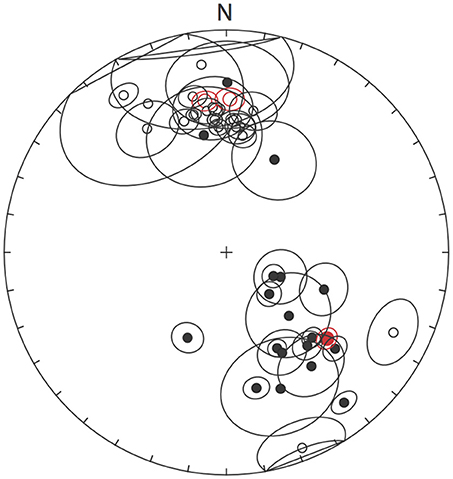
Figure 8. Site-mean directions of the Itararé Group rocks plotted on a stereonet: solid (open) symbols are projections on the lower (upper) hemisphere; black and red symbols are for sedimentary and igneous rocks, respectively. See text for details.
Virtual Geomagnetic Poles (VGPs) and circles of confidence for all the mean directions isolated from the igneous and sedimentary rocks are reported in Table 1 and plotted in Figure 9. VGPs from the igneous rock, intermediate temperature component, specimen directions are plotted in Figure 9A together with the mean high temperature component VGPs. The mean reference Early, middle and Late Cretaceous poles (Somoza and Zaffarana, 2008) are also plotted to aid the discussion of the data. The intermediate temperature component VGPs define an elongated pattern between the mean Early Cretaceous and IT14 VGP, to ~45°E and 60°S. A mean intermediate-temperature VGP and confidence ellipse (Kent, 1982) are also plotted. Because the intermediate temperature component is identical to the present-day field direction for the study area at the time the field work was performed, this VGP provides a useful reference for the discussion presented below.
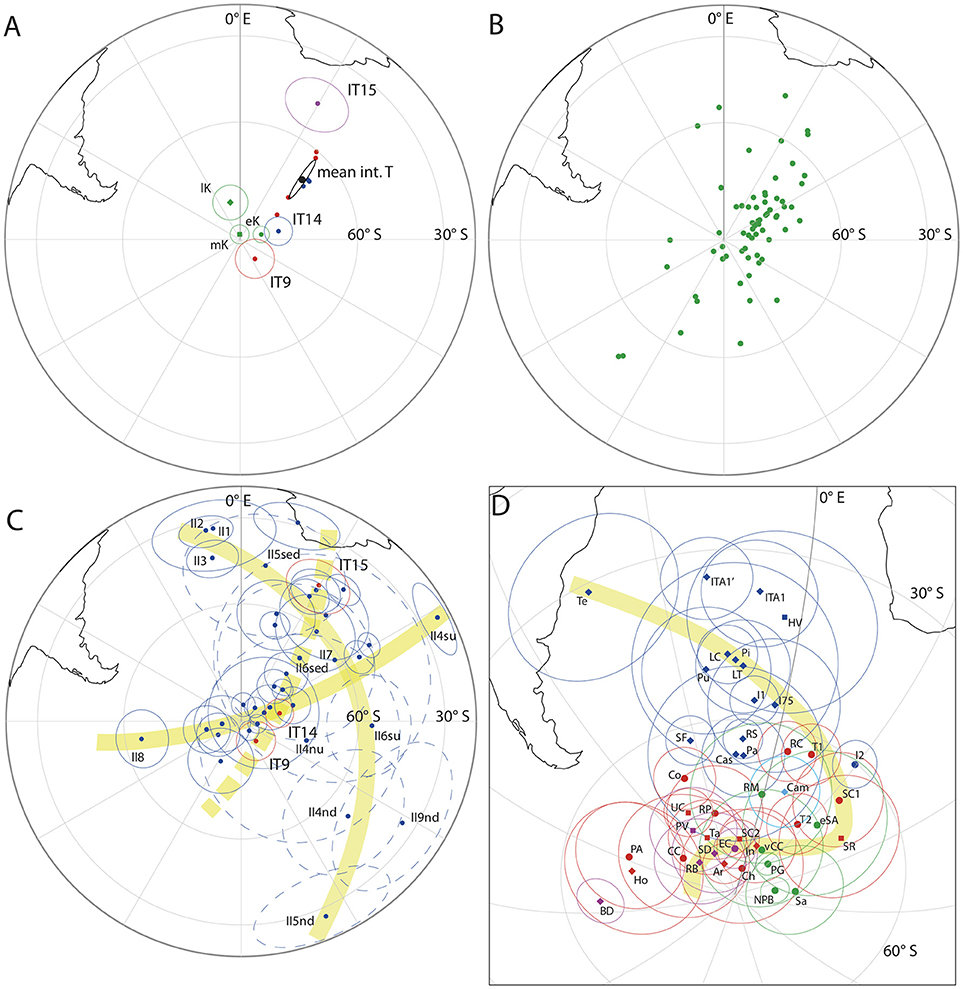
Figure 9. Virtual Geomagnetic Poles (VGPs): (A) VGPs calculated from the high temperature component magnetizations isolated from the mafic sills at IT9 (red), IT14 (blue), and IT15 (purple), and from the mean low temperature component (black) isolated from IT9 and IT14. The reference early, mid- and late Cretaceous paleopoles (green) of Somoza and Zaffarana (2008) are plotted for reference; (B) VGPs from mafic intrusions and lava flows from the same study area reported by Ernesto et al. (1999); (C) VGPs derived from the sedimentary rocks of the Itararé Group (blue) and from the mafic sills (red). Dashed lines indicate VGPs with higher scatter (α95 > 15°; k < 10). Highlighted in yellow are the approximate trends of the distributions of VGPs. Dashed-highlight is for the VGPs that follow the distribution of the igneous rock-derived VGPs, solid-highlights are for the N-S and E-W distributions of VGPs (see text and Table 1); (D) Paleopoles from relevant South American rock formations, for the Fm identifiers refer to Table 2. Blue, red, purple, light blue and green are Carboniferous, Permian, Triassic, Jurassic, and Cretaceous data, respectively. For each geologic period, the circles, squares and diamonds are for early, mid- and late, respectively. Highlighted in yellow is the problematic loop in the classic APWP as reported by Tomezzoli et al. (2013). See text for details.
The VGPs calculated from the igneous rocks confirm the results obtained by Ernesto et al. (1999), who calculated VPGs from paleomagnetic data derived from dykes, sills, and lava flows, that follow an elongated distribution that includes the VGPs from the three sills collected in this study. For a direct comparison we have plotted the results of Ernesto et al. (1999) in Figure 9B. Note that each VGP is calculated from an individual igneous unit (sill, dyke or flow) with a mean sample number of ~8, therefore these are comparable to the VGPs calculated in our study.
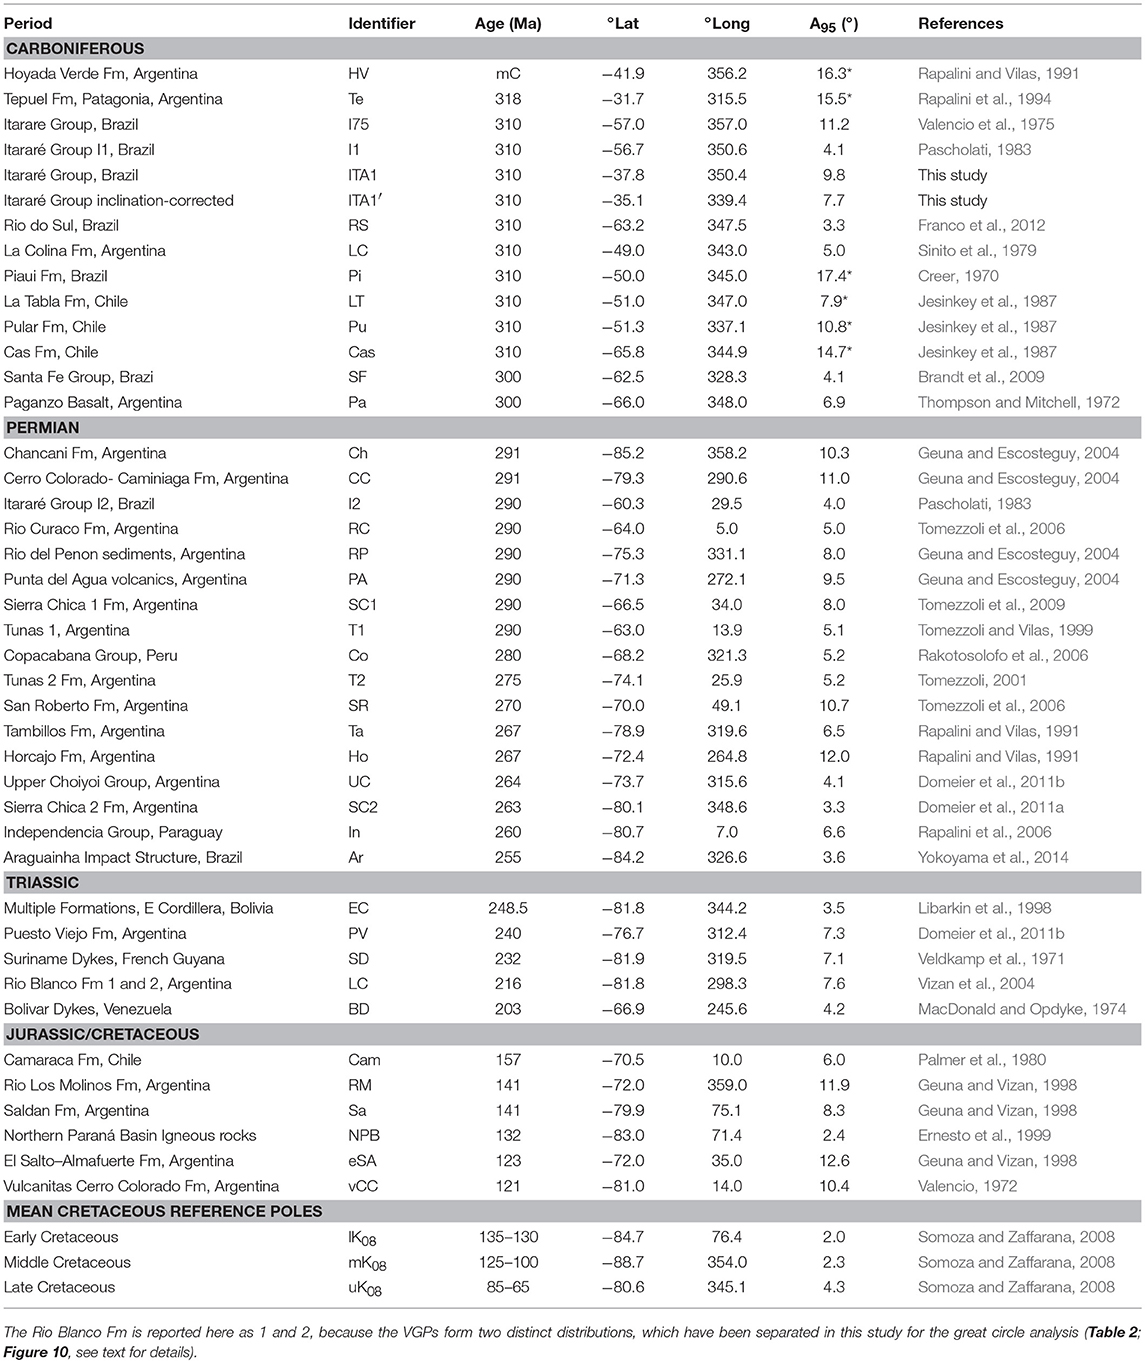
Table 2. South paleopoles, as reported in the literature, utilized in this study and separated by age: Identifiers correspond to the labels used in Figure 9; Ages are reported in Ma; degrees latitude, degrees longitude; A95 is 95% circle of confidence around the mean of the VGPs; *A95 was recalculated because not reported in the original study [either the α95 (La Tabla, Pular, Cas), the dm-dp (Hoyada Verde, Tepuel), or the csd (Piaui) of the directions were reported].
The site-mean VGPs calculated for the sedimentary rocks are plotted in Figure 9C together with the VGPs calculated for the mafic sills. All VGPs appear to form elongated distributions, highlighted in Figure 9C. Arguably, such distribution of VGPs are not Fisherian and should not be averaged using Fisher (1953) statistics to calculate a mean paleopole. We do note, however, that the VGPs of many sedimentary rocks cluster around those of the igneous sills.
Discussion
Rock-Magnetism of the Mafic Sills
Low temperature remanence measurements of the three mafic sills that intrude the Itararé Group reveal SD-PSD behavior for the sill at IT9 and somewhat larger grains for the sill at IT14, whereas the remanence of the sill at IT15 indicates MD grains (FC-ZFC curves in Supplementary Figure 3).
The variation in grain size is confirmed by the RTSIRM curves. According to Özdemir et al. (2002), RTSIRM losses of ~15, ~20, and ~55% upon temperature cycling correspond to grainsizes of 37, 100, and 220 nm, respectively, suggesting that the RTSIRMs of the sills are dominated by grains of at least 100 nm (IT9) and up to ~200 nm (IT15). These grain sizes are all within the PSD-MD range (SD-MD transition 50–60 nm, e.g., Dunlop, 1973). Presence of larger PSD-MD grains is further confirmed by the frequency dependence peaks observed between 35 and 50 K (Supplementary Figure 4) in the in-phase and out of phase susceptibilities.
High temperature susceptibility experiments (Supplementary Figure 5) indicate oxidized maghemite rims on magnetite grains for sills IT9 and IT14, and one dominant magnetite grain size for IT15 (Supplementary Figure 5).
Unmixing of backfield and IRM acquisition curves (Figure 5) reveal two distributions of coercivities within each sill. While for IT15 the coercivities clearly correspond to MD grains, the higher coercivity components for IT9 and IT14 are indicative of SD grains. For all specimens the mean coercivities are shifted toward lower fields on demagnetization compared to the acquisition curves, consistent with interacting SD and/or PSD-MD grains (Henkel, 1964; Cisowski, 1981).
Room and 400°C temperature FORC diagrams (Supplementary Figure 7) show interacting SD distributions for the sills at IT9 and IT14 and dominant MD distributions for IT15.
We interpret the high coercivity distributions of IT9 and IT14 as interacting SD grains. All sills possess low coercivity MD grains. Comparison of the MDFs (Figure 4B) and coercivity distributions (Figure 5) in all sills indicate that the lower coercivity components are responsible for most of the paleomagnetic remanence. In IT9 and IT14 the remanence is isolated up to ~35 and 60 mT, respectively, indicating that the higher coercivity interacting SD grains contribute only partially to the remanence component carried by larger grains. The interacting nature of the SD grains suggests a secondary thermo-chemical origin, rather than primary crystallization. However, the shape of the thermal demagnetization curves in Figure 4A, for IT9 and IT14, with relatively narrow unblocking temperature ranges, suggest that these particles carry the same remanent component as the larger grains. Therefore, a common event responsible for the growth of the SD particle would have likely resulted in a magnetic overprint of the softer MD (and possibly PSD) particles. These larger grains are of likely primary origin, and formed during slow cooling of the intrusions, however their magnetization is probably secondary, yet these particles retain high unblocking temperatures.
A viable mechanism for high unblocking temperature of MD particles (>400°C) was proposed by Dunlop et al. (1997). Following multidomain partial TRM theory of Dunlop and Xu (1994), they explained anomalously high laboratory unblocking temperatures of magnetic overprints close to the Curie temperature (TC) of the remanence carrying grains by means of a thermoviscous magnetization model for MD particles. According to Dunlop et al. (1997), for the particularly high unblocking temperatures observed in their study, a low temperature thermoviscous magnetization alone would likely not be sufficient to explain the data. They propose a combination of thermoviscous magnetization and superimposed chemical weathering as responsible for the observed unblocking temperatures. This model agrees with the presence of interacting SD and MD grains within the mafic sills that intrude the Itararé Group that both carry the same remanence components. These interpretations are also consistent with the paleomagnetic analysis presented below.
Origin of the Magnetization Components and Elongation of Paleomagnetic Directions
The intermediate temperature magnetization component directions isolated from the sills at IT9 and IT14 are indistinguishable from the present-day field direction, suggesting that this component represents a recent magnetic overprint carried by the softer magnetite grains (Figures 3A,B). The higher temperature directions obtained from the same sills plot close to the time-averaged present-day geomagnetic field direction, but show an elongation toward the present-day field direction (Figure 3C). Thermal demagnetization cannot fully clean these overprinted directions, which according to the shape of the thermal demagnetization curves of Figure 4A resides in both the larger magnetite grainsize fraction and in the interacting SD grains. On the other hand, AF cleaning only isolates one component of magnetization, which corresponds to the high temperature component, likely because the initial 5 mT steps are too coarse to resolve the component carried by the softer grains. The remanent directions are isolated between ~7.5 and ~35 mT at site IT9 and between 5 and ~60 mT at site IT14. Unmixing of the coercivity spectra upon demagnetization (Figures 5A,C) reveals two coercivity distributions centered at 20.0 and 56.8 mT for IT9, and 25.0 and 57.6 mT for IT14. Comparing these coercivity distributions to the AF ranges that isolate the magnetization components indicates that the magnetizations of both sills mostly reside in the lower coercivity grains. This observation is further supported by the MDFs from the AF demagnetization experiments that are 30.0 mT for IT9 and 35.5 mT for IT14 (Figure 4B) and therefore well-within the AF ranges that isolate the remanent directions. These observations suggest that the larger PSD-MD grains are the dominant remanence carriers for these sills.
It follows that the directions isolated must either be an ancient magnetization mostly residing in larger PSD- MD particles that is coincidentally close to the time-averaged field directions, or a recent overprint recorded by the same grains, which protracted over enough time to capture the time-averaged field. In either case, the elongation attests to very recent overprints toward the present-day field that cannot be fully removed by either thermal or AF treatment, and likely resides in the high-coercivity interacting SD grains. To summarize, the harder SD grains carry a very recent magnetic overprint that is visco-chemical in origin and cannot be fully erased, whereas the dominant distribution of PSD-MD grains carries the high-temperature component, which is either a primary magnetization coincidentally close to the time-averaged dipole field direction, or a secondary thermo-viscous remagnetization.
Determining the magnetic carrier of the components isolated in the sill at IT15 using both AF and thermal demagnetization is more straightforward. These reside in MD magnetite, as indicated by all rock-magnetic measurements performed, and more specifically in two overlapping grain size distributions. The magnetization isolated here is distinct and has opposite polarity to that of the other sills. This magnetization also resides in MD magnetite, however, it does not appear to be overprinted by the present-day field. It must therefore represent a stable primary direction or an ancient overprint that is resistant to laboratory cleaning, in which case it would likely be a thermo-viscous remagnetization.
The sills likely intruded the Carboniferous sedimentary sequence during the post-Jurassic extensional events that are responsible for the widespread magmatism in the Paraná/Chaco-Paraná basins. The three sills collected in this study crop out proximally to some igneous rocks reported on by Ernesto et al. (1999), and are surrounded by other outcrops on all sides. Moreover, the VGPs derived from these units follow the same distribution that approximately follows the 30 and 210° E meridians. It is therefore reasonable to assume that these rocks are related, providing a precise age constraint (133–130 Ma) for these intrusions.
It was previously determined that the directions isolated from the three sills have been overprinted by the present-day magnetic field. The elongation of the VGPs derived from the sills, dykes and flows sampled in our and Ernesto et al.'s (1999) studies may therefore be a consequence of either incomplete removal of the remagnetization component or an anomalous geomagnetic field behavior during the Cretaceous. Discriminating between the two possibilities would be speculative, however, because both datasets are derived from dual-polarity data we prefer to interpret these magnetizations as primary, but with incomplete removal of the present-day field overprint in some sites.
The VGPs of the Itararé Group sedimentary rocks appear to define distinct trends.
A first trend follows the distribution of the VGPs from the three mafic sills and is defined by the cluster of many VGPs around them, and is highlighted with a dashed line in Figure 9C. It is reasonable to assume that these sedimentary rocks were remagnetized by the intrusive rocks, and this distributions is further explained by comparison with the VGPs obtained from igneous rocks by Ernesto et al. (1999) (Figure 9B). It is apparent that many VGPs obtained from Permo-Carboniferous sedimentary rocks are distributed along the same elongated trend of the Early Cretaceous igneous rocks, providing solid evidence for remagnetization of these rocks.
Two other trends are highlighted in Figure 9C, and also include the VGPs obtained from the three mafic sills, but have different orientations. One distribution (denoted E-W) extends from the VGP of site II8 into the opposite hemisphere toward II4su, including the VGPs of IT9 and IT14a.
The other distribution (denoted N-S) extends from the accepted Late Carboniferous pole location, as defined by the VGPs of sites II1, II2, and II3, to the opposite hemisphere toward the VGP calculated from direction II5nd, and includes the VGP of the sill at IT15, defining a great circle-fit with strike and dip of 161.4 and 66.2° (N = 25). Notably, some of the VGPs defining this distribution (II4nu, II4nd, II5sed, II5nd, II6sed, II6su, II7, II9nd) have large scatter (α95 > 15°; k < 10, see Table 1) and are shown with dashed α95s in Figure 9C. These VGPs appear to “pin” the distribution, however, eliminating them from the analysis results in a great circle-fit with similar orientation (strike 164.8°, dip 67.6°; N = 17). The similarity of the fits suggests that the elongation is a real feature, and the high scatter of certain VGPs is an effect of remagnetizations, possibly associated with other unrecognized igneous bodies or migration of fluids associated with the magmatic events.
Interestingly, if one disregards the VGPs east of the intersection of the distributions (i.e., VGPs II4su, II4nd, II5nd, II6su, II9nd) under the assumption that these represent spurious magnetizations and/or based of their higher scatter, then the remaining VGPs define a loop that is remarkably similar to the classic South American APWP (e.g., Tomezzoli et al., 2013, highlighted in yellow in Figure 9D).
Evidence for Widespread Remagnetizations
In Figure 9D and Table 2 we report South American paleopoles that range in age between the Carboniferous and the Triassic. In yellow we highlight the APWP reported by Tomezzoli et al. (2013), featuring the distinctive loop. The cusp of this loop is inconsistent with a Pangea A assemblage (e.g., Brandt et al., 2009; Font et al., 2012), and it has been argued by these authors that the loop is either the result of unremoved magnetic overprints (mostly Cretaceous) and/or of the overall quality of specific paleomagnetic poles. Significantly, the alternative to the Pangea A reconstruction, Pangea B (Irving, 1977) which is a direct consequence of the loop, is considered unrealistic by many authors because of the high displacement rates required to return to the accepted Pangea A assemblage in the Jurassic (e.g., Domeier et al., 2012). In fact, calculating the tectonic displacement along the loop by utilizing the poles and their ages as reported by Tomezzoli et al. (2013) results in a mean rate of ~18 cm/yr. Such high velocity is in stark contrast with the average 1–8 cm year plate motion based on current sea floor spreading rates and assumed to have been valid through geologic history. It thus appears that the loop, and implicitly the Pangea B reconstruction, are unrealistic under multiple lines of evidence, warranting an in-depth investigation of the remagnetization and data quality postulations.
Discordant paleomagnetic data have been long recognized for Carboniferous to Triassic rocks and elongations in the distributions of younger (Jurassic and Cretaceous) South American VGPs and discordant associated paleopoles have also been the focus of extensive debate. Having recognized the elongated distributions in the VGPs of the Itararé Group sedimentary rocks (Figure 9C), we systematically evaluate the distributions of the VGPs that define the Carboniferous through Triassic portion of South America's APWP. In this analysis we also include some of the most problematic Late Jurassic and Early Cretaceous paleopoles, in search of patterns that may be consistent with the mafic sills that intrude the Itararé Group. The paleopoles evaluated are listed in Table 2 and plotted in Figure 9D. Unfortunately, not all published studies list the individual VGPs or directions used to calculate the mean formation paleopoles. Therefore, Table 2 and Figure 9D include additional Permo-Carboniferous paleopoles that could not be used for our analysis but are widely cited. The reference Cretaceous paleopoles of Somoza and Zaffarana (2008) are also reported in Table 2.
A total of 40 distributions of VGPs deriving from 37 studies were utilized, including the current work on the Itararé Group. We note that for the Rio Blanco Fm, as for the Itararé Group sedimentary rocks, the VGPs define two distinct distributions and have been subdivided accordingly. Likewise, the VGPs of the Itararé Group have been subdivided into 3 distributions, one for the three mafic sills (IT Sills) and two for the N-S (IT N-S) and E-W (IT E-W) distributions of the sedimentary rocks. All distributions used are listed in Table 3.
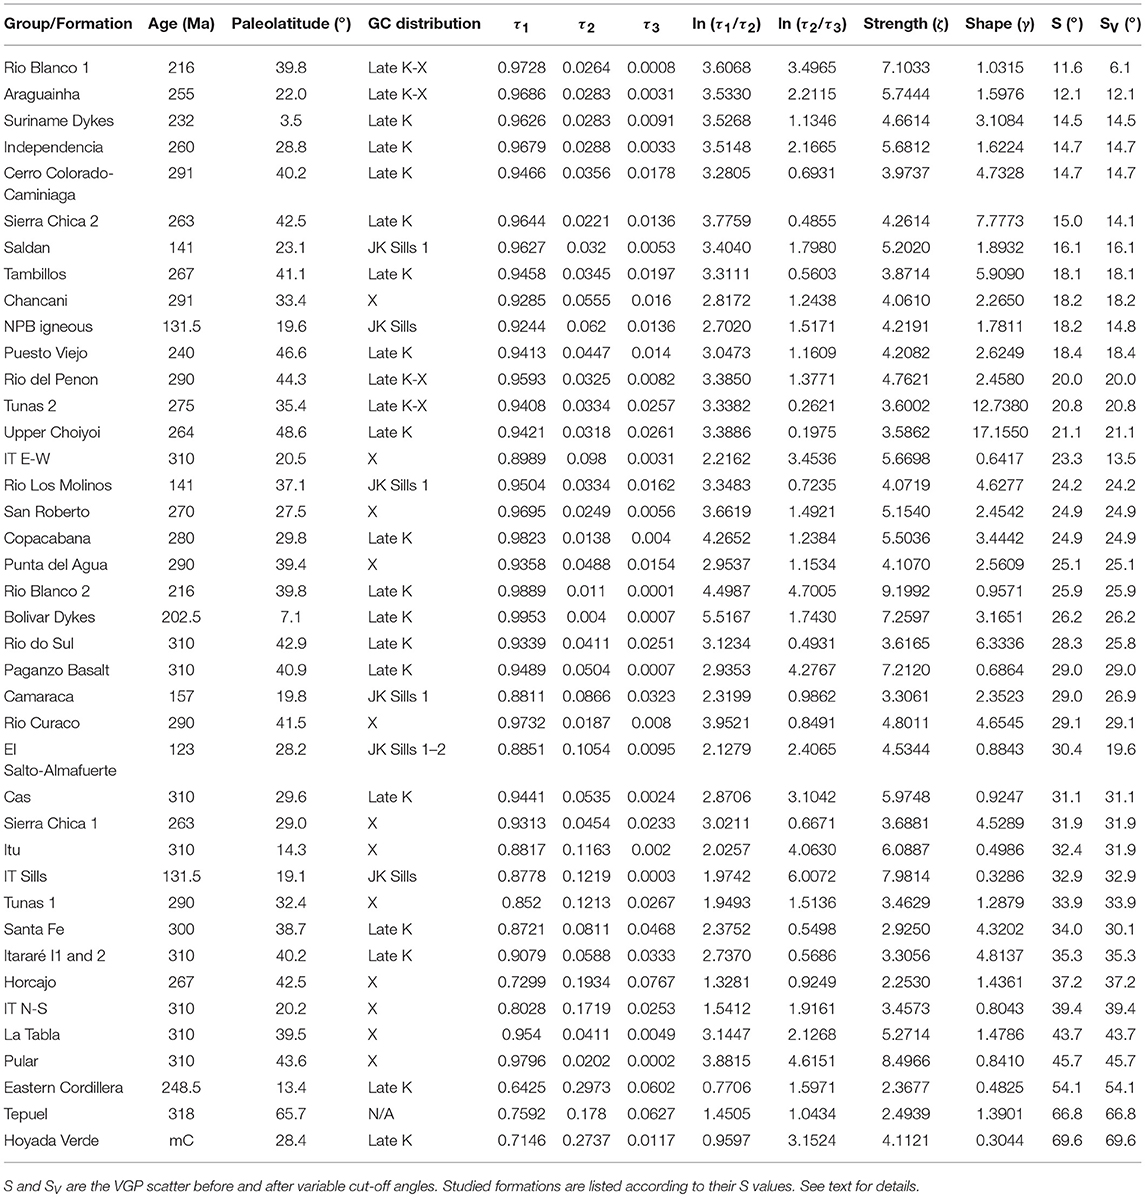
Table 3. Maximum, intermediate and minimum principal components (τ1, τ2, and τ3, respectively) of the VGP great-circle fits, and calculated shape (g) and strength (z) parameters.
We analyzed the elongation of the distributions of South VGP from each rock Formation and their mean intersections. Similarly to the analysis of remagnetization circles (McFadden and McElhinny, 1988), it is assumed that if the magnetizations are primary, the elongations of VGPs intersect at the mean paleopole position for the corresponding age of the magnetizations. Conversely, if the rocks are remagnetized, the great circles intersect at a position consistent with the pole for the time of the secondary magnetization.
For the purpose of determining whether Carboniferous, Permian and Triassic rock formations, including the Itararé Group sedimentary rocks, have been remagnetized by a common Jurassic/Cretaceous event, rock formations of these ages are analyzed together. The mafic sills that intrude the Itararé Group in the Early Cretaceous are analyzed with the Late Jurassic/Early Cretaceous formations. The expectation is that if the magnetizations are primary, the formations would intersect at distinct positions according to their ages, thus defining the South American APWP.
Because the VGPs are derived from both normal- and reverse-polarity data, they are treated as lines (each of which points in two opposite directions) rather than rays (each of which points in one direction only). For each formation, the VGPs can be summarized by a scatter matrix T (Mardia and Jupp, 2000, section 9.2.2). The eigenvalues are τ1 ≥ τ2 ≥ τ3 ≥ 0, and the eigenvector associated to τ3 is the pole to the best-fit plane through the VGPs. In this way, a plane is associated to each formation. The rock formations are manually grouped into clusters with similar planes. For each cluster, the scatter matrix of the plane poles is computed. The τ3 eigenvector of that matrix is then a best fit to the intersection of the planes and a point estimate of the intersection of the elongation of the original VGPs. Bootstrapping the analysis (e.g., Efron and Tibshirani, 1993; Tauxe et al., 2016a) produces point estimates P1, P2,…, P1000, which form an elliptical cloud centered near the original point estimate P. Using Mahalanobis distance (Mahalanobis, 1936) in the tangent space at P, one can construct an ellipse that contains 95% of the Pi. This ellipse constitutes a 95% confidence region for the intersection of elongation. Results of this technique are shown in Figure 10.
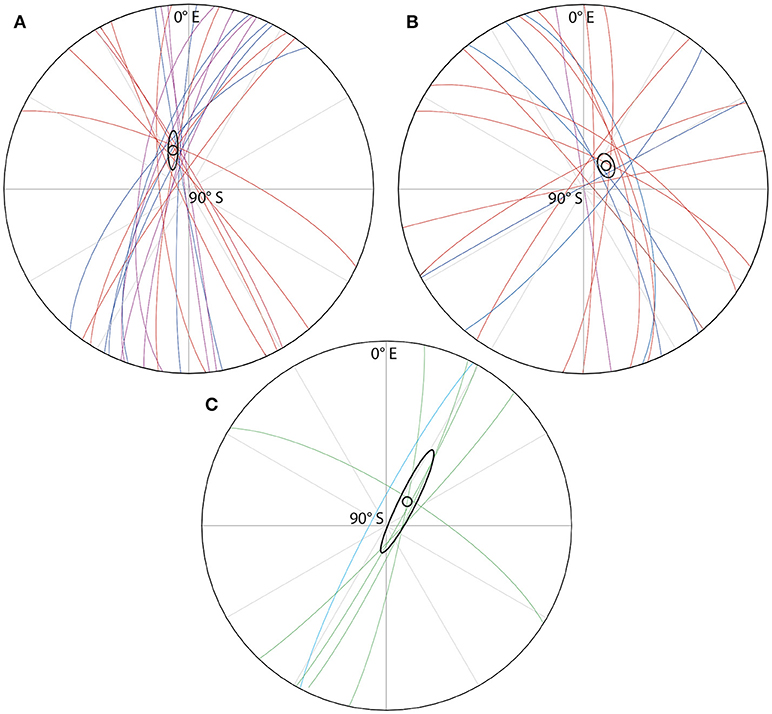
Figure 10. Great circle analysis of VGP elongations. Stereonet projections of great circle-fits through the VGPs of the rock formations studied. The South pole is in the center and the prime meridian is vertical through the plots. Blue, red, purple, light blue and green data are for Carboniferous (and intruding sills), Permian, Triassic, Jurassic, and Cretaceous data. Intersections of great circles and bootstrap 95% confidence ellipses are black symbols. (A) “Late Cretaceous” distribution; (B) “X” distribution; (C) “JK-Sills” distribution. See text for details.
The Carboniferous through Triassic formations define two distinct groups with intersections in the NW and NE quadrants of a stereonet (upper hemisphere), irrespective of the age of the rocks (Figures 10A,B, respectively). The intersection of the first group (Lat −71.7°, Long 337.8°; confidence ellipse: Lat range −79.2 to −63.5°; Long range 318.6–347.3°) coincides with the mean Late Cretaceous reference pole, will be referred to as “Late K.” The second group has a mean intersection that does not coincide to any Cretaceous reference pole and is referred to as “X” (Lat −75.5°, Long 44.5°; confidence ellipse: Lat range −79.4 to −71.4°; Long range 25.9–66.7°).
We note that three Permian and one Triassic rock formations, the Araguainha, the Tunas 2, the Rio del Penon, and the Rio Blanco (distribution 1), have distributions that fit equally well the “Late K” and the “X” groups. It is perfectly acceptable for a rock to record multiple magnetizations and therefore have a distribution of VGPs that is elongated between the two latest magnetizations. Furthermore, the two intersection positions are located 18.1° apart, and therefore it is not unreasonable that certain formations will have distributions of VGPs that are close to both intersections. Likewise, the distribution of the Tepuel Formation has a different orientation from the other formations and its τ3 does not fit a common great circle. In virtue of this it has not been included in the two groups, and possibly represents a primary and distinct magnetization.
The sills and other Late Jurassic/Early Cretaceous rocks, instead define a broad distribution that intersects in the NE quadrant of a stereonet. This distribution, labeled “JK-Sills,” intersects at a position virtually identical to “X” (Lat −75.7°, Long 40.6°; confidence ellipse: Lat range −89.4 to −53.9°; Long range 26.0–190.1°), but its uncertainty is strongly elongated, reflecting both the elongation of the data, and the fact that most great circles intersect at small angles to each other (Schmidt, 1985).
On a first analysis it is apparent that regardless of their age, the Carboniferous through Triassic rocks share two common intersections, which are therefore interpreted as remagnetizations. One of these (Figure 10A), coincides with the Late Cretaceous reference pole (Table 2; Figure 9A) and is thus interpreted as a Late Cretaceous remagnetization associated with the extensional events tied to the opening of the South Atlantic and related magmatism. The second remagnetization “X,” instead coincides with that of the “problematic” Late Jurassic/Early Cretaceous poles (Table 2; Figures 9C, 10B,C) and thus either reflects a remagnetization event in the Jurassic/Cretaceous (i.e., the magnetization of the J/K rocks is primary), or a later remagnetization that also affected these Jurassic/Cretaceous rocks (i.e., the magnetization of the J/K rocks is also secondary). The intersections of the Jurassic/Cretaceous rocks and the sills that intrude the Itararé Group rocks (Figure 10C), however, span the position of the VGP calculated from the low temperature component isolated from the sills at IT9 and IT14 (Table 1; Figures 3A,B, 8A), which in turn is indistinguishable from the present-day field direction (Figure 3B). It follows that magnetizations “JK-Sills” (indistinguishable from magnetization “X”) is either somewhat overprinted by the present-day field direction, or is a primary Late Jurassic/Early Cretaceous magnetization and its elongation reflects the geomagnetic field behavior, and coincidentally overlaps with the present-day field direction.
To constrain the shape of the VGP distributions further, the eigenvalues of the great-circle fits are plotted on a Woodcock (1977) diagram (Figure 11) as ln (τ1/ τ3) vs. ln (τ2/τ3). On such a diagram, perfectly elongated distributions (uniaxial girdles) lie along the abscissa, whereas perfect uniaxial clusters lie along the ordinate axis. The variation in shape is tracked by the value of γ = ln ((τ1/τ2)/ln(τ2/τ3). Furthermore, the strength of such distributions can be evaluated in terms of ζ = ln(τ1/τ3), with isotropic shapes at the origin. The eigenvalues are reported and values of γ and ζ are reported in Table 3.
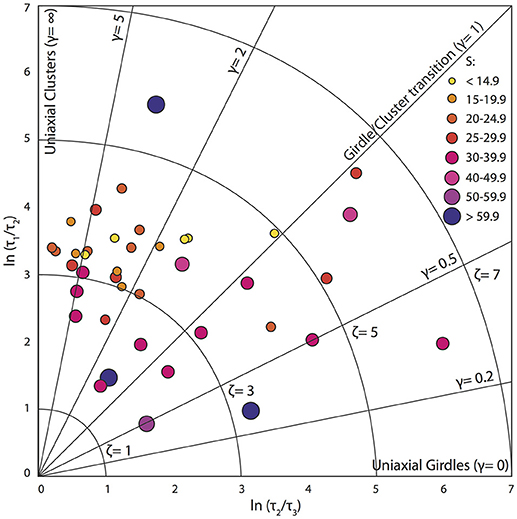
Figure 11. Woodcock (1977) diagram. Shape and strength of the VGP distributions plotted as ln (τ1/τ3) vs. ln (τ2/τ3), as a function of VGP scatter S. See text for details.
Additionally, for each Fm. we have also calculated the angular VGP scatter (S) (e.g., McFadden et al., 1988) of all VGPs, and after applying a variable cut-off angle (SV, Vandamme, 1994). These values are reported in Table 3. We note that the variable cut-off angle only makes a difference to eight of the VGP distributions, however, we point out that to fully evaluate the shape and strengths of the distributions, cut-off angles should not be applied as these will inevitably modify the shape parameters, and outliers should be removed based on the paleomagnetist's experience.
The Woodcock (1977) diagram in Figure 11 shows the Fms grouped according to their scatter values, S. Rather strikingly, S tends to increase with elongation (girdling). Scatter also increases with isotropy, reflected in greater S values toward the origin. Overall, it appears that many of the data are too girdled (γ > 2) to reflect primary magnetizations that average paleosecular variation. Conversely, for data that are too clustered and/or have too strong distributions (γ < < 5 and ζ > 5) these distributions may be unrealistic to reflect natural DRMs or TRMs. To further evaluate the scatter of these data, we plot S vs. the paleolatitude (Table 3) calculated from their reported paleomagnetic inclinations (or reported poles and site locations), together with their bootstrap confidences (Figure 12). For this analysis we have separated the igneous and sedimentary rocks, and have plotted the Model G fit (McFadden et al., 1988) calculated by Oliveira et al. (2018) for the Permo-Carboniferous Reverse Superchron (PCRS) using global data, and the Model G fit for the Cretaceous Normal Superchron (CNS) of Biggin et al. (2008), also from global data.
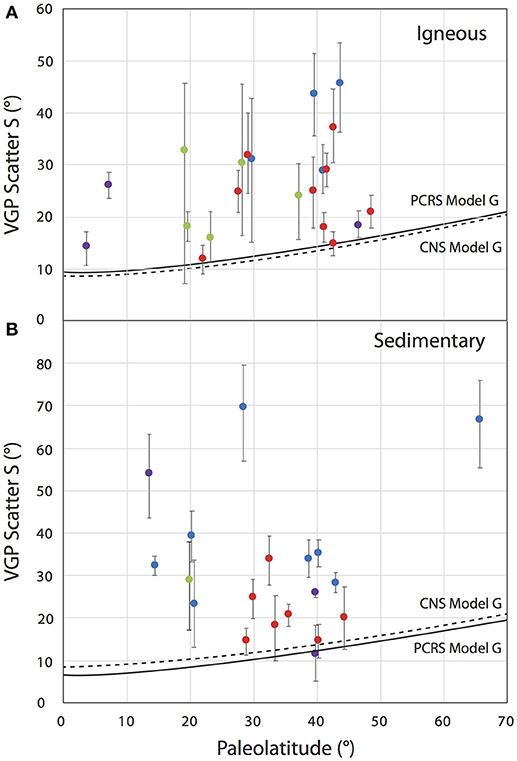
Figure 12. VGP scatter, S, vs. paleolatitude calculated from igneous (A) and sedimentary (B) rock formations of different ages: blue, red, purple and green are for Carboniferous, Permian, Triassic, and Jurassic-Cretaceous data, respectively. Error bars are based on the minimum and maximum values of S determined by bootstrapping. Solid curves are the Model G fit for the Permo-Carboniferous Reverse Superchron (PCRS Model G) of Oliveira et al. (2018), whereas the dashed curves are the Model G fit for the Cretaceous Normal Superchron (CNS Model G) of Biggin et al. (2008); see text for details.
It is apparent that the majority of the data analyzed in this study do not fit either the PCRS or CNS models, suggesting that the scatter of these data may be the result of unremoved secondary magnetizations, which increased the elongation and/or the strength of the distributions (see Figure 11). In general, however, we must stress that while a large (or too small) S value may be an indication of remagnetization, in general S cannot be used as a tool alone to identify remagnetizations. However, the observations that the data used in this study are highly elongated and/or possess strong distributions, the observation that the VGP distributions have common intersections regardless of the rock ages, together with the observation that the VGP scatter generally does not agree with global models of VGP scatter for similar aged-rocks, make a valid case for widespread remagnetizations in South America. The extent of the remagnetizations, however, needs to be evaluated by rock formation. That task is beyond the scope of this study.
We do realize that the possible mechanism for remagnetization suggested here for the igneous rocks, thermo-viscous remagnetization of larger PSD-MD grains, may not appear convincing to many, partly due to the still relatively poor understanding of MD grains. However, the evidence compiled for Jurassic/Cretaceous remagnetizations of older rocks appears overwhelming. Very similarly, Veselevskiy et al. (2016), reported convincing evidence for widespread Early Jurassic remagnetizations in Fennoscandia that affected 500 Ma to ~2 Ga rocks, with significant consequences for the APWP of Baltica. The authors of that study were not able to provide convincing petrographic or magnetic evidence or mechanisms for the remagnetizations, and speculate that migration of low-temperature fluids resulted in chemical remagnetization.
Regarding the Itararé Group rocks, specifically, we had already noticed that the three II1, II2 and II3 sites have a significantly different lithology than the rest of the Group rocks. Moreover, the VGPs calculated from these sites are located at the end of one of the N-S distributions (see Figure 9C), which is also a paleopole position consistent for Carboniferous rocks (cf. Figure 9D). A paleopole calculated from these sites, ITA1, is reported in Figure 9D and Table 2 (Lat −37.8°, Long 350.4°, A95 9.8°). It is located at lower latitudes than most of the other Carboniferous paleopoles, suggesting that this pole is unaffected by the remagnetizations described. We also note that the ITA1 paleopole is located at a similar latitude as the Carboniferous Tepuel paleopole, the only formation in our study that has a distribution of VGPs that is independent of the other rock formations, and therefore is possibly primary. Detailed paleomagnetic results of the sedimentary rocks of the Itararé Group will be presented in a dedicated article, together with their paleogeographic implications. However, we report here that an inclination correction of the ITA1 paleopole (Lat −35.1°, Long 339.4°, A95 7.7°) brings this pole into closer agreement to the Tepuel Fm paleopole (ITA1′ in Figure 9D and Table 2). For future investigations, we also suggest that a more modern study of the Tepuel Fm, whose pole currently has a large circle of confidence, may increase its precision. Likewise, we suggest that a new study of the Hoyada Verde Fm paleopole, which is the closest to the Itararé ITA1 pole (Figure 9C), may help better constrain the magnetization history of this Fm. The Hoyada Verde Fm VGPs show the most pronounced elongation and VGP scatter of all the studied formations, suggesting that these VGPs may likely have been dragged toward a younger paleopole position, and away from the expected Carboniferous pole position.
Conclusions
We have conducted a detailed paleo and rock-magnetic investigation of the Permo-Carboniferous Itararé Group sedimentary rocks and three intruding mafic sills that were encountered during field work. Paleomagnetic analysis revealed that many of the sedimentary rock sites have paleomagnetic directions that are grouped around those of the intrusive rocks from our and published studies, which have been precisely dated as Early Cretaceous. The intrusive rocks instead have stable magnetization directions that do not agree with the Cretaceous reference poles, but such discordant directions are also encountered in other South American Late Jurassic/Early Cretaceous rocks and have been deemed “problematic” by previous workers. Moreover, the intrusive rocks have magnetic overprints that are stable up to high temperatures that record the present-day field direction.
A detailed rock-magnetic investigation of the remanence-carrying minerals of the intrusive rocks reveals that the present-day overprint is carried by interacting SD magnetite particles, likely of chemical origin. The more stable component is instead carried by a population of PSD-MD magnetite grains.
A great circle analysis performed on VGPs from Carboniferous through Triassic rocks, as well as the “problematic” Late Jurassic/Early Cretaceous rocks from South America, clearly reveals two common intersecting positions, one corresponding to the Late Cretaceous and one of a different age. This observation suggests that all Carboniferous to Triassic rocks have been somewhat overprinted by either a Late Cretaceous magnetization and/or a different magnetization likely associated with a short lived geomagnetic field behavior during the Late Jurassic/Early Cretaceous, and possibly overprinted by the present-day magnetic field. The cause of the secondary magnetizations resides with the well-documented extensional processes that affected South America during the opening of the South Atlantic, and responsible for the widespread magmatism that occurred at that time.
We note that many of the South American paleopoles are inconsistent with the classic Pangea A reconstruction. We have calculated a displacement rate of ~18 cm/yr from the currently-accepted APWP for South America, highlighting how this is unrealistic from a plate motion standpoint. These lines of evidence provide further support for widespread remagnetizations.
The extent of the remagnetizations is formation-specific, but a careful evaluation of the Itararé Group sedimentary rocks allows discriminating sites that are likely unaffected, that enabled calculating a reliable paleomagnetic pole. Moreover, this paleomagnetic pole was corrected for inclination shallowing. Details of the paleomagnetism of the Itararé sedimentary rocks and inclination correction will be presented in a separate study, together with a comparison to other coeval paleopoles and associated paleogeographic implications.
We echo Veselevskiy et al. (2016) in suggesting that the implications of unidentified remagnetization throughout the geologic record may be profound. We find the evidence presented in this study compelling, despite the fact that a solid theoretical background for the remagnetization mechanism is still lacking, and we suggest it should be investigated further.
Author Contributions
DB contributed conception and design of the study, wrote the funding proposal, performed the sampling, data acquisition and analysis and writing of the manuscript. WC performed data acquisition and analysis. JD performed statistical analysis on a section of the manuscript. All authors contributed to manuscript revision, read and approved the submitted version.
Funding
The research was funded by the Sao Paulo Research Foundation (FAPESP) grants 2011/51204-0 and 2011/51228-6. The National Science Foundation Instrument and Facilities grants NSF/EAR 1028690 and 1339505 to the Institute for Rock Magnetism allowed the continuation of the project and partially supporting WC. Additional support for WC was provided by the University of Minnesota's Undergraduate Research Opportunity Program.
Conflict of Interest Statement
The authors declare that the research was conducted in the absence of any commercial or financial relationships that could be construed as a potential conflict of interest.
Acknowledgments
We thank the two reviewers for the detailed comments and suggestions, and the editor John Geissmann for handling the manuscript. We wish to thank Irene Raposo for applying for funding, organizing the field work, and contributing to sampling and data acquisition. Paulo Roberto dos Santos is cordially thanked for providing a detailed overview of the Itararé Group rocks during two field trips and Samuel Pedro Egidio for field-assistance. Mike Jackson and Bruce Moskowitz are kindly thanked for careful proofreading of the manuscript and providing useful comments and suggestions. This article is IRM publication number 1702.
Supplementary Material
The Supplementary Material for this article can be found online at: https://www.frontiersin.org/articles/10.3389/feart.2018.00182/full#supplementary-material
References
Abbot, D. H., and Isley, A. E. (2002). The intensity, occurrence, and duration of the superplume events and eras over geological time. J. Geodyn. 34, 265–307. doi: 10.1016/S0264-3707(02)00024-8
Arab, P. B., Perinotto, J. A., and Assine, M. L. (2009). Grupo Itararé (P-C da Bacia do Paraná) nas regiões de Limeira e Piracicaba – SP: contribuição ao estudo das litofácies. UNESP Geoci. 28, 501–521.
Araujo, L. M., Triguis, J. A., Cerqueira, J. R. da S., and Freitas, L.C. (2000). The atypical Permian petroleum system of the Paraná Basin, Brazil. AAPG Memoir. 73, 377–402.
Araujo, L. M., Yamamoto, J. K., Rostirolla, S. P., Mandrucci, V., and Tankard, A. (2005). Tar sandstones in the Paraná basin of Brazil: structural and magmatic controls of hydrocarbon charge. Mar. Petrol. Geol. 22, 671–685. doi: 10.1016/j.marpetgeo.2005.01.006
Baksi, A. K. (2018). Paraná flood basalt volcanism primarily limited to ~ 1 Myr beginning at 135 Ma: new 40Ar/39Ar ages for rocks from Rio Grande do Sul, and critical evaluation of published radiometric data. J. Volcanol. Geotherm. Res. 355, 66–77. doi: 10.1016/j.jvolgeores.2017.02.016.
Beck, M., Burmester, R., Drake, R., and Riley, P. (1994). A tale of two continents: some tectonic contrast between the Central Andes and the North American Cordillera, as illustrated by their paleomagnetic signatures. Tectonics 13, 215–224. doi: 10.1029/93TC02398
Beck, M. E. Jr. (1988). Analysis of Late Jurassic-recent paleomagnetic data from active margins of South America. J. South Am. Earth Sci. 1, 39–52. doi: 10.1016/0895-9811(88)90014-4
Biggin, A. J., Van Hinsbergen, D. J., Langereis, C. G., Straathof, G. B., and Deenen, M. H. (2008). Geomagnetic secular variation in the cretaceous normal superchron and in the Jurassic. Phys. Earth Planet. Inter. 169, 3–19. doi: 10.1016/j.pepi.2008.07.004
Bilardello, D., and Kodama, K. P. (2010). A new inclination shallowing correction of the Mauch Chunk Formation of Pennsylvania, based on high field-AIR results: implications for the Carboniferous North American APW path and Pangea reconstructions. Earth Planet. Sci. Lett. 299, 218–227. doi: 10.1016/j.epsl.2010.09.002
Boyden, J. A., Müller, R. D., Gurnis, M., Torsvik, T. H., Clark, J. A., Turner, M., et al. (2011). “Next-generation plate-tectonic reconstructions using GPlates,” in Geoinformatics: Cyberinfrastructure for the Solid Earth Sciences (Cambridge: Cambridge University Press), 95–113.
Brandt, D., Ernesto, M., Rocha-Campos, A. C., and dos Santos, P. R. (2009). Paleomagnetism of the Santa Fe Group, central Brazil: Implications for the late Paleozoic apparent polar wander path for South America. J. Geophys. Res. 114:B02101, doi: 10.1029/2008JB005735
Briden, J. C., Smith, A. G., and Sallomy, J. T. (1971). The geomagnetic field in Permo-Triassic time, Geophys. J. R. Astron. Soc. 23, 101–117. doi: 10.1111/j.1365-246X.1971.tb01805.x
Cardozo, N., and Allmendinger, R. W. (2013). Spherical projections with OSXStereonet. Comput. Geosci. 51, 193–205. doi: 10.1016/j.cageo.2012.07.021
Carey, S. W. (1958). “A tectonic approach to continental drift,” in Continental Drift-A Symposium, ed S. W. Carey (Hobart: University of Tasmania), 177–355.
Castillo, J., Gose, W. A., and Perarnau, A. (1991). Paleomagnetic results from Mesozoic strata in the Merida Andes, Venezuela. J. Geophys. Res. 96, 6011–6022. doi: 10.1029/90JB02282
Cembrano, J., Beck, M., Burmester, R., Rojas, C., Garcia, A., and Hervé, F. (1992). Paleomagnetism of lower cretaceous rocks from east of the liquine-ofqui fault zone, southern Chile: evidence of small in-situ clockwise rotations. Earth Planet. Sci. Lett. 113, 539–551. doi: 10.1016/0012-821X(92)90130-N
Cisowski, S. M. (1981). Interacting vs. non-interacting single domain behavior in natural and synthetic samples. Phys. Earth Planet. Inter. 26, 56–62. doi: 10.1016/0031-9201(81)90097-2
Cottrell, R. D., Tarduno, J. A., and Roberts, J. (2008). The Kiaman reversed polarity superchron at Kiama: toward a field strength estimate based on single silicate crystals. Phys. Earth Planet. Int. 169, 49–58. doi: 10.1016/j.pepi.2008.07.041
Creer, K. M. (1970). Studies on rock formations from Northeast Brazil. Phil. Trans. R. Soc. Lond. 267, 463–480. doi: 10.1098/rsta.1970.0052
Davis, J. (2018). geologyGeometry. Available online at: http://www.joshuadavis.us/software/
De Boer, J. (1965). Paleomagnetic indications of megatectonic movements in the Tethys. J. Geophys. Res. 70, 931–944. doi: 10.1029/JZ070i004p00931
Delorenzo Nardi Dias, K., and Scherer, C. M. S. (2008). Cross-bedding set thickness and stratigraphic architecture of aeolian systems: an example from the Upper Permian Piramboia Formation (Paraná Basin), southern Brazil. J. South Am. Earth Sci. 25, 405–415. doi: 10.1016/j.jsames.2007.07.008
Domeier, M., Van der Voo, R., Tohver, E., Tomezzoli, R. N., Vizan, H., Torsvik, T. H., et al. (2011a). New Late Permian paleomagnetic data from Argentina: refinement of the apparent polar wander path of Gondwana. Geochem. Geophys. Geosyst. 12:Q07002. doi: 10.1029/2011GC003616
Domeier, M., Van Der Voo, R., Tomezzoli, R. N., Tohver, E., Hendriks, B. W. H., Torsvik, T. H., et al. (2011b). Support for an “A-type” Pangea reconstruction from high-fidelity Late Permian and Early to Middle Triassic paleomagnetic data from Argentina. J. Geophys. Res. 116:B12114. doi: 10.1029/2011JB008495
Domeier, M., Van der Voo, R., and Torsvik, T. H. (2012). Paleomagnetism and Pangea: the road to reconciliation. Tectonophysics 514–517, 14–43. doi: 10.1016/j.tecto.2011.10.021
Dunlop, D. J. (1973). Superparamagnetic and single-domain threshold sizes in magnetite. J. Geophys. Res. 78, 1780–1793. doi: 10.1029/JB078i011p01780
Dunlop, D. J., and Özdemir, Ö. (1997). “Rock magnetism: fundamentals and frontiers,” in Cambridge Studies in Magnetism, ed D. Edwards (Cambridge: Cambridge University Press), 573.
Dunlop, D. J., Özdemir, Ö., and Schmidt, P. W. (1997). Paleomagnetism and paleothermometry of the Sydney Basin 2. Origin of anomalously high unblocking temperatures. J. Geophys. Res. 102, 27285–27295. doi: 10.1029/97JB02478
Dunlop, D. J., and Xu, S. (1994). Theory of partial thermoremanent magnetization in multidomain grains, 1. Repeated identical barriers to wall motion (single microcoercivity). J. Geophys. Res. 99, 9005–9023. doi: 10.1029/93JB02566
Efron, B., and Tibshirani, R. J. (1993). An Introduction to the Bootstrap. New York, NY: Chapman and Hall, 436.
Egli, R. (2013). VARIFORC: an optimized protocol for the calculation of non-regular first-order reversal curve (FORC) diagrams. Global Planet. Change 110, 302–320. doi: 10.1016/j.gloplacha.2013.08.003
Ernesto, M., Raposo, M. I. B., Marques, L. S., Renne, P. R., Diogo, L. A., and Min, A. (1999). Paleomagnetism, geochemistry and 40Ar/39Ar dating of the North-eastern Paraná Magmatic Province: tectonic implications. J. Geodyn. 28, 321–340. doi: 10.1016/S0264-3707(99)00013-7
Fazzito, S. Y., and Rapalini, A. E. (2016). Magnetic properties of the remagnetized Middle-Ordovician limestones of the Ponón Trehué Formation (San Rafael Block, central-western Argentina): insights into the Permian widespread Sanrafaelic overprint. J. South Am. Earth Sci. 70, 279–297. doi: 10.1016/j.jsames.2016.05.012
Fisher, R. A. (1953). Dispersion on a sphere. Proc. R. Soc. Lond. Ser. A 217, 295–305. doi: 10.1098/rspa.1953.0064
Font, E., Rapalini, A. E., Tomezzoli, R. N., Trindade, R. I. F., and Tohver, E. (2012). “Episodic remagnetizations related to tectonic events and their consequences for the South America Polar Wander Path,” in Remagnetization and Chemical Alteration of Sedimentary Rocks, eds R. D. Elmore, A. R. Muxworthy, M. Aldana, and M. Mena (London: Geological Society, Special Publications), 371.
França, A. B., and Potter, P. E. (1988). Estratigrafia, ambiente deposicional e análise de reservatório do Grupo Itararé (Permocarbonífero), Bacia do Paraná (parte 1). Bol. Geoci. Petrobras 2, 147–191.
França, A. B., and Potter, P. E. (1991). Stratigraphy and reservoir potencial of glacial deposits of the Itararé Group (Carboniferous-Permian), Paraná Basin, Brasil. Am. Assoc. Petrol. Geol. Bull. 75, 62–85.
Franco, D. R., Ernesto, M., Ponte-Neto, C. F., Hinnov, L. A., Berquo, T. S., Fabris, J. D., et al. (2012). Magnetostratigraphy and mid-palaeolatitude VGP dispersion during the Permo-Carboniferous Superchron: results from Parana Basin (Southern Brazil) rhythmites. Geophys. J. Int. 191, 993–1014. doi: 10.1111/j.1365-246X.2012.05670.x
Geuna, S., and Escosteguy, L. D. (2004). Paleomagnetism of the upper carboniferous–lower Permian transition from Paganzo basin, Argentina. Geophys. J. Int. 157, 1071–1089. doi: 10.1111/j.1365-246X.2004.02229.x
Geuna, S. E., and Vizan, H. (1998). New early cretaceous palaeomagnetic pole from Cordoba Province (Argentina): revision of previous studies and implications for the South American database. Geophys. J. Int. 135, 1085–1100. doi: 10.1046/j.1365-246X.1998.00688.x
Harrison, R. J., and Feinberg, J. M. (2008). FORCinel: an improved algorithm for calculating first-order reversal curve distributions using locally weighted regression smoothing. Geochem. Geophys. Geosyst. 9:Q05016. doi: 10.1029/2008GC001987
Henkel, O. (1964). Remanenzverhalten und Wechselwirkungen in hartmagnetischen Teilchenkollektiven. Phys. Status Solidi B 7, 919–929. doi: 10.1002/pssb.19640070320
Holz, M., França, A. B., Souza, P. A., Iannuzzi, R., and Rohn, R. (2010). A stratigraphic chart of the Late Carboniferous/Permian succession of the eastern border of the Paraná Basin, Brazil, South America. J. S. Am. Earth. Sci. 29, 381–399. doi: 10.1016/j.jsames.2009.04.004
Irving, E. (1977). Drift of the major continental blocks since the Devonian. Nature 270, 304–309. doi: 10.1038/270304a0
Irving, E., and Pullaiah, G. (1976). Reversals of the geomagnetic field, magnetostratigraphy and relative magnitude of paleosecular variation in the phanerozoic. Earth Sci. Rev. 12, 35–64. doi: 10.1016/0012-8252(76)90053-2
Janasi, V. A., Freitas, V. A., and Heaman, L. H. (2011). The onset of flood basalt volcanism, Northern Paraná Basin, Brazil: a precise U-Pb baddeleyite/zircon age for a Chapeco-type dacite. Earth Planet. Sci. Lett. 302, 147–153. doi: 10.1016/j.epsl.2010.12.005
Jesinkey, C., Forsythe, R. D., Mpodozis, C., and Davidson, J. (1987). Concordant late paleozoic paleomagnetizations from the Atacama Desert: implications for tectonic models of the Chilean Andes. Earth Planet. Sci. Lett. 85, 461–472. doi: 10.1016/0012-821X(87)90141-5
Kent, J. T. (1982). The Fisher-Bingham distribution on the sphere. J. R. Stat. Soc. Ser. B 44, 71–80.
Kirschvink, J. L. (1980). The least-squares line and plane and the analysis of palaeomagnetic data. Geophys. J. R. Astron. Soc. 62, 699–718. doi: 10.1111/j.1365-246X.1980.tb02601.x
Libarkin, J., Butler, R., Richards, D., and Sempere, T. (1998). Tertiary remagnetization of paleozoic rocks from the Eastern Cordillera and sub-Andean belt of Bolivia. J. Geophys. Res. 103, 30417–30429. doi: 10.1029/98JB02848
Limarino, C. O., and Spalletti, L. A. (2006). Paleogeography of the upper paleozoic basins of southern South America: an overview. J. S. Am. Earth Sci. 22, 134–155. doi: 10.1016/j.jsames.2006.09.011
Linares, E., and Valencio, D. A. (1975). Paleomagnetism and K-Ar ages of some trachybasaltic dykes from Rio de Los Molinos, Province of Cordoba, Republic of Argentina. J. Geophys. Res. 80, 3315–3321. doi: 10.1029/JB080i023p03315
Livermore, R. A., Smith, A. G., and Vine, F. J. (1986). Late palaeozoic to early mesozoic evolution of Pangaea. Nature 322, 162–165. doi: 10.1038/322162a0
Lurcock, P., and Wilson, G. S. (2012). PuffinPlot: a versatile, user-friendly program for aleomagnetic analysis. Geochem. Geophys. Geosyst. 13:Q06Z45. doi: 10.1029/2012GC004098
MacDonald, W. D., and Opdyke, N. D. (1974). Paleomagnetism of Northern South America. Am. Assoc. Petrol. Geol. Bull. 58, 208–215.
Mahalanobis, P. C. (1936). On the generalised distance in statistics. Proc. Natl. Inst. Sci. India. 2, 49–55.
Matos, S. L. F., Yamamoto, J. K., Riccomini, C., Hachiro, J., and Tassinari, C. C. G. (2001). Absolute dating of Permian ash-fall in the Rio Bonito formation, Paraná Basin, Brazil. Gondwana Res. 4, 421–426. doi: 10.1016/S1342-937X(05)70341-5
Maxbauer, D. P., Feinberg, J. M., and Fox, D. L. (2016). MAX UnMix: a web application for unmixing magnetic coercivity distributions. Comput. Geosci. 95, 140–145. doi: 10.1016/j.cageo.2016.07.009
McFadden, P. L., and McElhinny, M. W. (1988). The combined analysis of remagnetization circles and direct observations in paleomagnetism. Earth Planet. Sci. Lett. 87, 161–172. doi: 10.1016/0012-821X(88)90072-6
McFadden, P. L., Merrill, R. T., and McElhinny, M. W. (1988). Dipole/quadrupole family modeling of paleosecular variation. J. Geophys. Res. Solid Earth 93, 11583–11588. doi: 10.1029/JB093iB10p11583
Mendia, J. E. (1978). Palaeomagnetism of alkaline lava flows from El Salto-Almafuerte, Cordoba Province, Argentina. Geophys. J. R. Astron. Soc. 54, 539–546. doi: 10.1111/j.1365-246X.1978.tb05493.x
Menezes, P. T. L., and Travassos, J. M. (2000). An audiomagnetotelluric survey across an outcropping dike. Pageoph 157, 1857–1872. doi: 10.1007/PL00001130
Milani, E. J., Faccini, U. F., Scherer, C. M. S., Araújo, L. M., and Cupertino, J. A. (1998). Sequences and stratigraphy hierarchy of the Paraná Basin (Ordovician to Cretaceous), Southern Brazil. Bol. Inst. Geoci. USP 29, 125–173.
Milani, E. J., França, A. B., and Schneider, R. L. (1994). Bacia do Paraná. Bol. Geoci. Petrobrás 8, 69–82.
Milani, E. J., and Zalán, P. V. (1999). An outline of the geology and petroleum systems of the paleozoic interior basins of South America. Episodes 22, 199–205.
Morel, P., and Irving, E. (1981). Paleomagnetism and the evolution of Pangea. J. Geophys. Res. 86 1858–1872. doi: 10.1029/JB086iB03p01858
Moskowitz, B. M., Jackson, M. J., and Kissel, C. (1998). Low-temperature magnetic behavior of titanomagnetites. Earth Planet. Sci. Lett. 157, 141–149. doi: 10.1016/S0012-821X(98)00033-8
Mullins, C. E., and Tite, M. S. (1973). Magnetic viscosity, quadrature susceptibility, and frequency dependence of susceptibility in single-domain assemblies of magnetite and maghemite. J. Geophys. Res. 78, 804–809. doi: 10.1029/JB078i005p00804
Muttoni, G., Garzanti, E., Alfonsi, L., Cirilli, S., Germani, D., and Lowrie, W. (2001). Motion of Africa and Adria since the Permian: paleomagnetic and paleoclimatic constraints from northern Libya. Earth Planet. Sci. Lett. 192, 159–174. doi: 10.1016/S0012-821X(01)00439-3
Muttoni, G., Kent, D. V., and Channell, J. E. T. (1996). Evoloution of Pangea: paleomagnetic constraints from the southern Alps, Italy. Earth Planet. Sci. Lett. 140, 97–112. doi: 10.1016/0012-821X(96)00038-6
Néel, L. (1949). Théorie du traînage magnétique des ferromagnétiques en grains fins avec application aux terres cuites, Ann. Géophys. 5, 99–136.
Oliveira, W. P., Franco, D. R., Brandt, D., Ernesto, M., da Ponte Neto, C. F., and Zhao, X. (2018). Behavior of the paleosecular variation during the Permian-Carboniferous reversed superchron and comparisons to the low reversal frequency intervals since Precambrian times. Geochem. Geophys. Geosyst. 19, 1035–1048. doi: 10.1002/2017GC007262
Opdyke, N. D. J, Roberts, J., Claoué-Long, J., Irving, E., and Jones, P.J. (2000). Base of the Kiaman: Its definition and global stratigraphic significance. GSA Bull. 112, 1315–1341. doi: 10.1130/0016-7606(2000)112
Özdemir, Ö., Dunlop, D. J., and Moskowitz, B. M. (2002). Changes in remanence, coercivity and domain state at low temperature in magnetite. Earth Planet. Sci. Lett. 194, 343–358. doi: 10.1016/S0012-821X(01)00562-3
Özdemir, Ö., Moskowitz, B., and Jackson, M. (2009). Frequency and field dependent susceptibility of magnetite at low temperature. Earth Planets Space 61, 125–131. doi: 10.1186/BF03352892
Palmer, H. C., Hayatsu, A., and MacDonald, W. D. (1980). The Middle Jurassic Camaraca formation, Arica, Chile: paleomagnetism, K-Ar age dating and tectonic implications. Geophys. J. R. Astron. Soc. 62, 155–172.
Pascholati, E. M. (1983). “Possibilidade de interferencias termais do magnetismo Juro-Cretacico na analise paleomagnetica do Grupo Itararé,” in Atlas do 4° Simposio Regional de Geologia (São Paulo: SBG), 211–222.
Pinto, V. M., Hartmann, L. A., Santos, J. O. S., McNaughton, N. J., and Wildner, W. (2011). Zircon U-Pb geochronology from the Parana bimodal volcanic province support a brief eruptive cycle at ~135 Ma. Chem. Geol. 281, 93–102. doi: 10.1016/j.chemgeo.2010.11.031
Rakotosolofo, N. A., Tait, J. A., Carlotto, V., and Cardenas, J. (2006). Palaeomagnetic results from the Early Permian Copacabana Group, southern Peru: Implication for Pangaea palaeogeography. Tectonophysics 413, 287–299. doi: 10.1016/j.tecto.2005.10.043
Rapalini, A. E., Fazzito, S., and Orué, D. (2006). A new Late Permian paleomagnetic pole for stable South America: the Independencia Group. Paleomagnetism in LatinoAmerica. Earth Planets Space 58, 1247–1253. doi: 10.1186/BF03352620
Rapalini, A. E., Tarling, D. H., Turner, P., Flint, S., and Vilas, J. F. (1994). Paleomagnetism of the Carboniferous Tepuel Group, central Patagonia, Argentina. Tectonics 13, 1277–1294. doi: 10.1029/94TC00799
Rapalini, A. E., and Vilas, J. F. (1991). Preliminary paleomagnetic data from the Sierra Grande Formation: tectonic consequences of the first mid-Paleozoic paleopoles from Patagonia, J. South Am. Earth Sci. 4, 25–41. doi: 10.1016/0895-9811(91)90016-E
Rocha-Campos, A. C., Santos, P. R., and Canuto, J. R. (2008). Late Paleozoic glacial deposits of Brazil: Paraná Basin, in Fielding, C.R., Frank, T.D., and Isbell, J.L., eds., Resolving the Late Paleozoic Ice Age in Time and Space. Geol. Soc. Am. Special Paper 441, 97–114. doi: 10.1130/2008.2441(07)
Rochette, P., and Vandamme, D. (2001). Pangea B: an artifact of incorrect paleomagnetic assumptions? Ann. Geofis. 44, 649–658. doi: 10.4401/ag-3582
Santos, P. R., Rocha-Campos, A. C., and Canuto, J. R. (1996). Patterns of late palaeozoic deglaciation in the Paraná Basin, Brazil. Palaeogeogr. Palaeclimatol. Palaeoecol. 125, 165–184. doi: 10.1016/S0031-0182(96)00029-6
Schmidt, P. W. (1985). Bias in converging great circle methods. Earth Planet. Sci. Lett. 72, 427–432. doi: 10.1016/0012-821X(85)90063-9
Sinito, A. M., Valencio, D. A., and Vilas, J. E. (1979). Palaeomagnetism of a sequence of upper Palaeozoic-lower Mesozoic red beds from Argentina. Geophys. J. R. Astron. Soc. 58, 237–247. doi: 10.1111/j.1365-246X.1979.tb01022.x
Smirnov, A. V. (2009). Grain size dependence of low-temperature remanent magnetization in natural and synthetic magnetite: experimental study. Earth Planets Space 61, 119–124. doi: 10.1186/BF03352891
Smith, A. G., and Livermore, R. A. (1991). Pangea in Permian to Jurassic time. Tectonophysics 187, 135–179. doi: 10.1016/0040-1951(91)90417-Q
Somoza, R. (1994). South American reference pole for the mid-Cretaceous: further constraints in the interpretation of Andean paleomagnetic data. Geology 22, 933–936. doi: 10.1130/0091-7613(1994)022<0933:SARPFT>2.3.CO;2
Somoza, R., and Zaffarana, C. B. (2008). Mid-Cretaceous polar standstill of South America, motion of the Atlantic hotspots and the birth of the Andean cordillera. Earth Planet. Sci. Lett. 271, 267–277. doi: 10.1016/j.epsl.2008.04.004
Souza, P. A. (2006). Late Carboniferous palynostratigraphy of the Itararé Subgroup, northeastern Paraná Basin, Brazil. Rev. Palaeobot. Palynol. 138, 9–29. doi: 10.1016/j.revpalbo.2005.09.004
Tauxe, L., Banerjee, S. K., Butler, R. F., and van der Voo, R. (2016a). Essentials of Paleomagnetism. 4th Web Edn.
Tauxe, L., Shaar, R., Jonestrask, L., Swanson-Hysell, N. L., Minnett, R., Koppers, A. A. P., et al. (2016b). PmagPy: software package for paleomagnetic data analysis and a bridge to the magnetics information consortium (MagIC) database. Geochem. Geophys. Geosyst. 17, 2450–2463. doi: 10.1002/2016GC006307
Thomaz Filho, A., Misuzaki, A. M. P., and Antonioli, L. (2008). Magmatism and petroleum exploration in the Brazilian Paleozoic basins. Mar. Petrol. Geol. 25, 143–151. doi: 10.1016/j.marpetgeo.2007.07.006
Thompson, R., and Mitchell, J. G. (1972). Palaeomagnetic an4 radiometric evidence for the age of the lower boundary of the Kiaman magnetic interval in South America. Geophys. J. R. Astron. Soc. 27, 207–214. doi: 10.1111/j.1365-246X.1972.tb05772.x
Tomezzoli, R. N. (2001). Further palaeomagnetic results from the Sierras Australes fold and thrust belt, Argentina. Geophys. J. Int. 147, 356–366. doi: 10.1046/j.0956-540x.2001.01536.x
Tomezzoli, R. N., Melchor, R. N., and MacDonald, W. D. (2006). Tectonic implications of post-folding Permian magnetizations in the Carapacha Basin, La Pampa province, Argentina. Earth Planet. Sci. Lett. 58, 1235–1246. doi: 10.1186/BF03352619
Tomezzoli, R. N., Rapalini, A. E., Lopez de Luchi, M. G., and Martinez Dopico, C. (2013). Further evidence of widespread Permian remagnetization in the North Patagonian massif, Argentina. Gondwana Res. 24, 192–202. doi: 10.1016/j.gr.2012.08.019
Tomezzoli, R. N., Saint Pierre, T., and Valenzuela, C. (2009). New palaeomagnetic results from Late Paleozoic volcanic units along the western Gondwana in La Pampa, Argentina. Earth Planets Space 60, 1–7. doi: 10.1186/BF03352898
Tomezzoli, R. N., and Vilas, J. F. (1999). Paleomagnetic constraints on age of deformation of the Sierras Australes thrust and fold belt, Argentina. Geophys. J. Int. 138, 857–870. doi: 10.1046/j.1365-246x.1999.00914.x
Torq, F., Besse, J., Vaslet, D., Marcoux, J., Ricou, L. E., Halawani, M., et al. (1997). Paleomagnetic results from Saudi Arabia and the Permo-Triassic Pangea configuration. Earth Planet. Sci. Lett. 148, 553–567. doi: 10.1016/S0012-821X(97)00047-2
Torsvik, T., and Van der Voo, R. (2002). Refining Gondwana and Pangea palaeogeography: estimates of phanerozoic non-dipole (octupole) fields. Geophys. J. Int. 151, 771–794. doi: 10.1046/j.1365-246X.2002.01799.x
Torsvik, T. H., Müller, R. D., Van der Voo, R., Steinberger, B., and Gaina, C. (2008). Global plate motion frames: toward a unified model. Rev. Geophys. 46:RG3004, 1–44. doi: 10.1029/2007RG000227
Torsvik, T. H., Van der Voo, R., Preeden, U., Mac Niocaill, C., Steinberger, B., Doubrovine, P. V., et al. (2012). Phanerozoic polar wander, palaegeography and dynamics. Earth Sci. Rev. 114, 325–368. doi: 10.1016/j.earscirev.2012.06.007
Valencio, D. A. (1972). Paleomagnetism of the Lower Cretaceous Vulcanitas Cerro Colorado Formation of the Sierra de 10s Condores Group, Province of Cordoba, Argentina. Earth Planet. Sci. Lett. 16, 370–378. doi: 10.1016/0012-821X(72)90154-9
Valencio, D. A., Mendia, I. E., Giudici, A., and Gascdn, J. O. (1977). Palaeomagnetism of the Cretaceous Pirgua Subgroup (Argentina) and the age of the opening of the South Atlantic. Geophys. J. R. Astron. Soc. 51, 47–58. doi: 10.1111/j.1365-246X.1977.tb04189.x
Valencio, D. A., Rocha-Campos, A. C., and Pacca, I. G. (1975). Paleomagnetism of some sedimentary rocks of the Late Paleozoic Tubarão and Passa Dois Groups, from the Paraná Basin, Brazil. Rev. Brasil. Geoci. 5, 186–197.
Valencio, D. A., Vilas, J. F., and Pacca, I. G. (1983). The significance of the palaeomagnetism of Jurassic-Cretaceous rocks from South America: predrift movements, hairpins and magnetostratigraphy. Geophys. J. R. Astron. Soc. 73, 135–151. doi: 10.1111/j.1365-246X.1983.tb03811.x
Valencio, D. A., and Vilas, J. F. A. (1976). Sequence of the continental movements that occurred prior to and after the formation of the South Atlantic. Anais Acad. Brasil. Ciencias 48, 377–386.
Van der Voo, R. (1993). Paleomagnetism of the Atlantic, Tethys and Iapetus Oceans. New York, NY: Cambridge University Press, 411.
Van der Voo, R., and French, R. B. (1974). Apparent polar wandering for the Atlantic-bordering continents: late carboniferous to eocene. Earth Sci. Rev. 10, 99–119. doi: 10.1016/0012-8252(74)90082-8
Van der Voo, R., and Torsvik, T. H. (2001). Evidence for late paleozoic and mesozoic non-dipole fields provides an explanation for the Pangea reconstruction problems. Earth Planet. Sci. Lett. 187, 71–81. doi: 10.1016/S0012-821X(01)00285-0
Van Hilten, D. (1964). Evaluation of some geotectonic hypotheses by paleomagnetism. Tectonophysics 1, 3–71. doi: 10.1016/0040-1951(64)90028-9
Van Velzen, A. J., and Dekkers, M. J. (1999). Low-temperature oxidation of magnetite in loess-paleosol sequences: a correction of rock magnetic parameters. Stud. Geoph. Geod. 43, 357–375. doi: 10.1023/A:1023278901491
Vandamme, D. (1994). A new method to determine paleosecular variation. Phys. Earth Planet. Inter. 85, 131–142. doi: 10.1016/0031-9201(94)90012-4
Veldkamp, J., Mulder, F. G., and Zijderveld, J. D. A. (1971). Paleomagnetism of suriname dolerites. Phys. Earth Planet. Inter. 4, 370–380. doi: 10.1016/0031-9201(71)90020-3
Veselevskiy, R. V., Bazhenov, M. L., and Arzamastsev, A. A. (2016). Paleomagnetism of Devonian dykes in the northern Kola Peninsula and its bearing on the apparent polar wander path of Baltica in the Precambrian. Tectonophysics 675, 91–102. doi: 10.1016/j.tecto.2016.03.014
Vesely, F. F., and Assine, M. L. (2006). Deglaciation sequences in the Permo-Carboniferous Itararé Group, Paraná Basin, southern Brazil. J. South Am. Earth. Sci. 22, 156–168. doi: 10.1016/j.jsames.2006.09.006
Vizan, H., Ixen, R., Turner, P., Cortes, J. M., and Cladera, G. (2004). Paleomagnetism of Upper Triassic rocks in the Los Colorados hill section, Mendoza province, Argentina. J. South Am. Earth Sci. 18, 41–59. doi: 10.1016/j.jsames.2004.08.008
Watson, G. S., and Irving, E. (1957). Statistical methods in rock magnetism. Monthly Notices R. Astron. Soc. Geophys. Suppl. 7, 289–300. doi: 10.1111/j.1365-246X.1957.tb02882.x
Woodcock, N. H. (1977). Specification of fabric shapes using an eigenvalue method. Geol. Soc. Am. Bull. 88, 1231–1236. doi: 10.1130/0016-7606(1977)88<1231:SOFSUA>2.0.CO;2
Keywords: remagnetizations, paleomagnetism, rock-magnetism, South America, Pangea, Itararé, carboniferous
Citation: Bilardello D, Callebert WC and Davis JR (2018) Evidence for Widespread Remagnetizations in South America, Case Study of the Itararé Group Rocks From the State of São Paulo, Brazil. Front. Earth Sci. 6:182. doi: 10.3389/feart.2018.00182
Received: 28 June 2018; Accepted: 12 October 2018;
Published: 01 November 2018.
Edited by:
John William Geissman, The University of Texas at Dallas, United StatesReviewed by:
Baochun Huang, Peking University, ChinaBelén Oliva-Urcia, Universidad Autónoma de Madrid, Spain
Copyright © 2018 Bilardello, Callebert and Davis. This is an open-access article distributed under the terms of the Creative Commons Attribution License (CC BY). The use, distribution or reproduction in other forums is permitted, provided the original author(s) and the copyright owner(s) are credited and that the original publication in this journal is cited, in accordance with accepted academic practice. No use, distribution or reproduction is permitted which does not comply with these terms.
*Correspondence: Dario Bilardello, ZGFyaW8uYmlsYXJkZWxsb0BnbWFpbC5jb20=