 Matthew C. Garthwaite1*
 Victoria L. Miller2,3
 Steve Saunders4
 Michelle M. Parks5Guorong Hu1
 Amy L. Parker6
- 1Positioning and Community Safety Division, Geoscience Australia, Canberra, ACT, Australia
- 2The University of the West Indies Seismic Research Centre, St. Augustine, Trinidad and Tobago
- 3Montserrat Volcano Observatory, Flemings, Montserrat
- 4Rabaul Volcano Observatory, Rabaul, Papua New Guinea
- 5Icelandic Meteorological Office, Reykjavik, Iceland
- 6School of Earth and Planetary Sciences, Curtin University, Perth, WA, Australia
The primary goal of operational volcano monitoring is the timely identification of volcanic unrest. This provides critical information to decision makers tasked with mitigating the societal impacts of volcanic eruptions. Volcano deformation is recognized as a key indicator of unrest at many active volcanoes and can be used to provide insight into the depth and geometry of the magma source. Interferometric Synthetic Aperture Radar (InSAR) is a remote sensing technique that has detected deformation at many volcanoes globally, but most often with hindsight. To date, the use of InSAR for operational volcano monitoring has been limited to a few cases and only in high income countries. Yet a vast number of active volcanoes are located in low- and middle-income countries (LMICs), where resources for operational monitoring are constrained. In these countries, InSAR could provide deformation monitoring at many active volcanoes, including those that have no existing ground monitoring infrastructure. Several barriers combine to make uptake of InSAR into operational volcano monitoring difficult in most countries, but particularly in resource-constrained environments. To overcome some of these limiting factors, we propose a simplified processing chain to better incorporate InSAR and Global Navigation Satellite Systems (GNSS) data into the decision-making process at volcano observatories. To combine the InSAR and GNSS data we use a joint modelling procedure that infers volume changes of a spherical source beneath the volcano. The benefits of our approach for operational use include that the algorithm is computationally lightweight and can be run quickly on a standard desktop or laptop PC. This enables a volcano observatory to interpret geodetic data in a timely fashion, and use the information as part of frequent reporting procedures. To demonstrate our approach we combine ALOS-PALSAR InSAR data and continuous GNSS data from the Rabaul Caldera, Papua New Guinea between 2007 and 2011. Joint inversion of the two datasets indicates volume loss of ~1 × 10⁷ m3 (deflation) occurring between February 2008 and November 2009, followed by volume gain of ~2.5 × 10⁶ m3 (inflation) until February 2011 in a magma body situated ~1.5 km beneath the caldera.
Introduction
A disproportionately high number of volcanoes that were active in the Holocene are located in low- and middle-income countries (LMICs) (Chester, 2005). Compounding this volcanic risk, LMICs typically have the densest populations living in proximity of active volcanoes whilst also experiencing sustained population growth (Small and Naumann, 2001). Historical eruptions of volcanoes in LMICs have resulted in significant impacts for both humans and infrastructure. For example, there were: 36,000 deaths as a result of a tsunami triggered by the 1883 eruption of Krakatau in Indonesia (Brown et al., 2017); 25,000 deaths as a result of lahars triggered by the 1985 eruption of Nevado del Ruiz in Colombia (Naranjo et al., 1986); and $750 million USD losses following the 1991 eruption of Mount Pinatubo in the Philippines (Annen and Wagner, 2003). Furthermore, there is evidence to suggest a link between a region's level of economic development and the number of fatalities from volcanic events (Auker et al., 2013). Our increasing connectivity and globalization of transportation, communications and economies (e.g., Miller et al., 2016) means that we are more vulnerable to distant volcanic eruptions, for example via aviation routes passing close to active volcanoes (e.g., Alexander, 2013). These issues highlight the increasing importance of effective volcano monitoring programs at potentially active volcanoes. The ability to detect changes in behaviour at a volcano that may be precursory to an eruption, in a timely manner, can significantly improve the decision-making process (for example regarding local evacuations and aviation alerts).
Volcano observatories typically use ground-based networks consisting of seismic, deformation and gas monitoring instruments (e.g., Loughlin et al., 2015; Pallister and McNutt, 2015), and using all of these methods together improves the issuance of accurate advice (Winson et al., 2014). Under ideal circumstances, all potentially active volcanoes would be routinely monitored with a diverse suite of instruments and methods to develop a baseline understanding of volcanic behaviour and contextualize anomalies that may be indicative of unrest patterns. In reality though, only a small number of volcanoes are monitored with extensive instrument networks, with the majority (~65%) having little or no instrumental monitoring in place (Brown et al., 2015b; Loughlin et al., 2015). Improving ground-based instrumentation can be logistically and financially challenging, and where resources are limited, prioritization of monitoring targets and infrastructure is necessary. Consequently, undertaking a country-wide risk analysis and ranking exercise can help guide future monitoring strategies (e.g., Ewert et al., 2005).
Seismic monitoring remains the backbone of the early warning system at many volcano observatories in LMICs due to its ease of use in an operational and resource-constrained setting, its relatively low cost and its high sampling resolution that can afford early detection of signs of seismic unrest (Thompson, 2015). However, it is becoming increasingly common for deformation monitoring to be used as part of the early warning system (c.f. Dvorak and Dzurisin, 1997; Dzurisin, 2000; McNutt et al., 2000; Fernández et al., 2017). Most commonly, volcano deformation occurs due to the intrusion into or withdrawal of magma from the crust. Comparisons between data collected globally from ground-based sensors (Phillipson et al., 2013) and satellite remote sensing (Furtney et al., 2018) suggest that ground deformation (i.e., displacements of Earth's surface) is the indicator of pre-eruptive unrest that on average provides the longest lead-time prior to an eruption. However, this is not always the case. For example, in the lead up to the 2014 Bárðarbunga eruption in Iceland, increased seismicity was observed in the years preceding the eruption, but ground deformation was only observed about 1 month prior to the eruption. Furthermore, Biggs et al. (2014) found that of 198 volcanoes systematically monitored around the world, 9 (nearly 5%) of those erupted with no deformation detected. One well-documented example is Merapi volcano in Indonesia, which frequently erupts but with no deformation having been detected (e.g., Chaussard et al., 2013).
When it does occur, ground deformation at volcanoes can be measured with satellite Synthetic Aperture Radar (SAR) data processed using the Interferometric SAR (InSAR) technique, or via local networks of Global Navigation Satellite System (GNSS) instruments operated continuously or in measurement campaigns (e.g., Larson et al., 2010; Sigmundsson et al., 2018). Both the remotely-sensed InSAR technique and ground-based GNSS technique have advantages and disadvantages for monitoring volcano deformation (Table 1). However, both techniques provide observations that can be used to infer the location, volume change, and shape of the magma body causing the crustal deformation via analytical elastic modelling or more complex viscoelastic and finite element models (e.g., Lisowski, 2007; Segall, 2010). This modelling approach can be used to anticipate the occurrence of volcanic eruptions when the surface deformation is measured with sufficiently high spatial and temporal resolution (e.g., Kobayashi et al., 2018).
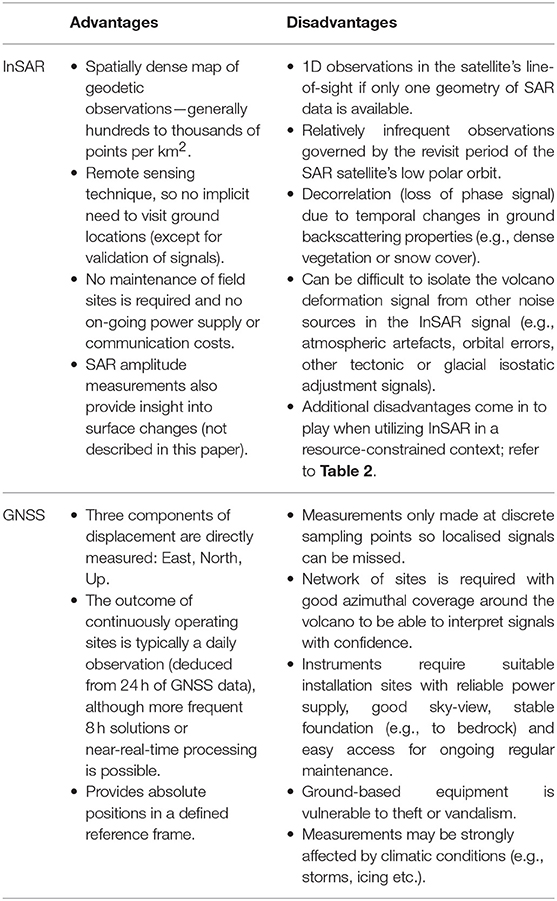
Table 1. Advantages and disadvantages of InSAR and GNSS for monitoring volcano deformation.
InSAR has been used successfully to measure surface deformation at a large number of volcanoes worldwide (e.g., Wicks et al., 1998; Amelung et al., 2000; Pritchard and Simons, 2002; Chaussard and Amelung, 2012; Lundgren et al., 2013; Biggs et al., 2014; Parks et al., 2015; Parker et al., 2016; Ebmeier et al., 2018; Pritchard et al., 2018). In many cases, InSAR facilitates monitoring at volcanoes that currently have limited or no ground-based monitoring networks. However, because of the latency between image acquisition and delivery, and general data availability from past SAR missions, many of the documented applications of InSAR to volcanoes have been carried out retrospectively (Ebmeier et al., 2018). Nevertheless there is a growing trend towards using InSAR data to provide early warnings in countries with large numbers of volcanoes and limited ground monitoring stations (Ebmeier et al., 2018; Pritchard et al., 2018).
For a monitoring technique to be considered “operational,” it must be in routine and independent use without the need for significant outside assistance to keep it running. Furthermore, the monitoring technique needs to be suitable for application in a systematic fashion (i.e., being repeatable and reliable) to meet institutional criteria for dependability and the need for credible, unambiguous signals. In an operational context there is a need to be able to use products (data and interpretations) for decision-making in critical situations under immense pressure. Therefore, the monitoring technique needs to be robust and defendable under public and political scrutiny.
In this context, InSAR is rarely used operationally at volcano observatories despite long-recognized promise (c.f. Stevens and Wadge, 2004; Ernst et al., 2008). The few cases where InSAR is used for routine volcano monitoring (i.e., systematically, but not necessarily operationally) are restricted to more economically developed countries. Some examples of these countries are: France (e.g., Peltier et al., 2017), Iceland (e.g., Sigmundsson et al., 2014; Parks et al., 2017), Japan (e.g., Morishita et al., 2016; Kobayashi et al., 2018), New Zealand (e.g., Hamling et al., 2015) and USA (e.g., Meyer et al., 2015; Dzurisin et al., 2018). More detail of how InSAR is applied to volcano monitoring in these countries is given in Supplementary Table 1.
The use of remote sensing data is often not constrained by geographic or political boundaries, so in many cases a volcano observatory will partner with external organisations (such as universities or national and international government science agencies) who undertake much of the InSAR processing (e.g., Pritchard et al., 2018). Despite this, the vast majority (~70%) of catalogued InSAR observations are from countries classed as “upper middle” income (Ebmeier et al., 2018), even though the majority of volcanoes active in the Holocene are located in LMICs (Chester, 2005). The social consequences that can arise from public dissemination of volcanic alert information necessitate that local authorities (i.e., the volcano observatory) lead the analysis and interpretation of pre-eruptive unrest signals. In this context, six potential barriers (Table 2) in combination prevent operational InSAR monitoring at volcano observatories in the majority of countries, but particularly in LMICs. Removing these barriers to facilitate the uptake of operational InSAR monitoring at volcano observatories is an important bridge to widespread and routine usage of this valuable tool in resource-constrained environments.
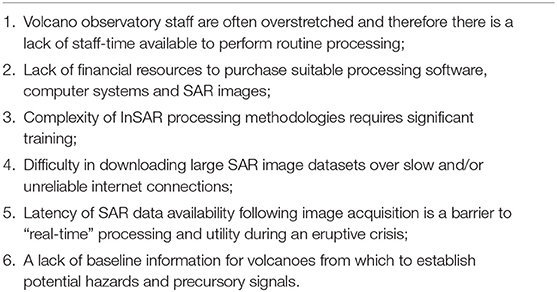
Table 2. Some potential barriers to operational InSAR monitoring at volcano observatories in an LMIC context.
We propose a simplified data processing chain in Figure 1 to facilitate more rapid uptake of InSAR data into operational use at volcano observatories. Firstly, geodetic data (InSAR and/or GNSS) is acquired and downloaded, together with the necessary auxiliary products required for their processing (Stage 1). Secondly, the geodetic data is processed using standardized data processing procedures to obtain surface displacement observations (Stage 2). Thirdly, the derived surface displacements from InSAR and/or GNSS are combined using a joint modelling approach to determine the relative volume change and movement of a magmatic source (Stage 3). The time series output of this stage can be used in the final stage (Stage 4) by the observatory to make decisions on the eruptive state of the volcano. The procedure is then iterated by acquiring more geodetic data to add to the time series.
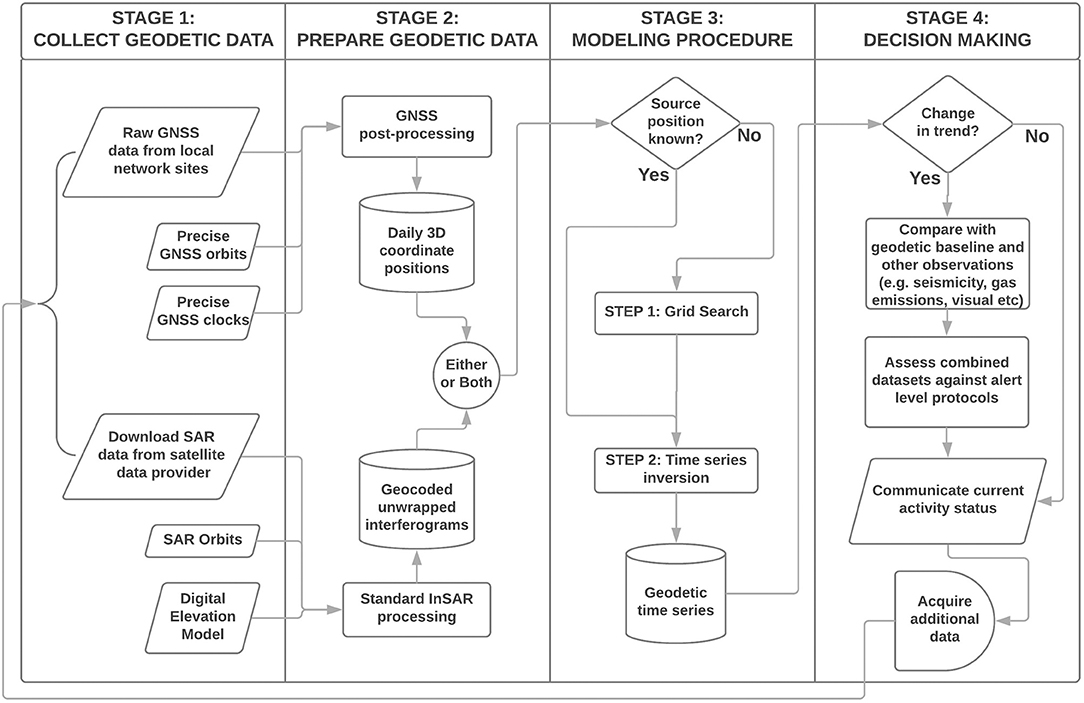
Figure 1. Flow chart summarizing the four stage process to incorporate geodetic (InSAR and/or GNSS) data into the operational volcano monitoring work flow.
In this paper we present a methodology for operationalizing Stage 3 of the processing chain and demonstrate its use with a case study of the Rabaul Caldera, Papua New Guinea. Our primary aim is to address barriers (1), (2), and (3) in Table 2. First, we give an overview of the Rabaul Caldera, its eruptive history and the efforts of the Rabaul Volcano Observatory (RVO) to monitor the volcano. We then describe the methods we have used to process InSAR and GNSS data available for the Rabaul Caldera. This processing corresponds to stages 1 and 2 in the overall processing chain depicted in Figure 1. In the following section, we describe our two-step joint modeling procedure for incorporating processed InSAR data, and where it is available, GNSS data. Our approach makes use of a computationally lightweight inversion algorithm that could be run operationally at a volcano observatory on modest computing facilities. We demonstrate the application of this methodology for the Rabaul Caldera with independent inversions of the InSAR and GNSS datasets, and their joint inversion. By comparing the results, we demonstrate that InSAR data could be used in isolation (i.e., without GNSS data) using our procedure at those volcanoes that lack ground-based geodetic instrumentation. Finally, we discuss the limitations and opportunities to improve upon our methodology. We also discuss the challenges involved with implementing the full four-stage processing chain (with reference to the barriers outlined in Table 2) and highlight some potential solutions.
The Rabaul Caldera and the Rabaul Volcano Observatory
Papua New Guinea (PNG) has 56 Holocene volcanoes with at least 20 of these historically active (Brown et al., 2015c). Over 80% of PNG's population lives within 100 km of a volcano (Brown et al., 2015a). The highest risk volcano is the Rabaul Caldera complex located at the north-eastern point of New Britain island (Figure 2). The former capital of the East New Britain province is located within the caldera structure (McKee et al., 2017). Even though the capital has since moved from Rabaul (to nearby Kokopo, outside the caldera), the port is still the primary hub for the province and vital for national and international trade operations. In addition, a population of up to 7,000 remains living within the caldera and the rapidly developing city of Kokopo is located on pyroclastic-flows deposited during eruptions from the caldera. Correspondingly, the Rabaul Caldera presents the highest risk to surrounding populations of all volcanoes in the Melanesia region (Brown et al., 2015c).
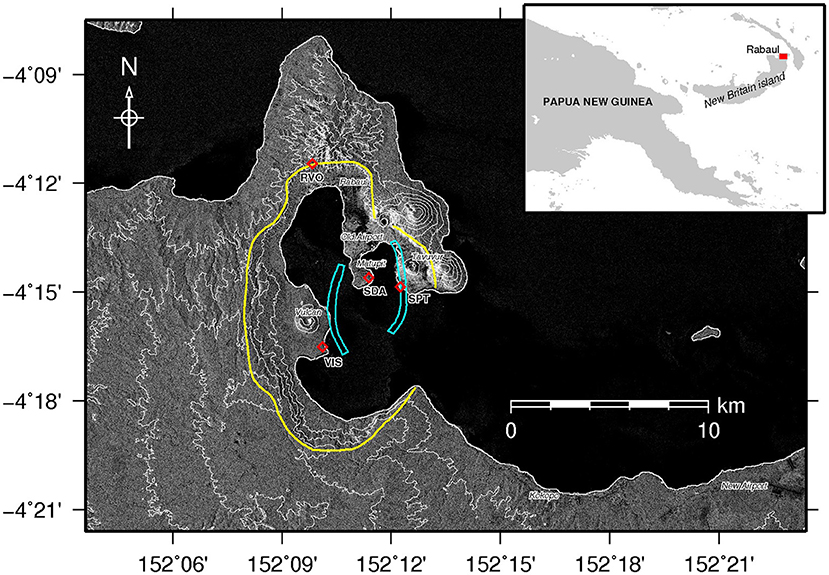
Figure 2. Map of the Rabaul Caldera labelled with points of interest mentioned in the text. Yellow line indicates the general topographic rim of the nested caldera complex. Cyan polygons outline the two zones of concentrated seismicity between 1971 and 1992 occurring above 2 km depth that Saunders (2001) used to infer the presence of a ring fault. Locations of GNSS monitoring stations are plotted as red diamonds. The GNSS monitoring station “RVO” is situated at the Rabaul Volcano Observatory (RVO) headquarters. Background image is an ALOS-PALSAR radar backscatter image captured on 5th December 2009. Topographic contours at 100m elevation intervals are shown as white lines. Inset map shows the location of Rabaul within New Britain island, Papua New Guinea.
The Rabaul Caldera contains several small Holocene eruptive vents within the footprint of a large Pleistocene nested caldera complex (Nairn et al., 1995; Jóhnson et al., 2010). Present day eruptions occur from two active vents, Tavurvur and Vulcan, located within the Rabaul Caldera complex (Figure 2). These two small vents have erupted on average every 24–59 years during the last ~250 years (McKee et al., 2017). Between eruptions, the Rabaul Caldera is known for its frequent periods of unrest, when seismic, thermal and deformation activity is heightened (e.g., McKee et al., 1984).
Seismic analysis indicates the presence of three magma bodies beneath the Rabaul Caldera (Finlayson et al., 2003; Itikarai, 2008; Jóhnson et al., 2010): a shallow body centred under the caldera with its top at ~3 km depth, a second shallow body located to the north-east outside of the caldera boundary with a similar depth, and a deeper body directly beneath the shallow body with its top at 12 km depth. The shallow caldera magma body is thought to be the main reservoir that feeds eruptions from both Tavuvur and Vulcan (Patia et al., 2017). Periodic magma injection into the shallow body is thought to come from the deeper magma reservoir, and possibly the second shallow body in the north-east. Mixing of these compositionally distinct magmas could trigger the periodic unrest and may lead to simultaneous eruption of Tavuvur and Vulcan if certain physical thresholds are exceeded (Jóhnson et al., 2010; Patia et al., 2017).
Following a devastating simultaneous eruption of Tavuvur and Vulcan in 1937, the RVO was established in 1940 to monitor the caldera and provide warnings of future eruptions (McKee et al., 2017). Today, RVO continues to monitor Rabaul and is also responsible for monitoring all PNG volcanoes. Since the Rabaul volcano presents the highest risk, it is also the best monitored volcano in the country. RVO operates a network of 15 seismic monitoring stations in and around the Rabaul caldera. Systematic geodetic monitoring of the caldera began in 1973, including gravity, tiltmeter and levelling measurements (Saunders, 2001). Furthermore, an electronic distance measuring (EDM) network was established in 1983 (Archbold et al., 1988). In addition to Rabaul, RVO also monitor eight other PNG volcanoes (Ulawun, Manam, Lamington, Garbuna, Pago, Langila, Bagana, Karkar) through the use of trained observers permanently located at the volcano. At five of these volcanoes (Ulawun, Manam, Lamington, Garbuna, and Pago) there is a single short-period seismometer that the observers are trained to view and identify earthquake types, whilst earthquake counts are telemetered directly to RVO. The other PNG volcanoes are monitored via freely available internet services for satellite-derived global sulphur dioxide measurements (https://so2.gsfc.nasa.gov/) and near-real-time volcanic hotspot detection measurements (http://www.mirovaweb.it/). RVO maintains a cache of seismic and GNSS monitoring instruments that is deployed when any of the volcanoes within PNG show signs of unrest.
A period of unrest occurred at the Rabaul Caldera between 1983 and 1985 when elevated levels of seismicity and surface uplift were detected. Geodetic data gathered during that period was used to infer a shallow inflationary point source (1–2 km depth) between Matupit and Tavuvur (McKee et al., 1984, 1989; Archbold et al., 1988). A single point source was not adequate to explain all features of the observed caldera deformation, and McKee et al. (1984) suggested a second point source immediately to the east of Vulcan. Saunders (2001) used finite element models to explain the seismicity pattern and deformation features observed in the levelling data collected during the 1983–1985 unrest period as a complex system incorporating broad inflation of the shallow magma body and intrusion of magma into, or along shallow ring fault structures above that magma body (Figure 2).
On 19 September 1994, the unrest culminated in another simultaneous eruption of Tavurvur and Vulcan (McKee et al., 2017). The eruption lasted several months destroying the airport and causing extensive damage to property and infrastructure through heavy ash fall (Blong, 2003). Parts of the RVO geodetic monitoring network (levelling benchmarks, tiltmeter stations and the EDM network) were also destroyed during this eruption. A new network of four GNSS monitoring stations (“RVO,” “SDA,” “SPT,” and “VIS”; Figure 2) was established in 1996, and further upgraded to enable “real-time” monitoring in January 2000 (Endo, 2005). When this system was functioning, GNSS observations were telemetered back to RVO and processed at 10 second intervals, with the resulting positions visualised in real-time on a computer display. The GNSS network has now obtained nearly two decades of baseline observations of surface deformation within the Rabaul Caldera. At the present time, RVO process the GNSS data on a daily basis using the proprietary “Trimble Business Centre” software. The resulting three-component daily solutions for each station are added to a database and changes are visualized using graphs (e.g., Figure 3). The absolute height changes recorded at Matupit (Figure 3) correlate with the recent eruptive history at Rabaul since January 2000 (Table 3). Since January 2000, all eruptions have occurred from Tavuvur, with Vulcan remaining dormant since the 1994 eruption.
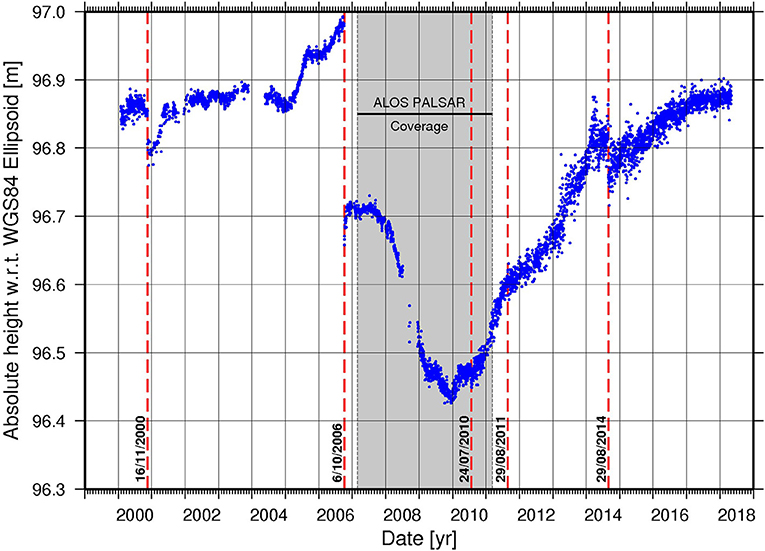
Figure 3. Record of absolute height change (with respect to the WGS84 Ellipsoid) at Matupit derived from RVO's daily processing of GNSS observations at station “SDA” since January 2000. The red-dashed lines mark dates where significant events occurred (described in Table 3).
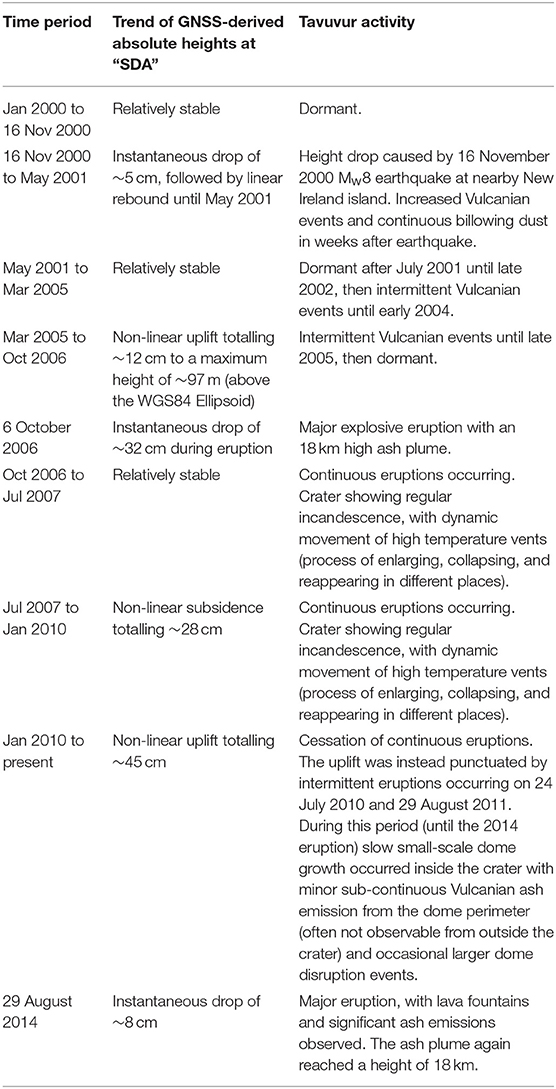
Table 3. Record of recent Tavuvur eruptive activity since January 2000 and trends in absolute height change measured by GNSS at station “SDA” located at Matupit (see Figure 3).
InSAR was already applied to the measurement of surface deformation at the Rabaul Caldera: Ronchin et al. (2017) conducted Persistent Scatterer InSAR analysis of ascending-pass ALOS-PALSAR data acquired between 27 February 2007 and 10 December 2010. Their results showed non-linear line of sight (LOS) displacement signals, localized to the Matupit and Vulcan peninsula regions, that were interpreted as subsidence indicative of the deflation of the shallow caldera magma body. No inflation signal during the monitored time period was described by Ronchin et al. (2017). The mean displacement (i.e., the velocity) for each InSAR observation was used to constrain a finite element model consisting of an array of small finite pressure sources within a heterogeneous physical domain. Within this construct, the InSAR data constrained the shape of a large, broadly cuboidal magmatic source between 3 and 4.5 km depth. A total magma volume of ~1 × 10⁸ m3 was drained from this body during Tavuvur eruptions during the observation period (Ronchin et al., 2017). Despite the ability of this method to define a complex geometry for the shallow caldera magma body within a heterogeneous domain consisting of realistic earth properties, it is unlikely to be a useful approach for operational volcano monitoring in PNG due to the complexity and computational expense of the modelling approach.
Geodetic Data
In this section we give an overview of the GNSS and InSAR data and the processing methodologies we used in our Rabaul Caldera case study. These steps constitute the procedures depicted as Stage 1 and Stage 2 in the overall processing workflow in Figure 1.
GNSS
Processing Method
We have used continuous GNSS data collected by RVO on the four-station Rabaul Caldera network (stations “RVO,” “SDA,” “SPT,” and “VIS” labelled in Figure 2). Note that here we only used observations of the Global Positioning System (GPS; the American GNSS system). Analysis of the GNSS observations was undertaken using the Bernese scientific software V5.2 (Dach et al., 2015). The processing strategy made use of parameters and model options that have been tested and approved for high precision GNSS data processing, as defined by the IERS Conventions (2010). International GNSS Service (IGS) final precise GNSS satellite orbits and Earth rotation parameters were used in the processing of the daily GNSS observations. A-priori dry tropospheric delays computed from a Standard Atmosphere were mapped with the Dry Global Mapping Function (Böhm et al., 2006). For the wet component, continuous piecewise linear troposphere parameters were estimated in 1 h intervals without any a-priori model using the wet Vienna Mapping Function and the ionosphere-free combination observations. To tie the solutions to the ITRF2008 reference frame (Altamimi et al., 2011), the GNSS data was processed along with the available data from 19 IGS sites located around the study region. As a result of this processing, a coordinate (X, Y, and Z) with respect to ITRF2008 was produced for every epoch (day) where >2 h of dual frequency (L1 and L2) GNSS observations were logged at the stations. Unfortunately, L2 observations are missing for the sites “SDA,” “SPT,” and “VIS” after 2015 and so no daily coordinate could be resolved for the post-2015 time period. Uncertainties for the coordinate output at each epoch were calculated as the standard deviation of observations of each component (see Dach et al., 2015; p.197). The uncertainty at each epoch was calculated independently (without temporal correlation) and deformation signals were not excluded from the calculation.
For this study we only used GNSS observations for the time period overlapping with the InSAR observations. Epochs where the Bernese-reported standard deviation of one of the three components was >0.1 m were removed from the dataset. This resulted in 2,792 daily solutions across the four GNSS stations and 8,376 total observations across the three displacement components. We de-trended the GNSS data to remove the constant-velocity plate tectonic signal by fitting a linear model to the three-components of data from “RVO” (Supplementary Figure 2) and subtracting these trends from data at all four stations.
Processing Results
The processed GNSS observations from the four Rabaul stations that we used in our modelling procedure are shown in Supplementary Figure 3. In Figure 4, the three-component GNSS observations have been converted into the InSAR LOS viewing geometry to enable a direct comparison with the InSAR data. Between 2009 and early 2011, GNSS data is generally available from all four stations, though prior to 2008 only GNSS data from “RVO” and “VIS” is available. Stations “SDA,” “SPT,” and “VIS” show variations in all three components of displacement at the level of 10 cm whereas, station “RVO” is stable during the observed time period. This implies that surface deformation imparted by the magma source or other shallow features is concentrated in the central region of the Rabaul Caldera close to the three GNSS stations and does not permeate as far north as station “RVO.” This observation enables constraints to be made on the maximum size of the magma source.
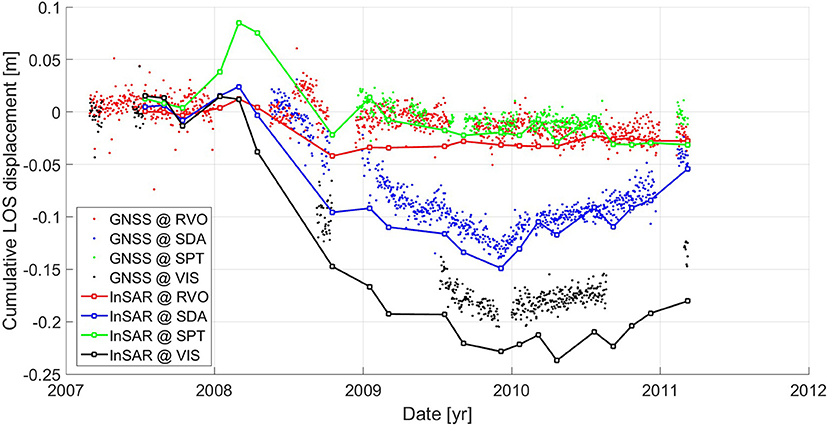
Figure 4. Comparison of cumulative LOS displacements derived from GNSS and InSAR data at the locations of the four GNSS stations within the Rabaul Caldera (Figure 2). Three component GNSS data have been converted into the InSAR LOS viewing geometry using the unit vector [−0.61, −0.13, and 0.78]. The three components of the GNSS data are shown in Figure 9. The plotted InSAR data correspond to the down-sampled observations extracted from the sampling grid node closest to each GNSS station.
Table 4 summarizes the uncertainties, quantified as the mean standard deviation, for the GNSS observations processed by Bernese. The uncertainty of data from “VIS” is greater than sites “SDA” and “SPT.” As a result, “VIS” will have less influence on the modelling procedure due to the relative down-weighting of these observations. The standard deviation of the daily GNSS solutions depends on several factors, including the quality of the GNSS equipment used, temporal coverage of observations, and site environmental factors (such as those leading to multipath). Given that there are multiple contributing factors it is hard to identify what has caused the noisier GNSS solutions for the “VIS” station, although we suspect an aging antenna and growth of trees in the near-field of the station.
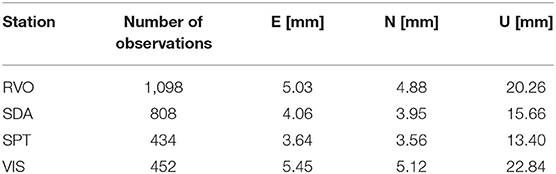
Table 4. Average uncertainties (computed as the mean standard deviations) of GNSS daily solutions used between 26/2/2007 and 10/3/2011 as reported by Bernese software.
InSAR
Processing Method
We conducted an independent InSAR analysis for the Rabaul Caldera of the same ascending-pass ALOS-PALSAR Fine-beam L-band data used by Ronchin et al. (2017) for the slightly extended period of 27 February 2007 to 10 March 2011 (21 images in total). The temporal coverage of the ALOS-PALSAR data used is highlighted in Figure 3. We generated interferograms using a standard differential interferometric SAR processing workflow (e.g., Rosen et al., 2000) implemented using the Gamma software (Wegmüller and Werner, 1997). We processed the simplest possible network of interferograms that connect all the epochs (Supplementary Table 2). This “daisy-chain” of 20 interferograms connects the epochs using the shortest possible temporal connections. Interferograms were calculated by multi-looking the data (i.e., the process of averaging and decimating data) in windows of 8 pixels in the range direction and 16 pixels in the azimuth direction, which helps to improve interferometric phase coherence throughout the dataset and the performance of unwrapping. The topographic phase signal was estimated and removed from interferograms using a 1-arc-second SRTM digital elevation model. We filtered the interferograms with a non-linear filter exponent of 0.5 (Goldstein and Werner, 1998) before unwrapping using a minimum cost flow algorithm (Costantini, 1998). A large part of the Rabaul Caldera is submerged beneath water (Figure 2). We subsequently masked unwrapped interferogram pixels that are located over water (as defined by the digital elevation model) and any other pixel with a coherence below a threshold of 0.4, prior to geocoding. We estimated and removed planar ramps from the geocoded interferograms that approximate the phase pattern introduced by errors in the orbit state vectors (Biggs et al., 2007). Interferograms are affected by noise caused by spatial and temporal variability of the atmosphere which can hide the volcano deformation signal in some cases (Parker et al., 2015). It is common to apply spatio-temporal filters to interferogram datasets to mitigate these atmospheric artefacts (Berardino et al., 2002), though we have not applied these filters in order to simplify the InSAR processing workflow. Finally, a reference phase was subtracted from each interferogram. The reference phase was computed as the median value within a 500 m square sample window centred on the position of the “RVO” GNSS station. This position was chosen for the reference because GNSS data shows that the “RVO” station is relatively stable (Figure 4).
Each processed geocoded interferogram is an image containing 522,720 independent pixel observations (Figure 5). Due to the spatial correlation of deformation signals in the interferogram, it is common practice to down-sample interferograms to remove redundant information and reduce the number of observations that will constrain the inversion procedure (e.g. Jónsson et al., 2002; Simons et al., 2002). For this study we applied a simple down-sampling strategy to reduce the number of observations by three orders of magnitude. We defined a grid with nodes spaced every 500 m in X and Y dimensions within a circular zone of 7 km radius centred on the Rabaul Caldera at 152° 11.148′E, 4° 15.276′S. Outside the zone we defined a coarser grid with nodes spaced every 2,500 m in X and Y dimensions. We computed the down-sampled observations as the mean phase within sample windows centred on the grid node with dimensions equal to the grid spacing. If >50% of the phase values had been previously masked (either due to being in the sea or below the coherence threshold), then no value was assigned for that node. Using this down-sampling strategy, we reduced the total number of InSAR observations to 6,831 (between 250 and 352 per interferogram).
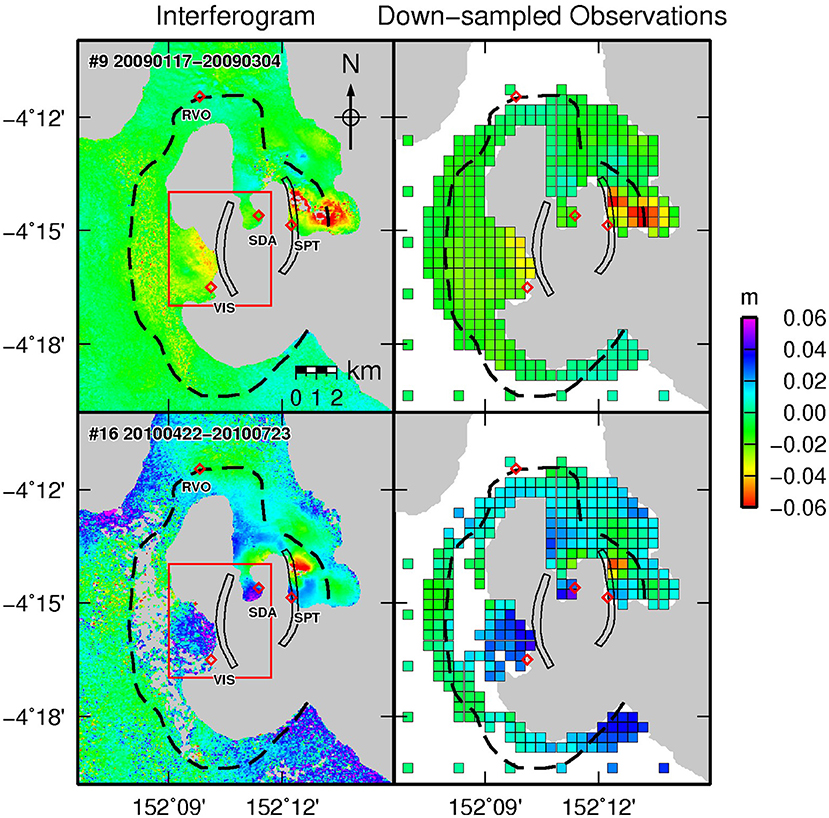
Figure 5. Examples of unwrapped geocoded ALOS-PALSAR interferograms and the corresponding down-sampled InSAR observations used for modelling. Interferogram #9 corresponds to the time of caldera subsidence (negative signal), whilst interferogram #16 corresponds to the time of caldera uplift (positive signal). Both interferograms contain large spatially-correlated signals not directly related to the deformation of the shallow magma body. Red labelled diamonds indicate the location of the four GNSS stations. All 20 interferograms and down-sampled InSAR observations are shown in Supplementary Figure 1. Black dashed line indicates the general topographic rim of the nested caldera complex and the black polygons outline the two zones of concentrated seismicity (Figure 2). The red-outlined square encloses the areas where deformation signals attributed to the shallow caldera magma body are seen.
Processing Results
In Figure 4 we directly compare time series of down-sampled InSAR observations with co-located GNSS observations from the four stations in the Rabaul Caldera. Despite the noise in the InSAR time series (attributable to spatially correlated atmospheric artefacts), there is generally a good agreement in the trends of both independent geodetic datasets. In particular, a negative LOS displacement trend (i.e., movement away from the SAR satellite) changes to a positive trend in late 2009 at both the localities of “SDA” and “VIS.” Offsets in the LOS displacement time series of InSAR and GNSS between 2009 and 2011 at both these stations appears to be attributable to a particularly noisy InSAR observation in late 2008 (interferogram #7; see Supplementary Figure 1).
The ALOS-PALSAR interferograms reveal complex surface deformation signals at the Rabaul Caldera that include the cumulative effects of several different deformation sources resulting in signals of different magnitude and spatial scale (Figure 5). The interferograms are also over-printed with spatially correlated atmospheric noise that obscure the deformation signal in many cases. For example, in interferogram #9 (Figure 5) a dominant signal is seen at, and to the east of Tavuvur. It is not clear whether this signal is caused by volcano deformation, atmospheric artefact, or potentially even a volcanic gas plume emanating from Tavuvur at the time of one of the SAR image captures. The broadest deformation signature, assumed to be caused by inflation and deflation in the shallow caldera magma body, is observed on the land masses of Matupit and Vulcan. The subsidence signal at these locations is confirmed by the time-series analysis of the same SAR dataset performed by Ronchin et al. (2017). It is these broad-scale signals that pervade through time that we primarily seek to constrain through our model inversion. Localized deformation signatures are also present in individual interferograms around the active vent of Tavuvur (to the east of Matupit) and at the site of the former Rabaul airport (to the north of Matupit). For example, interferogram #16 (Figure 5) captures 92 days of pre-eruptive deformation immediately prior to the 24 July 2010 Tavuvur eruption (Table 3), and shows broad uplift at Vulcan and Matupit and a highly localized subsidence signal on the northern flank of Tavuvur. These broad uplift signatures are likely caused by the influx of magma into the shallow magma body and the localized subsidence is possibly related to increased fracturing during initiation of a conduit beneath Tavuvur. These signals may also be associated with reactivation of the ring fault structure hypothesized by Saunders (2001).
The daisy-chain approach we used to generate interferograms resulted in one interferogram having a very large temporal and spatial baseline (see interferogram #7; Supplementary Table 2). The knock-on effect is that this interferogram has relatively poor coherence, which has resulted in a potential unwrapping error in the location of the former Rabaul airport (see Supplementary Figure 1). An unwrapping error, where the summation of 2π radian phase cycles is incorrectly resolved spatially, will have implications for the absolute magnitude of modelled source volume change over that time. Long spatial and temporal baselines are generally required to connect ALOS-PALSAR epochs across 2008 because a satellite manoeuvre was conducted in June 2008 to correct the inclination of the satellite's orbit (Shimada et al., 2010). Most modern SAR systems (e.g., Sentinel-1, COSMO-SkyMed, ALOS-2) have much stricter orbital control which should remove the need to rely on interferograms with very long baselines in the future.
Joint Modelling Procedure
In this section we describe the lightweight joint modelling approach that we propose as a simple methodology for a volcano observatory to process and interpret InSAR and/or GNSS displacement data in terms of the inflation or deflation of a magmatic source. This constitutes the procedure referred to as “Stage 3” in the overall processing workflow depicted in Figure 1.
Method
We have applied the lightweight method devised by Biggs et al. (2010) to jointly invert the InSAR and GNSS data from the Rabaul Caldera. This method has previously been applied to Okmok volcano in Alaska (Biggs et al., 2010) and Santorini caldera in Greece (Parks et al., 2015). The proposed method involves two steps:
• Step 1—Grid Search: fitting the observed geodetic data to a suite of forward model predictions, where the location of each forward model is varied within a defined three dimensional grid. The aim is to determine the source location that best fits the geodetic data.
• Step 2—Time Series Inversion: Solving for a time series of volume change for a source at the best-fit location derived from the previous step. The aim is to track changes in volume of the magmatic source.
The grid search is an important first step used to fix the source location based on a static geodetic dataset. The time series inversion step can then be applied in a continuous fashion over time as additional geodetic observations are collated. Occasional re-run of the (relatively time consuming) grid search can be used as a check that the source location remains stable based on the most up-to-date and complete geodetic datasets.
To compute forward model predictions of surface displacement we have used the simple “Mogi” model (Mogi, 1958), which describes the three dimensional surface displacements arising from a volume change ΔV at a singularity at depth within a homogeneous elastic half-space (e.g., Segall, 2010, p. 207):
where are displacement components at an observation point i on the free surface that is a distance of from the location of the singularity in three-dimensional Cartesian space of dimensions x, y and z. The Mogi model is used to approximate a spherical magma source, but is perhaps best interpreted as a “centre-of-mass” of the magma body. The inversion procedure aims to solve the system of equations that take the form:
where b is a vector containing the GNSS and/or InSAR observations, G is the design matrix containing the geometric components of the forward model equations (1) with rows equal to the number of observations and columns equal to the number of observation epochs, and m contains the volume change to be solved at each observation epoch. In the case of InSAR, the daisy-chain network gives incremental LOS displacement observations between the two image capture epochs. This is a special case of a “Small Baseline Subset” network (Berardino et al., 2002), where for four image epochs (2) would be:
where vi is a displacement at point i along the 1-dimensional LOS viewing geometry described by the unit vector l = [lx, ly, lz]. In the case of GNSS, we use the cumulative displacement with respect to the first observed epoch; for four daily epochs (2) would be:
The problem is overdetermined, since there are (in most situations) more observations than unknowns. A unique solution to this problem does not exist, but an approximate solution can be obtained via a weighted least squares solution of the system (Menke, 1984):
and the solution error is given by:
The solution error matrix Σx is obtained by computing the pseudo-inverse of the quantity [GTΣ− 1G] via Singular Value Decomposition, with singular values below a threshold being truncated. Following experimentation, we applied a threshold of 1e−11 for all inversions. The weight matrix Σ−1 is the inverse of the variance-covariance matrix (VCM). For a three-component GNSS observation at one epoch the VCM takes the form:
The diagonal is populated with the variances of individual InSAR and/or GNSS observations and the off-diagonals are zero. Neglecting data covariance can lead to poorer resolution of the determined model parameters (Sudhaus and Jónsson, 2009). However, by neglecting covariance the computational cost of the inversion is reduced since a Cholesky decomposition of the VCM is not required.
As mentioned previously, InSAR data contain spatially correlated noise arising from the different atmospheric conditions present at the two image acquisition times. It is desirable to down-weight noisier InSAR observations in the inversion procedure. The variance of the phase values within the down-sampling windows is used as the weight for each down-sampled InSAR observation. Low phase variance results in a higher weight. Daily three-component GNSS observations are assigned a weight based on the uncertainties reported by the Bernese software (summarized in Table 4). The relative weighting of the InSAR and GNSS datasets has a significant impact on the overall outcome of a joint inversion. The dataset that has more weight (less uncertainty) has greater influence on the final solution. Uncertainties produced by the Bernese GNSS processing are known to be optimistic (Kouba, 2015). To counteract this, we up-scaled the standard deviations for all GNSS observations by a factor of 5 (i.e., variance by a factor of 25). This resulted in more equal weights for the InSAR and GNSS observations (Supplementary Figure 4).
During the grid search (Step 1), the inversion procedure is iterated over a finite grid of points in X, Y, and Z dimensions to determine the forward model that minimizes the L2-norm of the residuals. We used the weighted Root Mean Square (wRMS) as the L2-norm, calculated as:
where q is a vector of weighted residuals
Step 1 of the modelling procedure is concluded by visualizing the grid of wRMS values at each depth and the depth profile of the minimum of each grid (Figure 6). The source location in X, Y, and Z is chosen where the wRMS is minimised. This is the location where the single Mogi model best fits the input geodetic datasets. In Step 2, we fix the Mogi source to this best fitting location and run a single inversion of the geodetic data to solve for the time series of volume change of the source.
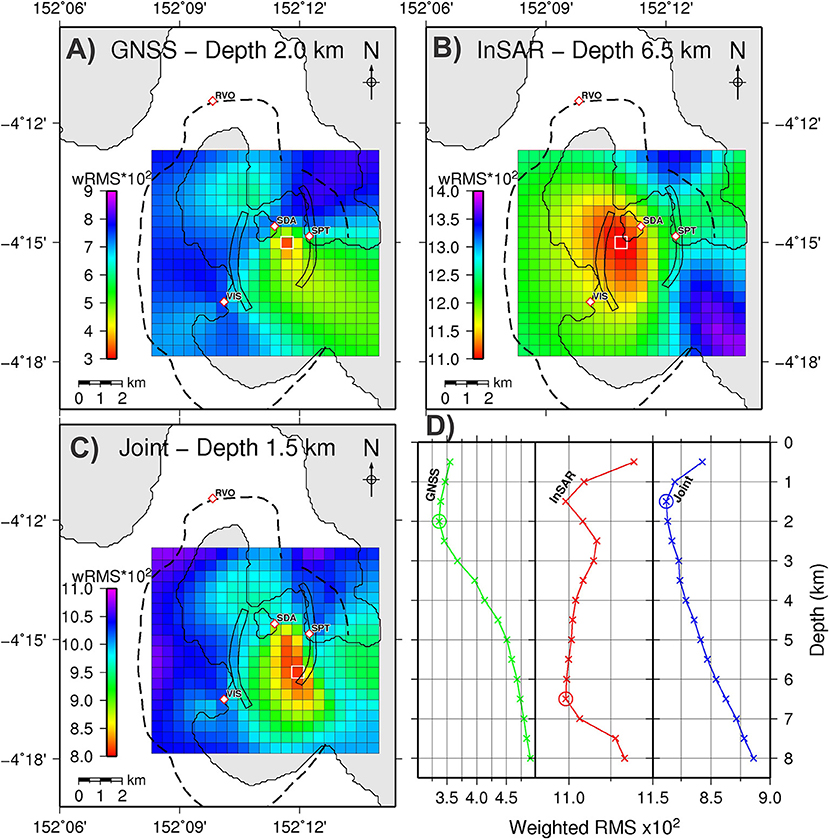
Figure 6. Plots of wRMS resulting from grid searches (Step 1) for the best source location for: (A) GNSS-only, (B) InSAR-only, (C) Joint inversion. White outlined square highlights the overall best fitting source for each inversion. (D) Plot of the depth variation of the minimum wRMS for each inversion. Circles highlight the overall best fit source for each inversion. Animations cycling through depth slices for each grid search are given in the Supplementary Material. Black dashed line indicates the general topographic rim of the nested caldera complex and the black polygons outline the two zones of concentrated seismicity (described in Figure 2). Red outlined diamonds indicate the location of the four GNSS stations.
Modelling Results
Step 1—Grid Search
We undertook a grid search across a rectangular region with dimensions of 10 x 9 km within the Rabaul Caldera (Figure 6). Iterations were performed at 500 m intervals in X and Y, and 500 m intervals in depth from 500 to 8,000 m. This resulted in a total of 5,985 iterations. The time taken to perform each iteration is dominated by the assembly of the design matrix. Run time therefore scales with the number of observations to be inverted. Correspondingly, a joint inversion iteration takes the longest (roughly 4.1 s), followed by the GNSS-only and InSAR-only inversions (roughly 2.1 s and 0.7 s, respectively). Thus, the total time for the grid search procedure was 24,538 s (~6.8 h) for the joint inversion on a fairly modest desktop PC (equipped with Intel Core i5-3470 CPU @ 3.2 GHz and 8 Gb of RAM). The grid sampling intervals can be varied to either prioritise sampling density or decrease run time. Here we performed the grid search over quite an expansive region, but this would not always be the case if there is confidence in the location of the magmatic source. Correspondingly, the grid search run time is customizable and could be much less for other volcanoes or during operational runs.
The results of the grid search are shown in Figure 6. The most likely source positions (indicated by the minimum wRMS) are quite different for independent InSAR and GNSS inversions. The GNSS inversion (Figure 6A) favours a source situated between Matupit and Tavuvur, southeast of station “SDA” and west of station “SPT,” at a depth of about 2 km. This broadly agrees with the source position inferred from geodetic data collected during the 1983–1985 unrest period (McKee et al., 1984, 1989; Archbold et al., 1988). The wRMS depth variation for the InSAR inversion (Figure 6D) reveals two source depths where the data are almost equally well fit. The actual minimum wRMS occurs for a source at a depth of 6.5 km (Figure 6B) situated southwest of station “SDA” and northeast of station “VIS.” The second source location, with only a marginally larger wRMS, is at a depth of 1.5 km with a position further south of “SPT” (see Supplementary Figure 5). This bimodal distribution of wRMS with depth suggests that the InSAR data cannot uniquely constrain a Mogi source in one single location, and a model with additional complexity, possibly two or more sources, is required to better fit the signals in the InSAR data. The joint inversion (Figure 6C) favours a source closest to the shallow InSAR solution at 1.5 km depth. We select this source location with the minimum wRMS from the joint inversion for use in the time series inversion (Step 2). Although this source location does not provide the best fit to GNSS and InSAR data taken in isolation, it is the best compromise when both datasets are used to constrain the inversion. This source is located at 152° 11.958′E, 4° 15.816′S, and a depth of 1.5 km. Animations of the wRMS for the full 3D grid searches are available in the Supplementary Material.
Step 2—Time Series Inversion
Figure 7 shows the time series of volume change derived from InSAR and GNSS independently and the joint inversion of these datasets for the source location identified in Step 1. Generally the three time series show the same trends of deflation followed by inflation. The joint inversion indicates a total volume loss (deflation) of ~1 × 10⁷ m3 occurring between February 2008 and November 2009, and a subsequent total volume gain (inflation) of ~2.5 × 10⁶ m3 until February 2011 when our observations cease. There is discrepancy in the total volume change resolved by InSAR and GNSS data for this source location, which is to be expected given that this source location is a compromise between the two datasets. Nevertheless, all three time series resolve the timing of changes in trend in February 2008 and November 2009.
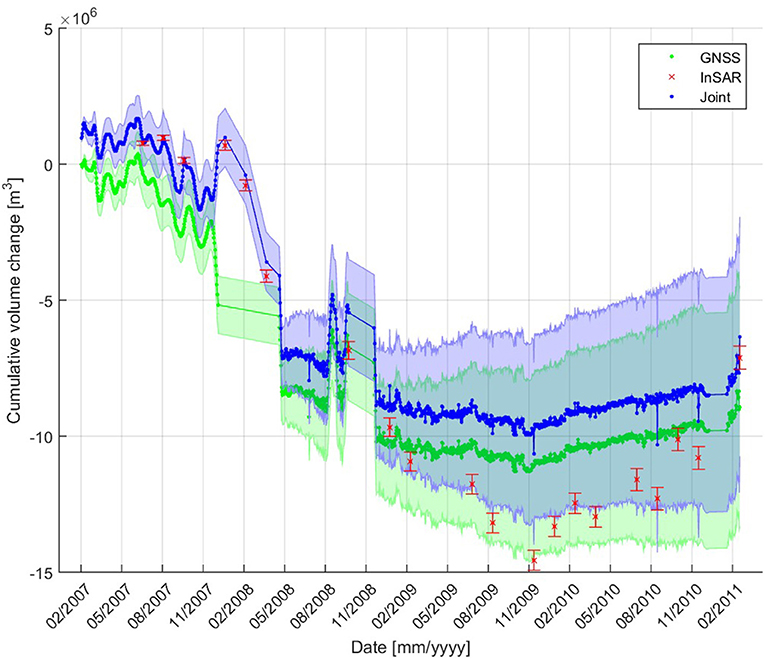
Figure 7. Time series inversion of the best source location determined from the joint inversion grid search. Cumulative volume change is plotted based on three inversions constrained by GNSS data only, InSAR data only and the joint inversion of GNSS and InSAR data. Uncertainties (1-sigma) are plotted as shaded error envelopes for the GNSS and joint inversions, and as error bars for the InSAR inversion.
The question is, what could be resolved if only the InSAR data was available to monitor the Rabaul Caldera? With only InSAR data to constrain the grid search we would determine that the best source location is at 152° 10.879′E, 4° 15.007′S, and a depth of 6.5 km (Figure 6B). In Figure 8 we show the volume change time series derived from an InSAR-only inversion with the Mogi source at the best position from the joint grid search, and the best position from the InSAR-only grid search. There is a difference in the absolute volume of deflation until November 2009, with the joint inversion resolving ~40% of the absolute deflation resolved by the InSAR-only inversion (~3.5 × 10⁷ m3). However, the exact timing of changes in trends can be seen in the time series of both inversions (i.e., the start of deflation after February 2008, and the change from deflation to inflation at November 2009). Therefore, the InSAR-only time series inversion is able to resolve the changes in trend that are required to make decisions at the volcano observatory despite not being able to unambiguously resolve absolute volume changes.
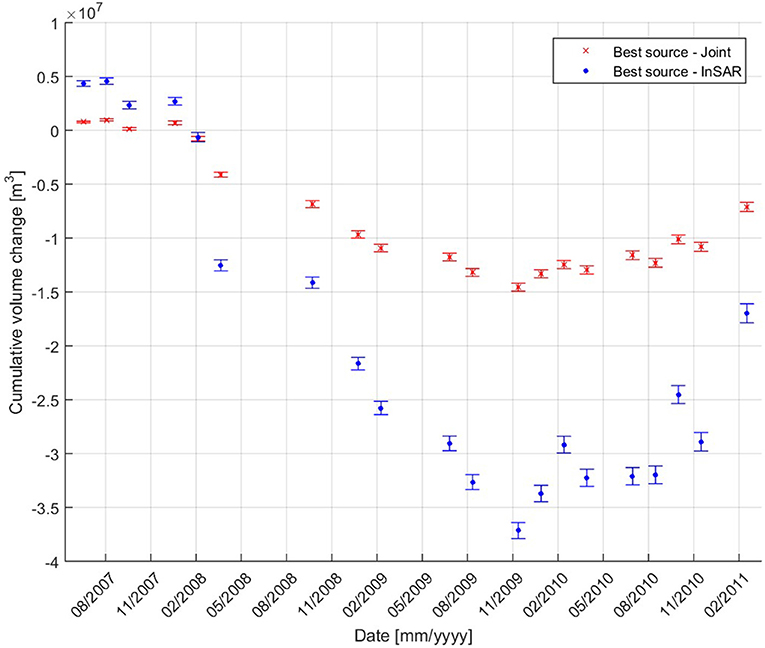
Figure 8. Time series inversion constrained by InSAR data for two source locations: the best location determined via joint inversion (red) and the best location determined by InSAR-only inversion (blue). 1-sigma uncertainties are plotted as error bars.
Residuals
Figure 9 shows the GNSS data at the four Rabaul stations and predicted surface displacement time series for a Mogi source at the best location indicated by the joint inversion grid search. All three components of model displacement fit within the uncertainty of the GNSS data at “RVO” and “VIS.” At “SDA,” the two horizontal components are similarly well fit, but the model under-predicts the gradients of subsidence and uplift. Conversely, at “SPT” the vertical displacement is fit within the data uncertainty, but the horizontal components are less well fit. The fact that the prediction for the best fitting source location cannot satisfy all the GNSS observations indicates that a single Mogi model is too simplistic to fully explain the deformation occurring at the Rabaul Caldera.
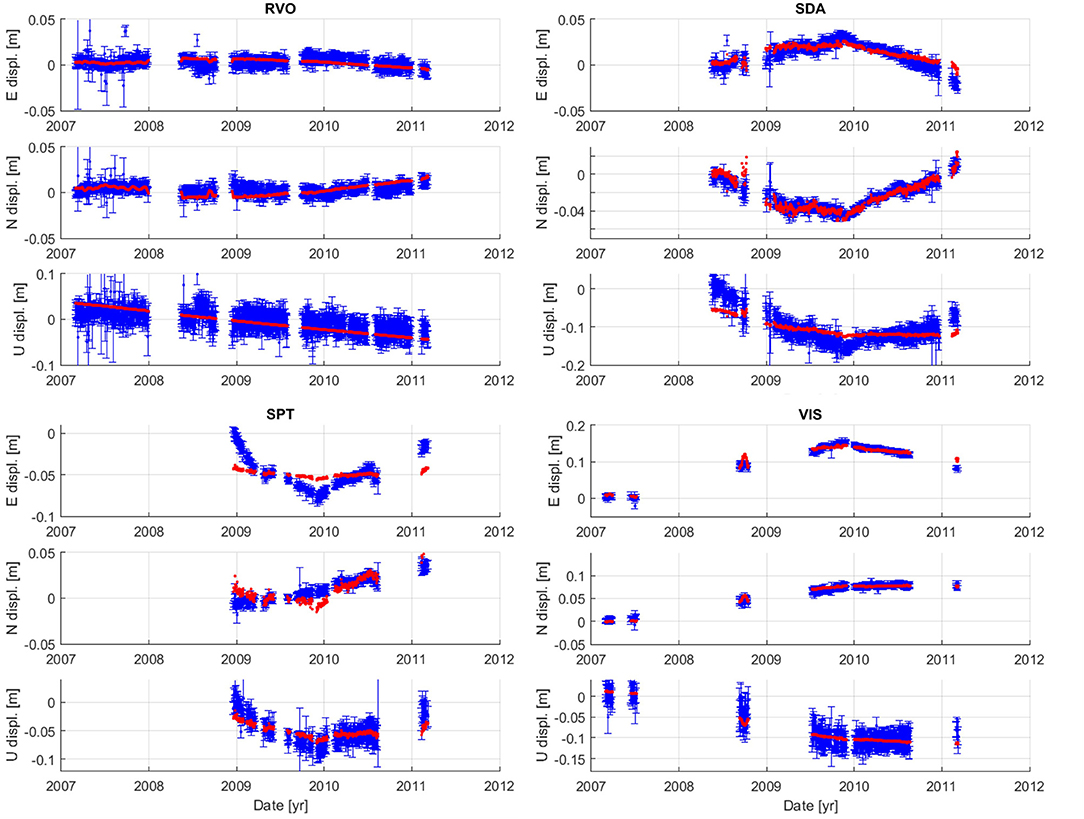
Figure 9. GNSS data and model predictions determined by the joint inversion time series (Step 2). Blue points with error bars show the GNSS observations and red line shows the model prediction of a single Mogi source at the location with minimum wRMS identified by the joint grid search (Step 1).
Figure 10 shows two examples of the down-sampled InSAR observations, the corresponding surface displacement predictions for the Mogi source, and differences between the two (i.e., the residuals) for the joint inversion (equivalent data for all interferograms are shown in Supplementary Figure 1). Generally across all 20 interferograms, the residuals are within 1–2 cm on the Vulcan peninsula and at Matupit (e.g., interferogram #16; Figure 10), though there are exceptions to this. For instance, in interferogram #9 (Figure 10), subsidence at Matupit is over-predicted but subsidence at Vulcan is under-predicted. As discussed in the InSAR Processing Results section, the InSAR data reveal the complex superposition of various localized and more broad-scale deformation features within the Rabaul Caldera. The superimposed localized signals act as a source of noise to the inversion modelled with a single Mogi source. In the case of complex volcanic systems, such as the Rabaul Caldera, decomposition of the InSAR deformation patterns (for instance, using independent component analysis; Ebmeier, 2016) prior to modelling could improve the constraint of InSAR signals on the single Mogi source that we implement to model the behaviour of the shallow caldera magma body. Ultimately though, a single Mogi source does not explain all the complexities revealed in the InSAR observations of the Rabaul Caldera.
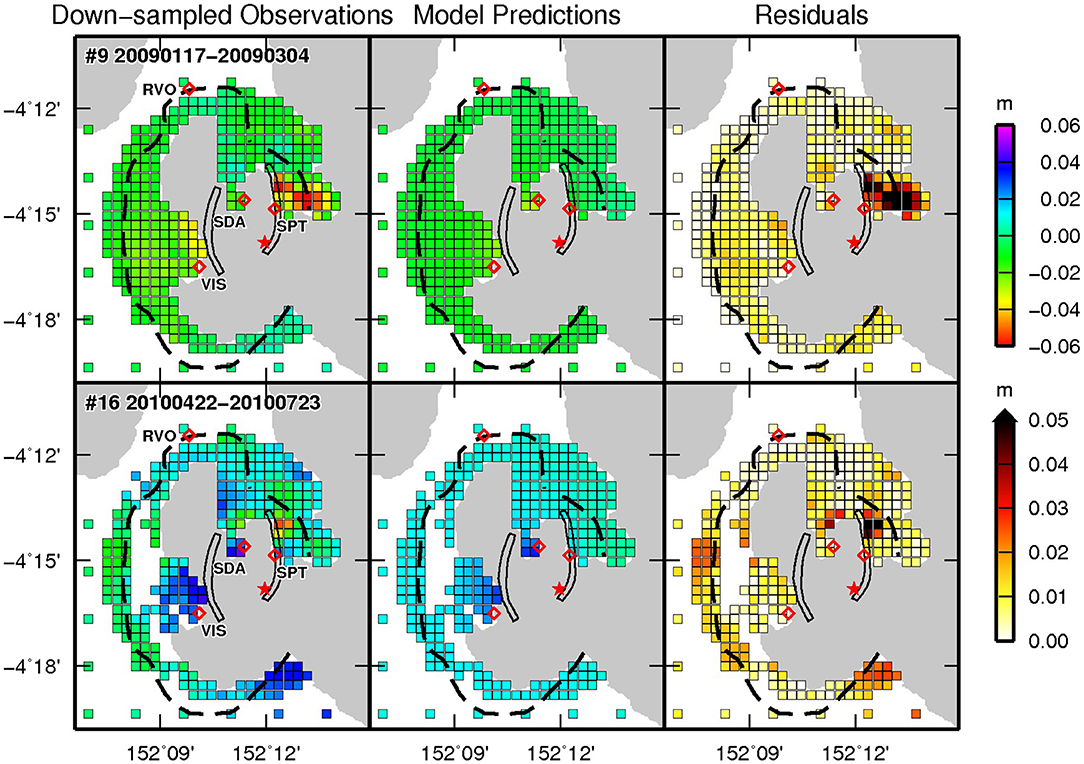
Figure 10. Examples of InSAR down-sampled observations, model predictions, and residuals from the joint time series inversion (Step 2). Interferogram #9 corresponds to the time of caldera subsidence (negative signal), whilst interferogram #16 corresponds to the time of caldera uplift (positive signal). Both interferograms contain large spatially-correlated signals not directly related to the deformation of the shallow magma body. Red star shows the location of the best fitting Mogi source determined from the joint inversion grid search. Red labelled diamonds indicate the location of the four GNSS stations. Corresponding data for all 20 interferograms are shown in Supplementary Figure 1. Black dashed line indicates the general topographic rim of the nested caldera complex and the black polygons outline the two zones of concentrated seismicity (described in Figure 2).
Discussion
Deformation Analysis of the Rabaul Caldera
Ronchin et al. (2017) present evidence that the ALOS-PALSAR data is imaging the “broad and long-term subsidence of Rabaul Caldera” that manifests as signals visible at Vulcan and Matupit. A key point of difference is that we resolve a period of subsidence followed by a change to uplift in November 2009, whereas Ronchin et al. (2017) interpret the InSAR data only in terms of subsidence. Our InSAR observations are corroborated by the GNSS observations (Figure 4), but in comparison are much noisier than the analysis of Ronchin et al. (2017). The primary reason for this is that Ronchin et al. (2017) used the more sophisticated Persistent Scatterer analysis method to process the same ALOS-PALSAR data set. This approach implements filters that are used to mitigate spatially correlated atmospheric artefacts but leave temporally correlated deformation signals. The end result of the Persistent Scatterer analysis is a comparatively smoother time series with suppressed noise. However, Persistent Scatterer analysis requires significant user knowledge and experience, and is time consuming to perform. It is therefore not a practical solution to InSAR uptake at a volcano observatory during an eruptive crisis. In contrast, our proposed modelling procedure requires less domain expertise and experience, yet can yield timely information on volcano deformation that can be interpreted directly at the volcano observatory. The future addition of spatio-temporal filtering to our modelling procedure could improve the overall results for inversions involving InSAR data.
Ronchin et al. (2017) were able to resolve a complicated magma body geometry using a finite element model constrained by average subsidence rates (i.e., velocities) derived from their Persistent Scatterer analysis. They estimated a total volume withdrawal of 1.2 × 10⁸ m3 over the February 2007 to December 2010 time period from depths between 2.5 and 4.5 km beneath the Rabaul Caldera. Although the accuracy of their volume estimate is unknown, it is an order of magnitude greater than the >1 × 10⁷ m3 we estimate from our joint inversion (Figure 7). Furthermore, the accuracy of our absolute volume change cannot be validated because it is highly dependent on the shape of the source. Nevertheless, the appeal of our simplified modelling technique in the context of operational volcano monitoring is its ability to record changes in trends (either changes in rate, the initiation or cessation of displacement, or the change from inflation to deflation).
Our grid searches constrained independently by the InSAR and GNSS observations have resulted in different best fit source locations (Figure 6). This discrepancy could be related to a number of factors: the location and density of geodetic observations; the wavelength of the deformation signal; the geometry of the source; the directional sensitivity of the InSAR and GNSS measurements; and the presence of several deformation sources. For example, if GNSS stations are sparsely distributed with poor azimuthal coverage with respect to the deformation source then they will not be able to successfully determine the location of the source. Furthermore, if GNSS observations from different stations in a sparse network have different data quality then the ability to accurately determine the source location could be compromised. In our case, data from the “VIS” station has a larger uncertainty than the other three stations (Table 4), and therefore has less influence on the modelling procedure.
InSAR observations have improved spatial resolution and coverage compared to most GNSS networks and are therefore usually more successful in determining the source location. However, an additional complicating factor at Rabaul is that the vast majority of the caldera floor is submerged beneath water, making it impossible to resolve the full surface deformation field with InSAR. This has possibly led to a more poorly constrained InSAR inversion in this case compared to when the same method has been applied to other volcanoes (e.g., Okmok; Biggs et al., 2010) where a complete spatial view of the surface deformation field is possible. InSAR is sensitive to vertical and east-west oriented displacements but not north-south displacements because of the 1-dimensional looking geometry. GNSS on the other hand typically provides equally accurate North-South and East-West displacements. For these reasons it is beneficial to use a combination of both InSAR and GNSS for volcano deformation monitoring wherever feasible.
Limitations of the Modelling Procedure
We have applied our modelling procedure using the simple Mogi analytical model, which is still widely used 60 years after it was first used in volcano modelling (e.g., Hamlyn et al., 2018; Kobayashi et al., 2018; Temtime et al., 2018). The Mogi model's success can be attributed to its relative simplicity (with only four parameters: X, Y, Z position and volume change) and its ability to reproduce the first-order surface displacement features caused by a variety of subsurface deformation phenomena. The limitations of the Mogi model include the simplified spherical geometry and the fact that the real crustal structure is not homogeneous, especially at a complex caldera structure. A caldera forms as a result of the collapse of the magma body roof, and the resulting complex plumbing system (typically combining dykes, inclined sheets and sills in addition to the shallow magma body; Tibaldi, 2015) is considerably more complex than the spherical geometry of the Mogi model. However, for the purpose of tracking changes in volcanic behaviour during a crisis, the use of a simple source geometry and crustal structure is advantageous considering the limited time available for interpretation. During the 2014–2015 Bárðarbunga eruption in Iceland our technique was used to rapidly produce a time-series of volume change that was interpreted in terms of the pressure change acting on the walls of the magma body as a result of magma outflow (Dumont et al., 2018). Assuming a spherical source will only provide an estimate of the “true” volume change, however this is inconsequential since we are primarily concerned with the overall trend and changes in trend for tracking magma movements.
It is straightforward to implement other analytical source models within the presented modelling framework that can explain different source types [e.g., horizontal sills or vertical dykes modelled as elastic dislocations (Okada, 1985), prolate ellipsoids (Yang et al., 1988), or horizontally-aligned circular cracks (Fialko et al., 2001)]. Furthermore, compound dislocation models (Nikkhoo et al., 2017) could be implemented to represent any of these different source types. Generally these alternative analytical models have a greater number of parameters than the Mogi model, which could impact on the computational cost of our modelling procedure. Adding complexity to models invariably involves adding more parameters, but can result in better overall fits to input datasets and more realistic source geometries (e.g., Ronchin et al., 2017). However, this complexity is not necessarily desirable in an operational context because it complicates the process for the volcano observatory staff and may result in slower computational run times. Using simple analytical models (such as the Mogi model) has the advantage that they can be run quickly (e.g., in a matter of seconds for the Mogi model once the source location has been constrained) in near-real-time on a modest desktop or laptop computer. This is beneficial for volcano observatory staff who have little time to refine the model to better fit the data during volcanic crises. When new geodetic data is received at the observatory, our modelling procedure can be quickly used by the staff to determine whether the magma withdrawal rate is increasing (potential for additional eruptive hazards), is fairly steady, or even declining. This trend information can then be used directly in the decision-making process (Stage 4).
Our modelling procedure inherently assumes that the deformation source does not move throughout the observed time period, which simplifies the implementation of the two-step process. However, this assumption is unlikely to be valid in most cases as magma moves through the volcano plumbing system at different depth levels and between different plumbing elements. Therefore, there is scope to improve the presented method by inverting for both source location and volume change at each epoch. This would enable the volcano observatory to infer when magma is migrating to shallower levels.
InSAR vs. GNSS for Operational Monitoring
Wherever feasible, a combination of GNSS and InSAR data will give the best temporal and spatial constraints on volcano deformation. InSAR observations are useful for supplementing the GNSS data stream, especially if SAR data from ascending-pass and descending-pass viewing geometries is available. In this situation, it is possible to derive vertical and East-West oriented volcano deformation signals from InSAR data alone and further improve constraints on the geometry and location of the magma source (e.g., Morishita et al., 2016; Peltier et al., 2017; Pepe et al., 2018). For our Rabaul Caldera case study, we have used InSAR data with a single ascending-pass LOS geometry. With only one InSAR viewing geometry it is not possible to unambiguously decompose vertical and horizontal displacements (e.g., Fuhrmann and Garthwaite, submitted; Parks et al., 2018). However, for those volcanoes where no geodetic monitoring is being done, even InSAR analysis with a single viewing geometry is advantageous because it can provide deformation observations with high spatial resolution, reducing the need for observatory staff to visit the volcano to deploy ground instrumentation. These InSAR constraints can even be used to select suitable sites for new GNSS station installations.
Perhaps the most significant limitation of InSAR for near-real-time operational monitoring is the relatively poor sampling frequency of images. All current SAR systems use polar orbits with a single satellite orbital revisit of at least 11 days (i.e., TerraSAR-X). However, the imaging frequency can be increased when multiple identical satellites with phased orbits form a constellation (e.g., COSMO-SkyMed and Sentinel-1). Each COSMO-SkyMed satellite has a 16 day orbital revisit, but with four satellites making up the constellation there are opportunities for images to be acquired after 1, 4, and 8 days have elapsed after the first satellite overpass. In the case of the European Sentinel-1 constellation, the two identical satellites have a 12 day revisit with an orbital phasing difference of 180 degrees, meaning that regular image capture opportunities exist every 6 days.
In isolation, the existing baseline of GNSS measurements could be used to reference physical thresholds of the Rabaul volcanic system to absolute heights of GNSS monitoring stations. For instance, if the “SDA” station at Matupit reaches a height of ~97 m above the WGS84 Ellipsoid, then an eruption of Tavuvur might be considered more likely based on what occurred prior to the 2006 eruption of Tavuvur (see Figure 3). Baseline observations over many eruptive cycles will assist in finessing these expectations and assigning greater confidence in the decision-making process. Therefore, using continuous GNSS data acquired and processed in near-real-time is possibly more advantageous than InSAR for operational geodetic monitoring at a volcano observatory where decisions may need to be made on a daily basis. This highlights the importance of properly maintaining existing GNSS infrastructure at volcanoes to ensure all stations are recording suitable data concurrently and the processing system can be run operationally.
Online services that process user-uploaded GNSS data files could be a useful operational tool for volcano observatories, providing that reliable internet connections are in place. Existing online services include CSRS-PPP and AUSPOS. The CSRS-PPP service https://webapp.geod.nrcan.gc.ca/geod/tools-outils/ppp.php, provided by Natural Resources Canada, uses the Precise Point Positioning (PPP) methodology (Héroux and Kouba, 2001), which makes use of the most precise and globally consistent satellite orbits and clocks, and considers various model components and corrections to achieve centimetre accuracy. Processed results from the CSRS-PPP service can be received within a few minutes of submission. The AUSPOS service http://www.ga.gov.au/scientific-topics/positioning-navigation/geodesy/auspos, provided by Geoscience Australia, processes submitted GNSS data in a network solution with data from IGS sites in the vicinity of the supplied data, and IGS orbit products. This methodology is equivalent to the method we described in the GNSS Processing Method section.
Removing Barriers to InSAR Uptake
In the fullness of time, the barriers to operational InSAR volcano monitoring in LMICs can be overcome. In the following we address each of the barriers outlined in Table 2, including how our described methodology can contribute to overcoming these issues.
Overstretched Observatory Staff
The immediate problem (lack of staff time) is not something that the expert user community can directly solve. Volcano observatory staff will always be overstretched, but by simplifying (or automating) the routine InSAR processing that is required to be done at the observatory we empower the observatory staff to incrementally incorporate InSAR analysis into operational processes. The majority of data downloading and processing could be automated, and even if there is failure of the processing for some interferometric pairs, a significant portion should process successfully with minimal to no intervention required.
In this paper we have suggested a simplified workflow that integrates InSAR and/or GNSS observations as they become available and uses a simple two-step inversion procedure to generate time series outputs in a common framework (i.e., magma source volume change). The first stage of the inversion (the grid search) takes longer to compute but only needs to be done on an intermittent (e.g., monthly) basis, providing that the source is not migrating rapidly. The second stage (the time series inversion), can be run in a short time on a daily basis to integrate new InSAR and/or GNSS observations as they become available. The data download and reformatting could be done automatically using scripts so the inversion itself would take a matter of seconds to complete.
To best address how we move towards incorporating InSAR monitoring into the volcano observatory decision-making process, we must also explore complementary methods of incorporating easily accessible InSAR products into observatory procedures. We do not directly address this issue in this paper, but it is conceivable that satellite data providers could move towards generating and distributing standardized interferometric products. The Committee on Earth Observation Satellites (CEOS) has a current initiative “CARD4L” (http://ceos.org/ard/) to define a series of “Analysis Ready Data” products for optical and SAR sensors and a standard InSAR product is currently being considered for adoption under the initiative. The upcoming NASA-ISRO SAR mission (“NISAR”) plans to disseminate a “geocoded unwrapped interferogram” as a standard product (NASA, 2018). Other organizations (universities or governmental agencies) are already making available standard InSAR products derived from Sentinel-1 data. Some examples of this are the SARVIEWS Hazard portal (http://sarviews-hazards.alaska.edu/) (Meyer et al., 2015), and the LiCSAR portal https://comet.nerc.ac.uk/COMET-LiCS-portal/ (González et al., 2016).
Distribution of standard analysis-ready InSAR products would remove a large component of the full InSAR processing workflow (i.e., stages one and two in Figure 1) from the volcano observatories list of regular work tasks. It could also remove the need for specialist interferometry software and high-end computational resources at the observatory (thus saving financial resources; barrier 2), and to some extent, InSAR expertise (barrier 3). All of these factors could greatly improve the uptake of InSAR data into operational usage. Therefore, developments in this space should be encouraged and championed by those working in a LMIC context.
Lack of Financial Resources
Proprietary software will remain an ongoing issue that is not currently addressed by the procedure we have presented (which was applied using the proprietary Matlab software and programming language). To enable further uptake in the future, the inversion workflow presented here could be translated to the Python programming language, which is open source (free to use) and offers broadly equivalent functionality to Matlab. Furthermore, the software package should be made available via an open software repository that volcano observatories can access.
The modelling procedure we have demonstrated reduces the need for large computer systems. Given that only a single inversion is required to undertake Step 2 of the procedure and obtain the time series of volume change, an answer can be obtained in a matter of seconds on a modest desktop PC. Therefore, it is entirely feasible that Step 2 of the modelling procedure could be run on a daily basis (including new InSAR data and/or daily GNSS observations as they become available) on a local computer at a volcano observatory to support operational monitoring. The more time consuming Step 1 process should be run periodically (i.e., fortnightly or monthly) to test whether the source position has migrated based on the most up to date geodetic datasets.
The Sentinel-1 constellation of SAR satellites, first launched in 2014, now acquires data over all of the world's subaerial Holocene volcanoes with at least a 12 day revisit. The data is accessible free of charge to anyone, and can be downloaded from the Copernicus Open Access Hub (https://scihub.copernicus.eu/) within a few hours of image acquisition. This ensures there is a source of SAR data available to all volcano observatories for use in operational InSAR processing, even without dedicated financial resources for data purchase. Sentinel-1 uses C-band radar (wavelength of 5.5 cm), which does not maintain adequate interferometric coherence in densely vegetated tropical environments. This is a common situation for many LMICs that are situated in equatorial regions. The forthcoming NISAR mission will incorporate longer wavelength L- and S-band radars (wavelengths of 24 and 9 cm, respectively; NASA, 2018) that should improve InSAR performance in these tropical environments. NASA and ISRO have agreed to a free and open data policy for the acquired NISAR data (NASA, 2018). Furthermore, the Japanese Aerospace Exploration Agency (JAXA) is working towards making its remote sensing data of 10 m or coarser resolution open in the future, including from its L-band SAR missions and starting with the ALOS-PALSAR data archive (pers. comm. Shin-ichi Sobue, JAXA, 30 August 2018). Open access to these longer wavelength SAR datasets is crucial for widespread application of InSAR to operational volcano monitoring in the tropics.
Complexity of InSAR Processing
InSAR processing methodologies remain highly complex. As a result, the training requirements for observatory staff to process and make use of InSAR data are expansive. Based on experiences in Latin America, Pritchard et al. (2018) reported that observatories found benefit in the InSAR training provided. However, often the participants of the training are temporary staff members (which can mean that knowledge is lost when they leave), or permanent staff that are tasked with several other operational duties. Also, due to the complexity of InSAR signals, observatories often want access to second opinions on data interpretations (Pritchard et al., 2018). This shows that experience obtained over many years or via close mentorship is needed for confident interpretation of InSAR signals.
By standardizing the InSAR processing chain and delivering standard products to observatories (i.e., removing stages one and two from the volcano observatories list of tasks), the need for training on the InSAR processing is reduced. Training efforts can then be focused on modelling and interpretation of signals. This increased focus on interpretation should enable observatory staff to build the confidence needed to independently incorporate InSAR into their operational procedures.
Internet Access
Internet access is a fundamental challenge in the use of remote-sensing data, and improved, reliable access to the internet would significantly increase the capacity of many observatories to access and use remote sensing data (Loughlin et al., 2015). As a remote sensing technique, InSAR inherently involves the use of very large image files and this is not likely to change. To some extent the problem can be mitigated by subsampling the images delivered to the observatory but this only really becomes possible when parts of the processing chain are standardized and run operationally by other organisations (as discussed above).
Zebker (2017) suggests distributing “geocoded flattened Single Look Complex” images instead of interferograms. The Single Look Complex (SLC) is a raw SAR image product containing both amplitude and phase information for each imaged pixel. Two SLCs acquired at different times by the same SAR sensor and in the same imaging geometry are required to form an interferogram. The SAR image product proposed by Zebker (2017) removes the complexities of radar geometry from the processing procedure (data are already transformed to the geographic coordinate system) and the phase information has already been corrected for geometry and topographic signal components. It is then a relatively straight forward procedure to generate interferograms by cross-multiplication of image pair combinations. Consequently, using these products would reduce the number of large image files that would need to be downloaded, compared to if the interferograms themselves were distributed. This approach could be most beneficial for a SAR system where orbits are poorly controlled (such as ALOS-PALSAR) and interferometric baselines are generally large. In these situations, large numbers of interferograms are needed to ensure a properly connected network for time series inversion and the “daisy-chain” approach is less applicable.
Latency of SAR Data
The delivery of SAR images to the volcano observatory will never be instant, and so real-time InSAR processing is not a realistic prospect for volcano monitoring. However, it is possible to obtain some SAR data quickly enough to enable “near-real-time” or “same day” InSAR processing, subject to the availability of a reliable internet connection with decent bandwidth. For instance, COSMO-SkyMed data can be delivered with a latency of about 6 h following image acquisition. Furthermore, Sentinel-1 data can be downloaded from the Copernicus Open Access Hub within a similar timeframe after acquisition. Progress is being made in the development of near-real-time InSAR processing algorithms (e.g., Spaans and Hooper, 2016), but these are still relatively complex and require expert knowledge.
GNSS monitoring is essential for those volcano observatories that require real time updates on volcano surface movement. Continuous GNSS data can be telemetered back to the observatory, processed in real time, and displayed on a screen with continuous updates (e.g., Endo, 2005). However, InSAR is very useful for supplementing this and gaining an improved understanding of what is happening due to the higher spatial resolution of the data, which enables more detailed modelling. Ultimately, a combination of both InSAR and GNSS represents the best possible volcano monitoring scenario for real-time applications.
Lack of Baseline Data
As discussed in the Introduction, not all volcanoes that erupt exhibit precursory deformation signals (Biggs et al., 2014). It is therefore critical to build a baseline of InSAR and/or ground-based geodetic observations at potentially active volcanoes to determine which ones could be routinely monitored for precursory ground deformation. These baseline surveys conducted systematically over whole volcanic regions (Pritchard and Simons, 2002; Chaussard and Amelung, 2012; Pritchard et al., 2018) should ideally be done before geodetic signals can be reliably used to make judgements on the state of a volcanic system and decisions that will affect at-risk populations. The longer the baseline of observations, the easier it will be to understand the physical thresholds in the volcanic system that can lead to an eruption, resulting in greater confidence during the decision-making process. It has been recognized that large eruptions could alter plumbing systems, meaning that background or pre-eruptive reference levels can change through time (e.g., Hekla volcano, Iceland Ofeigsson et al., 2011). We should leverage old archives of SAR data, as well as SAR data currently being acquired, to conduct these systematic baseline surveys. For instance, the ALOS-PALSAR mission acquired typically 20 ± 5 images in Fine Beam Mode between the 2006–2011 time period over the whole global land mass.
Conclusions
The broad and meaningful impact of using remote sensing data for volcano monitoring in LMICs has long been recognised (e.g., Ernst et al., 2008), and the applicability of the InSAR technique to volcano deformation monitoring has been demonstrated over decades. Despite this, there are very few examples globally (some are given in Supplementary Table 1) where InSAR-derived data is being operationally used in the decision-making process at volcano observatories. This is compounded further in a resource-constrained context and in LMICs by several barriers that limit the uptake of InSAR data (see Table 2).
In this paper we have presented a simplified processing chain (Figure 1) that could be used by volcano observatory staff to incorporate InSAR data into their operational procedures. In Stage 3 of this processing chain we have presented a lightweight two-step modelling procedure that uses geodetic data to constrain a physical model of magma body inflation/deflation. This physical model acts as a common framework that can be used to validate InSAR and GNSS observations where both are available. The modelling procedure can be run quickly on a modest laptop or desktop PC on a daily basis (or as frequently as new geodetic data is received) to track trends in volcano surface movement induced by volume changes in a subsurface magma body. The analysis of these trends and comparison against the observatory's baseline of observations then informs the decision-making process about whether volcano alert levels should change and/or whether notifications need to be issued. The two steps of the joint modelling procedure are:
• Step 1—a grid search to determine the best source position that could be undertaken periodically (e.g., on a monthly basis); and
• Step 2—daily operational processing involving the time series inversion for a specific source location. This can be run in a matter of seconds after the appropriate formatting of new InSAR and/or GNSS observations.
We have demonstrated the proposed lightweight modelling procedure at the Rabaul Caldera in PNG, where both GNSS and InSAR data are available. Joint inversion of the two datasets finds a best fitting Mogi source situated ~1.5 km beneath Rabaul Caldera at 152° 11.958′E, 4° 15.816′S. From Figure 7, it is clear that both the independent inversions of InSAR and GNSS were able to determine that the minimum volume of the magma source occurred at November 2009. That is when the observed subsidence trend at Rabaul (caused by source deflation) changed to an uplift trend (caused by source inflation). Therefore, our case study at Rabaul Caldera shows that it is feasible to use InSAR data in isolation at any deforming volcano to track surface movement trends using our modelling procedure. Furthermore, as a remote sensing technique, InSAR can be applied to generate a baseline of observations at remote volcanoes where ground-based monitoring is impractical. Application of standardized and simplified routine InSAR monitoring for currently un-monitored volcanoes could potentially provide volcano observatories with critical early warning signals prior to an eruption.
Author Contributions
MG and VM jointly developed the concept of this paper. MG processed the InSAR data, conducted the modelling of all datasets, and led the writing of the paper. SS collected the GNSS data, which was processed by GH. MP assisted with the use of the modelling software. All authors contributed to the writing of the paper. All authors contributed to the writing of the paper.
Funding
The work in this paper was completed as part of the Technical Disaster Risk Reduction Program in Papua New Guinea funded by the Australian Federal Government Department of Foreign Affairs and Trade (Activity 41, Record of Understanding 51172).
Conflict of Interest Statement
The authors declare that the research was conducted in the absence of any commercial or financial relationships that could be construed as a potential conflict of interest.
Acknowledgments
ALOS-PALSAR data was provided by JAXA through the RA4 program (PI 1134). The authors wish to acknowledge the contributions of many other Geoscience Australia colleagues in setting up and operating the GNSS and InSAR analysis capabilities. Hannah Dietterich, Jean-Luc Froger, Ian Hamling, Ingrid Johanson, Tomokazu Kobayashi, Craig Miller, Emily Montgomery-Brown, Aline Peltier, and Mike Poland are thanked for providing information to populate Supplementary Table 1. The Matlab software used here is based on code developed and shared by Juliet Biggs. This paper is published with the permission of the CEO, Geoscience Australia.
Supplementary Material
The Supplementary Material for this article can be found online at: https://www.frontiersin.org/articles/10.3389/feart.2018.00240/full#supplementary-material
References
Alexander, D. (2013). Volcanic ash in the atmosphere and risks for civil aviation: A study in European crisis management. Int. J. Disaster Risk Sci. 4, 9–19. doi: 10.1007/s13753-013-0003-0
Altamimi, Z., Collilieux, X., and Métivier, L. (2011). ITRF2008: an improved solution of the international terrestrial reference frame. J. Geod. 85, 457–473. doi: 10.1007/s00190-011-0444-4
Amelung, F., Jónsson, S., Zebker, H., and Segall, P. (2000). Widespread uplift and ‘trapdoor’ faulting on Galápagos volcanoes observed with radar interferometry. Nature 407, 993–996. doi: 10.1038/35039604
Annen, C., and Wagner, J.-J. (2003). The impact of volcanic eruptions during the 1990s. Nat. Hazards Rev. 4, 169–175. doi: 10.1061/(ASCE)1527-6988(2003)4:4(169)
Archbold, M. J., McKee, C. O., Talai, B., Mori, J., and De Saint Ours, P. (1988). Electronic distance measuring network monitoring during the Rabaul seismicity/deformational crisis of 1983–1985. J. Geophys. Res. 93, 12123–12136. doi: 10.1029/JB093iB10p12123
Auker, M. R., Sparks, R. S. J., Siebert, L., Crosweller, H. S., and Ewert, J. (2013). A statistical analysis of the global historical volcanic fatalities record. J. Appl. Volcanol. 2:2. doi: 10.1186/2191-5040-2-2
Berardino, P., Fornaro, G., Lanari, R., and Sansosti, E. (2002). A new algorithm for surface deformation monitoring based on small baseline differential SAR interferograms. IEEE Trans. Geosci. Remote Sens. 40, 2375–2383. doi: 10.1109/TGRS.2002.803792
Biggs, J., Ebmeier, S. K., Aspinall, W. P., Lu, Z., Pritchard, M. E., Sparks, R. S. J., et al. (2014). Global link between deformation and volcanic eruption quantified by satellite imagery. Nat. Commun. 5, 3471. doi: 10.1038/ncomms4471
Biggs, J., Lu, Z., Fournier, T., and Freymueller, J. T. (2010). Magma flux at Okmok Volcano, Alaska, from a joint inversion of continuous GPS, campaign GPS, and interferometric synthetic aperture radar. J. Geophys. Res. 115:B12401. doi: 10.1029/2010JB007577
Biggs, J., Wright, T., Lu, Z., and Parsons, B. (2007). Multi-interferogram method for measuring interseismic deformation: denali Fault, Alaska. Geophys. J. Int. 170, 1165–1179. doi: 10.1111/j.1365-246X.2007.03415.x
Blong, R. (2003). Building damage in Rabaul, Papua New Guinea, 1994. Bull. Volcanol. 65, 43–54. doi: 10.1007/s00445-002-0238-x
Böhm, J., Niell, A., Tregoning, P., and Schuh, H. (2006). Global Mapping Function (GMF): a new empirical mapping function based on numerical weather model data. Geophys. Res. Lett. 33:L07304. doi: 10.1029/2005GL025546
Brown, S. K., Auker, M. R., and Sparks, R. S. J. (2015a). “Populations around Holocene volcanoes and development of a Population Exposure Index,” in Global Volcanic Hazards and Risk, eds C. Vye-Brown, S. K. Brown, S. Sparks, S. C. Loughlin, and S. F. Jenkins (Cambridge: Cambridge University Press), 223–232.
Brown, S. K., Jenkins, S. F., Sparks, R. S. J., Odbert, H., and Auker, M. R. (2017). Volcanic fatalities database: analysis of volcanic threat with distance and victim classification. J. Appl. Volcanol. 6:15. doi: 10.1186/s13617-017-0067-4
Brown, S. K., Loughlin, S. C., Sparks, R. S. J., Vye-Brown, C., Barclay, J., Calder, E., et al. (2015b). “Global volcanic hazard and risk,” in Global Volcanic Hazards and Risk, eds C. Vye-Brown, S. K. Brown, S. Sparks, S. C. Loughlin, and S. F. Jenkins (Cambridge: Cambridge University Press), 81–172. doi: 10.1017/CBO9781316276273.004
Brown, S. K., Sparks, R. S. J., Mee, K., Vye-Brown, C., Ilyinskaya, E., Jenkins, S. F., et al. (2015c). Regional and Country Profiles of Volcanic Hazard and Risk. Report IV of the GVM/IAVCEI Contribution to the Global Assessment Report on Disaster Risk Reduction. Global Volcano Model and IAVCEI).
Chaussard, E., and Amelung, F. (2012). Precursory inflation of shallow magma reservoirs at west Sunda volcanoes detected by InSAR. Geophys. Res. Lett. 39:L21311. doi: 10.1029/2012GL053817
Chaussard, E., Amelung, F., and Aoki, Y. (2013). Characterization of open and closed volcanic systems in Indonesia and Mexico using InSAR time series. J. Geophys. Res. 118, 3957–3969. doi: 10.1002/jgrb.50288
Chester, D. K. (2005). “Volcanoes, society, and culture,” in Volcanoes and the Environment, eds G. G. J. Ernst, and J. Marti (Cambridge: Cambridge University Press), 404–439. doi: 10.1017/CBO9780511614767.015
Costantini, M. (1998). A novel phase unwrapping method based on network programming. IEEE Trans. Geosci. Remote Sens. 36, 813–821. doi: 10.1109/36.673674
Dach, R., Lutz, S., Walser, P., and Fridez, P. (2015). Bernese GNSS Software, Version5.2, User Manual. Bern: Astronomical Institute, University of Bern. Available online at: http://www.bernese.unibe.ch/docs/DOCU52.pdf (Accessed November 9, 2018).
Dumont, S., Sigmundsson, F., Parks, M. M., Drouin, V. J. P., Pedersen, G. B. M., Jónsdóttir, I., et al. (2018). Integration of SAR data into monitoring of the 2014-2015 Holuhraun eruption, Iceland: contribution of the Icelandic volcanoes supersite and the futurevolc projects. Front. Earth Sci. 6, 231. doi: 10.3389/feart.2018.00231
Dvorak, J. J., and Dzurisin, D. (1997). Volcano geodesy: the search for magma reservoirs and the formation of eruptive vents. Rev. Geophys. 35, 343–384. doi: 10.1029/97RG00070
Dzurisin, D. (2000). Volcano geodesy: challenges and opportunities for the 21st century. Philos. Trans. R. Soc. Lond. A 358, 1547–1566. doi: 10.1098/rsta.2000.0603
Dzurisin, D., Lu, Z., Poland, M. P., and Wicks, C. W. (2018). Space-Based Imaging Radar Studies of U.S. Volcanoes. Front. Earth Sci. doi: 10.3389/feart.2018.00249. [Epub ahead of print].
Ebmeier, S. K. (2016). Application of independent component analysis to multitemporal InSAR data with volcanic case studies. J. Geophys. Res. 121, 8970–8986. doi: 10.1002/2016JB013765
Ebmeier, S. K., Andrews, B. J., Araya, M. C., Arnold, D. W. D., Biggs, J., Cooper, C., et al. (2018). Synthesis of global satellite observations of magmatic and volcanic deformation: implications for volcano monitoring and the lateral extent of magmatic domains. J. Appl. Volcanol. 7:2. doi: 10.1186/s13617-018-0071-3
Endo, E. (2005). “The Rabaul Volcano observatory real-time GPS upgrade,” in Open-File Report, 2005-1232 (United States Geological Survey). Available online at: https://pubs.er.usgs.gov/publication/ofr20051232
Ernst, G. G. J., Kervyn, M., and Teeuw, R. M. (2008). Advances in the remote sensing of volcanic activity and hazards, with special consideration to applications in developing countries. Int. J. Remote Sens. 29, 6687–6723. doi: 10.1080/01431160802168459
Ewert, J. W., Guffanti, M., and Murray, T. L. (2005). “An assessment of volcanic threat and monitoring capabilities in the United States: framework for a National Volcano Early Warning System,” in Open-File Report, 2005-1164 (United States Geological Survey). Available online at: https://pubs.er.usgs.gov/publication/ofr20051164
Fernández, J., Pepe, A., Poland, M. P., and Sigmundsson, F. (2017). Volcano Geodesy: recent developments and future challenges. J. Volcanol. Geother. Res. 344, 1–12. doi: 10.1016/j.jvolgeores.2017.08.006
Fialko, Y., Khazan, Y., and Simons, M. (2001). Deformation due to a pressurized horizontal circular crack in an elastic half-space, with applications to volcano geodesy. Geophys. J. Int. 146, 181–190. doi: 10.1046/j.1365-246X.2001.00452.x
Finlayson, D. M., Gudmundsson, O., Itikarai, I., Nishimura, Y., and Shimamura, H. (2003). Rabaul volcano, Papua New Guinea: seismic tomographic imaging of an active caldera. J. Volcanol. Geother. Res. 124, 153–171. doi: 10.1016/S0377-0273(02)00472-9
Fuhrmann, T., and Garthwaite, M. C. (submitted). Resolving 3-dimensional surface motion with InSAR: constraints from multi-geometry data fusion. Remote Sens.
Furtney, M. A., Pritchard, M. E., Biggs, J., Carn, S. A., Ebmeier, S. K., Jay, J. A., et al. (2018). Synthesizing multi-sensor, multi-satellite, multi-decadal datasets for global volcano monitoring. J. Volcanol. Geother. Res. 365, 38–56 doi: 10.1016/j.jvolgeores.2018.10.002
Goldstein, R. M., and Werner, C. L. (1998). Radar interferogram filtering for geophysical applications. Geophys. Res. Lett. 25, 4035–4038. doi: 10.1029/1998GL900033
González, P. J., Walters, R. J., Hatton, E. L., Spaans, K., McDougall, A., Hooper, A. J., et al. (2016). “LiCSAR: tools for automated generation of Sentinel-1 frame interferograms,” in: 2016 Fall Meeting (San Francisco, CA: AGU). Available online at: https://agu.confex.com/agu/fm16/meetingapp.cgi/Paper/160810
Hamling, I. J., Hreinsdóttir, S., and Fournier, N. (2015). The ups and downs of the TVZ: Geodetic observations of deformation around the Taupo Volcanic Zone, New Zealand. J. Geophys. Res. 120, 4667–4679. doi: 10.1002/2015JB012125
Hamlyn, J., Wright, T., Walters, R., Pagli, C., Sansosti, E., Casu, F., et al. (2018). What causes subsidence following the 2011 eruption at Nabro (Eritrea)? Prog. Earth Planet. Sci. 5:31. doi: 10.1186/s40645-018-0186-5
Héroux, P., and Kouba, J. (2001). GPS precise point positioning using IGS orbit products. Phys. Chem. Earth Part A 26, 573–578. doi: 10.1016/S1464-1895(01)00103-X
IERS Conventions (2010). “IERS Technical Note; 36,” in Frankfurt am Main: Verlag des Bundesamts für Kartographie und Geodäsie, eds Petit, G and Luzum, B. p. 179.
Itikarai, I. (2008). The 3-D structure and earthquake locations at Rabaul Caldera, Papua New Guinea. Master of Philosophy thesis, Australian National University.
Jóhnson, R. W., Itikarai, I., Patia, H., and McKee, C. O. (2010). Volcanic Systems of the Northeastern Gazelle Peninsula, Papua New Guinea: Synopsis, Evaluation, and a Model for Rabaul Volcano. Papua New Guinea. Rabaul Volcano Workshop Report. (Port Moresby: Papua New Guinea Department of Mineral Policy and Geohazards Management, and Australian Agency for International Development).
Jónsson, S., Zebker, H., Segall, P., and Amelung, F. (2002). Fault slip distribution of the 1999 Mw 7.1 Hector Mine, California, Earthquake, Estimated from Satellite Radar and GPS Measurements. Bull. Seismol. Soc. Am. 92, 1377–1389. doi: 10.1785/0120000922
Kobayashi, T., Morishita, Y., and Munekane, H. (2018). First detection of precursory ground inflation of a small phreatic eruption by InSAR. Earth Planet. Sci. Lett. 491, 244–254. doi: 10.1016/j.epsl.2018.03.041
Kouba, J. (2015). A Guide to Using International GNSS Service (IGS) Products. International GNSS Service. Available online at: https://kb.igs.org/hc/en-us/articles/201271873-A-Guide-to-Using-the-IGS-Products
Larson, K. M., Poland, M., and Miklius, A. (2010). Volcano monitoring using GPS: developing data analysis strategies based on the June 2007 Kilauea Volcano intrusion and eruption. J. Geophys. Res. 115:B07406. doi: 10.1029/2009JB007022
Lisowski, M. (2007). “Analytical volcano deformation source models,” in Volcano Deformation: Geodetic Monitoring Techniques (Berlin; Heidelberg: Springer Berlin Heidelberg), 279–304.
Loughlin, S. C., Vye-Brown, C., Sparks, R. S. J., Brown, S. K., Barclay, J., Calder, E., et al. (2015). “An introduction to global volcanic hazard and risk,” in Global Volcanic Hazards and Risk, eds C. Vye-Brown, S. K. Brown, S. Sparks, S. C. Loughlin, and S. F. Jenkins. (Cambridge: Cambridge University Press), 1–80. doi: 10.1017/CBO9781316276273
Lundgren, P., Poland, M., Miklius, A., Orr, T., Yun, S., Fielding, E., et al. (2013). Evolution of dike opening during the March 2011 Kamoamoa fissure eruption, Kilauea Volcano, Hawai‘i. J. Geophys. Res. 118, 897–914. doi: 10.1002/jgrb.50108
McKee, C, Itikarai, I, and Davies, H. (2017). “Instrumental Volcano surveillance and community awareness in the lead-up to the 1994 eruptions at Rabaul, Papua New Guinea,” in Observing the Volcano World. Advances in Volcanology (An Official Book Series of the International Association of Volcanology and Chemistry of the Earth's Interior ? IAVCEI, Barcelona, Spain), eds C. J. Fearnley, D.K. Bird, K. Haynes, W. J. McGuire, and G. Jolly (Cham: Springer).
McKee, C., Mori, J., and Talai, B. (1989). “Microgravity changes and ground deformation at Rabaul Caldera, 1973–1985,” in Volcanic Hazards. IAVCEI Proceedings in Volcanology, Vol. 1, ed J. H. Latter (Berlin; Heidelberg: Springer), 399–428. doi: 10.1007/978-3-642-73759-6_24
McKee, C. O., Lowenstein, P. L., De Saint Ours, P., Talai, B., Itikarai, I., and Mori, J. J. (1984). Seismic and ground deformation crises at Rabaul Caldera: prelude to an eruption? Bull. Volcanol. 47, 397–411. doi: 10.1007/BF01961569
McNutt, S. R., Rymer, H., and Stix, J. (2000). “Synthesis of volcano monitoring,” in The Encyclopedia of Volcanoes, 1st Edn. ed H. Sigurdsson (San Diego, Ca: Academic Press), 1165–1184.
Meyer, F. J., McAlpin, D. B., Gong, W., Ajadi, O., Arko, S., Webley, P. W., et al. (2015). Integrating SAR and derived products into operational volcano monitoring and decision support systems. ISPRS J.Photogrammetry Remote Sens. 100, 106–117. doi: 10.1016/j.isprsjprs.2014.05.009
Miller, V., Bear-Crozier, A. N., Newey, V., Horspool, N., and Weber, R. (2016). Probabilistic Volcanic Ash Hazard Analysis (PVAHA) II: assessment of the Asia-Pacific region using VAPAH. J. Appl. Volcanol. 5:4. doi: 10.1186/s13617-016-0044-3
Mogi, K. (1958). Relations between the eruptions of various volcanoes and the deformations of the ground surfaces around them. Bull. Earthquake Res. Inst. Univ. Tokyo 36, 99–134.
Morishita, Y., Kobayashi, T., and Yarai, H. (2016). Three-dimensional deformation mapping of a dike intrusion event in Sakurajima in 2015 by exploiting the right- and left-looking ALOS-2 InSAR. Geophys. Res. Lett. 43, 4197–4204. doi: 10.1002/2016GL068293
Nairn, I. A., McKee, C. O., Talai, B., and Wood, C. P. (1995). Geology and eruptive history of the Rabaul Caldera area, Papua New Guinea. J. Volcanol. Geother. Res. 69, 255–284. doi: 10.1016/0377-0273(95)00035-6
Naranjo, J. L., Sigurdsson, H., Carey, S. N., and Fritz, W. (1986). Eruption of the Nevado del Ruiz Volcano, Colombia, On 13 November 1985: Tephra Fall and Lahars. Science 233, 961–963. doi: 10.1126/science.233.4767.961
NASA (2018). NASA-ISRO SAR (NISAR) Mission Science Users' Handbook, 1st Edn. Jet Propulsion Laboratory, California Institute of Technology).
Nikkhoo, M., Walter, T. R., Lundgren, P. R., and Prats-Iraola, P. (2017). Compound dislocation models (CDMs) for volcano deformation analyses. Geophys. J. Int. 208, 877–894. doi: 10.1093/gji/ggw427
Ofeigsson, B. G., Hooper, A., Sigmundsson, F., Sturkell, E., and Grapenthin, R. (2011). Deep magma storage at Hekla volcano, Iceland, revealed by InSAR time series analysis. J. Geophys. Res. 116:B05401. doi: 10.1029/2010JB007576
Okada, Y. (1985). Surface deformation due to shear and tensile faults in a half-space. Bull. Seismol. Soc. Am. 75, 1135–1154.
Pallister, J., and McNutt, S. R. (2015). “Chapter 66 - Synthesis of Volcano Monitoring,” in The Encyclopedia of Volcanoes, 2nd Edn. ed H. Sigurdsson (Amsterdam: Academic Press), 1151–1171. doi: 10.1016/B978-0-12-385938-9.00066-3
Parker, A. L., Biggs, J., and Lu, Z. (2016). Time-scale and mechanism of subsidence at Lassen Volcanic Center, CA, from InSAR. J. Volcanol. Geother. Res. 320, 117–127. doi: 10.1016/j.jvolgeores.2016.04.013
Parker, A. L., Biggs, J., Walters, R. J., Ebmeier, S. K., Wright, T. J., Teanby, N. A., et al. (2015). Systematic assessment of atmospheric uncertainties for InSAR data at volcanic arcs using large-scale atmospheric models: application to the Cascade volcanoes, United States. Remote Sens. Environ. 170, 102–114. doi: 10.1016/j.rse.2015.09.003
Parks, M., Sigmundsson, F., Sigurdsson, Ó., Hooper, A., and Hreinsdóttir, S., Ófeigsson, B., et al. (2018). Deformation due to geothermal exploitation at Reykjanes, Iceland. J. Volcanol. Geother. Res. doi: 10.1016/j.jvolgeores.2018.08.016
Parks, M. M., Heimisson, E. R., Sigmundsson, F., Hooper, A., and Vogfjörd, K. S., Árnadóttir, T., et al. (2017). Evolution of deformation and stress changes during the caldera collapse and dyking at Bárdarbunga, 2014–2015: Implication for triggering of seismicity at nearby Tungnafellsjökull volcano. Earth Planet. Sci. Lett. 462, 212–223. doi: 10.1016/j.epsl.2017.01.020
Parks, M. M., Moore, J. D. P., Papanikolaou, X., Biggs, J., Mather, T. A., Pyle, D. M., et al. (2015). From quiescence to unrest: 20 years of satellite geodetic measurements at Santorini volcano, Greece. J. Geophys. Res. 120, 1309–1328. doi: 10.1002/2014JB011540
Patia, H., Eggins, S. M., Arculus, R. J., McKee, C. O., Johnson, R. W., and Bradney, A. (2017). The 1994–2001 eruptive period at Rabaul, Papua New Guinea: petrological and geochemical evidence for basalt injections into a shallow dacite magma reservoir, and significant SO2 flux. J. Volcanol. Geother. Res. 345, 200–217. doi: 10.1016/j.jvolgeores.2017.08.011
Peltier, A., Froger, J.-L., Villeneuve, N., and Catry, T. (2017). Assessing the reliability and consistency of InSAR and GNSS data for retrieving 3D-displacement rapid changes, the example of the 2015 Piton de la Fournaise eruptions. J. Volcanol. Geother. Res. 344, 106–120. doi: 10.1016/j.jvolgeores.2017.03.027
Pepe, S., D'Auria, L., Castaldo, R., Casu, F., De Luca, C., De Novellis, V., et al. (2018). The Use of Massive Deformation Datasets for the Analysis of Spatial and Temporal Evolution of Mauna Loa Volcano (Hawai'i). Remote Sens. 10:968. doi: 10.3390/rs10060968
Phillipson, G., Sobradelo, R., and Gottsmann, J. (2013). Global volcanic unrest in the 21st century: An analysis of the first decade. J. Volcanol. Geother. Res. 264, 183–196. doi: 10.1016/j.jvolgeores.2013.08.004
Pritchard, M. E., Biggs, J., Wauthier, C., Sansosti, E., Arnold, D. W. D., Delgado, F., et al. (2018). Towards coordinated regional multi-satellite InSAR volcano observations: results from the Latin America pilot project. J. Appl. Volcanol. 7:5. doi: 10.1186/s13617-018-0074-0
Pritchard, M. E., and Simons, M. (2002). A satellite geodetic survey of large-scale deformation of volcanic centres in the central Andes. Nature 418:167. doi: 10.1038/nature00872
Ronchin, E., Masterlark, T., Dawson, J., Saunders, S., and Martì Molist, J. (2017). Imaging the complex geometry of a magma reservoir using FEM-based linear inverse modeling of InSAR data: application to Rabaul Caldera, Papua New Guinea. Geophys. J. Int. 209, 1746–1760. doi: 10.1093/gji/ggx119
Rosen, P. A., Hensley, S., Joughin, I. R., Li, F. K., Madsen, S. N., Rodriguez, E., et al. (2000). Synthetic aperture radar interferometry. Proc. IEEE 88, 333–382. doi: 10.1109/5.838084
Saunders, S. J. (2001). The shallow plumbing system of Rabaul caldera: a partially intruded ring fault? Bull. Volcanol. 63, 406–420. doi: 10.1007/s004450100159
Segall, P. (2010). Earthquake and Volcano Deformation. Princeton University Press. doi: 10.1515/9781400833856
Shimada, M., Tadono, T., and Rosenqvist, A. (2010). Advanced Land Observing Satellite (ALOS) and monitoring global environmental change. Proc. IEEE 98, 780–799. doi: 10.1109/JPROC.2009.2033724
Sigmundsson, F., Hooper, A., Hreinsdóttir, S., Vogfjörd, K. S., and Ófeigsson, B. G., Heimisson, E.R., et al. (2014). Segmented lateral dyke growth in a rifting event at Bárð*arbunga volcanic system, Iceland. Nature 517:191. doi: 10.1038/nature14111
Sigmundsson, F., Parks, M., Pedersen, R., Jónsdóttir, K., Ófeigsson, B. G., Grapenthin, R., et al. (2018). “Magma movements in volcanic plumbing systems and their associated ground deformation and seismic patterns,” in Volcanic and Igneous Plumbing Systems, eds S. Burchardt (Elsevier), 285–322. Available online at: http://www.sciencedirect.com/science/article/pii/B978012809749600011X
Simons, M., Fialko, Y., and Rivera, L. (2002). Coseismic Deformation from the 1999 Mw 7.1 Hector Mine, California, earthquake as inferred from InSAR and GPS observations. Bull. Seismol. Soc. Am. 92, 1390–1402. doi: 10.1785/0120000933
Small, C., and Naumann, T. (2001). The global distribution of human population and recent volcanism. Glob. Environ. Change Part B 3, 93–109. doi: 10.1016/S1464-2867(02)00002-5
Spaans, K., and Hooper, A. (2016). InSAR processing for volcano monitoring and other near-real time applications. J. Geophys. Res. 121, 2947–2960. doi: 10.1002/2015JB012752
Stevens, N. F., and Wadge, G. (2004). Towards operational repeat-pass SAR interferometry at active volcanoes. Nat. Hazards 33, 47–76. doi: 10.1023/B:NHAZ.0000035005.45346.2b
Sudhaus, H., and Jónsson, S. (2009). Improved source modelling through combined use of InSAR and GPS under consideration of correlated data errors: application to the June 2000 Kleifarvatn earthquake, Iceland. Geophys. J. Int. 176, 389–404. doi: 10.1111/j.1365-246X.2008.03989.x
Temtime, T., Biggs, J., Lewi, E., Hamling, I., Wright, T., and Ayele, A. (2018). Spatial and temporal patterns of deformation at the Tendaho geothermal prospect, Ethiopia. J. Volcanol. Geother. Res. 357, 56–67. doi: 10.1016/j.jvolgeores.2018.04.004
Thompson, G. (2015). “Seismic monitoring of volcanoes,” in Encyclopedia of Earthquake Engineering, eds M. Beer, I. A. Kougioumtzoglou, E. Patelli, and S.-K. Au. (Berlin; Heidelberg: Springer Berlin Heidelberg), 2896–2920.
Tibaldi, A. (2015). Structure of volcano plumbing systems: a review of multi-parametric effects. J. Volcanol. Geother. Res. 298, 85–135. doi: 10.1016/j.jvolgeores.2015.03.023
Wegmüller, U., and Werner, C. (1997). “GAMMA SAR processor and interferometry software,” in 3rd ERS Scientific Symposium (Florence: European Space Agency).
Wicks, C., Thatcher, W., and Dzurisin, D. (1998). Migration of fluids beneath yellowstone caldera inferred from satellite radar interferometry. Science 282, 458–462. doi: 10.1126/science.282.5388.458
Winson, A. E. G., Costa, F., Newhall, C. G., and Woo, G. (2014). An analysis of the issuance of volcanic alert levels during volcanic crises. J. Appl. Volcanol. 3:14. doi: 10.1186/s13617-014-0014-6
Yang, X.-M., Davis, P. M., and Dieterich, J. H. (1988). Deformation from inflation of a dipping finite prolate spheroid in an elastic half-space as a model for volcanic stressing. J. Geophys. Res. 93, 4249–4257. doi: 10.1029/JB093iB05p04249
Keywords: operational monitoring, volcano deformation, InSAR, low- and middle-income countries, Rabaul Caldera, remote sensing, volcanic unrest, GNSS
Citation: Garthwaite MC, Miller VL, Saunders S, Parks MM, Hu G and Parker AL (2019) A Simplified Approach to Operational InSAR Monitoring of Volcano Deformation in Low- and Middle-Income Countries: Case Study of Rabaul Caldera, Papua New Guinea. Front. Earth Sci. 6:240. doi: 10.3389/feart.2018.00240
Received: 28 September 2018; Accepted: 11 December 2018;
Published: 24 January 2019.
Edited by:
Federico Di Traglia, Università degli Studi di Firenze, ItalyReviewed by:
Alessandro Tibaldi, Università degli studi di Milano Bicocca, ItalyMatt Pritchard, Cornell University, United States
Copyright © 2019 Garthwaite, Miller, Saunders, Parks, Hu and Parker. This is an open-access article distributed under the terms of the Creative Commons Attribution License (CC BY). The use, distribution or reproduction in other forums is permitted, provided the original author(s) and the copyright owner(s) are credited and that the original publication in this journal is cited, in accordance with accepted academic practice. No use, distribution or reproduction is permitted which does not comply with these terms.
*Correspondence: Matthew C. Garthwaite, TWF0dC5HYXJ0aHdhaXRlQGdhLmdvdi5hdQ==