 Sujan Pal
 Hsin-I Chang
 Christopher L. Castro
 Francina Dominguez
- 1Department of Atmospheric Sciences, University of Illinois at Urbana–Champaign, Urbana, IL, United States
- 2Department of Hydrology and Atmospheric Sciences, The University of Arizona, Tucson, AZ, United States
Sub-seasonal to seasonal (S2S) forecasts are critical for planning and management decisions in multiple sectors. This study shows results from dynamical downscaling using a regional climate model at a convection-permitting scale driven by boundary conditions from the global reanalysis of the Climate Forecast System Model (CFSR). Convection-permitting modeling (CPM) enhances the representation of regional climate by better resolving the regional forcings and processes, associated with topography and land cover, in response to variability in the large-scale atmospheric circulation. We performed dynamically downscaled simulations with the Weather Research and Forecasting (WRF) model over the Upper and Lower Colorado basin at 12 km and 3 km grid spacing from 2000 to 2010 to investigate the potential of dynamical downscaling to improved the modeled representation of precipitation the Southwestern United States. Employing a convection-permitting nested domain of 3 km resolution significantly reduces the bias in mean (∼2 mm/day) and extreme (∼4 mm/day) summer precipitation when compared to coarser domain of 12 km resolution and coarse resolution CFSR products. The convection-permitting modeling product also better represents eastward propagation of organized convection due to mesoscale convective systems at a sub-daily scale, which largely account for extreme summer rainfall during the North American monsoon. In the cool season both coarse and high-resolution simulations perform well with limited bias of ∼1 mm/day for the mean and ∼2 mm/day for the extreme precipitation. Significant correlation was found (∼0.85 for summer and ∼0.65 for winter) for both coarse and high-resolution model with observed regionally and seasonally averaged precipitation. Our findings suggest that the use of CPM is necessary in a dynamical modeling system for S2S prediction in this region, especially during the warm season when precipitation is mostly convectively driven.
Introduction
Long-term decision making in applications like agriculture and water resources requires accurate seasonal forecast information on regional and local scales. The need for improved seasonal forecasting during the warm season (June to September) in the United States is particularly urgent. During this time of year, “billion-dollar disaster events” as defined in the National Centers for Environmental Information database, caused by severe weather, heat waves and drought, wildfire, and flooding are likely to become more extreme in an anthropogenically driven warming global climate (Meehl et al., 2000; Min et al., 2011). Changes in global precipitation in recent observational records generally validate the hypothesis “wet gets wetter, dry gets drier” (Hsu et al., 2011; Wang et al., 2012; Chang et al., 2015). The idea basically suggests increasing precipitation when it is climatologically preferred to occur (e.g., near-equatorial regions) and decreasing it where it is not (e.g., subtropical land areas). An increase in atmospheric blocking has also been observed in recent decades (Croci-Maspoli et al., 2007), leading to increased and more persistent extreme events in the mid-latitudes (Francis and Vavrus, 2012; Screen et al., 2013). In this respect, warm season climate appears to become more extreme in conjunction with large-scale atmospheric circulation (or teleconnection) patterns that are the primary drivers of continental-scale variations in wet and dry conditions on seasonal timescales (Coumou et al., 2014; Chang et al., 2015). Convectively driven weather events in the United States have become more extreme in the last 30 years, as well as worldwide (Meehl et al., 2000; Min et al., 2011; Ban et al., 2015) accounted for in large part by increases in the intensity of organized convective events, such as mesoscale convective systems (e.g., Luong et al., 2017). Predicting such events and assessing their seasonal impact in the near future therefore remains a challenge.
For the Colorado River Basin, one of the principal water resources for the Western United States, precipitation is mainly from winter storms (mid-latitude cyclones), that build snowpack, and thunderstorms that occur during the North American monsoon, with the former being relatively more important from the water resource perspective. Warm season high-impact convective events in the Southwestern United States are often linked to the North American monsoon (NAM) and are related to enhanced atmospheric instability and moisture (Holloway and Neelin, 2009; Trenberth, 2011; Feng et al., 2016; Luong et al., 2017). Winter snowpack develops mainly from winter storms with enhanced precipitation due to orographic forcing and the individual storm tracks. Extreme precipitation events in the cool season are caused by winter storms moving inland from a quasi-stationary trough, formed off the California coast (Sheppard et al., 2002). To capture convective events in a numerical model, especially over the complex terrain of the Colorado River basin, the model needs to have sufficient spatial and temporal resolution. More succinctly, the model needs to represent monsoon convective thunderstorms as well as orographically forced precipitation, and literature has clearly established the requirement for an enhanced resolution to add value for both (e.g., Luong et al., 2017). Existing coarse resolution S2S global forecast models lack this capability.
Modes of climate variability influence the deterministic seasonal forecasting of the large-scale atmospheric circulation over North America within the North American multi-model ensemble (NMME) models, which are used for S2S forecasting in the United States. For example, dominant modes of sea surface temperature variability (ENSO and AMO) influence the positioning and intensity of NAM ridge. The NAM is also influenced by circumglobal teleconnection (CGT), may be driven by both ENSO and Indian Summer Monsoon convection (Ding and Wang, 2005; Ciancarelli et al., 2013). However, downscaling from these models is necessary to explicitly represent the mesoscale processes like convective precipitation and thunderstorms. The “Multi-RCM Downscaling of Global Seasonal Forecasts (MRED)” project used multiple regional models to test the usefulness of downscaling a global seasonal forecast model. This community modeling effort downscaled December–April reforecasts from the NOAA climate forecast system (CFS) version 1 model, over a coterminous United States domain with 32 km grid spacing for a period of 23 years. Each regional model dynamically downscaled each member of a 10-member CFS ensemble every winter during the reforecast period 1982–2004. The MRED project showed that even when using a relatively coarse meso-β gird spacing of 32 km, dynamical downscaling can add skill to a global S2S model forecast (Shukla et al., 2013). The largest improvements in forecast precipitation were obtained in regions where the global models already demonstrated some skill (Feser et al., 2011). However, regional models with resolution at the meso-β scale or coarser are deficient in explicitly representing monsoon thunderstorms and have other limitations (Tripathi and Dominguez, 2013, TD13 hereafter). Furthermore, Kirtman et al. (2014) found that in comparison to the cool season, the level of skill in warm season seasonal forecasts of precipitation produced by the NMME is much lower, potentially due to the poor climatological representation of warm season convective precipitation. For example, the North American monsoon is not captured as a salient feature in the CFSv1 global seasonal forecast model (Castro et al., 2012; Yang et al., 2012). A necessary requirement for useful S2S prediction is therefore simultaneous skillful forecasting of the large-scale circulation anomaly along with its regional response in temperature and precipitation, especially the latter, where it is modulated primarily by regional forcings like topography or land cover (Leung et al., 2003a,b; Leung and Gao, 2016).
Convection parameterization schemes used in coarse resolution models (meso-β scale or larger, grid spacing > 10s of km) are a major source of errors and uncertainty in forecasting of precipitation (Wang and Seaman, 1997; Prein et al., 2015), both spatially and temporally. Convection-permitting regional climate models (CPM, meso-γ scale grid spacing < 4 km) provide a framework to generate more realistic regional scale hydro-climate information. CPMs add value in the representation of the winter precipitation, in complex terrain as well as monsoon thunderstorms in summer (Weusthoff et al., 2010; Fosser et al., 2015; Prein et al., 2015; Kendon, 2016). CPMs no longer rely on convection parameterization schemes and are able to explicitly resolve deep convection and associated precipitation. CPMs also offer the opportunity to improve the representation of orography and variations of surface fields at a high resolution. This can be especially advantageous in mountainous regions as well as domains with heterogeneous land surfaces (Prein et al., 2013a,b; Trusilova et al., 2013). In the Southwestern United States, warm season precipitation is linked to convective activity during NAM, consisting of intense precipitation events of relative short duration (i.e., on the order of 10 s of minutes to about an hour). NAM onset is modulated by sea surface temperature variability and atmospheric teleconnections, together with moisture supplied by nearby maritime sources (Adams and Comrie, 1997; Castro et al., 2012). In addition, complex terrain enhances the diurnal cycle of convection (Nesbitt et al., 2008). In short, convection during the monsoon is the result of an interaction between large-scale atmospheric circulation features and regional topographic variations. Small-scale local topography therefore plays an important role in the convection initiation, followed by upscale growth, which is extremely localized. For given environmental conditions, Eidhammer et al. (2018) found the drying ratio1 to be highly connected with the upwind slope for wide mountain ranges and on both the slope and width for narrow ranges. Thus there is ample motivation to apply CPM-type simulation over complex topographic regions of Colorado River basin, where model resolution has multiple fold effects on the simulation.
The effectiveness of CPM in seasonal forecasting has been discussed in Leung and Gao (2016), however only 2 years of simulations were performed. More recently, the value of CPM has been explored, particularly over Europe (Prein et al., 2015). Besides resolving the complex terrain, which is a key factor resulting in improved simulation skill in those regions, explicit simulation of convection also plays a significant role, leading to improvements in simulating diurnal precipitation and extreme rainfall. S2S forecasting in a climate simulation (>10 years) is yet to be tested over the Southwestern United States. In a recent study, Liu et al. (2017) performed two 13-year simulations over North America, with a 4-km grid spacing. They found that in general their long-term CPM simulation yielded satisfactory performance capturing the annual and S2S precipitation in the United States. It was one of the first applications of CPM in Southwestern United States where long-term climate simulations are concerned. However, they did not quantify the improvement in extreme precipitation representation and skill on the inter-annual time scale by CPM. In the other highly practiced method of downscaling, statistical downscaling, accuracy of representation of the mean is much higher than variability and extremes (Salvi et al., 2015). It can have high certainty in the total precipitation amount that the method represents. However, the seasonal variations and extremes of the statistically downscaled precipitation are not trustworthy, especially in the regions of complex topography. Regional CPM for ensemble forecasting, now computationally feasible, attempts to investigate the value added by CPM in S2S forecasting in terms of seasonal mean, extremes, diurnal movement of precipitation and inter-annual variability. The analysis of the products downscaled from the CFS atmospheric reanalysis and knowing the value added, can establish the potential for improved S2S forecasting by downscaling forecast products from the suite of existing global S2S models, for example available from the NMME within the United States.
Data and Methodology
Modeling Tool for Convective Extremes in the Colorado River Basin
A continuous convection-permitting model simulation was performed using the Weather Research and Forecasting model (WRF, version 3.5.1, Skamarock et al., 2008), by dynamically downscaling the CFSR from 2000 to 2010. The three nested WRF model domains are shown in Figure 1, where the outermost domain covers the Southwestern United States at 12 km resolution (WRFD1, 30-45 N, 121-103 W). Two inner domains are both at convection-permitting 3 km resolution: the upper Colorado basin (UCB, 35-43N, 113-105 W) and the lower Colorado Basin (LCB, 31-38 N, 118-105 W). The convection-permitting modeling (CPM) paradigm, when applied in a climate simulation, has the advantage of more robustly representing the statistical characteristics of precipitation means and extremes. The CFSR reanalysis is used as model initial and boundary forcing. Spectral nudging is used to constrain WRF with respect to the large scale atmospheric state, while allowing formation of regional scale features within the WRF simulation (von Storch et al., 2000; Castro et al., 2005; Miguez-Macho et al., 2005; Rockel et al., 2008; Chang et al., 2015). Spectral nudging in regional climate modeling adds value in warm season convective numerical simulations (Castro et al., 2012; Liu et al., 2017). The nudging is applied only at the largest scales throughout the entire domain at the upper levels of atmosphere for prognostic fields such as 500 mb geopotential height, U-wind, V-wind, and temperature. Specific model physical configurations are shown in Table 1. The physical parameterizations are consistent with the numerical weather prediction (NWP) type simulations at the University of Arizona Hydrology and Atmospheric Sciences (UA-HAS). The UA-HAS WRF configuration is widely used in operational forecasting and weather- and climate-type research projects, and it is ideal for simulating warm season convective events over the complex terrain of the Southwestern United States (Castro et al., 2012; Raman et al., 2014; Chang et al., 2015; Luong et al., 2017). The K-F scheme has five components including the trigger, updraft, downdraft, compensating circulation, and closure functions. The trigger may enhance the temperature of the air parcel due to local perturbations and is a function of horizontal resolution. In this study, the KF scheme was called at 5 min intervals during the WRF integration, consistent with its application in the other studies (Dudhia, 2012; Alsarraf and Broeke, 2015). In addition, the amount of temperature increment is higher for higher resolutions – which may also cause surplus precipitation (TD13). The UCB domain set up is roughly equivalent to the Colorado headwaters domain while domain configuration of LCB (Figure 1A) is consistent with that used in the WRF UA-HAS operational forecasting model (Figure 1). Figure 1B illustrates the complex topography of the domain. June-September (JJAS) is considered as the warm season, because when S2S forecast is considered, the model can be initiated in May and the simulation executed until September. Similarly, the cool season is defined as November to April, when most of the snowpack forms.
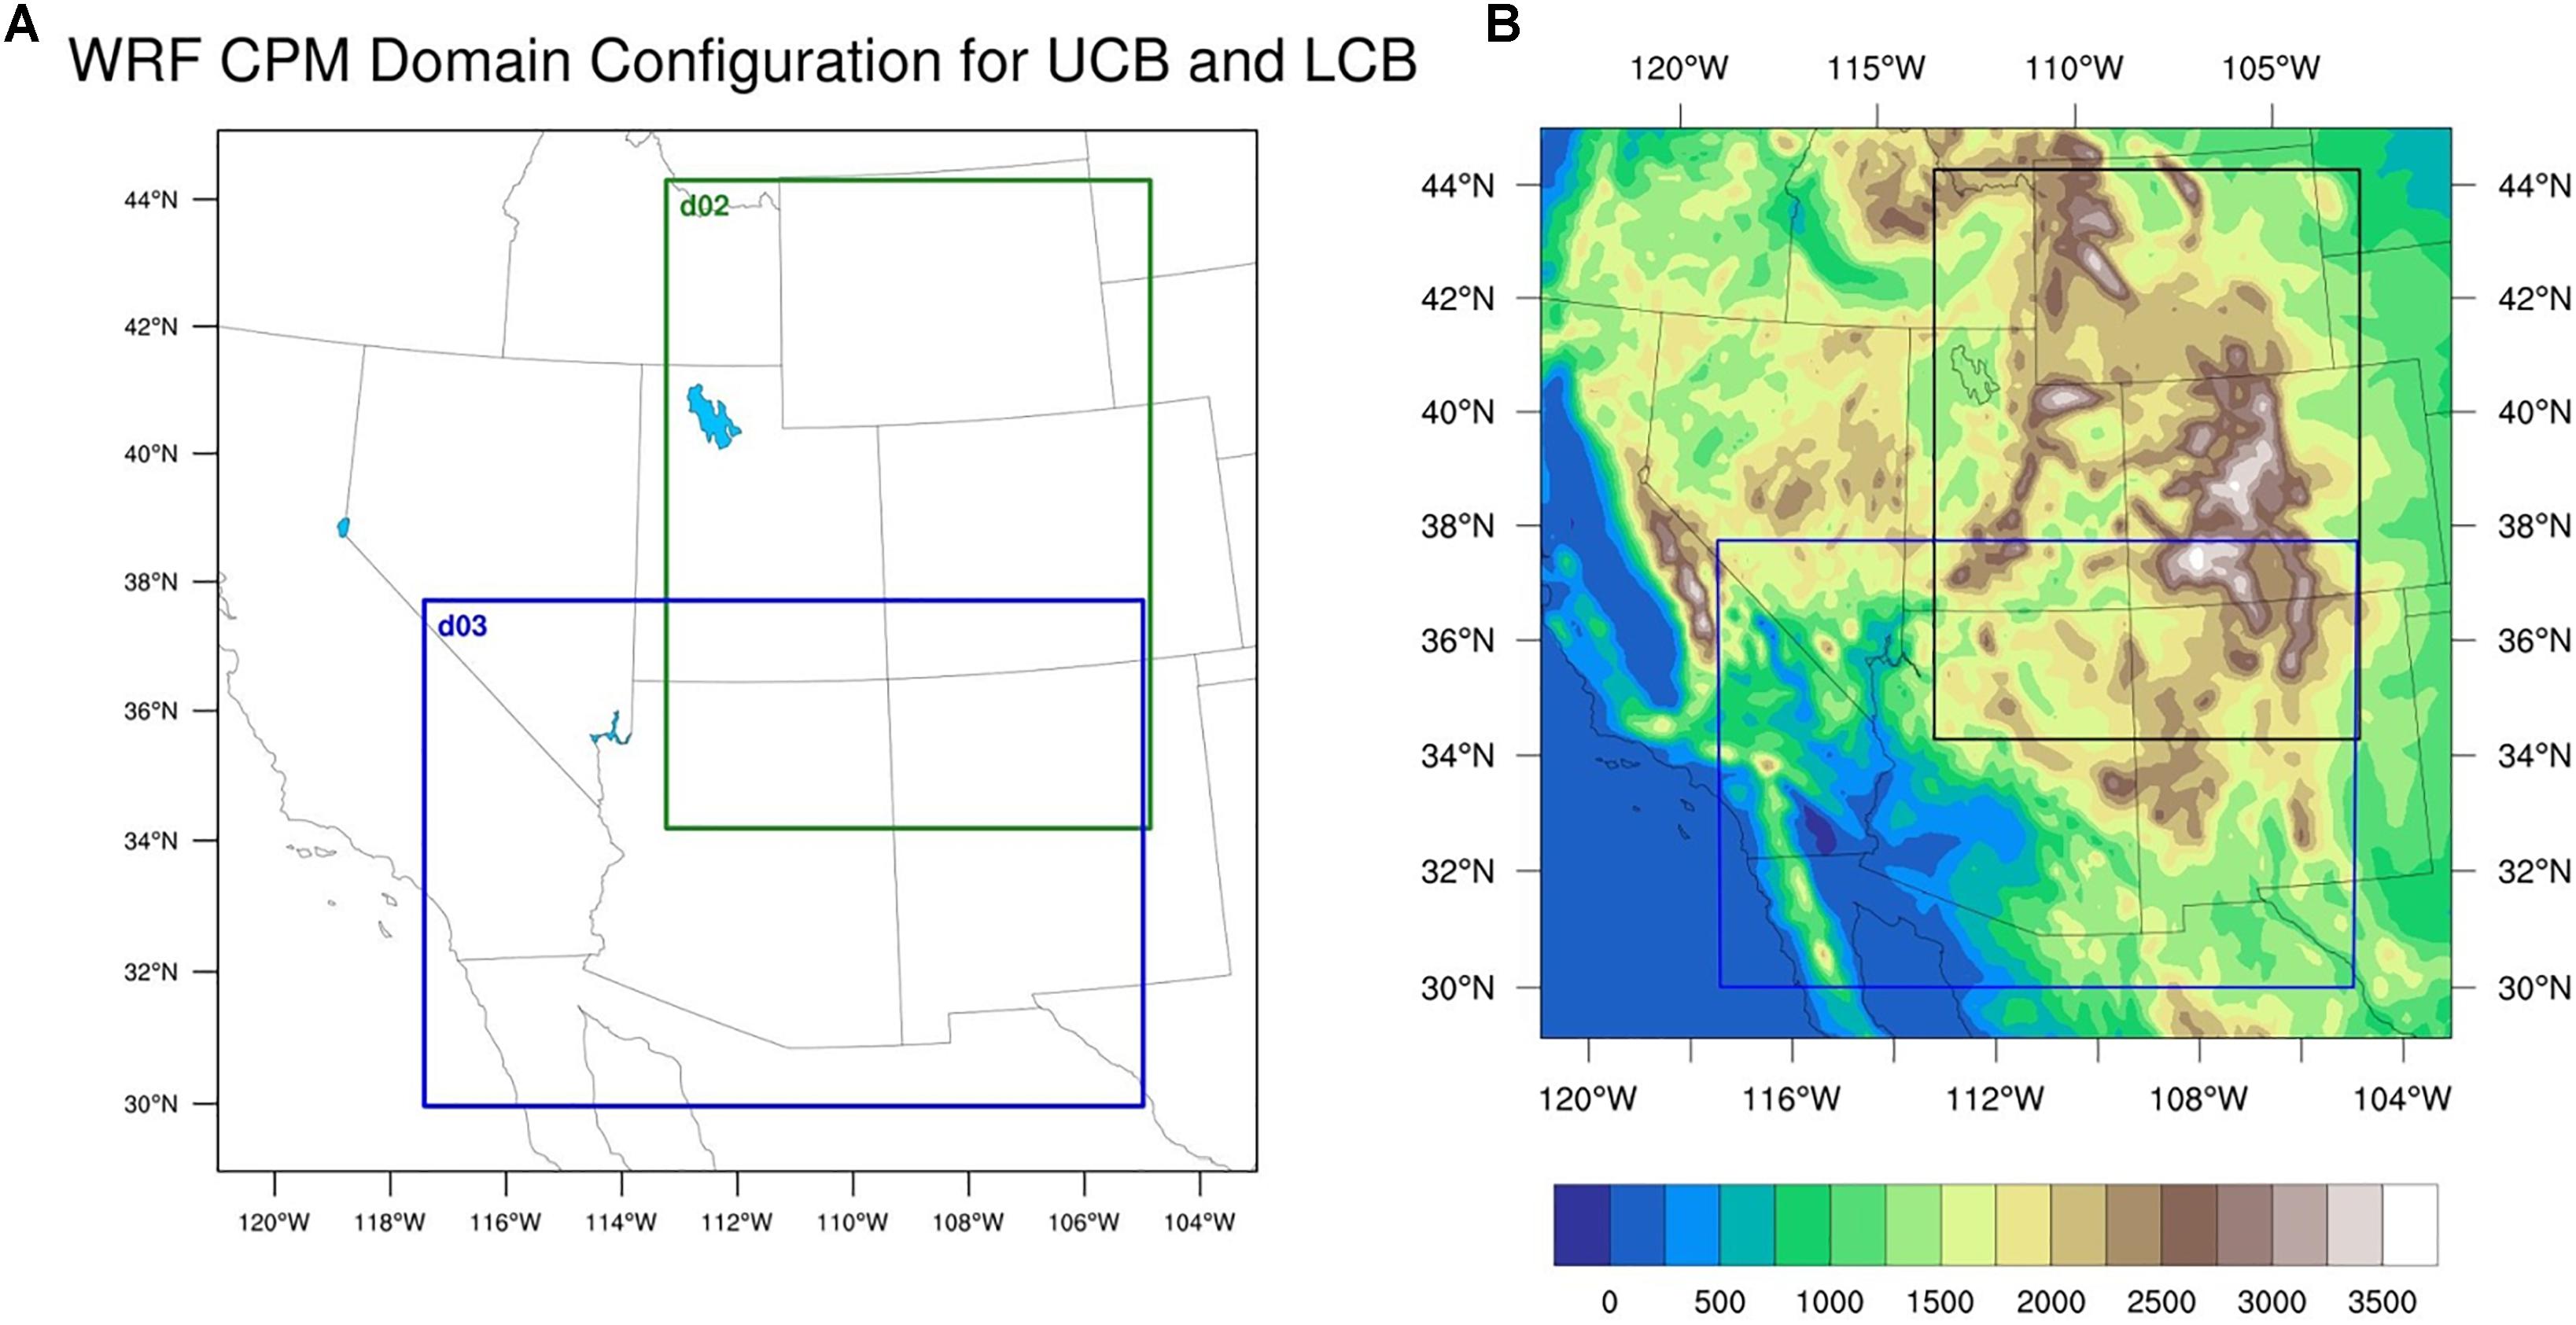
Figure 1. (A) The WRF-ARW nested domain configuration showing positions of CPM domains (UCB as d02 and LCB as d03) with 3 km resolution within the larger 12 km coarse resolution domain (WRFD1). (B) The complex topography (terrain height in meters) inside the domains. Black and blue boxes show the two convection permitting domains.
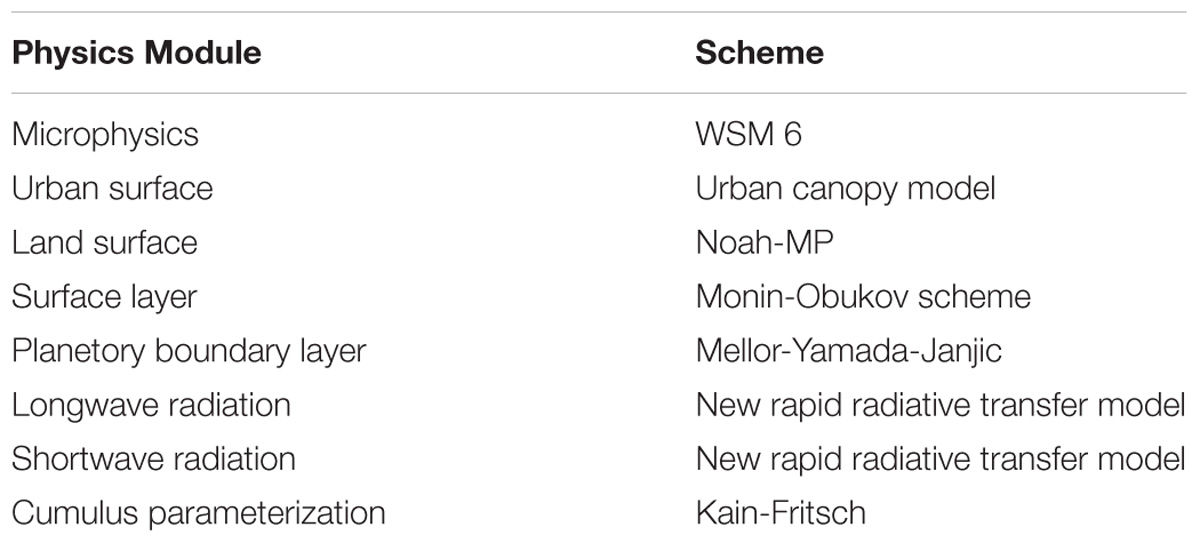
Table 1. NWP-type simulations parameterization for WRF-ARW.
Model Climatology Validation – Gridded Observation Products
Several gridded observation products are used to validate the numerically generated climatology for both outer and nested domains. One critical criterion, when identifying observational records for model validation, is to have sufficient temporal and spatial resolution to represent convective extremes. Gridded daily temperature data was obtained from the National Land Data Assimilation System (NLDAS). The resolution of NLDAS is 0.125 × 0.125° and is available for the whole simulation period from 2000 to 2010. Sources of gridded daily precipitation data are available within the contiguous United States include the Parameter-elevation Regressions on Independent slopes model (PRISM) data (Daly et al., 2005) at one-sixteenth degree resolution. PRISM represents climate observations at high-resolution, obtained from a comprehensive monitoring network to depict short- and long-term climate patterns. Point observations of precipitation measurements, the digital elevation model (DEM) and other spatial datasets are utilized to generate this high-resolution gridded estimate of annual, monthly and event based climatic parameters (Daly et al., 1994). PRISM data is also available for the whole simulation period from 2000 to 2010. These temperature and precipitation data sets were used to validate accuracy of the model results at different domain sizes and grid spacings.
National Center for Environmental Prediction (NCEP) Stage-IV 4-km gridded precipitation (Lin and Mitchell, 2005) was also used (2002–2010) to verify the diurnal cycle of precipitation climatology, over the study domains. The data is available hourly and therefore, suitable for analysis of precipitation at a sub-daily scale. In addition, use of Stage-IV allowed us to compare the model results with a completely different dataset and make interpretations that are more robust. Despite known errors in the NCEP Stage-IV precipitation dataset, such as beam blockage and limited gauge measurement sites (Minjarez-Sosa et al., 2012; Adams et al., 2014), this data consists of radar and gauge measurements that are quality controlled (Lin and Mitchell, 2005).
Statistical Methodology for Skill, Reliability, and Uncertainty Assessment
The performance of WRFD1 forecasting and the CPM downscaled seasonal precipitations (for UCB and LCB) were assessed over the period between 2000 and 2010. 4-month warm season precipitation was evaluated from June to September, corresponding to the period of monsoon-related precipitation inclusive of Monsoon onset. The cool season spanned from November to April, a standard period to evaluate winter precipitation used by the United States Bureau of Reclamation for the Colorado River basin. Mean and extreme precipitation climatology evaluations were performed following the “spatio-temporally averaged framework” for both the simulation at coarse (12 km) and high (3 km) resolution. Precipitation was seasonally averaged over the two regions of interest (UCB and LCB) for all simulation years. This type of framework has been previously used in literature (Salvi et al., 2017) for assessment of model predictions. Warm and cool season (JJAS and November-April, respectively) seasonal averages were calculated for each year. This method can serve as a direct estimate on the skill of the models for each season in different years. The potential skill and biases of the models were assessed following the metrics proposed by Murphy and Winkler (1992). The metrics are listed in Table 2. Metric ρfx is the correlation coefficient between the model simulations and observations; σf and σx are the standard deviations; μf and μx are the mean of the forecast and observations, respectively. The higher the correlation and the lower the biases, the better the model skill and reliability. Potential skill (PS) defines the model skill without any bias, slope reliability (SR) represents a measure of conditional bias, and standardized error (SE) represents a measure of conditional bias following Salvi et al. (2017). A perfect model will have values PS = 1 and SR = SE = 0. Admittedly, the work presented herein represents only one possible solution to assess credibility of CPM. We acknowledge that an ensemble-based approach would be the most desirable to determine the robustness. Uncertainty related to the precipitation simulation is determined by a bootstrap resampling (to create a synthetic set of simulation data) and a confidence interval around the mean precipitation value, using a total of 1000 samples. This non-parametric resampling-based approach allowed us to quantify the uncertainty of a non-normal distribution like precipitation (Zobel et al., 2017). A 95% bootstrap confidence interval was used as an uncertainty bound in the model. Inter annual variability of the yearly precipitation was assessed in terms of standard deviation, calculated over the simulation years.
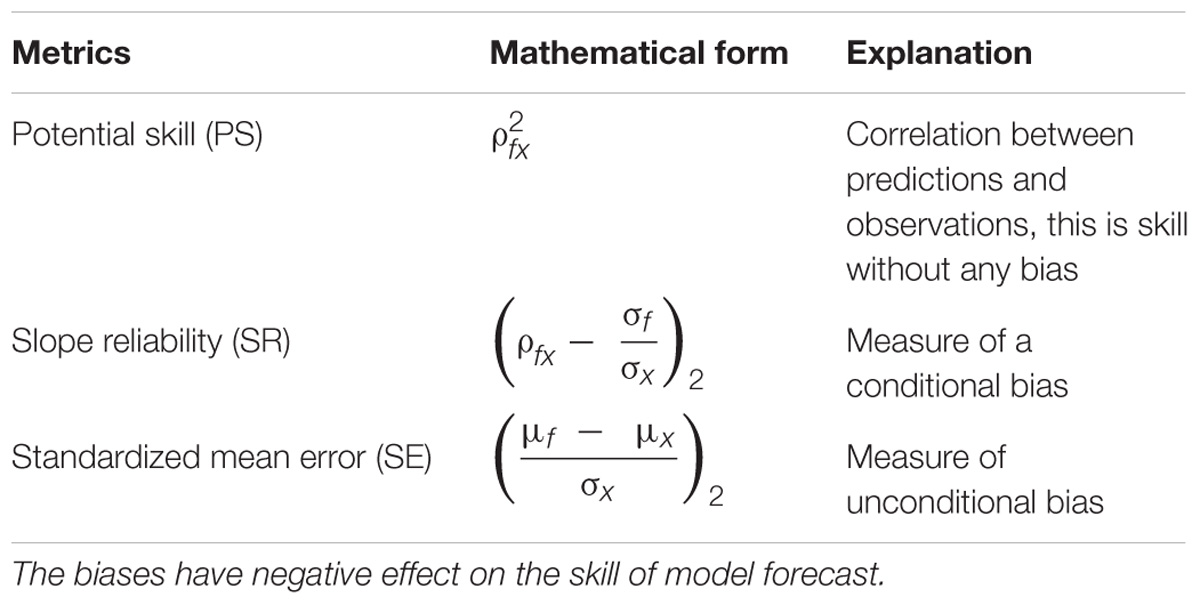
Table 2. Representation of different skill and bias metrics used in the regionally and seasonally (UCB and LCB for warm and cool season) averaged framework.
Results
RCM Validation: Warm and Cool Season Temperature
RCM-generated 2 m air temperature was compared with North American Land Data Assimilation System (NLDAS) (Mitchell et al., 2004) with respect to mean and extreme temperature climatology. The JJAS mean temperature from the observed NLDAS data is shown in Figure 2A. Considering the equivalent plot from the dynamically downscaled reanalysis (Figure 2B) a slight warm bias (1–2°C) is seen over most of the domain (Figure 2C). The bias is stronger when extreme temperature (95th Percentile) is considered (Figures 2D–F). This warm bias of WRF is consistent with previous studies (TD13; Liu et al., 2017) and is attributed to the use of Exner function while interpolating potential temperature to the WRF grids from the grids of a different dataset to generate the initial condition (Wee et al., 2012). During the cool season, a similar warm bias of 1–2°C was found in mean temperatures, although the spatial representation was good as expected (Figures 3A–C). However, extremely cold days have a negative temperature bias in the RCM (Figures 3D–F), also a well-documented problem with WRF as it produces unreasonably cold near-surface temperature over snow (Mass and Ovens, 2013; Wyszogrodzki et al., 2013). This problem is related to snow coverage, as November to April are the months when most of the snowpack in this region forms. The bias is not reflected in the mean winter temperature, as this error is apparent in daytime temperature and not at night. RCM simulations perform similarly with WRFD1 simulation in terms of simulating temperature. In the warm season (Supplementary Figure S1), a comparable warm bias is present in WRD1 and CPM simulations. The bias in extremely warm days is slightly higher than that of the mean. In the cool season (Supplementary Figure S2), some of the cold bias present on extremely cold days is eliminated with the application of CPM. Where the performance is quite akin in terms of representing seasonal mean, value added can be interpreted in terms of a higher resolution product obtained from the CPM simulation. The analogous bias in CFSR data is higher than WRF simulations in both the seasons (Figure 4). The regional climate model product is therefore superior to original CFSR data, in terms of its lower bias in the mean and extremes, as well as a higher spatial resolution. Overall, we showed that the RCM configuration used here produced realistic representation of seasonal temperature, satisfying the broad objective of this study. Next, we will emphasize on improvements in precipitation from CPM.
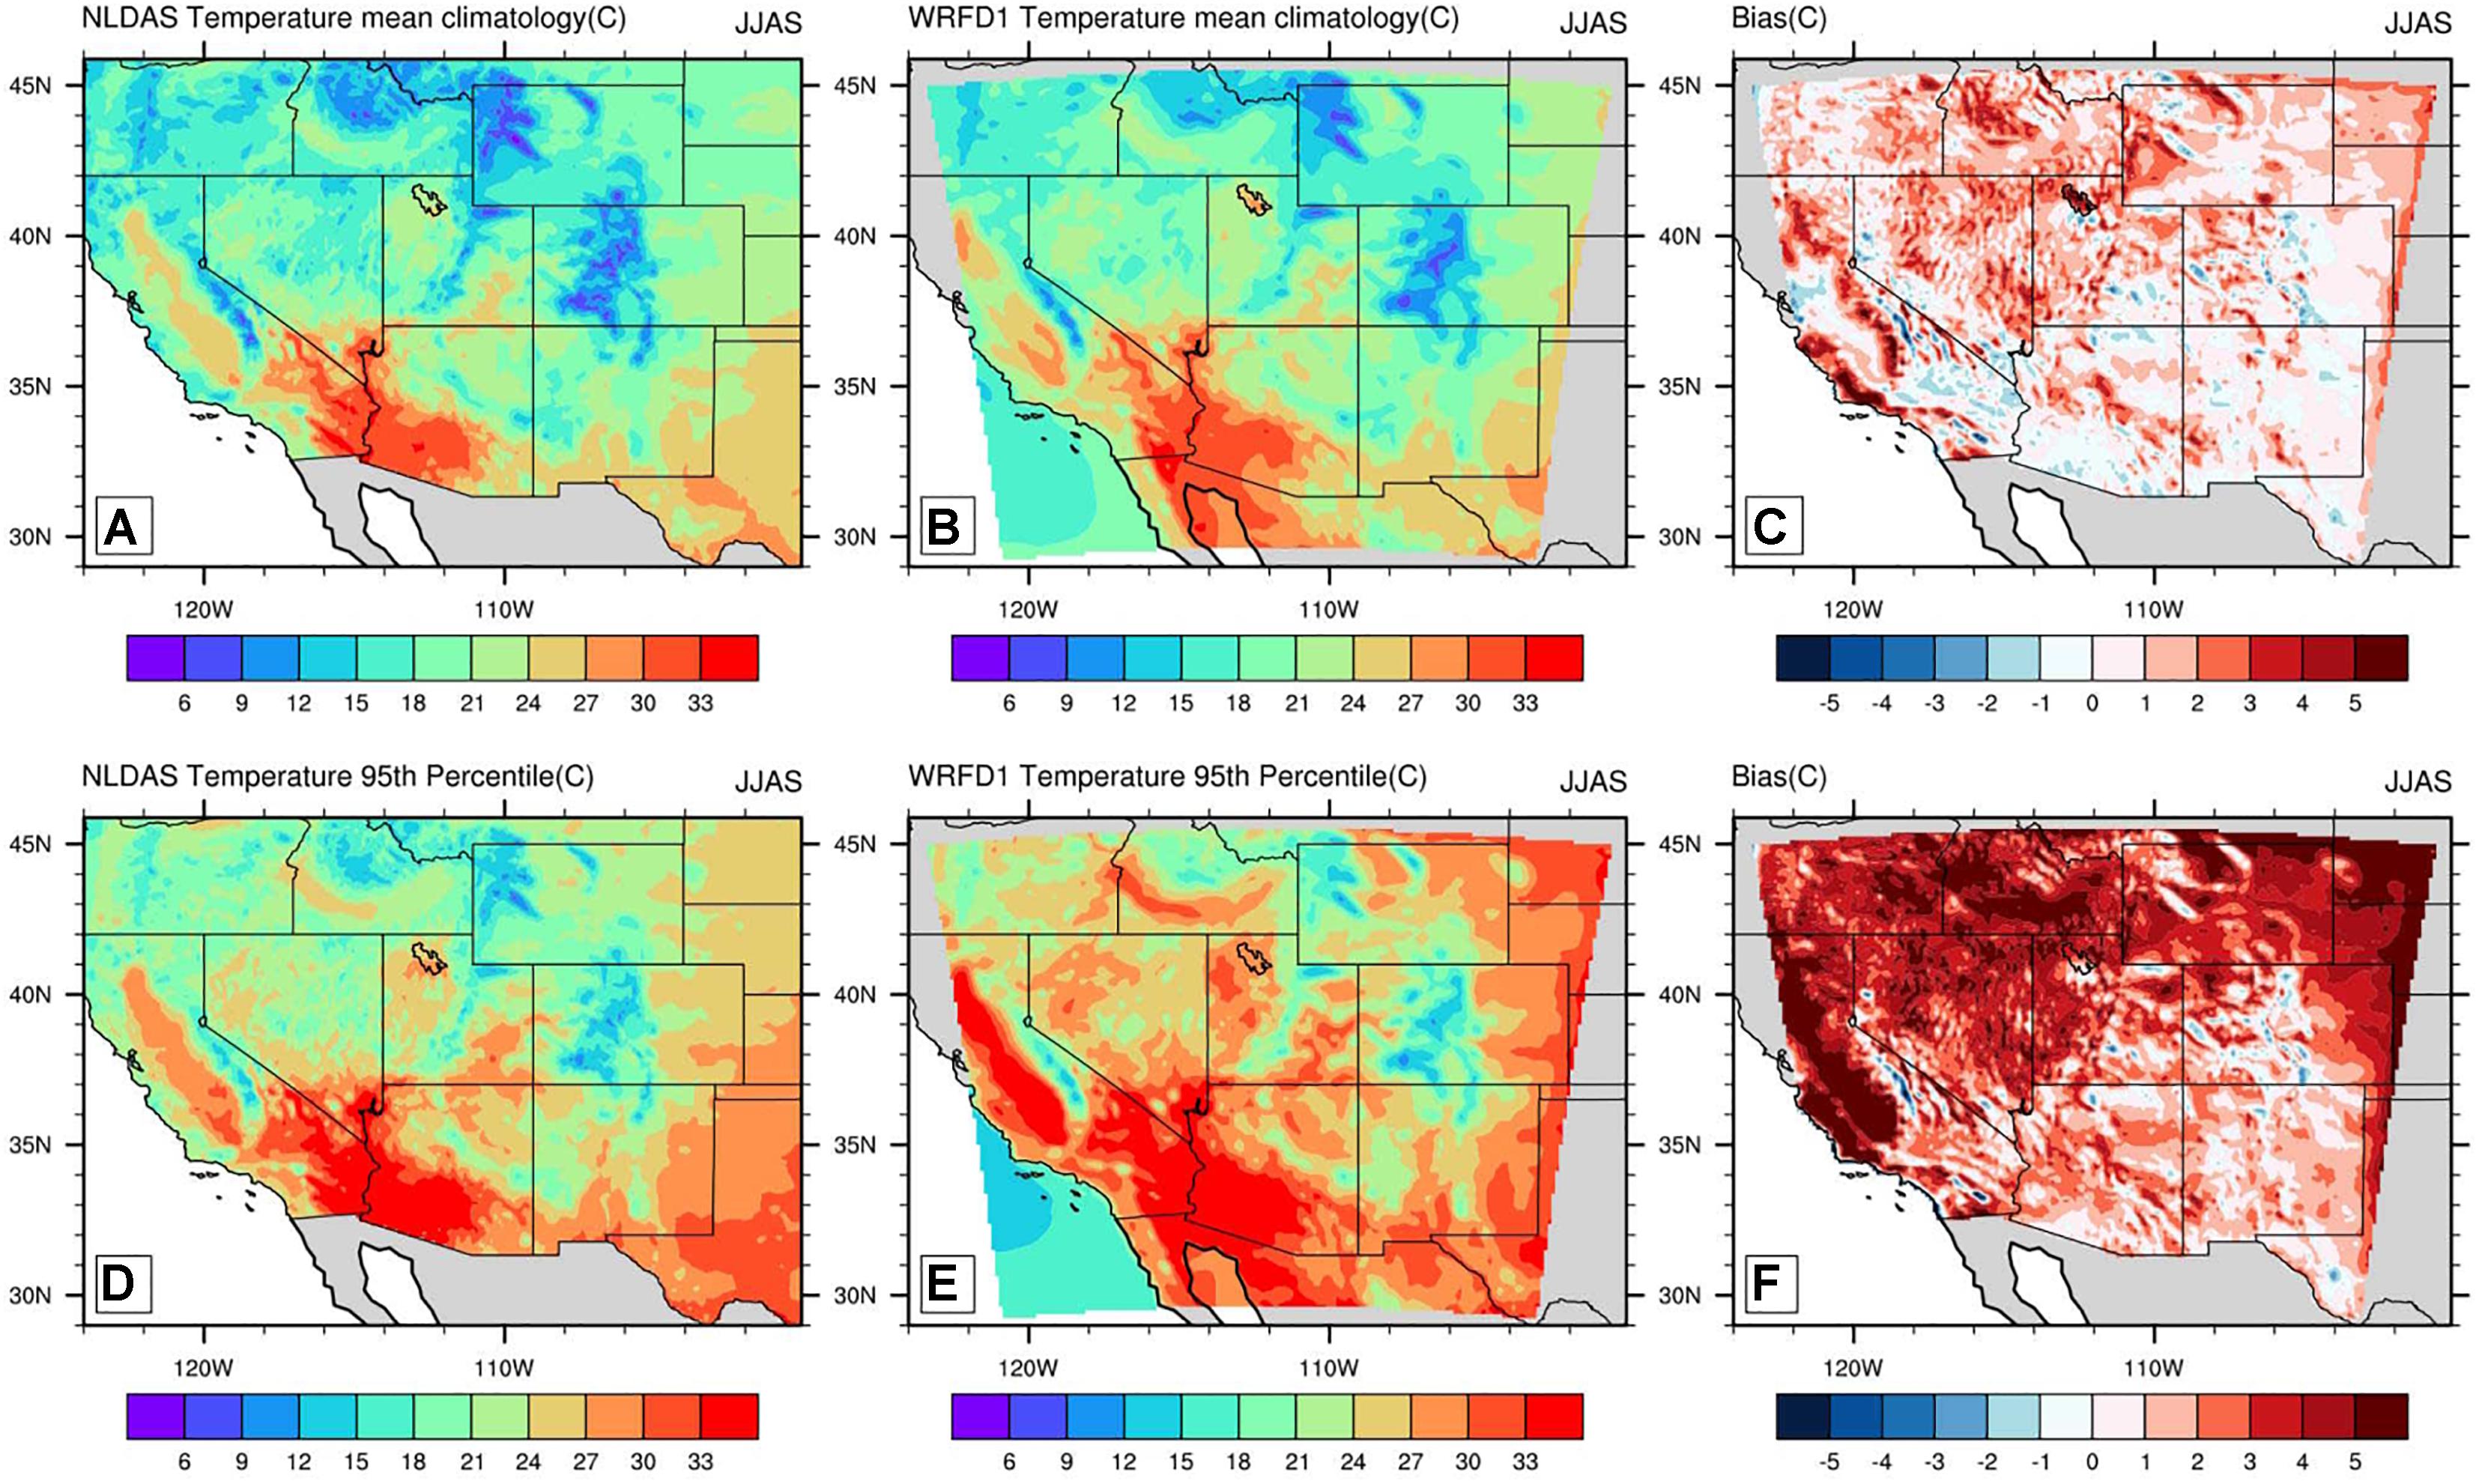
Figure 2. Mean climatology and 95th percentile of warm season (JJAS) temperature for 2000–2010 as represented by NLDAS (A,D) and CFSR-WRFD1 (B,E). WRFD1 model bias (model - observation) in warm season mean temperature is plotted in (C) and bias in extreme temperature is plotted in (F). Bias is higher in magnitude for extreme temperature.
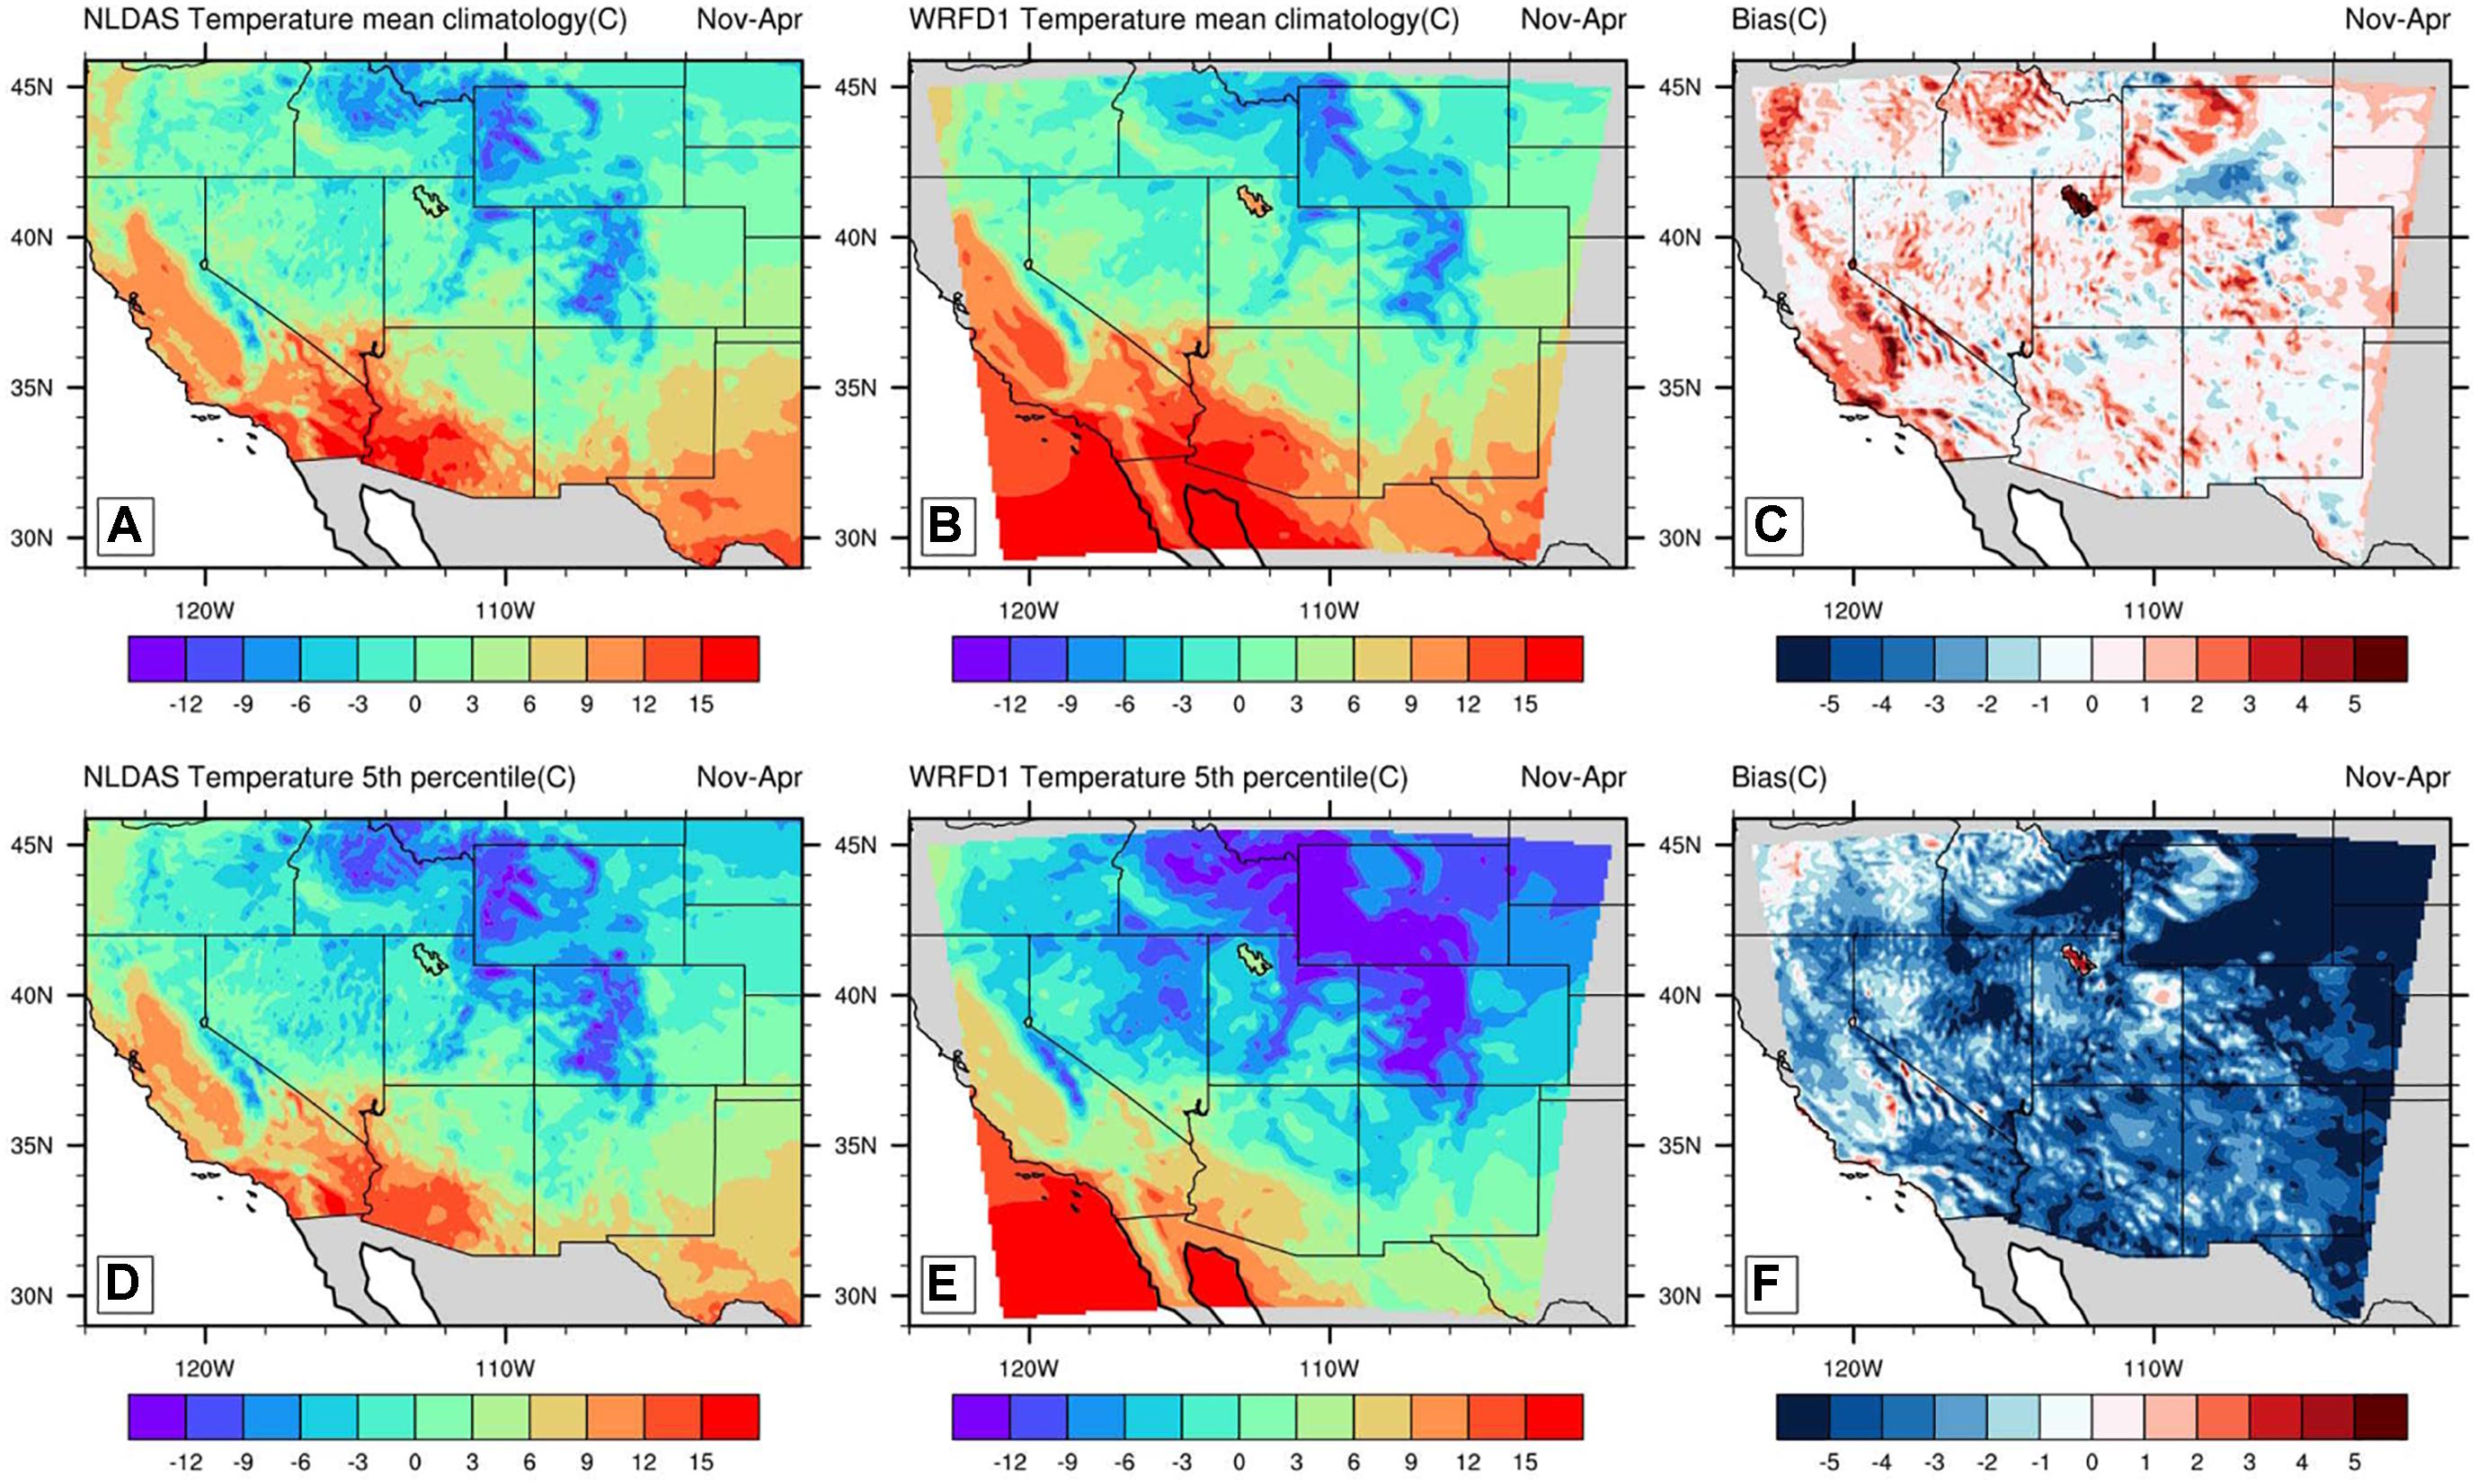
Figure 3. Mean climatology and 5th percentile of cool season (November–April) temperature for 2000–2010 as represented by NLDAS (A,D) and CFSR-WRFD1 (B,E). WRFD1 model bias (model – observation) in cool season mean temperature is plotted in (C) and bias in extreme temperature is plotted in (F). A cold bias is present in the model while representing the extreme cold season temperature.
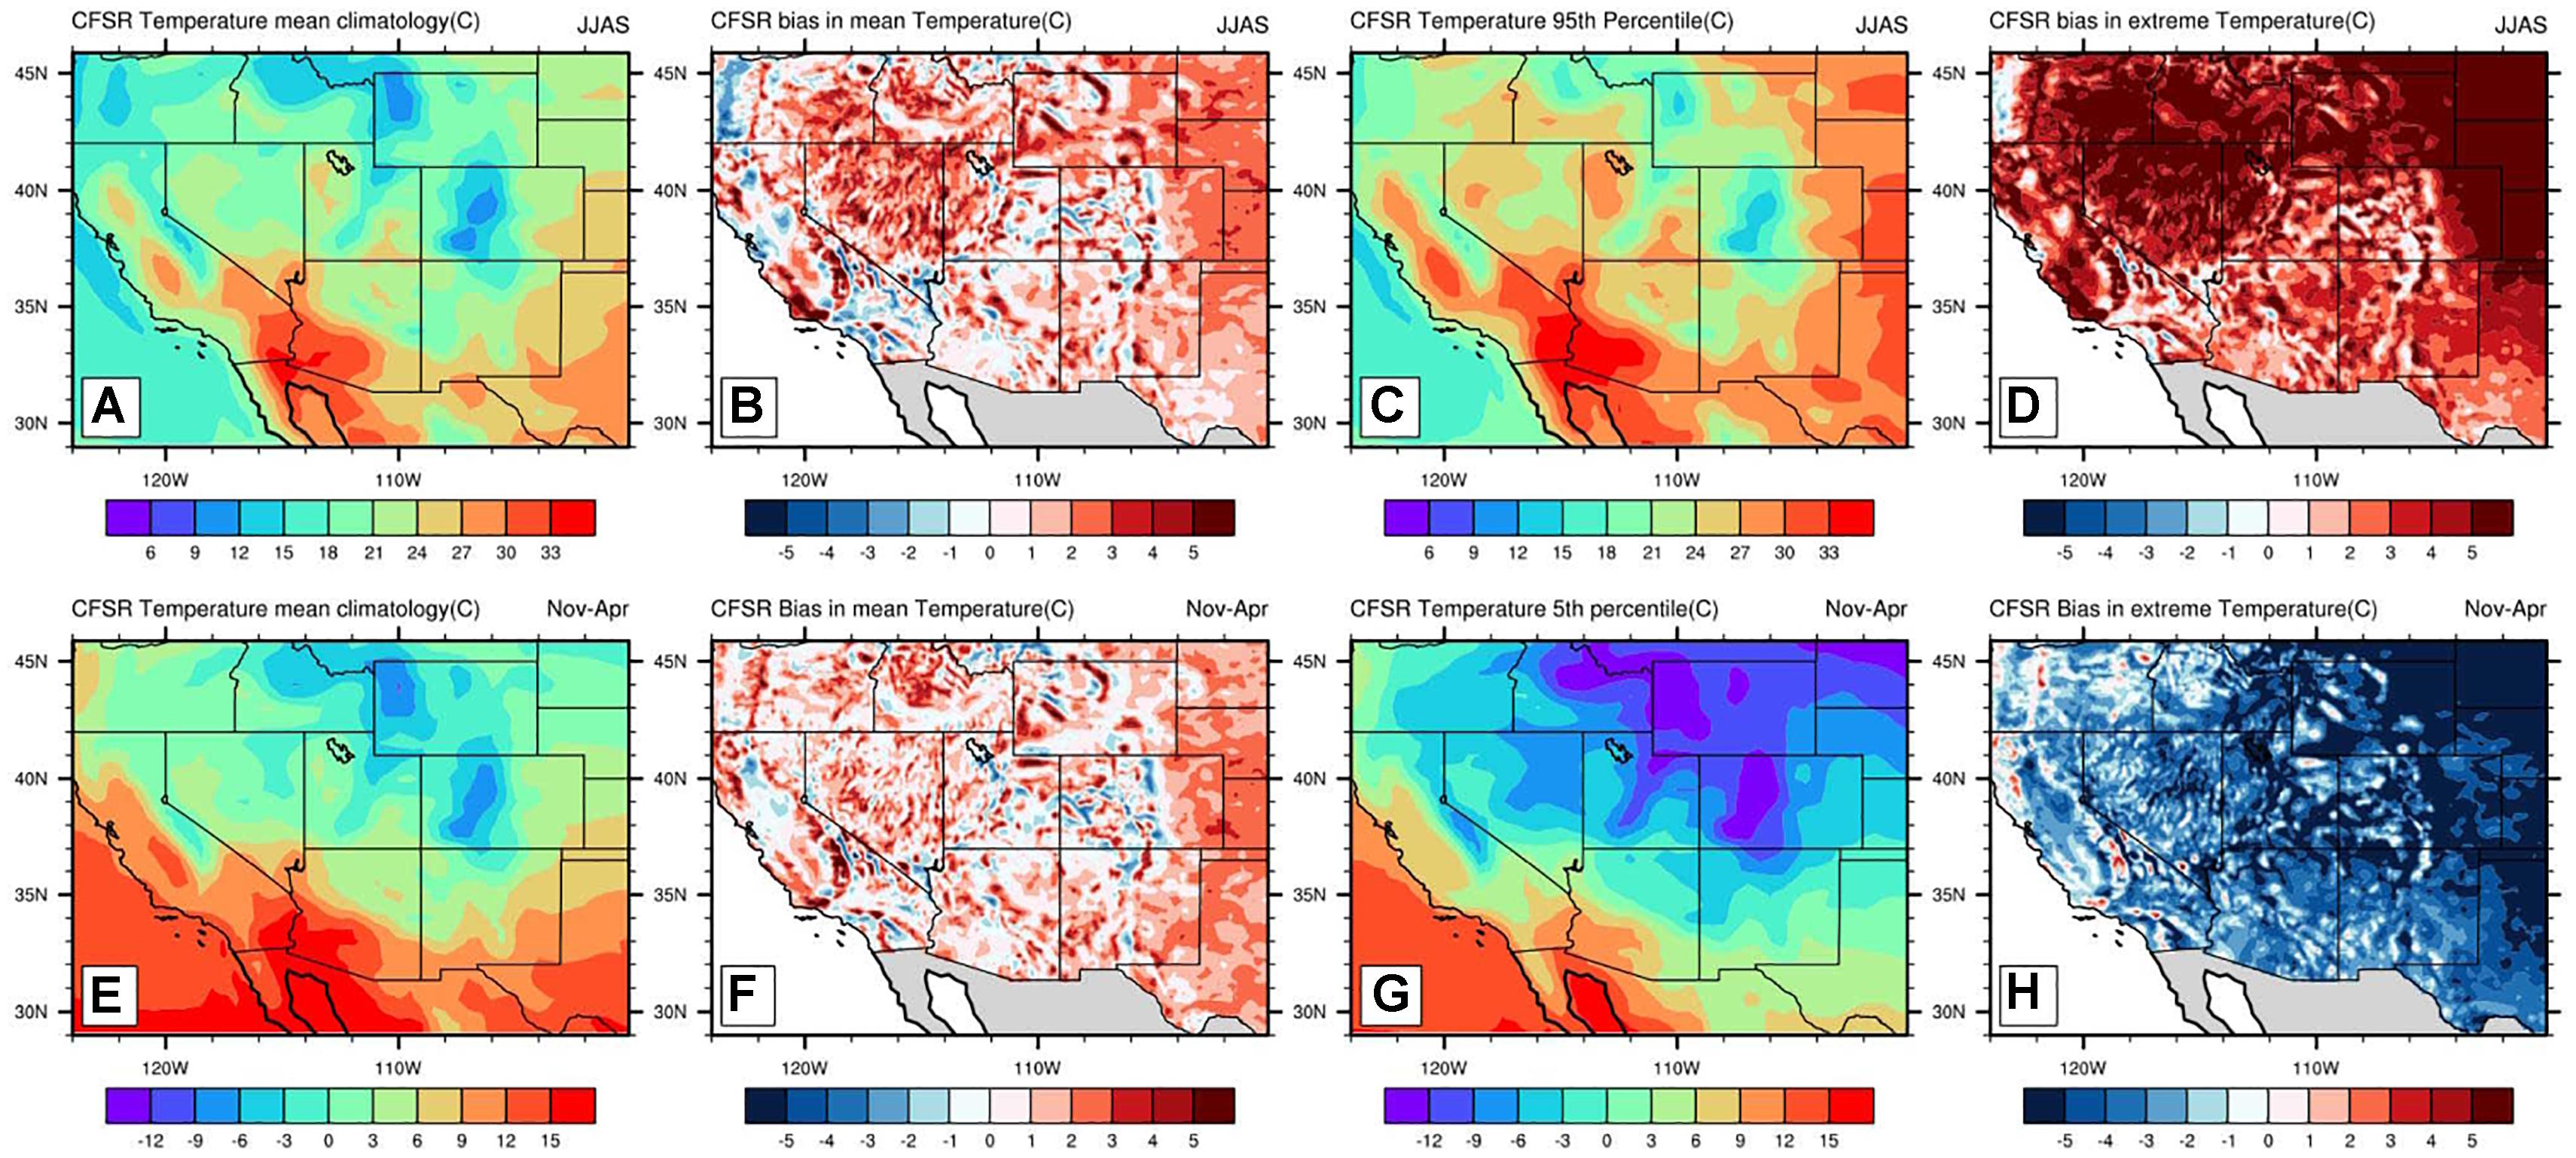
Figure 4. Climatology of mean and extreme warm (JJAS) and cool season (November–April) 2-m temperature (degree C) for 2000–2010 as represented by CFSR (A,C – warm season and E,G – cool season). (B,D,F,H) show the corresponding model biases (model – observation, degree C) of each representation. Bias is higher in magnitude while representing extremes.
Warm Season (JJAS) Precipitation
In the Southwestern United States, June, July, August and September are months of the North American monsoon (NAM) season which produces more than 50% precipitation (Reports to the Nation, 2004; TD13). The spatial distribution of model simulated climatological mean JJAS precipitation was interpolated onto the PRISM grid for comparison.
Mean Warm Season Precipitation
Figure 5 shows the seasonal mean precipitation values from PRISM, WRFD1, UCB and LCB. The detailed spatial structure observed in PRISM data, particularly in mountainous areas, was not well captured in WRFD1, and areas of overestimation are seen in both upper and lower Colorado basin (Figures 5A,B). The excessive overestimation can be attributed to multiple factors inclusive of exaggerated precipitable water and CAPE, and shortcomings in the convection parameterization scheme (TD13). The use of parameterization can trigger unrealistic repeated convection in the model, which leads to a high precipitation. In contrast, UCB and LCB (convection-permitting domains of the model) more realistically represent the areas of precipitation (Figures 5C,D). Figures 6A–C confirms the fact and it was shown that bias in CPM simulations are less than 1 mmday−1 while in coarser WRFD1 there was a widespread area of overestimation, generally in the order of 2–2.5 mmday−1. This clearly demonstrates the value added by the convection permitting modeling at meso-γ scale, for regions with complex topography. The value added of CPM is more prominent in the LCB where monsoon precipitation is relatively more (Adams and Comrie, 1997). Due to the presence of the Rocky Mountains and the Mogollon Rim, the topography is extremely varied here, which has implications for mesoscale circulation features and spatial variability in precipitation. The comparable precipitation result from CFSR yields a comparatively worse representation of the seasonal mean (Figures 7A,B), with a higher bias than regional models. Bias was amplified over the mountainous regions. In some places, bias in high precipitation exceeded even ± 2.5 mmday−1. High-resolution CPM simulations therefore definitely add value to the CFSR data, and these more reliable products can be used for hydrologic modeling, and seasonal water management purposes in the Southwestern United States.
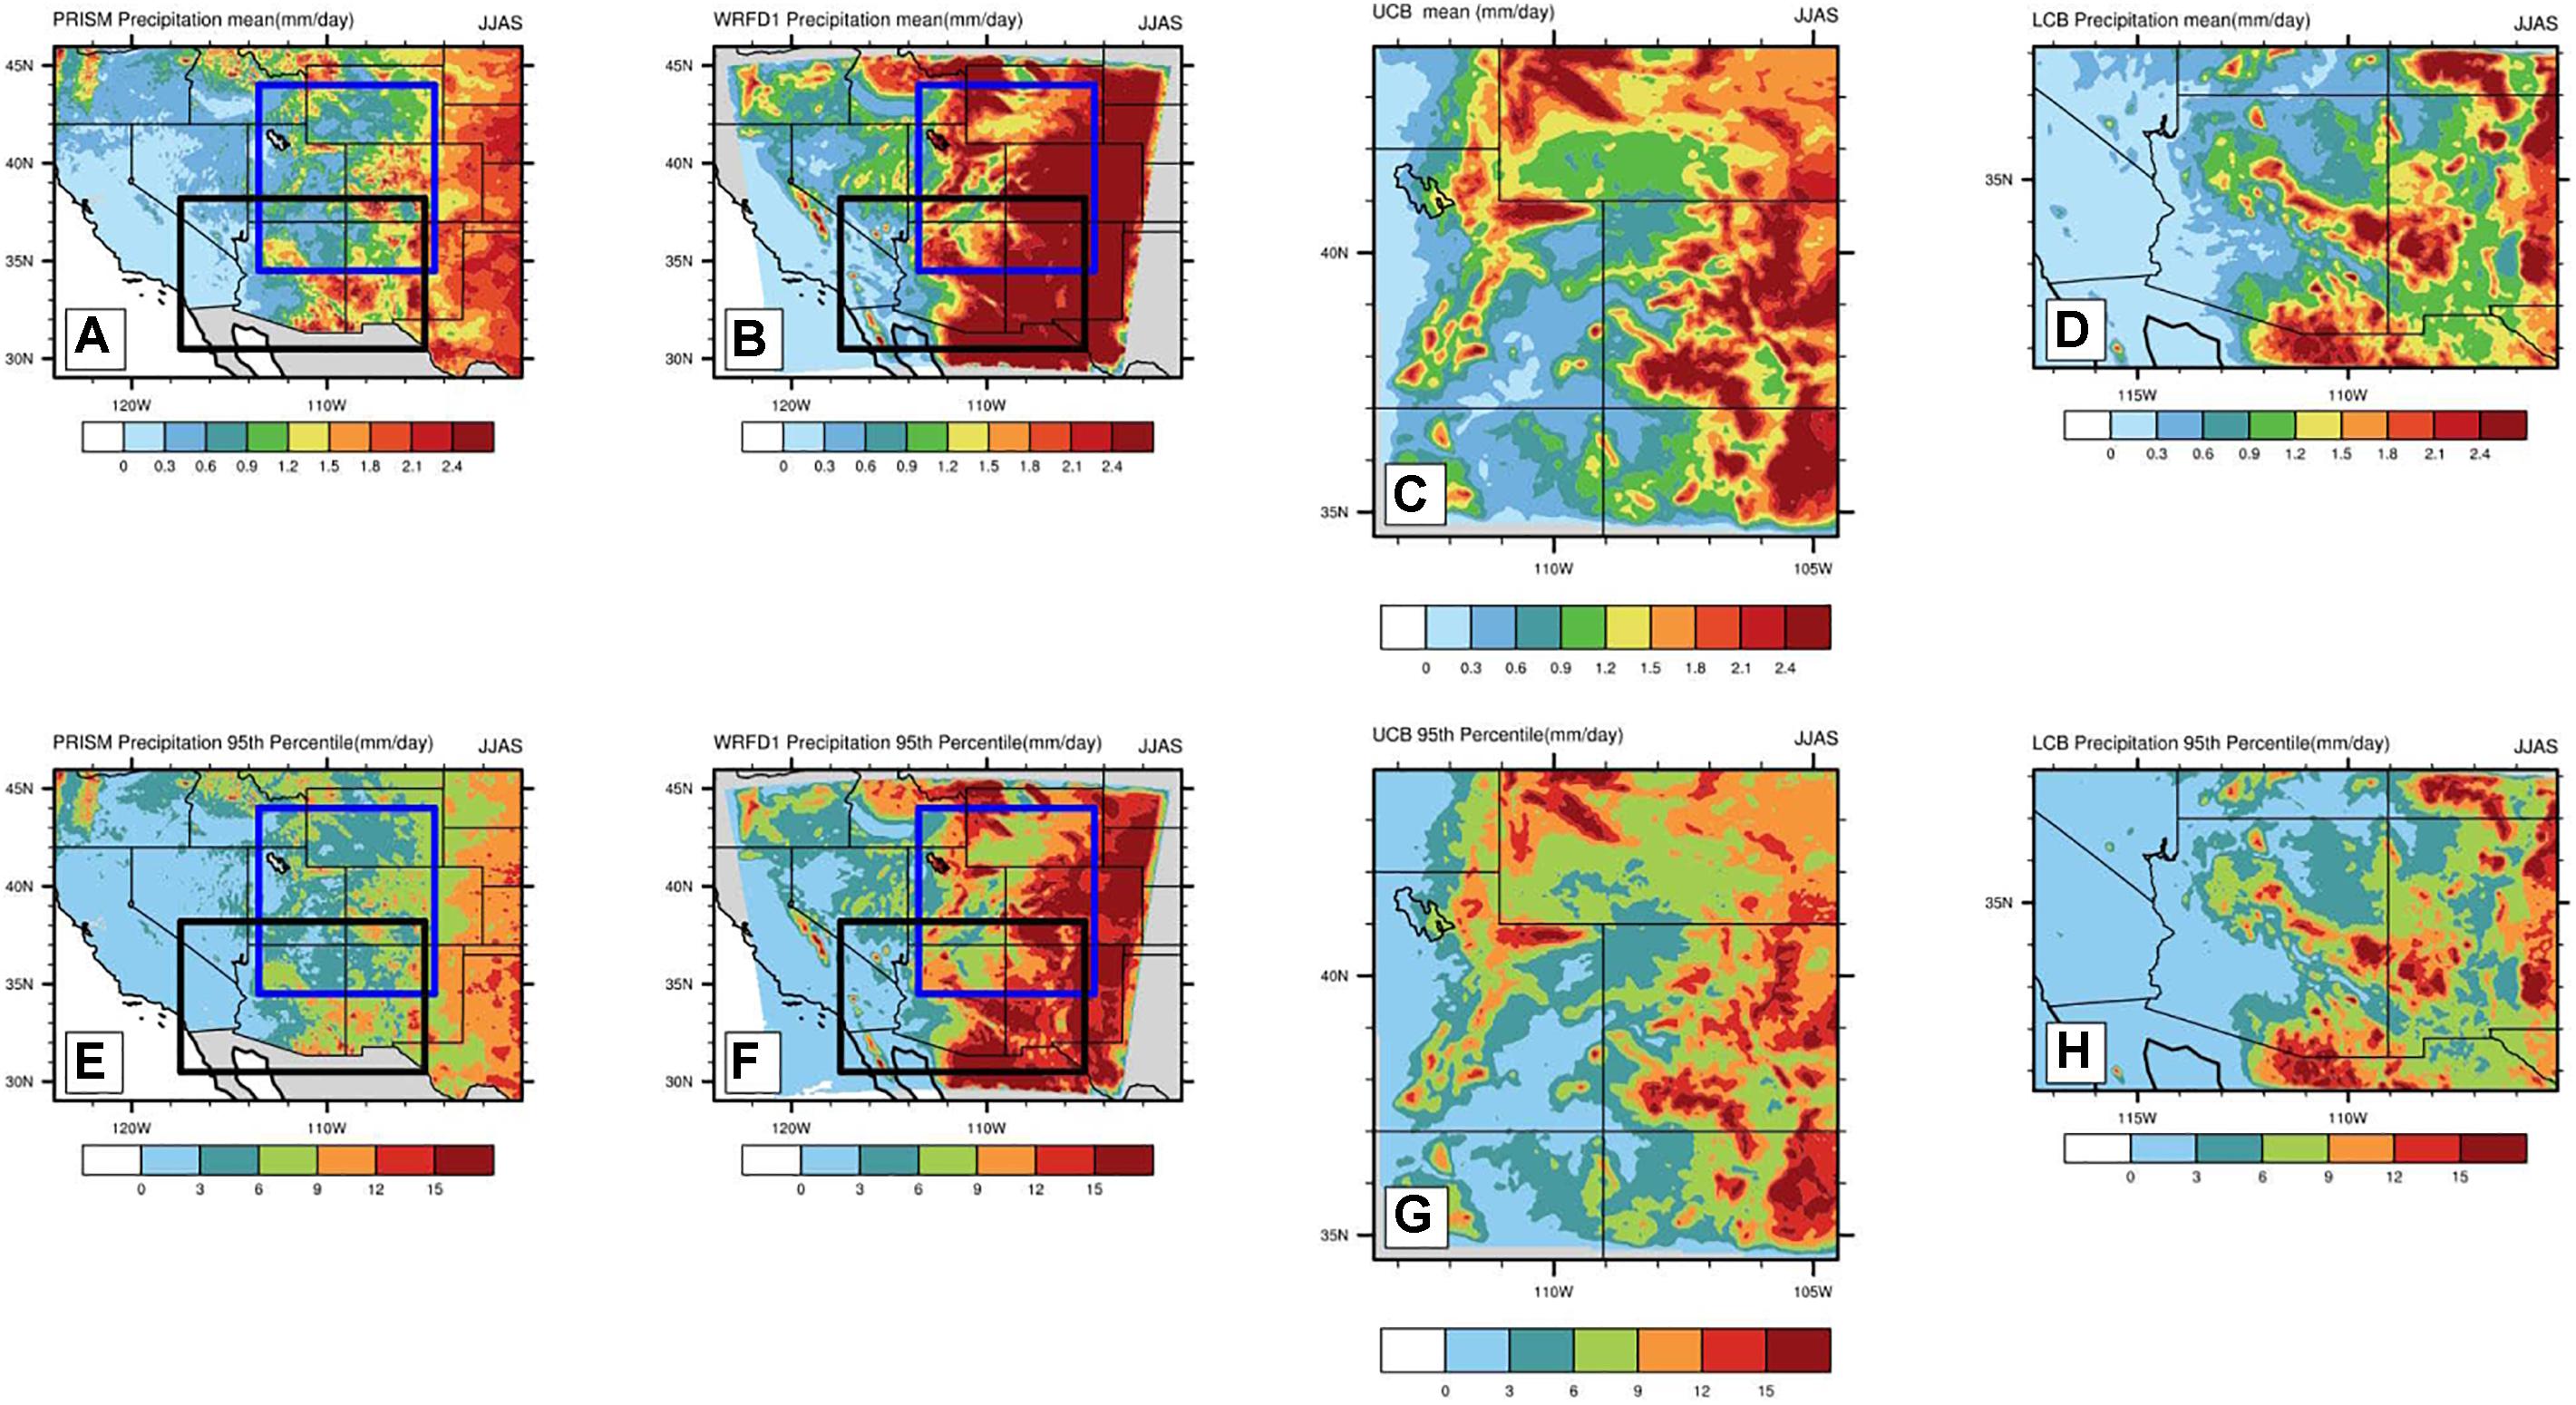
Figure 5. Mean and Extreme precipitation (95th percentile) climatology for warm season (JJAS) represented by observed (A,E), WRF coarse resolution domain (B,F), and CPMs (C,D,G,H). The blue and the black boxes in observed and WRFD1 plots represents the upper and lower Colorado basins (UCB and LCB) respectively where CPM simulations are performed.
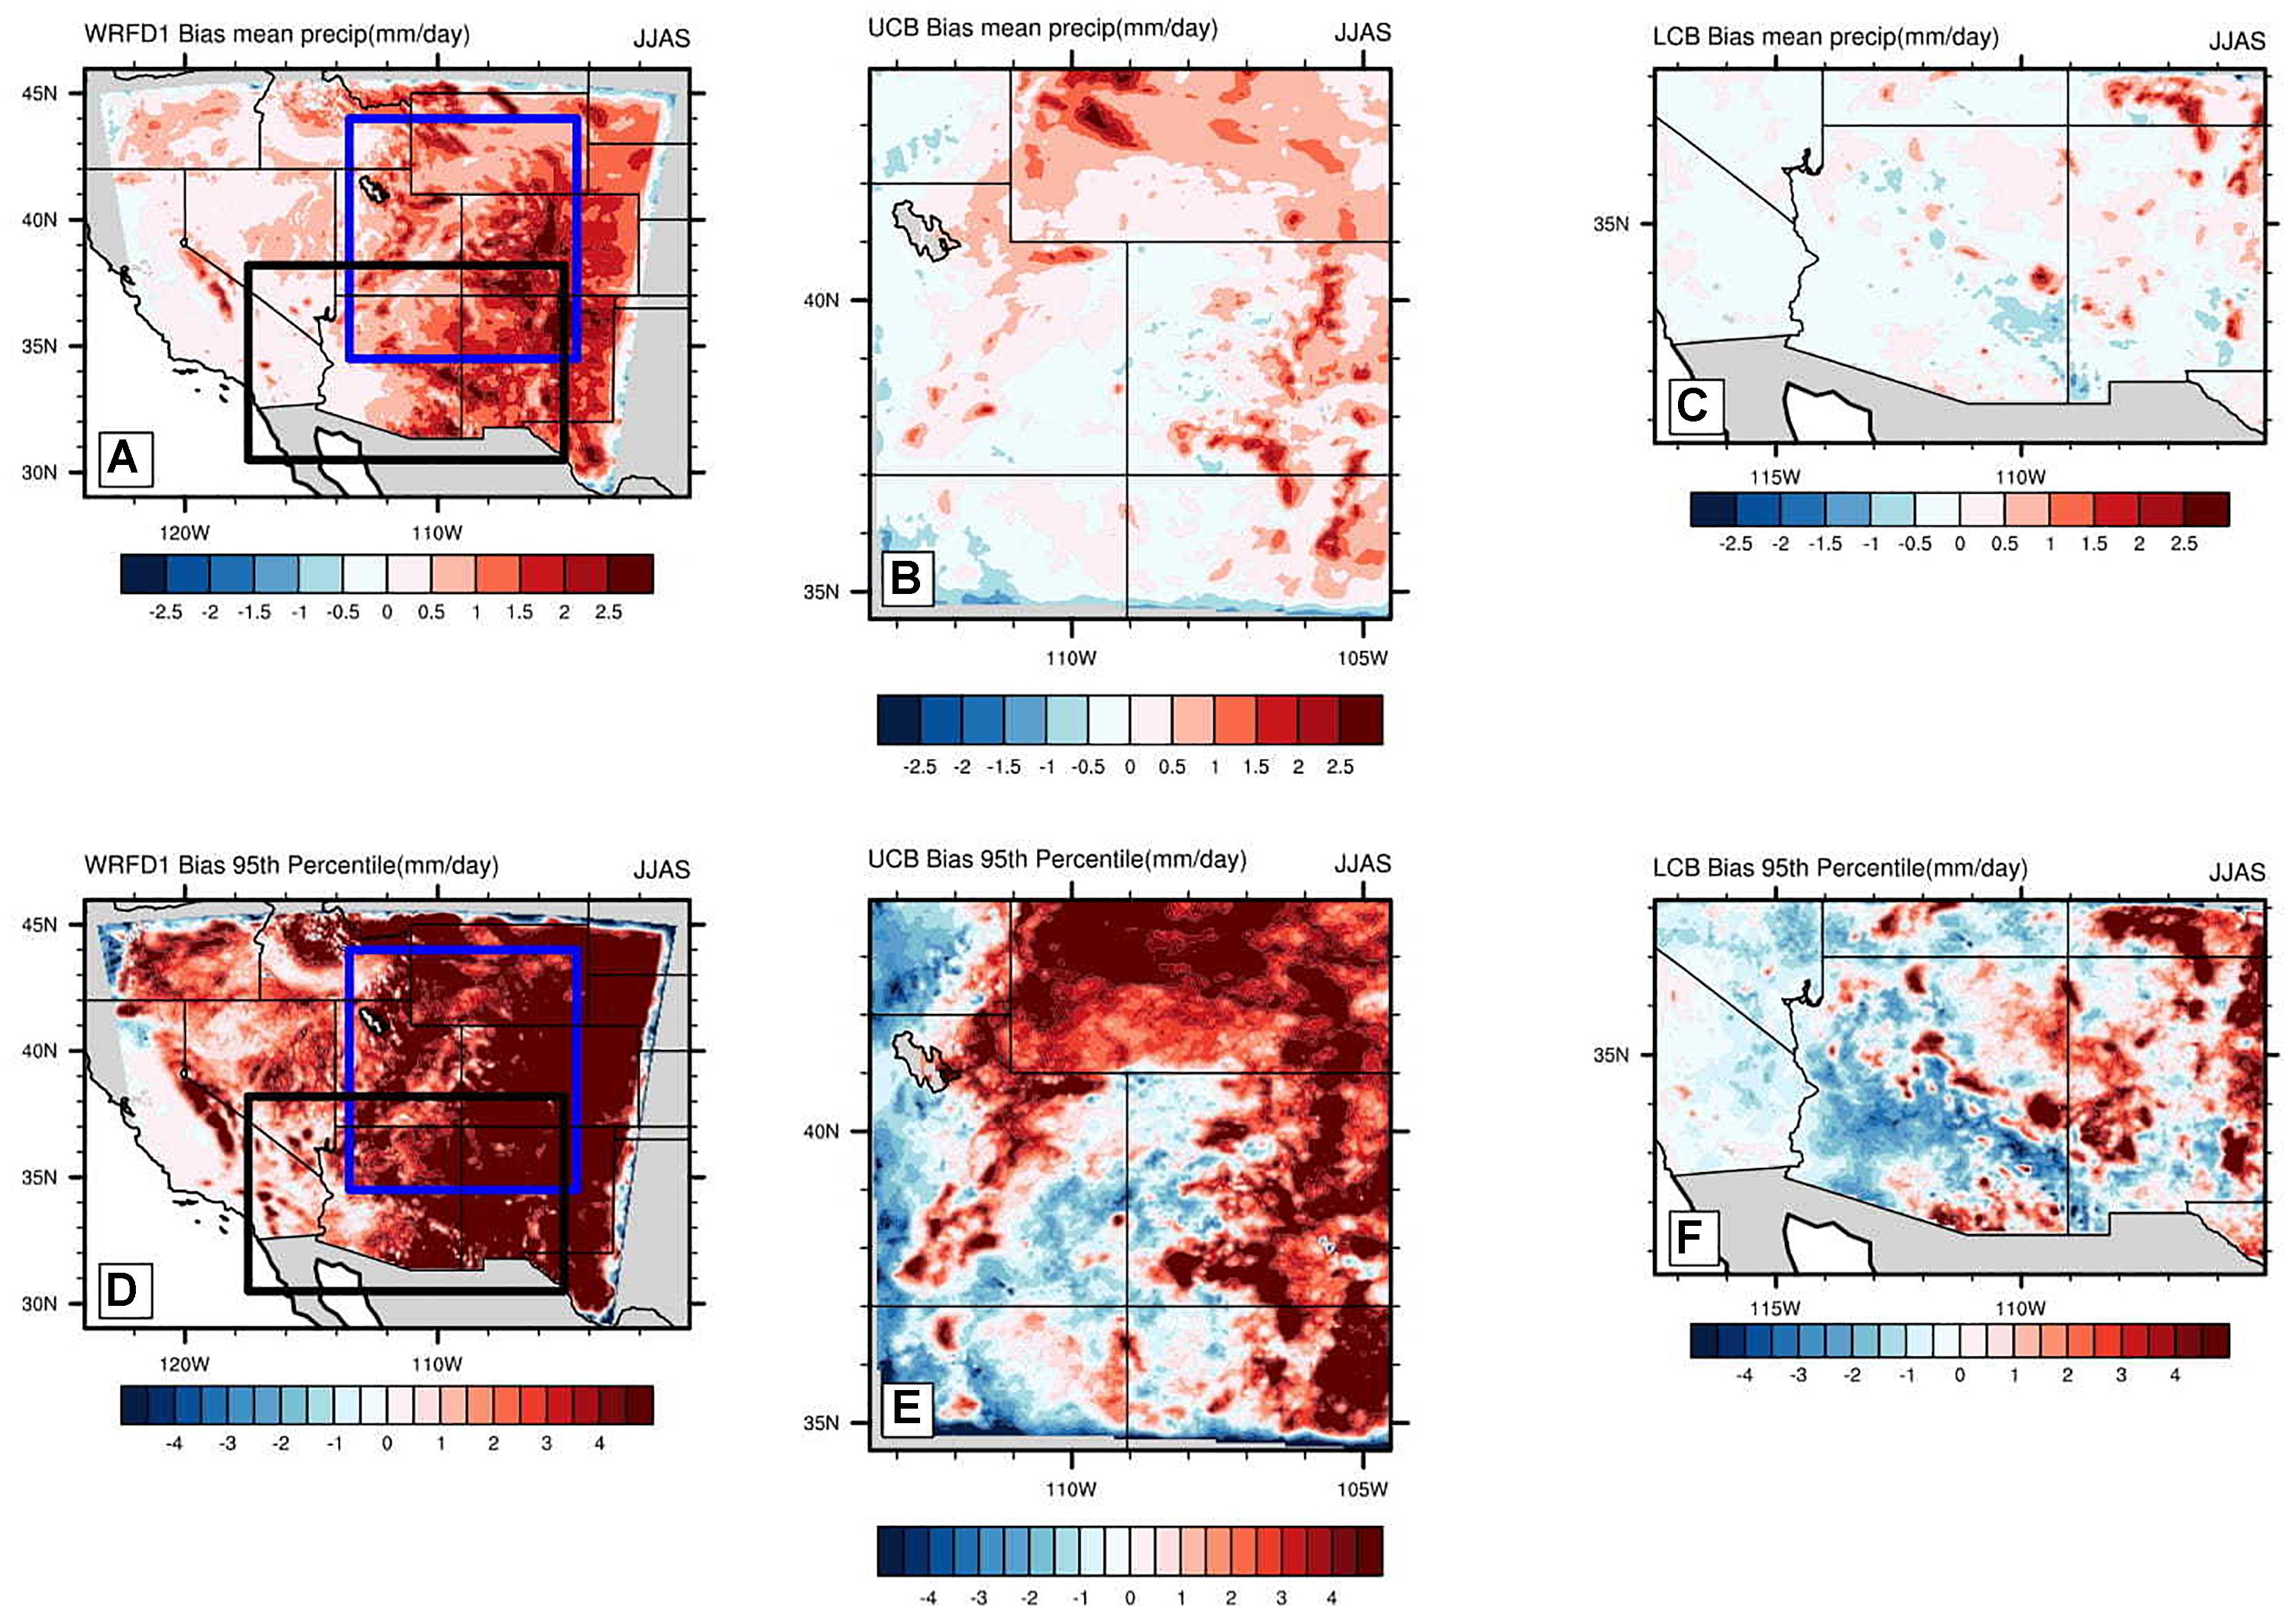
Figure 6. Absolute bias (modeled-observed, mm/day) in mean and extreme precipitation (95th percentile) in warm season CPM (B,C,E,F) and WRFD1 (A,D). The blue and the black boxes in observed and WRFD1 plots represent the upper and lower Colorado basins (UCB and LCB) respectively where CPM simulations are performed.
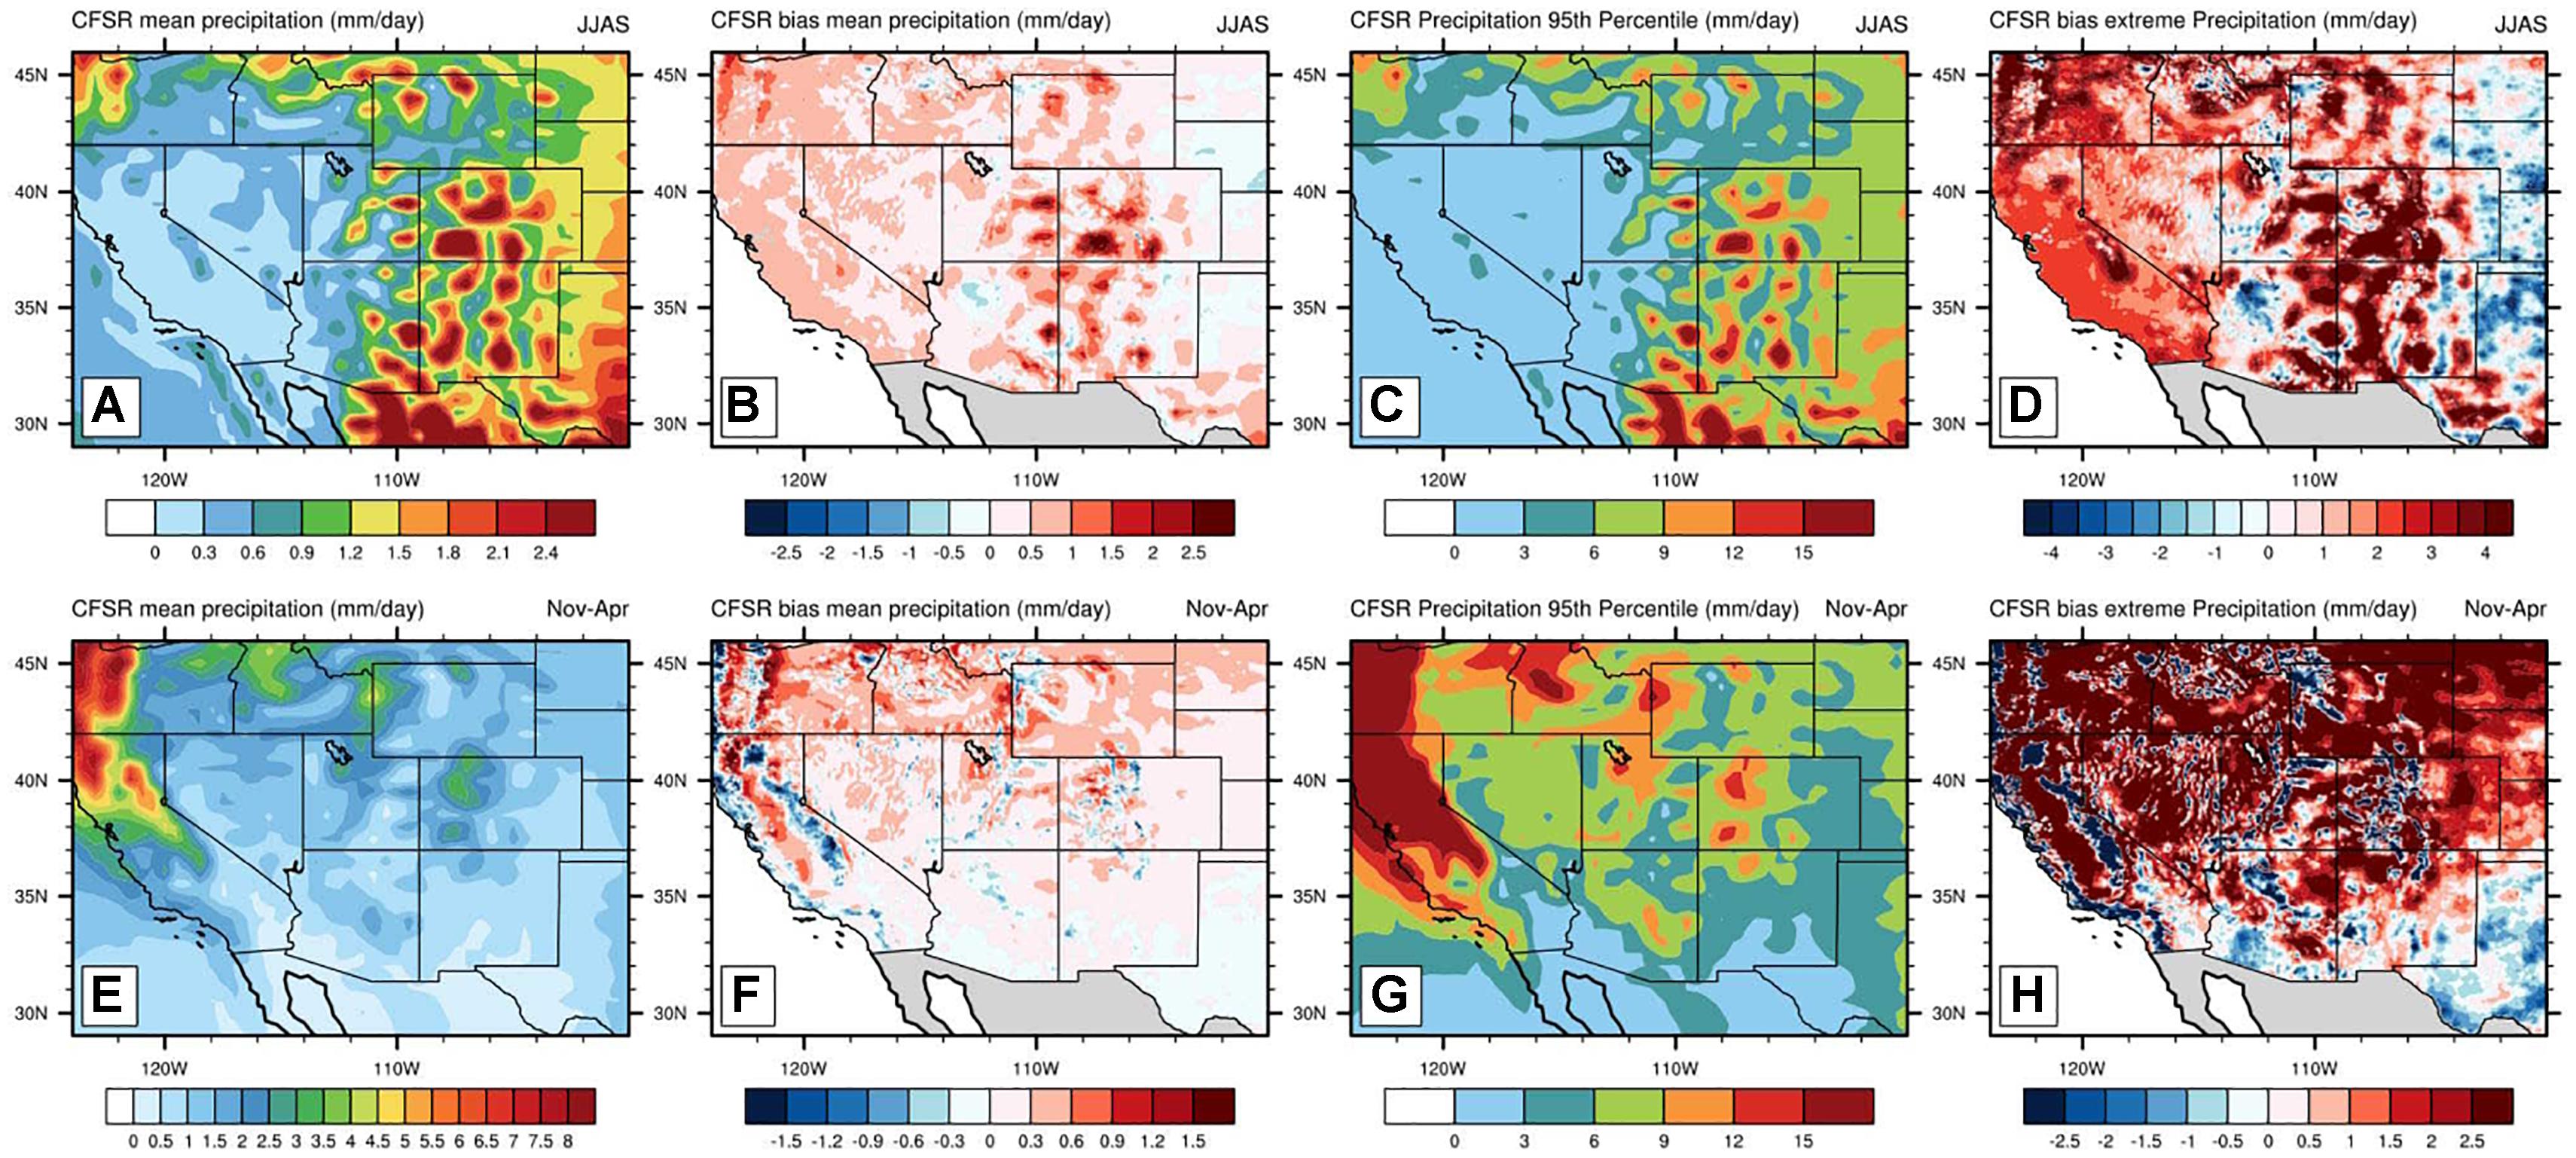
Figure 7. Climatology of mean and extreme warm (JJAS) and cool season (November–April) precipitation (mm/day) for 2000–2010 as represented by CFSR (A,C – warm season and E,G – cool season). (B,D,F,H) show the corresponding model biases (model – observation, mm/day) of each representation.
Diurnal Cycle of Warm Season Precipitation
The diurnal cycle of convective precipitation is an important aspect of monsoonal precipitation and has a high effect on the estimates of rainfall and the surface energy budget (TD13) of Southwestern United States. The warm season diurnal cycle in this region is extremely prominent, with precipitation spikes in the afternoon due to monsoon thunderstorms. The incorrect representation of the diurnal cycle of convective precipitation has been noted as potential problem in most coarse resolution general circulation models (GCMs), which misrepresents the diurnal pattern of warm season precipitation with the onset of moist convection too early and too often (Trenberth et al., 2003). Model simulated climatological mean diurnal precipitation at WRFD1, UCB, and LCB was compared with the gridded Stage-IV hourly data product (aggregated to 6-h). In the warm season during the early afternoon, convection originates in the Rocky Mountains and the systems then propagate eastward toward the Great Plains (Carbone et al., 2002; Janowiak et al., 2007; TD13). The distribution of sub daily and daily precipitation in the Southwestern and Midwestern United States, is determined by the propagation of these systems. The WRFD1 simulation generates excessive rainfall over the high terrain and is not able to produce organized, propagating convection (Figures 8E–H) as compared to observations (Figures 8A–D). The stagnant nature of the summer convection is also noted in coarse resolution (meso-β scale) simulation of TD13. The figures illustrate the movement of convection with respect to time of the day (plotted according to local time). By 5 am, the core of the observed convection has almost exited out of the domain, while in WRFD1 it is still present. Strong overestimation of precipitation is also found in WRFD1 simulation. Looking at the UCB and LCB simulations, it is clear that the diurnal cycle of precipitation is well represented, and the precipitation magnitude is also realistically represented in a seasonal scale (Figures 8I–P). CFSR fails to represent the diurnal cycle in a manner consistent with the daily precipitation (Figure 9). Due to coarse resolution and lack of local feedbacks in the reanalysis data, the quality of sub daily precipitation is compromised in CFSR, which would ultimately affect the mean and extreme seasonal precipitation. Climatologically, the high values present during 11pm – 5am and 5 am–11 am are unrealistic, given the observed Stage-IV data (Figures 8C,D). A regional climate model, at a convection-permitting scale is necessary to accurately represent the sub daily precipitation, and its organization and propagation in this region.
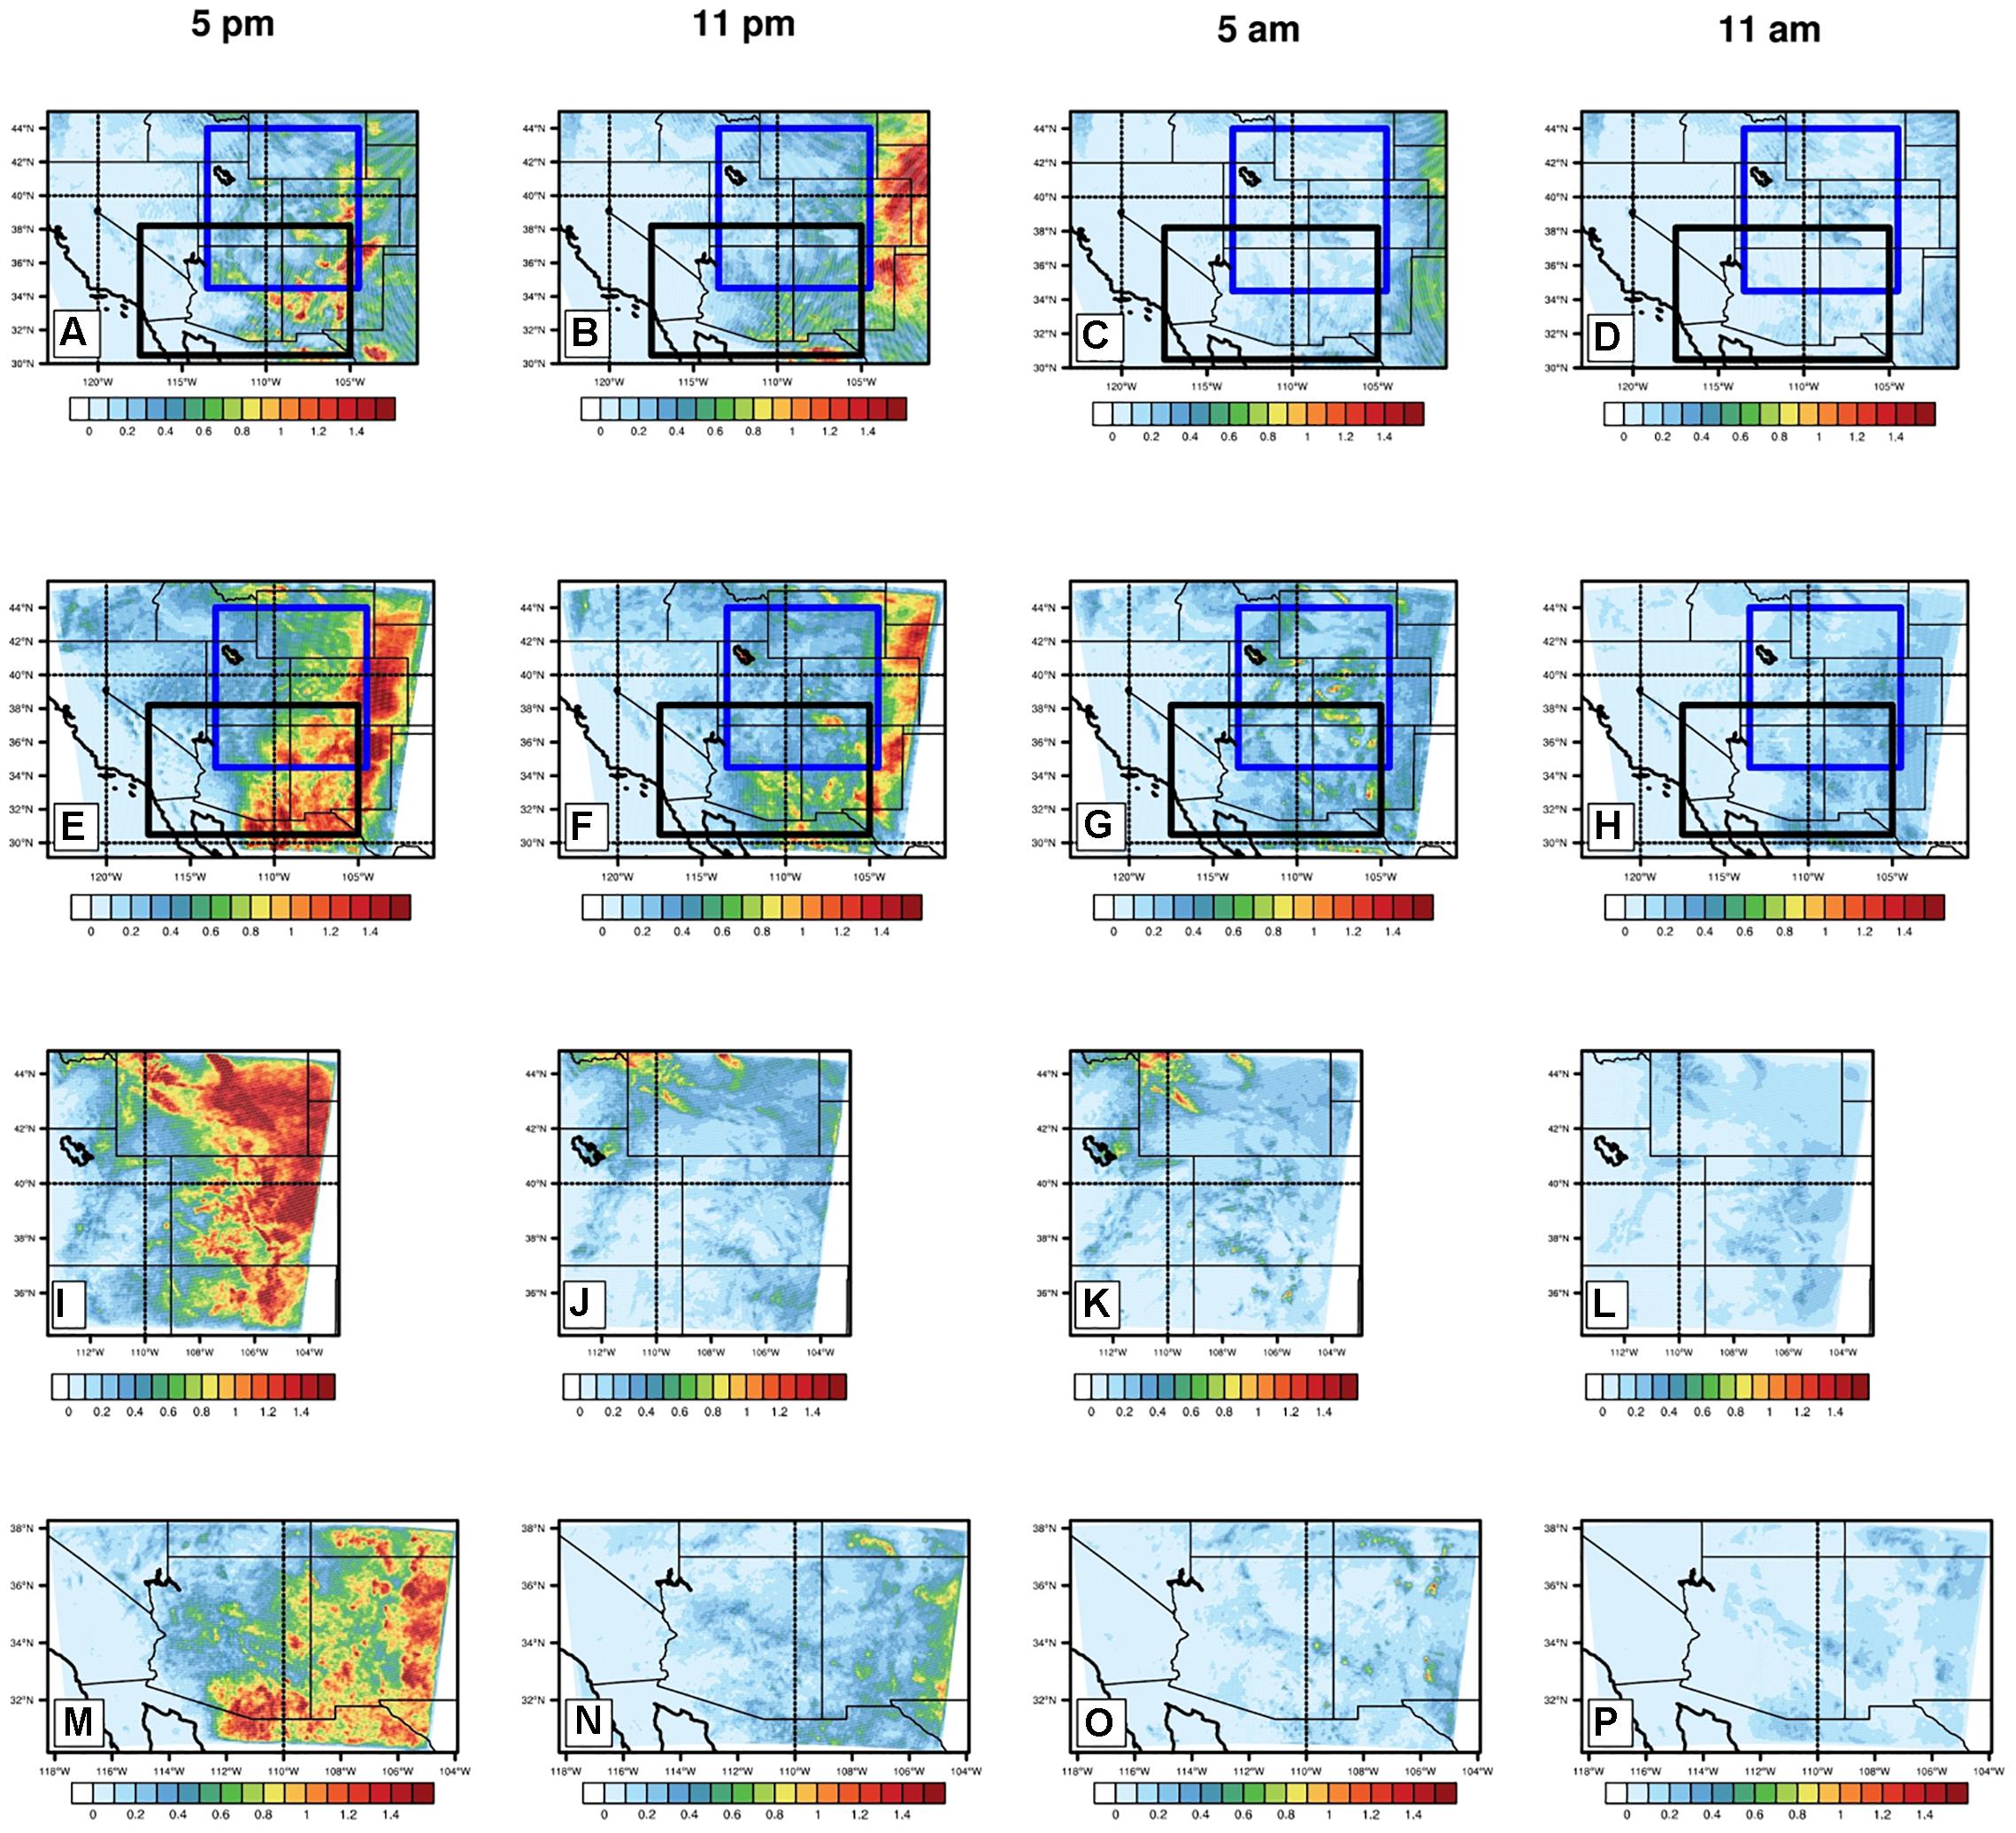
Figure 8. Climatological diurnal cycle of precipitation in WRFD1 and CPM simulations for the warm season of period 2002–2010 compared with climatological diurnal cycle of Stage-IV hourly precipitation data (mm/hr). Representation of mean precipitation during different times of the day (11 am–5 pm, 5 pm–11 pm, 11 pm–5 am, 5 am–11 am in local time) is plotted for observed (A–D); WRFD1 (E–H); UCB (I–L); and LCB (M–P). Most of the precipitation tends to occur during 11 am–5 pm. Then the system moves eastward.
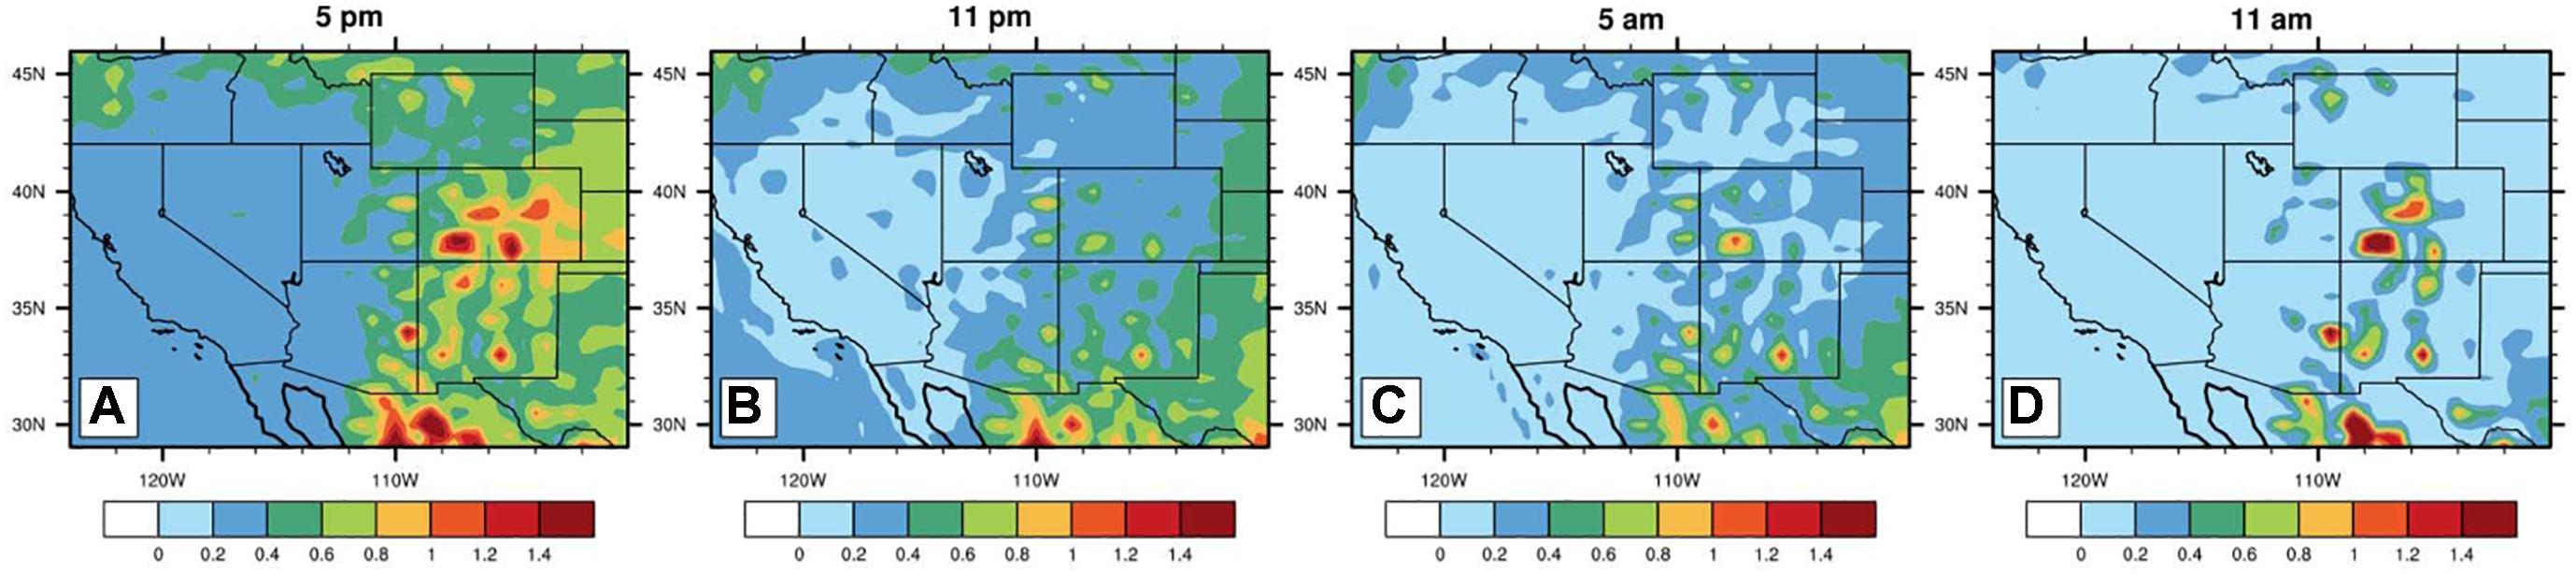
Figure 9. Climatological diurnal cycle of the warm season precipitation (mm/hr) of period 2002–2010 represented in CFSR. Representation of mean precipitation during different times of the day, 11 am–5 pm, 5 pm–11 pm, 11 pm–5 am, 5 am–11 am (in local time) is plotted in (A–D) respectively.
Extreme Warm Season Precipitation
The extreme summer precipitation climatology is calculated as a 95th percentile of the seasonal record (2000–2010) (Manzanas et al., 2017). We analyzed the biases of CPM simulations compared to the biases found in WRD1 simulations using the PRISM data as a reference. Due to its coarse spatial resolution which results in misrepresentation of essential regional features, WRFD1 fails to represent the actual extreme summer precipitation generated by mesoscale convective systems (MCSs), particularly over regions of complex topography (Figures 5E,F). A high bias was present (>4 mm day−1) in most of the domain (Figure 6D). The dynamically downscaled UCB and LCB simulations performed much better in spatial representation (Figures 5G,H) and bias was significantly lower (Figures 6E,F), a result similar to Luong et al., 2017. The CPM simulation was still wetter than observed in certain regions, which could be physically interpreted by the interrelation between a higher temperature (see Section “RCM validation: Warm and cool season temperature”) and a wetter climate in terms of the Clausius-Clapeyron relationship. With an increase in temperature, the water holding capacity of atmosphere increases; so higher amounts of rainfall can be produced given suitable conditions for generating convective precipitation (O’Gorman and Schneider, 2009; Allan et al., 2013). The spatial correspondence of extremely high temperatures and precipitation bias was most prominent in southern Colorado, western Utah and mountainous regions of Arizona (Figures 6E,F and Supplementary Figures S1E,F). However, this kind of relationship is non-linear and could therefore not be explicitly identified at all locations. It was not surprising that the model produced slightly high precipitation, but the spatial pattern was well captured. In addition, it added value to the coarse resolution CFSR data (Figure 7C) by reducing its high bias (Figure 7D) at much finer spatial resolution. Overall, CPM yields precipitation amounts that better correspond to the observed data than the equivalent coarse resolution model grid.
Cool Season Precipitation
Winter precipitation in the Southwest is driven by occasional large size cyclonic storms that take more southerly tracks during the winter season in North America. The strong westerly winds associated with these storms help advect moisture from the Pacific Ocean into this region.
Mean Cool Season Precipitation
Precipitation occurs mainly on the Mongollon Rim in Arizona and the Rockies in New Mexico (Figure 10A). Both domains, WRFD1, and CPMs are able to reproduce this precipitation, however, with higher accuracy in CPM (Figures 10B,D). The bias is less than ∼ 0.5 mmday−1 (Figures 11A,C). This was expected, as the model captures large-scale driven winter precipitation events better than summer convective events. WRFD1 grid resolution captured these types of events well, consistent with past literature (TD13; Kirtman et al., 2014). This also encouraged us to focus more on Convection-Permitting simulations to improve warm season seasonal forecasts, in lieu of developing completely new global models to capture large-scale circulation anomalies, the capability of which is already present in CFSR (Figures 7E,F).
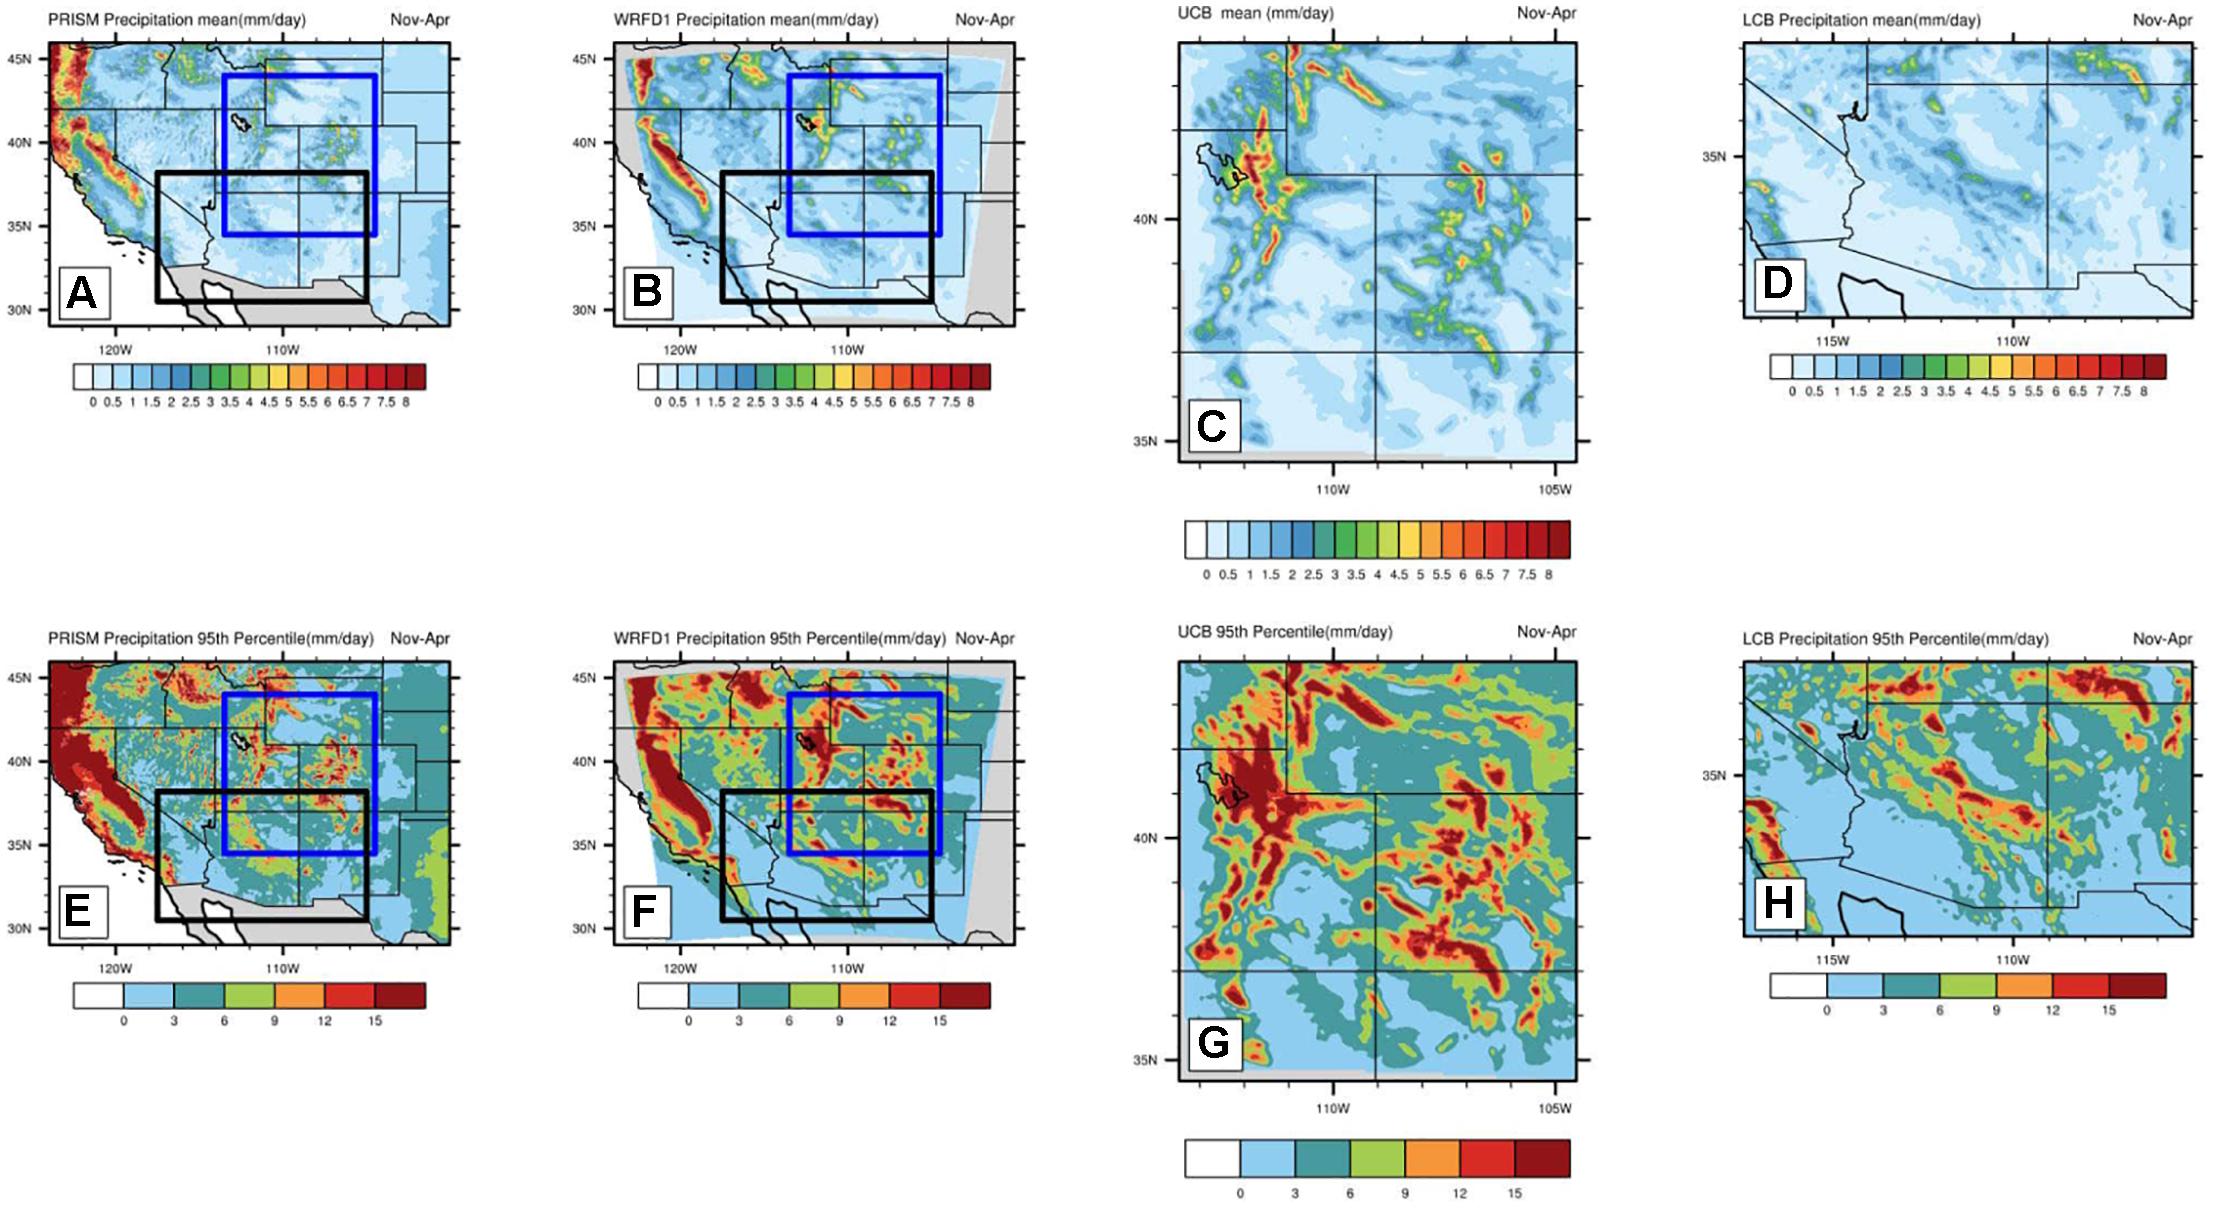
Figure 10. Same as Figure 5 but for cool season.
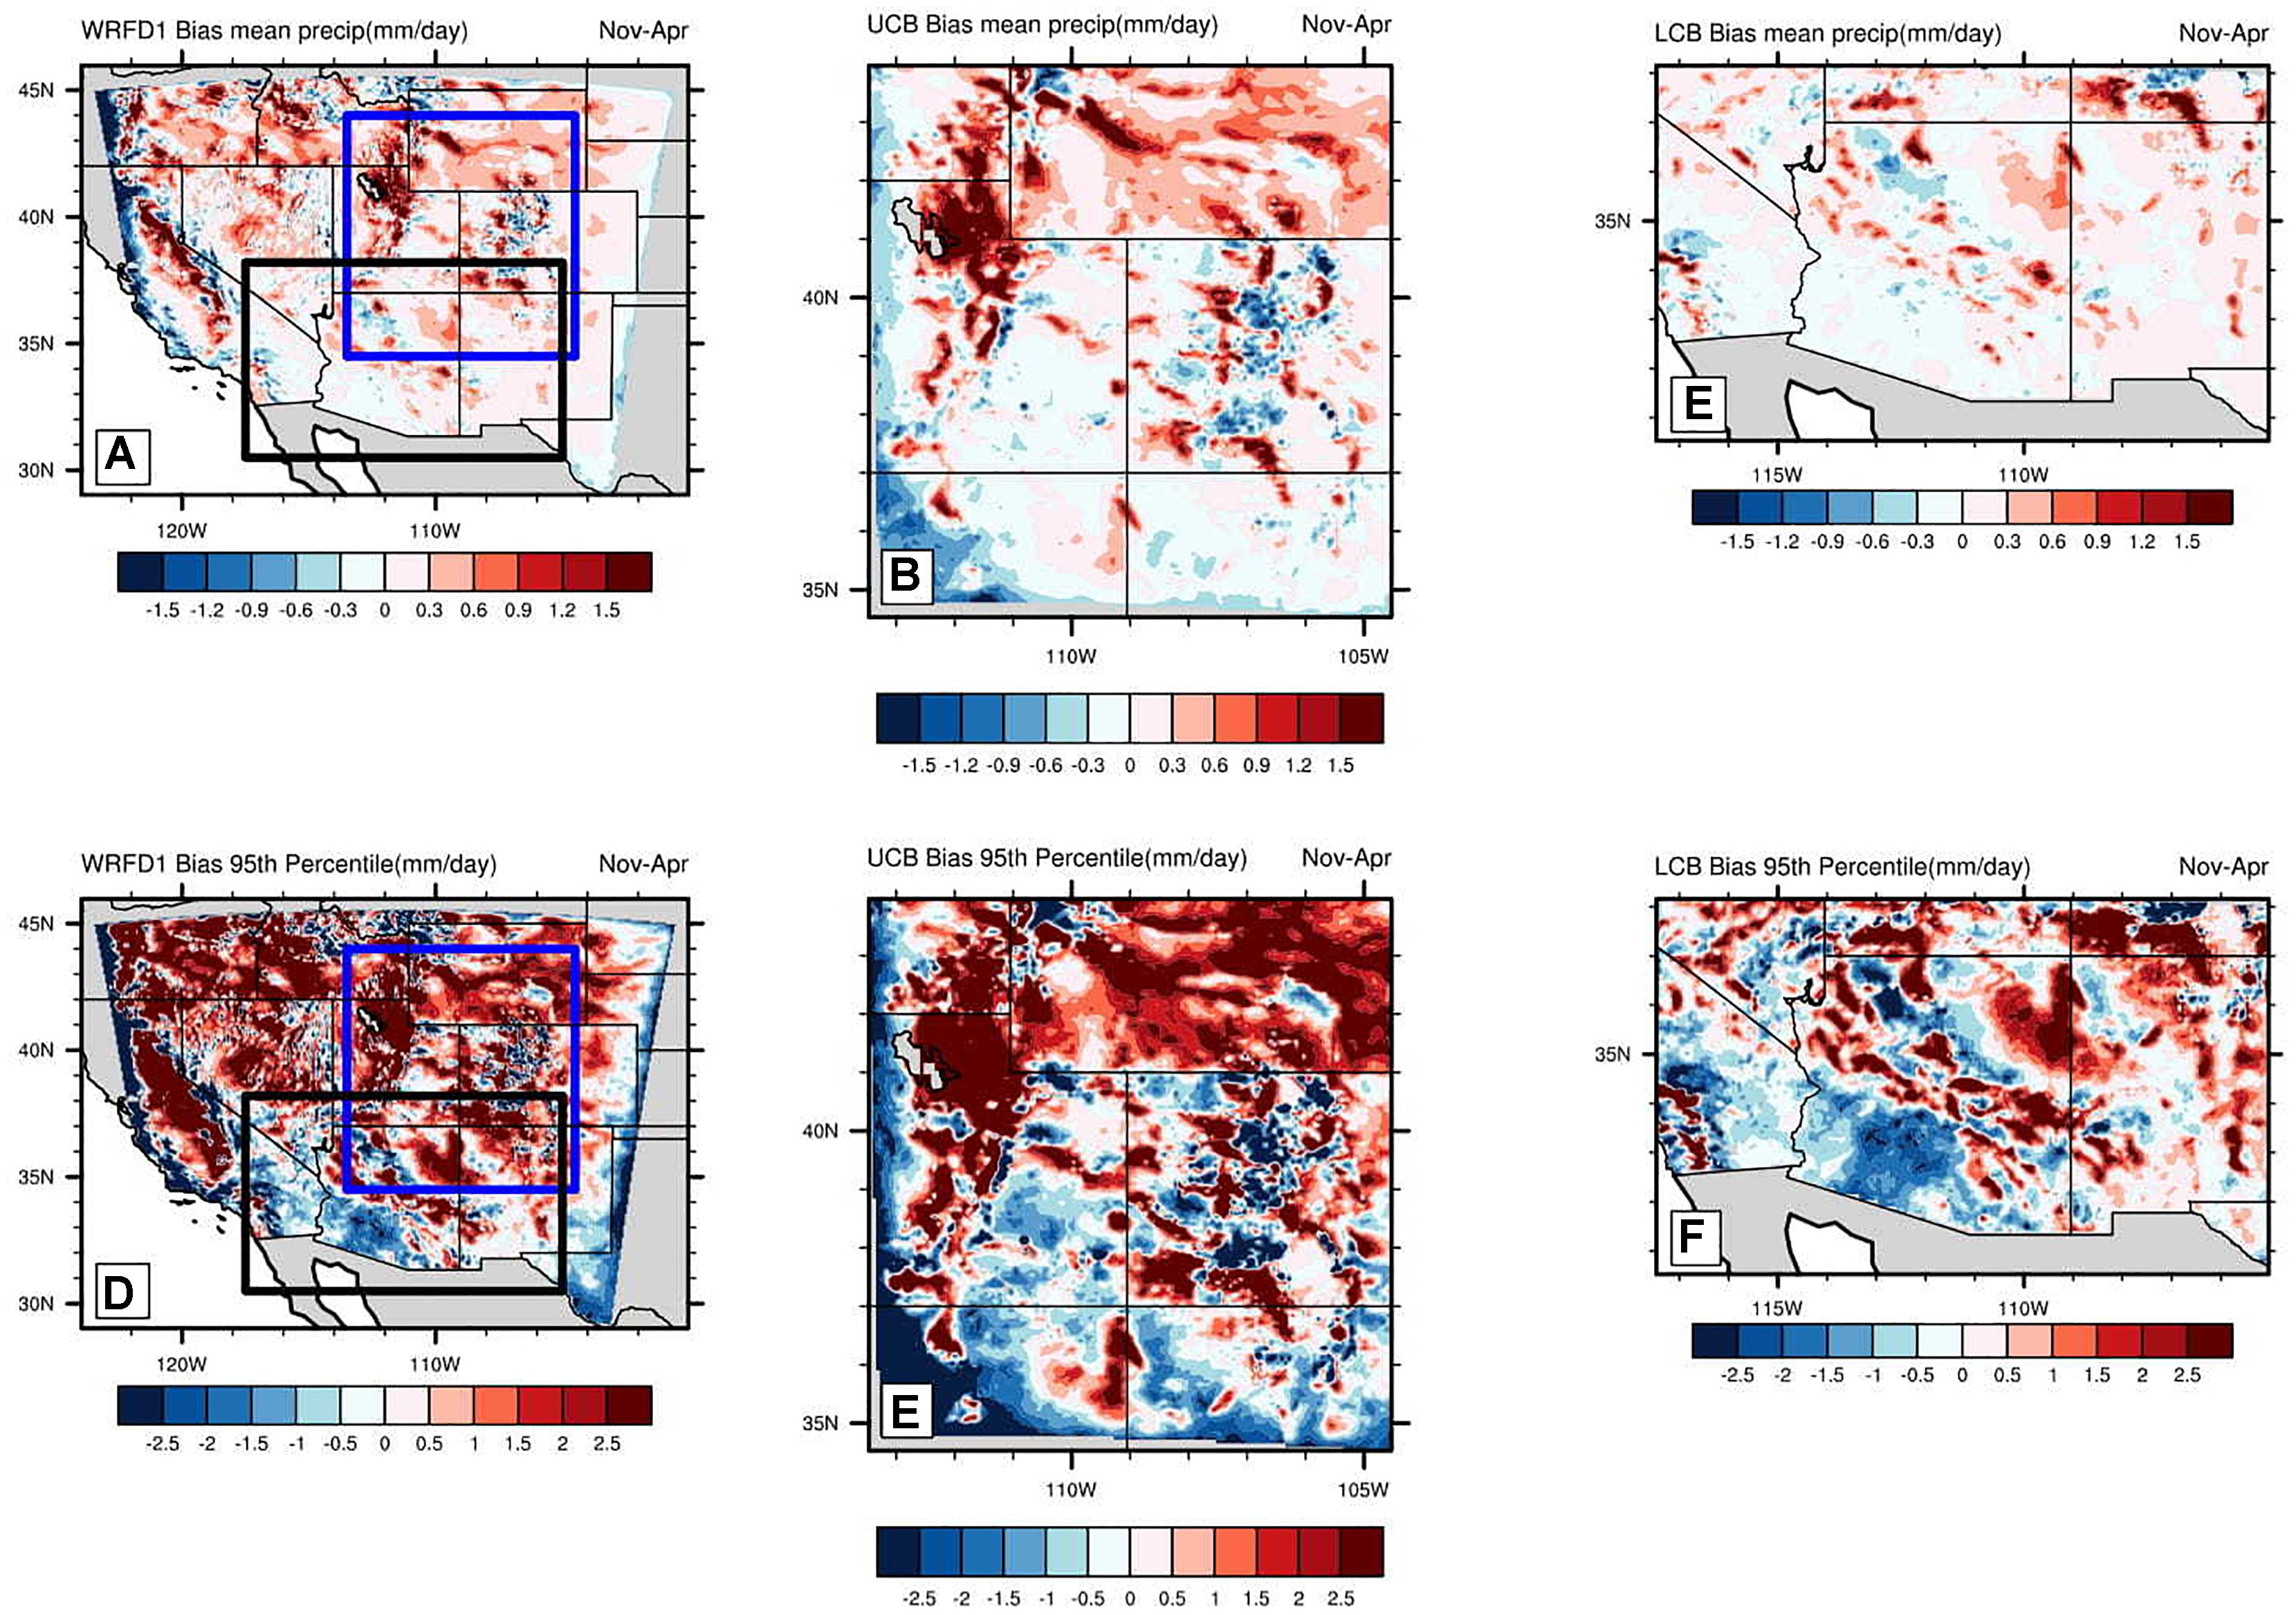
Figure 11. Same as Figure 6, but for cool season.
Extreme Cool Season Precipitation
Extreme cool season precipitation is exaggerated all over the region as simulated by both WRFD1 and CPMs. However, the spatial pattern is similar to that observed (Figures 10E–H). This could be attributed to the model incorrectly representing extreme winter temperatures. The cool season bias could also be associated with large-scale atmospheric features embedded in the boundary condition from CFSR. However, some of WRF biases may enhance it. Since the error is just in magnitude (Figures 11D–F), we suggest that application of some simple bias correction techniques may be an important step, before using these results as impact for subsequent impacts assessment modeling. This framework of dynamical downscaling followed by bias correction has become a common procedure in different user applications (Manzanas et al., 2017). In this way, reliable high-resolution precipitation products can be obtained, which can be used for hydrologic modeling for applications such as water management and extreme events, flood modeling, and renewable energy forecasting. CFSR being a coarse resolution model (Figure 7) is not suitable as a stand-alone product for these purposes.
Skill, Reliability, and Uncertainty
As discussed in section “Statistical Methodology for Skill, Reliability and Uncertainty Assessment,” the validations are also illuminated in a spatially and regionally averaged approach for each season and region. The values of different metrics calculated are shown in Table 3. Overall, WRFD1 and CPM simulations are characterized by similar PS values, revealing that coarse and high-resolution simulations have a similar capability to simulate the interannual variability of seasonal rainfall. Reduction in conditional and unconditional bias (less SR and SE values) is the main positive aspect of CPM simulations. This is consistent for all regions and seasons. However, in the warm season the improvement in bias is significant (119.732 to 2.1509 in UCB and 33.3996 to 0.2403 in LCB) while nominal in the winter season, which is also consistent with our results in section “Mean warm season precipitation.” CFSR was also outperformed in terms of bias, by CPM in all seasons and regions, especially in summer (4.435 in UCB and 0.942 in LCB). Use of a bootstrapping method allows us to quantify the uncertainty in the precipitation predictions (see section “Statistical Methodology for Skill, Reliability and Uncertainty Assessment”). Column 1 and Column 2 of Figure 12 reveals that CFSR and WRFD1 predictions have a wider uncertainty envelope compared to CPM simulations. It is noteworthy that CPM simulations capture the interannual variability of warm and cool season precipitation well and the observed precipitation (PRISM) is within the uncertainty bound. However, WRFD1 simulations perform significantly worse and magnitudes are off by ∼ 2 mm/day in the warm season. In the cool season, the improvement was not significant, but the uncertainty of the CPM is within the observed values, along with overall prediction of interannual variability, which is also well simulated in WRFD1 simulations. Column 3 of Figure 12 explains the model’s skill to address the inter-annual variability (assessed here in terms of standard deviation of a yearly time series at different regions). For both the seasons, box plots affirm that, CPM outperforms CFSR and WRFD1 simulations in capturing the year-to-year precipitation variability. However, to firmly comment on model skill on an inter annual time-scale, requires data of a longer time range which is beyond the scope of this study but should be considered in future research.
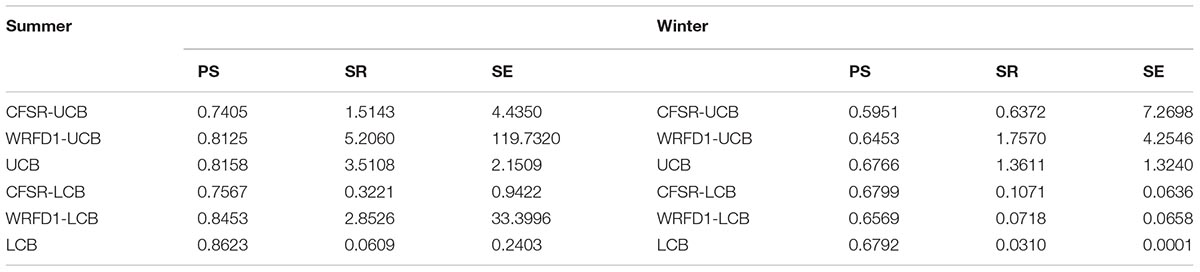
Table 3. Statistical skill and bias metrics for seasonally and regionally averaged framework.
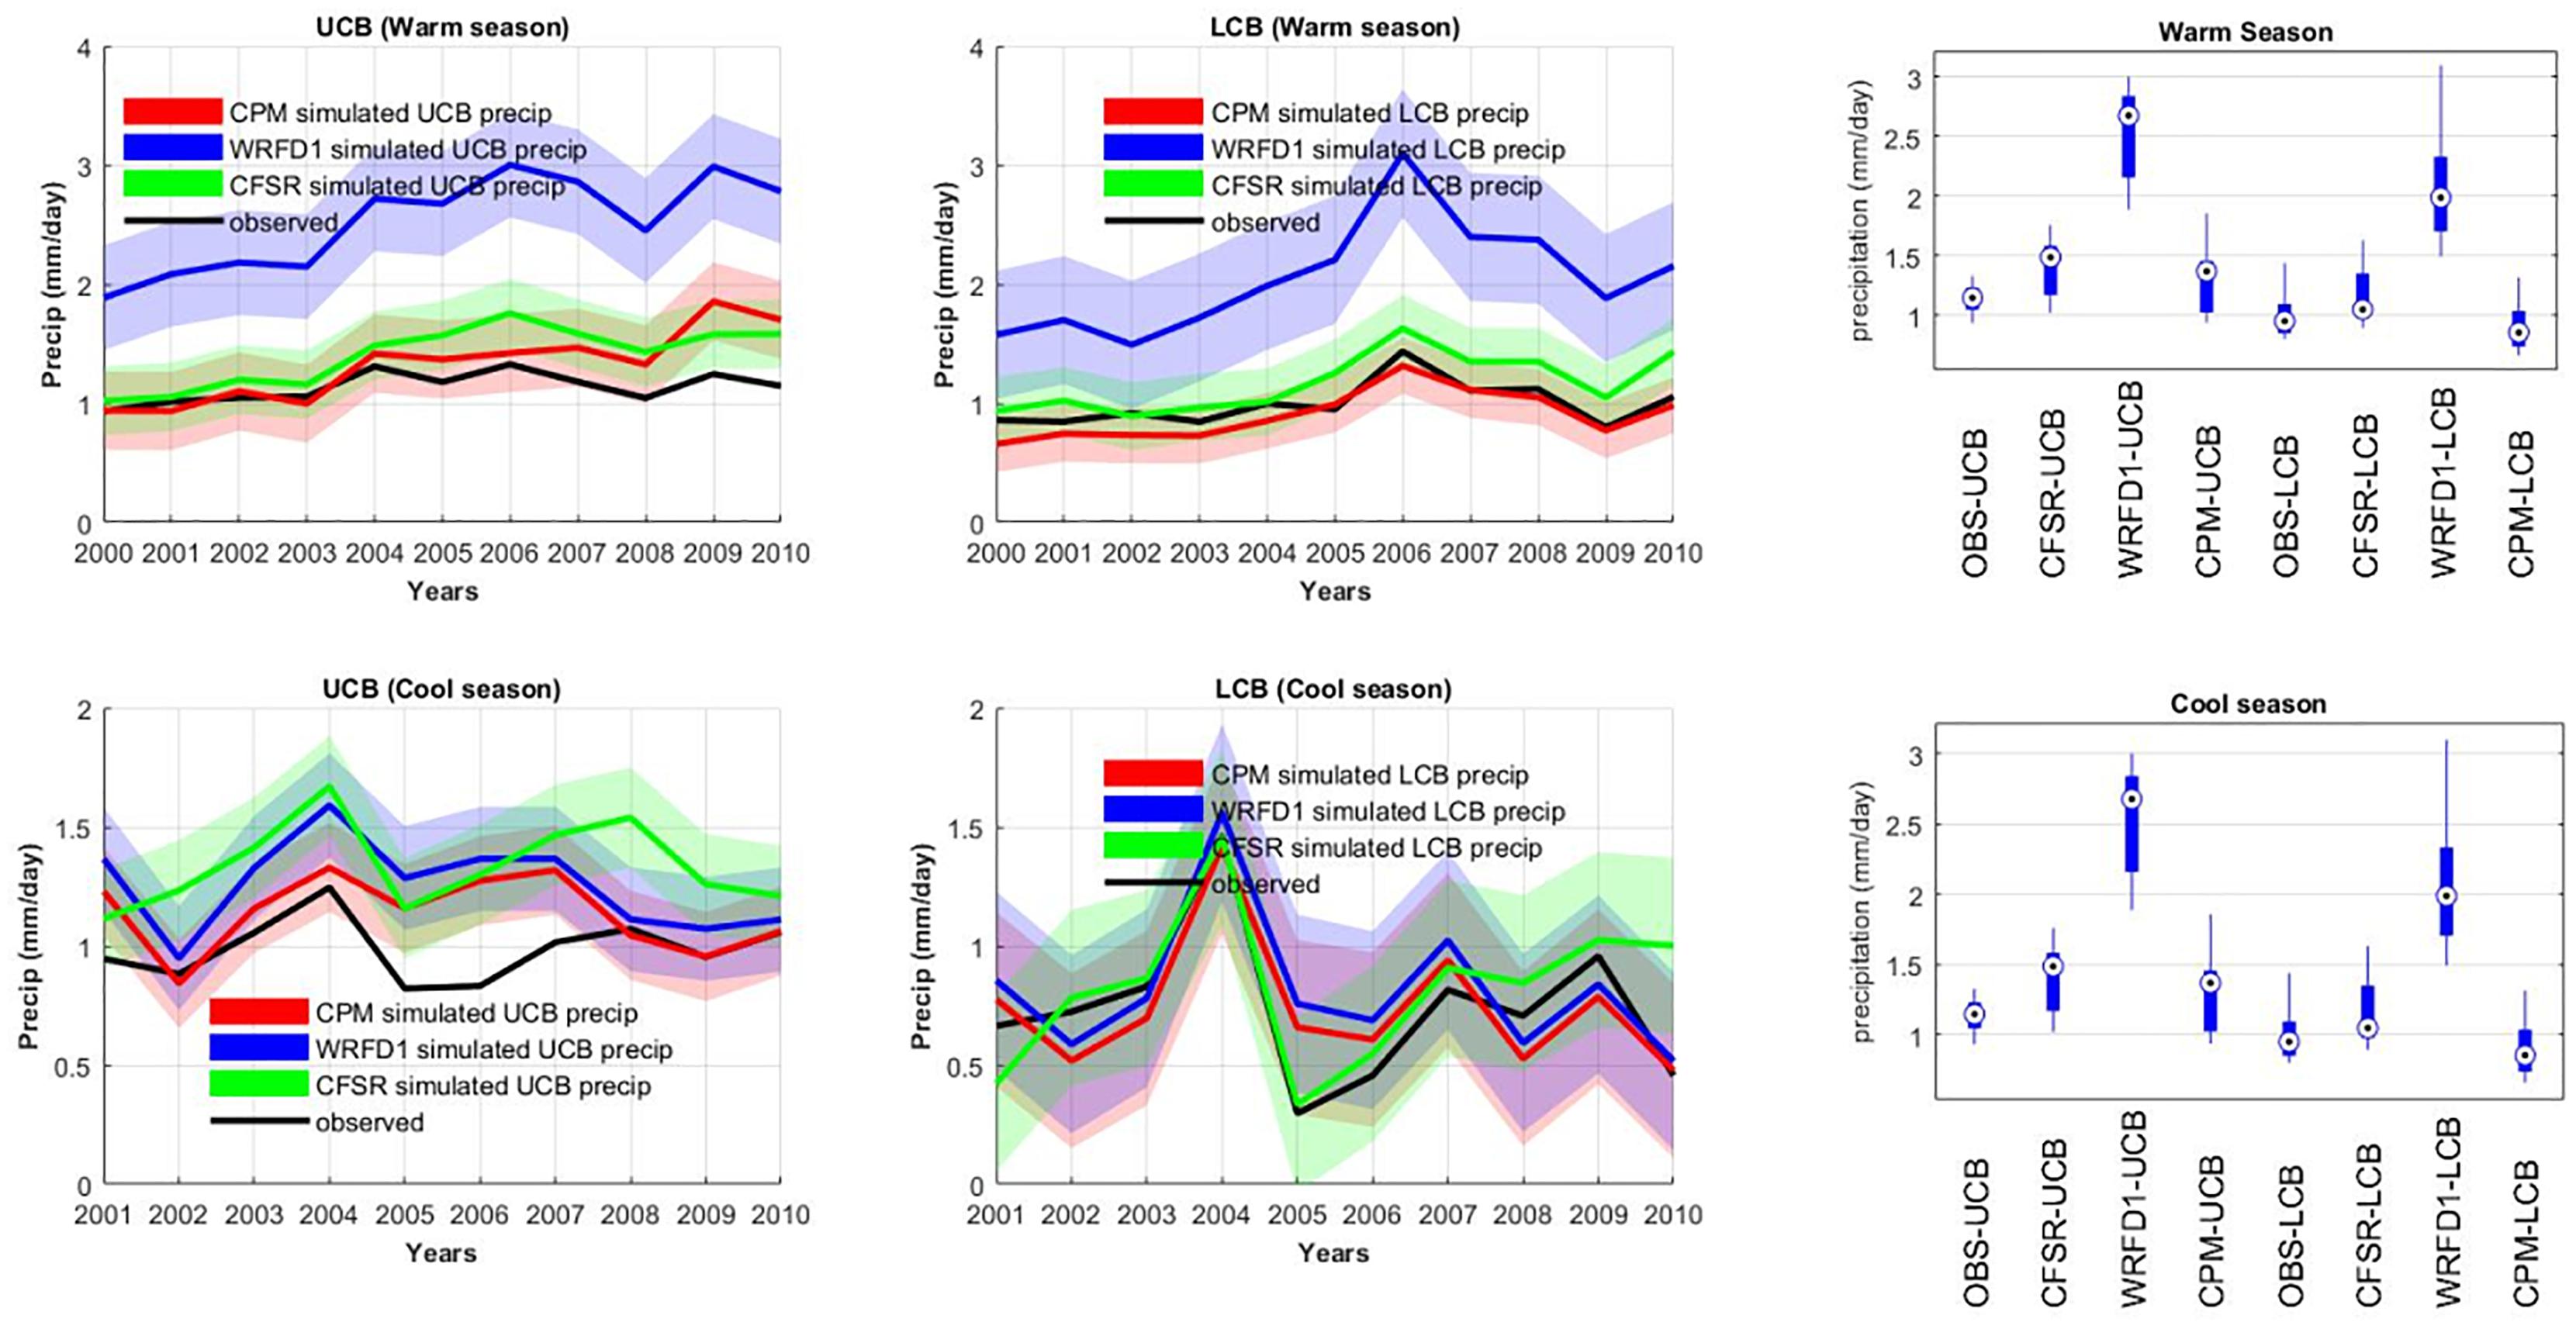
Figure 12. Inter-annual variability of the WRFD1 and CPM precipitation simulations in a regionally (UCB and LCB) and seasonally (warm and cool) averaged framework. Uncertainty bound is calculated using 95% confidence interval of the synthetic 1000 sample bootstrapped prediction set. Upper row illustrates the warm season while lower row shows the results from cool season. Box plots in column 3 shows the more accurate representation of year-to-year variability of precipitation in CPMs when compared to CFSR and WRFD1.
Discussion and Conclusion
Clear evidence shows that CPMs can add value to low-resolution meso-β scale simulations and greater relative improvement is seen in warm season precipitation. During the warm season, an interaction of with the enhanced convective environment, associated with large scale atmospheric circulation patterns and complex terrain, drives the rainfall in the Southwestern United States. So, it can be dynamically characterized by positioning of the Monsoon ridge, upper level disturbances and moisture inflows from the gulf along with the topographic effects. Seasonal precipitation prediction in the Southwest using dynamical atmospheric modeling requires accurate representation of deep convection, here assessed in terms of the timing of the climatological diurnal cycle of summer precipitation, seasonal mean and extremes as well as inter-annual variability. Improvements were found in representation of both seasonal mean and extreme precipitation. The correct spatial distribution of daily rainfall in CPMs is likely associated with the improvement in the dynamics of deep convection during JJAS as well as realistic representation regional features like orographic uplift.
Our results agreed with previous findings from Prein et al. (2013a, 2013b) regarding CPM. Along with the mean precipitation, an improvement of the extreme precipitation rates in the winter and warm season in the CPMs clearly indicates an added value in mountainous region because of the impact of accurately resolved orography in complex terrain. In addition, in the cool season the synoptic-scale flow is more important than in the warm season, because it suppresses the influence of local-scale processes on precipitation. Any improvement in the winter precipitation forecasts would be more attributable to skillful forecasting of the modes of climate variability governing the synoptic-scale circulation. A limitation of this study is the relatively small sizes of the CPM domains (Figure 1) which are spread across ∼1000 km (East-West) and ∼900 km (North-South) in the upper Colorado Basin and ∼1000km (East-West) ∼700 km (North-South) in the lower Colorado Basin. The boundary conditions from the 12 km simulations have a strong influence on the CPMs, especially in the situations with dominant large-scale weather patterns, which occur more frequently in winter. In such situations, the CPM simulations have a limited degree of freedom and are highly influenced by the solution of their parent simulations. However, despite these factors our CPM simulations performed well in both the seasons. CPMs represent variability at the inter-annual time scale, which is extremely important in a region like Southwest where summer precipitation variability is influenced by large-scale teleconnections (Ciancarelli et al., 2013). This method is therefore highly recommended for seasonal prediction in the context of a dynamical modeling system. In addition, due to high computational expense, only one ensemble member was generated for each basin and synthetic simulations were generated to quantify the uncertainty (see section “Skill, Reliability, and Uncertainty”). Despite this, useful insight was gained on the value added of CPM in warm season precipitation.
Quantifying the maximum potential forecast improvement, namely by downscaling retrospective CFSv2 reforecast simulations, remains a subject for ongoing and future research. This methodology is capable of capturing the complex spatial patterns of mean and extreme precipitation, especially in the Southwestern United States, and is also would be fully transferable to other geographic regions that experience convection in complex topography.
The value added of the methodology, to represent the spatial variability, is highly critical for impact assessment, which demands reasonable skill over a much finer resolution within a local region. At such a local scale, the regional effects like topography control spatial variability. Therefore, a framework that captures such regional effects can provide realistic downscaled output, useful for impact assessment studies. The enriched fine scale structure of precipitation can be significantly advantageous for impact studies which deals with small-scale problems like small watersheds, accurate streamflow, or flash flood prediction. Accurate representation of the intensity, location and spatial extent of severe precipitation events is important for such applications (Prein et al., 2013a). However, modeled temperature has a warm bias and regional climate model products still overestimate the summer and fall Southwest precipitations, consistent with the study by Liu et al., 2017 on dynamical downscaling.
There are important broader implications of this study relevant for improved S2S prediction. Anticipating extreme precipitation, at sub-seasonal lead time of 2–4 weeks, has been emphasized in the IPCC’s Managing the Risks of Extreme Events and Disasters to Advance Climate Change Adaptation (SREX). As some reforecast S2S models have the necessary sub-daily information to provide boundary forcing to a convection-permitting RCM, and with new seasonal reforecast data availability, it is technically feasible to apply CPMs at seasonal timescales to deterministically characterize the model forecast skill of extreme precipitation events over a long-term retrospective climatology, essentially extending the same numerical modeling paradigm that is presently applied to operational weather prediction.
Data Availability
The datasets generated for this study are available on request to the corresponding author.
Author Contributions
SP, H-IC, and CC worked together to share and discuss ideas. SP and H-IC worked together to prepare plots and writing. H-IC was in charge of the model simulation. CC and FD contributed to this research by exploring data, making useful observations, and providing new aspects for seasonal prediction of critical atmospheric variables using CPM simulations.
Funding
This study was funded by the University of Arizona Transboundary Aquifer Assessment Program (TAAP), authorized by Public Law 109–448, along with the University of Arizona Technology and Research Initiative Fund (TRIF). Additional support for SP was provided by the Department of Atmospheric Sciences, University of Illinois. Support for H-IC, CC, and publication of this manuscript was provided by the King Abdullah University of Science and Technology, sub-award agreement OSR-2018-CRG7-3706.2.
Conflict of Interest Statement
The authors declare that the research was conducted in the absence of any commercial or financial relationships that could be construed as a potential conflict of interest.
Acknowledgments
The authors thank Dr. Jing-Jia Luo for his editorial guidance and the two reviewers for their comments who helped to improve the manuscript.
Supplementary Material
The Supplementary Material for this article can be found online at: https://www.frontiersin.org/articles/10.3389/feart.2019.00011/full#supplementary-material
Footnotes
- ^ Defined as the ratio of precipitation to incoming water vapor flux.
References
Adams, D. K., and Comrie, A. C. (1997). The North American Monsoon. Bull. Amer. Meteor. Soc. 78, 2197–2213. doi: 10.1175/1520-0477(1997)078<2197:TNAM>2.0.CO;2
Adams, D. K., Minjarez, C., Serra, Y., Quintanar, A., Alatorre, L., Granados, A., et al. (2014). Mexican GPS tracks North American monsoon convection. Eos Trans. Amer. Geophys. Union 95, 61–62. doi: 10.1002/2014EO070001
Allan, R. P., Liu, C., Zahn, M., Lavers, D. A., Koukouvagias, E., and Bodas-Salcedo, A. (2013). Physically consistent responses of the global atmospheric hydrological cycle in models and observations. Surv. Geophys. 35, 533–552. doi: 10.1007/s10712-012-9213-z
Alsarraf, H., and Broeke, M. V. D. (2015). Using the WRF regional climate model to simulate future summertime wind speed changes over the Arabian Peninsula. J. Climatol. Weather Forecast. 3:144. doi: 10.4172/2332-2594.1000144
Ban, N., Schmidli, J., and Schär, C. (2015). Heavy precipitation in a changing climate. Does short-term summer precipitation increase faster? Geophys. Res. Lett. 42, 1165–1172. doi: 10.1002/2014GL062588
Carbone, R. E., Tuttle, J. D., Ahijevych, D. A., and Trier, S. B. (2002). Inferences of predictability associated with warm season precipitation episodes. J. Atmos. Sci. 59, 2033–2056. doi: 10.1175/1520-0469(2002)059<2033:IOPAWW>2.0.CO;2
Castro, C. L., Chang, H.-I., Dominguez, F., Carrillo, C., Schemm, J.-K., and Juang, H.-M. H. (2012). Can a regional climate model improve the ability to forecast the North American Monsoon? J. Clim. 2, 8212–8237. doi: 10.1175/JCLI-D-11-00441.1
Castro, C. L., Pielke, R. A., and Leoncini, G. (2005). Dynamical downscaling: assessment of value retained and added using the Regional Atmospheric Modeling System (RAMS). J. Geophys. Res. 110:D05108. doi: 10.1029/2004JD004721
Chang, H.-I., Castro, C. L., Carrillo, C. M., and Dominguez, F. (2015). The more extreme nature of U.S. warm season climate in the recent observational record and two “well-performing” dynamically downscaled CMIP3 models. J. Geophys. Res. Atmos. 120, 8244–8263. doi: 10.1002/2015JD023333
Ciancarelli, B., Castro, C. L., Woodhouse, C., Dominguez, F., Chang, H., and Carrillo, C. (2013). Dominant pattern of U.S. warm seasonprecipitation variability in a fine resolution observational record with focuson the southwest. Int. J. Climatol. 34, 687–707. doi: 10.1002/joc.3716
Coumou, D., Petoukhov, V., Rahmstorf, S., Petri, S., and Schellnhuber, H. J. (2014). Quasi-resonant circulation regimes and hemispheric synchronization of extreme weather in boreal summer. Proc. Natl. Acad. Sci. U.S.A. 111, 12331–12336. doi: 10.1073/pnas.1412797111
Croci-Maspoli, M., Schwierz, C., and Davies, H. C. (2007). A multi-facetedclimatology of atmospheric blocking and its recent linear trend. J. Clim. 20, 633–649. doi: 10.1175/JCLI4029.1
Daly, C., Gibson, W., Doggett, M., and Smith, J. (2005). The Near Real Time Monthly High Resolution Precipitation Climate Data Set for the Conterminous United States, Spatial Climate Analysis Service. Corvallis, OR: Oregon State University.
Daly, C. R., Neilson, P., and Phillips, D. L. (1994). A statistical-topographic model for mapping climatological precipitation over mountainous terrain. J. Appl. Meteor. 33, 140–158. doi: 10.1175/1520-0450(1994)033<0140:ASTMFM>2.0.CO;2
Ding, Q., and Wang, B. (2005). Circumglobal teleconnection in the NorthernHemisphere summer. J. Clim. 18, 3483–3505. doi: 10.1175/JCLI3473.1
Dudhia, J. (2012). Overview of WRF Physics. Available at: http://www2.mmm.ucar.edu/wrf/users/tutorial/201401/Physics_full.pdf
Eidhammer, T., Grubišiæ, V., Rasmussen, R., and Ikdea, K. (2018). Winter precipitation efficiency of mountain ranges in the Colorado Rockies under climate change. J. Geophys. Res. 123, 2573–2590. doi: 10.1002/2017JD027995
Feng, Z., Leung, L. R., Hagos, S., Houze, R. A., Burleyson, C. D., Balaguru, K., et al. (2016). More frequent intense, and long-lived storms dominate the springtime trend in central US rainfall. Nat. Commun. 7:13429. doi: 10.1038/ncomms13429
Feser, F., Rockel, B., von Storch, H., Winterfeldt, J., and Zahn, M. (2011). Regional climate models add value to global model data: a review andselected examples. Bull. Am. Meteorol. Soc. 92, 1181–1192. doi: 10.1175/2011BAMS3061.1
Fosser, G., Khodayar, S., and Berg, P. (2015). Benefit of convection permitting climate model simulations in the representation of convective precipitation. Clim. Dyn. 44, 45–60. doi: 10.1007/s00382-014-2242-1
Francis, J. A., and Vavrus, S. J. (2012). Evidence linking Arctic amplification to extreme weather in mid-latitudes. Geophys. Res. Lett. 39:L06801. doi: 10.1098/rsta.2014.0170
Holloway, C. E., and Neelin, J. D. (2009). Moisture vertical structure, column water vapor, and tropical deep convection. J. Atmos. Sci. 66, 1665–1683. doi: 10.1175/2008JAS2806.1
Hsu, P.-C., Li, T., and Wang, B. (2011). Trends in global monsoon area and precipitation over the past 30 years. Geophys. Res. Lett. 38:L08701. doi: 10.1029/2011GL046893
Janowiak, J. E., Dagostaro, V. J., Kousky, V. E., and Joyce, R. J. (2007). An examination of precipitation in observations and model forecasts during NAME with emphasis on the diurnal cycle. Clim. J. 20, 1680–1692. doi: 10.1175/JCLI4084.1
Kendon, E. J. (2016). Do convection-permitting regional climate models improve projections of future precipitation change? Bull. Am. Meteorol. Soc. 98, 79–93. doi: 10.1175/BAMS-D-15-0004.1
Kirtman, B. P., Dughong, M., Johnna, M., Infanti, J. L., Kinter, D. A., Paolino, Q. Z., et al. (2014). The North American multimodel ensemble: phase-1 seasonal-to-interannual prediction; phase-2 toward developing intraseasonal prediction. Bull. Am. Meteorol. Soc. 95, 585–601. doi: 10.1175/BAMS-D-12-00050.1
Leung, L., and Gao, Y. (2016). Regional downscaling of S2S prediction: Past lessons and future prospects. US Clivar Var. 14, 13–17.
Leung, L. R., Qian, Y., and Bian, X. (2003a). Hydroclimateof the western United States based on observation and regional climate simulation of 1981–2000. Part I: seasonal statistics. J. Clim. 16, 1892–1911. doi: 10.1175/1520-0442(2003)016<1892:HOTWUS>2.0.CO;2
Leung, L. R., Qian, Y., Bian, X., and Hunt, A. (2003b). Hy-droclimate of the western United States based on observation and regional climate simulation of 1981–2000. Part II: mesoscale ENSO anomalies. J. Clim. 16, 1912–1928. doi: 10.1175/1520-0442 (2003)016<1912:HOTWUS>2.0.CO;2
Lin, Y., and Mitchell, K. E. (2005). “The NCEP stage II/ IV hourly precipitation analyses: development and applications,” in Proceedings of the 19th Conference on Hydrology (San Diego, CA: Amer. Meteor. Soc.
Liu, C., Ikeda, K., Rasmussen, R., Barlage, M., Newman, A. J., Prein, A. F., et al. (2017). Continental-scale convection-permitting modeling of the current and future climate of North America. Clim. Dyn. 49, 71–95. doi: 10.1007/s00382-016-3327-9
Luong, T. M., Castro, C. L., Chang, H.-I., Lahmers, T., Adams, D. K., and Ochoa-Moya, C. A. (2017). The more extreme nature of North American monsoon precipitation in the southwestern United States as revealed by a historical climatology of simulated severe weather events. J. Appl. Meteor. Climatol. 56, 2509–2529. doi: 10.1175/JAMC-D-16-0358.1
Manzanas, R., Gutiérrez, J. M., Fernández, J., van Meijgaard, E., Calmanti, S., Magariño, M. E., et al. (2017). Dynamical and statistical downscaling of seasonal temperatureforecasts in Europe: added value for user applications. Clim. Serv. 9, 44–56. doi: 10.1016/j.cliser.2017.06.004
Mass, C. F., and Ovens, D. (2013). “Strange linear features in WRF clouds and precipitation: diagnosis and correction,” in Proceedings of the 14th Annual WRF Users’ Workshop, Boulder, CO.
Meehl, G. A., Zwiers, F., Evans, J., Knutson, T., Mearns, L., Whetton, P., et al. (2000). Trends in extreme weather and climate events: issues related to modelling extremes in projections of future climate change. Bull. Am. Meteorol. Soc. 81, 427–436. doi: 10.1175/1520-0477(2000)081<0427:TIEWAC>2.3.CO;2
Miguez-Macho, G., Stenchikov, G. L., and Robock, A. (2005). Regional climate simulations over North America: interaction of local processes with improved large-scale flow. J. Clim. 18, 1227–1246. doi: 10.1175/JCLI3369.1
Min, S. K., Zhang, X. B., Zwiers, F. W., and Hegerl, G. C. (2011). Human contribution to more-intense precipitation extremes. Nature 470, 378–381. doi: 10.1038/nature09763
Minjarez-Sosa, C. M., Castro, C. L., Kenneth, C., Cummins, L., Krider, E., and Waissmann, P. J. (2012). Toward development of improved QPE in complex terrain using cloud-to-ground lightning data: a Case Study for the 759 2005 Monsoon in Southern Arizona. J. Hydrometeor. 13, 1855–1873. doi: 10.1175/JHM-D-11-0129.1
Mitchell, E. K., Lohmann, D., Houser, P. R., Wood, E. F., Schaake, J. C., Robock, A., et al. (2004). The multi-institution North American Land Data Assimilation System (NLDAS): utilizing multiple GCIP products and partners in a continental distributed hydrological modeling system. J. Geophys. Res. 109:D07S90. doi: 10.1029/2003JD003823
Murphy, A. H., and Winkler, R. L. (1992). Diagnostic verification of probability forecasts. Int. J. Forecast. 7, 435–455. doi: 10.1016/0169-2070(92)90028-8
Nesbitt, S. W., Gochis, D. J., and Lang, T. J. (2008). The diurnal cycle ofclouds and precipitation along the Sierra Madre occidental observed during NAME-2004 : implications for warm season precipitation estimation incomplex terrain. J. Hydromet. 9, 728–743. doi: 10.1175/2008JHM939
O’Gorman, P. A., and Schneider, T. (2009). The physical basis for increases in precipitationextremes in simulations of 21st-century climate change. Proc. Natl Acad. Sci. U.S.A. 106, 14773–14777. doi: 10.1073/pnas.0907610106
Prein, A. F., Gobiet, A., Suklitsch, M., Truhetz, H., Awan, N., Keuler, K., et al. (2013a). Added value of convection permitting seasonal simulations. Clim. Dyn. 41, 2655–2677. doi: 10.1007/s00382-013-1744-6
Prein, A. F., Holland, G. J., Rasmussen, R. M., Done, J., Ikeda, K., Clark, M. P., et al. (2013b). Importance of regional climate model gridspacing for the simulation of heavy precipitation in the Colorado headwaters. J. Clim. 26, 4848–4857. doi: 10.1175/JCLI-D-12-00727.1
Prein, A. F., Langhans, W., Fosser, G., Ferrone, A., Ban, N., Goergen, K., et al. (2015). A review on regional convection-permitting climate modeling: demonstrations, prospects, and challenges. Rev. Geophys. 53, 323–361. doi: 10.1002/2014RG000475
Raman, A., Arellano, A. F., and Brost, J. J. (2014). Revisiting haboobs in the southwestern 769 United States: an observational case study of the 5 July 2011 Phoenix dust storm. 770 Atmos. Environ. 89, 179–188. doi: 10.1016/j.atmosenv.2014.02.026
Reports to the Nation (2004). The North American Monsoon on Our Changing Planet. Available at: https://www.cpc.ncep.noaa.gov/products/outreach/Report-to-the-Nation-Monsoon_aug04.pdf
Rockel, B., Castro, C. L., Pielke, S. R., von Storch, H., and Leoncini, G. (2008). Dynamical downscaling: assessment of model system dependent retained and added variability for two different regional climate models. J. Geophys. Res 113:D21107. doi: 10.1029/2007JD009461
Salvi, K., Ghosh, S., and Ganguly, A. R. (2015). Credibility of statistical downscaling under nonstationary climate. Clim. Dyn. 46, 1991–2023. doi: 10.1007/s00382-015-2688-9
Salvi, K., Villarinia, G., and Vecchib, G. A. (2017). High resolution decadal precipitation predictions over the continental United States for impacts assessment. J. Hydrol. 553, 559–573. doi: 10.1016/j.jhydrol.2017.07.043
Screen, J. A., Simmonds, I., Deser, C., and Tomas, R. (2013). The atmospheric response to three decades of observed sea ice loss. J. Clim. 26, 1230–1248. doi: 10.1175/JCLI-D-12-00063.1
Sheppard, P. R., Comrie, A. C., Packin, G. D., Angerbach, K., and Hughes, M. K. (2002). The climate of the southwest. Clim. Res. 21, 219–238. doi: 10.3354/cr021219
Shukla, S., Sheffield, J., Wood, E. F., and Lettenmaier, D. P. (2013). On the sources of global land surface hydrologic predictability. Hydrol. Earth Syst. Sci. Discuss. 10, 1987–2013. doi: 10.5194/hessd-10-1987-2013
Skamarock, W. C., Klemp, J. B., Dudhia, J., Gill, D. O., Barker, D. M., and Duda, M. G. (2008). A Description of the Advanced Research WRF 782 Version 2. NCAR Tech Notes-475+STR. Available at: http://opensky.ucar.edu/islandora/object/technotes:500
Trenberth, K. E. (2011). Changes in precipitation with climate change. Clim. Res. 47, 123–138. doi: 10.3354/cr00953
Trenberth, K. E., Dai, A., Rasmussen, R. M., and Parsons, D. B. (2003). The changing character of precipitation. Bull. Ameri. Met. Soc. 84, 1205–1217. doi: 10.1175/BAMS-84-9-1205
Tripathi, O. P., and Dominguez, F. (2013). Effects of spatial resolution in the simulation of daily and subdaily precipitation in the southwestern US. J. Geophys. Res. Atmos. 118, 7591–7605. doi: 10.1002/jgrd.50590
Trusilova, K., Früh, B., Brienen, S., Walter, A., Masson, V., Pigeon, G., et al. (2013). Implementation of an urban parameterization scheme into the regional climate model COSMO-CLM. J. Appl. Meteorol. Climatol. 52, 2296–2311. doi: 10.1175/JAMC-D-12-0209.1
von Storch, H., Langenberg, H., and Feser, F. (2000). A spectral nudging technique for dynamical downscaling purposes. Mon. Wea. Rev. 128, 3664–3673. doi: 10.1175/1520-0493(2000)128<3664:ASNTFD>2.0.CO;2
Wang, B., Liu, J., Kim, H.-J., Webster, P. J., and Yim, S.-Y. (2012). Recent change of the global monsoon precipitation (1979–2008). Clim. Dyn. 39, 1123–1135. doi: 10.1007/s00382-011-1266-z
Wang, W., and Seaman, N. L. (1997). A comparison of convective parameterization schemes in a mesoscale model. Mon. Wea. Rev. 125, 252–278. doi: 10.1175/1520-0493(1997)125<0252:ACSOCP>2.0.CO;2
Wee, T.-K., Kuo, Y.-H., Lee, D.-K., Liu, Z., Wang, W., and Chen, S.-Y. (2012). Two overlooked biases of the Advanced Research WRF (ARW) model in geopotential height and temperature. Mon. Wea. Rev. 140, 3907–3918. doi: 10.1175/MWR-D-12-00045.1
Weusthoff, T., Ament, F., Arpagaus, M., and Rotach, M. W. (2010). Assessing the benefits of convection-permitting models by neighborhood verification: examples from MAP D-PHASE. Mon. Wea. Rev. 138, 3418–3433. doi: 10.1175/2010MWR3380.1
Wyszogrodzki, A. A., Liu, Y., Jacobs, N., Childs, P., Zhang, Y., Roux, G., et al. (2013). Analysis of the surface temperature and wind forecast errors of the NCAR-AirDat operational CONUS 4-km WRF forecasting system. Meteor. Atmos. Phys. 122, 125–143. doi: 10.1007/s00703-013-0281-5
Yang, T., Hao, X., Shao, Q. C.-Y., Zhao, C., Chen, X., and Wang, W. (2012). Multi-model ensemble projections in temperature and precipitation extremes of the Tibetan Plateau in the 21st century, Global Planet. Change 80, 1–13. doi: 10.1016/j.gloplacha.2011.08.006
Keywords: regional climate model, seasonal forecasting, downscaling, precipitation, extremes
Citation: Pal S, Chang H-I, Castro CL and Dominguez F (2019) Credibility of Convection-Permitting Modeling to Improve Seasonal Precipitation Forecasting in the Southwestern United States. Front. Earth Sci. 7:11. doi: 10.3389/feart.2019.00011
Received: 05 November 2018; Accepted: 23 January 2019;
Published: 05 March 2019.
Edited by:
Jing-Jia Luo, Bureau of Meteorology, AustraliaReviewed by:
Venkata Ratnam Jayanthi, Japan Agency for Marine-Earth Science and Technology, JapanChowdary Sriranga Jasti, Indian Institute of Tropical Meteorology (IITM), India
Copyright © 2019 Pal, Chang, Castro and Dominguez. This is an open-access article distributed under the terms of the Creative Commons Attribution License (CC BY). The use, distribution or reproduction in other forums is permitted, provided the original author(s) and the copyright owner(s) are credited and that the original publication in this journal is cited, in accordance with accepted academic practice. No use, distribution or reproduction is permitted which does not comply with these terms.
*Correspondence: Sujan Pal, c3VqYW5wMkBpbGxpbm9pcy5lZHU=