 Jan Eichler1,2*
 Christian Weikusat1
 Anna Wegner1Birthe Twarloh1Melanie Behrens1Hubertus Fischer3Maria Hörhold1Daniela Jansen1Sepp Kipfstuhl1
 Urs Ruth1
 Frank Wilhelms1,4
 Ilka Weikusat1,2
- 1Alfred Wegener Institute Helmholtz Centre for Polar and Marine Research, Bremerhaven, Germany
- 2Department of Geosciences, Eberhard Karls University Tübingen, Tübingen, Germany
- 3Climate and Environmental Physics, Physics Institute and Oeschger Centre for Climate Change Research, University of Bern, Bern, Switzerland
- 4Fakultät für Geowissenschaften und Geographie, Georg-August-Universität Göttingen, Göttingen, Germany
Impurities in polar ice cores have been studied so far mainly for the purpose of reconstructions of past atmospheric aerosol concentrations. However, impurities also critically influence physical properties of the ice matrix itself. To improve the data basis regarding the in-situ form of incorporation and spatial distribution of impurities in ice we used micro-cryo-Raman spectroscopy to identify the location, phase and composition of micrometer-sized inclusions in natural ice samples around the transition from marine isotope stage (MIS) 6 into 5e in the EDML ice core. The combination of Raman results with ice-microsctructure measurements and complementary impurity data provided by the standard analytical methods (IC, CFA, and DEP) allows for a more interdisciplinary approach interconnecting ice core chemistry and ice core physics. While the interglacial samples were dominated by sulfate salts—mainly gypsum, sodium sulfate (possibly thenardite) and iron–potassium sulfate (likely jarosite)—the glacial ice contained high numbers of mineral dust particles—in particular quartz, mica, feldspar, anatase, hematite and carbonaceous particles (black carbon). We cannot confirm cumulation of impurities in the grain boundary network as reported by other studies, neither micro-particles being dragged by migrating grain boundaries nor in form of liquid veins in triple junctions. We argue that mixing of impurities on millimeter scale and chemical reactions are facilitated by the deforming ice matrix. We review possible effects of impurities on physical properties of ice, however the ultimate identification of the deformation agent and the mechanism behind remains challenging.
1. Introduction
Polar ice sheets represent the most direct archives of the past atmosphere. The ice as well as its gas and impurity content originates from snow which once precipitated at the surface, was compacted due to accumulation of new layers, transformed into ice, and further traveled through the ice column. Ice sheets are subject to continuous deformation and flow, which - in case of equilibrium - balances the mass accumulation on the surface with mass loss on the borders. They represent highly dynamic systems which react sensitively to changes in boundary conditions, e.g., temperature, accumulation rate etc. Thus, understanding ice sheet dynamics is of high interest to predict the future ice sheet response in times of changing climate, and is also crucial for correct interpretation of climate signals of the past.
Dissolved and particulate impurities in the ice play an important role for two reasons. On one hand, their concentrations measured in ice cores provide the main basis for reconstructions of the atmospheric aerosol composition in the past but may suffer from redistribution and chemical alteration in the ice. On the other hand, impurities seem to actively affect mechanical properties of ice and cause localized enhanced deformation (Dahl-Jensen, pers. comm.; Paterson, 1991; Jansen et al., 2017). From the very top surface, along the densification process in the firn column down to the deep ice, the interaction of impurities with the physical properties of the snow, firn (Freitag et al., 2013; Fujita et al., 2014) and ice (Paterson, 1991) has been observed, indicating (a) post-depositional changes of the original record, which hampers interpretation with respect to climate reconstruction and (b) changes in deformation rate and the need for a dedicated flow law (Greve, 1997; Placidi et al., 2010). Nevertheless, up to now, neither are the relevant processes understood nor the acting species identified.
The content of impurities in polar meteoric ice is relatively small compared to other polycrystalline materials appearing in nature. Impurities trapped in ice originate from atmospheric aerosols which are a mix of different species with a variety of sources and transport history (Legrand and Mayewski, 1997). The major components are sea salt aerosols from the interaction between the atmosphere, ocean and sea-ice, aeolian dust particles from continental sources, acidic components—mainly sulfate and nitrate, ammonium and other aerosols related to specific events, e.g., carbonaceous aerosols from biomass combustion (often referred to as black carbon) or tephra and volcanic sulfate from volcanic activity. Relative and absolute concentrations in this mixture underlie strong temporal and spatial variations and their analysis can provide information about past climate conditions, circulation patterns and source distributions. Continuous Flow Analysis (CFA) and Ion Chromatography (IC) deliver high-resolution concentration profiles for many impurity components based on meltwater samples. These methods became essential analytical tools in ice core science (Röthlisberger et al., 2000a; Kaufmann et al., 2008).
Impurities present in the polar ice have been long discussed with respect to their impact on the physical properties of the ice. Deformation experiments on doped monocrystalline ice, laboratory-made polycrystals as well as natural samples from ice cores revealed that various species had an enhancing effect on ice creep. However, the impurity concentrations, stresses and time scales in these experiments in general differ significantly from conditions present in nature, as these can hardly be achieved in a laboratory. Paterson (1991) compiled an overview of borehole deformation data and mechanical tests on ice cores and summarized that glacial ice in simple shear deforms on average 2.5 times faster than Holocene ice under the same stress and temperature conditions. He concluded that the higher deformation rates result from the development of strong crystal preferred orientation (CPO) and small grain sizes in glacial ice, which however were produced by high concentrations of impurities—possibly chloride and sulfate ions. The link between impurity content and ice microstructure as main driver for differences in deformation rate was proposed already in earlier studies. This was inspired by the frequently observed finer grain sizes in impurity-rich layers (e.g., Fisher and Koerner, 1986). Alley et al. (1986a,b) derived a theoretical basis of normal grain growth in ice and the effect of extrinsic substances on it. According to their analysis, concentrations of second phase inclusions (i.e., solid particles, micro-droplets etc.) in natural ice are too low to have a significant effect on grain growth via Zener pinning (Smith, 1948). However, Durand et al. (2006) argued that Zener pinning of micro-inclusions was strong enough, if particles would accumulate at grain boundaries due to ongoing migration recrystallization. Nevertheless, such a preferential distribution of micro-inclusions could not be verified as a general case so far (Faria et al., 2010; Eichler et al., 2017). Alley et al. (1986b) concluded that impurities dissolved in grain boundaries would significantly reduce grain boundary mobility (migration rate) even at very low concentrations and thus could have a decisive effect on the grain size. Segregation and solution of ions in grain boundaries was promoted by Wolff and Paren (1984) who suggested that electrical conductivity in ice was due to electrolytic conduction through grain boundaries. High impurity concentrations in grain boundaries and triple junctions would decrease the pressure melting point and lead to melting in veins and thin films along grain boundaries. Rempel et al. (2001) argued for the presence of liquid water in grain boundaries, suggesting that climate signals in ice cores may suffer from gravitational displacement due to anomalous diffusion through the vein network. While this may apply to temperate glaciers with temperatures close to the melting point, the relevance of such anomalous diffusion for ice sheets has not been ascertained for polar ice cores and deserves further investigation.
The above considerations motivate fundamental questions: Which species are abundant in which state (condensed second phase or solution) and what is their location with respect to the lattice and grain boundary network. Do some species (which?) segregate at grain boundaries? Which impurities control deformation rate of ice and in which way? To what extent are impurities in turn affected by the deforming ice? In order to approach these questions analytical techniques dedicated to solid materials became important. Remarkable steps in this direction are the applications of Raman spectroscopy, Energy-dispersive X-ray spectroscopy (EDX) and laser ablation inductively coupled plasma mass spectrometry (LA-ICP-MS) to glacier ice. Each of these methods brings its own specifications and limitations regarding sample preparation, spatial resolution and output data. Thus, the results and interpretations regarding the above questions vary significantly. Several studies reported the presence of dissolved impurities in grain boundaries and triple junctions. Mulvaney et al. (1988) found X-ray spectra of sulfur in triple junctions using EDX. This was supported by Fukazawa et al. (1998), who reported Raman spectra of nitrate and sulfate in triple junctions in ice samples with high acid concentrations. Raman analyses carried out by Ohno et al. (2005, 2006) and Sakurai et al. (2011) on the Dome Fuji ice core revealed that most of the sulfate formed micrometer-sized salt particles, in particular sodium, magnesium and calcium sulfate. However, most of the micro-inclusions were located in the grain interiors. Several EDX studies (Cullen and Baker, 2001; Barnes et al., 2002; Baker, 2003; Barnes, 2003; Iliescu and Baker, 2008) reported traces of sodium, chlorine and sulfur forming filaments at the sublimed ice surface. Some of the filaments grew at sites where grain boundaries and triple junctions intersected the surface. Della Lunga et al. (2014) investigated the location of impurities using LA-ICP-MS. While in impurity-rich layers (cloudy bands) there was no preferential impurity distributions with respect to the grain boundary network, in samples with lower impurity content, some evidence was found for higher impurity concentrations in the neighborhood of grain boundaries. However, LA-ICP-MS does not allow to distinguish between dissolved impurities and second phase inclusions.
Raman spectroscopy, being an optical technique, can acquire Raman spectra from the inner part of the ice sample, typically up to 1 mm below the specimen surface. Thus, surface contamination, sublimation and redistribution of impurities on the surface are irrelevant as long as the quality of the surface allows appropriate focusing of the excitation laser into the sample. The spatial resolution of a Raman microscope is on the order of μm which makes it suitable for measuring micro-inclusions, i.e., second phase inclusions typically of the size of a few μm. In this study we used the cryo-Raman system at the Alfred Wegener Institute Helmholtz Centre for Polar and Marine Research (AWI) to measure statistically relevant numbers of micro-inclusions in three sections from the EDML ice core along the transition from Marine Isotope Stage (MIS) 6 (penultimate glacial) into MIS 5e (last interglacial). The Raman analysis reveals chemical and mineralogical composition of micro-inclusion in a non-destructive way and without a need for melting the ice samples. The combination with microstructure mapping (Kipfstuhl et al., 2006) and impurity mapping (Eichler et al., 2017) increased the efficiency of the Raman measurements and, more importantly, allowed us to study spatial distributions of micro-inclusions at larger scales and in the microstructural context. Qualitative comparison of the Raman results with the IC, CFA and DEP measurements allows us to approach questions regarding the way of incorporation of different impurity species in natural polycrystalline ice. We discuss possible interaction scenarios between impurities and the deforming matrix.
2. Materials and Methods
2.1. Sample Material
We analyzed three 10 cm long ice sections from the EDML ice core (79°00′S, 0°04′E, elevation 2892m.a.s.l., Oerter et al., 2009; Wilhelms et al., 2014) around the transition from the penultimate glacial (MIS 6) into the last interglacial (MIS 5e). Sections 2371-4 and 2371-9 originate from bag 2371 (2370.4 and 2370.9 m below surface) with approximate age of the ice of 129.8 ka (Veres et al., 2013) which corresponds to early MIS 5e. Spatial distributions of visible micro-inclusions in sections 2371-4 and 2371-9 were presented and discussed in Eichler et al. (2017). Section 2392-2 (2391.2 m) is dated to 135.5 ka and thus originates from the end of MIS 6. The in-situ borehole temperature at this depth is around −13°C (Wilhelms et al., 2007) and this lower part of the ice sheet is subject to significant horizontal shear stress (Weikusat et al., 2017). In addition, several jumps in measured characteristics of the ice (grain size, CPO, grain aspect ratio, bore hole geometry) indicate profoundly different rheological behavior of the material in this depth regime. Figure 1 shows grain structures of the three analyzed samples measured on thin sections using an automatic fabric analyzer and digital image processing (Eichler, 2013). The two interglacial samples reveal large grains (mean grain area of 34.3mm2 and 38.7mm2 respectively, with largest grains reaching several cm2) and c-axes distributed in a girdle. In contrast, only 20 meters deeper the MIS 6 sample is characterized by fine grains (mean grain area of 1.6mm2) and a highly developed vertical single maximum in the c-axes distribution. The selected region is thus of key importance to understand the deformation mechanisms and their possible relation to impurities.
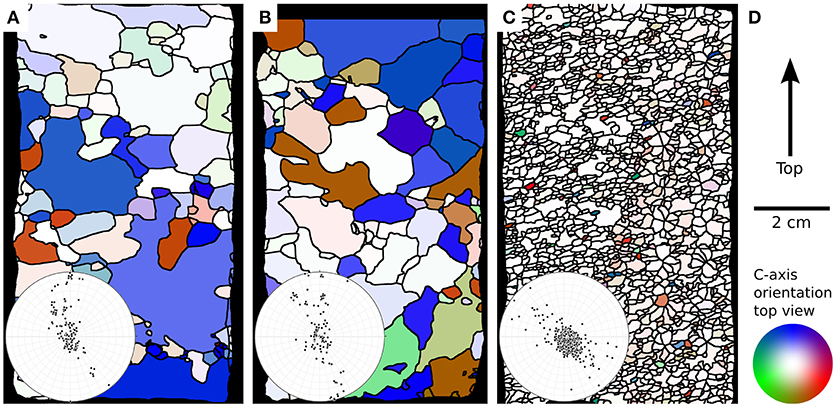
Figure 1. Different grain sizes and c-axis orientations in the three sections selected for Raman analysis. (A) section 2371-4. (B) section 2371-9. (C) section 2392-2. The pole figures represent stereographic projections of the average c-axis orientations (one point per grain) onto the horizontal plane. (D) legend indicating the orientation of the main ice core axis, scale bar and color code for the orientation of c-axes projected onto the horizontal plane. White color indicates c-axis aligned along the ice-core axis (vertical direction).
2.2. Sample Preparation
We used a standard procedure for preparation of thick sections (typical thickness of 5–10 mm) as described by Kipfstuhl et al. (2006). Both, the upper and the lower side of the section are polished in a first step using a microtome. The lower side is frozen to a glass plate using a thin water film. In order to obtain maximal surface quality, the sample sublimates for several hours under controlled temperature and humidity conditions. This way microtome scratches and other disturbances erase from the surface while grain-boundary grooves become more distinctive and easier to detect. The very clear surface obtained by this sublimation polishing is inevitable as it enables us to (1) locate the micro-inclusions inside the sample volume in order to produce impurity maps for Raman measurements and (2) as a prerequisite to obtain high-quality Raman signals.
2.3. Micro-Inclusions
Micro-inclusions are micrometer-sized dust particles, salts and droplets trapped in the ice matrix. They seem to be the most common form of impurity incorporation in cold ice, since ice, other than liquid water, is a bad solvent and rejects most substances from its lattice. The condensed phase and size of micro-inclusions are favorable for the application of light microscopy and Raman spectroscopy to localize them and to record their characteristic Raman spectra. We use a light microscope with an automatic x-y-stage (Kipfstuhl et al., 2006) to generate large area maps of micro-inclusions. The impurity maps of sections 2371-4 and 2371-9 were previously presented and discussed in Eichler et al. (2017). In this study we used these maps to locate the previously found micro-inclusions with the confocal Raman microscope and acquire their Raman spectra. This approach is particularly efficient in samples with relatively low impurity concentrations (2371-4 and 2371-9). Here the search for micro-inclusions using the Raman system alone would be very tedious. The combination of these two methods also enables us to put the recorded Raman spectra in a larger spatial context, i.e., to study the distribution of different spectra along the distance of several millimeters to centimeters.
2.4. Cryo-Raman
The Raman effect refers to inelastic scattering of light due to excitation of vibrational modes of molecules or crystals. This leads to a loss of the scattered light energy—the Raman shift—which is specific for each vibrational mode. Raman spectroscopy offers a unique analytical tool to analyze chemical impurities in a non-destructive way. Being an optical technique it is best suited to be applied to light-transparent materials—such as ice. In combination with confocal optics the excitation laser can be focused into a specimen's volume segment as small as a few μm3, typically up to 1 mm below the sample surface. This is a clear advantage over surface-analytical methods, since many disturbing factors can be neglected, such as surface pollution and possible reactions and rearrangements of trace elements due to processes at the surface or during melting or sublimation. The backscattered light is collected with the same confocal optics and conducted into the spectrometer in order to resolve its spectral distribution. The probability for a photon to be Raman-scattered is very low compared to elastic scattering (about 10−7). Thus, high incident light intensities, long integration times and sufficient concentrations of the analyzed matter are needed. Since the laser power is limited in order to avoid melting, precise focusing and high quality of the prepared sample surface are the determining factors to obtain a discernible spectrum.
The sizes of micro-inclusions in ice are typically close to the optical resolution limit and they appear as single dots with different shading on the image background. This makes estimations of their shapes and volumes on the basis of the micro-photographs hardly possible. Thus, the Raman spectra deliver a rather qualitative information about the impurity content without any access to their absolute concentrations. Ice itself is also Raman-active so that ice spectrum is always superimposed on the actual impurity spectra (Figure S1). In general, the characteristic impurity peaks are well distinguishable from the ice signal, however spectral regions with very strong ice-vibrational bands are somewhat “hidden.” This applies especially for the O–H vibrations of the ice molecules which can cover the O–H signal of various hydrates. Luckily, the O–H vibrations in minerals are often very strong and shifted to higher frequencies (e.g., gypsum), so that they can be distinguished from the ice signal. In addition, not all molecules exhibit Raman-active vibrational modes at all. The most relevant case here is NaCl being the main part of sea salt and thus present in relatively high concentrations in polar ice. Due to the selection rules all the vibrational transitions are forbidden and thus photons scatter only elastically. NaCl is therefore Raman-inactive and cannot be identified using Raman spectroscopy.
The Raman system used in this study is a WITec alpha 300 M+ combined with a NdYAG laser (λ = 532nm) and a UHTS 300 spectrometer with a 600 grooves mm−1 grating. A more detailed description of the system can be found in Weikusat et al. (2015). The excitation laser, spectrometer and control unit are at room temperature, while the microscope unit is placed in the cold laboratory at −15°C and connected through fiber optics. The laboratory temperature is close to the in-situ borehole temperature so that phase transitions due to different eutectic temperatures are avoided. Furthermore, this setup enables to perform sample preparation in the same cold room where the microscope is placed. This is a clear advantage over the use of a cryo-cell since exposure of samples to temperature gradients and moisture can be completely avoided. Only in this way the carefully prepared sample surface can be preserved during mounting on the microscope stage and protected from moisture deposition.
2.5. DEP, CFA, and IC
For the comparison with the Raman results, we here present impurity concentration, conductivity and particle concentration measurements from the EDML deep ice core from 2370 to 2394 m depth. Dielectric profiling (DEP) conductivity was measured continuously along whole core sections (data published here for the first time). Electrolytic conductivity, Ca2+ concentration and number of particles were measured continuously in millimeter resolution during the EPICA Dronning Maud Land (EDML) campaign using continuous flow analysis (CFA). Parts of the particle-concentration dataset have been published in Wegner et al. (2015), the conductivity and Ca2+ profiles are presented here for the first time. Due to dispersion in the CFA system the nominal resolution of the data is about 1 cm. Using sample fractions from the CFA, the ion concentrations of Na+, Cl−, Mg2+, Ca2+, and were measured discretely with ion chromatography (IC) at AWI Bremerhaven (data presented here for the first time).
DEP measures the electrical conductivity on ice cores continuously and non-destructively. The instrument consists of two aluminum shells as capacitors, acting as electrodes. An electric field is generated across the ice core diameter from which the real and imaginary part of the relative permittivity is obtained and the latter converted into conductivity (Wilhelms et al., 1998). The genesis of the DEP signal has been discussed previously (e.g., Moore et al., 1992).
CFA is a contamination-free, high resolution method to gain information about impurity concentrations in ice cores. A cross section of the ice core is melted on a heated metal block where only the inner part of the ice is analyzed in sensors downstream of the melt flow. The CFA system used in this study was developed at the University of Bern and is described in detail elsewhere (Röthlisberger et al., 2000a; Kaufmann et al., 2008). Precision of the CFA measurements is typically better than 10 % for the entire studied concentration range, due to the completely contamination-free sampling of the CFA analysis. Here we present the continuous high-resolution data of dissolved Ca2+, electrical conductivity and the amount of undissolved particles (Wegner et al., 2015). Sample fractions were collected in 5 cm resolution for further discrete analysis with IC.
Ion chromatography is commercially available and well established for the measurement of ions in ice cores (Wolff et al., 2006; Fischer et al., 2007; Ruth et al., 2008). For this study a Dionex IC2100 system was used. Anion measurements were conducted with a potassium hydroxide (KOH) eluent using a Dionex AS 18 (2 mm) separation column. A methane sulfonate (MSA−) eluent was used to conduct the cation measurements using a Dionex CS12a (2 mm) separation column. The uncertainty of the IC analysis is estimated to be better then 5 %, the reproducibility was estimated to be better than 10 % for glacial concentrations, however, can deteriorate at low concentrations, e.g., interglacial Ca2+ (Fischer et al., 2007; Ruth et al., 2008).
3. Results
3.1. IC, CFA, and DEP
Figure 2 compares various impurity signals within a 24 m long profile (2370–2394 m) along the transition between MIS 5a and MIS 6, which includes bags 2371 and 2392. The first panel compares electrical conductivities measured by DEP (blue) and CFA (black). Both signals represent a total contribution of all impurities, however each of them is formed due to different physical processes. While electrolytic conductivity in the meltwater (CFA) is a function of the amount of dissolved ions, the electric charge transfer in ice (DEP) is governed by protonic defects and their mobility through the crystal (Jaccard theory). This must be taken into account in order to explain the different behavior along the transition. While CFA conductivity shows an increase of a factor 2-3 in the MIS 6 part in line with the higher ion concentrations, the DEP conductivity keeps average values similar to MIS 5e. Both electrical conductivities correlate relatively well on the centimeter scale. However the CFA signal shows strong peaks on the millimeter to centimeter scale which are not reflected in the DEP signal. In some cases the DEP conductivity even shows an anti-correlating behavior. These narrow peaks, which only occur in the electrolytic conductivity, are clearly an effect of impurities dissolved in the meltwater (possibly Ca2+), which however in the frozen state do not contribute to the dielectric properties.
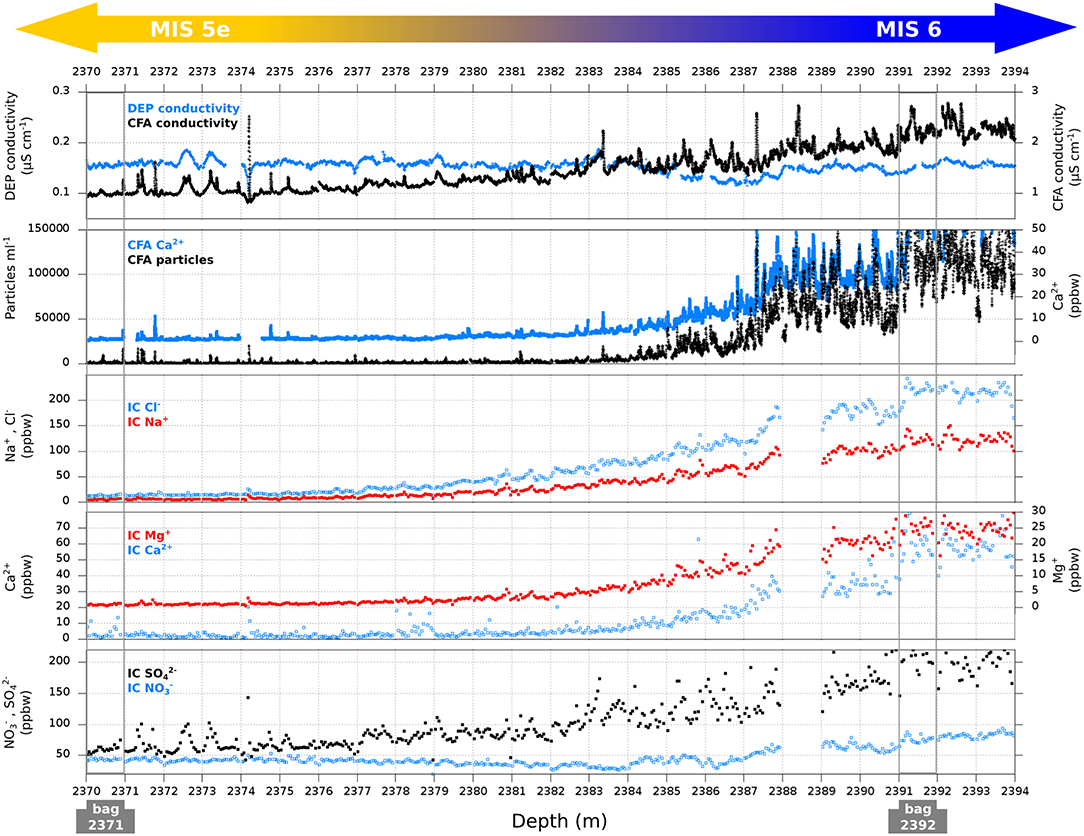
Figure 2. DEP, CFA, and IC data along the transition between MIS 5a and MIS 6 (2370–2394 m). The positions of bags 2371 and 2392 are marked. The concentrations of solid particles have been previously presented by Wegner et al. (2015), all other datasets are presented here for the first time.
The climatic transition is characterized by a gradual change in the concentration of virtually all relevant impurity components. Insoluble dust (CFA, number of particles per ml of meltwater) is the most prominent example showing the highest contrast between the glacial and interglacial part. While in the upper part (MIS 5e) the number of particles oscillates roughly around 1.5·103ml−1 with highest peaks reaching 1.5·104ml−1, average concentrations of 1.3·105ml−1 and peaks with 2.5·105ml−1 are reached below the transition. This represents an increase of two orders of magnitude and is consistent with previous reports (Wegner et al., 2015). The CFA Ca2+ shows a similar signal as the CFA dust with well correlated peaks. This suggests that major parts of calcium are of non-sea salt origin (nssCa) as discussed further below, and shares similar sources and transport paths with aeolian dust. The CFA and IC results are in a good agreement and the difference in Ca2+ concentration above and below the transition is approximately one order of magnitude.
The six main ions measured by IC are Cl−, Na+, Mg2+, Ca2+, and (lower three panels of Figure 2). All IC signals show a concentration increase toward MIS 6, however with varying slopes. The major sea salt components Cl−, Na+ and Mg2+ correlate with each other and the contrast between MIS 5e and MIS 6 concentration is around a factor of 20 (see Table 2). The shows a variable signal. The most prominent peaks correlate with peaks in the DEP conductivity, as expected from earlier studies (Moore et al., 1991). The concentration of rises by a factor 4 across the climatic transition. In contrast the concentration reveals a relatively stable signal (around 40 ppbw in MIS 5e) without any significant peaks and a concentration increase by only a factor 2 across the transition.
3.2. Raman Results
We analyzed in total 290 micro-inclusions within the three measured samples. The Raman spectra of 183 (63 %) micro-inclusions could be identified using reference spectra. 12 (4 %) micro-inclusions showed Raman spectra which could not be identified. In 19 (7 %) cases the signal was disturbed by strong luminescence and 76 (26 %) micro-inclusions showed no signal at all. In order to maximize the signal-to-noise ratio we varied the integration time typically between 2.5 and 5 seconds per accumulation and the number of accumulations between 10× and 20×. However, the total acquisition time per micro-inclusion was limited by the cumulative heating of the particles, which would in extreme cases cause local melting or even destruction of the particles.
Table 1 presents the identified impurity species and their absolute numbers in the three analyzed sections. We can differentiate between a group of numerous sulfates vs. other minerals often called mineral dust. Most spectra in this group are the three silicates: quartz, mica and feldspar. We also identified a few iron oxides and titanium oxides (hematite, anatase), which also contribute to this group. Carbonaceous particles have been found in form of pure graphite as well as carbon-sulfate mix.
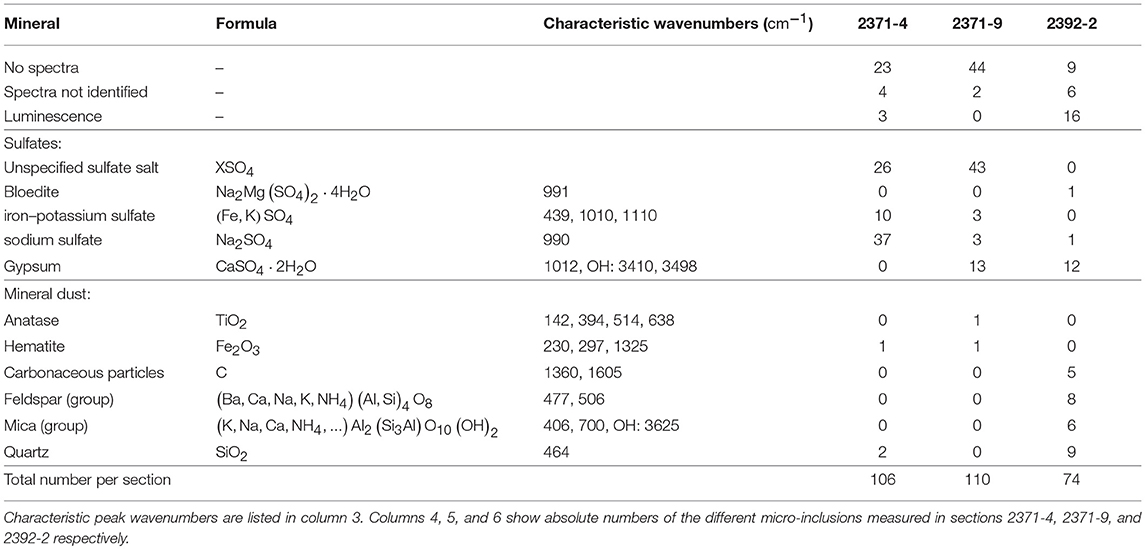
Table 1. Raman spectra of micro-inclusions detected in the analyzed ice sections.
Sulfate particles are relatively easy to detect due to the intense ν1 vibrational mode of the SO4 molecule. However, further determination of exact specie depends on the quality of the spectra. Thus, a significant number of sulfate inclusions could not be further specified and are referred to as unspecified sulfates. Within the fully identified sulfate spectra, sodium sulfate (possibly thenardite, Na2SO4) and gypsum (CaSO4·2H2O) represent the most abundant species. Another frequently observed spectrum showed a very good match with the reference spectra of jarosite ((Fe, K)SO4).
Figure 3 shows the relative occurrence of the identified species within all three samples. There is a clear difference between ice from the warm period (2371-4 and 2371-9) and the glacial ice (2392-2). First, impurity concentrations from the cold period are much higher than in warm-period ice. In the case of dust concentration this implies to a factor 100 more particles in glacial ice. Second, two thirds of micro-inclusions in the glacial sample are insoluble dust particles and one third are sulfates - mainly gypsum particles. In contrast, the warm period ice contains around 96% sulfate inclusions and only a minimal fraction, around 4%, of insoluble dust. The most frequent species in 2371-4 is Na2SO4 followed by the group of unspecified sulfates. In 2371-9, unspecified sulfates are most prevalent, followed by gypsum particles (CaSO4·2H2O). Representative examples of the different Raman spectra are shown in Figure S2.
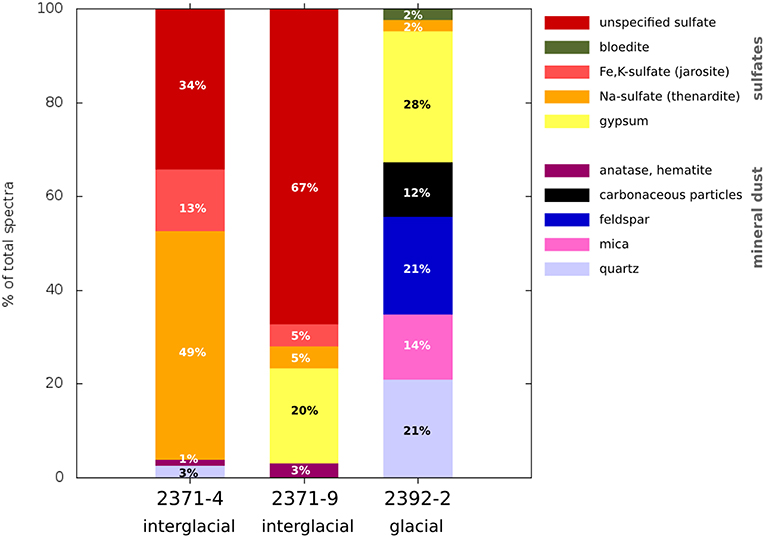
Figure 3. Relative concentrations of identified species in percent within each sample. Different color families are used to distinguish between sulfate inclusions and mineral dust— cold colors for insoluble dust and rather warm colors for sulfates. While in the interglacial samples sulfate salts form 96% of the micro-inclusions, in the glacial ice mineral dust is most prevalent.
3.3. Impurity Distribution
Micro-inclusions are distributed rather heterogeneously through the polycrystal. This is evident from their positions in the impurity maps (Figures 4–6) as already stated in Eichler et al. (2017). Micro-inclusions form areas of higher and lower concentrations and tend to align in horizontal bands which extend over grain boundaries. The double horizon in section 2371-9 (Figure 5B) is a clear example of such layering. At the sub-millimeter scale, small groups and chains of micro-inclusions are frequently observed. The Raman spectra reveal no separation patterns or preferred grouping of individual chemical compounds. The different species seem to be well mixed within the analyzed areas.
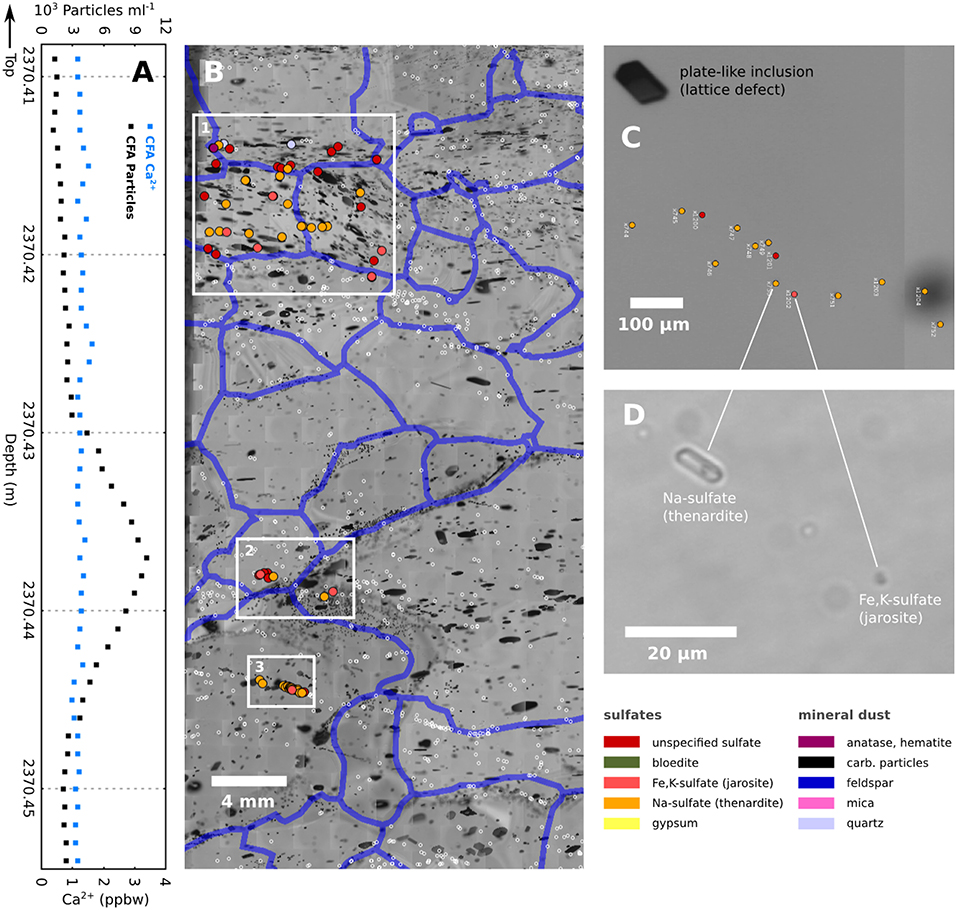
Figure 4. Detail of section 2371-4 (2370.408–2370.455 m): (A) high resolution CFA profile showing Ca2+ concentration and number of insoluble particles. (B) Impurity map with three rectangular areas of interest. White circles represent positions of individual micro-inclusions presented in Eichler et al. (2017). Colored circles indicate micro-inclusions analyzed with the Raman system. Blue bands indicate positions of grain boundaries at the focus depth of the micro-inclusions. Black objects in the image are effects of ice relaxation: small elliptical micro-bubbles which tend to form close to grain boundaries and larger hexagonal planar lattice defects often called the plate-like inclusions. (C) detail of area 3 with a chain of micro-inclusions. A plate-like inclusion (black, upper left corner) can serve as a marker of the crystallographic lattice orientation. (D) detail of two micro-inclusions from area 3. The sodium sulfate particle (left) exhibits an exceptionally large size. Its elongation direction seems to coincide with the basal plane of the ice crystal.
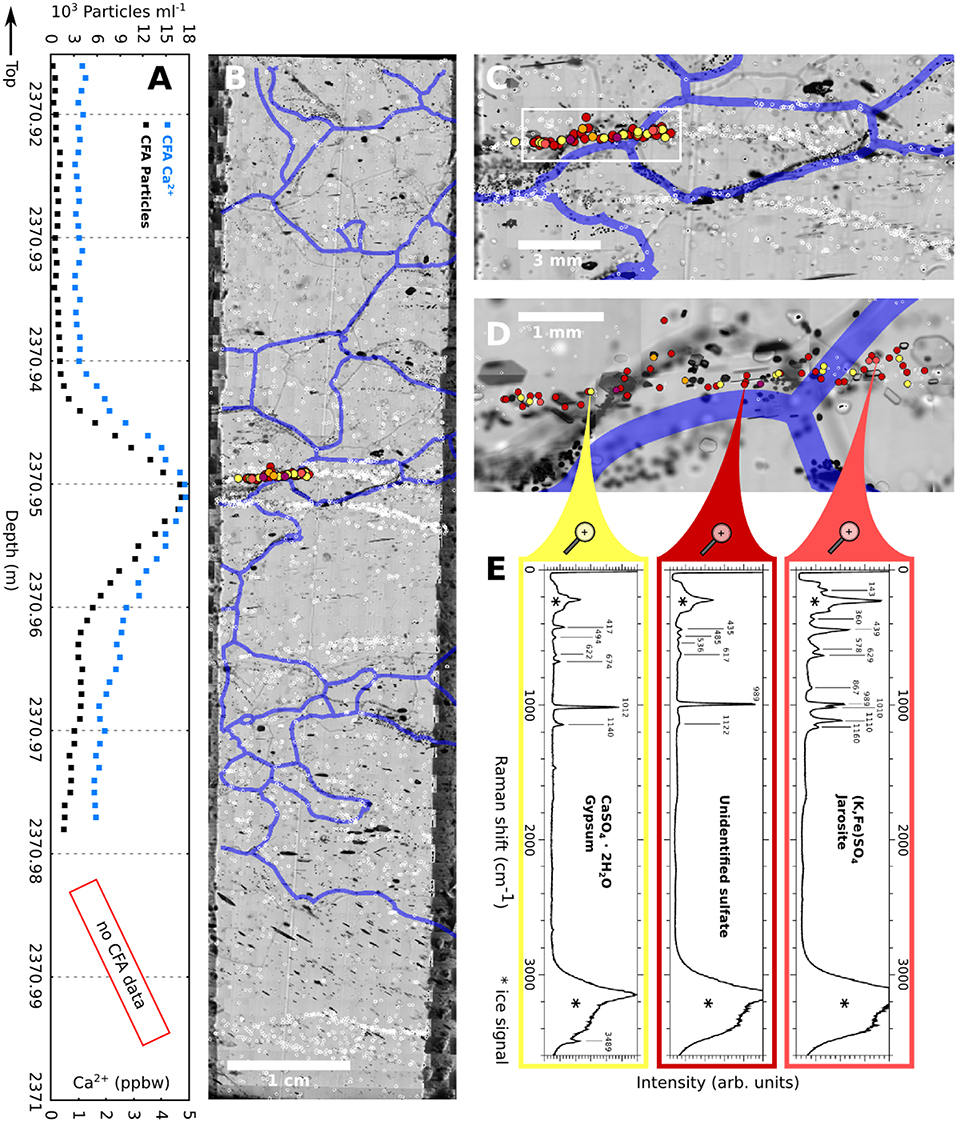
Figure 5. Detail of section 2371-9 (2370.915–2371.0 m): (A) high resolution CFA profile showing Ca2+ concentration and number of insoluble particles. (B) impurity map, white circles represent positions of individual micro-inclusions presented in Eichler et al. (2017). Colored circles indicate micro-inclusions analyzed with the Raman system. Blue bands indicate positions of grain boundaries at the focus depth of the micro-inclusions. A horizontal double layer of micro-inclusions at 2370.95 m correlates with a strong peak in the CFA profiles. (C) detail of the double layer with area of interest selected for the Raman measurements in the upper horizon. (D) zoom into the upper horizon. (E) raman spectra of three selected micro-inclusions in the upper horizon.
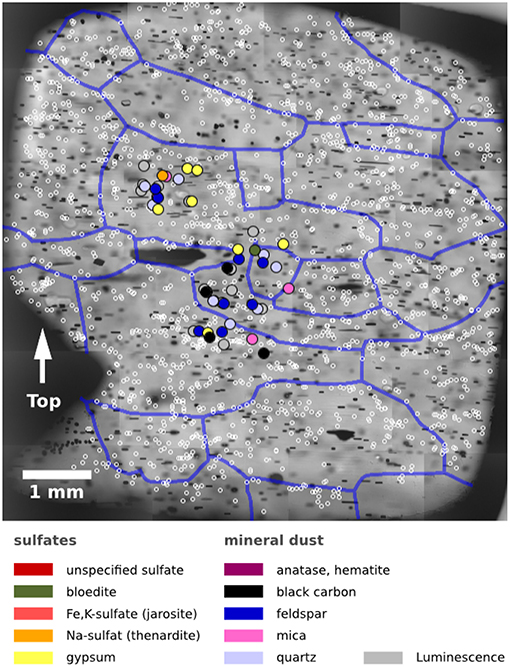
Figure 6. Impurity map in section 2392-2 (2392.26 m). The impurity analysis of the MIS 6 sample was restricted to an area of approximately 8 × 8 mm2. White circles represent positions of individual micro-inclusions. Colored circles indicate micro-inclusions analyzed with the Raman system. Gray circles represent micro-inclusions with strong luminescence. Blue bands indicate positions of grain boundaries at the upper surface, approximately 300 microns above the focus depth of the micro-inclusions.
We found no significant relationship between the positions of micro-inclusions and the grain boundary network neither in the glacial nor interglacial samples. The implications for the interaction between grain boundaries and micro-inclusions (Zener pinning and drag) have been discussed in Eichler et al. (2017). The Raman analysis shows that also compositions of the particles are independent of the distance from grain boundaries. When acquiring Raman signal directly from grain boundaries and triple junctions, only the ice signal could be detected, without any spectra indicating dissolved impurities. However, such attempts were limited only to measurements on the sample surface, since grain boundaries are invisible in the bulk by default.
4. Discussion
4.1. Raman Analysis
We identified the composition of 63 % of the measured micro-inclusions. The remaining 37 % measurements showed either no signal at all, were disturbed by luminescence, or exhibited an unidentified Raman spectrum. A reliable phase identification is dependent on the quality of the acquired spectra. For instance in the case of sulfates, many phases exhibit a very intense main band (ν1 mode of the SO4 molecule) around the same Raman shift and can only be identified, if the minor lattice vibrations are also resolved. The quality of the Raman signal strongly depends on the size of each individual micro-inclusion, on the quality of the sample surface, particle–surface distance and other factors. Micro-inclusions without any signal can be attributed either to Raman-inactive species such as NaCl or to cases where the excitation laser focus missed the target. In both cases only ice spectrum could be recorded.
Among the 183 identified micro-inclusions sulfates dominate the statistics. In the MIS 5e samples (2371-4 and 2371-9) they represent 96% of micro-inclusions. This is in agreement with previous studies by Ohno et al. (2005, 2006) who found sulfate salts being the major micro-inclusions in Dome Fuji. Sodium sulfate was previously reported by Ohno et al. (2006) in form of mirabilite. The peak positions in our spectra as well as the absence of the O–H peak indicate rather the anhydrous phase thenardite in our samples. However, the O–H vibration may be hidden by the ice O–H bands so that this argument is not very strong. In contrast, the O–H band of gypsum (CaSO4·2H2O) is visible in a number of its spectra so that the phase identification is certain. We identified for the first time iron–potassium sulfate ((Fe, K)SO4) in ice using Raman spectroscopy. The spectra showed a very good match with the reference spectra of jarosite. Jarosite was curiously identified by Baccolo et al. (2018) within dust particles in deep ice from Talos Dome. The formation of jarosite in icy environments on Mars was discussed by Michalski and Niles (2011). We also detected a few particles with relatively good match to the spectra of bloedite (Na2Mg(SO4)2·4H2O). The unspecified sulfate particles are attributed to at least two different Raman spectra (see Figures S2K,L), both with the SO4 symmetric stretching mode ν1 at 989 cm−1. Possible candidates are sodium-aluminum sulfate (Na, Al)SO4, magnesium sulfate MgSO4, ammonium sulfate (NH4)2SO4 and similar, or mixtures of these.
The number of dust particles detected in the interglacial samples are relatively low–2 quartz particles, 2 hematite and 1 anatase. This is in accordance with the low concentrations of dust in the CFA profile. In contrast, the MIS 6 sample (2392-2) contains almost two orders of magnitude higher concentrations of mineral dust (105 particles per ml, CFA). This reflects conditions characteristic for glacial periods, namely low accumulation rates in combination with high atmospheric dust content. This is also reflected in the spectra statistics, which is dominated by crust-forming silicates – quartz, mica and feldspar. Interestingly, Ca-containing crustal minerals, such as Ca-plagioclase and Ca-carbonates are completely missing. This could result from the insufficient number of measured spectra in the “dusty” MIS 6 sample. However, another explanation could be that postdepositional changes in the composition of mineral dust occurred as suggested by Baccolo et al. (2018), e.g., due to exposure to strong acids like H2SO4. The abundant gypsum particles could be a byproduct of such changes. The discussion below reveals some indications for similar changes affecting also the sea-salt aerosols.
4.2. Ion Balance
The ionic composition of the water-soluble impurities can be assessed using ion chromatography (IC). Table 2 presents concentrations measured by IC in bags 2371 and 2392 (column 2 and 3). Values are averaged along one meter. Molar masses (column 4) are used to calculate molar concentrations for each ion (column 5 and 6). Taking sodium as sea-salt reference and using standard sea-salt ionic ratios (column 7) we can estimate the expected sea-salt (SS) and non-sea-salt (NSS) contribution for each ion (column 8 and 9). All ions reveal an increase of concentration from bag 2371 (MIS 5e) to bag 2392 (MIS 6). Furthermore, the concentration ratios between individual compounds differ significantly between the glacial and interglacial ice.
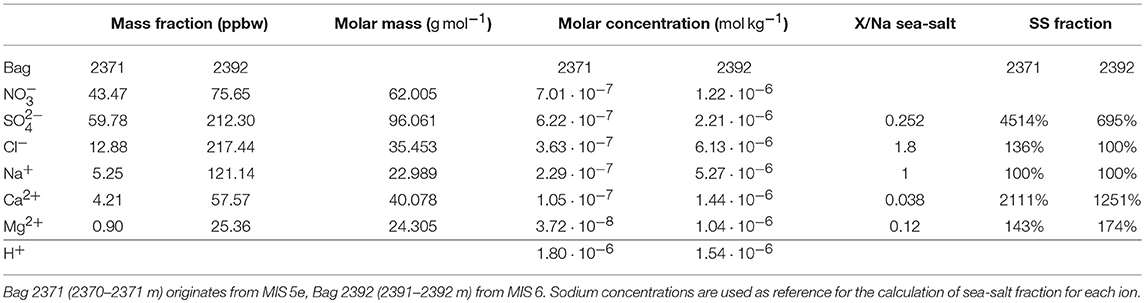
Table 2. Mean IC concentrations within two one-meter-long ice core segments (bags) which envelope the studied samples.
In bag 2371 nitrate and sulfate are the major ions with 7.01·10−7molkg−1 and 6.22·10−7molkg−1 respectively, followed by chloride (3.63·10−7molkg−1). The cations Na+, Ca2+ and Mg2+ are present in significantly lower concentrations resulting in an overall acidity of the ice. On the contrary, Cl− and Na+ dominate the ion budget in bag 2392 with molar concentrations of 6.13·10−6molkg−1 and 5.27·10−6molkg−1 respectively.
In both segments, Cl−, Na+ and Mg2+ match very well the sea-salt ion balance and can be considered to originate almost entirely from sea-salt, being transported to the Antarctic plateau in form of NaCl, MgCl2 and their mixtures. This is also reflected in the correlated signals of these three components in Figure 2. On the contrary, the concentrations of and Ca2+ exceed the seawater balance about an order of magnitude. This is consistent with their non-sea-salt origin at the EDML site. The main sources are marine biogenic sulfur (Kaufmann et al., 2010) and stratospheric sulfate deposits, whereas most Ca2+ is transported together with continental dust and is often used as a dust proxy (Ruth et al., 2008).
The imbalance between major anions and cations can be expressed in the concentration of excess protons H+ following Eq. 1. The concentrations of other ions such as and MSA− in our samples are very low so that their contributions to the overall acidity can be neglected.
Despite the different ionic concentrations and ratios between bag 2371 and 2392, the H+ concentrations reveal very similar values in both bags (Table 2, last row). Thus, the ice acidity is nearly constant across the transition between MIS 5e and MIS 6 and is indeed consistent with the DEP conductivity signal (Figure 2).
4.3. Sulfate
The Raman analysis revealed that sulfate particles form a dominant part of micro-inclusions in our samples. In the interglacial samples they represent 96% of all identified spectra. This result is consistent with similar observations by Ohno et al. (2005, 2006) in the Dome Fuji ice core. We cannot confirm observations by Fukazawa et al. (1998) who suggested presence of sulfuric acid in aqueous solution along grain boundaries and triple junctions leading to a network of liquid-filled veins (Rempel et al., 2001). Ionic concentrations in our samples (Table 2) reveal a sufficient amount of cations as reaction partners to form sulfate salts. Accordingly, most precipitates in form of micro-inclusions rather than liquid H2SO4 solution. This, however, can be different in ice with extremely high sulfate concentrations.
4.4. Nitrate
The main sources of remain uncertain, however it is a major impurity component in Antarctic ice (Röthlisberger et al., 2000b). As shown in Table 2, it represents the most abundant ion in terms of molar concentration in the two interglacial samples (bag 2371) and similar concentrations are found also in the glacial part (bag 2392). This is apparently in contradiction to the Raman analysis. In fact, not even one micro-inclusion showed a spectrum that could be clearly attributed to a nitrate salt. This discrepancy may be explained by the relatively high excess of trace anions. In an acidic environment the three main acids—HNO3, H2SO4 and HCl—compete to react with the relatively low amount of cations. Sulfuric acid is the most reactive one being able to replace the other acids in their salts (Iizuka et al., 2008). Thus, the final product are various sulfate salts forming micro-particles as shown in the Raman data. However, this does not explain what happens with the nitrate which remains present in the ice, as obvious from the IC measurements. If micro-droplets of concentrated HNO3 would form, they should be easily detectable with the Raman-microscope. It seems to be conclusive that nitrate ions are present rather in a dissolved form than a condensed phase. This is in agreement with experimental results by Thibert and Dominé (1998) who suggested HNO3 (with relatively high diffusion coefficient: D = 2·10−11cm2s−1 at −32°C) forming solid solution in ice. The mean migration distance of after 129 ka would be around 9 cm which would fade away any seasonality in the nitrate signal in our samples. Indeed, the IC profile (Figure 2) shows a very stable signal without any distinctive peaks or other kind of variability.
4.5. Chloride
The case of HCl may be similar to HNO3, albeit complicated by the fact that hydrochloric acid and its most prominent salt—NaCl—do not possess a Raman-active mode. Thus, the Raman data do not provide any direct information about the form or location of chloride in ice. The IC data in Table 2 indicate that the Cl− concentration in our samples resembles the sea-salt Cl−/Na+ ratio, meaning that no significant loss of Cl− occurred since deposition. However, the high amount of Na2SO4 spectra indicates that a considerable part of Cl− was replaced from the sea-salt by sulfate. This could occur in a direct reaction with sulfuric acid (2) or over several steps, e.g., via (3) and (4).
The final product of these reactions is the formation of Na2SO4 and release of HCl. According to the phase diagram by Thibert and Dominé (1997) the amount of chloride present in our samples could easily form solid solution even if all the NaCl was converted into Na2SO4. The diffusion coefficient of HCl in ice estimated by Thibert and Dominé (1997) is of the order of 10−12cm2s−1. This would lead to an average distance of 2 cm after 129 ka. Taking ice thinning into account the Cl− signal should be well preserved even at 2400 m depth. This is in agreement with the IC profile which shows a good correlation between the Cl− and Na+ signals. Our Raman results in combination with the ion balance from IC are overall in a good agreement with chemical compositions of salt inclusions predicted by Iizuka et al. (2008).
4.6. Solid Solution
The presence of excess anions in the studied samples raises questions on their incorporation and distribution in the ice. This will mainly depend on the amount of energy needed for their incorporation. It has been postulated that ions with rather small ionic radii such as F− and Cl− should be able to substitute water molecules in the ice lattice. The incorporation of one HCl molecule for instance would introduce a Bjerrum L defect and an ionic defect into the lattice (Petrenko and Whitworth, 1999), both being electric charge carriers. If a significant amount of HCl were available—e.g., due to reaction (??)—the electrical properties would change radically. Thus, the DEP conductivity in Figure 2 may not be directly linked to the concentration as apparent from its curve shape, but rather to the amount of dissociated Cl− which, however, depends on via (2), (3) and (4).
Larger molecules are not compatible with the dimensions of the ice lattice and thus cannot substitute water molecules at the lattice sites. They represent high-energy lattice defects and therefore are likely to accumulate at regions of high energy, such as grain boundaries, subgrain boundaries, triple junctions and other impurities. Thibert and Dominé (1997, 1998) suggested that diffusion through low angle grain boundaries was important for both—Cl− and . Dissolved ions in grain boundaries and triple junctions are likely to affect several of their characteristics, in particular the mobility (Alley et al., 1986b) and molecular structure via enhanced premelting (Rempel et al., 2001). The absence of Raman signal in grain boundaries and triple junctions suggests that concentrations of Raman-active molecules in the grain boundary network are significantly lower than reported by e.g., Fukazawa et al. (1998). This does not apply to mono-atomic ions and Raman-inactive molecules, which could still reside in the grain boundaries. However, liquid water phase caused by enhanced premelting should be well distinguishable from the ice Raman spectra, which was not the case.
4.7. Transport, Mixing, and Reactions
The comparison of Raman results with concentrations of major ions (IC) indicates that mixing and chemical reactions occurred since deposition of the different impurities. It is difficult to guess when or in which depth these processes occur. It is likely that many chemical processes take place already in the aerosol phase, during precipitation or shortly after it, during snow metamorphism. Porous snow with its large surface area, temperature gradient and light penetrating the upper layers offers a highly reaction-friendly environment for many species (Dominé and Shepson, 2002; Bartels-Rausch et al., 2014). Postdepositional losses of MSA−, and Cl− have been investigated by Weller et al. (2004) at the EDML site. In contrast to sites with low accumulation rate there was no significant Cl− loss with depth in the EDML snow. The Cl/Na ratio persisted close to the sea-salt value. The authors suggested that the main part of Cl− was located inside the ice crystals in form of NaCl isolated from the other reacting agents. This again would suggest that reactions with other acids (see section 4.5) would occur later on, possibly when the pores have already been closed off and the ice was formed.
Below the firn–ice transition impurities are trapped at their locations and the transport and reaction dynamics is reduced significantly. In a completely static matrix the transport of impurities is controlled exclusively by diffusion due to thermic fluctuations. However, as ice deforms it provides more opportunities for mixing and reactions between impurities. Two important flow-related processes are: (1) Accumulation and drag of dissolved impurities by migrating grain boundaries (GB) due to dynamic recrystallization and grain growth. The longer the distance covered by the GB migration, the more dissolved ions can accumulate in it, react with each other and, eventually, precipitate in form of newly formed salt particles. Such micro-particles would be left behind because of their low mobility. (2) Strain in a deforming ice polycrystal distributes highly heterogeneously (Jansen et al., 2016; Llorens et al., 2016; Steinbach et al., 2016) forming localized bands of high strain and strain rate. Under simple shear conditions these shear bands align at low angles to the horizontal shear plane (Llorens et al., 2016), which typically also corresponds to the orientation of the isochrones. Impurities located in such shear bands are exposed to higher mechanical mixing rates, however without a necessarily disturbing effect on their chronology. Both mechanisms could be relevant for mixing of dissolved impurities and the formation of new micro-inclusions with increasing depth as suggested by Faria et al. (2010). This could also partly explain their characteristic spatial distributions on the micro-scale, i.e., the frequently observed chains and groups of micro-inclusions (e.g., Figure 4B).
4.8. Deformation of Ice
As shown in previous studies (Fisher and Koerner, 1986; Dahl-Jensen and Gundestrup, 1987; Paterson, 1991; Cuffey et al., 2000), impurity-loaded ice in simple shear deforms in general more readily than clean ice. Ambiguous results have however been observed possibly due to oversimplified assumptions on large-scale deformation geometry (plain strain vs. shear) and the interaction with anisotropic ice (Paterson, 1983). It is thus worthwhile discussing the actual processes under the likely deformation kinematics. The samples discussed here originate from depths 2370 m and 2392 m, i.e., deep enough in the lowest third of the ice sheet where simple shear due to interaction with bedrock is already expected to dominate the deformation (Dansgaard-Johnsen model). Numerical ice sheet modeling of the EDML site predicts the onset of simple shear below 1700 m and further increase of horizontal shear around 2400 m (Weikusat et al., 2017). The MIS 6–5e transition is characterized by the highest spatial gradient of impurity concentration along the entire ice core. Thus, we can expect a different rheology for the two neighboring parts—the interglacial, clean ice being the “harder” and the glacial, impurity-loaded ice the “softer” layer for shearing. Recent measurements of the EDML borehole deformation, which will be published elsewhere, indeed suggest such a behavior (Jansen et al., 2017).
Investigations of the effect of impurities on the deformation rate of ice often differentiate between dissolved impurities (ions) vs. second phase inclusions (micro-inclusions) (Alley et al., 1986a,b; Alley and Woods, 1996; Gow et al., 1997; Cuffey et al., 2000; Durand et al., 2006). Furthermore, it is distinguished between a direct effect on the single ice-crystal plasticity (Jones, 1967; Glen, 1968; Jones and Glen, 1969; Petrenko and Whitworth, 1999) vs. the interaction between impurities and grain boundaries (Alley et al., 1986a; Humphreys and Hatherly, 2004; Durand et al., 2006; Eichler et al., 2017). The latter has been suggested as responsible for the frequently observed high impurity content correlating with small grains sizes (Fisher and Koerner, 1986; Paterson, 1991). Impurities either in particulate or dissolved form would slow down grain boundary migration and grain growth. According to Paterson (1991), fine-grained ice in simple shear tend to develop strong CPO faster than coarse-grained ice. Other authors (e.g., Cuffey et al., 2000; Goldsby and Kohlstedt, 2001) propose other grain-size sensitive deformation mechanisms acting on the micro-scale.
Based on the results presented above following conclusions can be drawn: The amount of dissolved impurities is rather small, since most cations and anions react together forming salt inclusions. Nitrate represents an exception, as demonstrated through its absence in the Raman records and thus is likely to enter in solid solution. However, the concentrations in MIS 5e and MIS 6 are very similar, so that is rather unlikely to be responsible for such dramatic differences in microstructure (Figure 1) and rheology. Solid solution of chloride, which introduces protonic defects into the ice lattice and thus increases mobility of dislocations (Petrenko and Whitworth, 1999), depends on the concentration of other major acids to replace Cl− in the sea salt. As shown in Table 2, the acidities in both parts of the ice core are very similar, so that the role of dissolved Cl− may be rather minor as well. However, the concentration of NaCl itself increases by a factor 20 from MIS 5e to MIS 6. Thus, depending on its phase and spatial distribution, which are inaccessible to the Raman analysis, NaCl could have a significant effect on ice physical properties. Micro-inclusions, which represent the most common form of impurities in ice, are another major candidate responsible for the different properties of glacial and interglacial ice. The number of insoluble particles per volume unit increases by two orders of magnitude along the climatic transition (Figure 2). However, the actual mechanism must be further investigated, since contradictory assumptions and observations are associated with our current understanding of Zener pinning as the controlling mechanism (Alley et al., 1986a; Durand et al., 2006; Eichler et al., 2017).
5. Summary
In this study a combination of micro-cryo-Raman spectroscopy and CFA, IC and DEP data was presented in order to investigate the way in which chemical impurities integrate and distribute in solid ice. This is another step toward a more holistic view on ice cores, building a bridge between ice core chemistry and physical properties of ice. For more quantitative comparisons and in order to improve the statistical significance, a higher number of micro-inclusions covering larger areas should be investigated in future studies. This is technically possible, however requires further improvements of the focusing routine in order to reduce the time between individual measurements.
The three studied EDML samples originate from the depth range between 2370 m and 2400 m around the transition from the penultimate glacial period MIS 6 to the early MIS 5e and are characterized by immense differences in impurity concentrations and compositions as well as crystal sizes and orientations. While the glacial impurity concentrations are up to several orders of magnitude higher than the interglacial ones (e.g., dust), the average crystal area decreases by a factor 20. The MIS 6 micro-inclusions are dominated by mineral dust particles. On the contrary, 96 % of the MIS 5e inclusions were sulfate particles, mainly gypsum, sodium sulfate, iron–potassium sulfate (likely jarosite) and other unspecified sulfates. We report for the first time Raman spectra of mica, graphite, anatase, hematite, possibly jarosite and bloedite in an ice core. The spatial distributions of micro-inclusions are highly heterogeneous, forming horizontal layers on the millimeter-scale and small groups or chains of micro-inclusions on the micrometer-scale. No preferential distribution of micro-inclusions with respect to the grain boundary network could be determined, neither in the interglacial nor in the glacial samples. Furthermore, no Raman signal was detected, which would indicate the presence of dissolved impurities in grain boundaries or triple junctions. This puts the relevance of liquid-filled or acid-filled veins into question, at least for concentrations and temperatures present in our samples. Nevertheless, small amount of ions, e.g., as referred by Alley et al. (1986a), could still segregate to grain boundaries without being detected by the Raman microscope. Also, NaCl—the main part of sea salt—has to be excluded from our considerations, since it is inaccessible for Raman spectroscopy, no matter in which phase.
The combination of Raman analysis of micro-inclusions with the concentrations of major ions from IC demonstrates that the way impurities incorporate into ice varies not only from species to species, but rather depends on the overall ion budget, as already suggested by Iizuka et al. (2008). This is evident from the case of missing nitrate salts in the Raman spectra, which we interpret as a result of reactions with stronger acids—mainly H2SO4—leading to the solution of in ice. The presence of Na2SO4 suggests that also a part of Cl− was expelled from the sea-salt and possibly dissolved in the matrix, while the Na+/Cl− sea salt ratio stayed preserved. Similarly, the solid mineral-dust aerosols seem to be affected by the acids, as suggested by the absence of Ca-carbonate and Ca-plagioclase and the abundance of gypsum instead. We conclude that some of these reactions may take place after the deposition of the original aerosols. The deforming ice matrix offers a number of mechanisms which facilitate mixing and reactions between impurities on the micrometer to millimeter scale, without necessarily disturbing their chronology. Thus, our understanding of polar ice as a frozen archive should be reconsidered. Whether a particular impurity signal will be preserved at a certain depth depends on the reactions it was involved in, their products and the mobilities (or diffusion rates) of these products.
The link between impurities and enhanced deformation of ice remains ambiguous, as well as the identification of the responsible impurity species. Our results suggest that the two major actors are likely to be micro-inclusions and sodium sulfate, which is however invisible to the Raman spectroscopy. The effect of dissolved ions might be rather minor, as most of them react and precipitate in form of salt inclusions. The excess ion concentrations are similar in both parts of the ice core. Micro-inclusions represent the most common form of impurities and experience the highest concentration gradient along the climatic transition. However, the identification of the responsible mechanism remains pending. In particular, future investigation still need to resolve, whether characteristic microstructures such as small grains and strong CPOs are the main drivers for enhanced deformation, or its consequence.
Data Availability
The raw Raman data supporting the conclusions of this manuscript will be made available by the authors, without undue reservation, to any qualified researcher.
Author Contributions
JE and IW contributed to the initial concept. JE performed Raman measurements and analysis of the Raman spectra with support from CW. BT performed ion chromatography measurements, CFA data were provided by HF, AW, and UR. MB and MH contributed to the analysis of the data. DEP data were provided by FW. DJ, SK, and IW contributed to the interpretation of data by providing expertise on the field of ice deformation as well as the general glaciological framework. The manuscript was written by JE with contributions of all coauthors.
Funding
This research was funded by HGF grant VH-NG-802 to JE and IW, SPP 1158 DFG grant WE4711/2 to CW.
Conflict of Interest Statement
The authors declare that the research was conducted in the absence of any commercial or financial relationships that could be construed as a potential conflict of interest.
Acknowledgments
We thank Rolf Weller for helpful discussions and his expertise in the chemistry of snow and ice. This work is a contribution to the European Project for Ice Coring in Antarctica (EPICA), a joint European Science Foundation/European Commission scientific program, funded by the EU (EPICA-MIS) and by national contributions from Belgium, Denmark, France, Germany, Italy, the Netherlands, Norway, Sweden, Switzerland and the United Kingdom. The main logistic support was provided by IPEV and PNRA (at Dome C) and AWI (at Dronning Maud Land).
Supplementary Material
The Supplementary Material for this article can be found online at: https://www.frontiersin.org/articles/10.3389/feart.2019.00020/full#supplementary-material
References
Alley, R. B., Perepezko, J. H., and Bentley, C. R. (1986a). Grain growth in polar ice: I. theory. J. Glaciol. 32, 415–424. doi: 10.1017/S0022143000012120
Alley, R. B., Perepezko, J. H., and Bentley, C. R. (1986b). Grain growth in polar ice: II. Application. J. Glaciol. 32, 425–433. doi: 10.1017/S0022143000012132
Alley, R. B., and Woods, G. A. (1996). Impurity influence on normal grain growth in the GISP2 ice core, Greenland. J. Glaciol. 42, 255–260. doi: 10.1017/S0022143000004111
Baccolo, G., Cibin, G., Delmonte, B., Hampai, D., Marcelli, A., Di Stefano, E., et al. (2018). The contribution of synchrotron light for the characterization of atmospheric mineral dust in deep ice cores: preliminary results from the talos dome ice core (east antarctica). Condensed Matt. 3:25. doi: 10.3390/condmat3030025
Baker, I. (2003). Imaging dislocations in ice. Microsc. Res. Techn. 62, 70–82. doi: 10.1002/jemt.10382
Barnes, P. R. F. (2003). Comment on “Grain boundary ridge on sintered bonds between ice crystals” [J. Appl. Phys. 90, 5782 (2001)]. J. Appl. Phys. 93, 783–785. doi: 10.1063/1.1521800
Barnes, P. R. F., Mulvaney, R., Robinson, K., and Wolff, E. W. (2002). Observations of polar ice from the holocene and the glacial period using the scanning electron microscope. Anna. Glaciol. 35, 559–566. doi: 10.3189/172756402781816735
Bartels-Rausch, T., Jacobi, H.-W., Kahan, T. F., Thomas, J. L., Thomson, E. S., Abbatt, J. P. D., et al. (2014). A review of air–ice chemical and physical interactions (AICI): liquids, quasi-liquids, and solids in snow. Atmospher. Chem. Phys. 14, 1587–1633. doi: 10.5194/acp-14-1587-2014
Cuffey, K. M., Conway, H., Gades, A., Hallet, B., Raymond, C. F., and Whitlow, S. (2000). Deformation properties of subfreezing glacier ice: Role of crystal size, chemical impurities, and rock particles inferred from in situ measurements. J. Geophys. Res. 105, 27895–27916. doi: 10.1029/2000JB900271
Cullen, D., and Baker, I. (2001). Observation of impurities in ice. Microsc. Res. Techn. 55, 198–207. doi: 10.1002/jemt.10000
Dahl-Jensen, D., and Gundestrup, N. S. (1987). “Constitutive properties of ice at Dye3, Greenland,” in The Physical Basis of Ice Sheet Modelling, eds E. D. Waddington and J. S. Walder (Vancouver, BC: IAHS Press), 31–43.
Della Lunga, D., Müller, W., Rasmussen, S., and Svensson, A. (2014). Location of cation impurities in NGRIP deep ice revealed by cryo-cell UV-laser-ablation ICPMS. J. Glaciol. 60, 970–988. doi: 10.3189/2014JoG13J199
Dominé, F., and Shepson, P. B. (2002). Air-snow interactions and atmospheric chemistry. Science 297, 1506–1510. doi: 10.1126/science.1074610
Durand, G., Gagliardini, O., Thorsteinsson, T., Svensson, A., Kipfstuhl, S., and Dahl-Jensen, D. (2006). Ice microstructure and fabric: an up-to-date approach for measuring textures. J. Glaciol. 52, 619–630. doi: 10.3189/172756506781828377
Eichler, J. (2013). C-Axis Analysis of the NEEM Ice Core – An Approach based on Digital Image Processing. Master's Thesis, Fachbereich Physik, Freie Universität Berlin *Alfred-Wegener-Institut Helmholtz-Zentrum für Polar- und Meeresforschung.
Eichler, J., Kleitz, I., Bayer-Giraldi, M., Jansen, D., Kipfstuhl, S., Shigeyama, W., et al. (2017). Location and distribution of micro-inclusions in the edml and neem ice cores using optical microscopy and in situ raman spectroscopy. Cryosphere 11, 1075–1090. doi: 10.5194/tc-11-1075-2017
Faria, S. H., Freitag, J., and Kipfstuhl, S. (2010). Polar ice structure and the integrity of ice-core paleoclimate records. Quat. Sci. Rev. 29, 338–351. doi: 10.1016/j.quascirev.2009.10.016
Fischer, H., Fundel, F., Ruth, U., Twarloh, B., Wegner, A., Udisti, R., et al. (2007). Reconstruction of millennial changes in dust emission, transport and regional sea ice coverage using the deep EPICA ice cores from the Atlantic and Indian Ocean sector of Antarctica. Earth Planet. Sci. Lett. 260, 340–354. doi: 10.1016/j.epsl.2007.06.014
Fisher, D., and Koerner, R. (1986). On the special rheological properties of ancient microparticle-laden northern hemisphere ice as derived from bore-hole and core measurements. J. Glaciol. 32, 501–510. doi: 10.1017/S0022143000012211
Freitag, J., Kipfstuhl, S., Laepple, T., and Wilhelms, F. (2013). Impurity-controlled densification: a new model for stratified polar firn. J. Glaciol. 59, 1163–1169. doi: 10.3189/2013JoG13J042
Fujita, S., Hirabayashi, M., Goto-Azuma, K., Dallmayr, R., Satow, K., Zheng, J., et al. (2014). Densification of layered firn of the ice sheet at NEEM, greenland. J. Glaciol. 60, 905–921. doi: 10.3189/2014JoG14J006
Fukazawa, H., Sugiyama, K., Mae, S., Narita, H., and Hondoh, T. (1998). Acid ions at triple junction of Antarctic ice observed by Raman scattering. Geophys. Res. Lett. 25, 2845–2848. doi: 10.1029/98GL02178
Glen, J. (1968). The effect of hydrogen disorder on dislocation movement and plastic deformation of ice. Physik der kondensierten Materie 7, 43–51. doi: 10.1007/BF02422799
Goldsby, D. L., and Kohlstedt, D. L. (2001). Superplastic deformation of ice: experimental observations. J. Geophys. Res. 106, 11017–11030. doi: 10.1029/2000JB900336
Gow, A. J., Meese, D. A., Alley, R. B., Fitzpatrick, J. J., Anandakrishnan, S., Woods, G. A., et al. (1997). Physical and structural properties of the Greenland Ice Sheet Project 2 ice core: a review. J. Geophys. Res. Oceans 102, 26559–26575. doi: 10.1029/97JC00165
Greve, R. (1997). Application of a polythermal three-dimensional ice sheet model to the greenland ice sheet: response to steady-state and transient climate scenarios. J. Clim. 10, 901–918. doi: 10.1175/1520-0442(1997)010<0901:AOAPTD>2.0.CO;2
Humphreys, F. J., and Hatherly, M. (2004). Recrystallization and Related Annealing Phenomena. Oxford, UK: Elsevier.
Iizuka, Y., Horikawa, S., Sakurai, T., Johnson, S., Dahl-Jensen, D., Steffensen, J. P., et al. (2008). A relationship between ion balance and the chemical compounds of salt inclusions found in the greenland ice core project and dome fuji ice cores. J. Geophys. Res. Atmospher. 113:D07303. doi: 10.1029/2007JD009018
Iliescu, D., and Baker, I. (2008). Effects of impurities and their redistribution during recrystallization of ice crystals. J. Glaciol. 54, 362–370. doi: 10.3189/002214308784886216
Jansen, D., Llorens, M. G., Westhoff, J., Steinbach, F., Kipfstuhl, S., Bons, P. D., et al. (2016). Small-scale disturbances in the stratigraphy of the NEEM ice core: observations and numerical model simulations. Cryosphere 10, 359–370. doi: 10.5194/tc-10-359-2016
Jansen, D., Weikusat, I., Kleiner, T., Wilhelms, F., Dahl-Jensen, D., Frenzel, A., et al. (2017). In situ-Measurement of Ice Deformation From Repeated Borehole Logging of the EPICA Dronning Maud Land (EDML) Ice Core, East Antarctica. Vienna: EGU General Assembly.
Jones, S. (1967). Softening of ice crystals by dissolved fluoride ions. Phys. Lett. A 25, 366–367. doi: 10.1016/0375-9601(67)90702-5
Jones, S. J., and Glen, J. W. (1969). The effect of dissolved impurities on the mechanical properties of ice crystals. Philos. Mag. 19, 13–24. doi: 10.1080/14786436908217758
Kaufmann, P., Fundel, F., Fischer, H., Bigler, M., Ruth, U., Udisti, R., et al. (2010). Ammonium and non-sea-salt sulfate in the epica ice cores as indicator of biological activity in the southern ocean. Quat. Sci. Rev. 29, 313–323. doi: 10.1016/j.quascirev.2009.11.009
Kaufmann, P. R., Federer, U., Hutterli, M. A., Bigler, M., Schüpbach, S., Ruth, U., et al. (2008). An improved continuous flow analysis system for high-resolution field measurements on ice cores. Environ. Sci. Technol. 42, 8044–8050. doi: 10.1021/es8007722
Kipfstuhl, S., Hamann, I., Lambrecht, A., Freitag, J., Faria, S., Grigoriev, D., et al. (2006). Microstructure mapping: a new method for imaging deformation induced microstructural features of ice on the grain scale. J. Glaciol. 52, 398–406. doi: 10.3189/172756506781828647
Legrand, M., and Mayewski, P. (1997). Glaciochemistry of polar ice cores: a review. Rev. Geophys. 35, 219–243. doi: 10.1029/96RG03527
Llorens, M. G., Griera, A., Bons, P. D., Lebensohn, R. A., Evans, L. A., Jansen, D., et al. (2016). Full-field predictions of ice dynamic recrystallisation under simple shear conditions. Earth Planet. Sci. Lett. 450, 233–242. doi: 10.1016/j.epsl.2016.06.045
Michalski, J. R., and Niles, P. B. (2011). “Formation of jarosite in the Mawrth Vallis region of mars by weathering within paleo-ice deposits,” in Lunar and Planetary Science Conference, Vol 42 (Houston, TX), 1926
Moore, J. C., Narita, H., and Maeno, N. (1991). A continuous 770-year record of volcanic activity from east antarctica. J. Geophys. Res. Atmosp. 96, 17353–17359. doi: 10.1029/91JD01283
Moore, J. C., Wolff, E. W., Clausen, H. B., and Hammer, C. U. (1992). The chemical basis for the electrical stratigraphy of ice. J. Geophys. Res. Solid Earth 97, 1887–1896. doi: 10.1029/91JB02750
Mulvaney, R., Wolff, E., and Oates, K. (1988). Sulphuric acid at grain boundaries in Antarctic ice. Nature 331:247. doi: 10.1038/331247a0
Oerter, H., Drücker, C., Kipfstuhl, S., and Wilhelms, F. (2009). Kohnen station - the drilling camp for the EPICA deep ice core in dronning maud land. Polarforschung 78, 1–23. doi: 10.2312/polarforschung.78.1-2.1
Ohno, H., Igarashi, M., and Hondoh, T. (2005). Salt inclusions in polar ice core: location and chemical form of water-soluble impurities. Earth Planet. Sci. Lett. 232, 171–178. doi: 10.1016/j.epsl.2005.01.001
Ohno, H., Igarashi, M., and Hondoh, T. (2006). “Characteristics of salt inclusions in polar ice from Dome Fuji, East Antarctica,” in Geophysical Research Letters, Vol. 33 (Washington, DC: AGU publications). doi: 10.1029/2006GL025774
Paterson, W. (1983). Deformation within polar ice sheets: an analysis of the Byrd station and Camp Century borehole-tilting measurements. Cold Reg. Sci. Technol. 8, 165–179. doi: 10.1016/0165-232X(83)90007-1
Placidi, L., Greve, R., Seddik, H., and Faria, S. H. (2010). Continuum-mechanical, anisotropic flow model for polar ice masses, based on an anisotropic flow enhancement factor. Cont. Mech. Thermodyn. 22, 221–237. doi: 10.1007/s00161-009-0126-0
Rempel, A. W., Waddington, E. D., Wettlaufer, J. S., and Worster, M. G. (2001). Possible displacement of the climate signal in ancient ice by premelting and anomalous diffusion. Nature 411, 568–571. doi: 10.1038/35079043
Röthlisberger, R., Bigler, M., Hutterli, M., Sommer, S., Stauffer, B., Junghans, H. G., et al. (2000a). Technique for continuous high-resolution analysis of trace substances in firn and ice cores. Environ. Sci. Technol. 34, 338–342. doi: 10.1021/es9907055
Röthlisberger, R., Hutterli, M. A., Sommer, S., Wolff, E. W., and Mulvaney, R. (2000b). Factors controlling nitrate in ice cores: Evidence from the dome c deep ice core. J. Geophys. Res. Atmosp. 105, 20565–20572. doi: 10.1029/2000JD900264
Ruth, U., Barbante, C., Bigler, M., Delmonte, B., Fischer, H., Gabrielli, P., et al. (2008). Proxies and measurement techniques for mineral dust in antarctic ice cores. Environ. Sci. Technol. 42, 5675–5681. doi: 10.1021/es703078z
Sakurai, T., Ohno, H., Horikawa, S., Iizuka, Y., Uchida, T., Hirakawa, K., et al. (2011). The chemical forms of water-soluble microparticles preserved in the antarctic ice sheet during termination i. J. Glaciol. 57, 1027–1032. doi: 10.3189/002214311798843403
Smith, C. S. (1948). Grains, phases, and interfaces: an interpretation of microstructure. AIME Trans. 175, 15–51.
Steinbach, F., Bons, P. D., Griera, A., Jansen, D., Llorens, M.-G., Roessiger, J., et al. (2016). Strain localisation and dynamic recrystallisation in the ice-air aggregate: a numerical study. Cryosp. Discuss. 2016, 1–30. doi: 10.5194/tc-2016-167
Thibert, E., and Dominé, F. (1997). Thermodynamics and kinetics of the solid solution of HCl in ice. J. Phys. Chem. B 101, 3554–3565. doi: 10.1021/jp962115o
Thibert, E., and Dominé, F. (1998). Thermodynamics and kinetics of the solid solution of HNO3 in ice. J. Phys. Chem. B 102, 4432–4439. doi: 10.1021/jp980569a
Veres, D., Bazin, L., Landais, A., Toyé Mahamadou Kele, H., Lemieux-Dudon, B., Parrenin, F., et al. (2013). The antarctic ice core chronology (aicc2012): an optimized multi-parameter and multi-site dating approach for the last 120 thousand years. Clim. Past 9, 1733–1748. doi: 10.5194/cp-9-1733-2013
Wegner, A., Fischer, H., Delmonte, B., Petit, J. R., Erhardt, T., Ruth, U., et al. (2015). The role of seasonality of mineral dust concentration and size on glacial/interglacial dust changes in the epica dronning maud land ice core. J. Geophys. Res. Atmosp. 120, 9916–9931. doi: 10.1002/2015JD023608
Weikusat, C., Kipfstuhl, S., and Weikusat, I. (2015). Raman tomography of natural air hydrates. J. Glaciol. 61, 923–930. doi: 10.3189/2015JoG15J009
Weikusat, I., Jansen, D., Binder, T., Eichler, J., Faria, S. H., Wilhelms, F., et al. (2017). Physical analysis of an antarctic ice core–towards an integration of micro- and macrodynamics of polar ice. Philos. Trans. R. Soc. A 375:20150347. doi: 10.1098/rsta.2015.0347
Weller, R., Traufetter, F., Fischer, H., Oerter, H., Piel, C., and Miller, H. (2004). Postdepositional losses of methane sulfonate, nitrate, and chloride at the european project for ice coring in antarctica deep-drilling site in dronning maud land, antarctica. J. Geophys. Res. Atmosp. 109:D07301. doi: 10.1029/2003JD004189
Wilhelms, F., Kipfstuhl, J., Miller, H., Heinloth, K., and Firestone, J. (1998). Precise dielectric profiling of ice cores: a new device with improved guarding and its theory. J. Glaciol. 44, 171–174. doi: 10.1017/S002214300000246X
Wilhelms, F., Miller, H., Gerasimoff, M. D., Drcker, C., Frenzel, A., Fritzsche, D., et al. (2014). The epica dronning maud land deep drilling operation. Ann. Glaciol. 55, 355–366. doi: 10.3189/2014AoG68A189
Wilhelms, F., Sheldon, S. G., Hamann, I., and Kipfstuhl, S. (2007). “Implications for and findings from deep ice core drillings - An example: the ultimate tensile strength of ice at high strain rates,” in Physics and Chemistry of Ice (The Proceedings of the International Conference on the Physics and Chemistry of Ice held at Bremerhaven, Germany on 23-28 July 2006), ed W. F. Kuhs (Göttingen; Bremerhaven: The Royal Society of Chemistry Special Publication), 635–639.
Wolff, E. W., Fischer, H., Fundel, F., Ruth, U., Twarloh, B., Littot, G. C., et al. (2006). Southern ocean sea-ice extent, productivity and iron flux over the past eight glacial cycles. Nature 440:491. doi: 10.1038/nature04614
Keywords: EDML ice core, location of impurities, Raman spectra, strain localization, mixing and reactions
Citation: Eichler J, Weikusat C, Wegner A, Twarloh B, Behrens M, Fischer H, Hörhold M, Jansen D, Kipfstuhl S, Ruth U, Wilhelms F and Weikusat I (2019) Impurity Analysis and Microstructure Along the Climatic Transition From MIS 6 Into 5e in the EDML Ice Core Using Cryo-Raman Microscopy. Front. Earth Sci. 7:20. doi: 10.3389/feart.2019.00020
Received: 07 September 2018; Accepted: 04 February 2019;
Published: 26 February 2019.
Edited by:
Maurine Montagnat, Centre National de la Recherche Scientifique (CNRS), FranceReviewed by:
Barbara Delmonte, Universitá degli studi di Milano Bicocca, ItalyAnders Svensson, University of Copenhagen, Denmark
Copyright © 2019 Eichler, Weikusat, Wegner, Twarloh, Behrens, Fischer, Hörhold, Jansen, Kipfstuhl, Ruth, Wilhelms and Weikusat. This is an open-access article distributed under the terms of the Creative Commons Attribution License (CC BY). The use, distribution or reproduction in other forums is permitted, provided the original author(s) and the copyright owner(s) are credited and that the original publication in this journal is cited, in accordance with accepted academic practice. No use, distribution or reproduction is permitted which does not comply with these terms.
*Correspondence: Jan Eichler, amFuLmVpY2hsZXJAYXdpLmRl; amFuLmVpY2hsZXJAem9oby5jb20=