 Craig Magee
 Murray Hoggett3
 Christopher A.-L. Jackson
 Stephen M. Jones
- 1Basins Research Group, Department of Earth Science and Engineering, Imperial College London, London, United Kingdom
- 2School of Earth and Environment, University of Leeds, Leeds, United Kingdom
- 3School of Geography, Earth and Environmental Science, University of Birmingham, Birmingham, United Kingdom
Space for shallow-level sills and laccoliths is commonly generated by bending and uplift of overlying rock and sediment. This so-called “roof uplift” produces forced folds, the shape and amplitude of which reflect the geometry of underlying intrusions. The surface expression of forced folds can therefore be inverted to constrain intruding magma body properties, whilst ancient forced folds provide a record of sill and laccolith emplacement. Deciphering how shallow-level intrusion translates into roof uplift is thus critical to enhancing our understanding and forecasting of magma emplacement. To-date, emplacement models and surface deformation inversions are underpinned by the consideration that roof uplift is, to a first-order, an elastic process. However, several studies have suggested inelastic processes can accommodate significant magma volumes, implying first-order roof uplift may be a function of elastic and inelastic deformation. In particular, seismic reflection images of forced folds above ancient sills and laccoliths have been used to argue that final fold amplitudes can be substantially less (by up to 85%) than the underlying intrusion thickness. Although these seismic-based observations imply elastic and inelastic deformation accommodated intrusion, these studies do not consider whether burial-related compaction has reduced the original fold amplitude. Here, we use geological (e.g., lithology) and geophysical (e.g., seismic velocity) information from the Resolution-1 borehole offshore eastern New Zealand, which intersects a forced fold and upper ~50 m of a sill imaged in 2D seismic reflection data, to decompact the folded sequence and recover its original geometry. We show the Resolution Sill is likely ~117–187 m thick, depending on the interval velocity for the entire intrusion, whereas the forced fold has an apparent maximum amplitude of ~127 m, corresponding to a sill thickness-fold amplitude discrepancy of up to 47%. Decompaction indicates the original maximum forced fold amplitude likely ranged from ~131–185 m, suggesting post-emplacement, burial-related compaction of this and other forced folds may be the source of apparent discrepancies between fold amplitude and intrusion thickness. Whilst seismic reflection data can provide fundamental insights into how shallow-level emplacement translates into roof uplift and ground displacement, we show decompaction and backstripping are required to recover the original fold geometry. To assess the relative importance of elastic and inelastic space-making processes during the formation of seismically imaged sills and forced folds, we demonstrate that our method should be applied to remove any post-emplacement, burial-related compaction signature.
Introduction
Generating space to accommodate magma emplacement requires deformation of the host rock. Field- and seismic reflection-based studies of ancient intrusions, supported by various physical, numerical, and analytical modeling approaches, reveal sills and laccoliths emplaced at shallow-levels within the upper crust can be accommodated by elastic bending of the overburden and, potentially, the free surface (so-called “roof uplift”; e.g., Gilbert, 1877; Johnson and Pollard, 1973; Pollard and Johnson, 1973; Koch et al., 1981; Fialko and Simons, 2001; Smallwood and Maresh, 2002; Trude et al., 2003; Hansen and Cartwright, 2006; Bunger and Cruden, 2011; Galland, 2012; Galland and Scheibert, 2013; Jackson et al., 2013; Magee et al., 2013a; van Wyk de Vries et al., 2014; Montanari et al., 2017; Reeves et al., 2018). Geodetic data also suggest that short-timescale ground displacements at active volcanoes, generated by sill or laccolith emplacement, reflect elastic deformation (e.g., Pagli et al., 2012; Castro et al., 2016; Ebmeier et al., 2018). These zones of roof uplift mimic the plan-view geometry of underlying intrusion(s) and can thus be described as a form of “forced fold” (e.g., Hansen and Cartwright, 2006; Magee et al., 2013a); i.e., a fold with a morphology controlled by that of a forcing member below (Stearns, 1978). By assuming purely elastic deformation accommodates magma emplacement at shallow-levels, particularly when the intrusion diameter (D) to emplacement depth (d) ratio is >>4, we can expect the original intrusion thickness (T0max) to broadly equal the original amplitude (F0max) of the overlying forced fold (i.e., F0max/T0max = 1) (Pollard and Johnson, 1973; Fialko and Simons, 2001; Hansen and Cartwright, 2006; Jackson et al., 2013).
Seismic reflection data reveal the current maximum amplitude (Fmax) of buried forced folds can be up to 85% less than the measured maximum thickness (Tmax) of underlying, crystallized sills or laccoliths (i.e., Fmax/Tmax < 1; Figure 1A) (Hansen and Cartwright, 2006; Jackson et al., 2013; Magee et al., 2013a). Such discrepancies between fold amplitude and intrusion thickness, particularly where Fmax/Tmax << 1, have been suggested to relate to the accommodation of magma by both elastic and inelastic deformation (Jackson et al., 2013; Magee et al., 2013a, 2017). Syn-intrusion, fracture-driven porosity reduction, faulting, and fluidization of the host rock around exposed sills confirms that inelastic deformation can partly and, perhaps in some instances, fully accommodate magma emplacement (Figures 1B,C) (e.g., Johnson and Pollard, 1973; Morgan et al., 2008; Schofield et al., 2012, 2014; Jackson et al., 2013; Spacapan et al., 2016). It has also been suggested that inelastic ductile strain and vertical compaction of deforming strata can cause fold amplitudes to decay upwards, particularly if D/d is <4 (Hansen and Cartwright, 2006; Jackson et al., 2013). Seismic and field data therefore provide evidence for the accommodation of magma by elastic and inelastic deformation, challenging the assumption that emplacement models need only account for elastic processes (e.g., Galland and Scheibert, 2013; Magee et al., 2013a; Holohan et al., 2017; Scheibert et al., 2017; Gerbault et al., 2018).
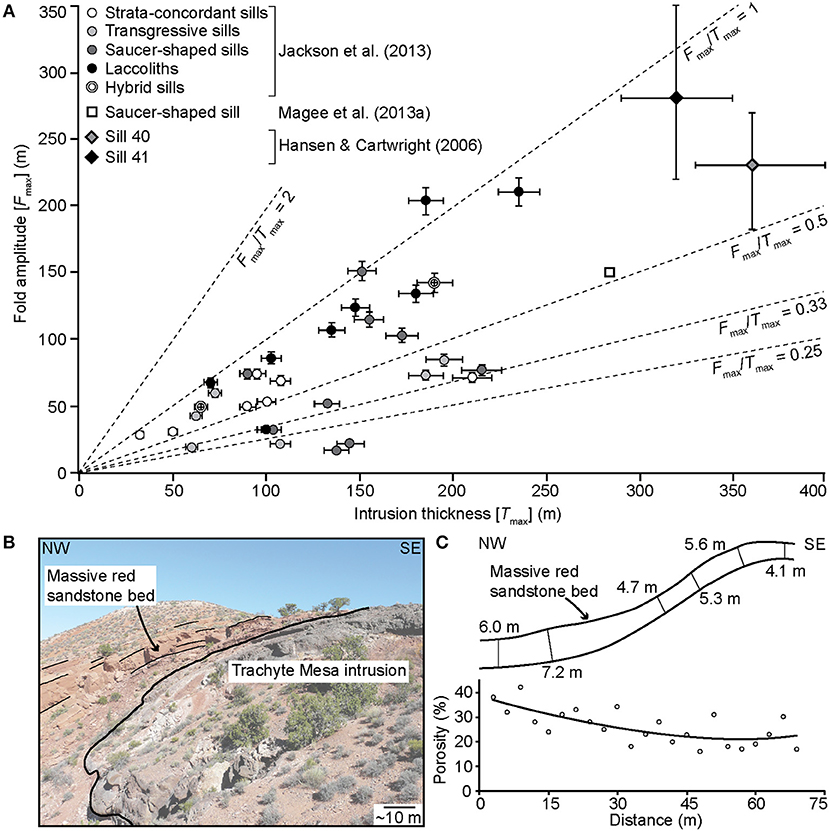
Figure 1. (A) Seismically imaged maximum forced fold amplitudes (Fmax) plotted against maximum measured thicknesses (Tmax) of underlying sills or laccoliths from data within the: (i) Bight Basin, offshore southern Australia (Jackson et al., 2013); (ii) Exmouth Sub-basin, offshore north-western Australia (Magee et al., 2013a); and (iii) Rockall Basin, NE Atlantic (Hansen and Cartwright, 2006). See Jackson et al. (2013) and Hansen and Cartwright (2006) for information on error bars. (B) Field photograph showing folding of sandstone beds above the Trachyte Mesa intrusion in the Henry Mountains, Utah, USA. (C) Sketch showing changes in thickness of a massive red sandstone bed, shown in (B), over the Trachyte Mesa intrusion, which corresponds to a reduction in porosity (after Morgan et al., 2008). The best-fit curve is third order polynomial with an R2 value of 0.49 (Morgan et al., 2008).
Seismic reflection data capture the current, and not necessarily the original, geometry of ancient intrusions and forced folds. For example, original fold amplitudes and sill thicknesses, and the ratio between them, may by modified by the: (i) migration of magma away from the seismically resolved intrusion (Tmax < T0max) coupled with little or no fold subsidence (Fmax > Tmax) (e.g., Reeves et al., 2018); (ii) deflation of the sill in response to crystallization of and/or volatile release from the magma (Tmax < T0max; e.g., Caricchi et al., 2014), which could promote disproportionate fold subsidence (Fmax > Tmax); (iii) erosion of the fold crest (Fmax < Tmax) (Hansen and Cartwright, 2006; Jackson et al., 2013); (iv) interference with neighboring folds (Jackson et al., 2013), which could locally inhibit or enhance folding; and/or (v) burial and compaction of the folded sequence (Fmax < Tmax) (Jackson et al., 2013). No study has yet quantified how post-emplacement, burial-related compaction can modify forced fold geometries and amplitudes. Without incorporating an assessment of how burial-related compaction has affected the seismically resolved forced fold geometry and amplitude, the role of inelastic processes in accommodating magma cannot be determined from seismic reflection data alone.
Here, we examine a saucer-shaped sill, the Resolution Sill, and overlying forced fold imaged in 2D seismic reflection data from the Canterbury Basin, offshore eastern New Zealand and intersected by the Resolution-1 borehole (Figure 2). The borehole penetrates the upper ~50 m of the saucer-shaped sill, which can broadly be categorized as a gabbro. Using velocity information from Resolution-1 we aim to depth convert and decompact the seismic reflection data, allowing us to constrain the original maximum fold amplitude (i.e., F0max) and assess how burial-related compaction impacts fold geometry. We show that burial-related compaction modifies ancient intrusion-induced forced folds within sedimentary basins, reducing discrepancies between fold amplitude and sill thickness. Before using seismic-based examples of ancient intrusion and forced fold pairs to postulate emplacement mechanics at active volcanoes, it is essential to first account for burial-related compaction.
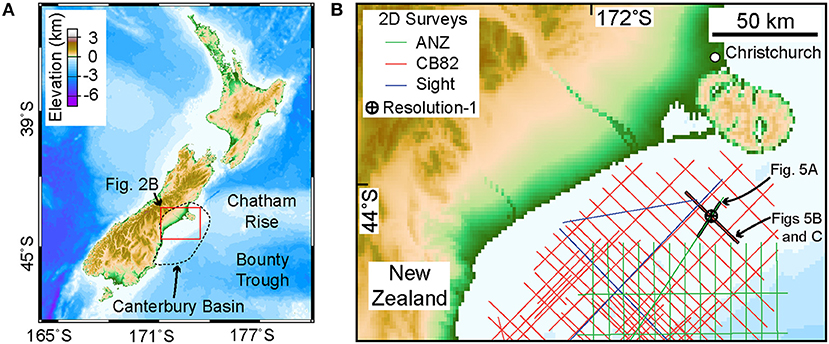
Figure 2. (A) Location of the Canterbury Basin within New Zealand. (B) Location of 2D seismic lines and the Resolution-1 borehole used in this study.
Geological Setting
The Canterbury Basin spans onshore and offshore SE New Zealand and formed during Late Albian-to-Early Campanian rifting between New Zealand, Antarctica, and Australia (Figure 2) (Fulthorpe et al., 1996; Lu and Fulthorpe, 2004). The basement typically corresponds to greywacke and argillite meta-sedimentary rocks of the Torlesse Supergroup (Permian-to-Early Cretaceous; Figure 3) (Uruski, 2010). In the north of the basin, within the study area, syn-rift sedimentary strata deposited within graben and half-graben are dominated by the paralic coal measures of the Broken River Formation, and marine siltstones and mudstones of the Conway Formation (Figure 3) (Carter, 1988; Killops et al., 1997; Schiøler et al., 2011). Onset of post-rift, thermal subsidence in the Maastrichtian led to the deposition of the high-energy marine Charteris Bay Sandstone (Lower Paleocene), which is overlain by tuffs of the View Hill Volcanics, mudstones of the Conway Formation, and calcareous marine mudstones of the Ashley Formation (Figure 3) (Carter, 1988; Killops et al., 1997; Schiøler et al., 2011). Micritic limestones attributed to the Amuri Formation were deposited between the Early Oligocene and Early Miocene, although the majority of this time period corresponded to the development of a regional unconformity across much of the Canterbury Basin (Figure 3) (Carter, 1988; Killops et al., 1997; Schiøler et al., 2011). Uplift along the Alpine Fault, and an associated increase in the supply of terrigenous silt and sand, resulted in the deposition of the marine Tokama Siltstone, which locally contains tuffs belonging to the Harper Hills Basalt (K-Ar ages of 13.5 ± 0.4–11.0 ± 0.3 Ma), and overlying Kowai Formation (Early Miocene-to-Recent; Figure 3) (Sewell and Gibson, 1988; Lu et al., 2005).
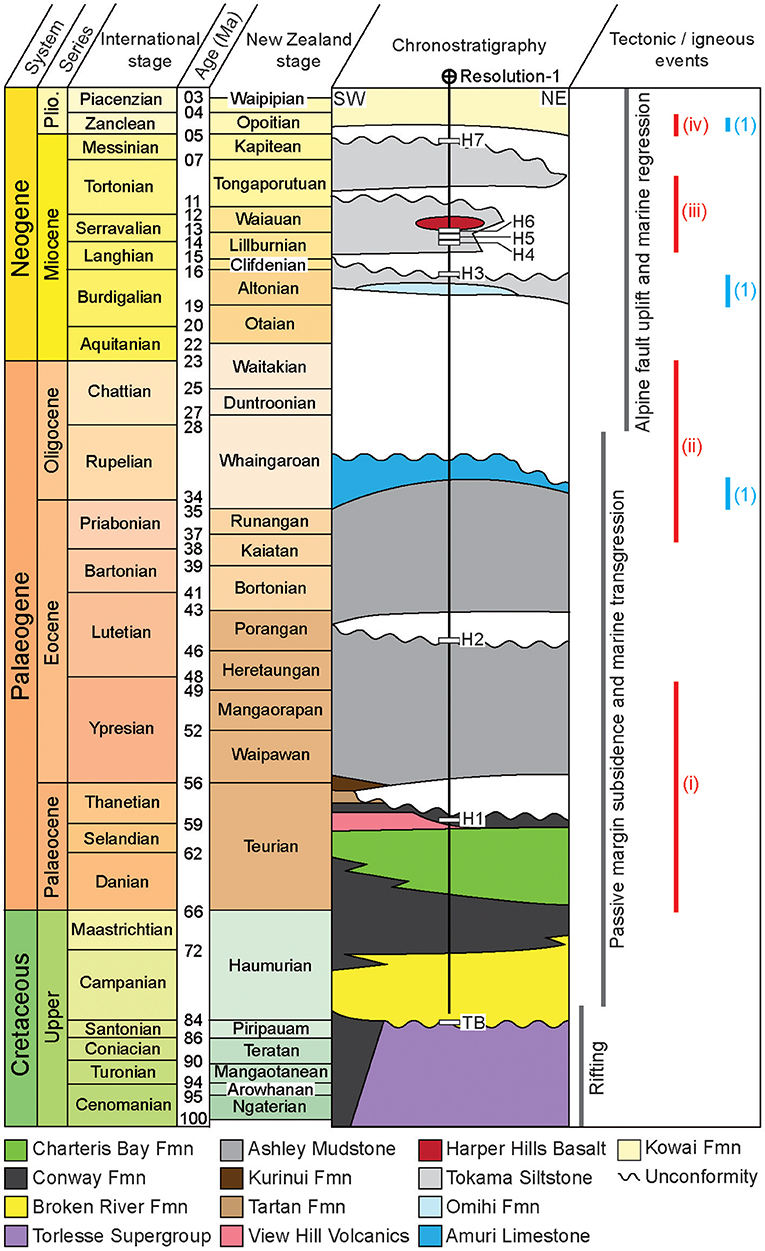
Figure 3. Chronostratigraphic chart for the northern Canterbury Basin around Resolution-1, highlighting different tectonic and igneous events (based on Carter, 1988; Fulthorpe et al., 1996; Killops et al., 1997; Timm et al., 2010; Uruski, 2010; Schiøler et al., 2011; Reeves et al., 2018). Igneous events from Timm et al. (2010) correspond to: (i) Geraldine and Timaru Lavas; (ii) Banks Peninsula; (iii) Cookson Volcanics; (iv) View Hill, Central Canterbury. (1) Offshore sill emplacement events (Reeves et al., 2018). Fmn, formation.
Several discrete phases of intra-plate, post-Cretaceous magmatism and volcanism have been recorded in the Canterbury Basin, including the View Hill Volcanics and the Harper Hills Basalt (Figure 3) (e.g., Timm et al., 2010; Reeves et al., 2018). It has been suggested that volcanism occurred in response to decompression melting of upwelling heterogeneous asthenospheric mantle following localized removal of gravitationally unstable lithospheric material (Timm et al., 2010).
Dataset
Borehole Data
Resolution-1 is located ~50 km south of Christchurch (Figure 2) and was drilled in 1975 for Shell BP Todd Canterbury Services Ltd (Milne et al., 1975). The borehole was drilled in a water depth of 64 m and extends to a total depth of 1,963.05 m, intersecting the Resolution Sill between 1,911.5 and 1,963.05 m (Milne et al., 1975). Data available for the borehole include (Milne et al., 1975): (i) a well-completion report containing petrological descriptions of cuttings and sidewall core, sampled every 5 m between 1,910 and 1,958 m, and continuous core collected between 1,958.2 and 1,963.05 m within the sill; (ii) sonic (ΔT), gamma ray (GR), caliper (CAL), and spontaneous potential (SP) logs (Figure 4); (iii) a petrophysical summary log plot; (iv) well-formation tops, ages, and lithological descriptions; and (v) K-Ar ages of 12 ± 2 Ma for the sill. Density logs, neutron porosity logs, thin sections, or photomicrographs are not available to corroborate the petrographic descriptions.
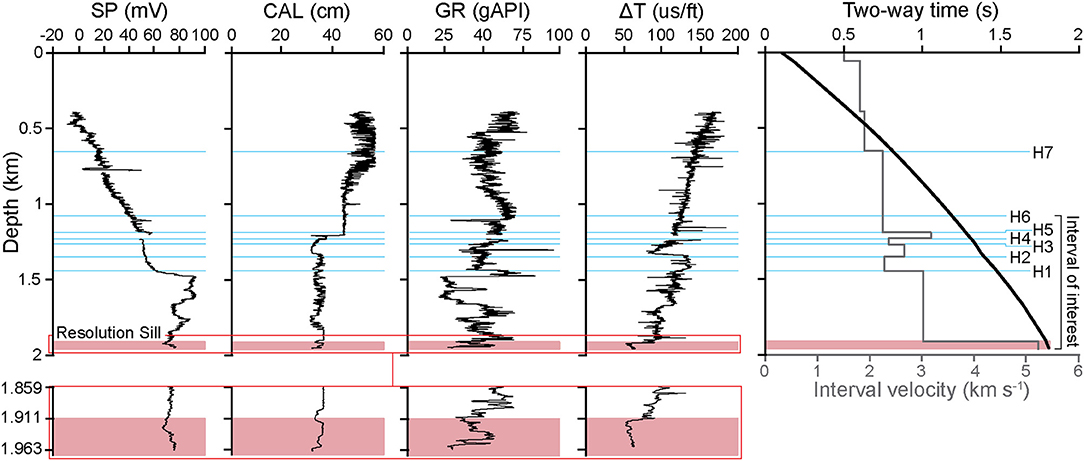
Figure 4. Spontaneous potential (SP), Caliper (CAL), Gamma ray (GR), and Sonic (ΔT) logs from the Resolution-1 borehole plotted against depth. A plot of two-way time and interval velocity changes with depth is also shown. The locations of the mapped horizons and the Resolution Sill are highlighted.
Resolution-1 has sparse time-depth information. To facilitate depth-conversion of the seismic reflection data, we therefore derived a time-depth curve by integrating sonic log data after using a median filter with a window of five samples to remove spikes caused by sample skipping (Figure 4). The sonic log data were also used to calculate a compressional wave (Vp) velocity log by taking the reciprocal of the interval transit time log and converting from feet to meters, and to define average interval velocities for different units (Figure 4). For example, the average interval velocity within the Resolution Sill intersected by the borehole is 5.2 km s−1 (Figure 4), with a standard deviation of 0.3 km s−1. Although the average interval velocity of the sill where it is intersected by Resolution-1 can be defined (i.e., 5.2 km s−1), the borehole does not extend through the entire intrusive body; as a result, we model a range of sill velocities (4.5–6.0 km s−1) to estimate possible intrusion thicknesses (Smallwood and Maresh, 2002). Velocity data in the water column and the shallowest sedimentary strata were not recorded, so we assume values of 1.5 km s−1 between 0 and 64 m (i.e., seawater) and 1.8 km s−1 between 64 and 385 m (i.e., near-seabed sediments) (Figure 4).
Petrological Description of the Resolution Sill
The petrological description of the Resolution Sill was provided by Dr. G. A. Challis of the New Zealand Geological Survey (Milne et al., 1975). Based on 5 m-spaced cuttings collected between 1,911.5 and 1,958 m, the Resolution Sill is best described as a medium-to-coarse grained quartz gabbro comprising plagioclase, quartz, titanaugite, and aegerine. Minor amounts of magnetite, ilmenite, and biotite also occur. Some fine-grained, glassy, black rock chips, which contain white spherules, originate from the top contact chilled margin (see below).
At the top of the continuous core collected from the Resolution Sill, which corresponds to a depth of 1,958.2 m, the intrusion is a coarse-grained quartz syenogabbro primarily comprising titanaugite rimmed by aegerine augite, zoned plagioclase (labradorite to oligoclase) rimmed by anorthoclase, and ilmenite; fine-grained, quartz, biotite, apatite, and chlorite also occur (Table 1). Below 1,958.3 m, quartz is absent and the Resolution Sill can be broadly classified as a teschenite that consists of plagioclase, titanaugite, analcite, anorthoclase, and occasionally olivine with accessory apatite, ilmenite, magnetite, and zeolites (Table 1). Variations in the abundance of olivine and titanaugite between ~1,958 and 1,963 m indicate the Resolution Sill is subtly layered (Table 1).
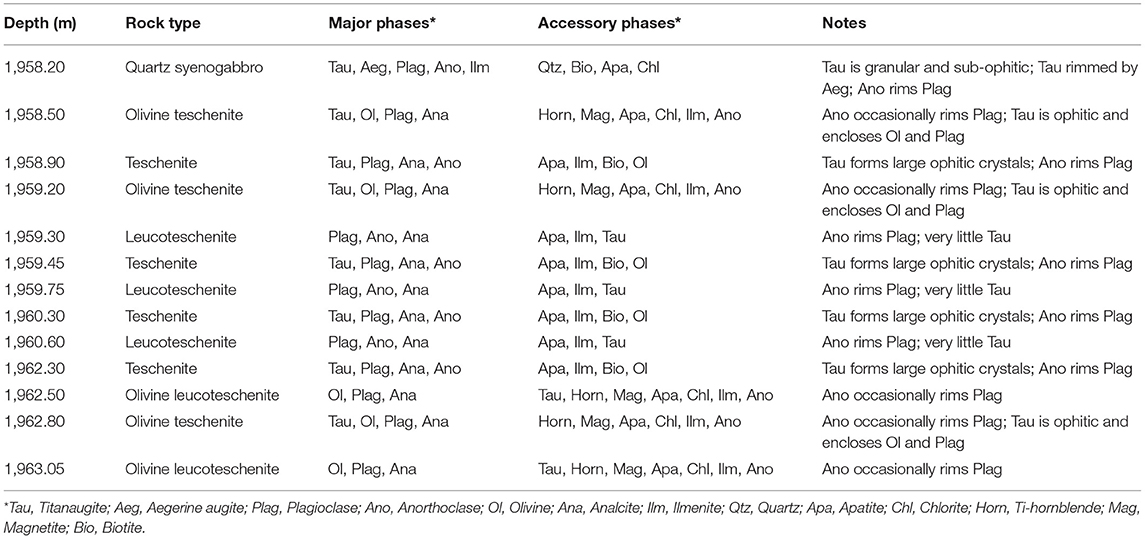
Table 1. Resolution-1 continuous core petrology.
Petrological analyses of cuttings reveal that a 44 m thick (from 1,877.5 to 1,911.5 m) sedimentary succession directly overlying the sill is heavily pyritised and contains abundant zeolites; this is particularly marked in the first 25 m above the sill. These mineral phases may have formed in response to contact metamorphism or hydrothermal alteration and, thereby, potentially define the thermal aureole of the Resolution Sill (Figure 4).
Seismic Reflection Data
This study utilizes three, zero-phase, time-migrated, 2D seismic reflection surveys (the ANZ, CB82, and Sight surveys; Figure 2). We focus on an area that covers ~3,000 km2 and has a total seismic line length of ~484 km (Figure 2). Line spacing for the different vintage seismic data ranges from 3.5 to 16 km (Figure 2B). Seismic data are displayed with a zero-phase SEG normal polarity; a downward increase in acoustic impedance correlates to a positive (black/red) reflection, whilst a negative (white/blue) reflection corresponds to a downward decrease in acoustic impedance (Figure 5). Interval velocities derived from borehole data were used to convert the seismic reflection data from depth in seconds two-way time (TWT) to depth in meters (Figures 4, 5). We only depth-converted data above Top Basement because the lithology and physical properties (e.g., Vp) of the underlying Torlesse Supergroup are unknown (Figure 5C).
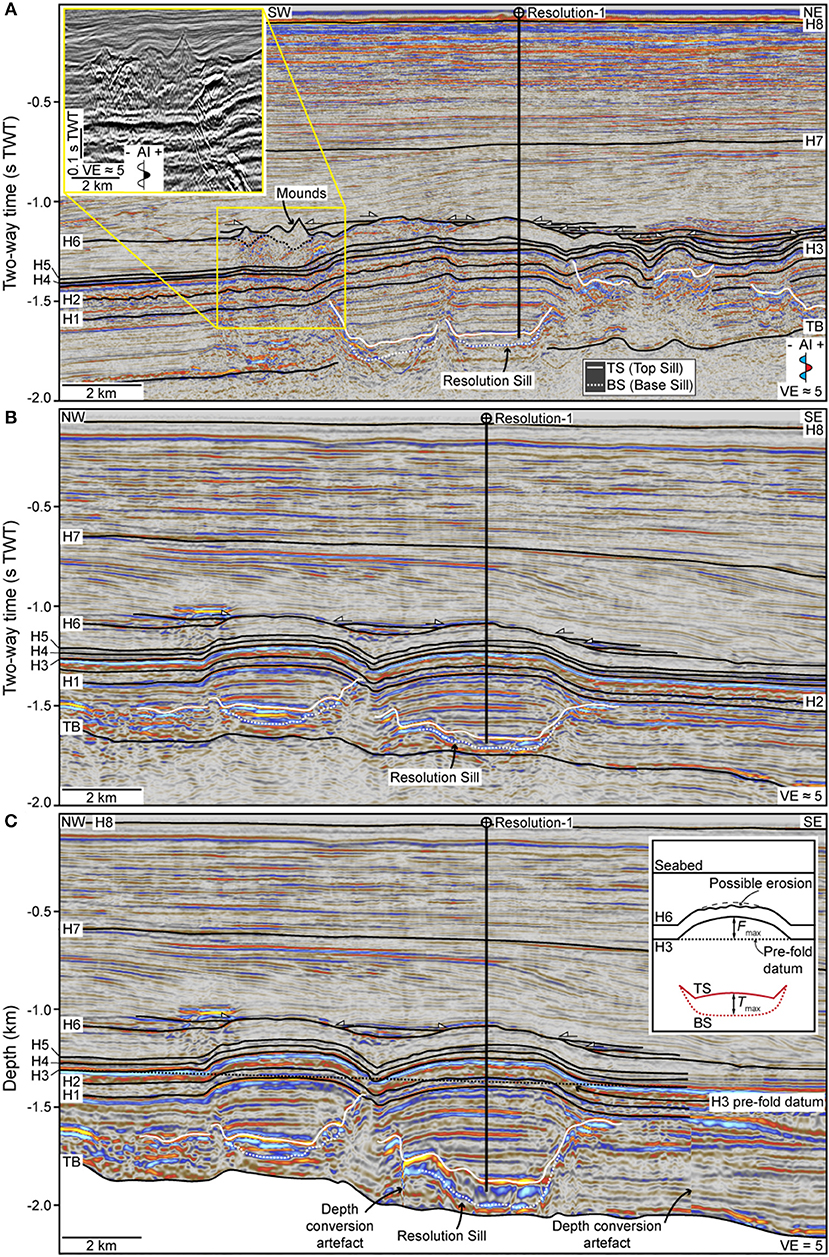
Figure 5. (A,B) Interpreted, time-migrated seismic sections imaging the Resolution Sill and neighboring intrusions. Mapped stratigraphic horizons are marked and white-filled arrows highlight onlap onto H6. Inset in (A) shows an uninterpreted, zoomed-in view of the mounded structures. AI, acoustic impedance and VE, vertical exaggeration. See Figure 2B for location of the seismic lines. Uninterpreted sections provided in Supplementary Figure 1. (C) Depth-converted version of the seismic section shown in (B). Inset schematically shows how erosion may modify the top of the fold and how Fmax and Tmax were measured.
Data Resolution
The resolution of a studied interval in seismic reflection data is dependent on the dominant wavelength (λ) of the seismic waves, with λ = v/f, where v is he interval velocity and f is the dominant frequency (Brown, 2011). In order to distinguish reflections emanating from two distinct boundaries (e.g., the top and base of a sill), their vertical distance needs to exceed the limit of separability (~λ/4) for the data (Brown, 2011). If the vertical distance between the boundaries is less than the limit of separability, the two reflections will interfere on their return to the surface and cannot be deconvolved; they will appear as tuned reflection packages, the true thickness of which cannot be determined (Brown, 2011). The limit of visibility (~λ/30) defines the minimum vertical distance between two boundaries required to produce a tuned reflection package that can be distinguished from noise in the seismic reflection data (Brown, 2011). Interval velocities of 2.2–3.2 km s−1 for the sedimentary sequence in the section of interest (Figure 4), coupled with a seismic dominant frequency that decreases with depth from ~40 to 25 Hz, suggests that the limits of separability and visibility for the data decrease with depth from ~32 to 14 m and ~4 to 2 m, respectively. Assuming the entire Resolution Sill has an interval of velocity of 5.2 km s−1, equal to that of the upper 50 m intersected by Resolution-1, a surrounding dominant frequency of ~25 Hz indicates its limits of separability and visibility are ~52 and ~7 m, respectively. However, if we consider that the average interval velocity of the Resolution Sill is more variable (i.e., 4.5–6.0 km s−1), the maximum limits of separability and visibility may be ~60 and ~6 m, respectively. Reflections from the top and base of the Resolution Sill where it is >60 m thick will therefore be distinguishable in the seismic data, whereas parts of the sill <60 m thick but over >6 m thick will be expressed as tuned reflection packages (see Smallwood and Maresh, 2002; Magee et al., 2015; Eide et al., 2018). Where the Resolution Sill is <7 m thick, it is unlikely to be detectable in the seismic reflection data.
Seismic Interpretation
The study area contains several high-amplitude reflections that are laterally discontinuous and can typically be sub-divided into a strata-concordant inner region surrounded by a transgressive, inward-dipping limb; i.e., they display a saucer-shaped morphology (Figure 5). We mapped these reflections and interpret them as sills because: (i) one corresponds to the Resolution Sill intersected by the Resolution-1 borehole (Figure 5); and (ii) they are geometrically similar to igneous saucer-shaped sills observed in the field and imaged in other seismic reflection datasets (e.g., Thomson and Hutton, 2004; Planke et al., 2005; Polteau et al., 2008a; Magee et al., 2016a). For all sills we mapped the top contact (TS) and, where seismically resolved, the base sill (BS) (Figure 5). In addition to sills, we mapped nine key seismic horizons and tied them to the Resolution-1 borehole (Figures 3–5): TB = Top Basement (~84 Ma); H1 = Intra-Conway Formation unconformity, above the View Hill volcanics (Mid-Paleocene, ~58 Ma); H2 = Intra-Ashley Formation unconformity (Mid-Eocene, ~45 Ma); H3 = Top Omihi Formation (Early Oligocene, ~16 Ma); H4 = lowermost Intra-Tokama Formation (Early to Mid-Miocene, ~14 Ma); H5 = Intra-Tokama Formation (Mid-Miocene, ~14 Ma); H6 = Base Harper Hill Basalts (Mid-Miocene, ~13.5 ± 0.4 Ma) and top of the force folds; H7 = Top Tokama unconformity (Miocene to Pliocene, ~6 Ma); and H8 = seabed.
The limited resolution of the seismic reflection data means we cannot ascertain whether erosion has modified the geometry of the fold top (i.e., H6) and reduced its amplitude post-emplacement (e.g., Figure 5C). We therefore measure amplitude along the prominent intra-fold horizon H3 (e.g., Figure 5C). To determine fold amplitude we measure the vertical distance between the top of H3 and an inferred pre-fold datum constructed by extrapolating the regional trend of H3 from areas where there are no sills or forced folds (Figure 5C inset). The maximum vertical distance between H3 and the pre-fold datum is the maximum fold amplitude (Fmax; Figure 5C). Sill thickness is measured as the vertical distance between TS and BS, with the maximum sill thickness defined by Tmax (Figure 5C).
Decompaction and Backstripping
Whilst several studies suggest cases where Fmax/Tmax << 1 reflects magma accommodated by elastic and inelastic deformation processes, they do not quantitatively evaluate the role of burial and compaction in modifying forced fold geometry (Jackson et al., 2013; Magee et al., 2013a, 2017). Loading of sedimentary sequences during burial promotes progressive loss of porosity with depth (i.e., compaction), and causes beds to become thinner and structures (e.g., faults) to flatten. The compaction of strata at any given depth is controlled by its lithology and lithostatic load. Because crystalline intrusive rocks have virtually no porosity and can be considered incompressible, Tmax will not change with burial. However, compaction of the overlying sedimentary sequence is expected to reduce Fmax and therefore decrease of Fmax/Tmax. The sedimentary sequence adjacent to the sill is overlain by a thicker column of sediment/rock, meaning it will compact more than where it is folded above the sill; this variation in lithostatic load across the fold can promote differential compaction (Hansen and Cartwright, 2006; Schmiedel et al., 2017). Evaluating the role of post-emplacement compaction in modifying forced folds is critical to establishing the relationship between the original maximum fold amplitude (F0max) and intrusion thickness, which can be used to inform interpretation of emplacement mechanics. To extract F0max, we decompact and backstrip the forced fold. Note we do not take into account processes that may alter sill thickness (e.g., contraction during crystallization; Caricchi et al., 2014) and thus assume Tmax = T0max.
Forward Modeling
Decompacting and backstripping sedimentary sequences imaged in depth-converted seismic reflection data involves restoring the initial porosity (φ0) of strata at the top of the sequence from its current porosity (φ), by removing its overburden. This technique normally involves estimating a porosity log from sonic log data using either the Wyllie time-average method or Raymer-Hunt-Gardner empirical relationship (Wyllie et al., 1956; Raymer et al., 1980). However, given the shallow depth of our interval of interest (i.e., 1–2 km) and the limited log data available (e.g., there is no density log), we cannot reliably assess the accuracy of current porosity logs derived from these methods. We therefore apply forward modeling techniques to establish whether plausible decompacted and backstripped scenarios are realistic and how they impact fold geometry. In particular, based on the lithological information from Resolution-1, we model a series of different parameter ranges and combinations to assess potential variations between sill thickness and the original fold amplitude. Because estimates of φ0 and the compaction length scale (λ), which is the inverse of the compaction coefficient, are not available, we model a range of realistic values (Sclater and Christie, 1980): (i) φ0 is considered to range from 0.7 to 0.25, consistent with a range of siliciclastic sequences; and (ii) λ ranges from 3.7 to 1.4 km.
Forward modeling involved the standard back-stripping procedure described by Sclater and Christie (1980). The most common function used to model porosity decay with depth is the exponential relationship:
where z is depth below seafloor. Considering the rock matrix fraction (m) complements porosity (Smallwood, 2009), whereby
we can relate the pre- and post-compactional stratal thicknesses via conservation of mass to give:
where z1 and z2 are the initial top and base depths of the sediment package in question (i.e., the present day depth, below the seafloor, of the top forced fold and top sill, respectively), and z3 and z4 are the original depth below the seafloor of the top and base of the sedimentary package (i.e., the original depth of the forced fold is at the seafloor, hence z3 = 0, and z4 is the depth of the sill we solve to find). Substituting equations 1 and 2 into equation 3 and integrating gives:
We solve equation 4 numerically to find the thickness of the original thickness of the folded sedimentary section (i.e., z4 – z3) along individual vertical traces; by calculating equation 4 along vertical traces across the width of the sill-fold pair, we recover the original geometry of the forced fold. Because we do not know the correct input values for φ0 or λ, we calculated multiple iterations of equation 4 using different, realistic combinations of φ0 (0.7–0.25) and λ (3.7–1.4). This method assumes the folded layer has no elastic thickness, which we consider reasonable because much of the folded section was likely unlithified during deformation. Assuming forced folds have very little, or no, elastic thickness is consistent with forced folds having similar diameters to underlying intrusions (e.g., Hansen and Cartwright, 2006; Jackson et al., 2013).
Observations
Resolution Sill
Resolution Sill Well-Log Response
The Resolution Sill is characterized by an abrupt increase in Vp, from ~3.0 km s−1 in the overlying strata to ~5.2 km s−1 within the sill (Figure 4). Within the sill itself, values of Vp, GR, and SP vary substantially on a meter to decameter-scale (Figure 4).
Geometry
The Resolution Sill is observed on two seismic lines, with its top corresponding to a high-amplitude, positive polarity reflection (TS; Figures 4, 5). Where the base of the sill is resolved, it is characterized by a discrete, moderate-to-high amplitude, negative polarity reflection (BS) that appears to coincide with the top of the basement (TB) at a present day depth of ~2 km (Figure 5). Although the Resolution Sill can only be mapped on two 2D seismic lines, the constraints these data provide on lateral sill tip locations allow us to interpolate its 3D geometry within a sill outline derived from comparison to exposed and seismically imaged sills (e.g., Chevallier and Woodford, 1999; Planke et al., 2005; Hansen et al., 2008; Polteau et al., 2008b; Magee et al., 2014, 2016a). Overall, the 54 km2 sill has an elliptical, saucer-shaped morphology with a NW-trending, long axis of ~6.2 km and a NE-trending short axis of ~2.8 km (Figure 6). The strata-concordant inner sill is sub-circular, with a diameter (D) of ~2.2 km, passing laterally into gently (8°), inward-dipping, up to ~0.4 km high transgressive limbs to the SE and NW (Figures 5, 6). Toward the south-eastern edge of the Resolution Sill, at its shallowest level, the transgressive limb transitions into a strata-concordant outer rim (Figures 5, 6).
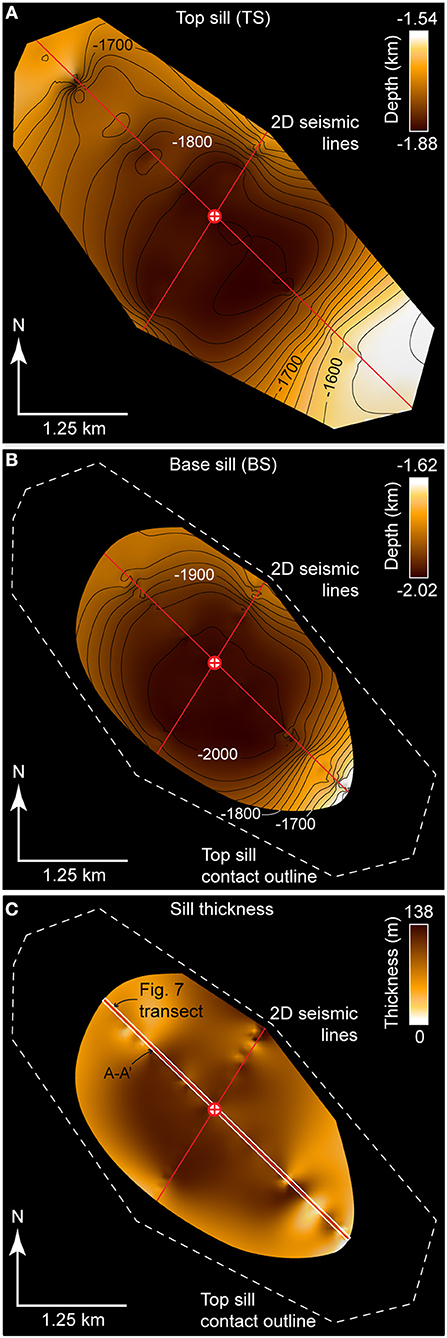
Figure 6. (A,B) Depth-structure maps of top (TS) and base (BS) saucer-shaped sill reflections interpolated from interpretation of the sill on the two seismic lines (thin white lines) in Figure 5. The selected sill outline is constrained by the seismic reflection data and assumes the sill likely has an elliptical shape, similar to sills observed elsewhere (see Hansen et al., 2008). (C) Thickness map of TS–BS, i.e., where both horizons can be seismically resolved, assuming a constant sill interval velocity of 5.02 km s−1.
Intrusion thickness appears variable across the strata-concordant inner sill, although there is a first-order decrease away from the center; assuming an interval velocity of 5.2 km s−1 for the entire sill, its thickness ranges from ~138 m (Tmax) to ≤52 m (Figures 6C, 7). Superimposed onto this outward-thinning trend within the inner sill are apparently several abrupt changes in sill thickness (e.g., there is a ~75 m change at A-A′; Figure 7). However, because the lower portion of the sill is not intersected by Resolution-1, we do not know if it is characterized by similar velocities. We also do not know whether the interval velocity of the sill varies laterally. We therefore calculate sill thickness using a range of feasible interval velocities (i.e., 4.5–6.0 km s−1). The envelope calculated for this velocity range constrains how thickness may vary along-strike when the sill velocity across (i.e., vertically and laterally) the intrusion is constant (e.g., 4.5 or 5.2 km s−1) or variable (e.g., if the velocity decreases toward its edges) (Figure 7). For a range of interval velocities, we show the sill: (i) could be up to ~187 m thick (i.e., Tmax); (ii) maintains a first-order decrease in thickness from its center outwards; and (iii) thickness still appears to show local, abrupt variations, although the magnitude of these changes may be limited depending on how velocity varies laterally (Figure 7). For example, dependent on the sills velocity configuration, the thickness change at A-A′ could be up to ~149 m, or down to ~17 m. The outer portions of the transgressive sill limbs are defined by tuned reflection packages, such that their vertical thickness cannot be measured; where tuning occurs we consider intrusion thickness can range from 60 to 6 m (i.e., the limits of separability and visibility, respectively) (Figures 5, 7).
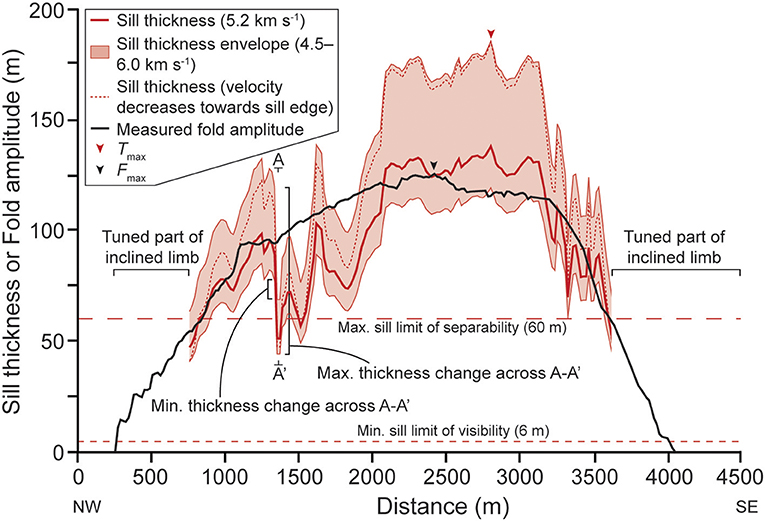
Figure 7. Plot of amplitude across the fold, at H3, measured directly from the seismic reflection data (i.e., Figure 5C). We also show a range of sill thicknesses, for different seismic interval velocities, across the intrusion where TS and BS can be distinguished; a sill thickness profile considering a seismic interval velocity of 5.2 km s−1 is particularly highlighted because this is the average interval velocity for the upper 50 m of the intrusion where it is intersected by the Resolution-1 borehole. Thicknesses are not shown where the sill corresponds to a tuned reflection package along the inclined limbs, but we do highlight the maximum (max.) limit of separability and minimum (min.) limit of visibility for the sill. Note the lateral offset of Fmax and Tmax.
The Resolution Sill is bordered to the SW, NW, and NE by three additional saucer-shaped sills; we are unable to constrain the 3D geometry of these neighboring sills because they cannot be mapped sufficiently on multiple seismic lines (Figure 5). In cross-section, the sills to the SW and NW display similar geometries and emplacement depths to the Resolution Sill, whereas the base of the north-eastern sill broadly coincides with Horizon H1 (Figure 5).
Host Rock Structure
Strata directly above the Resolution Sill, up to H6, are folded (Figures 5, 8). The ~58 km2, elliptical (i.e., ~6.2 km × 3 km) dome is relatively flat-topped, with uplift primarily accommodated by monoclinal bending directly above the transgressive limbs of the Resolution Sill, which cross-cut the lowermost folded strata (Figures 5, 8). The top of the fold corresponds to H6, i.e., the ~12.5 Myr old base of the 9 m thick Harper Hills Basalt, and is onlapped by overlying, sub-horizontal strata of the Tokama Siltstone (Figures 3, 5). Whilst these seismic-stratigraphic onlap relationships indicate H6 represented the syn-intrusion free surface, the limited resolution of the seismic reflection data means we cannot ascertain whether erosion has subtly modified the geometry of the fold crest. The maximum fold amplitude (Fmax) at H3 is ~127 m, with amplitude gradually and smoothly decreasing toward the fold periphery (Figure 7). The vertical distance between H6 and TS is ~0.75 km (Figure 5C).
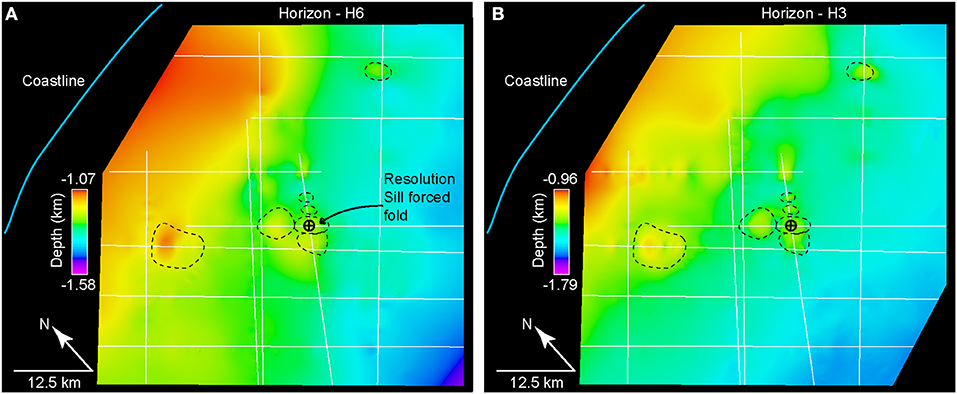
Figure 8. (A,B) Depth-structure maps of horizons H6 and H3, highlighting the location of the Resolution-1 borehole and intrusion-induced forced folds (black dashed lines) in the vicinity. 2D seismic lines (white lines) also shown.
Similar folds are developed above the three sills neighboring the Resolution Sill; the top of these folds all occur at H6 and their boundaries directly overlie lateral sill tips (Figures 5, 8). Although these forced folds merge in places to form compound forced folds (see Magee et al., 2014), depth-conversion of available 2D data suggests our inferred pre-fold datum captures the regional trend of the folded strata (e.g., Figure 5C). The supra-sill fold to the SW of the Resolution Sill is associated with several mound-like structures marked by moderate-amplitude, positive polarity (black) reflections that downlap onto Horizon H6 and themselves are onlapped H6–H7 strata (Figure 5A). These mounds are up to ~315 ms TWT high (their height in meters cannot be calculated without knowledge of their Vp) and have diameters up to ~3.5 km. The mounds appear to have erosional bases that truncate underlying strata, including H6 (Figure 5A). Internal reflections within the mounds are relatively poorly imaged but appear to have a convex-upwards morphology (Figure 5A).
Fold Amplitude Compared to Sill Thickness
The maximum sill thickness (Tmax) is estimated to be ~138 m, but may range from ~117–187 m thick depending on the interval velocity of the entire sill (Figure 7). The maximum fold amplitude (Fmax) measured at H3 is ~127 m (Figure 7). Tmax may thus be up to 47% greater than Fmax. Comparing these intrusion and fold measurements suggests Fmax/Tmax is ~0.92, potentially ranging from ~0.68–1.09. We also note there is a lateral offset of ~400 m between the locations of Fmax and Tmax (Figure 7). Fold amplitude and sill thickness both display a first-order decrease toward their peripheries, although sill thickness does appear to vary abruptly in places where fold amplitude does not (Figure 7). It is difficult to determine how fold amplitude relates to the thickness of the transgressive limbs because the latter are only expressed as tuned reflection packages so only their maximum (i.e., the limit of separability, 60 m) and minimum (i.e., the limit of visibility, 6 m) thicknesses can be constrained (Figures 5, 7).
Decompaction and Backstripping Results
Decompaction of the amplitude profile across the top of the fold intersected by Resolution-1 reveals that its shape is maintained but its maximum amplitude increases from ~127 m (i.e., Fmax) to up to ~131–185 m (i.e., F0max; Figure 9). Uncertainties in the decompaction input parameters means the original fold amplitude profile cannot be absolutely determined. Although calculated F0max/Tmax values range from 0.70 to 1.58, the breadth of which is a function of the broader range of possible scenarios compared to Fmax/Tmax, it is clear there is a greater overlap between likely sill thicknesses and amplitude values after decompaction (Figure 9). Following decompaction, the vertical distance between H6 and TS (i.e., the emplacement depth) is ~0.8 km.
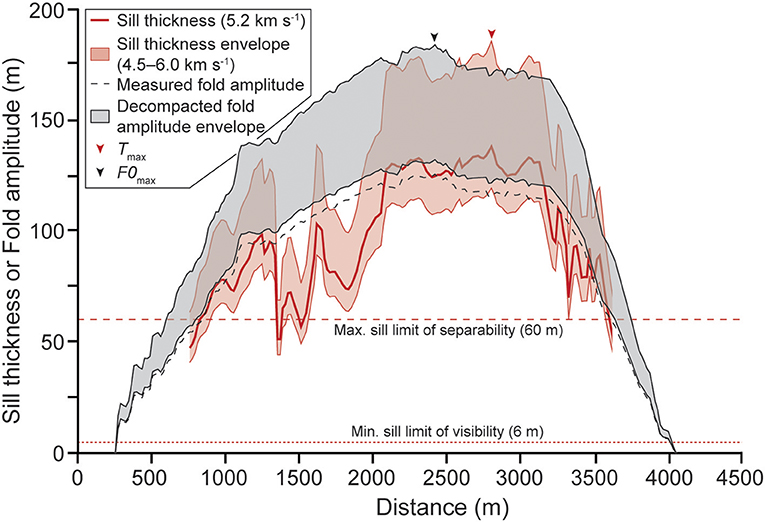
Figure 9. Plot of fold amplitude and sill thickness across the seismic line in Figure 5C, highlighting how the measured fold shape and amplitude changes if the seismic data is decompacted and backstripped.
Discussion
Timing of Sill Emplacement and Forced Folding
The top of the forced fold overlying the Resolution Sill corresponds to Horizon H6, where a thin tuff, which is genetically related to the Harper Hills Basalt, is interbedded with the Tokama Siltstone (Figure 5). Onlap of the marine, middle-to-late Miocene Tokama Siltstone onto Horizon H6 suggests it formed the paleo-seabed during sill emplacement and forced folding. Where exposed onshore, the tholeiitic Harper Hills Basalts have K-Ar ages ranging from 13.5 ± 0.4 to 11.5 ± 0.3 Ma (Sewell and Gibson, 1988), which can be used as a proxy for the age of H6. This potential age range for H6 overlaps with the radiometric date obtained for the Resolution Sill (i.e., 12 ± 2 Ma; Milne et al., 1975), suggesting sill emplacement and forced folding occurred ~12 Ma.
Sills and forced folds adjacent to the Resolution Sill display similar seismic-stratigraphic relationships (i.e., H6 marks the fold tops) and, in places, are overlain by mound-like features we interpret as volcanoes based on: (i) their moderate-to-high amplitude, positive polarity top contacts indicative of a downward increase in seismic velocity and density, consistent with a transition from sedimentary to igneous rocks (e.g., Symonds et al., 1998; Planke et al., 2005); (ii) observed truncation underlying strata, similar to eye-shaped hydrothermal vents, suggesting they formed via explosive activity (e.g., Jamtveit et al., 2004; Planke et al., 2005; Hansen, 2006; Magee et al., 2016b); and (iii) they have similar geometries and internal architectures to volcanic vents and volcanoes observed in other sedimentary basins (e.g., Symonds et al., 1998; Jackson, 2012; Magee et al., 2013b). Overall, our seismic-stratigraphic observations, coupled with radiometric dating of the Resolution Sill and the Harper Hills Basalt onshore, indicate a phase of magmatism and volcanic activity across the northern Canterbury Basin during the Mid-Miocene (Sewell and Gibson, 1988; Timm et al., 2010).
Emplacement Mechanics and Burial-Related Compaction
For shallow-level sills and laccoliths accommodated purely by elastic bending of the overburden, we may expect the original fold amplitude, measured at the fold top, and sill thickness to be broadly equal (i.e., F0max/T0max = 1) (e.g., Pollard and Johnson, 1973; Fialko and Simons, 2001; Hansen and Cartwright, 2006; Jackson et al., 2013). The ratio between the original fold amplitude and sill thickness is partially controlled by the ratio of the inner sill diameter (D) and depth of emplacement (d), with larger sills intruded at shallower depths capable of generating more bending, and thus uplift of the contemporaneous free surface, than a smaller sill at greater depths (e.g., Pollard and Johnson, 1973; Fialko and Simons, 2001; Hansen and Cartwright, 2006; Jackson et al., 2013). In particular, if the D/d ratio is >4, it is considered that the overburden will not resist bending and elastic deformation will therefore fully accommodate magma emplacement (Pollard and Johnson, 1973; Hansen and Cartwright, 2006). Decompaction of our data indicates the Resolution Sill, which has an inner sill diameter (D) of ~2.2 km, was emplaced at a depth (d) of ~0.8 km beneath the contemporaneous surface (i.e., H6) and thus had a D/d ratio of ~2.75. Given a D/d ratio < 4, the model of Pollard and Johnson (1973) suggests that the overburden may have resisted bending and, in addition to elastic deformation, promoted inelastic vertical compaction or ductile strain, thereby suppressing forced fold amplitude (i.e., F0max < T0max) (see also Hansen and Cartwright, 2006; Jackson et al., 2013).
In contrast to previous studies, we quantitatively assess the impact post-emplacement compaction during burial has on fold geometry (principally amplitude) and, therefore, F0max/Tmax as opposed to Fmax/Tmax (cf. Hansen and Cartwright, 2006; Jackson et al., 2013; Magee et al., 2013a, 2017). We show that following decompaction and backstripping, the overall fold geometry is maintained but its amplitude increases from 127 m (Fmax) up to 131–185 m (F0max) (Figure 9). These potential F0max values, coupled with a sill thickness of 117–187 m, means F0max/Tmax ranges from 0.70 to 1.58; this is greater than our measured Fmax/Tmax range (i.e., 0.68–1.09), which we attribute to the broader range of scenarios we test in calculating F0max/Tmax. Considering uncertainties in the various parameters controlling F0max/Tmax measurement (e.g., sill and strata interval velocities, incorrect extrapolation of the pre-fold datum), our calculated F0max/Tmax range of 0.70–1.58 suggests: (i) fold amplitude and sill thickness could be equal; (ii) fold amplitude may be less than sill thickness by up to ~30%, a scenario consistent with a D/d ratio of ~2.75; or (iii) fold amplitude is greater than sill thickness by up to ~37%, which could occur when thin (i.e., with thicknesses below the limit of visibility) sills that contributed to uplift are not seismically resolved (Reeves et al., 2018). Although uncertainties mean we cannot ascertain the true, original sill-fold relationships, there qualitatively appears to be a better fit between the potential ranges of sill thickness and decompacted fold amplitude (Figure 9).
In addition to burial-related compaction, it is also worth highlighting that Fmax/Tmax discrepancies could be attributed to (Hansen and Cartwright, 2006; Jackson et al., 2013; Magee et al., 2013a): (i) reduction of fold amplitude due to erosion of the fold crest; (ii) incorrect depth conversion; (iii) strain interference with adjacent folds during deformation; (iv) out-of-plane deformation; or (v) changes in intrusion geometry. We measure amplitude from an intra-fold horizon (i.e., H3), so discount erosion of the fold crest as a mechanism for reducing Fmax and producing Fmax/Tmax ratios <1 (e.g., 0.81) (Figure 5C). By using velocity data from Resolution-1 and calculating sill thickness for a range of velocity values means we have better control on depth conversion parameters than previous studies, yet our results highlight Fmax/Tmax discrepancies <1 are still plausible (cf. Hansen and Cartwright, 2006; Jackson et al., 2013; Magee et al., 2013a, 2017). The Resolution Sill and overlying forced fold are adjacent to and abut sill-fold pairs, of the same age, to the NW and SW (Figures 5, 8), implying strain interference between the folds may have enhanced or inhibited fold growth; however, we cannot quantify whether strain interference had a positive of negative impact on Fmax, particularly without access to 3D seismic reflection data. Abrupt, localized variations in thickness across the sill are not reflected by the overlying fold shape (Figures 5, 7, 9); this local decoupling between sill and fold shape may suggest vertical displacement induced by sill intrusion is distributed across an area because the overburden has some flexural strength (see Stearns, 1978). The fold profile we measure thus does not capture and may have been modified by localized out-of-plane deformation or changes in intrusion geometry; these observations imply that relatively simple ground deformation patterns may be generated by intrusions with complex geometries. Whether folded strata respond (i.e., deform) to small-scale changes in intrusion thickness is a function of emplacement depth and various host rock properties (e.g., flexural rigidity, bed thickness, co-efficient of friction between layers) (e.g., Stearns, 1978).
Overall, our work implies that explicitly accounting for burial-related compaction likely reduces measured Fmax/Tmax discrepancies (Magee et al., 2013a; cf. Jackson et al., 2013). We show that emplacement of the Resolution Sill was principally accommodated by elastic bending of the overburden but, without sufficient borehole data to accurately constrain the original fold geometry, cannot confirm whether inelastic deformation also generated space for the intrusion. Further work is required to test the impact of burial-related compaction on the geometry and amplitude of seismically imaged forced folds, and to determine how burial-related compaction signals can be deconvolved from intrusion-related inelastic deformation processes that modify fold geometry.
Conclusions
Elastic bending and uplift of overlying rock and sediment, and potentially the free surface, can accommodate emplacement of shallow-level, tabular intrusions; this intrusion-induced deformation is a form of “forced folding.” Many numerical and analytical models examining sill and laccolith emplacement, as well as inversions of ground displacement data at active volcanoes used to recover information pertaining to subsurface magma movement, typically only incorporate elastic processes and neglect inelastic deformation mechanisms. Whilst the assumption that host rock deformation is purely elastic can be applied to many scenarios, several seismic reflection-based studies have suggested that synchronous elastic and inelastic processes can generate space for magma intrusion. This interpretation that elastic and inelastic processes can accommodate magma, which is supported by some outcrop data and analytical modeling, is based on some seismically imaged forced folds having amplitudes much smaller than the thickness of the underlying intrusion; i.e., elastic bending is expected to produce folds with amplitudes broadly equal to the thickness of the underlying intrusion. However, these seismic-based studies do not quantitatively account for post-emplacement, burial-related compaction of forced folds, which may be expected to reduce their amplitude. Through analysis of the Resolution Sill and its overlying forced fold, imaged in seismic reflection data offshore eastern New Zealand and intersected by the Resolution-1 borehole, we present the first robust decompaction and backstripping of an intrusion-induced forced fold to constrain its original geometry. Our results highlight the forced fold had an original amplitude of ~131–185 m, but burial-related compaction has reduced its amplitude to ~127 m. The top and base of the Resolution Sill are seismically distinguishable across its center, where it has a maximum thickness of 117–187 m, depending on the interval velocity of the entire sill. Although uncertainties still exist, we show that decompaction reduces and potentially fully accounts for apparent discrepancies between fold amplitudes and sill thicknesses. Our observations also suggest relatively simple fold shapes may be produced by complex intrusion geometries, involving local abrupt changes in thickness. Seismic reflection data provides unprecedented insights into the 3D geometry of natural intrusions and forced folds, but we highlight the need to consider the role of burial-related compaction in modifying fold shapes and amplitudes.
Author Contributions
CM designed the study, carried out the seismic interpretation, interpreted the data, and wrote the manuscript. MH conducted decompaction and backstripping analysis, aided data interpretation, and edited the manuscript. CJ and SJ contributed to data interpretation and edited the manuscript.
Funding
Open access publication costs to be funded by University of Leeds library.
Conflict of Interest Statement
The authors declare that the research was conducted in the absence of any commercial or financial relationships that could be construed as a potential conflict of interest.
Acknowledgments
CM acknowledges funding from an Imperial College Junior Research Fellowship and a NERC Independent Research Fellowship (NE/R014086/1). MH acknowledges funding from NERC studentship NE/1369185. New Zealand Petroleum and Minerals are thanked for providing all data used (i.e., 2D seismic reflection lines, borehole data, and relevant reports), which are freely available through https://www.nzpam.govt.nz/. Schlumberger are thanked for provision of Petrel seismic interpretation software.
Supplementary Material
The Supplementary Material for this article can be found online at: https://www.frontiersin.org/articles/10.3389/feart.2019.00037/full#supplementary-material
References
Brown, A. R. (2011). Interpretation of Three-Dimensional Seismic Data. Tulsa, OK: Society of Exploration Geophysicists and American Association of Petroleum Geologists.
Bunger, A. P., and Cruden, A. R. (2011). Modeling the growth of laccoliths and large mafic sills: role of magma body forces. J. Geophys. Res. 116:B02203. doi: 10.1029/2010JB007648
Caricchi, L., Biggs, J., Annen, C., and Ebmeier, S. (2014). The influence of cooling, crystallisation and re-melting on the interpretation of geodetic signals in volcanic systems. Earth Planet. Sci. Lett. 388, 166–174. doi: 10.1016/j.epsl.2013.12.002
Carter, R. M. (1988). Post-breakup stratigraphy of the kaikoura synthem (Cretaceous-Cenozoic), continental margin, southeastern New Zealand. N. Z. J. Geol. Geophys. 31, 405–429. doi: 10.1080/00288306.1988.10422141
Castro, J. M., Cordonnier, B., Schipper, C. I., Tuffen, H., Baumann, T. S., and Feisel, Y. (2016). Rapid laccolith intrusion driven by explosive volcanic eruption. Nat. Commun. 7:13585. doi: 10.1038/ncomms13585
Chevallier, L., and Woodford, A. (1999). Morpho-tectonics and mechanism of emplacement of the dolerite rings and sills of the western Karoo, South Africa. S. Afr. J. Geol. 102, 43–54.
Ebmeier, S. K., Andrews, B. J., Araya, M. C., Arnold, D. W. D., Biggs, J., Cooper, C., et al. (2018). Synthesis of global satellite observations of magmatic and volcanic deformation: implications for volcano monitoring and the lateral extent of magmatic domains. J. Appl. Volcanol. 7:2. doi: 10.1186/s13617-018-0071-3
Eide, C. H., Schofield, N., Lecomte, I., Buckley, S. J., and Howell, J. A. (2018). Seismic interpretation of sill complexes in sedimentary basins: implications for the sub-sill imaging problem. J. Geol. Soc. Lond. 175, 193–209. doi: 10.1144/jgs2017-096
Fialko, Y., and Simons, M. (2001). Evidence for on-going inflation of the Socorro magma body, New Mexico, from interferometric synthetic aperture radar imaging. Geophys. Res. Lett. 28, 3549–3552. doi: 10.1029/2001GL013318
Fulthorpe, C. S., Carter, R. M., Miller, K. G., and Wilson, J. (1996). Marshall paraconformity: a mid-oligocene record of inception of the Antarctic circumpolar current and coeval glacio-eustatic lowstand? Mar. Petrol. Geol. 13, 61–77. doi: 10.1016/0264-8172(95)00033-X
Galland, O. (2012). Experimental modelling of ground deformation associated with shallow magma intrusions. Earth Planet. Sci. Lett. 317, 145–156. doi: 10.1016/j.epsl.2011.10.017
Galland, O., and Scheibert, J. (2013). Analytical model of surface uplift above axisymmetric flat-lying magma intrusions: implications for sill emplacement and geodesy. J. Volcanol. Geotherm. Res. 253, 114–130. doi: 10.1016/j.jvolgeores.2012.12.006
Gerbault, M., Hassani, R., Novoa Lizama, C., and Souche, A. (2018). Three-dimensional failure patterns around an inflating magmatic chamber. Geochem. Geophys. Geosyst. 19, 749–771. doi: 10.1002/2017GC007174
Gilbert, G. K. (1877). Report on the Geology of the Henry Mountains. Washington, DC: US Government Printing Office.
Hansen, D. M. (2006). The morphology of intrusion-related vent structures and their implications for constraining the timing of intrusive events along the NE Atlantic margin. J. Geol. Soc. Lond. 163, 789–800. doi: 10.1144/0016-76492004-167
Hansen, D. M., and Cartwright, J. (2006). The three-dimensional geometry and growth of forced folds above saucer-shaped igneous sills. J. Struct. Geol. 28, 1520–1535. doi: 10.1016/j.jsg.2006.04.004
Hansen, D. M., Redfern, J., Federici, F., Di Biase, D., and Bertozzi, G. (2008). Miocene igneous activity in the Northern Subbasin, offshore Senegal, NW Africa. Mar. Petrol. Geol. 25, 1–15. doi: 10.1016/j.marpetgeo.2007.04.007
Holohan, E. P., Sudhaus, H., Walter, T. R., Schöpfer, M. P., and Walsh, J. J. (2017). Effects of host-rock fracturing on elastic-deformation source models of volcano deflation. Sci. Rep. 7:10970. doi: 10.1038/s41598-017-10009-6
Jackson, C. A., Schofield, N., and Golenkov, B. (2013). Geometry and controls on the development of igneous sill–related forced folds: a 2-D seismic reflection case study from offshore southern Australia. Bulletin 125, 1874–1890. doi: 10.1130/B30833.1
Jackson, C. A. L. (2012). Seismic reflection imaging and controls on the preservation of ancient sill-fed magmatic vents. J. Geol. Soc. Lond. 169, 503–506. doi: 10.1144/0016-76492011-147
Jamtveit, B., Svensen, H., Podladchikov, Y. Y., and Planke, S. (2004). Hydrothermal vent complexes associated with sill intrusions in sedimentary basins. Geol. Soc. Lond. Spec. Publ. 234, 233–241. doi: 10.1144/GSL.SP.2004.234.01.15
Johnson, A. M., and Pollard, D. D. (1973). Mechanics of growth of some laccolithic intrusions in the Henry mountains, Utah, I: field observations, Gilbert's model, physical properties and flow of the magma. Tectonophysics 18, 261–309. doi: 10.1016/0040-1951(73)90050-4
Killops, S. D., Cook, R. A., Sykes, R., and Boudou, J. P. (1997). Petroleum potential and oil-source correlation in the Great South and Canterbury Basins. N. Z. J. Geol. Geophys. 40, 405–423. doi: 10.1080/00288306.1997.9514773
Koch, F. G., Johnson, A. M., and Pollard, D. D. (1981). Monoclinal bending of strata over laccolithic intrusions. Tectonophysics 74, T21–T31. doi: 10.1016/0040-1951(81)90189-X
Lu, H., and Fulthorpe, C. S. (2004). Controls on sequence stratigraphy of a middle miocene–holocene, current-swept, passive margin: offshore Canterbury Basin, New Zealand. Geol. Soc. Am. Bull. 116, 1345–1366. doi: 10.1130/B2525401.1
Lu, H., Fulthorpe, C. S., Mann, P., and Kominz, M. A. (2005). Miocene-recent tectonic and climatic controls on sediment supply and sequence stratigraphy: Canterbury Basin, New Zealand. Basin Res. 17, 311–328. doi: 10.1111/j.1365-2117.2005.00266.x
Magee, C., Briggs, F., and Jackson, C. A. (2013a). Lithological controls on igneous intrusion-induced ground deformation. J. Geol. Soc. Lond. 170, 853–856. doi: 10.1144/jgs2013-029
Magee, C., Duffy, O. B., Purnell, K., Bell, R. E., Jackson, C. A. L., and Reeve, M. T. (2016b). Fault-controlled fluid flow inferred from hydrothermal vents imaged in 3D seismic reflection data, offshore NW Australia. Basin Res. 28, 299–318. doi: 10.1111/bre.12111
Magee, C., Hunt-Stewart, E., and Jackson, C. A. L. (2013b). Volcano growth mechanisms and the role of sub-volcanic intrusions: insights from 2D seismic reflection data. Earth Planet. Sci. Lett. 373, 41–53. doi: 10.1016/j.epsl.2013.04.041
Magee, C., Jackson, C. A. L., Hardman, J. P., and Reeve, M. T. (2017). Decoding sill emplacement and forced fold growth in the exmouth sub-basin, offshore northwest Australia: implications for hydrocarbon exploration. Interpretation 5, SK11–SK22. doi: 10.1190/INT-2016-0133.1
Magee, C., Jackson, C. A. L., and Schofield, N. (2014). Diachronous sub-volcanic intrusion along deep-water margins: Insights from the Irish Rockall Basin. Basin Res. 26, 85–105. doi: 10.1111/bre.12044
Magee, C., Maharaj, S. M., Wrona, T., and Jackson, C. A. L. (2015). Controls on the expression of igneous intrusions in seismic reflection data. Geosphere 11, 1024–1041. doi: 10.1130/GES01150.1
Magee, C., Muirhead, J. D., Karvelas, A., Holford, S. P., Jackson, C. A., Bastow, I. D., et al. (2016a). Lateral magma flow in mafic sill complexes. Geosphere 12, 809–841. doi: 10.1130/GES01256.1
Milne, A. D., Simpson, C., and Threadgold, P. (1975). Well Completion Report Resolution-1, for BP, Shell, Todd (Canterbury) Services Limited. New Zealand Geological Survey. Unpublished open-file Petroleum Report PR648.
Montanari, D., Bonini, M., Corti, G., Agostini, A., and Del Ventisette, C. (2017). Forced folding above shallow magma intrusions: Insights on supercritical fluid flow from analogue modelling. J. Volcanol. Geotherm. Res. 345, 67–80. doi: 10.1016/j.jvolgeores.2017.07.022
Morgan, S., Stanik, A., Horsman, E., Tikoff, B., de Saint Blanquat, M., and Habert, G. (2008). Emplacement of multiple magma sheets and wall rock deformation: trachyte mesa intrusion, Henry Mountains, Utah. J. Struct. Geol. 30, 491–512. doi: 10.1016/j.jsg.2008.01.005
Pagli, C., Wright, T. J., Ebinger, C. J., Yun, S. H., Cann, J. R., Barnie, T., et al. (2012). Shallow axial magma chamber at the slow-spreading Erta Ale Ridge. Nat. Geosci. 5:284. doi: 10.1038/ngeo1414
Planke, S., Rasmussen, T., Rey, S. S., and Myklebust, R. (2005), “January. Seismic characteristics and distribution of volcanic intrusions hydrothermal vent complexes in the Vøring Møre basins,” in Geological Society, London, Petroleum Geology Conference Series, Vol. 6 (London: Geological Society of London), 833–844.
Pollard, D. D., and Johnson, A. M. (1973). Mechanics of growth of some laccolithic intrusions in the Henry Mountains, Utah, II: bending and failure of overburden layers and sill formation. Tectonophysics 18, 311–354. doi: 10.1016/0040-1951(73)90051-6
Polteau, S., Ferré, E. C., Planke, S., Neumann, E. R., and Chevallier, L. (2008a). How are saucer-shaped sills emplaced? constraints from the Golden Valley Sill, South Africa. J. Geophys. Res. 113:B12104. doi: 10.1029/2008JB005620
Polteau, S., Mazzini, A., Galland, O., Planke, S., and Malthe-Sørenssen, A. (2008b). Saucer-shaped intrusions: occurrences, emplacement and implications. Earth Planet. Sci. Lett. 266, 195–204. doi: 10.1016/j.epsl.2007.11.015
Raymer, L. L., Hunt, E. R., and Gardner, J. S. (1980). “An improved sonic transit time-to-porosity transform,” in SPWLA 21st Annual Logging Symposium (Lafayette, LA: Society of Petrophysicists and Well-Log Analysts).
Reeves, J., Magee, C., and Jackson, C. L. (2018). Unravelling intrusion-induced forced fold kinematics and ground deformation using 3D seismic reflection data. Volcanica 1, 1–17. doi: 10.30909/vol.01.01.0117
Scheibert, J., Galland, O., and Hafver, A. (2017). Inelastic deformation during sill and laccolith emplacement: insights from an analytic elastoplastic model. J. Geophys. Res. 122, 923–945. doi: 10.1002/2016JB013754
Schiøler, P., Raine, J. I., Crundwell, M., Griffin, A., Hollis, C. J., Kulhanek, D. K., et al. (2011). Revised Biostratigraphy and Well Correlation, Canterbury Basin, New Zealand Ministry of Economic Development. New Zealand. Unpublished Petroleum Report PR4365.
Schmiedel, T., Kjoberg, S., Planke, S., Magee, C., Galland, O., Schofield, N., et al. (2017). Mechanisms of overburden deformation associated with the emplacement of the Tulipan sill, mid-Norwegian margin. Interpretation 5, SK23–SK38. doi: 10.1190/INT-2016-0155.1
Schofield, N., Alsop, I., Warren, J., Underhill, J. R., Lehné, R., Beer, W., et al. (2014). Mobilizing salt: magma-salt interactions. Geology 42, 599–602. doi: 10.1130/G35406.1
Schofield, N. J., Brown, D. J., Magee, C., and Stevenson, C. T. (2012). Sill morphology and comparison of brittle and non-brittle emplacement mechanisms. J. Geol. Soc. Lond. 169, 127–141. doi: 10.1144/0016-76492011-078
Sclater, J. G., and Christie, P. A. (1980). Continental stretching: an explanation of the post-mid-cretaceous subsidence of the central North Sea basin. J. Geophys. Res. 85, 3711–3739. doi: 10.1029/JB085iB07p03711
Sewell, R. J., and Gibson, I. L. (1988). Petrology and geochemistry of tertiary volcanic rocks from inland central and South Canterbury, South Island, New Zealand. N. Z. J. Geol. Geophys. 31, 477–492. doi: 10.1080/00288306.1988.10422145
Smallwood, J. R. (2009). Back-stripped 3D seismic data: A new tool applied to testing sill emplacement models. Petrol. Geosci. 15, 259–268. doi: 10.1144/1354-079309-844
Smallwood, J. R., and Maresh, J. (2002). The properties, morphology and distribution of igneous sills: modelling, borehole data and 3D seismic from the Faroe-Shetland area. Geol. Soc. Lond. Spec. Publ. 197, 271–306. doi: 10.1144/GSL.SP.2002.197.01.11
Spacapan, J. B., Galland, O., Leanza, H. A., and Planke, S. (2016). Igneous sill and finger emplacement mechanism in shale-dominated formations: a field study at Cuesta del Chihuido, Neuquén Basin, Argentina. J. Geol. Soc. Lond. 174, 422–433. doi: 10.1144/jgs2016-056
Stearns, D. W. (1978). Faulting and forced folding in the Rocky Mountains foreland. Laramide folding associated with basement block faulting in the western United States. Geol. Soc. Am. Mem. 151, 1–37. doi: 10.1130/MEM151-p1
Symonds, P. A., Planke, S., Frey, O., and Skogseid, J. (1998). Volcanic evolution of the western Australian continental margin and its implications for basin development. Sediment. Basins West. Austr. 2, 33–54.
Thomson, K., and Hutton, D. (2004). Geometry and growth of sill complexes: insights using 3D seismic from the North Rockall Trough. Bull. Volcanol. 66, 364–375. doi: 10.1007/s00445-003-0320-z
Timm, C., Hoernle, K., Werner, R., Hauff, F., van den Bogaard, P., White, J., et al. (2010). Temporal and geochemical evolution of the Cenozoic intraplate volcanism of Zealandia. Earth Sci. Rev. 98, 38–64. doi: 10.1016/j.earscirev.2009.10.002
Trude, J., Cartwright, J., Davies, R. J., and Smallwood, J. (2003). New technique for dating igneous sills. Geology 31, 813–816. doi: 10.1130/G19559.1
Uruski, C. I. (2010). New Zealand's deepwater frontier. Mar. Petrol. Geol. 27, 2005–2026. doi: 10.1016/j.marpetgeo.2010.05.010
van Wyk de Vries, B., Márquez, A., Herrera, R., Bruña, J. G., Llanes, P., and Delcamp, A. (2014). Craters of elevation revisited: forced-folds, bulging and uplift of volcanoes. Bull. Volcanol. 76:875. doi: 10.1007/s00445-014-0875-x
Keywords: forced fold, sill, seismic reflection, emplacement, roof uplift, compaction
Citation: Magee C, Hoggett M, Jackson CA-L and Jones SM (2019) Burial-Related Compaction Modifies Intrusion-Induced Forced Folds: Implications for Reconciling Roof Uplift Mechanisms Using Seismic Reflection Data. Front. Earth Sci. 7:37. doi: 10.3389/feart.2019.00037
Received: 30 October 2018; Accepted: 15 February 2019;
Published: 12 March 2019.
Edited by:
Katherine Dobson, Durham University, United KingdomReviewed by:
Guillaume Duclaux, University of Nice Sophia Antipolis, FranceIkuro Sumita, Kanazawa University, Japan
Copyright © 2019 Magee, Hoggett, Jackson and Jones. This is an open-access article distributed under the terms of the Creative Commons Attribution License (CC BY). The use, distribution or reproduction in other forums is permitted, provided the original author(s) and the copyright owner(s) are credited and that the original publication in this journal is cited, in accordance with accepted academic practice. No use, distribution or reproduction is permitted which does not comply with these terms.
*Correspondence: Craig Magee, Yy5tYWdlZUBsZWVkcy5hYy51aw==