 Sebastian T. Kock1,2*
 Karsten Schittek2,3Holger Wissel1Heinz Vos4Christian Ohlendorf5Frank Schäbitz3Liliana C. Lupo6Julio J. Kulemeyer7
 Andreas Lücke1
- 1Institute of Bio- and Geosciences, IGB-3: Agrosphere, Forschungszentrum Jülich GmbH, Jülich, Germany
- 2Institute of Geography, Heidelberg Center for the Environment, Heidelberg University, Heidelberg, Germany
- 3Institute of Geography Didactics, University of Cologne, Cologne, Germany
- 4Institute of Energy and Climate, IEK-7: Stratosphere, Forschungszentrum Jülich GmbH, Jülich, Germany
- 5GEOPOLAR, Institute of Geography, University of Bremen, Bremen, Germany
- 6Laboratorio de Palinología, Facultad de Ciencias Agrarias, Instituto de Ecorregiones Andinas (INECOA-CONICET), National University of Jujuy, Jujuy, Argentina
- 7Facultad de Ingeniería/Agrarias, Instituto de Ecorregiones Andinas (INECOA-CONICET), National University of Jujuy, Jujuy, Argentina
High-elevation cushion peatlands are promising archives for paleoenvironmental studies in their extreme habitat of the Central Andean highlands between ∼4000 and 4800 m a.s.l. The Cerro Tuzgle cushion peatland (CTP, 24°09′ S, 66°24′ W), located in the NW Argentine Andes, is formed by the vascular cushion plants Oxychloe andina (O. andina) and Zameioscirpus muticus (Z. muticus). To extend the knowledge base on the modern ecology of these peatlands, we investigated the stable isotope composition of bulk material and cellulose (δ18O, δ13C, δ15N) of the dominant cushion-forming species O. andina (Juncaceae) and Z. muticus (Cyperaceae) as well as water samples (δ18O, δ2H) of several pools interspersed within the peatland. We further applied a multiproxy approach for a peat core from CTP spanning the last 2900 years with XRF scanning, bulk geochemistry and stable isotope analyses on bulk peat and cellulose size fractions. Modern samples of O. andina and Z. muticus expose significant differences in cellulose δ18O, e.g., between leaves and rhizomes of O. andina (Δδ18Ol-r = 4.11‰) and between leaves of O. andina and Z. muticus (Δδ18Ol-l = 2.8‰). Modern water samples exhibit strong isotopic differences between single water pools (max. Δδ18O = 13.09‰) due to local variable evaporative enrichment. Within the peat core, we observe considerable multi-centennial variations in δ18O composition of cellulose confirmed by all size fractions. Based on the regional relation between decreasing δ18Oprec values with increasing precipitation amounts and 18O enrichment in the peatland waters due to evaporation, we suggest an interpretation of our δ18O cellulose record as moisture proxy for CTP. This interpretation is corroborated by a high correlation between oxygen isotopes, peat growth and geochemical data. Accordingly, CTP indicates dryer conditions between 2190 and 2120, 1750 and 1590, 1200 and 1080 and since 130 cal. yr BP, whereas periods with increased humidity prevailed from 2750 to 2250 and from 600 to 130 cal. yr BP. Temporal changes in the match to South American Summer Monsoon (SASM) reconstructions suggest impacts of other large-scale atmospheric variability modes or a different SASM expression at our southerly location.
Introduction
The Andes represent a prominent longitudinal climatic barrier for the South American continent. Two major atmospheric circulation systems influence the climate of the Andes, the South American summer monsoon (SASM) and the Southern Hemisphere westerly winds (SHW) (Garreaud et al., 2003). Interactions between these systems affect climate conditions of the entire Southern Hemisphere. Hence, interest in paleoclimate archives from the Central Andes has grown during the recent decades (e.g., Flantua et al., 2016). Between these systems, the Arid Diagonal is developed, characterized by low annual precipitation amounts and a limited number of paleoclimate archives. Due to this lack of continuous and high resolution records, knowledge on the climatic evolution of the Andean region during the Holocene is still limited and insufficient compared to the hemispheric and global significance of this region.
Suitable archives to fill the gap of knowledge are high-Andean cushion peatlands, as several studies could provide in the past (Schittek et al., 2016; Kock et al., 2018, 2019). Continuous, high accumulation rates ensure highly resolved records for paleoenvironmental investigations with a multiplicity of proxy data (Schittek, 2014). While stable isotope analyses are a well-established tool in paleoecological investigations of Northern Hemisphere peatlands (e.g., Ménot-Combes et al., 2002; Moschen et al., 2009), isotope analyses on cushion peatlands reside in an initial stage. Different to the Northern Hemisphere dominant peat-forming species Sphagnum, a non-vascular plant, the cushion-forming species are vascular plants. Vascular plants are able to regulate their gas exchange by stomata, affecting the isotope fractionation processes of both oxygen (δ18O) and carbon isotopes (δ13C) during metabolic processes (Ménot and Burns, 2001).
The stable isotope values of peatland plants underlie a strong dependency on the respective source values of atmospheric CO2 and plant available H2O. Overall, carbon isotope fractionation is dependent on the atmospheric source value, on the difference between intercellular and atmospheric partial pressure of CO2, which is controlled by the stomatal conductance in vascular plants, and on the biochemical fractionation (Farquhar et al., 1989). During more humid phases, an increasing stomatal conductance is leading to decreased δ13C values in plant organic matter. During more arid phases, an increased leaf to air vapor pressure gradient is leading to a closure of the stomata to prevent passive water loss as a result of transpiration (Amesbury et al., 2015a). One of the first responses to water deficit in vascular plants is the inhibition of growth, which allows plants to reduce their transpiration rates and to avoid metabolic and cellular damage caused by low water potentials (Cominelli et al., 2008). Besides carbon isotopes, oxygen isotopes are very often applied within paleoecological investigations (e.g., Ménot-Combes et al., 2002). The δ18O value of plant cellulose is directly related to the respective leaf water (δ18OLW) and enriched by about 27.0‰ due to biochemical fraction during formation of primary photosynthates (glucose) (DeNiro and Epstein, 1981; Sternberg, 2009). The aperture of plant stomata has a strong influence on δ18OLW. Stomatal closure, caused, e.g., by drought, lead to a decrease of stomatal conductance and increased enrichment of δ18OLW values during transpiration (Farquhar et al., 2007). Due to the dependence on the respective water source value (δ18OSW) and the leaf water enrichment, reported δ18O values for extracted cellulose of vascular plants in peatlands cover a considerable range (Brenninkmeijer et al., 1982; Hong et al., 2009; Amesbury et al., 2015b).
Stable isotope investigations on cushion peatlands in South America prior to this study have been executed in Peru (Distichia peatlands; Skrzypek et al., 2011; Engel et al., 2014) and Bolivia (Gouze et al., 1987). Further studies on vascular plants in peatlands only have been conducted in Switzerland (Ménot and Burns, 2001), China (e.g., Hong et al., 2000, 2009; Liu et al., 2018) and New Zealand (Amesbury et al., 2015a,b). For carbon isotopes, a relationship between δ13C and temperature (Ménot and Burns, 2001; Skrzypek et al., 2011; Engel et al., 2014; Amesbury et al., 2015a) was described. Ménot and Burns (2001) also reported that on an altitudinal gradient the atmospheric CO2 concentration is a stronger determinant for δ13C values of peat plants than temperature. Hong et al. (2000, 2009) interpret δ18O as a proxy for surface air temperature changes, while Amesbury et al. (2015b) used δ18O for tracking precipitation moisture sources.
Here we investigated modern water and plant (leaves, rhizomes, fruits) samples of the Cerro Tuzgle cushion peatland (CTP) as well as a 2.6 m composite peat profile. In the peat profile, we analyzed the major and trace elements, ash content, humification tendency, organic carbon and total nitrogen isotope composition of bulk peat and carbon and oxygen isotope composition of cellulose. Prior to cellulose extraction, samples were separated into three different size fractions (<200 μm, 200–1000 μm, >1000 μm). Additional macrofossil analyses were used to identify changes between different plant species within the record. As a general hypothesis for the study we postulate that changes in moisture conditions at CTP are mirrored in δ18Ocell values of the peat profile and that disturbances in such a relation, e.g., because of decomposition, can be detected within the multi-proxy approach.
Overall, the study strives (1) to set-up a modern dataset as base for interpretation of the isotope records, (2) to establish the first continuous cellulose stable carbon and oxygen isotope record of cushion peatlands from the Central Andes, (3) to discuss moisture fluctuations at CTP in the context of available SASM reconstructions.
Study Area
NW Argentine, High-Andean “Puna”
The CTP (24°09′ S, 66°24′ W, 4,350 m a.s.l., Figure 1a) is located in the northwest Argentine Andes close to the Cerro Tuzgle (24°09′ S, 66°24′ W) in the province of Jujuy. The area is characterized by recent tectonic processes and geothermal activity, including several seasonal and permanent springs in the so called Cerro Tuzgle – Tocomar geothermal volcanic area (Giordano et al., 2013). The occurrence of block glaciers or high-elevation cryogenic soils is not reported for the study area. The region is part of the internally drained Puna comprising the southern part of the Altiplano-Puna plateau (Allmendinger et al., 1997; Norini et al., 2014). Due to differences in precipitation amount, the Argentine Puna can be subdivided into a semi-humid part in the east, where the CTP is situated and an arid area in the west (Cabrera, 1968; Troll, 1968; Kuentz, 2009).
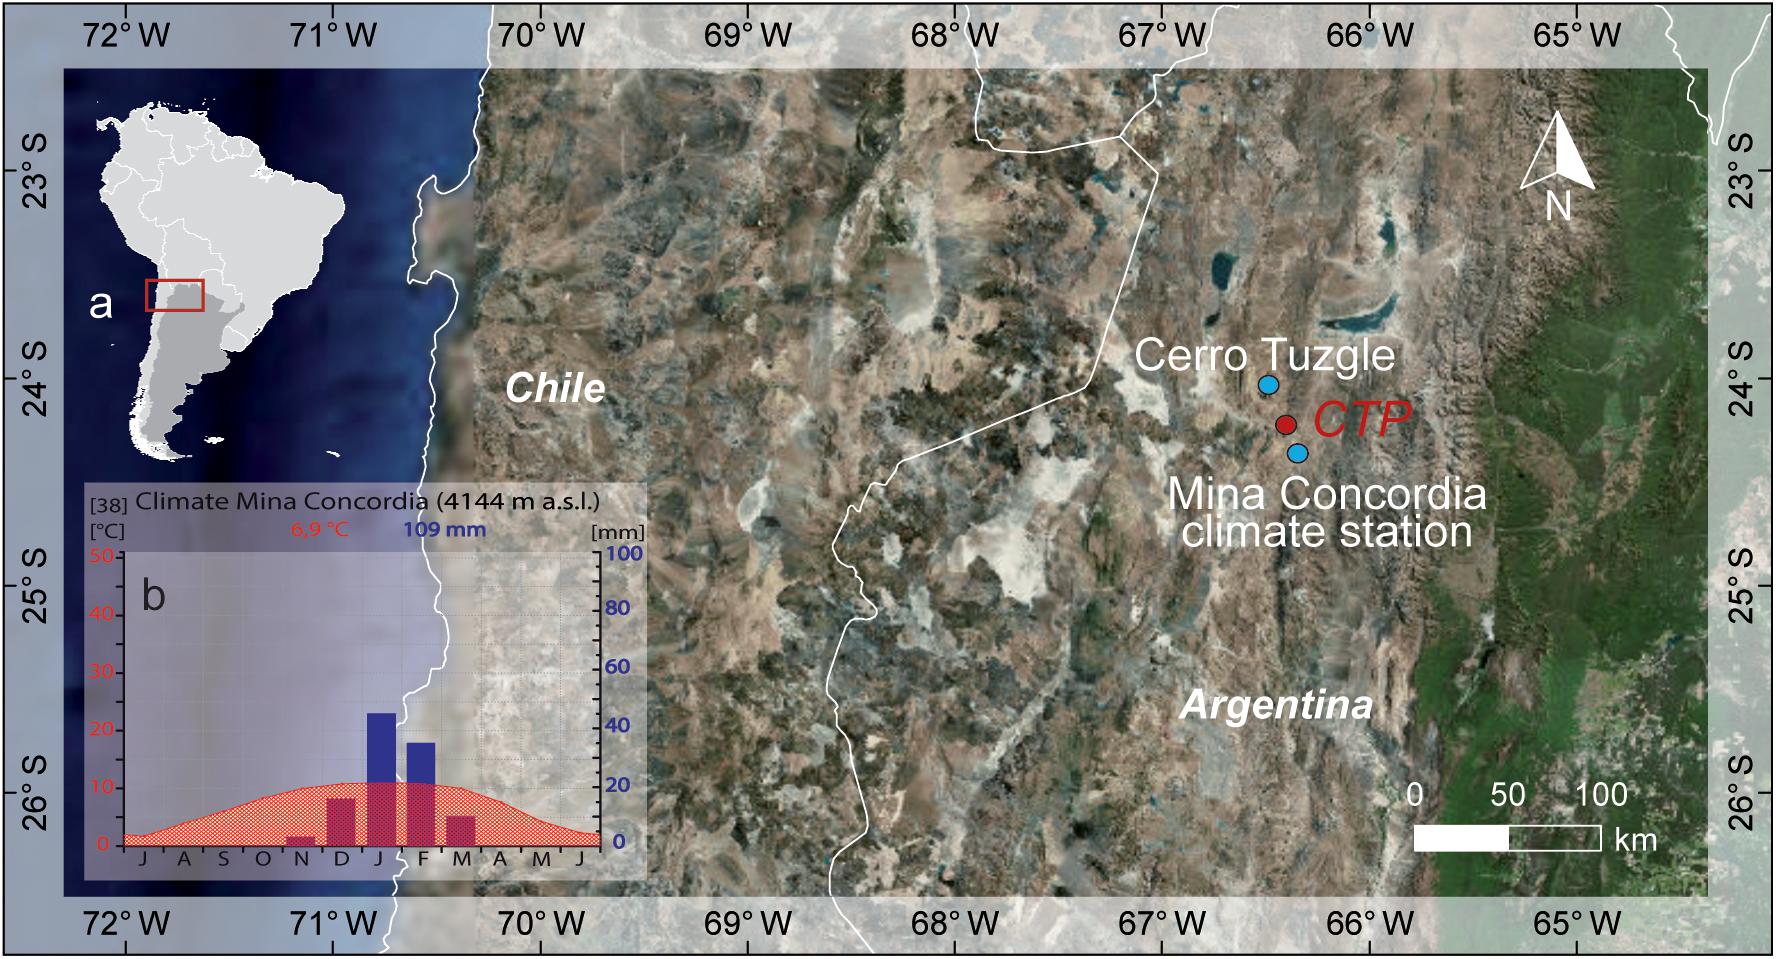
Figure 1. (a) Location of the CTP study area, Cerro Tuzgle and Mina Concordia climate. (b) Climate diagram Mina Concordia [data source: Mina Concordia (1950 – 1990; 1966 and 1970 are missing) data based on Bianchi et al., 2005]. Map data source is GLCF World Data and DGM-GTOPO30.
Its location is in the north to the Arid Diagonal at the crossroads between tropical and extratropical precipitation regimes (Vuille and Ammann, 1997; Garreaud et al., 2009). The weather station at the Concordia mine (4,144 m a.s.l.) shows the main climatic characteristics of the study area (Figure 1b). Annual temperatures range between 2 and 10°C (mean annual temp.: 6.9°C) with temperature maxima prevailing in the austral summer months. Annual precipitation sums are 109 mm on average while more than 90% occur between November and March, indicating the main source for meteoric water reaching the CTP is the SASM. Cold front or cuts off events that lead to precipitation in the austral winter months are rare (Figure 1b).
Cushion Peatlands as Environmental Archives
In the recent decade, high-elevation cushion peatlands turned out to be high-potential archive for paleoenvironmental investigations (Squeo et al., 2006; Engel et al., 2014; Schittek et al., 2015). These sensitive ecosystems are comparably less vulnerable to the availability of water due to their special textural adaptations like cushion-growth that increase the resistance to water fluctuations (Schittek, 2014). Thus, they have the potential for continuous records from the harsh environment in the (semi-) arid region of the Central Andes. High-Andean cushion peatlands can accumulate several meters of thickness, which are composed of Juncaceae like Oxychloe, Distichia and Patosia and are frequently supplemented by Cyperaceae of the genera Zameioscirpus and Phylloscirpus (Ruthsatz, 2008). Furthermore, cushion peatlands are very sensitive to climatic changes due to their occurrence close to the limits of vegetation growth and contingent upon temperature, water economy and growing period (Ruthsatz, 1977).
A number of high-elevation peatlands occur in the study region (Werner, 1974). In contrast to most of the cushion peatlands in the area, CTP is situated between comparatively flat slopes of outcropping Ordovician volcanic rocks and sedimentary units as well as Cretaceous conglomerates and sands. Thus, it is protected against increased allochthonous sediment input from lateral stream channels or valleys during extreme rainfall events (Schittek et al., 2016). A presently inactive alluvial fan at the southernmost section of the peatland developed a natural dam and led to continuous accumulation of peat in the past. Modern vegetation of the investigated section of the peatland is characterized by stable mats formed by Oxychloe andina (O. andina), partially supplemented by Zameioscirpus muticus (Z. muticus). O. andina is forming dense cushions by keep growing at their tops and form rhizomes at the bottom (Figure 2b). The leaves are lignified and have a prickle at their tops, potentially as protection against grazing of hoofed animals (Figure 2c) (Rauh, 1988; Ruthsatz, 2008; Schittek et al., 2016). Z. muticus grows in small gaps and fissures of the O. andina cushions. Furthermore, Cyperaceous species like Z. muticus can overgrow open peat surfaces that were damaged by mechanical, frost or drought harms, and thus can protect the peatland against erosion (Ruthsatz, 2008). In contrast to O. andina, Z. muticus has a higher physiological and ecological tolerance, showing, e.g., greater resistance against frost or droughts. However, the species cannot compete with the growth of the cushion plant Oxychloe. The structure of their rhizomes is too insecure, the leaves are neither lignified nor possess a prickle and the growth does not always continue at their tops (Ruthsatz, 2008).
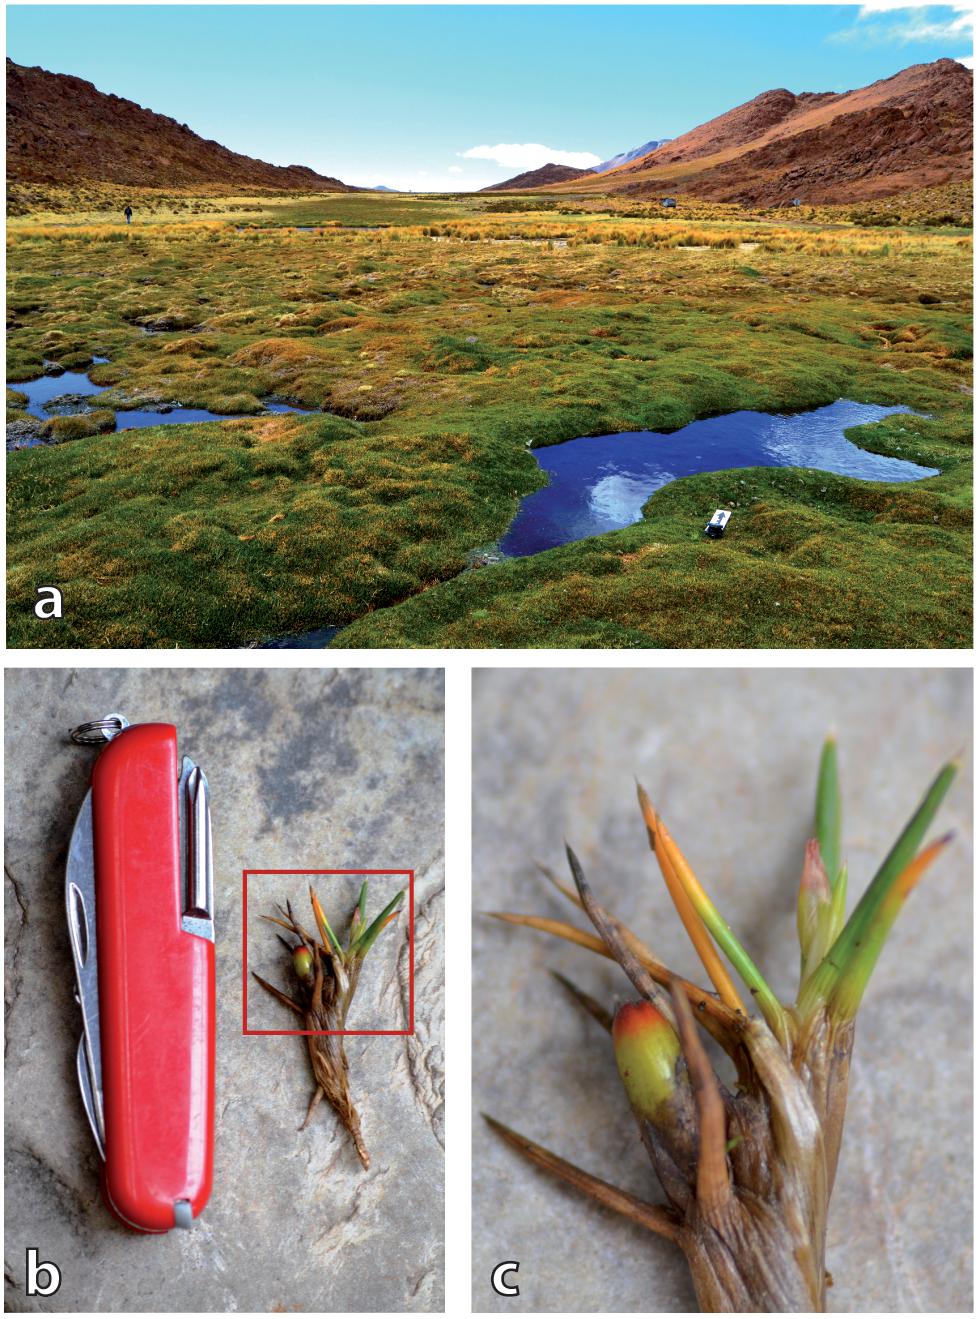
Figure 2. (a) Picture of the CTP (in NNW direction) showing several cushions formed by Oxychloe andina, interspersed by shallow pools that are connected through superficial rivulets (November 2014). (b) O. andina plant compared to a pocketknife (November 2014). (c) Enlargement of the top part of the O. andina shoot. Inner part is composed of young leafs (green) and the flower (pink top). The fruit (greenish-yellow bottom and red top) is located close to the rhizomes (November 2014).
As the CTP is situated in a valley of an ephemeral stream, the Juncaceous cushion plants are interspersed by shallow pools, which can be connected by superficial water flows, originating from springs and during rainfall events from run-off from the surrounding slopes, but also occur isolated without superficial connection (Figure 2a). Underground flow can additionally lead to hydrologic connectivity within cushion peatlands (Schittek et al., 2012). However, for CTP, consisting of homogeneous peat with interspersed minerogenic matter of smaller grain sizes, the water flow velocity is likely to be low.
Materials and Methods
Modern Water and Plant Samples
In October 2013, two crossing transects (from northwest to southeast and from southeast to northwest) were set to enable a systematic sampling of the peatlands surface waters. Furthermore, various modern plant samples of different species (O. andina and Z. muticus) were taken in a close radius around the coring location in 2012. In November 2014, further water samples were taken from selected positions within the peatlands surface. The peat water sample was extruded by hand from a respective peat sample close to the surface of the intact cushion.
Modern plant samples were separated into leaves, rhizomes, and fruits of O. andina and Z. muticus in the field. In the laboratory, the separated plant parts were washed several times with deionized water to remove all visible sedimentary remains. After freeze-drying, the plants were milled with a high-speed mill grinder (Retsch, MM 400) to generate homogeneous samples. Since dispersion was not necessary for these samples, cellulose extraction after Wissel et al. (2008) was conducted without a treatment of NaOH.
For δ18Ocell analyses, about 275 μg of freeze-dried cellulose was weighed in silver capsules, crimped and stored for at least 24 h in a vacuum drier at 100°C before analyses. Samples were then pyrolysed at 1450°C by using a high temperature pyrolysis analyzer (HT-O, HEKAtech) and measured on-line with a coupled IRMS (Isoprime, GV Instruments) to determine the oxygen stable isotope ratio. Peak integration of m/z 28, 29, and 30 was used to determine the oxygen content (O). The δ13C-values were determined using 200–300 μg of dried cellulose weighed into tin foil cups. Samples were combusted at 1080° using an element analyzer (EuroEA, Eurovector) interfaced on-line to an isotope IRMS (Isoprime, GV Instruments). Peak integration of m/z 44, 45 and 46 was used to determine the carbon content (C). The element contents of C and O respectively the C/O ratio can be used as a quality indicator for the extracted cellulose in comparison to the theoretical C/O ratio in cellulose of 0.90 (Wissel et al., 2008).
The overall precision of replicate analyses is estimated to be better than 5% (rel.) for carbon and oxygen content, <0.1‰ for δ15N and δ13C and <0.25‰ for δ18O.
Stable isotope analyses of the water samples were carried out using a Cavity Ringdown Spectrometer (L2130-I, Picarro). Results are reported as δ values relative to the VSMOW (Gonfiantini, 1978). Internal standards, calibrated against VSMOW, Standard Light Antarctic Precipitation, and Greenland Ice Sheet Precipitation were used to ensure long-term stability of analyses. The precision of the analytical system was ≤ 0.1‰ for δ18O and ≤1.0‰ for δ2H.
All isotope results are presented as δ-values (‰) according to the equation:
where RS is the isotope ratio of the sample (2H/1H, 13C/12C, 15N/14N, 18O/16O) and RSt is the isotope ratio of the respective standard. Calibrated laboratory standards were used to control the quality of the analyses and to relate the raw values to the isotopic reference scales (VSMOW for hydrogen and oxygen, VPDB for carbon, AIR for nitrogen). Standards, including the International Atomic Energy Agency (IAEA) standard IAEA-CH6 cellulose powder (δ18O = 37.09 ± 0.09‰), two further commercially available cellulose powders, Merck (δ18O = 29.97 ± 0.08‰) and Fluka cellulose (δ18O = 28.84 ± 0.12‰), and two in-house standards, Rice (δ18O = 23.64 ± 0.15‰) and Peanut cellulose (δ18O = 23.93‰ ± 0.11‰), were calibrated against the reference standards IAEA-601 (δ18O = 23.14‰) and IAEA-602 (δ18O = 71.28‰) for oxygen isotopes. The standards USGS24 (δ13C = -10.45 ± 0.03‰), IAEA-CH6 (δ13C = -16.05 ± 0.04‰) and IAEA-CH7 (δ13C = -32.15 ± 0.05‰) were used for calibration of carbon isotopes values. The calibration of nitrogen isotopes values was ensured by the use of the standards IAEA-N-1 (δ15N = 0.4 ± 0.2‰), IAEA-N-2 (δ15N = 20.3 ± 0.2‰), USGS25 (δ15N = -30.4 ± 0.4‰), and USGS26 (δ15N = 53.7 ± 0.4‰).
Core Sampling and Geochemical Measurements
In December 2012, the core Tuz-694 which reached a total depth of 8 m was extracted in 1 m segments by percussion coring. In this study, we present investigations on the upper 3 m of the core Tuz-694. The core was opened lengthwise with a modified core saw, cut into two halves, photographed and described lithologically.
For major and trace elements analyses, the first core half was measured with a resolution of 2 mm using an ITRAX X-ray fluorescence (XRF) core scanner (Cox Analytical Systems; Croudace et al., 2006). A molybdenum (Mo) tube at 30 kV and 10 mA was used with an exposure time of 10 s for every measurement respectively. The same core half was cut in one centimeter slices, from which boundary areas were removed to exclude possible contamination, which were used for cellulose extraction. The second half was accordingly prepared in 1 cm slices for stable isotope (δ13COM, δ15Nbulk) and element content analyses as well as loss on ignition (LOI550) and humification (T535) measurements on bulk material. From these samples, subsamples at 8 cm intervals were selected for macrofossil analyses.
Prior to the cellulose extraction after Wissel et al. (2008), bulk peat samples were treated with NaOH (5%) to ensure dispersion and enable separation into three size fractions by sieving at 200 and 1000 μm (established fractions: <200 μm, 200–1000 μm, >1000 μm). Oxygen and carbon isotope measurements of the extracted cellulose followed methods described above.
For stable isotope and element content analyses as well as for LOI550 and T535, bulk peat samples were freeze-dried and milled (Retsch, MM 400). For the analyses of the stable isotope ratios of carbon (δ13COM) and total carbon content (TC) as well as total nitrogen isotopes (δ15Nbulk) and nitrogen content (TN) one measurement was conducted using tin capsules and combusted at 1080°C in an elemental analyzer (EuroEA, Eurovector) with an automated sample supply linked to an isotope ratio mass spectrometer (Isoprime, Micromass). TN and TC contents were calculated according to the amounts of N2 and CO2 released after sample combustion (peak integration) and calibrated against element standards. Various tests with 5% HCl proved that decalcification was not necessary for the determination of organic carbon content and for δ13COM measurements, thus, the TC content is an equivalent of the total organic carbon content (TOC). Loss on ignition (LOI550) determination followed standard procedures with an initial milled material weight of 25–30 mg (see Heiri et al., 2001). Accordingly, the ash content was calculated by subtracting the LOI550 from 100%. Humification measurements followed the procedures recommended by Blackford and Chambers (1993) and Chambers et al. (2011), standardized to a target value of 20 mg organic matter in the sample.
Composite Profile, Radiocarbon Dating and Data Analyses
The upper sections of the second and third Tuz-694 core segment were determined as caving material because of loose bedding and deviations in XRF results and were thus discarded. A small hiatus occurs between 98 and 100 cm due to loss of material owing to the coring procedure. Moreover the retrieved core segments were compacted unequally during the coring due to the high water content. Within the first 1 m section, the peat material was compacted to 80 cm (20% compaction), the peat material of the second segment to 49 cm (51% compaction) and the third segment was compacted to 67 cm (33% compaction). To build a composite profile, the core segments were linearly decompacted by using a correction factor (core length/compacted length). The developed composite profile is the basis for the age-depth model. All depths mentioned in the text are decompacted composite core depths except for the depth given in the stratigraphical description below.
Nine samples were selected from characteristic stratigraphical layers for radiocarbon dating on bulk peat samples (0.5 – 1.0 cmł) by Accelerator Mass Spectrometry at Poznań Radiocarbon Laboratory (Poznań, Poland) (Table 1). Radiocarbon ages were calibrated using CALIB 7.0.4 (Stuiver et al., 2013) and the SHCal13 data set for Southern Hemisphere calibration (Hogg et al., 2013).
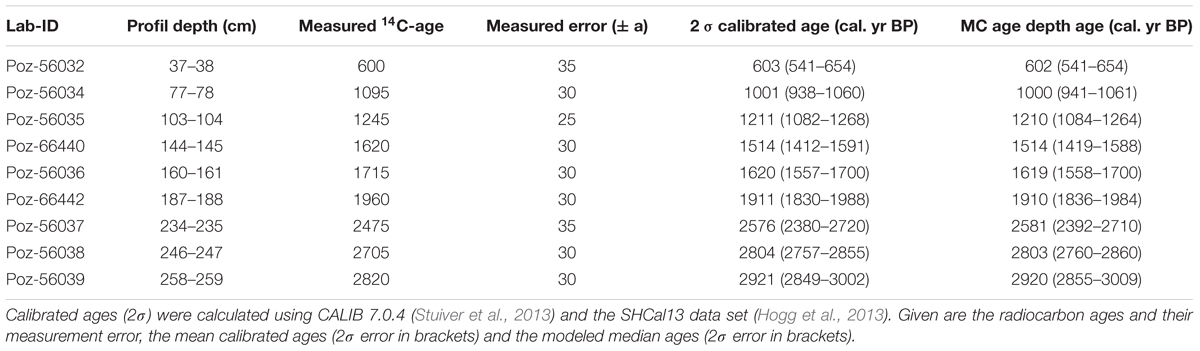
Table 1. Radiocarbon ages of core Tuz-694 from the CTP.
In an earlier contribution (Schittek et al., 2016), the calibration of radiocarbon ages for the Tuzgle composite record was based on the IntCal13 calibration data set (Reimer et al., 2013). Meanwhile, Marsh et al. (2018) proposed a mixed-curve model between IntCal13 and SHCal13 for the regions affected by the SASM and receiving unknown amounts of carbon dioxide input from both hemispheres. Although atmospheric CO2 from the Northern Hemisphere is brought to the eastern Andes during the austral summer, its potential influence declines with increasing southern latitude. At the latitude of CTP, the impact of northern hemispheric CO2 should be negligible. Accordingly, radiocarbon ages for the Tuzgle composite record were recalibrated here with the SHCal data set, the age-depth model was recalculated (Tuz.v2) and geochemical proxies from Schittek et al. (2016) are also shown on this updated age-depth scale. The modeled ages for the decompacted core depths are the medians of 800 Monte Carlo simulations also used to generate confidence intervals integrating the probabilistic nature of calibrated 14C-dates (Higuera et al., 2009; MCAgeDepth software package). All discussed ages are calibrated ages BP (cal. yr BP), if not mentioned otherwise. Pearson correlation coefficients (p > 0.05) were determined by using the R software (version 3.2.2) and the package “rioja” (version 0.9-15; Juggins, 2017) to describe parameter relations.
Results
Stratigraphy and Chronology
The stratigraphy of core Tuz-694 is dominated by homogeneous, faintly layered peat, partially interspersed with clastic material (Figure 3). Between 14 and 8 cm depth, sand is supplementing the highly organic peat. A short hiatus, occurring between 100 and 98 cm, is caused by core loss due to the coring procedure. At 134 cm, a fine gravel dominated layer occurs. Between 245 and 230 cm, an increased content of silt is observed.
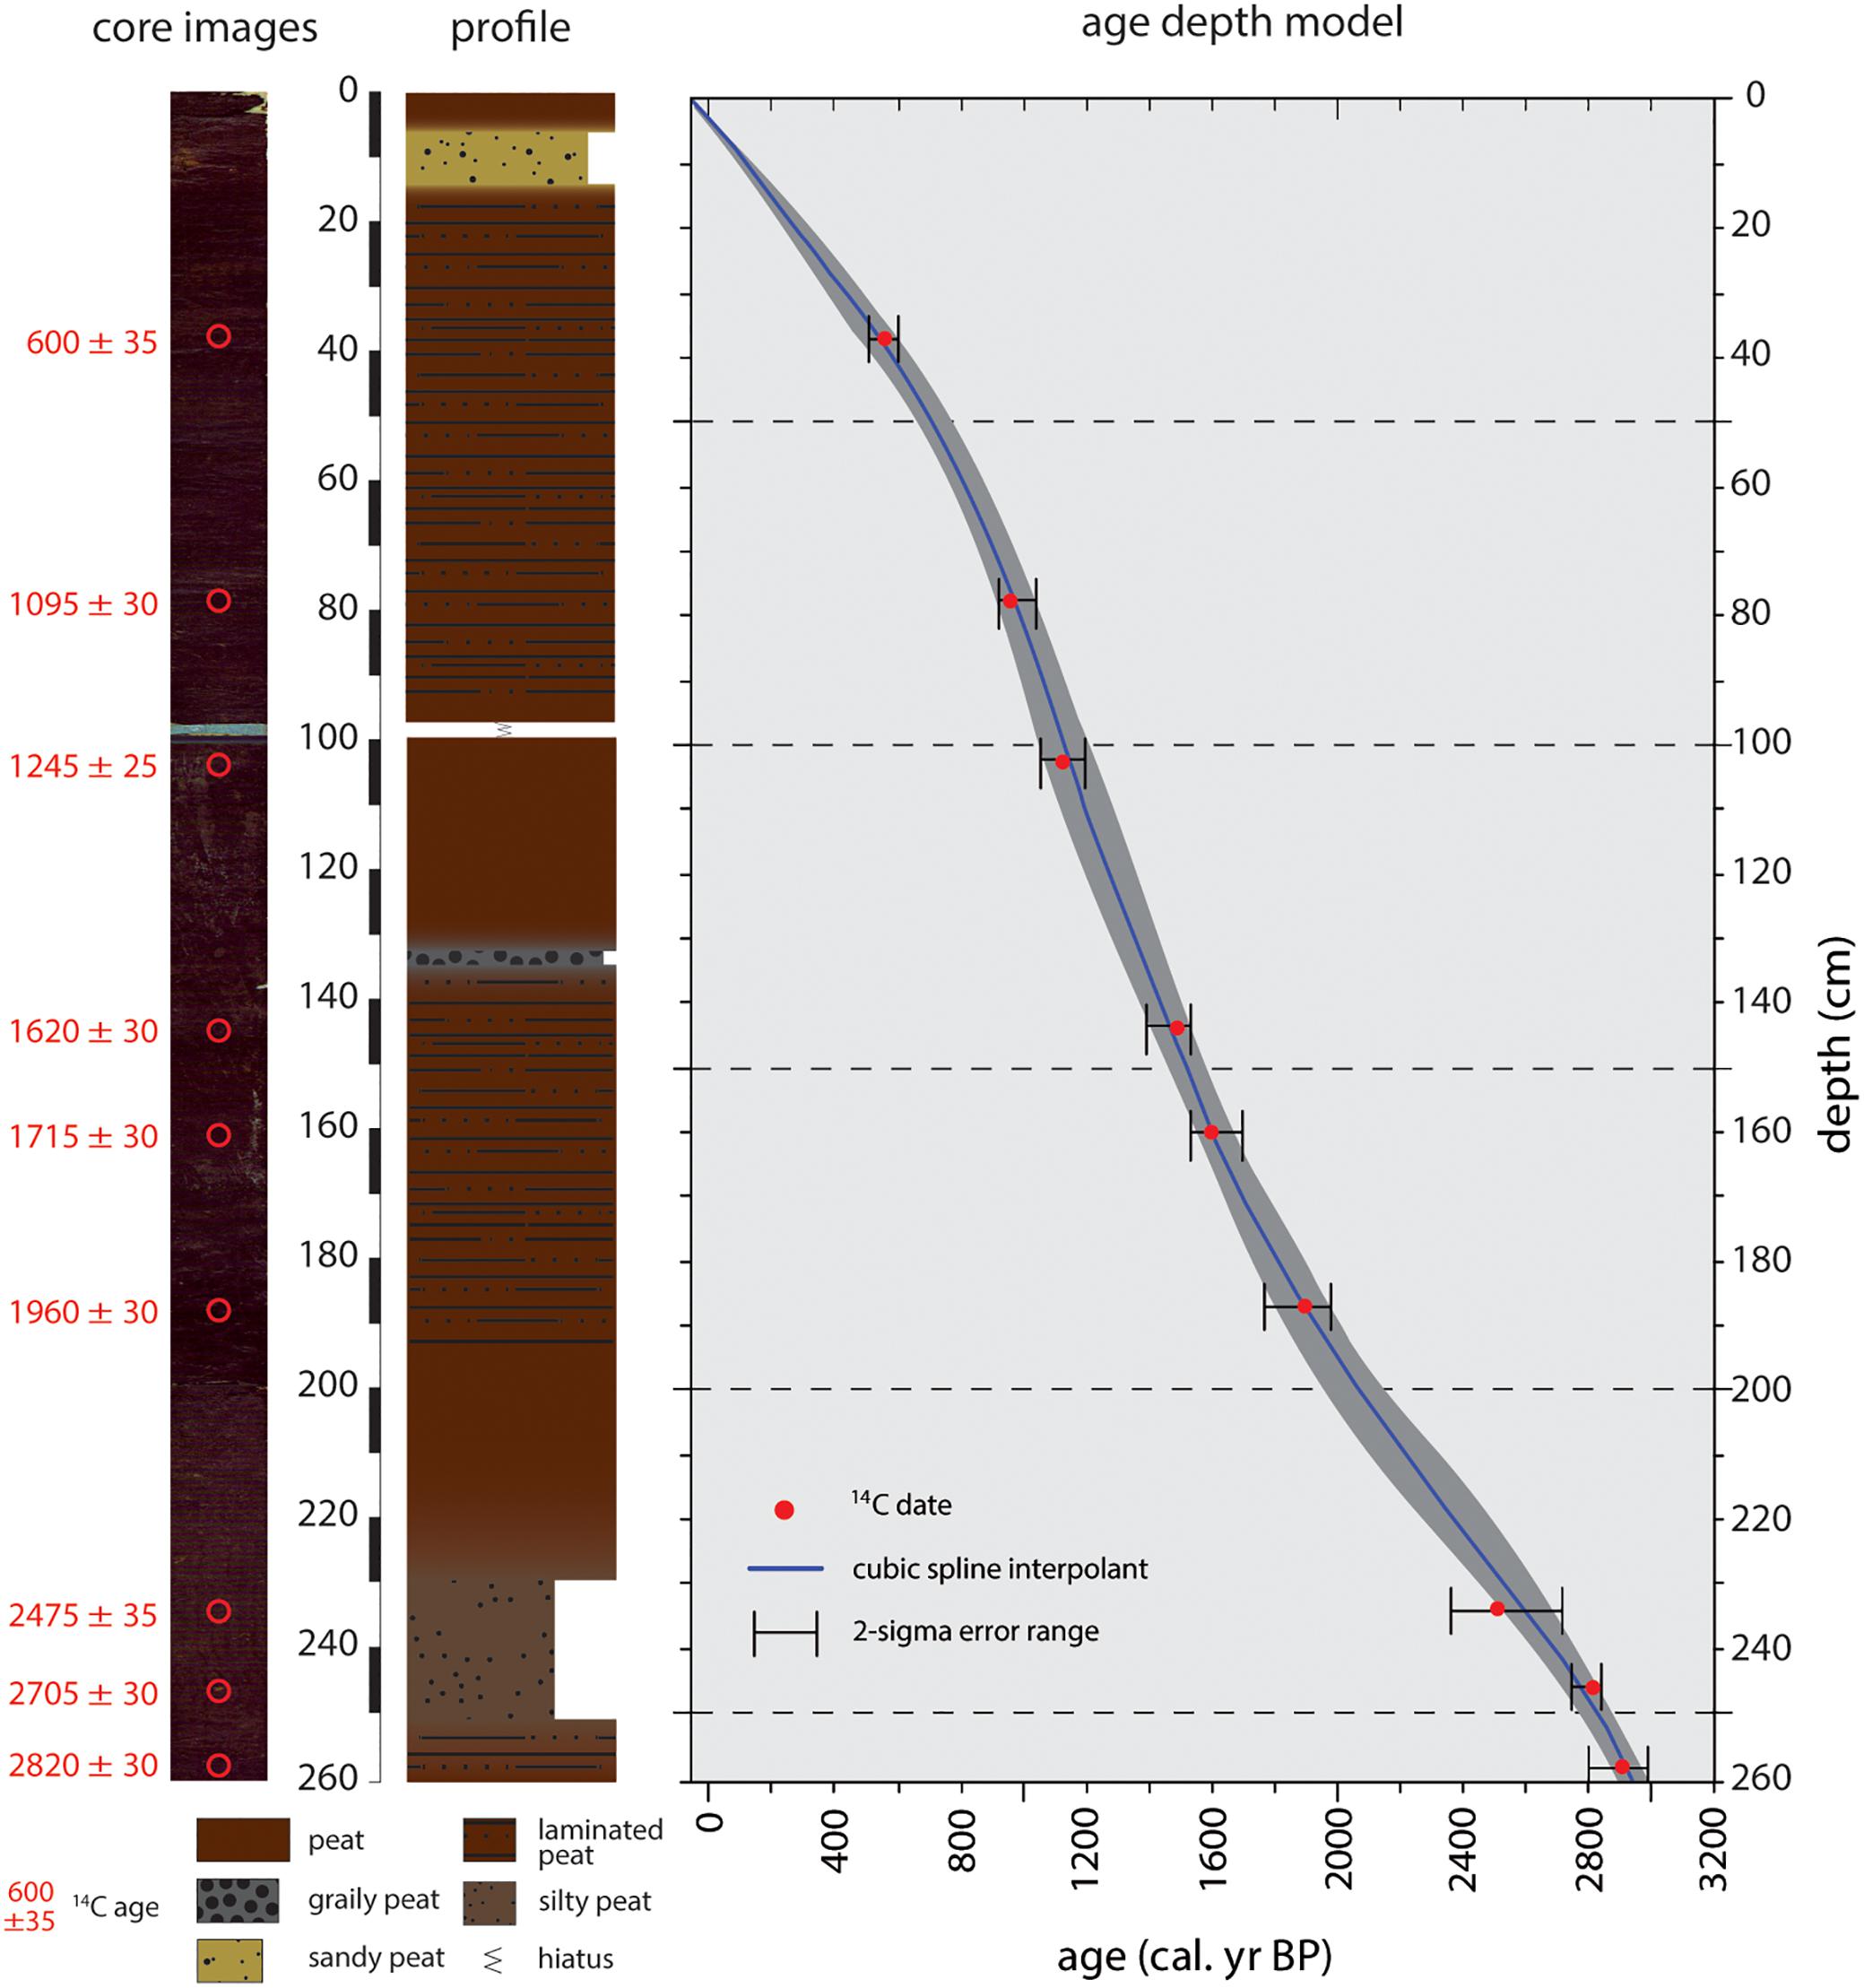
Figure 3. Core images, stratigraphy and age depth model of the core Tuz-694. 14C-ages with their respective uncertainties are shown on the left side of the core images. The only hiatus in the stratigraphy is present between 98 and 100 cm. The age depth model is based on nine 14C-dates. The red dots indicate the mean calibrated ages with error bars (2 s). Gray band represents the modeled uncertainty and the black line the 50th percentiles.
The chronology is based on nine AMS radiocarbon dates and the drilling date as anchor point for the core top (Table 1). The age-depth model (Figure 3) shows a continuous peat accumulation of the CTP for the last ∼2900 cal. years. The average time-resolution of our CTP record is about 11 years per centimeter with a range between 7 to 18 years.
Modern Data
The δ18O values of modern water scatter between -11.1 and 2.0‰, while the respective δ2H values vary between -78.2‰ and -13.8‰ (Supplementary Table S1). Overall, the data reveal a very good correlation between δ18O and δ2H (r = 0.99). The extruded water sample shows relatively low δ18O (-8.7‰) and δ2H (-65.1‰) values, however, only a small offset to isotopic of an adjacent pool (-9.5‰ δ18O and -71.1‰ δ2H) could be revealed.
The analysis of plant samples from the CTP reveal distinct differences between O. andina and Z. muticus (Table 2). With regard to the cellulose yield, a large difference between leaves of O. andina (19.3%) and Z. muticus (10.9%) becomes apparent. The difference between the rhizomes is much smaller (O. andina 14.1% and Z. muticus 16.6%) and almost indistinguishable with respect to the small sample number. The isotope measurements of the extracted cellulose indicate that leaves of Z. muticus have lower δ18Ocell values (28.9‰) than leaves of O. andina (31.68‰), but that Z. muticus has slightly higher δ18Ocell values in rhizomes compared to O. andina (28.2 to 27.6‰). The δ13Ccell dataset indicate values as expected for C3 plants (Pate, 2001). δ13Ccell values are consistently enriched in leaves and rhizomes of Z. muticus compared to leaves and rhizomes of O. andina (leave Δδ13Ccell: Zam-Oxy = 0.6‰, rhizome Δδ13Ccell: Zam-Oxy = 0.8).
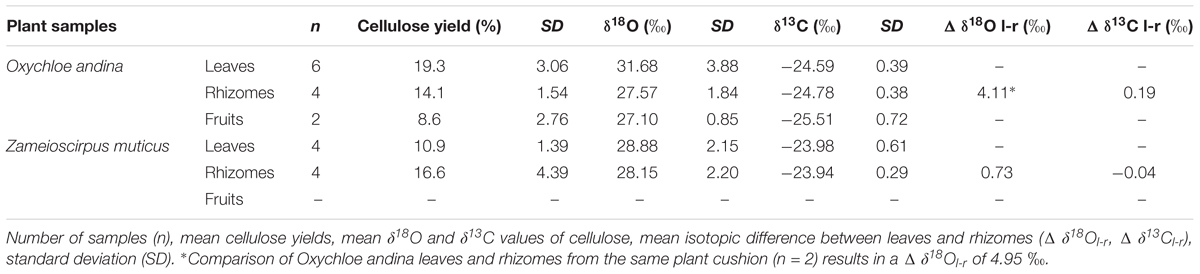
Table 2. Cellulose isotope values of modern plant samples from the Cerro Tuzgle Peatland.
Whereas the intraplant difference between leaves and rhizomes in the carbon isotope composition (δ13Cl-r) is very low, major differences occur in the oxygen isotope composition of the investigated species (Δδ18Ol-r = 0.73‰ for Z. muticus; Δδ18Ol-r = 4.11‰ for O. andina). Comparing distinctive leave-rhizomes pairs within the same cushion of O. andina results in an even higher spread (Δδ18Ol-r = 4.95‰).
Core Data
Bulk Isotope Composition, Element Contents, LOI550 and Humification
Values of δ13COM reveal low variability between -26 and -25‰ during most parts of the record (Figure 4). Highest values occur between 1700 and 1270 cal. yr BP (up to -24.5‰), before a decreasing trend toward lower δ13COM values prevail until 230 cal. yr BP. The δ15Nbulk values shift considerably between 4.0 (∼2060 cal. yr BP) and 1.1‰ (∼390 cal. yr BP) with phases of higher (1730 to 1340, 700 to 610, and around 110 cal. yr. BP) and lower (2910 to 2300, 1240 to 1010, 500 to 350 and 50 to -30 cal. yr BP) values. The TOC content ranges between 42.8 (∼2910 cal. yr BP) and 16.3% (∼1390 cal. yr BP). On average, TOC contents remain between 25 and 40% even in sections with increased sedimentation rates, e.g., between 2740 and 2510 cal. yr BP. Only during short intervals where clastic input can be observed, the TOC values are lower (e.g., 21.9% around 1370 cal. yr BP). The TN content shows low variations around 2%, but is well correlated with TOC (r = 0.83). A conspicuous peak occurs around 2060 cal. yr BP (3.3%). The TOC/TN ratio varies between 10.9 (∼2060 cal. yr BP) and 19.7% (∼500 cal. yr BP). The transition from low TOC/TN values combined with low variability to higher values with an increased variability after 1080 cal. yr BP is prominent. LOI550 ranges between 32.5 (∼1390 cal. yr BP) and 85.7% (∼1060 cal. yr BP). On average, LOI550 values remain low between 2880 (67.7%) and 1080 (59.8%) cal. yr BP. Comparably high values occur between 1030 and 270 cal. yr BP. T535 values shift between 77.4% (∼1000 cal. yr BP) and 89.4% (∼-10 cal. yr BP). While moderate fluctuations dominate the record, a trend toward higher values is prominent between 270 and -10 cal. yr BP.
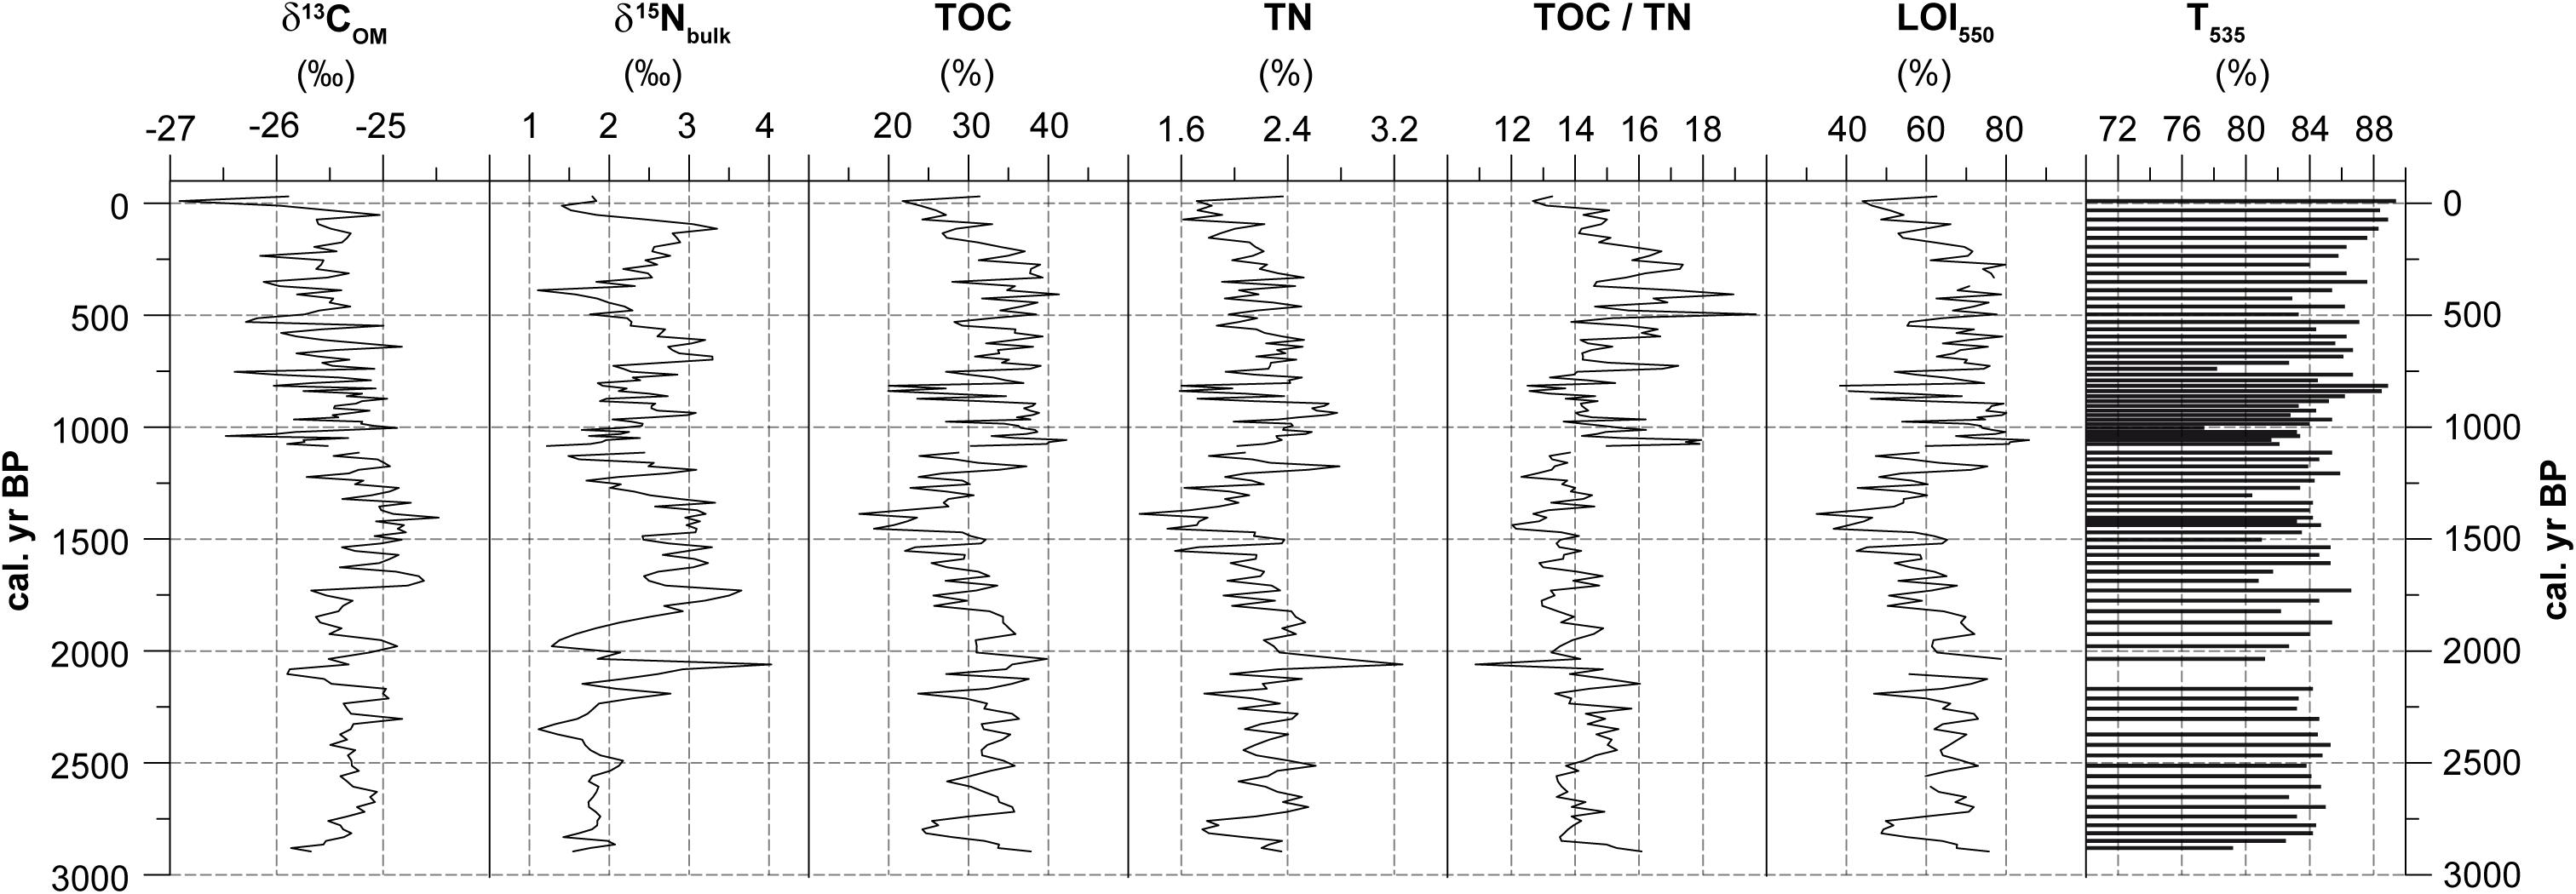
Figure 4. Stable isotopes and element composition on bulk material. δ13COM (‰ vs. VPDB), δ15Nbulk (‰ vs. AIR), TOC (%), TN (%) values as well as the TOC/TN ratio, LOI550 and T535. Missing values are due to insufficient bulk material for analyses and the hiatus between 1080 and 1110 cal. yr BP.
A slight negative correlation (r = -0.17) exists between TOC and δ13COM while no correlation exists between TN and δ15Nbulk (Supplementary Table S2). Similarly, only a weak correlation occurs between δ13COM and δ15Nbulk (r = 0.16). T535 values reveal a negative correlation with δ13COM (r = -0.4) and with TOC (r = -0.39).
Cellulose Oxygen and Carbon Isotopes
The C/O ratios of cellulose from all three investigated size fractions fall into a small range around 0.9 and, thus, indicate that the extraction provided cellulose free of inorganic and organic contaminants (Supplementary Figure S1, see Wissel et al., 2008 for details).
In general, the δ18Ocell values of the different size fractions fluctuate between 28.0 and 31.0‰ and show comparable trends (Figure 5). Conspicuous peaks (e.g. ∼1320 cal. yr BP) or phases with increased (e.g., 2210 to 2120, 1800 to 1600 or 1160 to 1080 cal. yr BP) or reduced values (e.g., 2530 to 2230 or 610 to 130 cal. yr BP) occur in all three time series within the same depths. The high correlation between the fractions < 200 μm and 200–1000 μm (r = 0.93) confirms a strong similarity between these size fractions. δ18Ocell values of the fraction > 1000 μm are comparable to those of the two smaller fractions, however, with a reduced variability and slight differences in the temporal development. This is confirmed by weaker, but still remarkably high correlations (r ≥ 0.59).
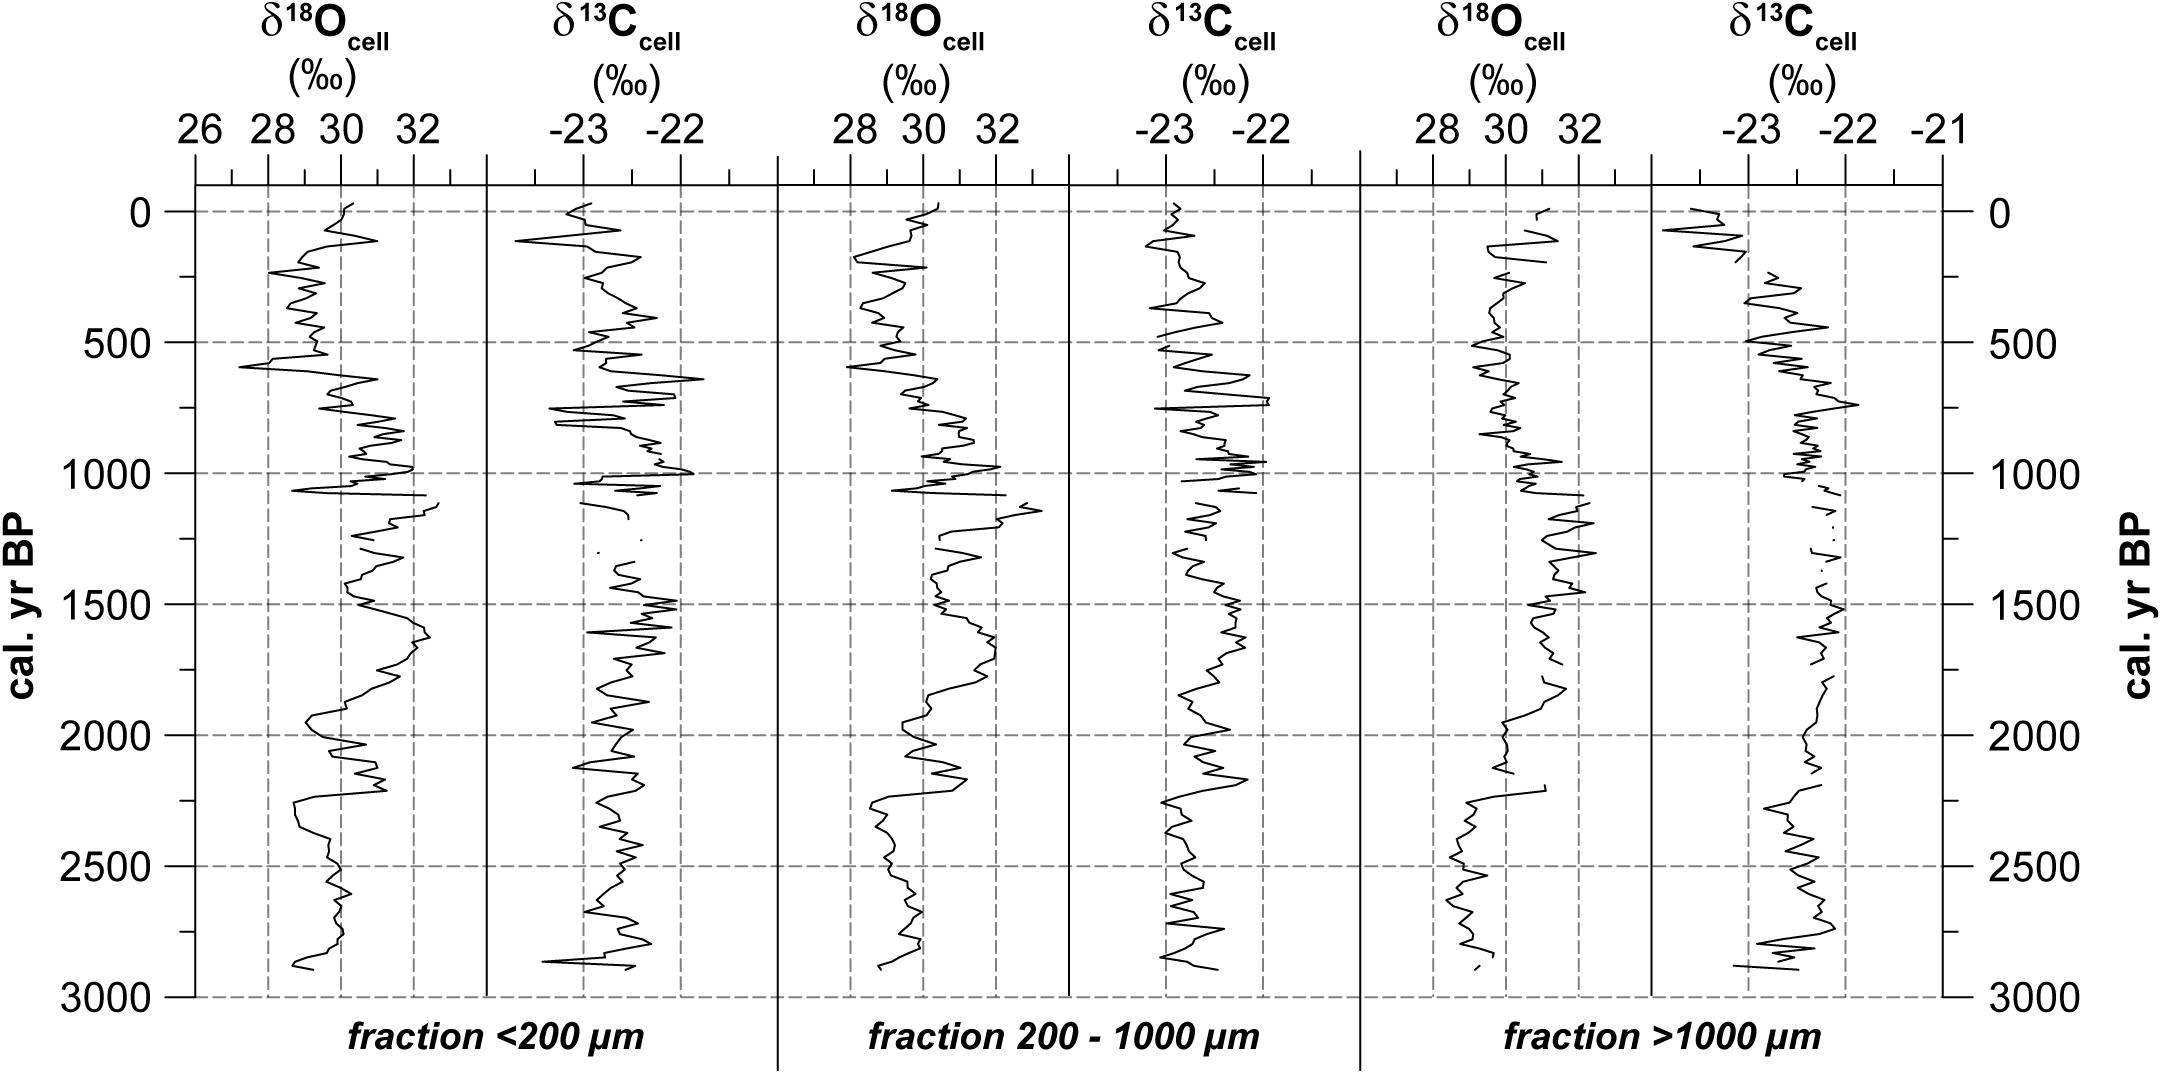
Figure 5. Stable oxygen and carbon isotope composition of cellulose. Given are δ18Ocell (% vs. VSMOW) and δ13Ccell (% vs. VPDB) for the respective fractions < 200 μm, 200–1000 μm and >1000 μm. Missing values are due to insufficient cellulose material for analyses and the hiatus between 1080 and 1110 cal. yr BP.
Comparing all size fractions, the δ13Ccell values vary on average between -22.0 and -23.0‰. However, a transition from lower to higher variable δ13Ccell values after 1080 cal. yr BP is prominent. Further, a slight trend toward decreasing values after 1080 cal. yr BP can be distinguished that is mostly visible in the fraction > 1000 μm. The two smallest fractions reveal a high correlation (r = 0.61). Correlations between the smallest and the largest (r = 0.35), as well as between the middle and largest fraction (r = 0.52) are lower. Within fractions, correlations between δ18Ocell and δ13Ccell reach r values between 0.17 and 0.48.
In comparison to δ13COM values, δ13Ccell values are enriched by about ∼3‰ on average. This difference is comparable with the results of Ménot and Burns (2001) for vascular plants and of Moschen et al. (2009) for Sphagnum peatlands respectively. The trends of δ13Ccell and δ13COM show similarities that are confirmed by correlation coefficients between r = 0.34 and r = 0.42. However, it is conspicuous that δ13COM values are not decreasing within the upper 50 cm. No correlation occurs for δ13Ccell and TOC, while slight negative correlations between δ18Ocell and TOC values exist (r ≤-0.26). A slight negative correlation can be found between T535 and δ13Ccell (r ≤-0.4) while no correlation exists between T535 and δ18Ocell (r ≥ 0.1).
Visual inspection of size fractions prepared for cellulose extraction revealed further details of sample compositions. According to nine inspected samples, the largest size fraction (>1000 μm) is mainly comprised of rhizomes with contributions reaching almost 100% and minor admixtures of leaves. The medium size fraction (200–1000 μm) in comparison contains larger amounts of leave fragments resulting roughly in a 40/60% mixture of rhizomes fragments and leaves. The content of the smallest size fraction (<200 μm) was unidentifiable.
Geochemical Composition From XRF Measurements
Sulfur (S) and Calcium (Ca) values reveal a close similarity (r = 0.99) with very low intensities (total counts = cnts) between 2900 and 2070 cal. yr BP and again from 1060 to -60 cal. yr BP (Figure 6). Strongly increased values occur around 1900, 1650, 1520 and between 1310 and 1130 cal. yr BP. On average, Manganese (Mn) counts fluctuate between 50 and 200. Slightly increased values occur around 2780 and 870 cal. yr BP, while sharply increased values are evident between 260 and 10 cal. yr BP. The counts of Iron (Fe) vary between 5000 and 15000 cps during the most phases of the record. Highest values occur between 2850 and 2780, 2000 and 1750, and between 890 and 800 cal. yr BP. The Mn/Fe ratio fluctuates mostly around 0.01, however, with increased values around 2680, between 2220 and 2080, 1020 and 920 and between 210 and 10 cal. yr BP. Reduced values can be distinguished between 2000 and 1750 and between 400 and 320 cal. yr BP. Interestingly, the peaks of Ca and S occur in the phase with the highest δ18Ccell values.
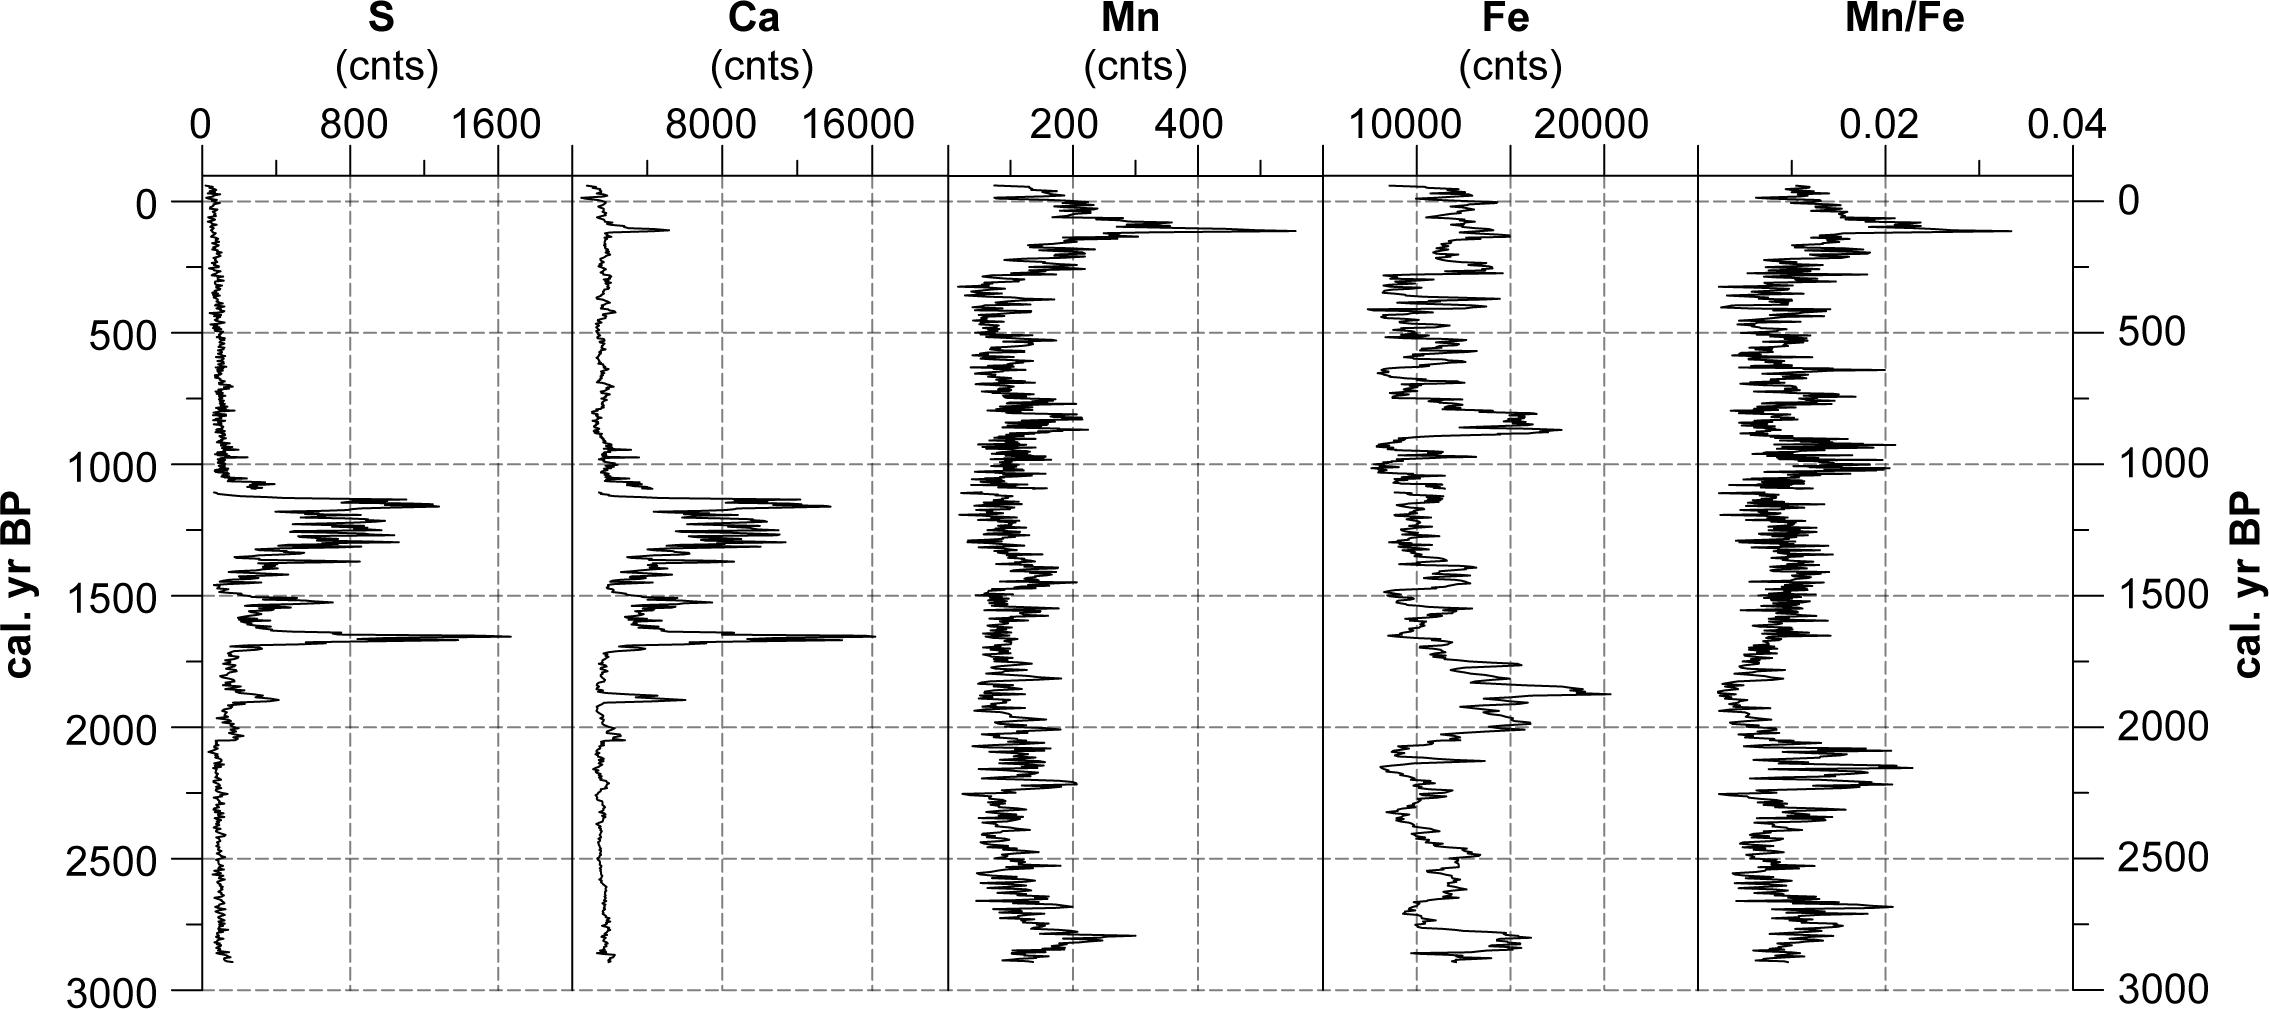
Figure 6. Results of XRF analyses. Given are S, Ca, Mn and Fe values as well as the Mn/Fe-ratio. Missing values are due to the hiatus between 1080 and 1110 cal. yr BP.
Discussion
Implications From Modern Hydrology
The isotopic composition of modern water samples gives an insight into the present hydrological system of CTP. In the headwater as well as the main accumulation section of the peatland (Figure 7), two springs occur (Schittek et al., 2016). These springs are presumably seasonal cold-water springs, located in the Ordovician basement rocks that are characterized by secondary permeability (Giordano et al., 2013). Giordano et al. (2013) describe this part of the Cerro Tuzgle-Tocomar geothermal region as recharge area, thus, the CTP is affected by groundwater of recent precipitation periods and not by deeper geothermal groundwater sources. Following this concept, the isotopic source values of the peatlands’ water are directly linked to the isotope composition of local precipitation, though local evaporation processes during infiltration may have additional influence. However, a multiyear smoothing of the input isotope signal has to be expected due to soil/groundwater residence time and the smoothing effect of the peat water reservoir.
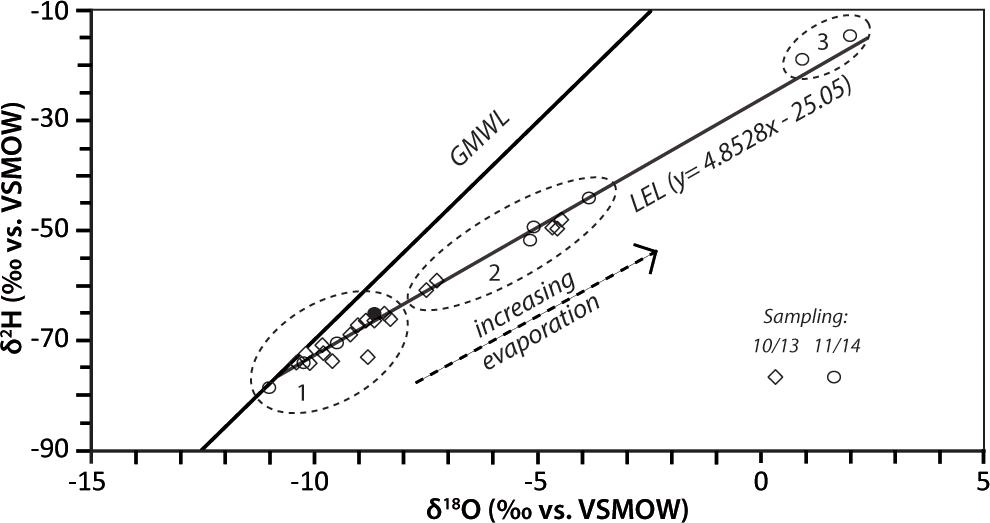
Figure 7. Isotopic composition of CTP modern water samples, sampled in October 2013 (diamonds) and November 2014 (circles). The black filled circle represents the peat water sample (see Supplementary Table S1). The dashed circles represent different degrees of evaporation; (1) low evaporation, (2) slight to medium evaporation, (3) strong evaporation. Also shown are the GMWL (δ2H = 8.13δ18O+10.8, Rozanski et al., 1993) and the LEL (δ2H = 4.8528δ18O-25.05).
The isotopic composition all CTP water samples are compared with the Global Meteoric Water Line [GMWL, δ2H = 8.13δ18O+10.8, Rozanski et al. (1993)], as the existing database (e.g., Global Network of Isotopes in Precipitation - GNIP) is not sufficient to develop a Local Meteoric Water Line. Irrespective of the observed spatial heterogeneity, the samples reveal regularity as they fall on a single line in δ space, clearly describing the modern evaporation line (LEL) for CTP (Figure 7). This is also true for the extruded plant water sample. The slope of the observed relation (δ2H = 4.85 δ18O – 25.05) is typical for evaporating surface waters (e.g., Mook, 2001) that have to be expected due to the local environmental conditions. We interpret this behavior as another evidence for a single, isotopic homogeneous water source for CTP, i.e., that meteoric water (precipitation, young groundwater) recharges the peatland. Thus, older and potentially isotopically different groundwater is not involved in the hydrology of the peatland which in turn is closely connected to the meteoric water cycle. This is supported by low electrical conductivity values of the water (Schittek et al., 2016).
The surface water data set from October 2013 gives further insights into the spatial heterogeneity of water isotopes. Samples close to the two springs (Tuz-1, Tuz-2, Tuz-12, Tuz-13, Tuz-21, Tuz-22) are characterized by a low degree of 18O enrichment compared to spring values, thus low evaporative enrichment (Figure 8). All other samples of the CTP suggest a higher degree of evaporative enrichment, e.g., in isolated pools (Tuz-5) that are surrounded by dense cushion vegetation without interspersed channels. The water samples of the lake section (Tuz-9 and Tuz-10) exhibit the strongest degree of evaporation due to their large open water surface prone to evaporation. On the one hand, these spatial heterogeneities indicate the strong effect of microtopographical differences for evaporative isotope enrichment of surface water in cushion peatlands. Similar effects have already been described for Sphagnum peatlands (Ménot-Combes et al., 2002). On the other hand, they point toward a limited movement respectively exchange of water within the peatland despite superficial connections through visible rivulets (Figure 2). It seems likely that with increasing dryness or temporal drought, the number of isolated pools in the peatland will grow causing a respective response toward higher δ18O and δ2H values in these pools. The implication for a microtopographical habitat, i.e., a potentially temporal stable single cushion in the peat land is that variations in water availability through changes in e.g. evaporation, precipitation, connectivity or growth are systematically translated into a respective response of the local source water isotopic signature.
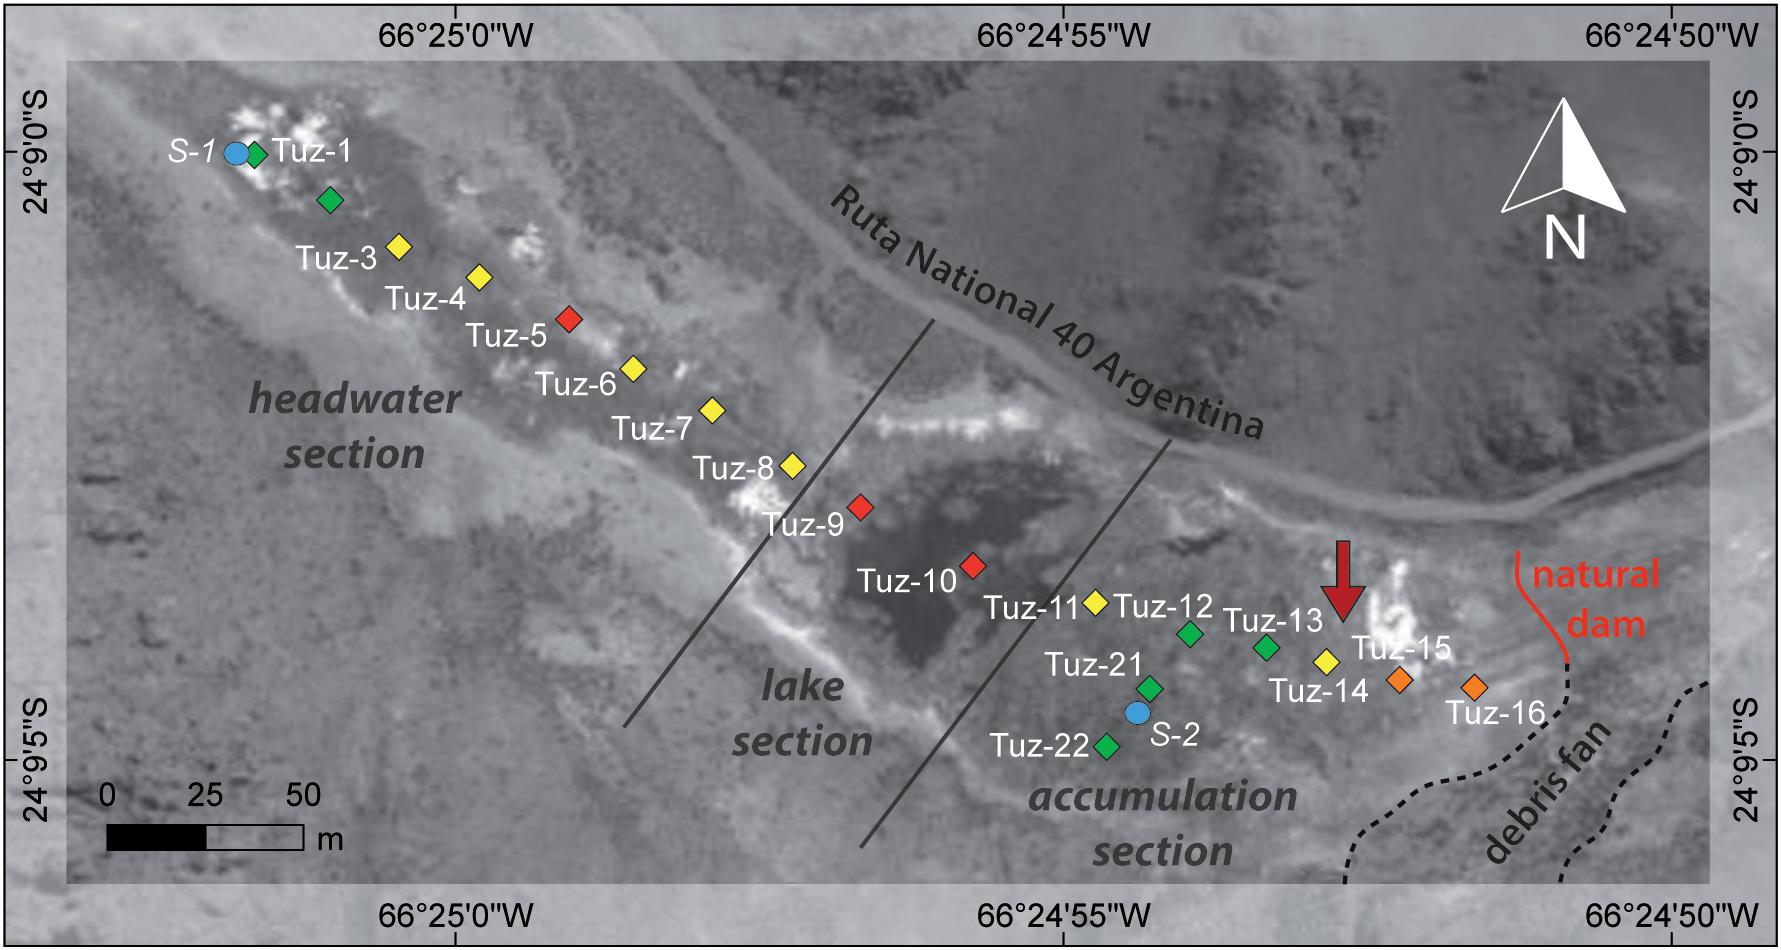
Figure 8. Location of water samples from October 2013 on the CTP. Colors indicate relative 18O enrichment in the samples, i.e., the degree of evaporation (green: low or absent evaporation, yellow: slight evaporation, orange: medium evaporation, red: strong evaporation). Diamonds indicate surface peatland samples (Tuz), blue circles (S1 and S2) indicate the location of the springs, the red arrow the location of core Tuz-694. The debris fan (dashed line) presumably favors the development of the natural dam (red line). The main sections of the peatland are illustrated according to Schittek et al. (2016) (data source: DGM-GTOPO30).
Implications From Modern Vegetation
The modern plant samples reveal distinct isotopic differences between O. andina and Z. muticus (Table 2). In contrast to Z. muticus (Δδ18Ol-r = 0.7‰) a huge offset in δ18O between rhizomes and leaves of O. andina (Δδ18Ol-r = 4.1‰) is evident. Even larger differences between leaves and roots were reported for the vascular plant Empodisma (∼Δδ18Ol-r = 8.4‰ to 11.8‰) (Amesbury et al., 2015b). We suggest that this offset arises from dissimilar leaf structures. Leaves of O. andina are described as lignified (Ruthsatz, 2008), thus, might possess a higher protection against transpiration, leading to increased 18O/16O ratios of leaf water and, finally, of leaf cellulose relative to Z. muticus. Considering these intraspecies δ18Ocell ranges, vegetation changes should have a minor influence on the δ18O signal in the size fractions, i.e., 200–1000 μm, since values of Z. muticus leaves and rhizomes are within the limits of O. andina. Given the small species difference for rhizomes (Table 2), such effects should be negligible for the largest size fraction (>1000 μm).
In comparison with other investigations on vascular (Amesbury et al., 2015a) and non-vascular peatlands (e.g., Loisel et al., 2009), the ranges of δ13C cellulose values are small for both species (Table 2). However, previous studies reveal that interspecies variability can have significant influences on the δ13Ccell signal (Ménot and Burns, 2001). In the present study, mean δ13Ccell values of Z. muticus are enriched for leaves (δ13CZam-Oxy = 0.61‰) and rhizomes (δ13CZam-Oxy = 0.84‰) respectively in contrast to O. andina. Thus, the potential δ13Ccell change to be expected for a complete (but unlikely) vegetation change from one species to the other would amount to 0.6–0.8‰. Further investigations on the range of δ18Ocell and δ13Ccell variations within a single cushion in the same microenvironment could help identify causes for the observed isotopic differences.
Peat Forming Vegetation and Decomposition
To use cushion peatlands as continuous high-resolution archives aspects like changes in plant composition need to be considered. Peatlands consisting of Oxychloe are poor in species diversity, in contrast to e.g., Distichia dominated peatlands, are especially suitable for paleoenvironmental studies (Ruthsatz, 2008) because species-specific effects are limited. This notion applies with regard to the CTP record, where only O. andina and Z. muticus dominate the peatland. Our measurements on modern plant samples indicate that changes in the occurrence between the species could cause a smoothing of δ18O variations recorded in the peat core and might lead to a slight shift in δ13Ccell values (see above). However, macrofossil analyses confirm that O. andina is the dominant peat forming species in CTP within the whole record (Schittek et al., 2016; Schittek, unpublished data). Furthermore, macrofossil analyses indicate an increase of Z. muticus between 80 cm and 130 cm depth (Schittek et al., 2016; Schittek, unpublished data), without any visible response in our isotope proxies excluding any vegetational bias in the records.
Another question is, whether different size or compositional fractions of the peat possess different (climate-) signals. Correlation analyses reveal a strong respectively good accordance between our two smaller size fractions (r = 0.93 for δ18O, r = 0.61 for δ13C), indicating that the fractions < 200 μm and 200–1000 μm comprise the same signal. Weaker correlations of δ18O of these fractions with the fraction > 1000 μm can be linked to the composition of the size fractions since the largest fraction mainly consist of rhizomes while the smaller fractions have varying contributions of rhizomes and leaves. According to our modern plant data (see above), O. andina dominated phases should possess an offset δ18O between the smaller (enriched) fractions and the largest fraction dominated by (depleted) rhizomes. However, this expectation is not met by our data, even if some parts of the record exhibit more depleted δ18Ocell > 1000 values. Most likely a direct comparison between the isotopic compositions of living leaves with already decomposed leaves or other plant parts in the peat is not feasible. A way to overcome this problem could be to use already died off leaves age groups of preceding years of still living plants. Modern δ13Ccell values of O. andina exhibit a small deviation between leaves and rhizomes (Δδ13Cl-r = 0.2‰), thus, the development in every fraction is expected to be very similar. This assumption is mainly confirmed despite some deviations regarding the δ13Ccell > 1000 record. Reasons for these deviations could be a change in the contribution of the remaining plant parts (leaves, rhizomes) to the composition of the smaller fractions. Overall, the general isotopic trends in all fractions reveal a good match, wherefore we argue that the primordial environmental signal is imprinted and inherited in all three size fractions.
Decomposition can have an influence on the stable isotope composition of bulk peat or cellulose. Burial and humification of peat material removes at first the more labile organic fractions, thus may significantly change the δ13C values of bulk organic matter (Ménot and Burns, 2001) toward enriched δ13C values in the residual peat (e.g., Novak et al., 2010). A raised degree of humification can potentially be identified by low T535 values (e.g., Chambers et al., 2011). In the CTP record, the variation of T535 is very limited indicating that the influence of decomposition on isotope records of bulk peat is negligible, after the step of initial removal of mobile and soluble phases. Starting from fresh plant litter, cellulose is also decomposed to a comparable or even larger degree as lignin after initial removal of soluble components (e.g., Sjöberg et al., 2004; Fioretto et al., 2005). However, not much is known on isotopic changes through cellulose decomposition especially with respect to the oxygen isotopic composition of cellulose. During an artificial aging experiment, Schleser et al. (1999) observed a maximum deviation of 0.3‰ from the initial δ13C value of wood cellulose, however, with increasing degree of cellulose decomposition the δ13C values of the remaining cellulose again reached their initial values. Thus, we expect isotope effects of decomposition on cellulose, despite strong reduction of cellulose content, to be small. Identical (within analytical uncertainty) mean cellulose oxygen and carbon stable isotope values of all size fractions further support this concept.
Paleoclimatic Implications From the CTP Proxy Dataset
The δ18O values recorded in plant cellulose are controlled by several (local) influences like evaporation degree of the surface water or changes in peat composition (see above). However, a major factor is the isotopic composition of the source water. Climate modeling studies (e.g., Vuille et al., 2003; Vuille and Werner, 2005) point out that δ18O values of precipitation (δ18Oprec) in the Central Andes are affected by precipitation amount, moisture source, degree of rainout upstream and re-evaporation, condensation temperature and atmospheric circulation. Independent of the variety of factors, Global Network of Isotopes in Precipitation (GNIP) station data clearly indicate a significant negative correlation of δ18O values with precipitation amount for different parts in South America (IAEA/WMO, 2004). While low gradients are observed from the coastal area of Brazil (e.g., Belém GNIP station, 24 m a.s.l.: -0.113‰/10 mm), higher gradients occur in the Andean Highlands (e.g., Gran Chocaya GNIP station, 4340 m a.s.l.: -1.226‰/10 mm) (Supplementary Table S3). The connection between precipitation amount and δ18O is supported by Ballantyne et al. (2011) who infer decreased δ18Oprec values in more humid periods in a study of tree ring cellulose in Brazil (3.18°S, 60.08°W), Peru (12.68°S, 69.28°W) and northern Argentina (22.08°S, 66.08°W).
Based on this fundamental relation, we argue that increased precipitation amounts at the study site are directly connected with more depleted source water for CTP cushion plants and vice versa. Furthermore, we argue that recent precipitation forms the primary source of water for the cushion plants. Since water influx into the peatland from the north or from older groundwater can be excluded (see above), water solely reaches the CTP in form of (1) direct precipitation on the peatland and superficial run-off from the surrounding slopes as well as from the ephemeral stream and (2) recharge from two springs from shallow groundwater (see also Schittek et al., 2016).
Accordingly, during phases of increased humidity, depleted precipitation reaches CTP. Due to a high water volume (but nearly constant surface area), evaporation has potentially lower influence on the δ18O values of the water within the peatland. With sufficient water supply (considering site conditions), we expect the vascular plants O. andina and Z. muticus to have comparably open stomata, leading to comparably less18O enrichment in the leaf water (e.g., Roden et al., 2000). Overall, these factors operate additive and lead to relatively depleted δ18Ocell values within the cushion plants. Vice versa, periods with increased aridity are characterized by low but enriched precipitation reaching the study area, stronger influence of local evaporation effects, reduced stomatal conductance and increasing fractionation with enriched δ18OLW values, and finally enriched δ18Ocell values. Thus, we interpret δ18Ocell values to be a proxy for moisture conditions at CTP (Figure 9b).
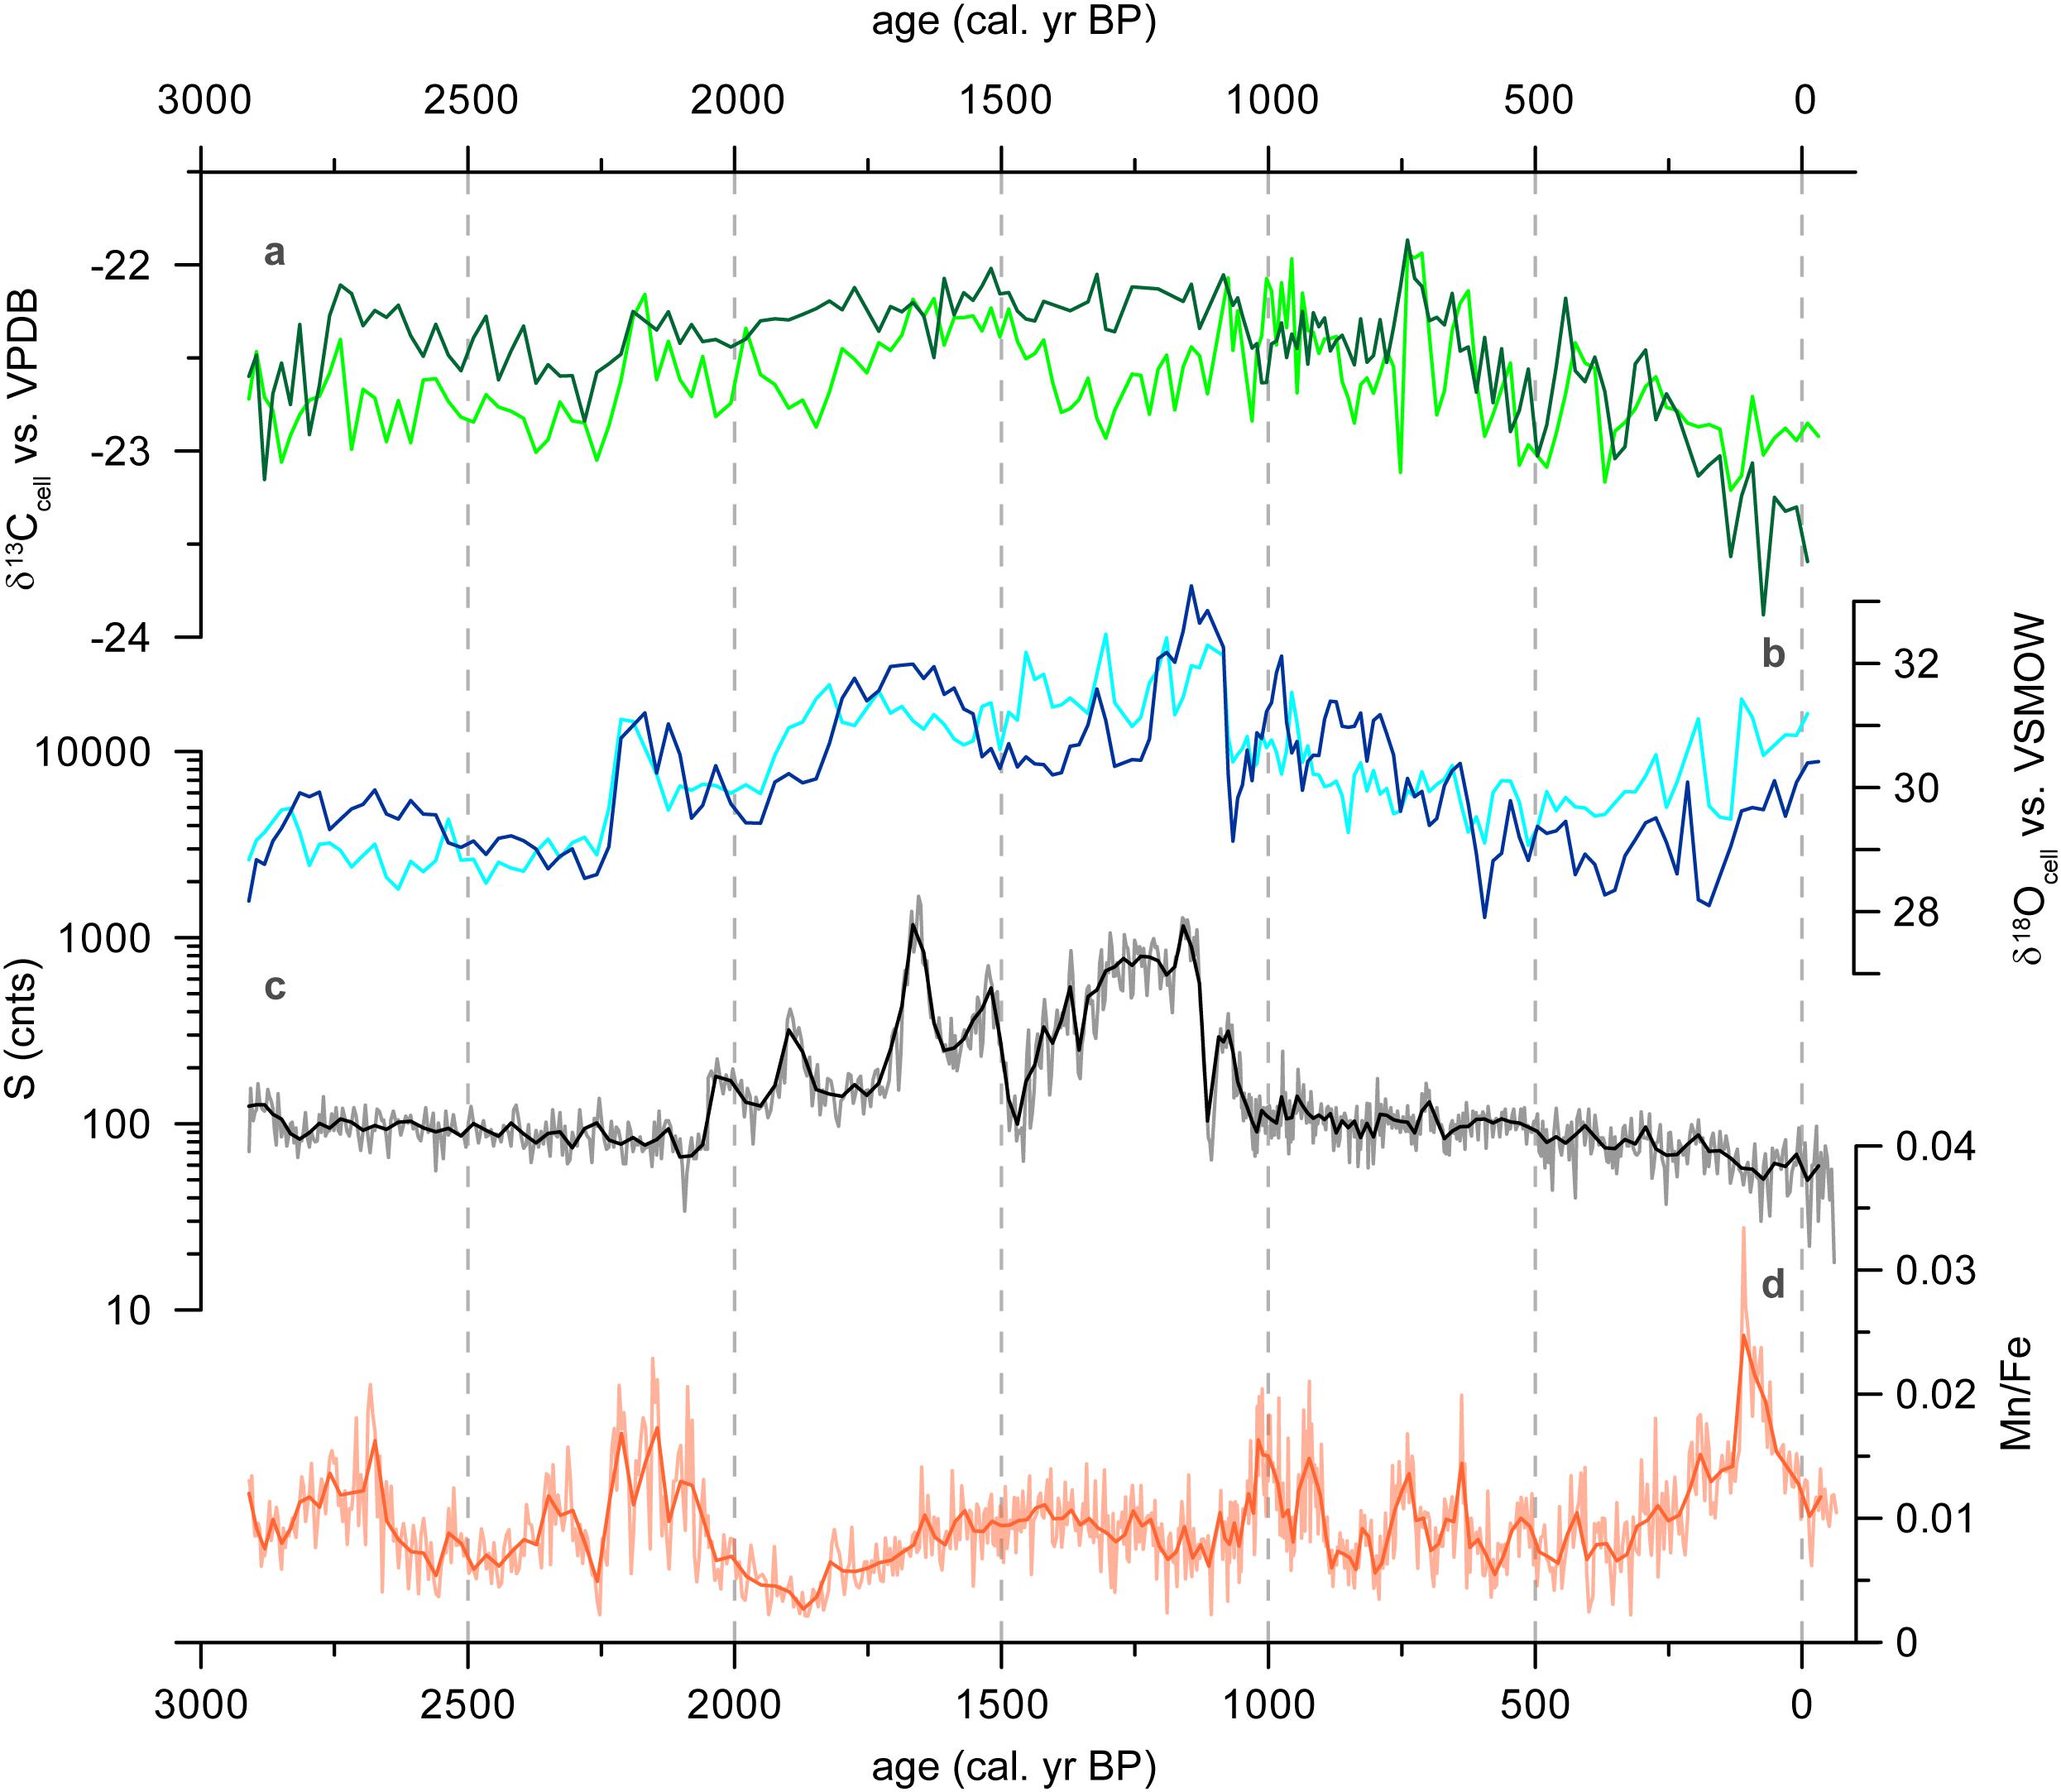
Figure 9. Results of core Tuz-694. (a) δ13Ccell (‰ vs. VPDB) for fraction 200–1000 μm (light green) and >1000 μm (dark green), (b) δ18Ocell (‰ vs. VSMOW) for fraction 200–1000 μm (dark blue) and fraction > 1000 μm (light blue), (c) Sulfur content (black: 5 pt. average, log10-scale), (d) Mn/Fe ratio (orange: 5 pt. average).
Beside oxygen isotopes, the stable carbon isotope compositions of bulk organic matter or cellulose also provide insights into local environmental and climatic conditions (Figure 9a). Through the stomatal aperture transpiration and photosynthesis in leaves are coupled processes, which in turn have strong impacts on the stable carbon and oxygen isotope composition of new photosynthates. Due to this basic dependency of both variables on stomatal aperture, i.e., because gas exchange through the stomata influences both carbon and water cycle of the plants, a certain relation can be expected (Smedley et al., 1991; Barbour et al., 2002; Chaves et al., 2004; Gessler et al., 2009). Since photosynthetic carbon fixation solely influences the plant carbon cycle, such a relation might be very variable in strength. Nevertheless, further evidence for our interpretation of δ18Ocell as moisture indicator for CTP may be derived from a correlation between δ13Ccell and δ18Ocell. Indeed, positive significant correlations appear in our cellulose stable isotope records (Supplementary Table S2). Correlation coefficients between δ13Ccell and δ18Ocell reach values of about r = 0.5 for the medium size fractions. Overall, these positive correlations between δ13Ccell and δ18Ocell support our interpretation that more enriched δ18Ocell values are indicative for more severe moisture stress at CTP.
The ratio of Mn/Fe is used as an indicator of redox conditions in CTP (Schittek et al., 2015, 2016). Accordingly, anoxic conditions in the peat water column and presumably stable water conditions are indicated by high Mn/Fe values (Figure 9d). Principally, the place of signal generation differs between these proxies (leave, “catotelm”) which might already cause temporal deviations. Also, Mn and Fe can be of lithogenic origin and transported to the CTP while redeposition processes can further hinder an unambiguous interpretation. δ18Ocell values can be affected in detail by several factors like precipitation amount, moisture source, moisture transport history or the degree of rainout upstream (Insel et al., 2013). Further investigations are needed to explain the differences between these two proxies connected to the peatland hydrology in more detail.
The striking parallel curves of S and Ca counts (r = 0.99) suggests the hypothesis that these element counts are linked to gypsum precipitates, developed under dry conditions without strong water-table fluctuations (e.g., Litaor et al., 2004). Although the values might indicate secondary gypsum precipitates after core opening, we argue that the ion concentration did not change in the plant pore water, and thus, reflect climatic conditions during synthesis. Interestingly, the phase of strongly increased counts of S and Ca appear together with highest values of δ18Ocell (Figure 9c), which again strengthen our interpretation of δ18Ocell as proxy for moisture conditions at CTP.
Regional Paleoclimate Comparison
Based on our δ18Ocell record, we observe phases with enhanced and reduced moisture supply at the CTP (24°S, Figure 10a). Wetter conditions prevailed from 2750 to 2250 and from 600 to 130 cal. yr BP, while drier conditions can be identified between 2190 and 2120, 1750 and 1590, 1200 and 1080 and since 130 cal. yr BP. In order to interpret our findings in the context of changes in the large scale atmospheric circulation, we compare the CTP record with local and supraregional paleoclimate records of the high Andes between 10 and 24°S (Figure 10).
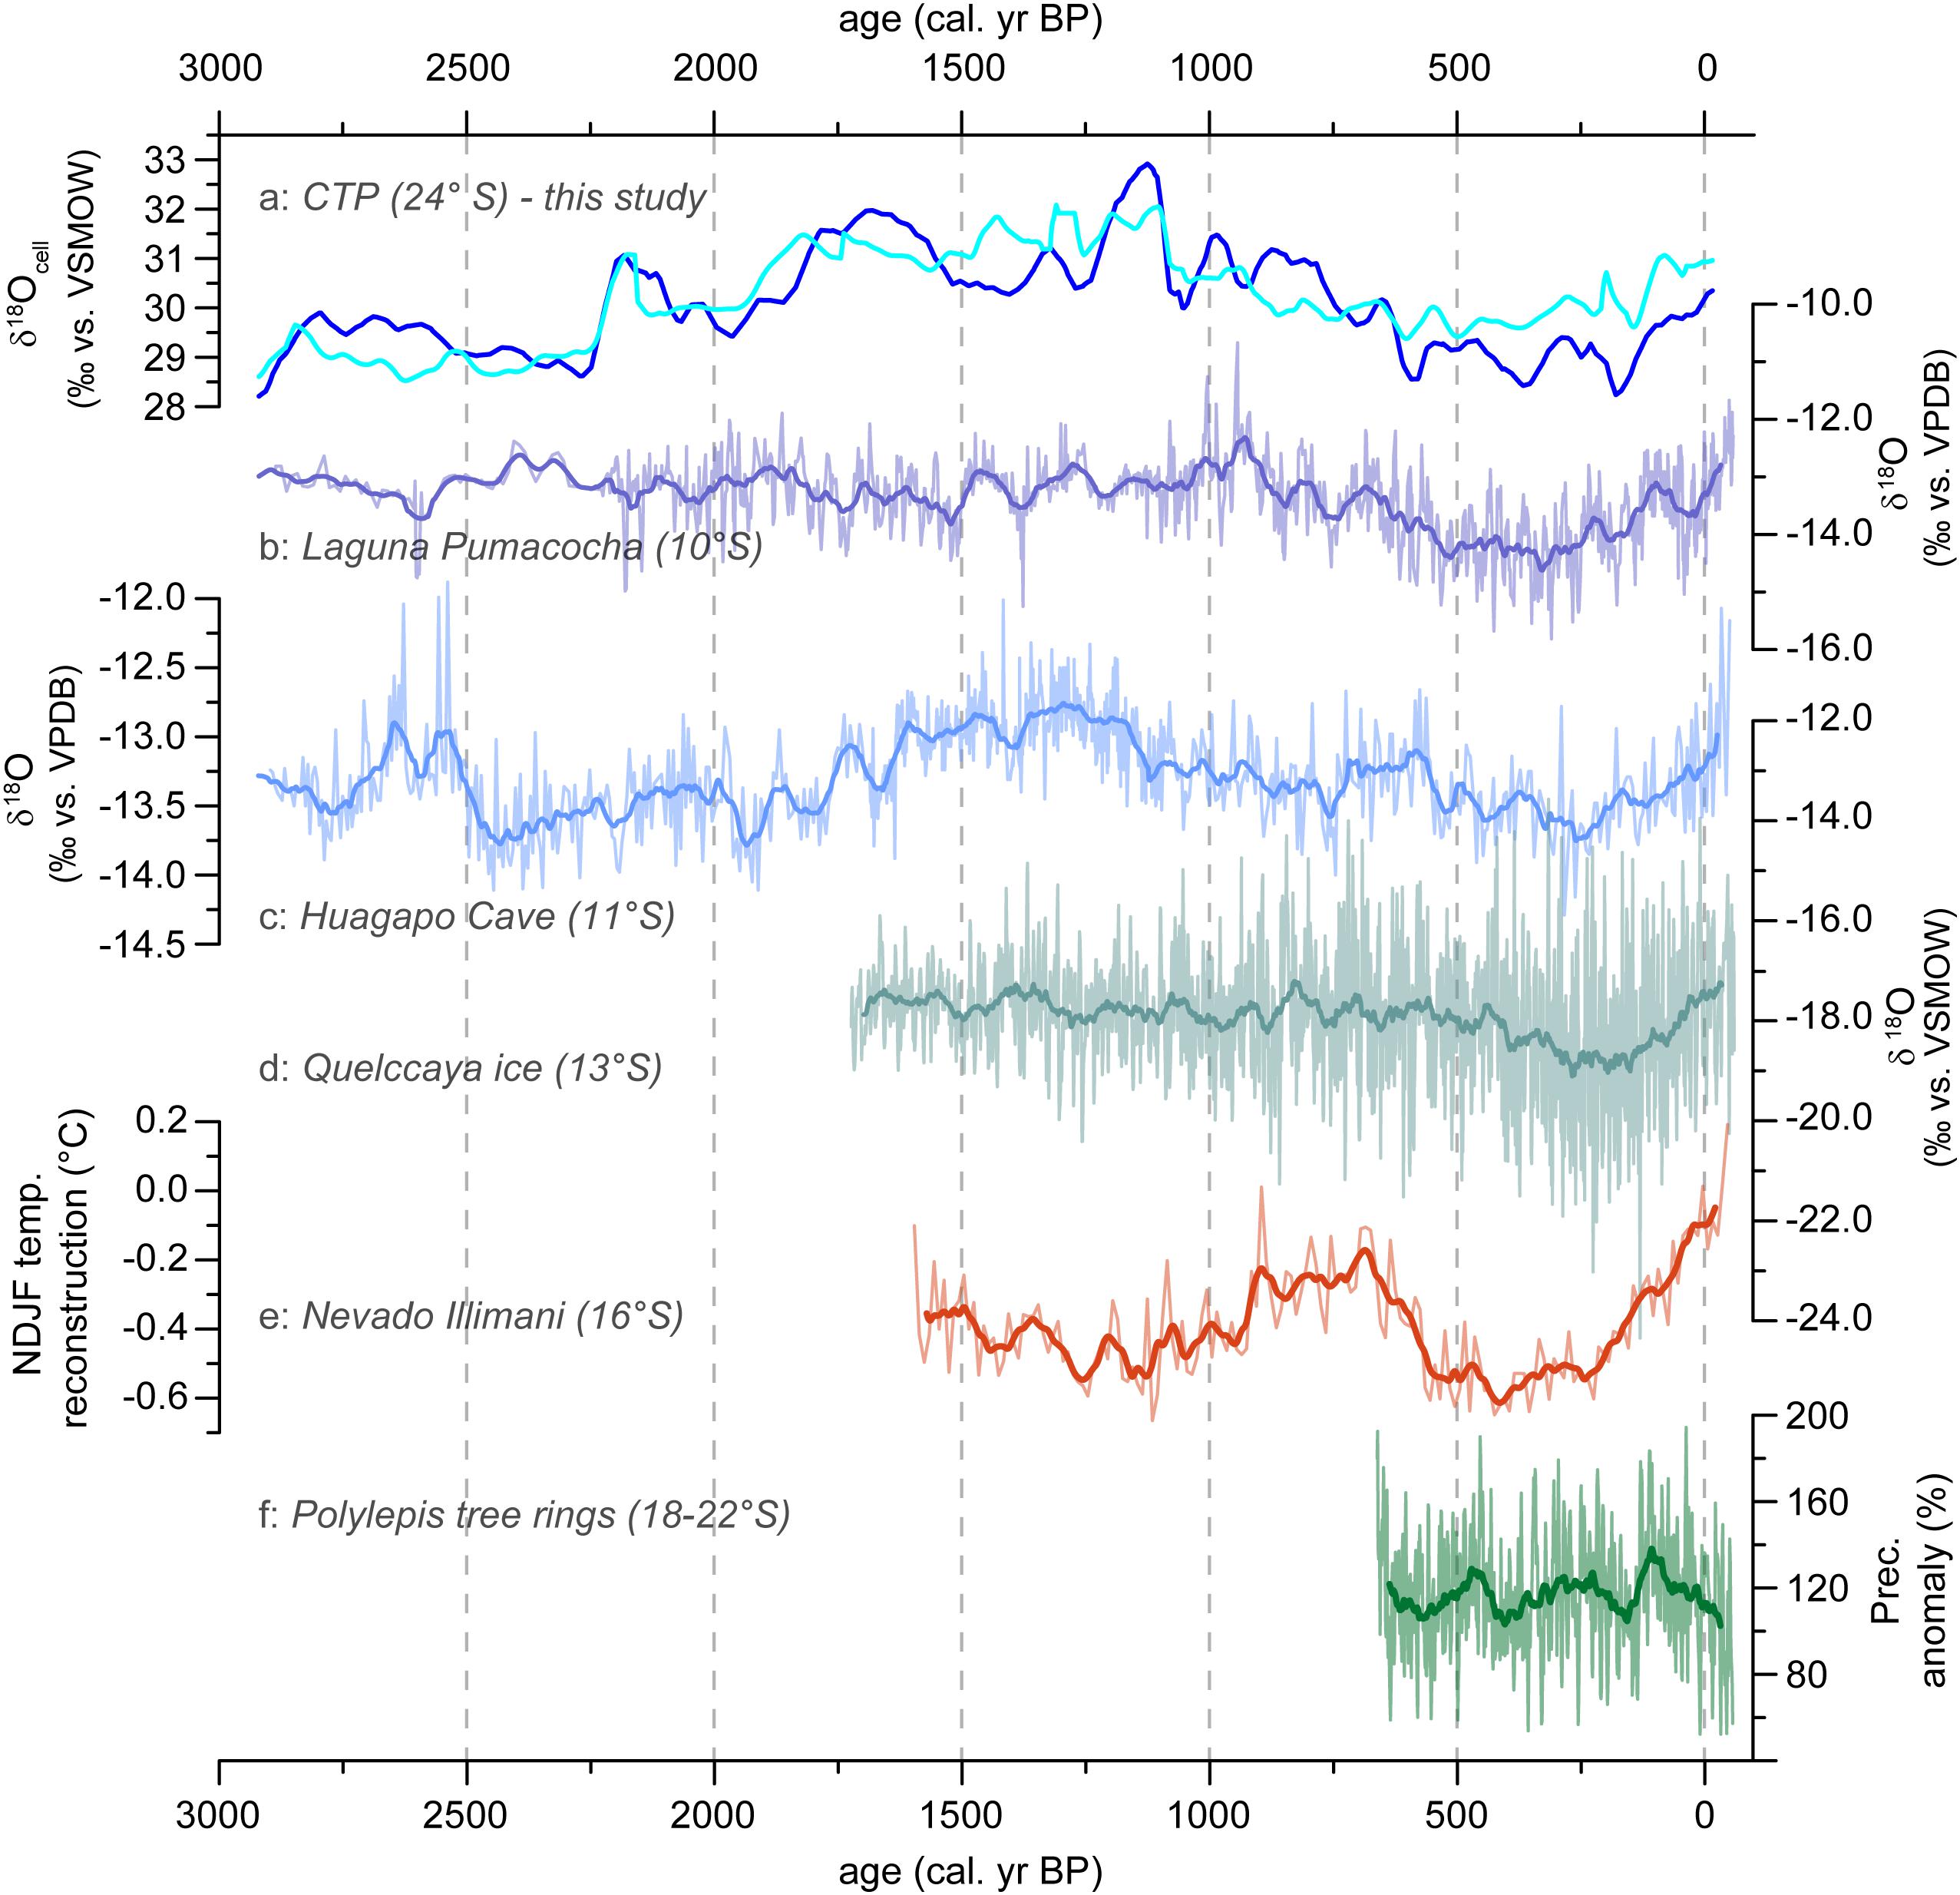
Figure 10. CTP record compared with supraregional archives. (a) CTP δ18Ocell (‰ vs. VSMOW) for fraction 200–1000 μm (dark blue) and fraction >1000 μm (light blue), Argentina (b) δ18O (‰ vs. VPDB) of Laguna Pumacocha (∼10°S), Peru (Bird et al., 2011a,b), (c) δ18O (‰ vs. VPDB) of Huagapo Cave (∼11 °S), Peru (Kanner et al., 2013), (d) δ18O (‰ vs. VSMOW) of Quelccaya ice cap (∼13°S), Peru (Thompson et al., 2013), (e) NDJF temperature anomalies (°C) of the Nevado Illimani based on ammonium concentrations (16°S), Bolivia (Kellerhals et al., 2010), (f) Precipitation anomalies (%) for the Central Andes based on Polylepis tarapacana tree rings (18–22°S), Chile and Bolivia (Morales et al., 2012). Mark that all values are annualized based on the original data (presented in transparent colors) and averaged by 51 years.
Regional atmospheric circulation is mainly driven by (1) the strength of the Atlantic Meridional Overturning Circulation, (2) latitudinal changes of the Intertropical Convergence Zone (ITCZ), (3) the dipole-like pattern of the South Atlantic Convergence Zone and the South American Low Level Jet (SALLJ) and (4) the position of the Bolivian High (Liebmann and Mechoso, 2011; Marengo et al., 2012; Vuille et al., 2012; Rojas et al., 2016; Novello et al., 2018). During austral spring, moisture transport from the North Atlantic to the Andean highlands starts with a weakening of the meridional temperature gradient between October and November, leading to a southward displacement of the SALLJ. Simultaneously, connected to this shift of the ITCZ over the tropical Atlantic and Pacific, deep convection over the central part of the continent starts to develop (Hastenrath, 1997; Marengo et al., 2012). Finally, this leads to the development of the SASM during the summer months, thus, to N-S moisture transport reaching the NW Argentine Andes (Garreaud, 2000; Vera et al., 2006; Vuille et al., 2012). In the northern Central Andes, numerous archives are describe to have a close δ18O dependence to the SASM development (e.g., lake sediments: Bird et al., 2011a,b; speleothems: Kanner et al., 2013; ice caps: Thompson et al., 2013; tree rings: Ballantyne et al., 2011). Comparing these sites (see Figure 10d) with the CTP δ18Ocell record (Figure 10a) several phases with strong similarities and differences can be detected.
In many parts, comparable curve progressions of δ18O records are visible for CTP, Laguna Pumacocha, Huagapo cave and Quelccaya ice cap. High similarity of all archives occurs between 600 cal. yr BP and recent times, covering the Little Ice Age, characterized by decreased δ18O values (increased precipitation), and the Current Warm Period, dominated by increased δ18O values (decreased precipitation). Comparing the entire CTP record since 2900 cal. yr BP, highest conformity is visible for Huagapo cave. The good comparability of δ18O records from Huagapo cave and CTP offers the potential to resolve latitudinal climate gradients due to transient changes in circulation systems (e.g., SASM) if uncertainties in age models can be accounted for. However, despite the spatial proximity to the Huagapo cave, δ18O values of Laguna Pumacocha show stronger deviations compared to CTP.
If we assume that no shift of the seasonal precipitation regimes took place, thus, rainfall occurs only between November and March, other reasons linked to the overturning circulation systems need to be considered. Vuille and Keimig (2004) stated that due to easterly upper- and midtropospheric wind anomalies, three out of phase SASM modes can be differentiated. A northern mode is leading to enhanced convective activity and tropical precipitation in the Andes between ∼10 and ∼20°S, while a northeastern mode is affecting the eastern Cordillera of the high Andes between ∼15 and ∼22°S by increased precipitation amounts. Contrary, a southern mode leads to increased precipitation in the southern Central Andes between ∼20 and ∼30°S, due to a southern displacement of the Bolivian High and a Rossby wave dispersion of the Southern Hemisphere extratropics (Vuille and Keimig, 2004). A more frequent out-of-phase SASM in the past could be a possible explanation for temporal deviations between the proxy records, although extratropical precipitation events as cold air cut off- and cold frontal snowfall are typical for the austral winter (Vuille and Ammann, 1997; Barett et al., 2009). To disentangle the paleoclimatic features in the southern Central Andes, more isotope studies on cushion peatlands are needed.
Temperature reconstruction of the Amazon Basin as the source region for the Ammonium concentration in the Nevado Illimani (Kellerhals et al., 2010; Figure 10e) as well as local temperature reconstruction from the high-Andean Laguna Chepical (32°S, de Jong et al., 2013) excludes the influence of local temperatures on the δ18Ocell values of the CTP, which could possibly extend/reduce a vegetation-active period. Previous works already showed that the amount effect and not temperature explains a significant fraction of isotopic variations on seasonal and interannual time scales (e.g., Bird et al., 2011b; Vuille et al., 2012).
As archives covering the last 2900 years are scarce, a local paleoclimate comparison is difficult. Nevertheless, taking small age depth model uncertainties into account, precipitation reconstruction for the Altiplano of Bolivia and Northern Chile based on tree-ring width series of Polylepis tarapacana also reveals a good progression with the δ18Ocell values of the CTP (Morales et al., 2012; Figure 10f).
Conclusion
For the understanding of cushion peatlands as highly suitable paleoclimate archives our study could reveal several important findings. Modern plant samples expose significant differences in the isotope composition of the dominant plant species and clearly indicate the need for analyses of the modern vegetation prior to the interpretation of any core sample results. Modern water samples reveal strong isotopic differences for single water pools of up to Δδ18O = 13.09‰ due to evaporation, implying limited movement respectively exchange of water within the peatland despite superficial rivulets. Overall, modern water samples describe a local evaporation line for CTP.
Macrofossil analyses of bulk samples showed that the dominating peat forming species of CTP is O. andina. Despite temporal changes in composition of the deposited peat between O. andina and Z. muticus no detectable influence on the isotopic composition of peat cellulose did occur. Microscopic inspection of peat size fractions revealed distinct differences in their composition (leaves, rhizomes). Irrespective of that, the respective isotope records of all three size fractions are overall consistent.
Increasing precipitation in the study area is connected with decreasing δ18Oprec values while less precipitation is accompanied by enriched δ18Oprec values (IAEA/WMO, 2004). Also, during more arid phases the effects of local evaporation on the isotopic composition of peat water is stronger than during humid phases. Additionally, the stomata of the cushion plants are constricted or closed under water stress, leading to respectively enriched δ18OLW values, and finally enriched δ18Ocell values. Considering these factors together we argue that δ18Ocell values are a suitable proxy for moisture conditions at the CTP reflecting local humidity changes during the last 2900 cal. yr BP that are closely connected to the SASM. Discrepancies in the temporal match with other SASM reconstructions suggest impacts of other large-scale atmospheric variability or a different SASM expression at the southerly location of the CTP. According to this finding, predominant dryer conditions dominated at the CTP from 2190 to 2120, 1750 to 1590 and are dominating since 130 cal. yr BP, while more humid conditions prevailed between 2750 and 2250 and between 600 and 130 cal. yr BP. The investigated size fractions show similar developments in their δ18Ocell records, however, smaller deviations occur most likely indicating either different compositions or decomposition histories. The obvious differences between the CTP record and other existing climate records reveal the need for further investigations regarding the causes for those discrepancies and provide potential to reveal the history of the spatial (latitudinal) evolution of the SASM during the late Holocene.
Data Availability
All datasets generated for this study are included in the manuscript and/or the Supplementary Files. Raw data can be found in the Supplementary Table S1 and will additionally be made available via the National Oceanic and Atmospheric Administration (NOAA) Paleoclimate database.
Author Contributions
All authors have made substantial contributions to the manuscript in an equal way and approved the submitted version. SK, KS, and AL contributed conception and design of the study. KS and FS provided approval for publication of the content. HV, CO, and HW performed the statistical analysis of the data and helped by the interpretation. SK, AL, and KS wrote sections of the manuscript. LL and JK revised the manuscript critically for important intellectual content.
Funding
This work was funded by the German Academic Exchange Service (DAAD) PROMOS – scholarship for Thesis preparation 2015 to SK, German Science Foundation to FS (SCHA 14-1/2), the German Federal Ministry for Education and Research to KS (ARG 06/009), and the National University of Jujuy to LL (SeCTER) which is greatly appreciated.
Conflict of Interest Statement
The authors declare that the research was conducted in the absence of any commercial or financial relationships that could be construed as a potential conflict of interest.
Acknowledgments
We thank Gabriel Cortés, Fabio Flores, Gonzalo Torres, and Leandro Rojo for great help during fieldwork. Special thanks belong to Ulrike Langen, Heike Zimmermann, and Josip Sučić for their help in the laboratory. We also thank Sabine Stahl for support and help with the calibration of the XRF results.
Supplementary Material
The Supplementary Material for this article can be found online at: https://www.frontiersin.org/articles/10.3389/feart.2019.00045/full#supplementary-material
References
Allmendinger, R. W., Jordan, T. E., Kay, S. M., and Isacks, B. L. (1997). The evolution of the altiplano-puna plateau in the central andes. Annu. Rev. Earth Planet. Sci. 25, 139–174. doi: 10.1146/annurev.earth.25.1.139
Amesbury, M. J., Charman, D. J., Newnham, R. M., Loader, N. J., Goodrich, J., Royles, J., et al. (2015a). Can oxygen stable isotopes be used to track precipitation moisture source in vascular plant-dominated peatlands? Earth Planet. Sci. Lett. 430, 149–159. doi: 10.1016/j.epsl.2015.08.015
Amesbury, M. J., Charman, D. J., Newnham, R. M., Loader, N. J., Goodrich, J. P., Royles, J., et al. (2015b). Carbon stable isotopes as a palaeoclimate proxy in vascular plant dominated peatlands. Geochim. Cosmochim. Acta 164, 161–174. doi: 10.1016/j.gca.2015.05.011
Ballantyne, A. P., Baker, P. A., Chambers, J. Q., Villalba, R., and Argollo, J. (2011). Regional differences in South American monsoon precipitation inferred from the growth and isotopic composition of tropical trees. Earth Interact. 15, 1–35. doi: 10.1175/2010EI277.1
Barbour, M. M., Walcroft, A. S., and Farquhar, G. D. (2002). Seasonal variation in δ13C and δ18O of cellulose from growth rings of Pinus radiata. Plant Cell Environ. 25, 1483–1499. doi: 10.1046/j.0016-8025.2002.00931.x
Barett, B. S., Garreaud, R. D., and Falvey, M. (2009). Effect of the andes cordillera on precipitation from a midlatitude cold front. Mon. Weather Rev. 137, 3092–3109. doi: 10.1175/2009MWR2881.1
Bianchi, A., Yañez, C., and Acuna, L. (2005). Data From: Base De Datos Mensuales De Precipitaciones Del Noroeste Argentino. Convenio INTA-SAGPYA. INTA Salta. Climate Data. Available at: http://www.ora.gov.ar/informes/atlas_noa_precipitaciones.pdf
Bird, B. W., Abbott, M. B., Rodbell, D. T., and Vuille, M. (2011a). Holocene tropical South American hydroclimate revealed from a decadally resolved lake sediment δ18O record. Earth Planet. Sci. Lett. 310, 192–202. doi: 10.1016/j.epsl.2011.08.040
Bird, B. W., Abbott, M. B., Vuille, M., Rodbell, D. T., Stansell, N. D., and Rosenmeier, M. F. (2011b). A 2,300-year-long annually resolved record of the South American summer monsoon from the Peruvian Andes. Proc. Natl. Acad. Sci. U.S.A. 108, 8583–8588. doi: 10.1073/pnas.1003719108
Blackford, J. J., and Chambers, F. M. (1993). Determining the degree of peat decomposition for peat based palaeoclimatic studies. Int. Peat J. 5, 7–24.
Brenninkmeijer, C. A. M., van Geel, B., and Mook, W. G. (1982). Variations in the D/H and 18O/16O ratios in cellulose extracted from a peat bog core. Earth Planet. Sci. Lett. 61, 283–289. doi: 10.1016/0012-821X(82)90059-0
Cabrera, A. L. (1968). “Ecología vegetal de la Puna,” in Geo-Ecology of the Mountainous Regions of the Tropical Americas, ed. C. Troll (Bonn: Ferd. Dümmlers Verlag), 15–55.
Chambers, F. M., Beilman, D. W., and Yu, Z. (2011). Methods for determining peat humification and for quantifying peat bulk density, organic matter and carbon content for palaeostudies of climate and peatland carbon dynamics. Mires Peat 7, 1–10.
Chaves, M. M., Osório, J., and Pereira, J. S. (2004). “Water use efficiency and photosynthesis,” in Water Use Efficiency in Plant Biology, ed. M. A. Bacon (Oxford: Blackwell Publishing), 43–74.
Cominelli, E., Galbiati, M., and Tonelli, C. (2008). Integration of water stress response cell expansion and cuticle deposition in Arabidopsis thaliana. Plant Sig. Behav. 3, 556–557. doi: 10.4161/psb.3.8.5699
Croudace, I. W., Rindby, A., and Rothwell, R. G. (2006). ITRAX: description and evaluation of a new multi-function X-ray core scanner. Geol. Soc. Spec. Publ. 267, 51–63. doi: 10.1144/GSL.SP.2006.267.01.04
de Jong, R., von Gunten, L., Maldonado, A., and Grosjean, M. (2013). Late Holocene summer temperatures in the central Andes reconstructed from the sediments of high-elevation Laguna Chepical, Chile (32°S). Clim. Past 9, 1921–1932. doi: 10.5194/cp-9-1921-2013
DeNiro, M. J., and Epstein, S. (1981). Isotopic composition of cellulose from aquatic organisms. Geochim. Cosmochim. Acta 45, 1885–1894. doi: 10.1016/0016-7037(81)90018-1
Engel, Z., Skrzypek, G., Chuman, T., Šefrna, L., and Mihaljevič, M. (2014). Climate in the western cordillera of the central andes over the last 4300 years. Quat. Sci. Rev. 99, 60–77. doi: 10.1016/j.quascirev.2014.06.019
Farquhar, G. D., Cernusak, L. A., and Barnes, B. (2007). Heavy water fractionation during transpiration. Plant Physiol. 143, 11–18. doi: 10.1104/pp.106.093278
Farquhar, G. D., Hubick, K. T., Condon, A. G., and Richards, R. A. (1989). “Carbon isotope fractionation and plant water-use efficiency,” in Stable Isotopes in Ecological Research 68, eds P. W. Rundel, J. R. Ehleringer, and K. A. Nagy (Berlin: Springer), 21–40.
Fioretto, A., Di Nardo, C., Papa, S., and Fuggi, A. (2005). Lignin and cellulose degradation and nitrogen dynamics during decomposition of three leaf litter species in a mediterranean ecosystem. Soil Biol. Biochem. 37, 1083–1091. doi: 10.1016/j.soilbio.2004.11.007
Flantua, S. G. A., Hooghiemstra, H., Vuille, M., Behling, H., Carson, J. F., Gosling, W. D., et al. (2016). Climate variability and human impact in South America during the last 2000 years: synthesis and perspectives from pollen records. Clim. Past 12, 483–523. doi: 10.5194/cp-12-483-2016
Garreaud, R. D. (2000). Intraseasonal variability of moisture and rainfall over the South American Altiplano. Mon. Weather Rev. 128, 3337–3346. doi: 10.1175/1520-0493(2000)128<3337:IVOMAR>2.0.CO;2
Garreaud, R. D., Vuille, M., and Clement, A. C. (2003). The climate of the Altiplano: observed current conditions and mechanisms of past changes. Palaeogeogr. Palaeocl. 194, 5–22. doi: 10.1016/S0031-0182(03)00269-4
Garreaud, R. D., Vuille, M., Compagnucci, R., and Marengo, J. (2009). Present-day South American climate. Palaeogeogr. Palaeocl. 281, 180–195. doi: 10.1016/j.palaeo.2007.10.032
Gessler, A., Brandes, E., Buchmann, N., Helle, G., Rennenberg, H., and Barnard, R. L. (2009). Tracing carbon and oxygen isotope signals from newly assimilated sugars in the leaves to the tree-ring archive. Plant Cell Environ. 32, 780–795. doi: 10.1111/j.1365-3040.2009.01957.x
Giordano, G., Pinton, A., Cianfarra, P., Baez, W., Chiodi, A., Viramonte, J., et al. (2013). Structural control on geothermal circulation in the cerro tuzgle-tocomar geothermal volcanic area (Puna plateau, Argentina). J. Volcanol. Geoth. Res. 249, 77–94. doi: 10.1016/j.jvolgeores.2012.09.009
Gonfiantini, R. (1978). Standards for stable isotope measurements in natural compounds. Nature 271, 534–536. doi: 10.1038/271534a0
Gouze, P., Ferhi, A., Fontes, J. C., and Roche, M. A. (1987). Composition isotopique (18 O) de la matière organique des tourbières actuelles et holocènes en Bolivie: résultats préliminaires et perspectives d’application en paléoclimatologie. Géodynamique 2, 113–116.
Hastenrath, S. (1997). Annual cycle of upper air circulation and convective activity over the tropical Americas. J. Geophys. Res. 102, 4267–4274. doi: 10.1029/96JD03122
Heiri, O., Lotter, A. F., and Lemcke, G. (2001). Loss on ignition as a method for estimating organic and carbonate content in sediments: reproducibility and comparability of results. J. Paleolimnol. 25, 101–110. doi: 10.1023/A:1008119611481
Higuera, P. E., Brubaker, L. B., Anderson, P. M., Sheng Hu, F., and Brown, T. A. (2009). Vegetation mediated the impacts of postglacial climate change on fire regimes in the south-central brooks range, Alaska. Ecol. Monogr. 79, 201–219. doi: 10.1890/07-2019.1
Hogg, A. G., Quan, H., Blackwell, P. G., Niu, M., Buck, C. E., Guilderson, T. P., et al. (2013). SHCAL13 southern hemisphere calibration, 0-50,000 years cal BP. Radiocarbon 55, 1889–1903. doi: 10.2458/azu_js_rc.55.16783
Hong, Y. T., Hong, B., Lin, Q. H., Shibata, Y., Zhu, Y. X., Leng, X. T., et al. (2009). Synchronous climate anomalies in the western North Pacific and North Atlantic regions during the last 14000 years. Quat. Sci. Rev. 28, 840–849. doi: 10.1016/j.quascirev.2008.11.011
Hong, Y. T., Jiang, H. B., Liu, T. S., Zhou, L. P., Beer, J., Li, H. D., et al. (2000). Response of climate to solar forcing recorded in a 6000-year δ18O time-series of Chinese peat cellulose. Holocene 10, 1–7. doi: 10.1191/095968300669856361
IAEA/WMO. Data from: Global Network of Isotopes in Precipitation. GNIP Database (2004). IAEA/WMO. Data From: Global Network of Isotopes in Precipitation. GNIP Database. Available at: https://nucleus.iaea.org/wiser/index.php.
Insel, N., Poulsen, C. J., Sturm, C., and Ehlers, T. A. (2013). Climate controls on Andean precipitation δ18O interannual varariability. J. Geophys. Res. Atmos. 118, 9721–9742. doi: 10.1002/jgrd.50619
Juggins, S. (2017). Data From: Rioja: Analysis of Quaternary Science Data, R Package Version (0.9-9). Available at: https://cran.r-project.org/web/packages/rioja/index.html.
Kanner, L. C., Burns, S. J., Cheng, H., Edwards, R. L., and Vuille, M. (2013). High-resolution variability of the South American summer monsoon over the last seven millennia: insights from a speleothem record from the central Peruvian Andes. Quat. Sci. Rev. 75, 1–10. doi: 10.1016/j.quascirev.2013.05.008
Kellerhals, T., Brütsch, S., Sigl, M., Knüsel, S., Gäggeler, H. W., and Schwikowski, M. (2010). Ammonium concentration in ice cores: a new proxy for regional temperature reconstruction? J. Geophys. Res. 115:D16123. doi: 10.1029/2009JD012603
Kock, S. T., Schittek, K., Luecke, A., Maldonado, A., and Mächtle, B. (2018). Geomorphodynamics of the western Chilean Central Andes (27°S) during the last 1800 cal. yr BP as recorded in a high-Andean cushion peatland. Z. Geomorphol. 62 (in press). doi: 10.1127/zfg_suppl/2018/0537
Kock, S. T., Schittek, K., Mächtle, B., Wissel, H., Maldonado, A., and Lücke, A. (2019). Late Holocene environmental changes reconstructed from stable isotope and geochemical records from a cushion-plant peatland in the Chilean Central Andes (27°S). J. Quat. Sci. 34, 153–164. doi: 10.1002/jqs.3088
Kuentz, A. (2009). Dynamiques actuelle et holocène de la Puna (Andes sèches du Pérou) à partir des observacións de terrain, de la cartographie (SIG) et de la palynologie (Région du Nevado Coropuna). [dissertation]. [Clermont-Ferrand]: Université Blaise Pascal.
Liebmann, B., and Mechoso, C. R. (2011). “The south american monsoon system,” in The Global Monsoon System Research and Forecast, 2nd Edn, eds C.-P. Chang, Y. Ding, N.-C. Lau, R. H. Johnson, B. Wang, and T. Yasunari (Singapore: World of Scientific), 137–157. doi: 10.1142/9789814343411_0009
Litaor, M. I., Reichmann, O., Auerswald, K., Haim, A., and Shenker, M. (2004). The geochemistry of phosphorus in peat soils of a semiarid altered wetland. Soil Sci. Soc. Am. J. 68, 2078–2085. doi: 10.2136/sssaj2004.2078
Liu, J., Chen, Y., Ma, L., Pu, H., Liu, C., Zhao, Z., et al. (2018). The δ13C of cellulose from modern plants and its responses to the atmosphere From the peatland records of Dajiuhu, China. Holocene 28, 408–414. doi: 10.1177/0959683617729444
Loisel, J., Garneau, M., and Hélie, J.-F. (2009). Modern Sphagnum δ13C signatures follow a surface moisture gradient in two boreal peat bogs, James Bay lowlands, Québec. J. Quat. Sci. 24, 209–214. doi: 10.1002/jqs.1221
Marengo, J. A., Liebmann, B., Grimm, A. M., Misra, V., Silva Dias, P. L., Cavalcanti, I. F. A., et al. (2012). Recent developments on the South American monsoon system. Int. J. Climatol. 32, 1–21. doi: 10.1002/joc.2254
Marsh, E. J., Bruno, M. C., Fritz, S. C., Baker, P., Capriles, J. M., and Hastorf, C. A. (2018). IntCal, SHCal, or a mixed curve? Choosing a 14C calibration curve for archaeological and paleoenvironmental records from tropical South America. Radiocarbon 2018, 1–16. doi: 10.1017/RDC.2018.16
Ménot, G., and Burns, S. J. (2001). Carbon isotopes in ombrogenic peat bog plants as climatic indicators: calibration from an altitudinal transect in Switzerland. Org. Geochem. 32, 233–245. doi: 10.1016/S0146-6380(00)00170-4
Ménot-Combes, G., Burns, S. J., and Leuenberger, M. (2002). Variations of 18O/16O in plants from temperate peat bogs (Switzerland): implications for paleoclimatic studies. Earth. Planet. Sci. Lett. 202, 419–434. doi: 10.1016/S0012-821X(02)00794-X
Mook, W. G. (2001). Environmental Isotopes in the Hydrological Cycle: Principles and Applications, Vol. 1. Vienna, VA: IAEA.
Morales, M. S., Christie, D. A., Villalba, R., Argollo, J., Pacajes, J., Silva, J. S., et al. (2012). Precipitation changes in the South American Altiplano since 1300 AD reconstructed by tree-rings. Clim. Past 8, 653–666. doi: 10.5194/cp-8-653-2012
Moschen, R., Kühl, N., Rehberger, I., and Lücke, A. (2009). Stable carbon and oxygen isotopes in sub-fossil Sphagnum: assessment of their applicability for palaeoclimatology. Chem. Geol. 259, 262–272. doi: 10.1016/j.chemgeo.2008.11.009
Norini, G., Cogliati, S., Baez, W., Arnosio, M., Bustos, E., Viramonte, J., et al. (2014). The geological and structural evolution of the cerro tuzgle quaternary stratovolcano in the back-arc region of the Central Andes, Argentina. J. Volcanol. Geoth. Res. 285, 214–228. doi: 10.1016/j.jvolgeores.2014.08.023
Novak, M., Zemanova, L., Buzek, F., Jackova, I., Adamova, M., Komarek, A., et al. (2010). The effect of a reciprocal peat transplant between two contrasting Central European sites on C cycling and C isotope ratios. Biogeosciences 7, 921–932. doi: 10.5194/bg-7-921-2010
Novello, V. F., Cruz, F. W., Mosquet, J. S., Vuille, M., de Paula, M. S., Nunes, D., et al. (2018). Two millennia of south atlantic convergence zone variability reconstructed from isotopic proxies. Geophys. Res. Lett. 45, 5045–5051. doi: 10.1029/2017GL076838
Pate, J. S. (2001). “Carbon isotope discrimination and plant water-use efficiency,” in Stable Isotope Techniques in the Study of Biological Processes and Functioning of Ecosystems, eds M. Unkovich, J. Pate, A. McNeill, and D. J. Gibbs (Berlin: Springer), 19–36. doi: 10.1007/978-94-015-9841-5_2
Rauh, W. (1988). Tropische Hochgebirgspflanzen: Wuchs- Und Lebensformen. Berlin: Springer. doi: 10.1007/978-3-642-73426-7
Reimer, P. J., Bard, E., Bayliss, A., Beck, J. W., Blackwell, P. G., Ramsey, C. B., et al. (2013). INTCAL13 and MARINE13 radiocarbon age calibration curves 0–50,000 years cal BP. Radiocarbon 55, 1869–1887. doi: 10.2458/azu_js_rc.55.16947
Roden, J. S., Lin, G., and Ehleringer, J. R. (2000). A mechanistic model for interpretation of hydrogen and oxygen isotope ratios in tree-ring cellulose. Geochim. Cosmochim. Acta 64, 21–35. doi: 10.1016/S0016-7037(99)00195-7
Rojas, M., Arias, P. A., Flores-Aqueveque, V., Seth, A., and Vuille, M. (2016). The South American monsoon variability over the last millennium in climate models. Clim. Past 12, 1681–1691. doi: 10.5194/cp-12-1681-2016
Rozanski, K., Araguás-Araguás, L., and Gonfiantini, R. (1993). “Isotopic patterns in modern global precipitation,” in Climate Change in Continental Isotopic Records, Vol. 78, eds P. K. Swart, K. C. Lohmann, J. Mckenzie, and S. Savin (Washington: American Geophysical Union), 1–36.
Ruthsatz, B. (1977). Pflanzengesellschaften Und Ihre Lebensbedingungen in Den Andinen Halbwüsten Nordwest-Argentiniens. Stuttgart: J. Cramer in der Gebrüder Borntraeger Verlagsbuchhandlung.
Ruthsatz, B. (2008).“Hartpolstermoore der Hochanden NW-Argentiniens als Indikatoren für Klimagradienten,” in Flora, Vegetation Und Naturschutz zwischen Schleswig-Holstein Und Südamerika. Festschrift für Klaus Dierßen zum 60. Geburtstag, eds J. Dengler, C. Dolnik and M. Trempel (Hamburg: Mitteilungen der Arbeitsgemeinschaft für Geobotanik in Schleswig-Holstein und Hamburg 65), 209–238.
Schittek, K. (2014). Cushion Peatlands in the High Andes of Northwest Argentina as Archives for Palaeoenvironmental Research, Dissertationes Botanicae 412. Stuttgart: J. Cramer in der Gebrüder Borntraeger Verlagsbuchhandlung.
Schittek, K., Forbriger, M., Mächtle, B., Schäbitz, F., Wennrich, V., Reidel, M., et al. (2015). Holocene environmental changes in the highlands of the southern Peruvian Andes (14° S) and their impact on pre-Columbian cultures. Clim. Past 11, 27–44. doi: 10.5194/cp-11-27-2015
Schittek, K., Forbriger, M., Schäbitz, F., and Eitel, B. (2012). “Cushion peatlands fragile water resources in the high andes of southern peru,” in Water Contributions to Sustainable Supply and Use, Landscape and Sustainable Development, eds H. Weingartner, O. Blumenstein, and M. Vavelidis (Salzburg: Workinggroup Landscape and Sustainable Development),63–84.
Schittek, K., Kock, S. T., Lücke, A., Ohlendorf, C., Kulemeyer, J. J., Lupo, L. C., et al. (2016). A high-altitude peatland record of environmental changes in the NW Argentine Andes (24°S) over the last 2100 years. Clim. Past 12, 1165–1180. doi: 10.5194/cp-12-1165-2016
Schleser, G. H., Frielingsdorf, J., and Blair, A. (1999). Carbon isotope behaviour in wood and cellulose during artificial aging. Chem. Geol. 158, 121–130. doi: 10.1016/S0009-2541(99)00024-8
Sjöberg, G., Nilsson, S. I., Persson, T., and Karlsson, P. (2004). Degradation of hemicellulose, cellulose and lignin in decomposing spruce needle litter in relation to N. Soil Biol. Biochem. 36, 1761–1768. doi: 10.1016/j.soilbio.2004.03.010
Skrzypek, G., Engel, Z., Chuman, T., and Šefrna, L. (2011). Distichia peat a new stable isotope paleoclimate proxy for the Andes. Earth Planet. Sci. Lett. 307, 298–308. doi: 10.1016/j.epsl.2011.05.002
Smedley, M. P., Dawson, T. E., Comstock, J. P., Donovan, L. A., Sherrill, D. E., Cook, C. S., et al. (1991). Seasonal carbon isotope discrimination in a grassland community. Oecologia 85, 314–320. doi: 10.1007/BF00320605
Squeo, F. A., Warner, B. G., Aravena, R., and Espinoza, D. (2006). Bofedales: high altitude peatlands of the central Andes. Rev. Chil. Hist. Nat. 79, 245–255. doi: 10.4067/S0716-078X2006000200010
Sternberg, L. D. S. O. (2009). Oxygen stable isotope ratios of tree-ring cellulose: the next phase of understanding. New Phytol. 181, 553–562. doi: 10.1111/j.1469-8137.2008.02661.x
Stuiver, M., Reimer, P. J., and Reimer, R. W. (2013). Calib 7.0. Radiocarbon Calibration Program. Available at: http://calib.org/calib/download/calib704.zip
Thompson, L. G., Mosley-Thompson, E., Davis, M. E., Zagorodnov, V. S., Howat, I. M., Mikhalenko, V. N., et al. (2013). Annually resolved ice core records of tropical climate variability over the past ∼1800 years. Science 340, 945–950. doi: 10.1126/science.1234210
Troll, C. (1968). “The cordilleras of the tropical Americas. aspects of climatic, phytogeographical and agrarian ecology,” in Geo-Ecology of the Mountainous Regions of the Tropical Americas, ed. C. Troll (Bonn: Ferd. Dümmlers Verlag), 15–56.
Vera, C., Higgins, W., Amador, J., Ambrizzi, T., Garreaud, R., Gochis, D., et al. (2006). Toward a unified view of the American Monsoon systems. J. Clim. 19, 4977–5000. doi: 10.1175/JCLI3896.1
Vuille, M., and Ammann, C. (1997). Regional snowfall patterns in the high, arid Andes. Clim. Chang. 36, 413–423. doi: 10.1007/978-94-015-8905-5_10
Vuille, M., Bradley, R. S., Werner, M., Healy, R., and Keimig, F. (2003). Modeling δ18O in precipitation over the tropical Americas: 1. Interannual variability and climatic controls. J. Geophys. Res. Atmos. 108:4174. doi: 10.1029/2001JD002038
Vuille, M., Burns, S. J., Taylor, B. L., Cruz, F. W., Bird, B. W., Abbott, M. B., et al. (2012). A review of the South American monsoon history as recorded in stable isotopic proxies over the past two millennia. Clim. Past 8, 1309–1321. doi: 10.5194/cp-8-1309-2012
Vuille, M., and Keimig, F. (2004). Interannual variability of summertime convective cloudiness and precipitation in the Central Andes derived from ISCCP-B3 Data. J. Clim. 17, 3334–3348. doi: 10.1175/1520-0442(2004)017<3334:IVOSCC>2.0.CO;2
Vuille, M., and Werner, M. (2005). Stable isotopes in precipitation recording South American summer monsoon and ENSO variability: observations and model results. Clim. Dynam. 25, 401–412. doi: 10.1007/s00382-005-0049-9
Werner, D. J. (1974). “Landschaftsökologische Untersuchungen in der argentinischen Puna,” in Tagungsbericht Und Wissenschaftliche Abhandlungen, Deutscher Geographentag Kassel 1973, eds C. Rathjens and M. Born (Kassel: F. Steiner Verlag), 508–528.
Keywords: late Holocene, cushion peatlands, Central Andes, SASM, precipitation, cellulose, stable isotopes
Citation: Kock ST, Schittek K, Wissel H, Vos H, Ohlendorf C, Schäbitz F, Lupo LC, Kulemeyer JJ and Lücke A (2019) Stable Oxygen Isotope Records (δ18O) of a High-Andean Cushion Peatland in NW Argentina (24° S) Imply South American Summer Monsoon Related Moisture Changes During the Late Holocene. Front. Earth Sci. 7:45. doi: 10.3389/feart.2019.00045
Received: 21 December 2018; Accepted: 27 February 2019;
Published: 22 March 2019.
Edited by:
Steven L. Forman, Baylor University, United StatesReviewed by:
Mingrui Qiang, South China Normal University, ChinaZoltan Kern, MTA Research Centre for Astronomy and Earth Sciences, Hungary
Copyright © 2019 Kock, Schittek, Wissel, Vos, Ohlendorf, Schäbitz, Lupo, Kulemeyer and Lücke. This is an open-access article distributed under the terms of the Creative Commons Attribution License (CC BY). The use, distribution or reproduction in other forums is permitted, provided the original author(s) and the copyright owner(s) are credited and that the original publication in this journal is cited, in accordance with accepted academic practice. No use, distribution or reproduction is permitted which does not comply with these terms.
*Correspondence: Sebastian T. Kock, cy5rb2NrQGZ6LWp1ZWxpY2guZGU=