 Jan Seibert
 Barbara Strobl
 Simon Etter
 Philipp Hummer
 H. J. (Ilja) van Meerveld
- 1Department of Geography, University of Zurich, Zurich, Switzerland
- 2Department of Aquatic Sciences and Assessment, Swedish University of Agricultural Sciences, Uppsala, Sweden
- 3SPOTTERON GmbH, Vienna, Austria
Hydrological observations are crucial for decision making for a wide range of water resource challenges. Citizen science is a potentially useful approach to complement existing observation networks to obtain this data. Previous projects, such as CrowdHydrology, have demonstrated that it is possible to engage the public in contributing hydrological observations. However, hydrological citizen science projects related to streamflow have, so far, been based on the use of different kinds of instruments or installations; in the case of stream level observations, this is usually a staff gauge. While it may be relatively easy to install a staff gauge at a few river sites, the need for a physical installation makes it difficult to scale this type of citizen science approach to a larger number of sites because these gauges cannot be installed everywhere or by everyone. Here, we present a smartphone app that allows collection of stream level information at any place without any physical installation as an alternative approach. The approach is similar to geocaching, with the difference that instead of finding treasure-hunting sites, hydrological measurement sites can be generated by anyone and at any location and these sites can be found by the initiator or other citizen scientists to add another observation at another time. The app is based on a virtual staff gauge approach, where a picture of a staff gauge is digitally inserted into a photo of a stream bank or a bridge pillar, and the stream level during a subsequent field visit to that site is compared to the staff gauge on the first picture. The first experiences with the use of the app by citizen scientists were largely encouraging but also highlight a few challenges and possible improvements.
Introduction
Data on the quantity and quality of water are needed for appropriate water management decisions. However, hydrology and water resources management are frequently restricted by limited data availability, particularly in data-scarce regions with urgent water management issues (Mulligan, 2013). The decline of national hydrological and meteorological observation networks (Vörösmarty et al., 2001; Fekete et al., 2012; Ruhi et al., 2018) is frustrating, especially in light of the current local and global water-related challenges, and those ahead, such as adaptation to extreme events and securing water resources for a growing population. Although new observation techniques, including remote sensing, geophysical methods, and wireless sensor networks, provide exciting opportunities for new data collection, central hydrological variables, such as soil moisture or streamflow remain difficult to observe with a sufficient spatiotemporal resolution. Therefore, crowd-based data collection might be a valuable complementary approach to collect data and overcome data limitations (Buytaert et al., 2014).
The idea to include the public in hydrological and meteorological data collection is by no means new. The Swedish meteorologist Tor Bergeron asked the public through appeals over radio and phone calls to measure snow depth (Bergeron, 1949) and rainfall (Bergeron, 1960) and to mail their observations on postcards. This resulted in much more detailed maps than would have been possible with official station data alone. It allowed the creation of a snow depth map for an area of one degree square covering Uppland, Sweden based on 98 observations by volunteers rather than data from only 12 official stations (Bergeron, 1949). For the rainfall observations, Bergeron and his co-workers developed the Pluvius rain gauge as an inexpensive alternative to existing, official gauges. While later there were ∼800 of these gauges in other parts in Sweden, for the initial surveys during 1953 about 150 gauges were distributed in a ∼30 km by ∼30 km area around Uppsala, Sweden (Bergeron, 1960). Both of these projects led to a better understanding of the influence of topography and vegetation on precipitation formation. Even though these early studies were very successful, similar approaches remained rare due to the logistical challenge to transmit and enter the collected data in a common database. However, recent developments in information and communication technology provide exciting new opportunities for citizen-science based approaches using text messages (Lowry and Fienen, 2013; Weeser et al., 2018), websites (e.g., Stream Tracker1), apps (e.g., Teacher et al., 2013; Davids et al., 2018; Kampf et al., 2018; Photrack2), data mining (Smith et al., 2015; Li et al., 2018) or custom-designed wearable sensors (e.g., Hut et al., 2016; smartfin3). However, as stated by Jerad Bales, the Chief scientist for hydrology at the U.S. Geological Survey, “Crowdsourcing water-information is in its infancy […], and there remain major issues of data quality and sustainability (Lowry and Fienen, 2013). Nevertheless, the use of crowdsourcing to report routine water data, as well as information on floods and droughts, needs to be creatively explored” (Bales, 2014).
With a large number of contributions from citizens, the CrowdHydrology project4 (Lowry and Fienen, 2013) has (and still does) successfully demonstrated that it is possible to engage the public in hydrological measurements by asking them to submit stream level observations via text messages. A similar system was implemented in Cithyd5. However, these approaches using staff gauges (scaled measurement sticks in the water) restrict the number of places where stream levels can be observed because staff gauges cannot be installed everywhere and by everyone. In mountainous streams, a stable installation is challenging even for hydrologists, and often permits are required before a staff gauge can be installed. Furthermore, if a physical installation is possible, one might consider installing a stream level logger instead of a staff gauge as these loggers have become less expensive and more reliable in recent years. Instead, we propose an approach where anyone can start a measurement location and the observations can be taken anywhere and by anyone. Our approach is similar to geocaching6, with the difference that instead of treasure hunting sites, stream level observation sites are established and can be revisited by other citizen scientists. In this paper, we describe the virtual staff gauge approach, highlight several design considerations, and discuss whether people understand the concept. In another study (Strobl et al., 2019), we found that most people can classify the water level correctly by comparing it to a reference picture with a virtual staff gauge. Here the focus was on how well people are able to “install” a virtual staff gauge in the app, i.e., taking the reference picture and placing the staff gauge in this picture.
Virtual Staff Gauge
General Approach
The advantage of the virtual staff gauge approach is that it avoids physical installations and makes the setup of new observation sites fast and easy. The basic idea behind our approach for stream level observations is that it is usually possible to identify a number of features in a stream or on the streambank, such as rocks, that allow ranking of the stream levels (i.e., “below this tree but above that rock”). While such stream level class observations are not as precise as continuous stream level observations from a staff gauge (i.e., no millimeter resolution) and provide more qualitative information such as “the water level is very low” or “there is a flood event,” they can be quite informative for hydrological modeling (van Meerveld et al., 2017). The challenge is to allow easy identification of the different stream level classes, without the need for lengthy verbal descriptions. A picture is helpful in this respect but needs to be amended by a scale. For this, we use the virtual staff gauge approach (see also Figure 1):
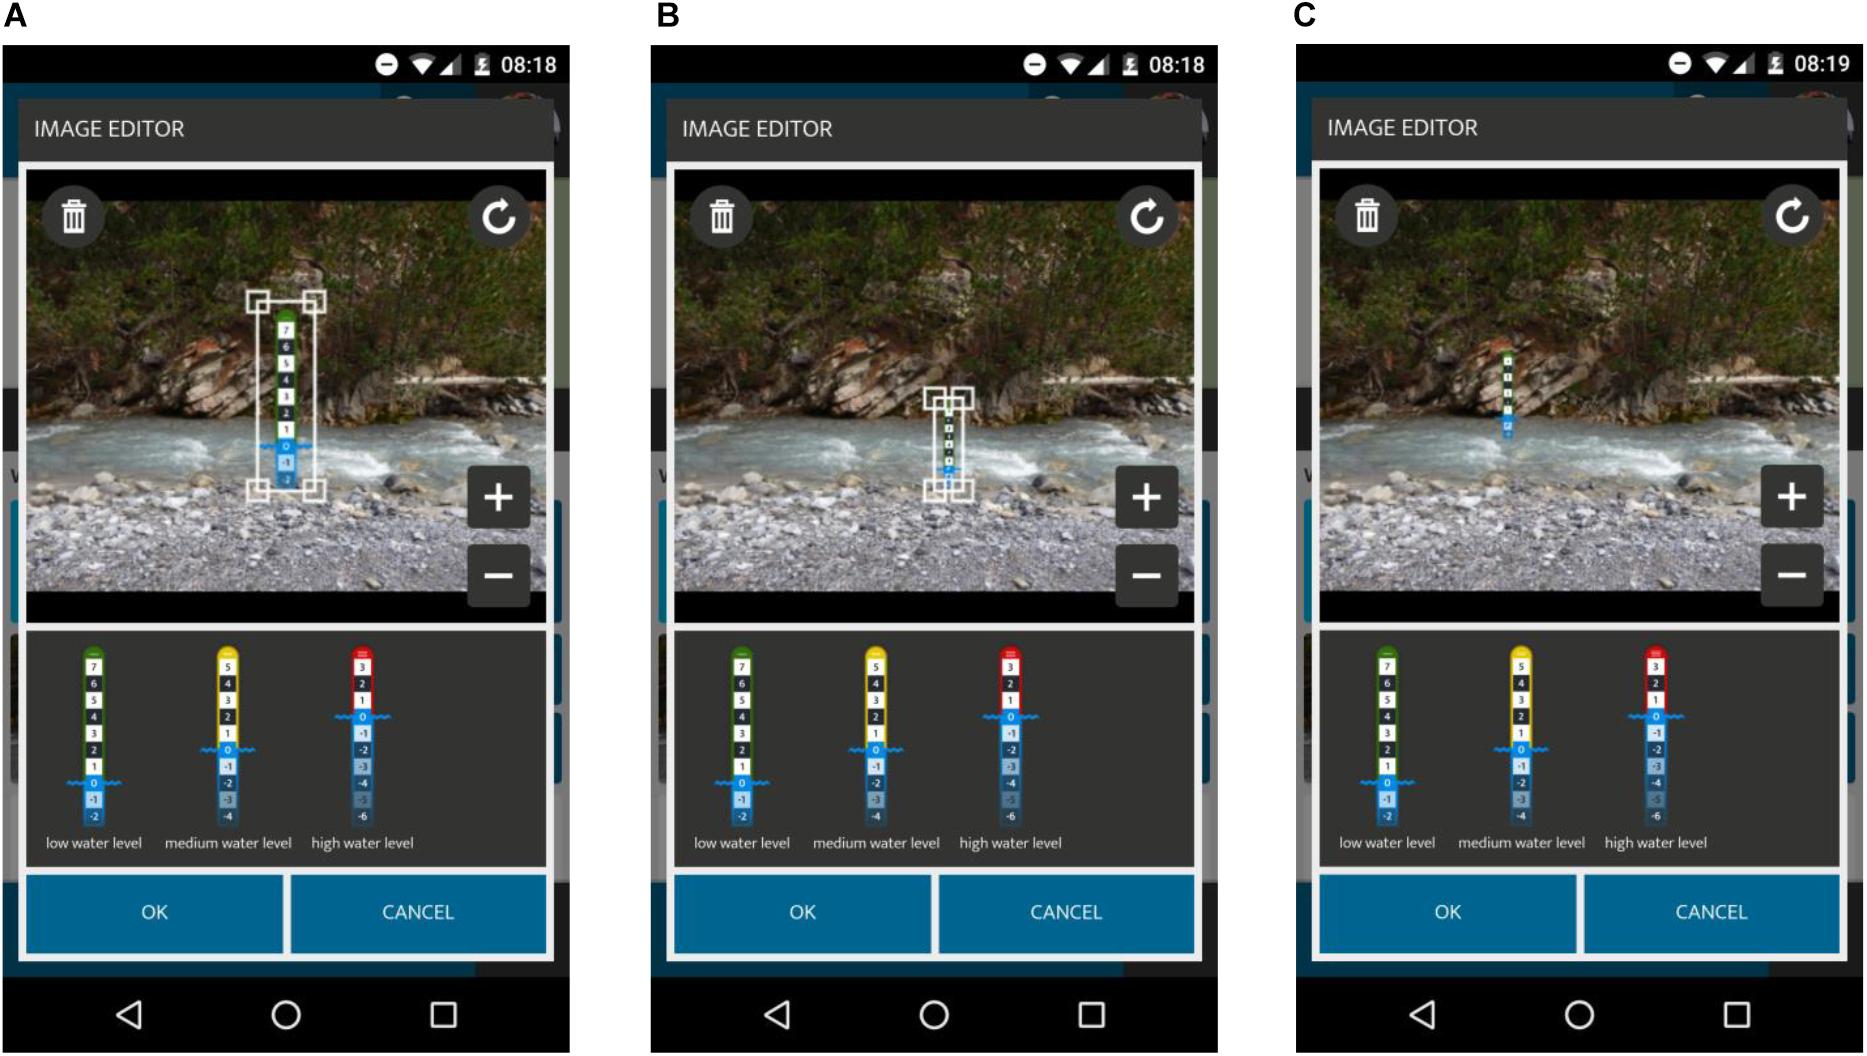
Figure 1. Series of screenshots showing the insertion of the virtual staff gauge in the reference picture: (A) insert the image of the staff gauge in the reference picture, (B) scale the inserted image, and (C) move the image so that the blue line matches the stream level in the picture.
• The user chooses a suitable site along a stream and identifies the location on a map in the smartphone app.
• The user takes a picture of the streambank (perpendicular to the flow direction and as level as possible, to minimize contortion of the view). There should be some reference in the picture, such as a bridge or stones and ideally, the picture is taken during low flow conditions.
• An image of a yardstick with a number of classes is digitally inserted into the picture as a virtual staff gauge. The user can move the inserted staff gauge in the image and scale it so that it covers the expected stream level variations.
This reference picture with the virtual staff gauge allows anyone who visits the site at a later time to estimate the stream level class by relating the current stream level to the features on the photo and the virtual staff gauge (e.g., the stream level has changed and is now above a certain rock). For this update, a simplified horizontal staff gauge design is used in the “Update Spot” interface of the app (Figure 2) that shows the full range of class bars for input. To update a spot and provide a new observation of the stream level, the user compares the current stream level with the reference picture with the staff gauge in the app, takes a new picture of the stream, clicks on the current stream level class on the horizontal staff gauge and submits the new observation to the data servers. Over time, this results in a time series of water level observations (Figure 3). It is important to note, that the user observes and enters the water level; the new picture is only used for documentation. While automated image recognition could be valuable, at this point we rather rely on human eyes and interpretation and avoid issues such as the exact location and angle when the picture is taken. The pictures, however, allow data quality control. We have recently developed the CrowdWater game as an approach to use these pictures for crowdbased quality control of the water level class data (see “Game”7).
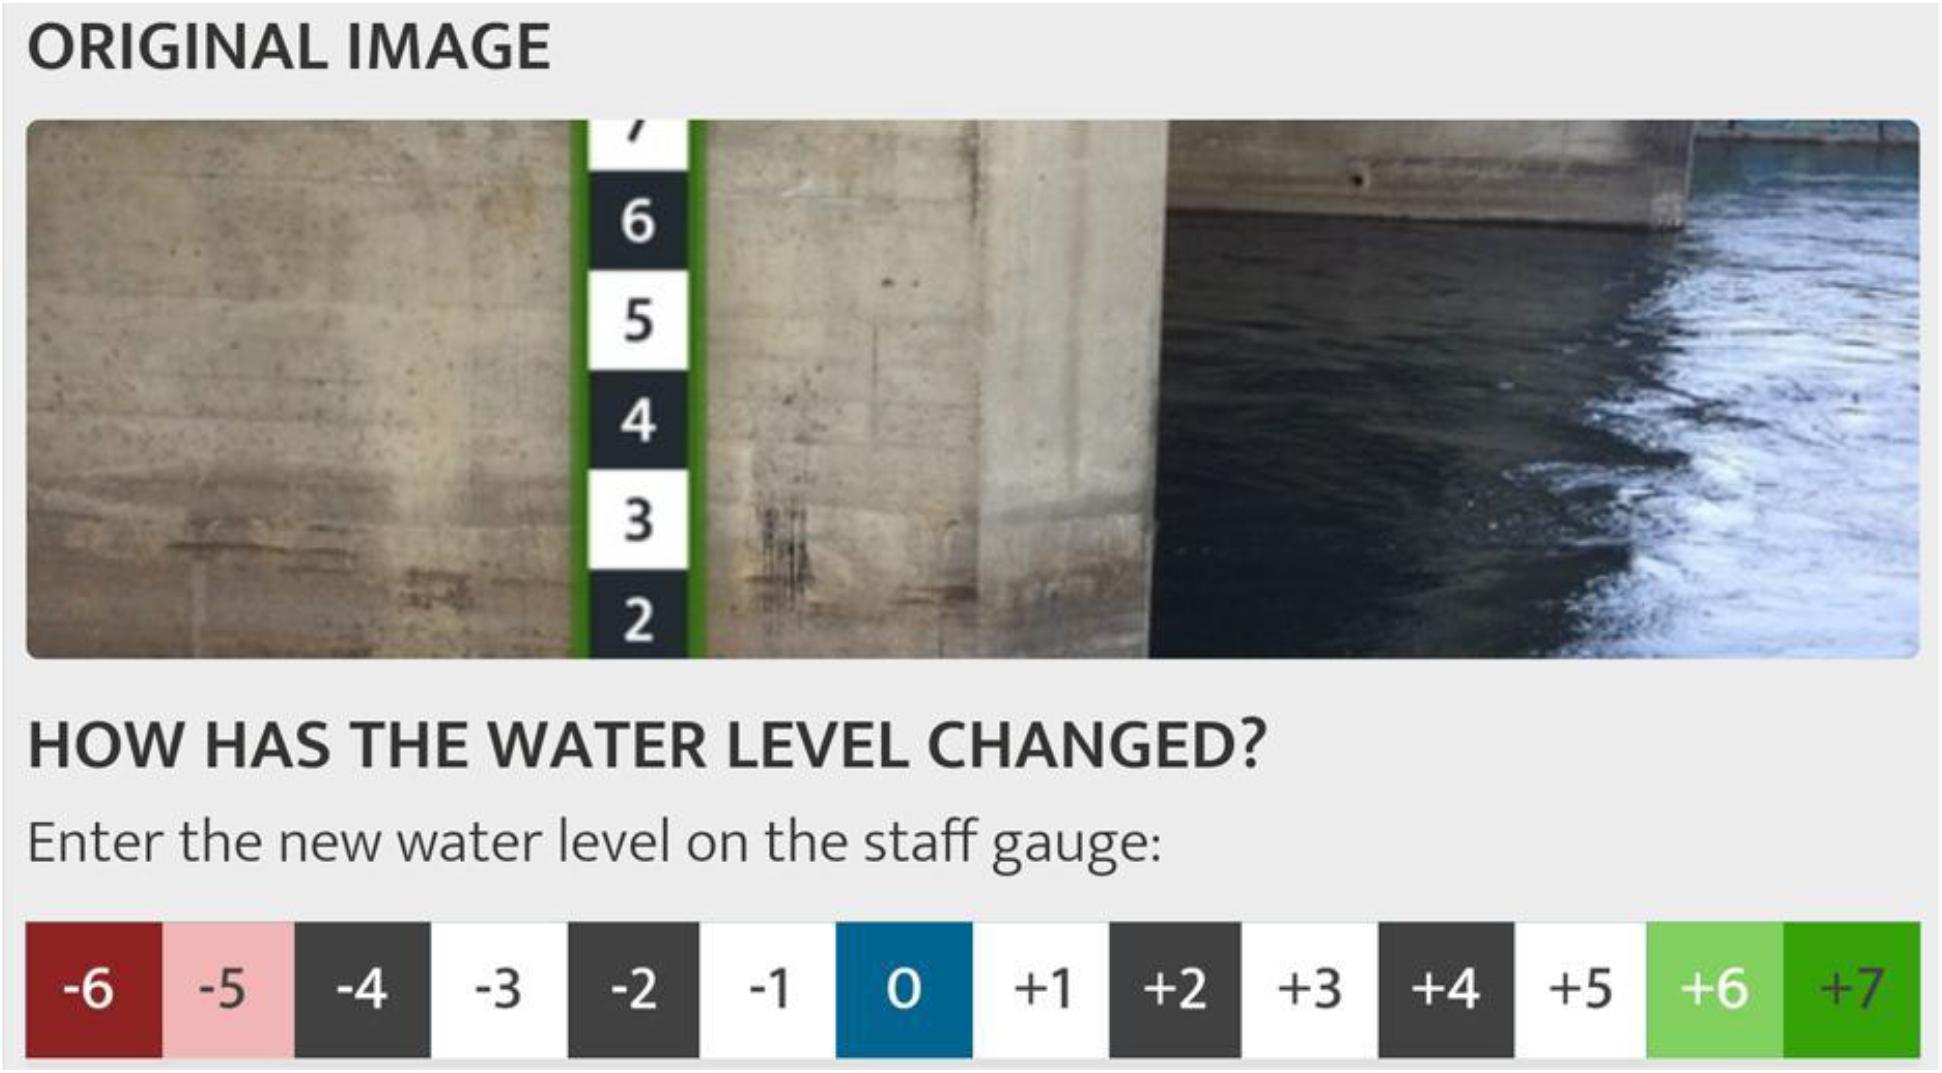
Figure 2. The horizontal version of the staff gauge at the “Update Spot” interface as selectable buttons to report the new water level class observation. Design/author: Philipp Hummer, SPOTTERON Citizen Science, www.spotteron.net.
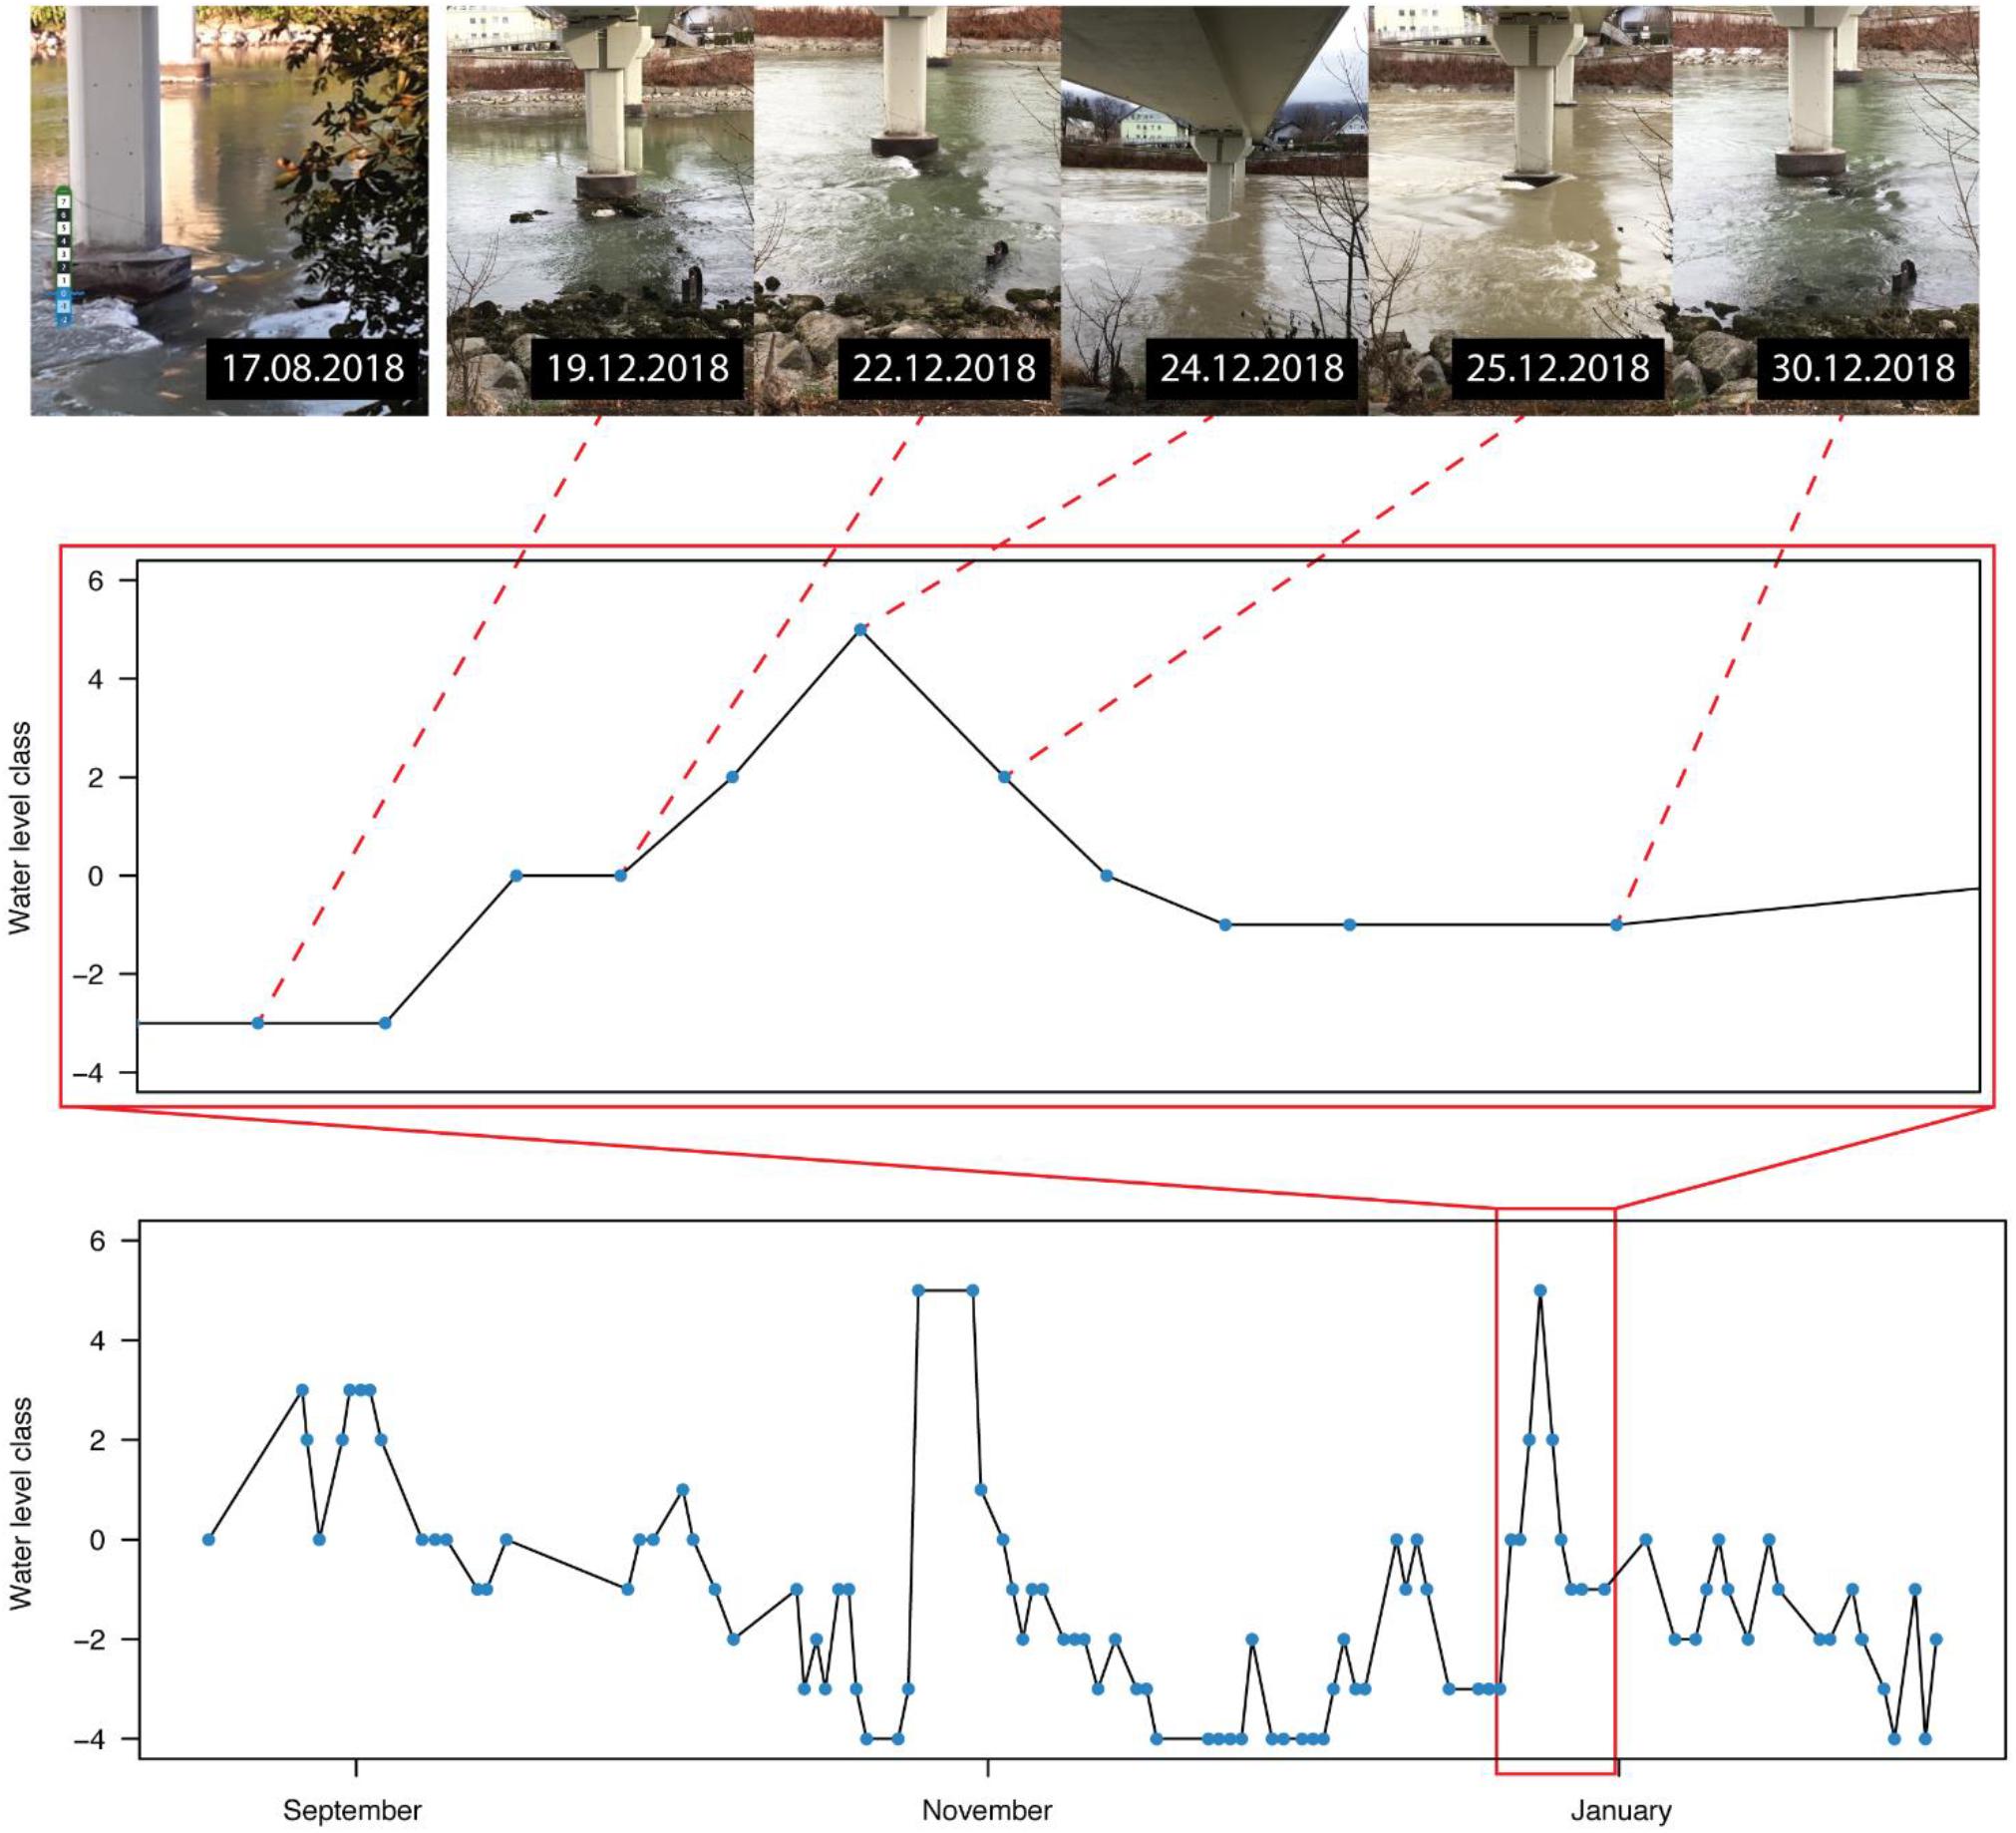
Figure 3. Example of a water level time series obtained using the CrowdWater app (River Salzach, Austria). The pictures for one runoff event (and the reference picture) are shown as an example in the top row.
Design Considerations and Initial Tests
Several decisions on the design of the virtual staff gauge had to be taken before implementation in the smartphone app. Early on it was decided to use relative stream level classes instead of numeric values in, for instance, centimeters, as there is an obvious limitation in the resolution of stream-level observations that can be achieved with a virtual staff gauge. Translating the virtual staff gauge levels to absolute levels would also make the “virtual installation” much more time consuming as it would require observations of different heights. Absolute levels would also be site-specific, i.e., the offset would vary largely from place to place. Fortunately, absolute levels are not needed for the potential use in hydrological modeling because the relative values provide important information on the timing of streamflow responses (Seibert and Vis, 2016; van Meerveld et al., 2017).
In an early test with university students, two different types of staff gauges were tested. In addition to regular class sizes (as ultimately implemented in the app), we also tested irregular class sizes (Figure 4), but this idea was discarded because some users found it confusing and because it did not allow for as much flexibility as we had hoped.
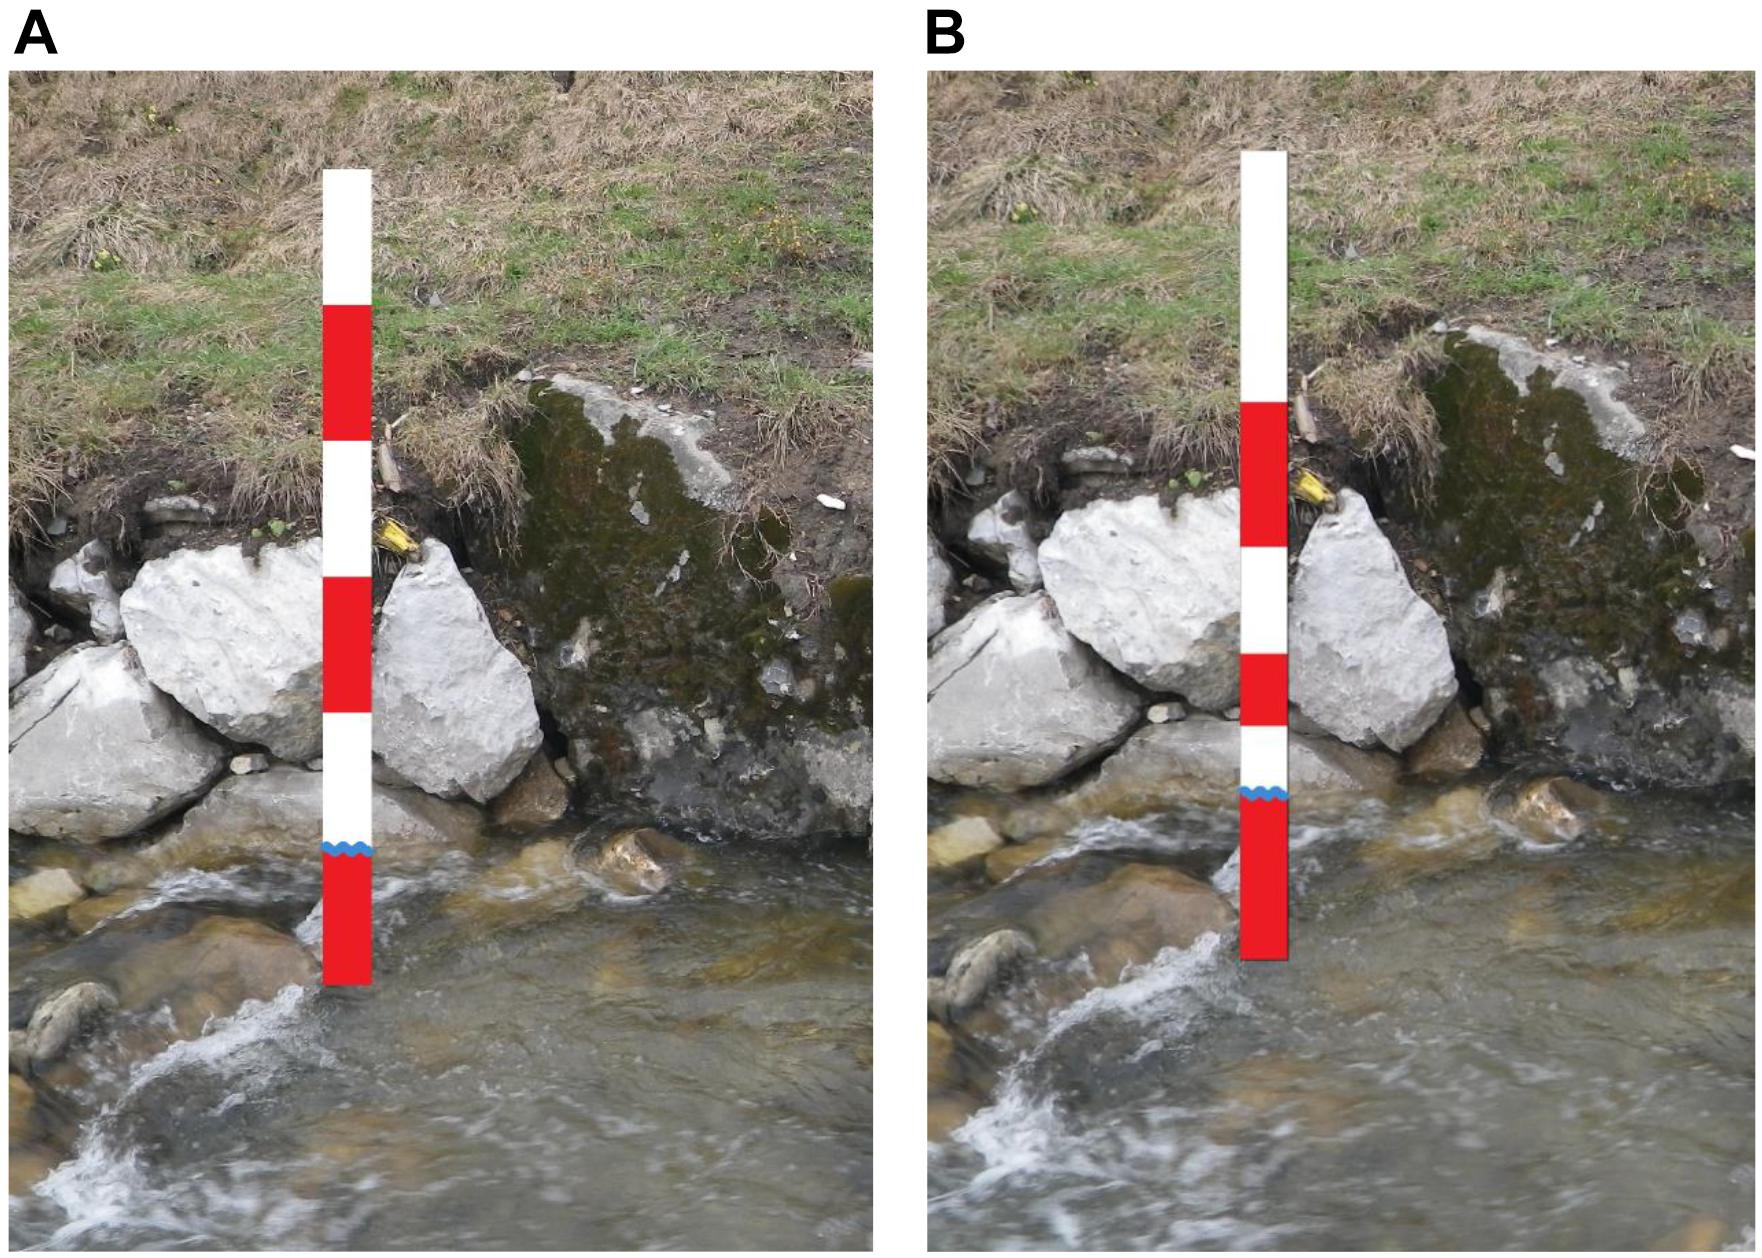
Figure 4. Early version of the virtual staff gauge with regular (A) and irregular (B) class sizes.
Once we had decided to have a non-metric virtual staff gauge with regular class sizes, we started to discuss the implementation with SPOTTERON, which is the app company hired to develop the CrowdWater app. During these discussions, the focus was largely on how to make the app intuitive to use. A clearly visible blue wave on the virtual staff gauge was chosen to indicate the stream level at the time that the reference picture was taken (Figure 5). During placement, the citizen scientists will highlight the stream level in the photo with the water line in the staff gauge (Figure 1). We decided to use ten classes on the virtual staff gauge; this was a compromise between simplicity, resolution, and usability. Through the use of a negative and positive scale, we tried to make the image even more intuitive, as a negative value would indicate a stream level below the level in the reference picture and a positive value above it (Figure 6). The stream level numbers and class bars follow a neutral black/white scheme to utilize contrast between the sections but also maintain secondary visual weight.
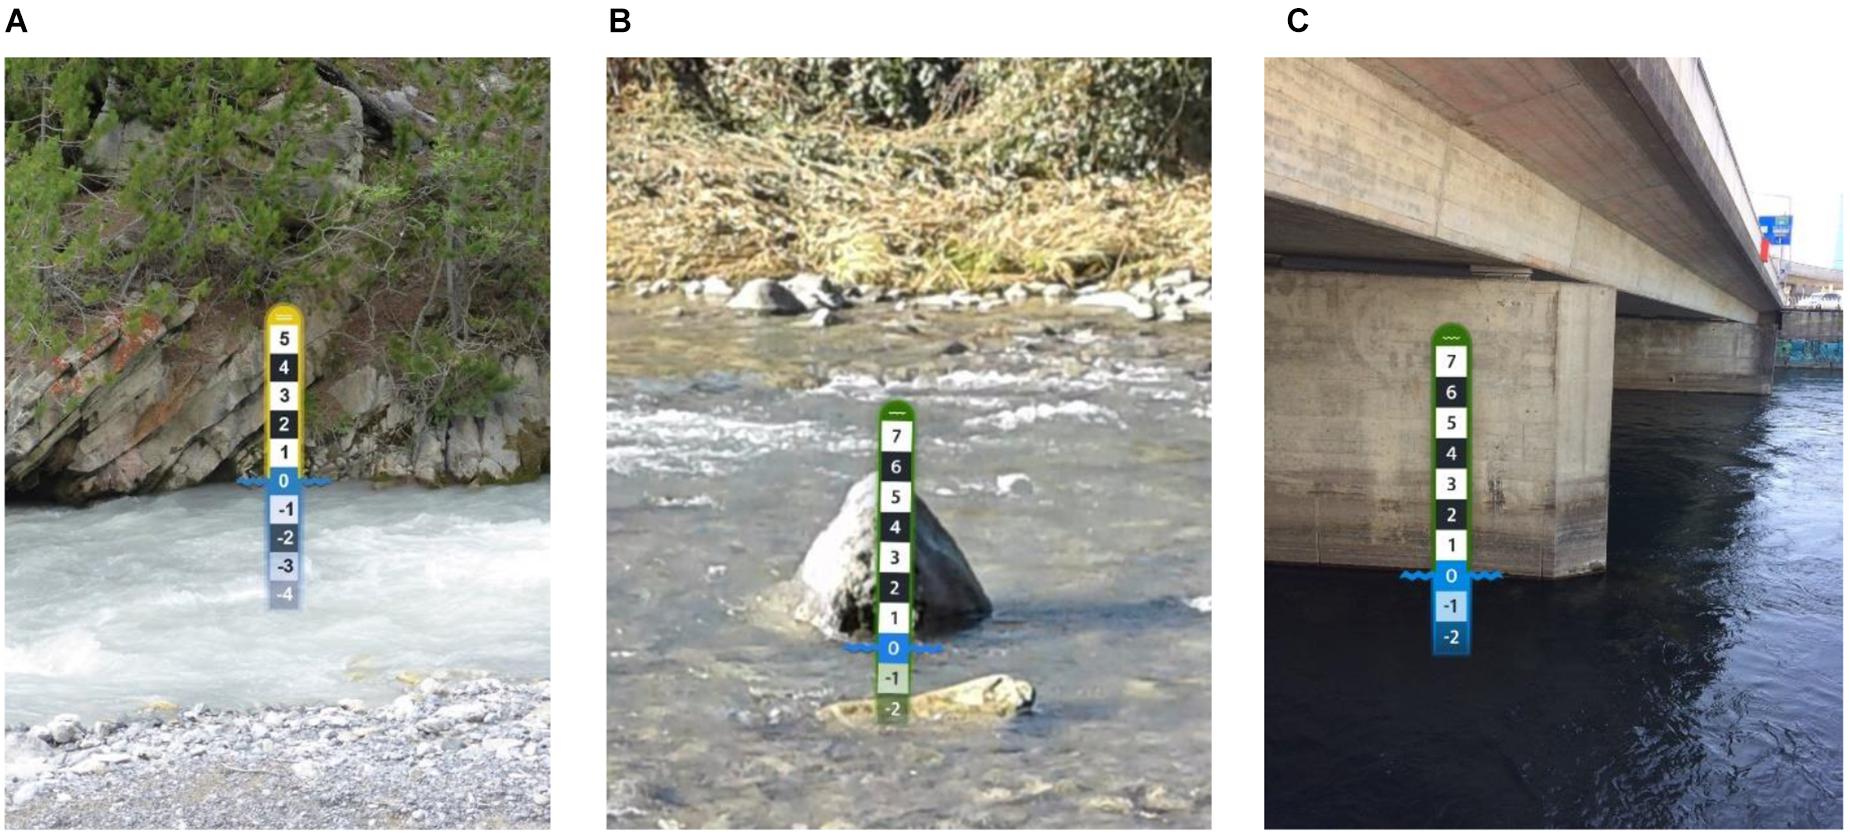
Figure 5. Examples of well-placed virtual staff gauges on (A) the opposite stream bank, (B) a rock in the stream, and (C) a bridge pillar, showing the blue wave at the stream level when the site was established and the positive and negative scale above and below the current stream level, respectively.
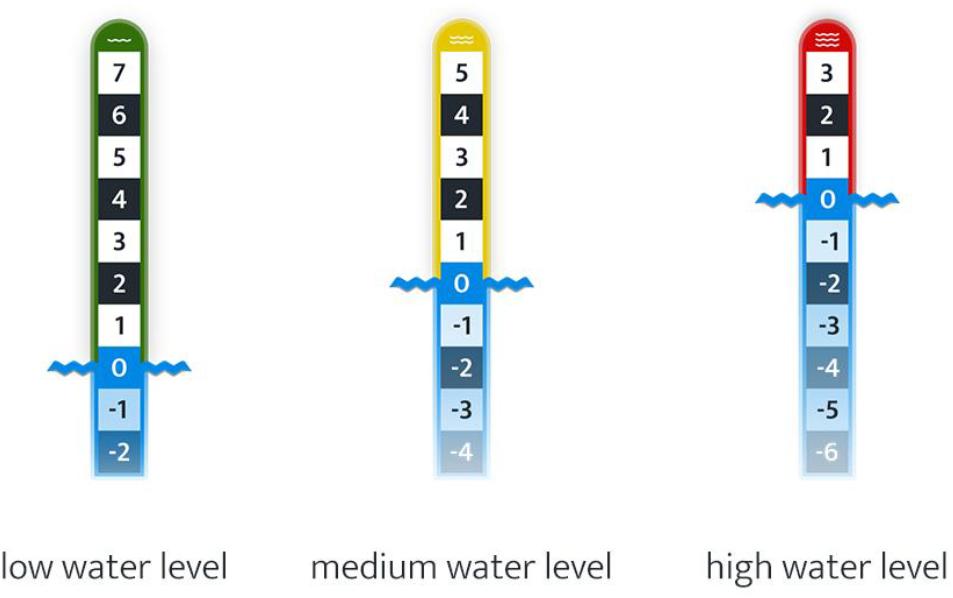
Figure 6. The three staff gauges available in the app. Their ideal application depends on the flow condition of the river at the time that the reference picture is taken. Design/author: Philipp Hummer, SPOTTERON Citizen Science, www.spotteron.net.
We recommend that citizen scientists initiate a new measurement site during low flow conditions because the reference points are better visible during low flow conditions and this enables future users to better assess the situation for an update. However, this might be a strong restriction in practice and we, therefore, decided to allow insertion of virtual staff gauges also in photos taken during situations with high stream levels. To use suitable staff gauges for all flow conditions, we decided to offer three different staff gauges to the user (Figure 6). The green staff gauge is best suited for rivers with a low water level at the time that the reference picture is taken, as it still has many positive classes (i.e., above the blue wave) to record stream levels for higher flow conditions. The yellow staff gauge is well suited for when the reference picture is taken at average flow conditions, and the red staff gauge is ideal for high flow conditions. The red, yellow and green staff gauges were chosen because strong, vibrant colors visually communicate not only a difference but also a development over time, e.g., traffic lights signal different states of movement.
Virtual Staff Gauge Implementation
The virtual staff gauge was implemented as a so-called “sticker”. Stickers are a common practice in app design; they use image- or vector-based content as overlays in photos that are taken on a smartphone. They are mainly used in messenger tools, such as WhatsApp or Facebook Messenger to add additional information or emotions to images. Positioning and transformation are usually done by multi-touch gestures for scaling, placement, and rotation. In this case the sticker has to be moved so that the staff gauge is aligned with the streambank or bridge pillar and the blue line is located at the water level (Figure 1). By adopting such a rather well-known input method, the use of the app is more intuitive and, thus, optimizes usability. Obviously, using an established technique also had technical advantages for the implementation.
In practice, the placement of the staff gauge can happen on bright or dark, blurry or clear, high- or low-saturation pictures, taken by the users on all kinds of smartphone models and cameras. Therefore, various designs for the virtual staff gauges were tested on different backdrop images and directly on smartphone screens (Figures 7, 8). To ensure that the staff gauge is visible in various conditions, we used additional soft shadows to enhance the edge contrast, but still let the staff gauge immerse itself into the picture as part of the scenery. We furthermore decided to strengthen the visual representation of the areas above and below the stream level by using a blue hue for all class bars below the water level and making them slightly transparent (Figures 6–8).
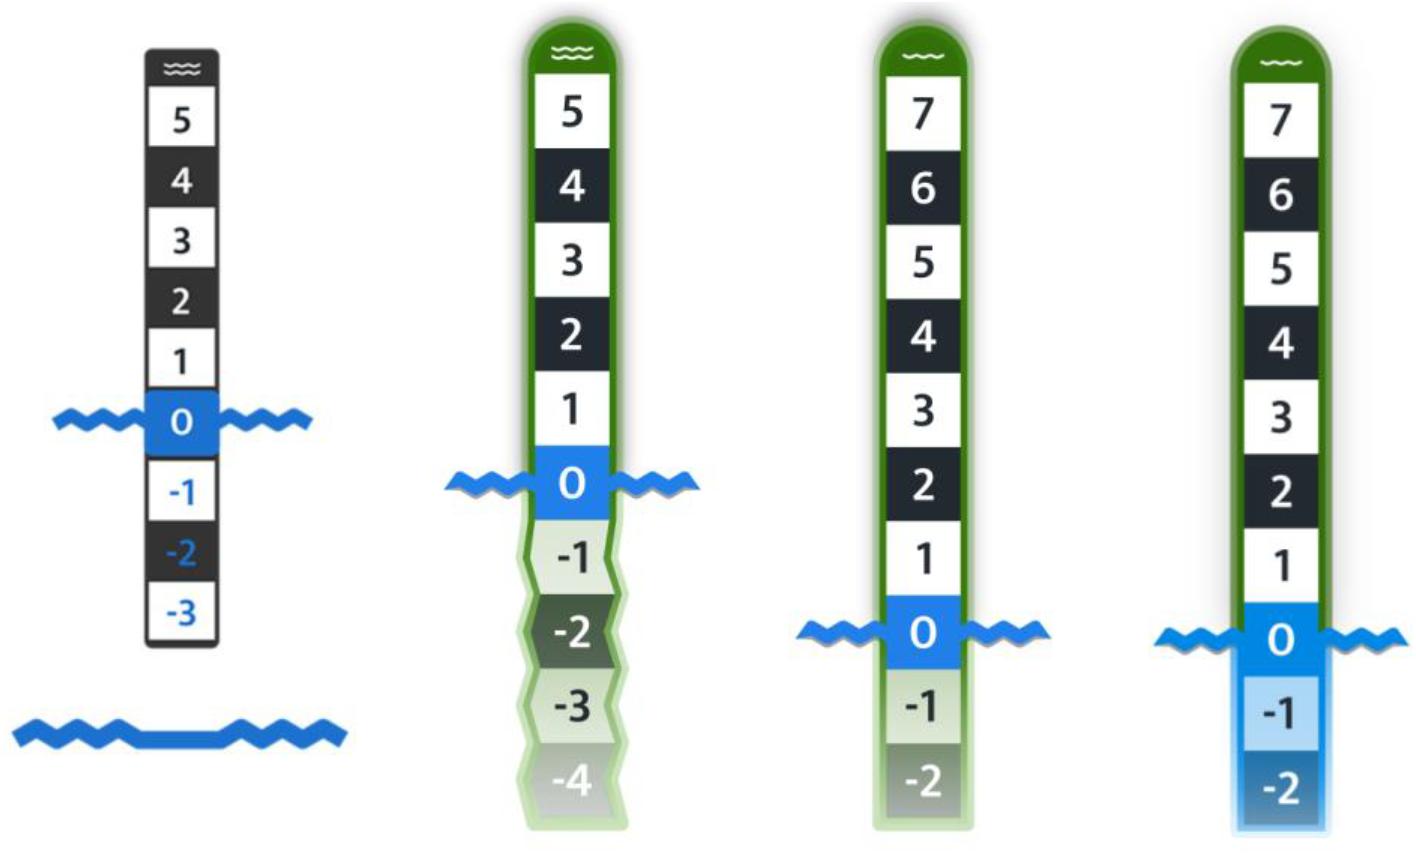
Figure 7. Various staff gauge designs. Design/author: Philipp Hummer, SPOTTERON Citizen Science, www.spotteron.net.
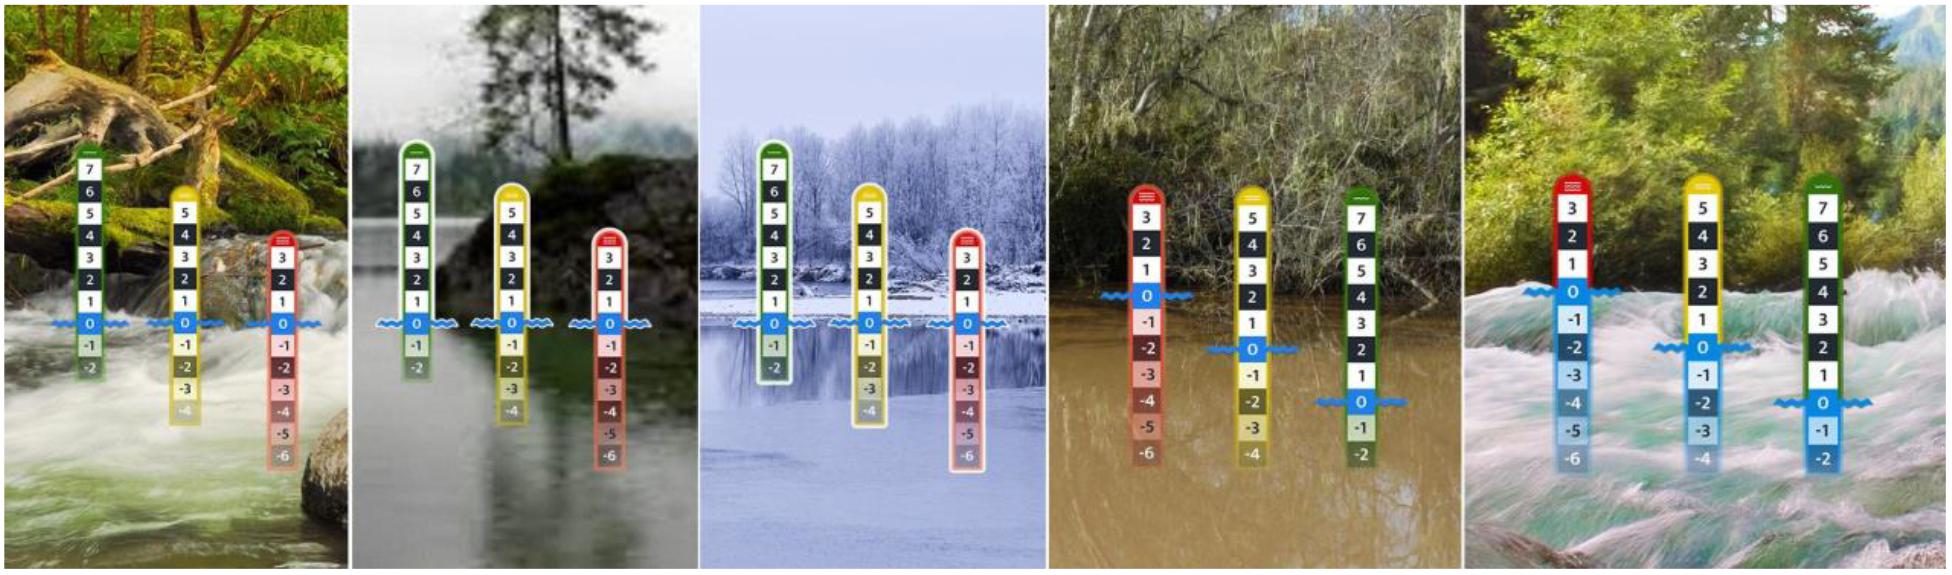
Figure 8. Staff gauge design variants in different environments. Design/author: Philipp Hummer, SPOTTERON Citizen Science, www.spotteron.net. Note that the virtual staff gauges were not scaled nor placed correctly (see Figure 1).
Test of the App in Practice
CrowdWater App
The virtual staff gauge was implemented in the CrowdWater smartphone app. The app was first launched for iOS and Android in March 2017; there have been several updates of the app since its initial launch. The app was promoted on the CrowdWater homepage (see Footnote 7), through Facebook, Twitter, Instagram, LinkedIn, and ResearchGate posts, as well as on the CrowdWater YouTube channel and at several conferences.
When starting the app, the user has to browse through a number of intro-slides that explain the basic functionalities and the interface of the app. Among them is the sticker function of the virtual staff gauge (Figure 9). Additional guidance on how to use the app in the form of texts, pictures and videos are provided on the project homepage and in an explanatory YouTube video8.
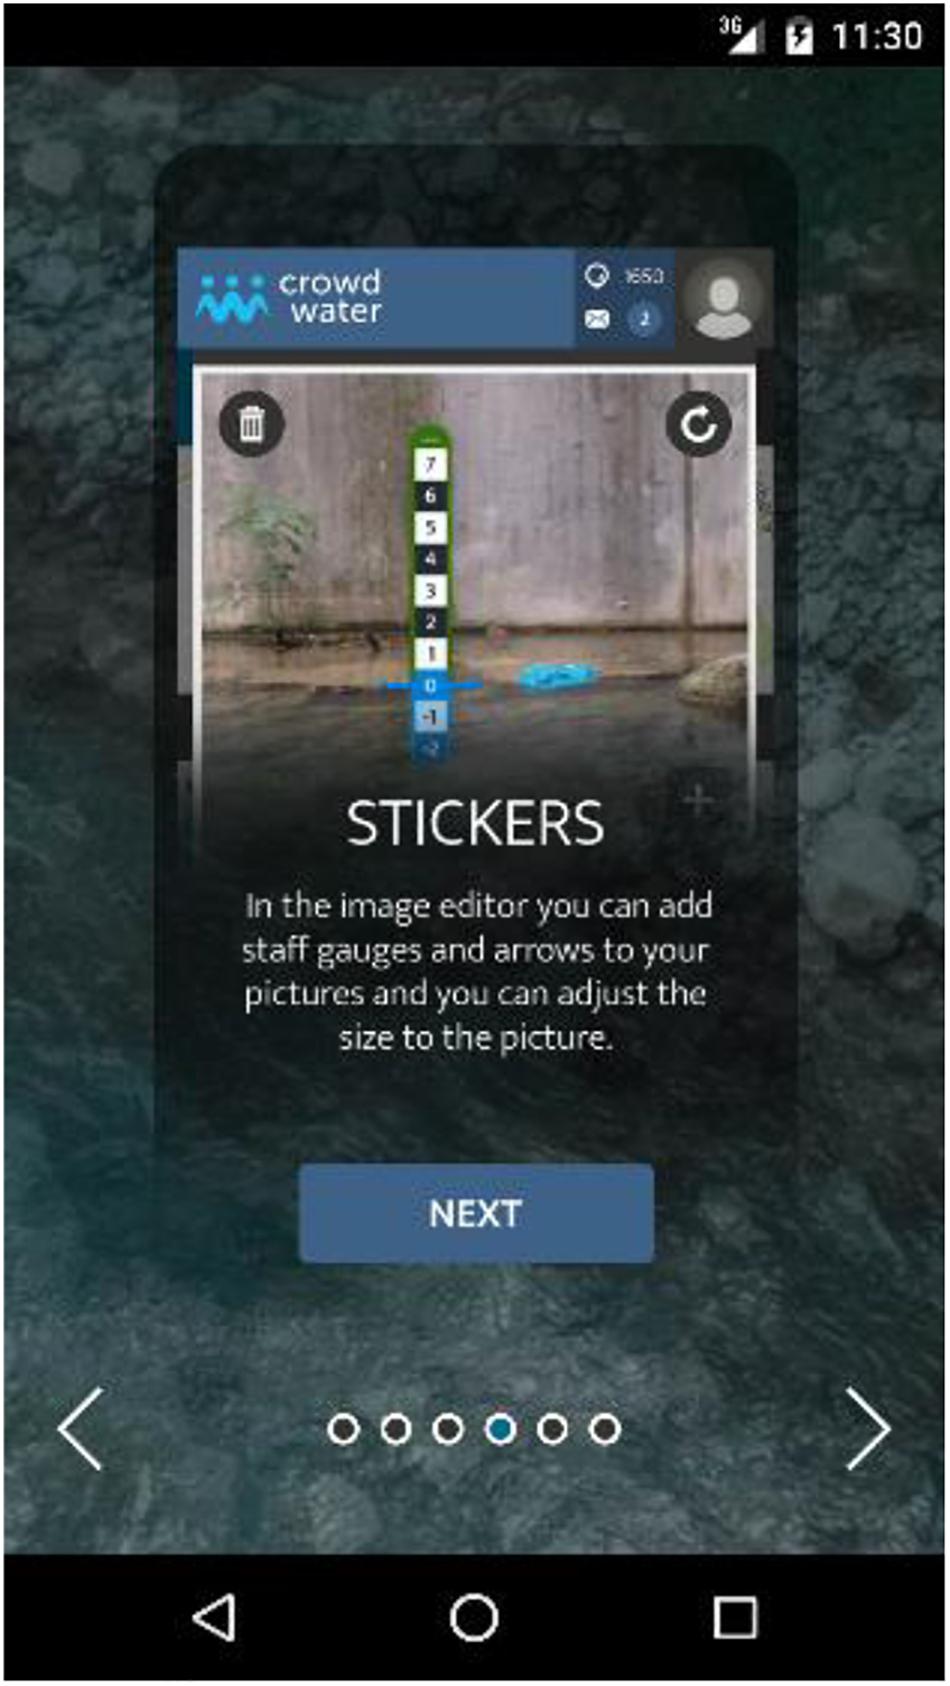
Figure 9. Screenshot of an intro slide that appears when the app is opened for the first time. These can be re-watched anytime. The goal is to quickly provide the most important information on the basic functionalities of the app.
Typical Mistakes
While users seem to understand the approach used in the CrowdWater app in general, there were also a number of recurrent mistakes related to the staff gauge placement or size. These mistakes affect about 10% of the more than 500 reference pictures (Table 1). Staff gauge placement or size problems could be due to users not having read the available instruction material or not fully understanding the concept. Some other issues are not directly related to setting up a virtual staff gauge site but still affect the results, e.g., it is less useful if users create new measurement sites in, or close to, a location where another spot already exists than when they update the existing spot or start a new site on a different river.
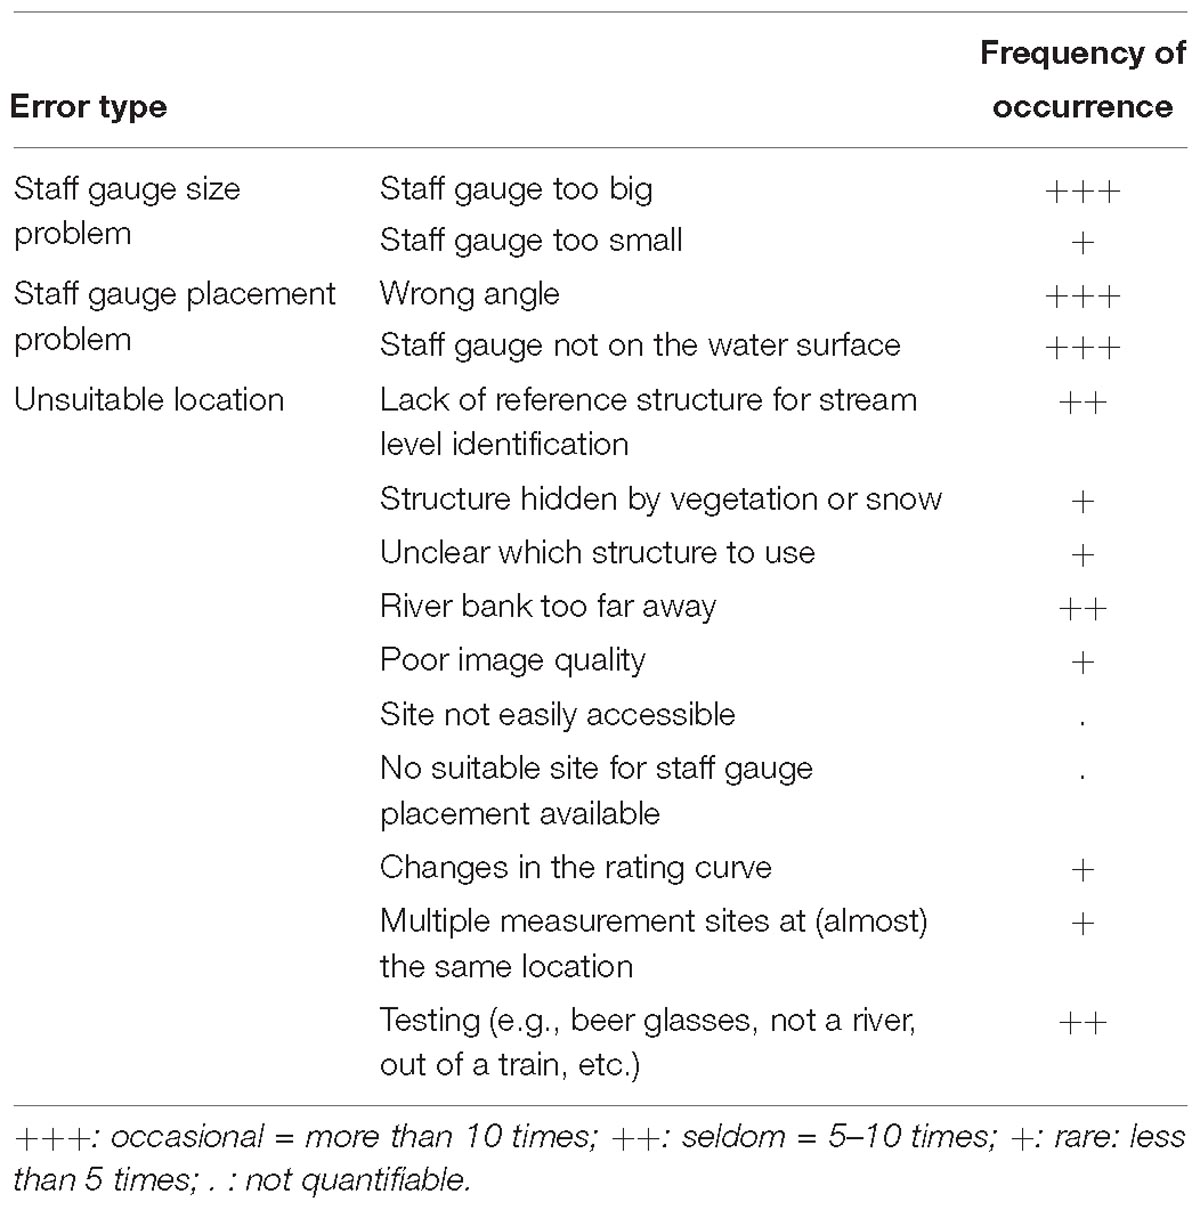
Table 1. Collection of errors made by app-users grouped into broader error categories and frequency of occurrence.
Staff Gauge Placement Problem
The most common mistake was related to the placement of the virtual staff gauge. Some users took pictures in the direction of the flow (instead of perpendicular to the flow, see example in Figure 10). This makes it almost impossible to place a virtual staff gauge that allows subsequent level observations because clear reference features are usually missing on these pictures. Another placement related issue occurs when the blue wave of the staff gauge is not located at the water surface in the reference picture. This means that the stream level of the reference picture is not at zero, which could lead to confusion for other users when updating the spot later on.
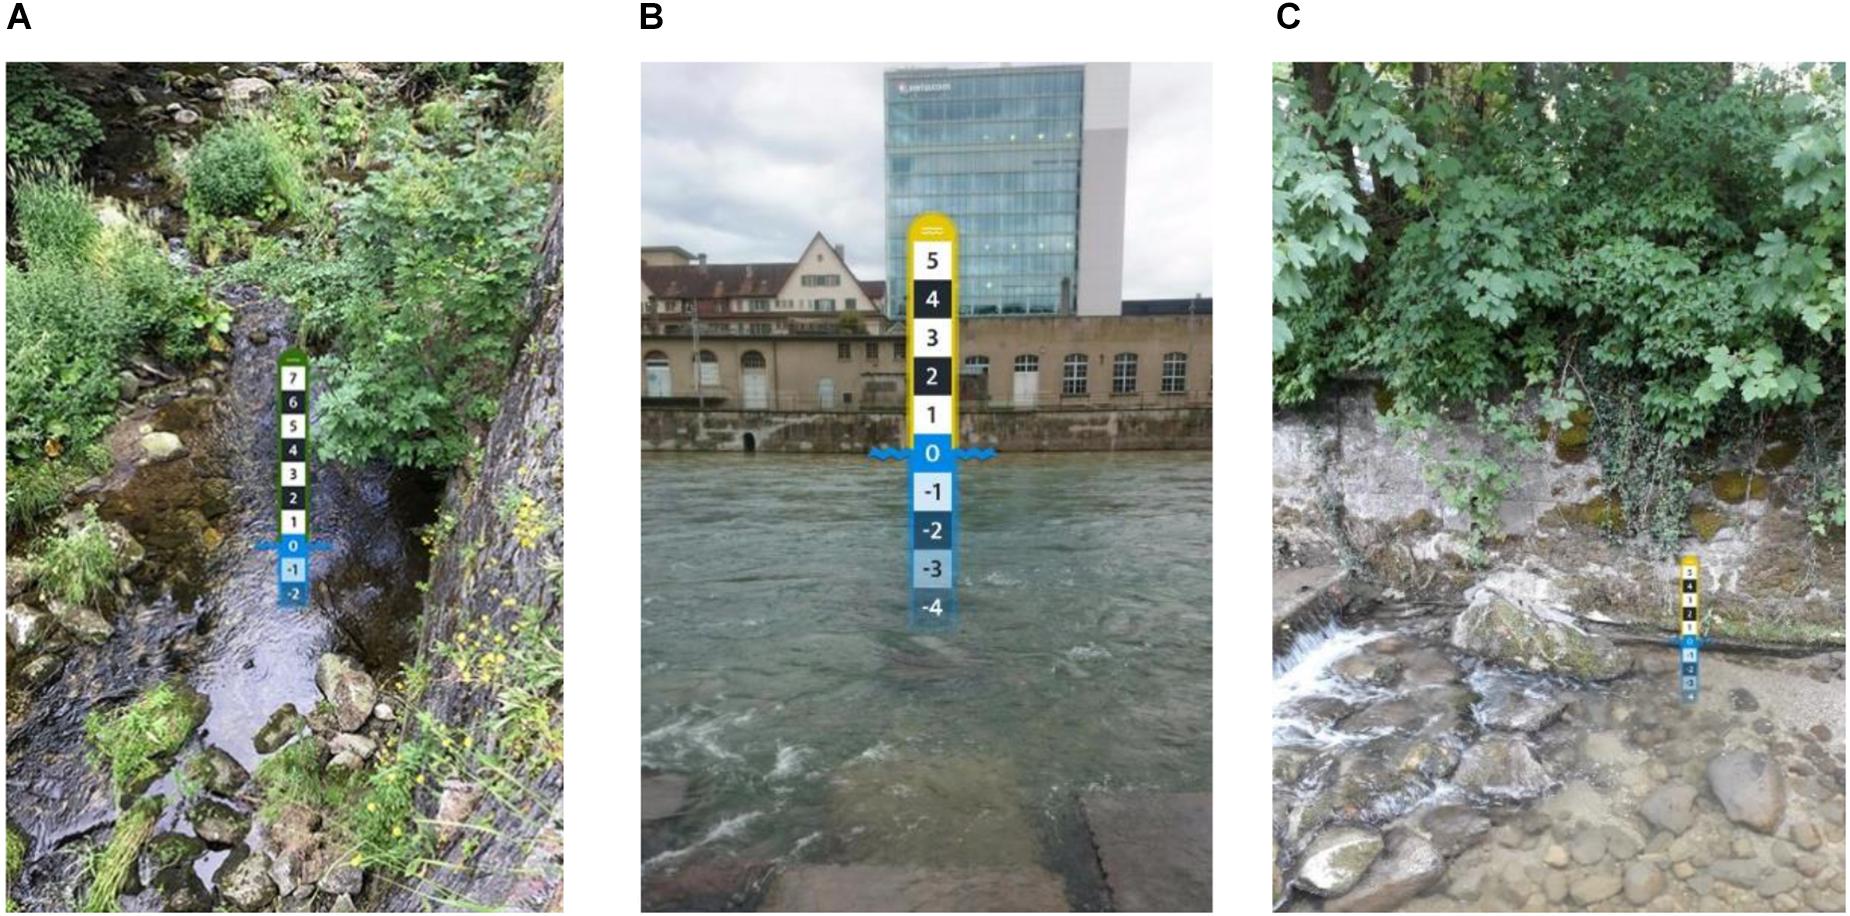
Figure 10. Examples of misplaced virtual staff gauges: (A) The picture was taken in the upstream direction instead of perpendicular to the flow direction, which makes it impossible to estimate subsequent stream level changes, (B) The virtual staff gauge is so large that it is unlikely that the water level will reach different classes and is therefore improbable to obtain an approximate representation of the stream hydrograph, (C) The small virtual staff gauge can show small changes in the stream level, but cannot represent very high flows as anything above a medium flow falls into the highest class.
Staff Gauge Size Problems
In a number of cases, the size of the staff gauge was suboptimal. This may be either because people do not realize that they can resize the size of the staff gauge or do not understand why it is useful to rescale the staff gauge. The perfect staff gauge size is however, somewhat subjective and might to some degree depend on the specific research question and data needs for a site.
In our instruction material, we show the optimal case where the highest class of the staff gauge reaches up to the level of the highest in-bank flow. This may, however, be hard to imagine for citizen scientists and is probably also not considered when users place their first virtual staff gauge. Staff gauges that are too large are not only unrealistic (i.e., the stream level is very unlikely to rise into the highest classes) but this also reduces the variation in future observations because it is less likely that a change in stream level is large enough to reach the next class. There were also a few cases where the staff gauge was too small. A small staff gauge can make it hard to determine the class of the current stream level because the differences between the classes are too small. It also makes it hard to document very high or very low flows. Furthermore, finding the location of the measurement site can be challenging when users take a very detailed (zoomed-in) picture of the reference structure. This issue was more common for small staff gauges and could probably be solved by implementing an option to add an overview photo that shows the general location of the reference structure.
Unsuitable Location
An obvious problem are pictures that lack references for level identification or pictures where a staff gauge was not inserted in the picture. Optimal conditions to place a virtual staff gauge, such as a vertical wall on the opposite river bank or a vertical structure like a rock or bridge pillar in the river, are sometimes hard to find. At least in some cases, the reason for problematic pictures could also be that the rivers were not easily accessible or had no suitable reference features but people still wanted to take a picture to establish a measurement site. Another problem is that in some locations the vegetation growth obscures features on the river bank that were visible when the reference picture was taken (e.g., in winter when there was no vegetation). This makes it nearly impossible to compare stream levels properly. Reference pictures with snow can also make it difficult to assess the stream level later on.
On wide rivers, it is difficult to place a reasonably sized staff gauge at the opposite river bank and still observe changes in stream levels. Furthermore, in these cases, the quality of the pictures is often low due to zooming. This problem can be solved at locations with an instream structure (such as a bridge pillar) and placing the staff gauge along a pillar.
Changes due to erosion or sedimentation are another issue. In these cases stream levels are not a reliable indicator of streamflow. Our dataset contains one site where the riverbed changed quite drastically due to deposited sediment. Because the reference structure (a concrete wall next to a bridge) stayed in place, approximately the same flow meant a different stream level class compared to the situation in the reference picture taken before the sediment was deposited. The solution to this problem would be to archive the reference picture and create a new one.
Concluding Remarks
In this paper, we presented a new citizen science approach based on virtual staff gauges that allow crowd-based stream level observations along any stream. The advantage of this approach is that no physical installations are needed, which makes the approach fully scalable, as it is easy and quick for anyone to set up a new measurement site or contribute an observation to an existing site. As discussed in this paper, during development and testing of the virtual staff gauge approach, we identified several issues that required modifications in the original design. Further app developments and better guidance for app users on how to set up a virtual staff gauge site will reduce the number of incorrect sites in the future. Despite these challenges, the first experiences from using the virtual staff gauge approach are encouraging and show that this approach can be useful to collect stream level data at many locations by citizen scientists.
In the first year since launching the smartphone app, numerous measurement sites have been set up. On 3. September 2018, 2431 observations had been submitted by 218 users. For 79 of the 675 sites, more than five updates on the stream level class had been submitted. The collected data have a limited resolution due to the use of stream level classes and are sometimes spotty in time. However, previous work using synthetic data indicates that such data are still informative to constrain hydrological models. Time series of precipitation and temperature are more likely to be available than those of streamflow. The observed stream level class data can, thus, be used in combination with these time series to generate modeled streamflow time series. The potential value of such data has been evaluated based on subsets of existing data. These studies have indicated the value of water level class data for model calibration (van Meerveld et al., 2017); uncertain streamflow estimates were less informative (Etter et al., 2018). The water level data collected in the CrowdWater project are publicly available, and we expect them also to be used for other uses, be it for research, flood protection or leisure activities.
While our current focus is on measurement sites in Switzerland, the app can be, and is already, used worldwide. For developing and evaluating the value of the data obtained with the virtual staff gauge approach countries with a relative wealth of stream data, such as Switzerland, are favorable, but we anticipate that, once developed and tested, the approach will be most beneficial in regions where data are scarce.
Author Contributions
JS and HvM developed the first idea of the virtual staff gauge while hiking along a Swiss creek. BS and SE were responsible for the tests and the evaluation of the user experience of the app and contributed by specifying the requirements for the app, which were then discussed among all authors and further developed with PH. PH was responsible for most of the graphical design and the implementation of the smartphone app. JS wrote the manuscript with input from all authors.
Funding
The CrowdWater project is funded by the Swiss National Science Foundation (Project Number 163008).
Conflict of Interest Statement
PH is founder and co-owner of the company SPOTTERON GmbH.
The remaining authors declare that the research was conducted in the absence of any commercial or financial relationships that could be construed as a potential conflict of interest.
Acknowledgments
We thank all participants of the CrowdWater project for contributing their observations.
Footnotes
- ^ http://www.streamtracker.org
- ^ http://www.photrack.ch/mobile.html
- ^ https://smartfin.org/
- ^ http://www.crowdhydrology.com
- ^ http://www.cithyd.com/it/
- ^ https://www.geocaching.com/
- ^ https://www.crowdwater.ch
- ^ https://www.youtube.com/watch?v=3ag4sHWf0yg
References
Bales, J. D. (2014). Progress in data collection and dissemination in water resources - 1974-2014. Water Resour. Impact 16, 18–23.
Bergeron, T. (1949). The problem of artificial control of rainfall on the globe. Part II: the coastal orographic maxima of precipitation in autumn and winter. Tellus 1, 15–32. doi: 10.1111/j.2153-3490.1949.tb01264.x
Bergeron, T. (1960). Operation and Results of “Project Pluvius”. Washington, DC: American Geophysical Union, 152–157. doi: 10.1029/GM005p0152
Buytaert, W., Zulkafli, Z., Grainger, S., Acosta, L., Alemie, T. C., Bastiaensen, J., et al. (2014). Citizen science in hydrology and water resources: opportunities for knowledge generation, ecosystem service management, and sustainable development. Front. Earth Sci. 2:26. doi: 10.3389/feart.2014.00026
Davids, J. C., Rutten, M. M., Shah, R. D. T., Shah, D. N., Devkota, N., Izeboud, P., et al. (2018). Quantifying the connections—linkages between land-use and water in the Kathmandu Valley. Nepal. Environ. Monit. Assess. 190:17. doi: 10.1007/s10661-018-6687-2
Etter, S., Strobl, B., Seibert, J., and van Meerveld, I. (2018). Value of uncertain streamflow observations for hydrological modelling. Hydrol. Earth Syst. Sci. 22, 5243–5257. doi: 10.5194/hess-2018-355
Fekete, B. M., Looser, U., Pietroniro, A., and Robarts, R. D. (2012). Rationale for monitoring discharge on the ground. J. Hydrometeorol. 13, 1977–1986. doi: 10.1175/JHM-D-11-0126.1
Hut, R., Tyler, S., and Van Emmerik, T. (2016). Proof of concept: temperature-sensing waders for environmental sciences. Geosci. Instrum. Methods Data Syst. 5, 45–51. doi: 10.5194/gi-5-45-2016
Kampf, S., Strobl, B., Hammond, J., Annenberg, A., Etter, S., Martin, C., et al. (2018). Testing the waters: mobile apps for crowdsourced streamflow data. EOS 99, 30–34. doi: 10.1029/2018EO096355
Li, Z., Wang, C., Emrich, C. T., and Guo, D. (2018). A novel approach to leveraging social media for rapid flood mapping: a case study of the 2015 South Carolina floods. Cartogr. Geogr. Inf. Sci. 45, 97–110. doi: 10.1080/15230406.2016.1271356
Lowry, C. S., and Fienen, M. N. (2013). CrowdHydrology: crowdsourcing hydrologic data and engaging citizen scientists. Ground Water 51, 151–156. doi: 10.1111/j.1745-6584.2012.00956.x
Mulligan, M. (2013). WaterWorld: a self-parameterising, physically based model for application in data-poor but problem-rich environments globally. Hydrol. Res. 44:748. doi: 10.2166/nh.2012.217
Ruhi, A., Messager, M. L., and Olden, J. D. (2018). Tracking the pulse of the Earth’s fresh waters. Nat. Sustain. 1, 198–203. doi: 10.1038/s41893-018-0047-7
Seibert, J., and Vis, M. J. P. (2016). How informative are stream level observations in different geographic regions? Hydrol. Process. 30, 2498–2508. doi: 10.1002/hyp.10887
Smith, L., Liang, Q., James, P., and Lin, W. (2015). Assessing the utility of social media as a data source for flood risk management using a real-time modelling framework. J. Flood Risk Manag. 10, 370–380. doi: 10.1111/jfr3.12154
Strobl, B., Etter, S., van Meerveld, I., and Seibert, J. (2019). Accuracy of crowdsourced streamflow and stream level class estimates. Hydrol. Sci. J. (in press). doi: 10.1080/02626667.2019.1578966
Teacher, A. G. F., Griffiths, D. J., Hodgson, D. J., and Inger, R. (2013). Smartphones in ecology and evolution: a guide for the app-rehensive. Ecol. Evol. 3, 5268–5278. doi: 10.1002/ece3.888
van Meerveld, H. J., Vis, M. J. P., and Seibert, J. (2017). Information content of stream level class data for hydrological model calibration. Hydrol. Earth Syst. Sci. 21, 4895–4905. doi: 10.5194/hess-21-4895-2017
Vörösmarty, C. J., Askew, A., Grabs, W., Barry, R. G., Birkett, C., Döll, P., et al. (2001). Global water data: a newly endangered species. Eos Trans. Am. Geophys. Union 82, 1999–2001. doi: 10.1029/01EO00031
Keywords: citizen science, smartphone app, water level class, crowdsourcing, data collection
Citation: Seibert J, Strobl B, Etter S, Hummer P and van Meerveld HJ (2019) Virtual Staff Gauges for Crowd-Based Stream Level Observations. Front. Earth Sci. 7:70. doi: 10.3389/feart.2019.00070
Received: 07 September 2018; Accepted: 19 March 2019;
Published: 12 April 2019.
Edited by:
Jonathan D. Paul, Imperial College London, United KingdomReviewed by:
Wouter Buytaert, Imperial College London, United KingdomTim van Emmerik, Delft University of Technology, Netherlands
Jon Olav Skøien, European Commission – Joint Research Center, Belgium
Copyright © 2019 Seibert, Strobl, Etter, Hummer and van Meerveld. This is an open-access article distributed under the terms of the Creative Commons Attribution License (CC BY). The use, distribution or reproduction in other forums is permitted, provided the original author(s) and the copyright owner(s) are credited and that the original publication in this journal is cited, in accordance with accepted academic practice. No use, distribution or reproduction is permitted which does not comply with these terms.
*Correspondence: Jan Seibert, amFuLnNlaWJlcnRAZ2VvLnV6aC5jaA==