 Kristine S. Madsen
 Jens Murawski
- Danish Meteorological Institute, Copenhagen, Denmark
Climate change will affect the coastline of the Baltic Sea through changes in sea level, storm surges and waves. In Denmark, a large part of the responsibility for climate adaptation lies with the local municipalities. The purpose of this study was to map the user needs for coastal climate change information of five municipalities in the Danish south western Baltic Sea and the Danish Coastal Authority in a cost-efficient way and to transform the mapping into local climate indicators. An interview template was customized to form the basis for telephone interviews of key stakeholders and systematic gathering of the results. The interest for the interviews was high, and response from the interviewed persons on the use of the template was very positive. During the interviews, it was clear that the municipalities have access to extensive information on the population and infrastructure, as well as detailed geographical information. The main interests were in very high quality storm surge warnings and present day and future extreme sea level and wave heights. This should be based on modeling of past storm surges and future changes, taking observations, and historical records into account. There was a big need for more detailed information than presently available, and for common scenarios, which will help the collaboration between municipalities. Within this study, the user requirements were used to define targeted climate indicators. Within the C3S CODEC project, the indicators will be provided for the municipalities, based on a downscaling of European scale storm surge, and wave simulations to local scale.
Introduction
Climate change will affect the coastline of the Baltic Sea through changes in sea level, storm surges and waves, affecting, among others, the risk of flooding, and level of erosion (Olesen et al., 2014; Bacc II Author Team, 2015). The south western part of the Baltic Sea pose a special risk area, as the coastline is relatively well sheltered from frequently occurring sea level variability such as tides and high waves, and e.g., the harbor in Køge has not experienced storm surges above 1.52 m the last 63 years (Ditlevsen et al., 2018). At the same time, the region is known to have experienced some very extreme storm surges in historic time, most explicitly in 1872 (Colding, 1881). Thus, the coastline is relatively sensitive to general sea level rise. The southern shoreline of Copenhagen, the capital of Denmark, lies in this region. It is thus an area with an obvious coastal hazard emphasized by coastal climate change and high societal and economic importance (Hallegatte et al., 2011) and has been selected as flood prone according to the EU flood directive (Andersen et al., 2018).
The need for climate information in various sectors in Europe is well established (Soares et al., 2018). Previous studies have shown that there is a need both for climate change information and information on decision making under large uncertainties (Turnpenny et al., 2004), not the least for the coastal region, where many aspects of society, including socio-economic and environmental issues, have to be taken into account (Tribbia and Moser, 2008). It has long been recognized that focusing only on the science, at the expense of user engagement, implies a risk of “simply providing too much of the wrong type of information” (McNie, 2007, p. 17). The information must be recognized as salient, credible, and legitimate to the users (Cash et al., 2002), and to ensure this, Vaughan et al. (2016) call for feedback and engagement between providers, purveyors and users of climate change services.
Several of the above studies have involved large user investigations involving online surveys and in depth interviews. Our motivation for this study was to test a relatively efficient and low cost method for early user interaction and mapping of user needs to design dedicated coastal climate indicators for the region, as the first step of a use case on Baltic Sea coastal climate change in the Copernicus Climate Change Service (C3S) CODEC project.
The section on Materials and Methods focuses on the use of an interview template designed for general user investigations for the C3S user need mapping, and use of interviews with few, but carefully selected responders. The results section describes the user response, including the early involvement and how the method fed into the C3S service, and allowed derivation of relevant and feasible climate change indicators.
Materials and Methods
Study Area and Selected Municipalities
In Denmark, a large part of the responsibility for climate adaptation lies with the local municipalities.
The five municipalities Copenhagen, Dragør, Hvidovre, Ishøj, and Køge were selected for the study, to represent the variation of geographical conditions in the region, as well as various levels of focus on climate adaptation (see next paragraph). The selection was made based on our previous knowledge of, and engagement with, the municipalities. Further, the Danish Coastal Authority was included in the survey, as it has a central role in advising the municipalities on issues regarding flooding, and climate change. In total, six interviews were made.
All municipalities have coastline toward the Køge Bay region – the south coast of Copenhagen – in the south western Baltic Sea (Figure 1). The central Copenhagen Municipality represents the Copenhagen historical, governmental and cultural capital center and dense urban population, while the other municipalities are suburban, and also encompass rural areas and areas of natural and recreational interest. The Municipality of Copenhagen represents significantly more people than the other municipalities. It has an advanced program on climate change adaptation and is planning flood gate protection together with its closest neighbor municipalities. The other municipalities represent different awareness levels on the need for climate change adaptation. The municipalities all have access to extensive information on the population and infrastructure, as well as detailed geographical information, for their local area.
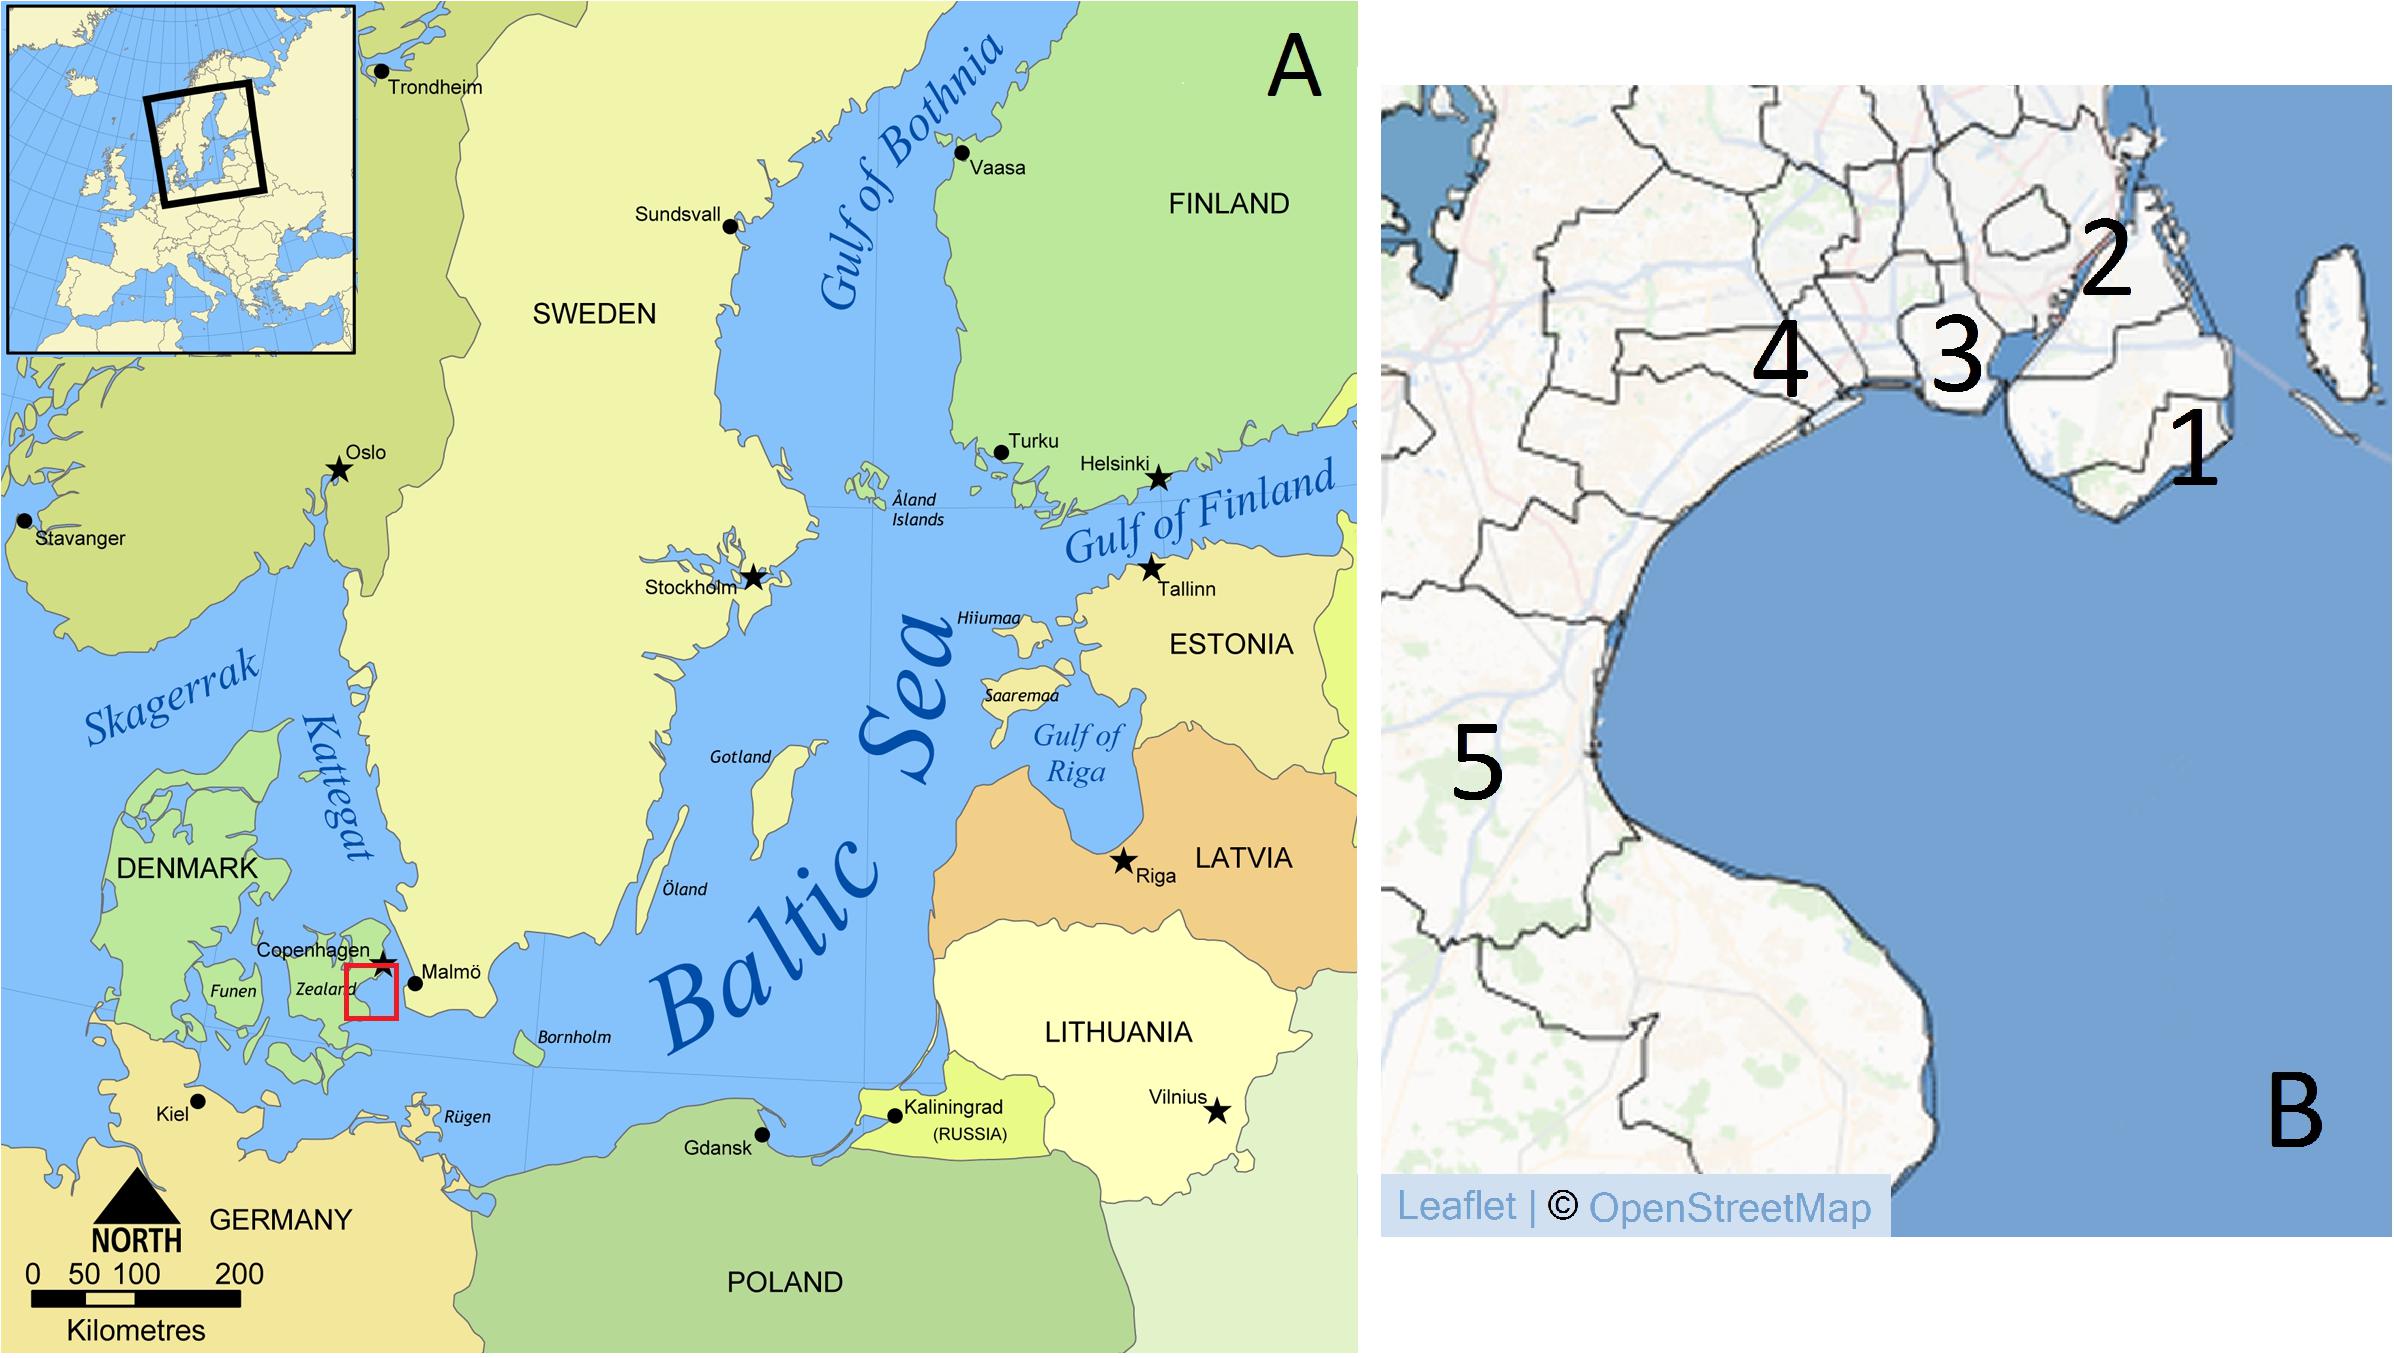
Figure 1. (A) Overview map of the Baltic Sea region, with Køge bay marked with a red square. (B) Zoom to Køge Bay and the five municipalities of Dragør (1), Copenhagen (2), Hvidovre (3), Ishøj (4), and Køge (5).
Interview Template
The interview template was originally developed for use within the SECTEUR project and for the C3S contract D422Lot2.TEC. Within this study, the wording of selected questions were tailored to focus on coastal climate change. The interview template (see Supplementary Material) consisted of a range of questions, space to write answers, and references to corresponding elements of the C3S User Requirement Database. That is, there was an almost one-to-one link between the template and the database elements.
The template contained an introductory part, focusing on identifying the interviewed person(s), their organization and professional role, and overall need for coastal climate information. The central part of the template consisted of identifying new essential climate variables and climate change indicators needed by the municipalities, by specifying key needs for climate information, needs for combination with socio-economic information or other data sources, and a range of meta-information, including data source, spatial-temporal resolution, quality and uncertainty information needs, and data format requirements. Also, there was room to discuss the needs for visualization and data processing tools. The interview template was rounded off with a talk on how new data will be used by the municipalities, the possibility to identify if more people in the organization or externally were relevant for the interview, and whether the interviewed person would like to be involved in the further process.
Interview Procedure
All interviewees were briefly introduced to the project and the interviews over e-mail, followed up with contact by phone. All invited municipalities were willing to participate in the interviews, and the interviews were conducted with representatives from the municipalities and the Coastal Authority over phone or through face to face meetings. They were limited to last 1 h. Before the interview, the interview template was sent to the interviewees for orientation, and to allow preparation of responses in the organization, but they were instructed not to fill it. During the interview, the template was followed with some flexibility, allowing focus on the areas of greatest importance to the individual interviewee, thus allowing a detailed interview of the needs for design of new climate indicators. Notes were taken during the interview, and based on this, the template was filled out by the research team. Finally, the filled template was sent to the interviewee for corrections and approval.
This study was carried out in accordance with the recommendations of the DMI Ethics Committee of the Danish Meteorological Institute, and the protocol was approved by the committee. All subjects gave written informed consent to participate.
Results
Summary of Interview Findings
The main interest of the interviewees was very high quality storm surge warnings and projections of possible present day and future extreme sea level and wave heights for the detailed coastline (Figure 2). This should be based on modeling of past storm surges and future changes, taking observations, and historical records into account. The information was primarily required to prepare decision making in the municipalities, e.g., for preparation of information material to local politicians. There was a big need for more detailed information than presently available, and for authoritative (nationally selected or recommended) scenarios, which would help the collaboration between municipalities.
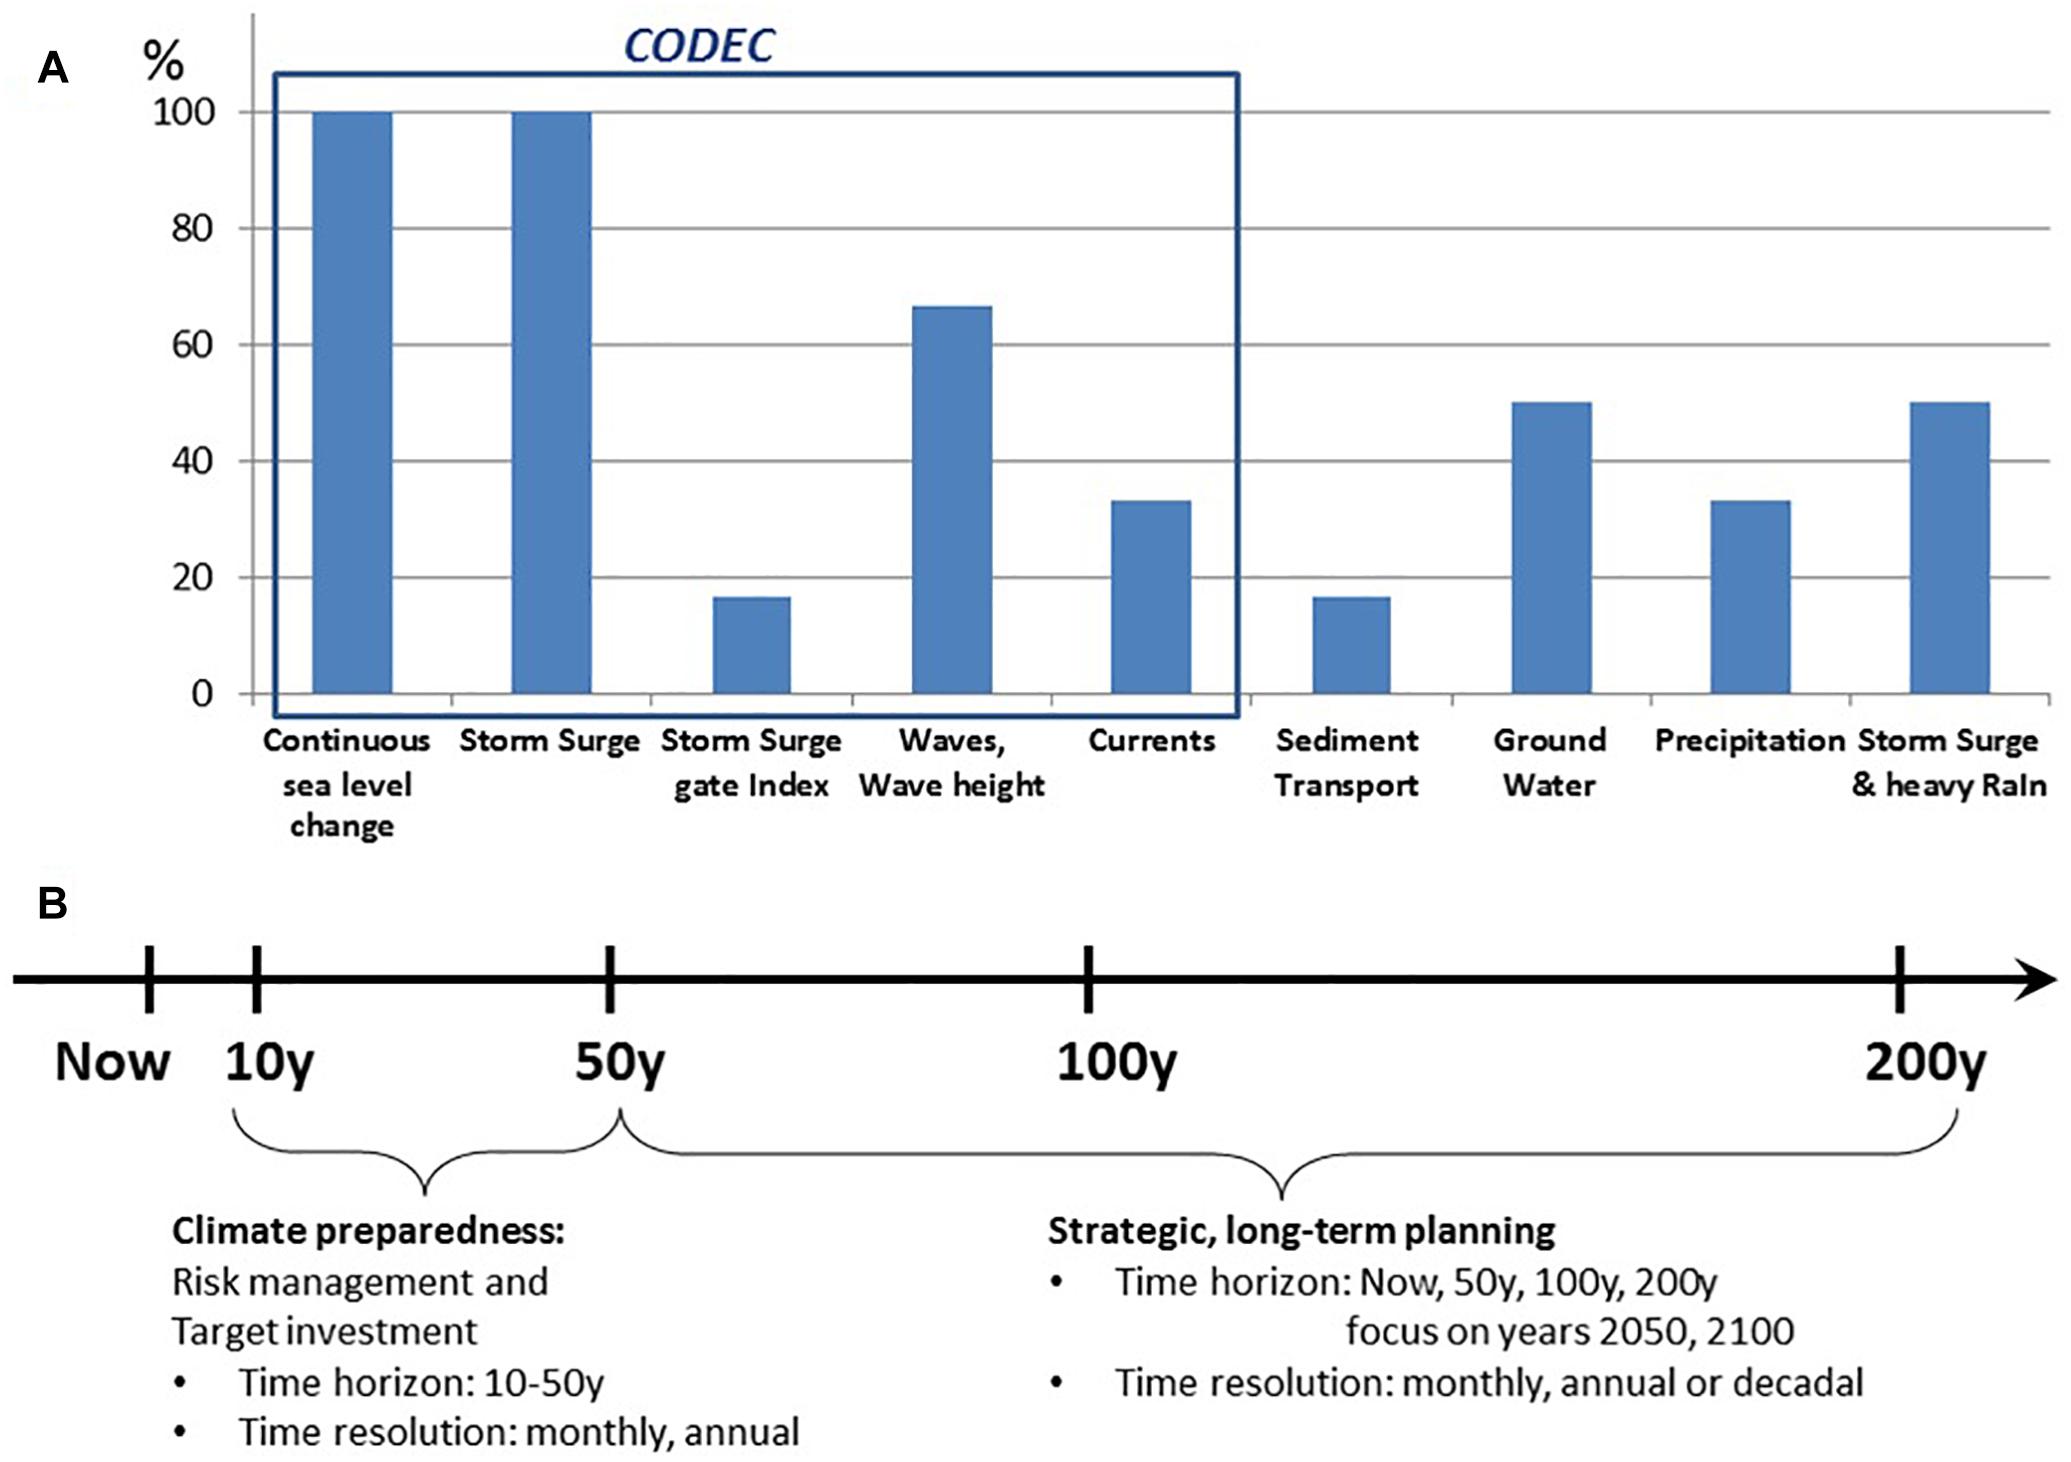
Figure 2. (A) User interest in percentage of number of interviewed users. The interest areas are targeting: mean and extreme sea level for climate preparedness and planning; precipitation and coinciding storm surge and heavy rain events; as well as waves and currents for climate assessments of ocean variability and sediment transport in Køge Bay. The planned southern Copenhagen storm surge gate is in focus for one user, who has a large interest in a gate index indicating the number of high water events that will require a closing of the gates. The frame indicates topics selected to be translated into climate change indicators within the C3S_422_Lot2_Deltares CODEC contract; the selection was made based on a combination of the user requirements, the feasibility of deriving the indicators and the coastal frame of the project. (B) Illustration of the two main time scales in focus for the interviewees: user applications for climate preparedness and risk assessment (10–50 years), as well as long term strategic planning (50–200 years). The interviewed users require relatively low time resolution of the statistical products: monthly, annual or even decadal, but they require very high spatial resolution of about 1 km on regional scale (200 km × 200 km) and roughly 100 m on local, coastal scale.
Secondary requirements included information on mean sea level changes for a range of planning purposes. This should be with a known reference level, preferably the Danish national DVR90 system, and should be complimented with information on land rise. For the planning of new flood gates and other infrastructure sensitive to exceedance of a specific sea level height, there was a request for a “gate index,” indicating the frequency and duration of events where the sea level exceeds a given height. Also, there was a need for an indicator of changes in ocean currents relating to the distribution of seaweed deposition, and thus recreation and tourism.
The municipalities generally related to present day situations when discussing future climate change, and thus it will clearly make communication of climate change information, e.g., a future storm surge height indicator, easier, if it can be presented in the same terms as used for present day storm surge warnings and statistics.
The information should represent the region of Køge Bay including the Danish and Swedish coast. The time scales in focus varied between the municipalities, from mid-century (2050) to end century, and 150 years ahead (Figure 2). Regarding data formats, all municipalities are advanced users of GIS software and would like to integrate the climate information into their present systems, where many other layers of information are available.
The municipalities expect state of the art quality data, and were generally aware of the need for uncertainty information. They were ready to handle uncertainties in the form of standard deviations, percentiles, or upper- and lower bounds. The knowledge of ensembles was limited. Further, they would like information on underlying assumptions and datasets that goes into the calculations to be available, to assure a transparent dataflow.
The primary needs were to have data to improve long term planning in relation to climate adaptation, especially by giving neighboring municipalities common information as a basis for decision making; and to have the best possible foundation for emergency preparedness. The needs for visualization and data processing facilities were limited, as the municipalities in general preferred to do this within their own GIS systems.
To ease the planning process and integration with other products, there was a general request to have updates of the information on regular intervals, to give a predictable data flow to the decision making process. The preferred frequency for updates varied between 6 months and a few years, with most requests for annual updates. Only indicators with significant changes or new information should be updated.
All interviewed persons were willing to take part in the further development of the service, potentially getting involved in the project as a user-representative. They were generally happy to be involved early in the process, and eager to follow the development. They also indicated that the interview template covered the topic well, and the procedure with an interview of fixed duration was an efficient way for them to give input.
Derived Dedicated Coastal Climate Indicators for the Region
Based on the interviews, the following indicators were selected.
• Mean Sea level change indicator: Mean sea level change of selected reference periods, with, and without local land rise.
• Storm surge indicator: Storm surge height and duration changes.
• Gate index: Number of threshold exceedances per year and duration.
• Sea State (Waves) indicator: Changes in wave height in a future climate, both for average conditions and high-sea level events, that is, the wave setup during storm surges.
• Ocean current indicator: Strength of average currents during normal and stormy conditions.
The indicators will be derived from regional hydrodynamic and wave model simulations of the future climate.
Discussion
The present study represents a cost efficient approach to early user interaction, completed with six carefully selected interviews of 1 h duration each. Yet, very detailed information on user needs were obtained, in a format that could relatively easily be translated into coastal climate change indicators, as well as fed back to the C3S User Requirement Database. Compared to larger user investigations, the main risk of the approach is to miss important user information from municipalities not invited for interviews. Thus, a well-defined target group and relatively high degree of pre-hand knowledge to select representative interviewees is required. Also, the degree of awareness of the topic was quite high among the interviewees. Without this, one would risk to get very little feedback. With these precautions in mind, the interviews have allowed identification of climate change indicators early in the contract, allowing understanding of how the information is relevant to, and why it is requested by the end user.
Ethics Statement
This study was carried out in accordance with the recommendations of the DMI Ethics Committee of the Danish Meteorological Institute, and the protocol was approved by the committee. All subjects gave written informed consent to participate.
Author Contributions
KM and JM contributed to conception and design of the study and performed the interviews. MB and JS performed the calculations required for derivation of indicators. KM wrote the first draft of the manuscript. All authors contributed to manuscript revision, read, and approved the submitted version.
Funding
The research leading to these results has received funding from the C3S_422_Lot2_Deltares contract on coastal climate change (CODEC), for the Copernicus Climate Change Service.
Conflict of Interest Statement
The authors declare that the research was conducted in the absence of any commercial or financial relationships that could be construed as a potential conflict of interest.
Acknowledgments
The research leading to these results has received funding from the C3S contract C3S_422 Lot2 Deltares-European Services to derive consistent European dataset for tide, storm surge, and wave conditions Climate Impact Indicators for the evaluation of climate change impacts on coastal areas in Europe (CODEC). The contract includes data for full European coastline, to be added to C3S data store, and five use cases, including the presented.
We kindly acknowledge the Copernicus C3S project SECTEUR (Sector Engagement for the Copernicus Climate Change Service: Translating European User Requirements, C3S_52_Lot2) and the Copernicus C3S contract D422_Lot 2, together with ECMWF, for provision of the original interview template. C3S_52_Lot2 was implemented by the Institute for Environmental Analytics, University of Reading, United Kingdom, contact Dr. Maria Noguer.
The Copernicus Climate Change Service (C3S) is funded by the European Union and aims to:
• Become an authoritative source of climate information for Europe.
• Build upon national investments and complement national climate service providers.
• Support the market for climate services in Europe.
• Provide free public access to climate change information.
Supplementary Material
The Supplementary Material for this article can be found online at: https://www.frontiersin.org/articles/10.3389/feart.2019.00081/full#supplementary-material
References
Andersen, K. J., Piontkowitz, T., Jebens, M., Thomsen, M., and Henriksen, L. S. (2018). Revurdering og Ajourføring af Risikoområder for Oversvømmelse fra hav og Vandløb. Oversvømmelsesdirektivet, Anden planperiode. Lemvig: Kystdirektoratet, Miljø- og Fødevareministeriet.
Bacc II Author Team (2015). Second Assessment of Climate Change for the Baltic Sea Basin. Heidelberg: Springer International Publishing, doi: 10.1007/978-3-319-16006-1
Cash, D., Clark, W. C., Alcock, F., Dickson, N. M., Eckley, N., and Jäger, J. (2002). Salience, Credibility, Legitimacy and Boundaries: Linking Research, Assessment and Decision Making. KSG Working Papers Series RWP02-046. Cambridge, MA: Harvard University.
Colding, L. A. (1881). Nogle Undersøgelser over Stormen over Nord- og Mellem-Europa af 12te – 14de November 1872 og over den derved fremkaldte Vandflod i Østersøen. Vidensk. Selsk. Skr. 6. Copenhagen: Bianco Lunos Kgl. Hof-Bogtrykkeri.
Ditlevsen, C., Ramos, M. M., Sørensen, C., Ciocan, U. R., and Piontkowitz, T. (2018). Højvandsstatistikker 2017. Lemvig: Kystdirektoratet, Miljø- og Fødevareministeriet.
Hallegatte, S., Ranger, N., Mestre, O., Dumas, P., Corfee-Morlot, J., Herweijer, C., et al. (2011). Assessing climate change impacts, sea level rise and storm surge risk in port cities: a case study on Copenhagen. Clim. Change 104, 113–137. doi: 10.1007/s10584-010-9978-3
McNie, E. C. (2007). Reconciling the supply of scientific information with user demands: an analysis of the problem and review of the literature. Environ. Sci. Policy 10, 17–38. doi: 10.1016/j.envsci.2006.10.004
Olesen, M., Madsen, K. S., Ludwigsen, C. A., Boberg, F., Christensen, T., Cappelen, J., et al. (2014). Fremtidige Klimaforandringer i Danmark. DMI Climate Report 14-06. Copenhagen: Danish Meteorological Institute. doi: 10.1016/j.envsci.2006.10.004
Soares, M. B., Alexander, M., and Dessai, S. (2018). Sectoral use of climate information in Europe: a synoptic overview. Clim. Serv. 9, 5–20. doi: 10.1016/j.cliser.2017.06.001
Tribbia, J., and Moser, S. C. (2008). More than information: what coastal managers need to plan for climate change. Environ. Sci. Policy 11, 315–328. doi: 10.1016/j.envsci.2008.01.003
Turnpenny, J., Haxeltine, A., and O’Riordan, T. (2004). A scoping study of user needs for integrated assessment of climate change in the UK context: part 1 of the development of an interactive integrated assessment process. Integr. Assess. 4, 283–300. doi: 10.1080/13895170590514309
Keywords: climate change, sea level change, user needs, user driven, Copernicus C3S
Citation: Madsen KS, Murawski J, Blokhina M and Su J (2019) Sea Level Change: Mapping Danish Municipality Needs for Climate Information. Front. Earth Sci. 7:81. doi: 10.3389/feart.2019.00081
Received: 04 December 2018; Accepted: 03 April 2019;
Published: 18 April 2019.
Edited by:
Marcus Reckermann, Helmholtz Centre for Materials and Coastal Research (HZG), GermanyReviewed by:
Alex Oriel Godoy, Universidad del Desarrollo, ChileRoger Brian Street, University of Oxford, United Kingdom
Copyright © 2019 Madsen, Murawski, Blokhina and Su. This is an open-access article distributed under the terms of the Creative Commons Attribution License (CC BY). The use, distribution or reproduction in other forums is permitted, provided the original author(s) and the copyright owner(s) are credited and that the original publication in this journal is cited, in accordance with accepted academic practice. No use, distribution or reproduction is permitted which does not comply with these terms.
*Correspondence: Kristine S. Madsen, a21hQGRtaS5kaw==