 Morgane Jolivet
 Edward J. Anthony
 Antoine Gardel
 Guillaume Brunier3
- 1USR LEEISA, CNRS, Ifremer, Université de Guyane, Cayenne, French Guiana
- 2UM 34 CEREGE, Aix-Marseille University, CNRS, IRD, INRA, Collège de France, Aix-en-Provence, France
- 3Laboratoire des Sciences de l’Environnement Marin (LEMAR), UMR 6539 (UBO/CNRS/IRD/Ifremer), Institut Universitaire Européen de la Mer, Plouzané, France
On the 1500 km-long mud-dominated Guianas coast of South America, between the mouths of the two mega-rivers, the Amazon and the Orinoco, debouch numerous small rivers draining the humid tropical/equatorial Guiana Shield. The geomorphic development of the mouths of these rivers reflects interactions among water discharge, fluvial sediment load, and the alongshore migration of Amazon-derived mud banks alternating with inter-bank areas. The mouth of the Maroni River, astride the French Guiana-Suriname border, shows advanced estuarine infill and geomorphic development characterized by a western (downdrift) side comprising numerous recent cheniers and an eastern (updrift) side bound by an old (>2000 years B.P.) chenier. A multi-decadal analysis of the beach bounding this chenier shows little net overall mobility notwithstanding significant decadal to sub-decadal variation. The overall stability reflects the diversion of sand supply from the Maroni River toward the downdrift coast and limited sand supply by the smaller Mana River further east, and the south bank of which was contiguous with this beach. The variability in beach multi-decadal mobility reflects the influence, on waves, of alongshore-migrating banks (strong wave dissipation, limited beach mobility) and inter-bank areas (limited wave dissipation, larger beach mobility), highlighted by a comparison, in the current bank phase, of offshore and inshore waves. Erosion of the beach between 2011 and 2017 coincides with the sealing of the mouth of the Mana by muddy progradation in 2011 and mouth relocation several kilometers eastward. The morphodynamics of the beach and shorter-term fluctuations in budget are related to: (1) interaction with estuarine sand dunes mobilized by strong tidal currents on the adjacent shallow shoreface, (2) the influence of the Maroni channel, and (3) rapid encroachment of the leading edge of the shore-attached mud bank on the eastern part of the beach. The beach morphodynamics and evolution highlight, thus, embedded levels of influence: the Maroni at the local scale, and the net westward sediment-transport system and bank and inter-bank alternations that affect the Guianas coast at a regional scale. The recent erosion poses a threat to the local communities by reducing beach space available for recreation and turtle-nesting.
Introduction
The Guianas coast of South America is a unique system in the world characterized by large-scale muddy sedimentation in spite of the exposure of the coast to waves from the Atlantic (Figure 1A). The mud is organized into a series of large banks that migrate along the coast under the influence of waves and currents, separated by “inter-bank” zones (Anthony et al., 2010). In this system, the inner part of a mud bank can weld onto the coast, creating new land that can be rapidly colonized by mangroves, whereas in inter-bank zones, higher incident wave energy can lead to intense shoreline erosion. Inter-bank erosion is mitigated, where beaches (cheniers) composed of sand and/or shells occur (Augustinus, 1978; Augustinus et al., 1989; Prost, 1989; Anthony et al., 2019). Cheniers are wave-reworked coarse-grained deposits resting stratigraphically on a muddy substrate (Otvos, 2018).
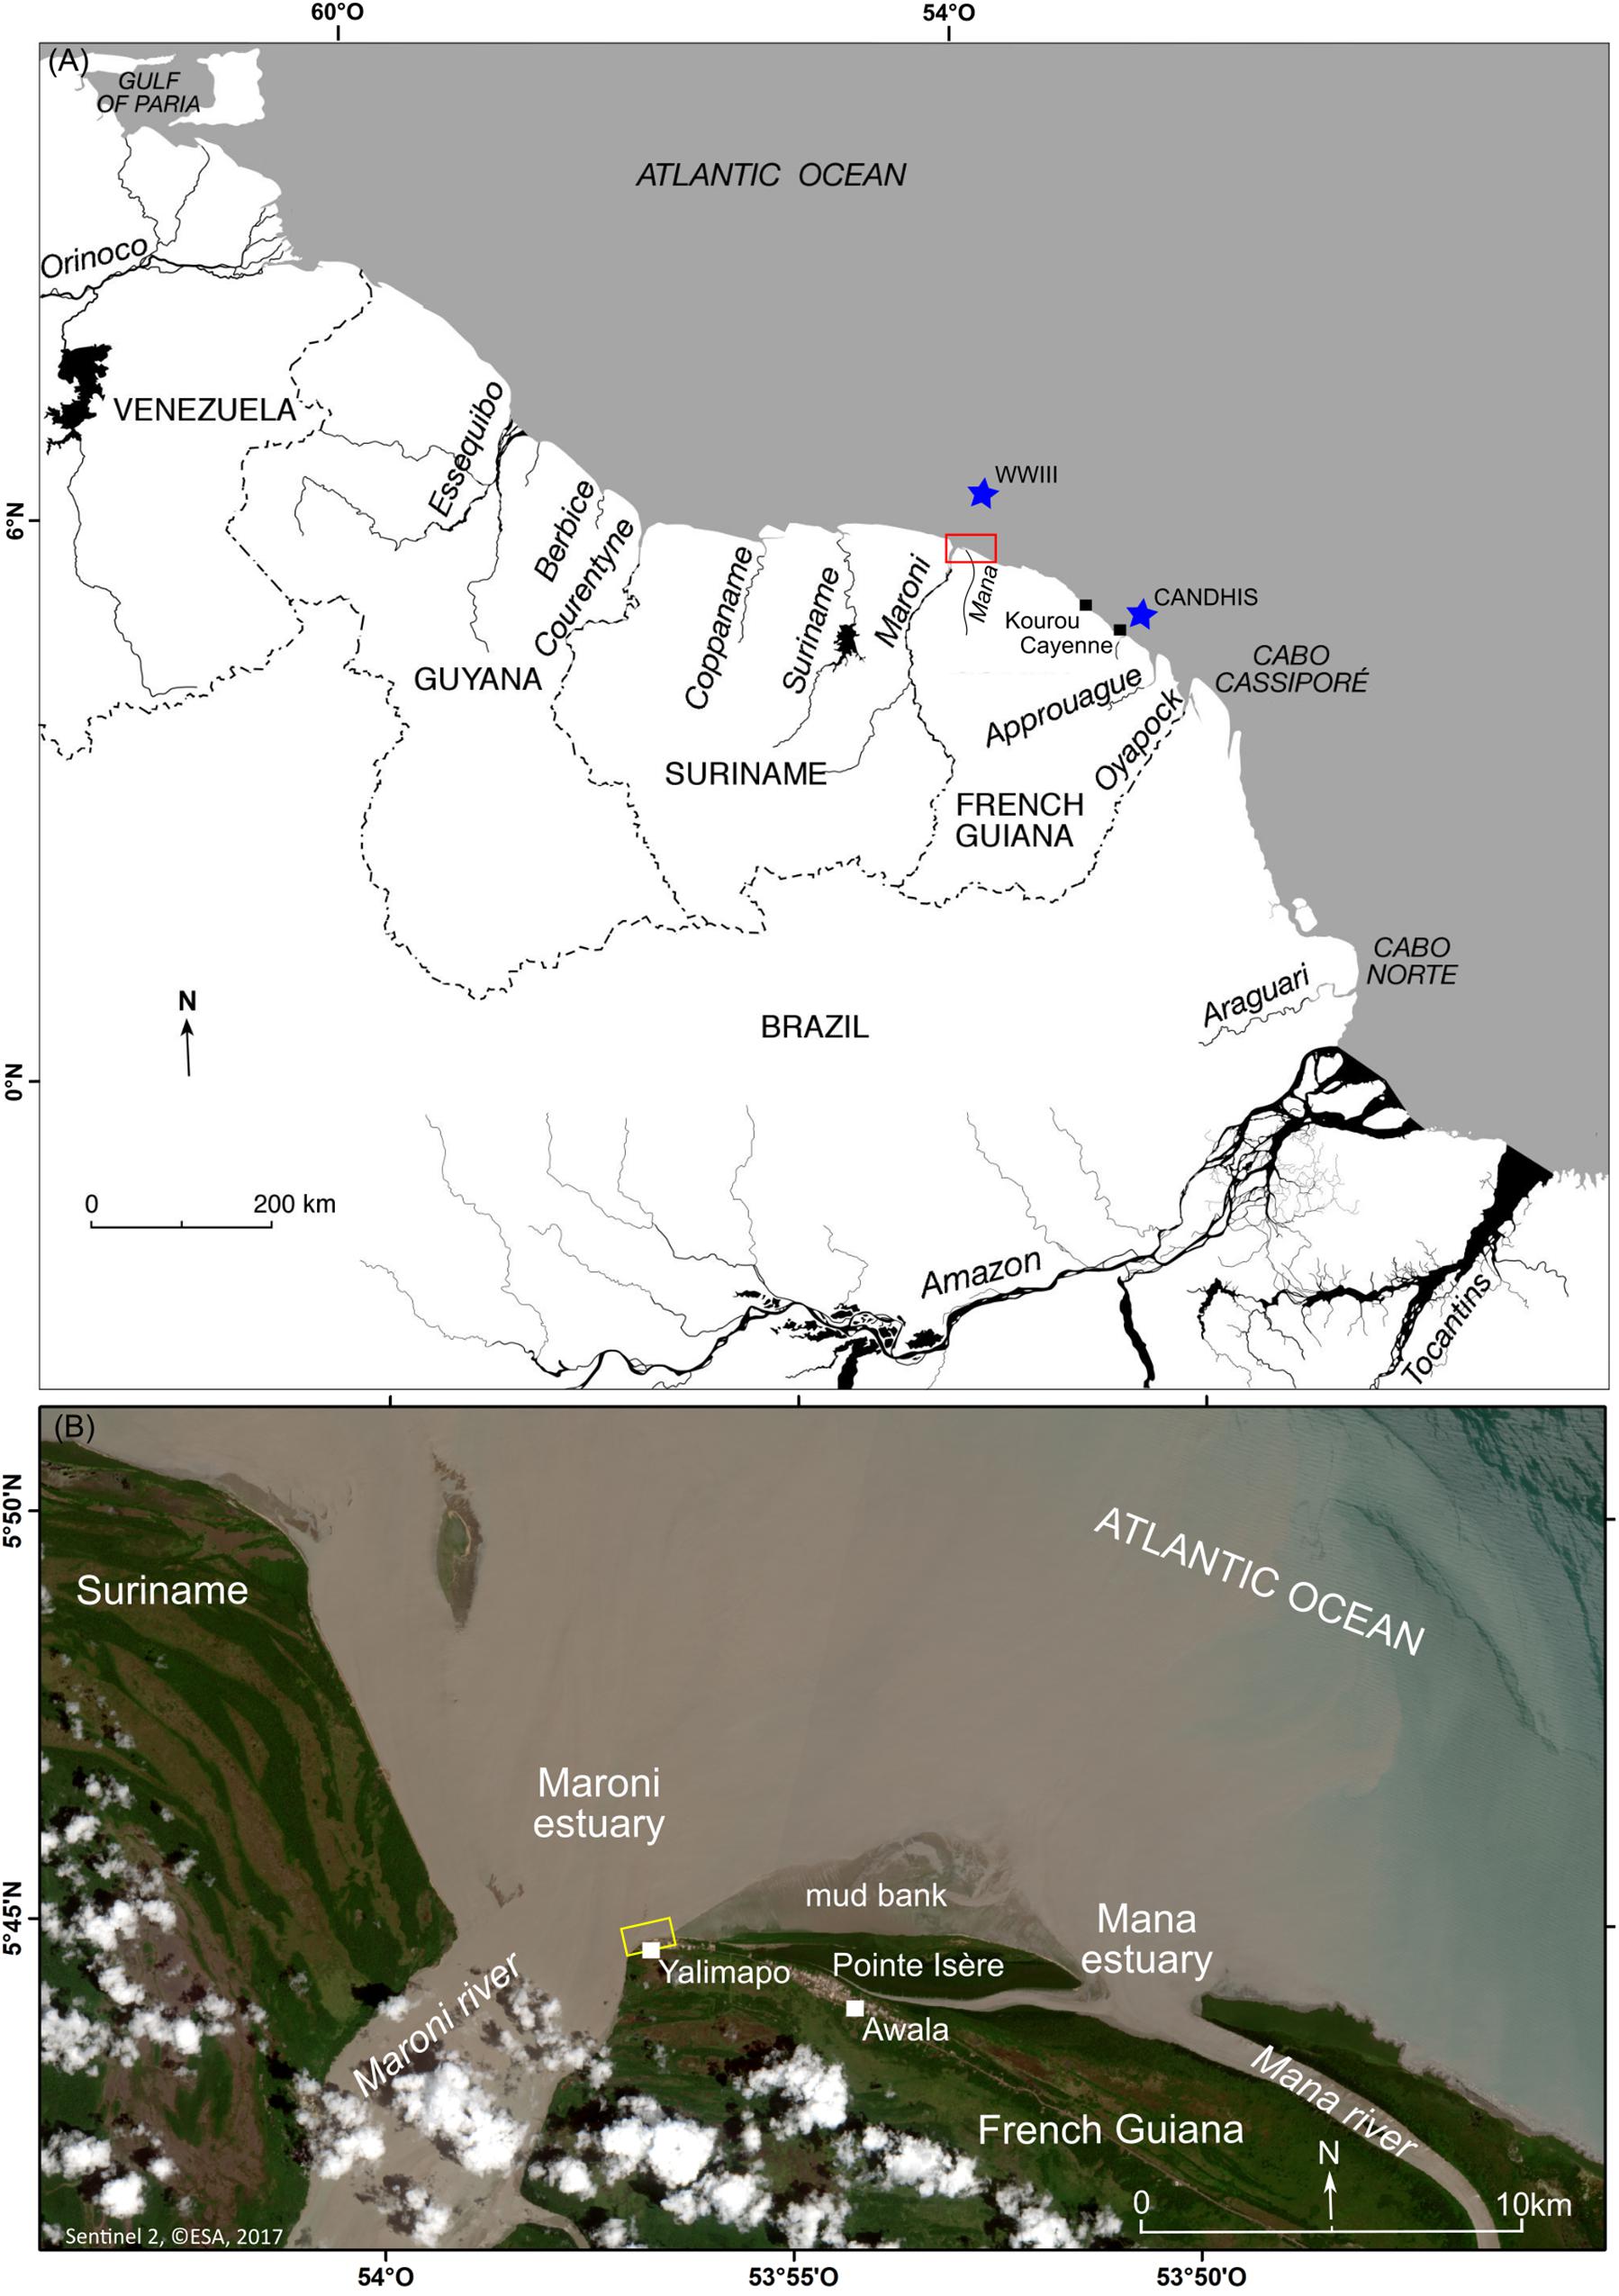
Figure 1. (A) Map of the Guianas coast between the deltas of the Amazon and Orinoco Rivers, and study area (red box). Also shown are several smaller rivers, among which the Maroni, and the Mana in western French Guiana. (B) SENTINEL 2 satellite image showing a close-up view of the mouth of the Maroni River and the neighboring Mana River, the former mouth of which (located at Awala) has been sealed by shore-attached mud following erosion of much of Pointe Isère, a mud cape extant since at least the mid-19th century. Yellow box shows aerial and ground photos on Figure 5.
There has been significant progress in unraveling the characteristics of mud banks (Abascal Zorrilla et al., 2018; Abascal Zorrilla, 2019) and their interaction with the Amazon-Orinoco coast (Anthony et al., 2010, 2014). Within this overwhelmingly mud-and mangrove-dominated 1500 km-long coast, cheniers are restricted in their development, and the mechanisms and pathways of sand supply responsible for their formation are still not clear because of this pervasive influence of mud. Cheniers are, nevertheless, an important resource. In addition to their role in coastal protection, they serve as zones of rural settlements and urban development, and as pathways for road and communication networks. Active cheniers assure recreational and ecological functions and services, notably by providing nesting sites for marine turtles and habitat for shorebirds and other wildlife. They also provide ready access to the sea for fishermen in this mud-dominated setting.
Although sandy deposits, and locally shells, may form secondary sources reworked from inner shoreface deposits or from pre-existing cheniers attacked by erosion, the primary source of sand for the development of the cheniers on the Guianas coastal plain is the local rivers (Anthony et al., 2013, 2014). Between the two big Amazon and Orinoco Rivers occur numerous smaller rivers (Figure 1A) reflecting the rainy tropical/equatorial catchments draining the Guiana Shield. In French Guiana, the heavy-mineral signatures of beach (chenier) sands are typical of the basement rocks drained by these local rivers (Pujos et al., 2000). The capacity of these rivers to supply sand to the coast depends on their ability to limit large-scale sedimentation of Amazon mud at their mouths. The smaller river mouths are commonly diverted by capes built from mud supplied by the Amazon (Augustinus, 1978; Plaziat and Augustinus, 2004; Gardel et al., 2019). Beaches are rare on this muddy coast and are systematically found downdrift (west to northwest) of river mouths on the east-west to southeast-northwest trending Amazon-Orinoco coast, thus highlighting the importance of the regional longshore sand transport induced by waves from a relatively constant north to east quadrant (Figure 2). These beaches (cheniers) commonly run alongshore for a few kilometers to tens of kilometers, before petering out to give way to the more common muddy mangrove-colonized shorelines. The variability in the lengths of such cheniers reflects sand supply volume from updrift and interruptions by mud-bank attachment to the shore that lead to chenier isolation inland (Anthony et al., 2019). Coasts updrift of many river mouths are generally, thus, characterized by muddy shorelines impinging directly on the east (or southeast) bank, forming a continuous mangrove-colonized fringe that may line the estuarine reaches of the Guiana rivers for several kilometers upstream.
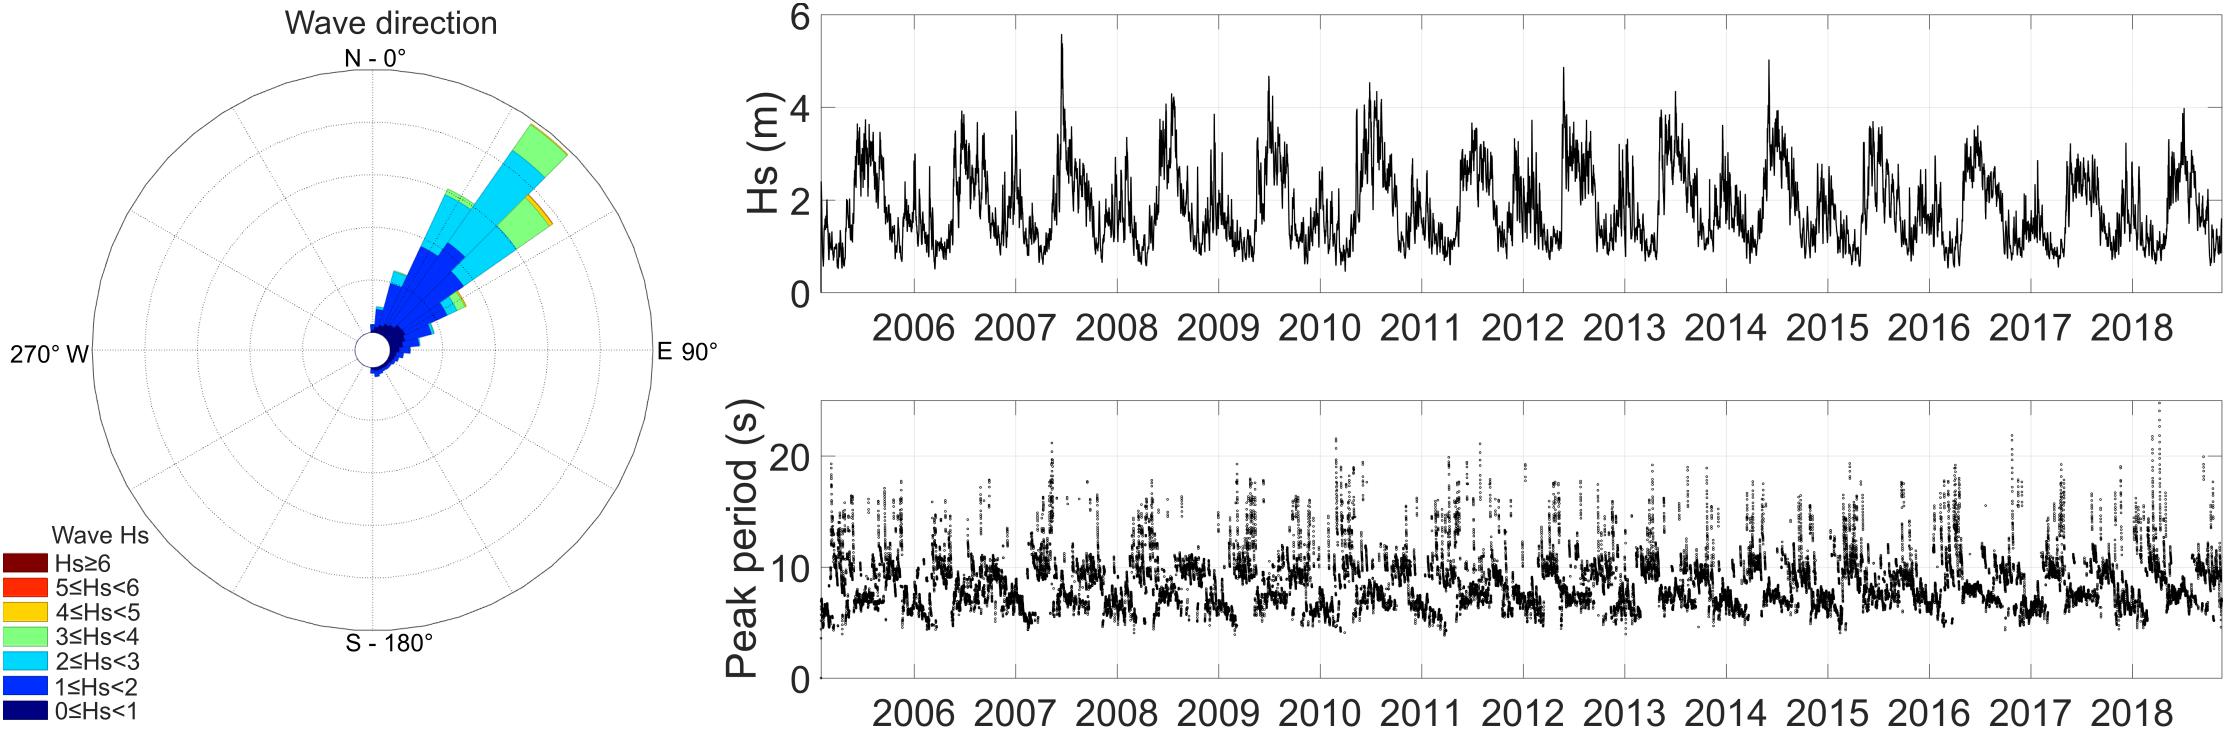
Figure 2. Three hour averages of wave-climate parameters, Hs and Ts, derived from a 13 year (2006–2018) record of data extracted from the Wave Watch III model (WWIII, NOAA) for a point (5°54′14.85′N, 53°48′7.96″W) 20 km offshore of the mouth of the Maroni (see Figure 1A).
Among the larger rivers is the Maroni (68,700 km2; mean discharge: 1700 m3/s), between French Guiana and Suriname, characterized by a large funnel-shaped, sand-filled shallow estuary mouth, reflecting significant fluvial bedload supply (Figure 1B). The Maroni is a good example of a river that has supplied sand for downdrift sandy chenier construction in Suriname (Anthony et al., 2019). The east shore of the Maroni exhibits, however, a sandy beach fronting the village of Yalimapo, in contrast to the common pattern of pervasive muddy sedimentation. This beach was considered as one of the most important turtle-nesting sites on the Guianas coast (Peron, 2014), and still is the most important recreational beach in western French Guiana. This beach was hitherto linked to the south bank of the Mana River (Figure 1B), a smaller river (catchment size: 12,090 km2; mean discharge: 320 m3/s) diverted westward by a large muddy cape, Pointe Isère (Plaziat and Augustinus, 2004) that has been largely eroded over the last five decades (Jolivet et al., 2019). The gradual impingement of a large mud bank has been accompanied, in 2011, by sealing of the ancestral mouth of the Mana by mud and deflection of the present mouth of this river several kilometers east of the village of Awala, which is now completely isolated from the sea by the shore-attached remnant of Pointe Isère (Figure 1B).
In this paper, we analyze, from a combination of remote sensing and field datasets, this updrift sandy beach and show how its morphodynamics and short (seasonal) to medium-term (multi-decadal) evolution have been modulated by the interplay of fluvial sand supply, river-mouth processes, mud-bank sedimentation, updrift muddy erosion of Pointe Isère, and wave dampening. The study highlights the morphodynamic and sedimentary interactions between a sandy beach and estuarine infill. It also brings out complex multi-decadal regional shoreline change in a context associated with bank sedimentation and inter-bank erosion under the overarching influence of mud supply from the Amazon.
Materials and Methods
We combined a mesoscale temporal (1955–2017) analysis of shoreline change in the vicinity of the river mouth with a short-term approach based on field experiments conducted in 2017–2018 (Figure 3). Except where specified otherwise, all the data generated by the study were archived and analyzed using MATLAB software.
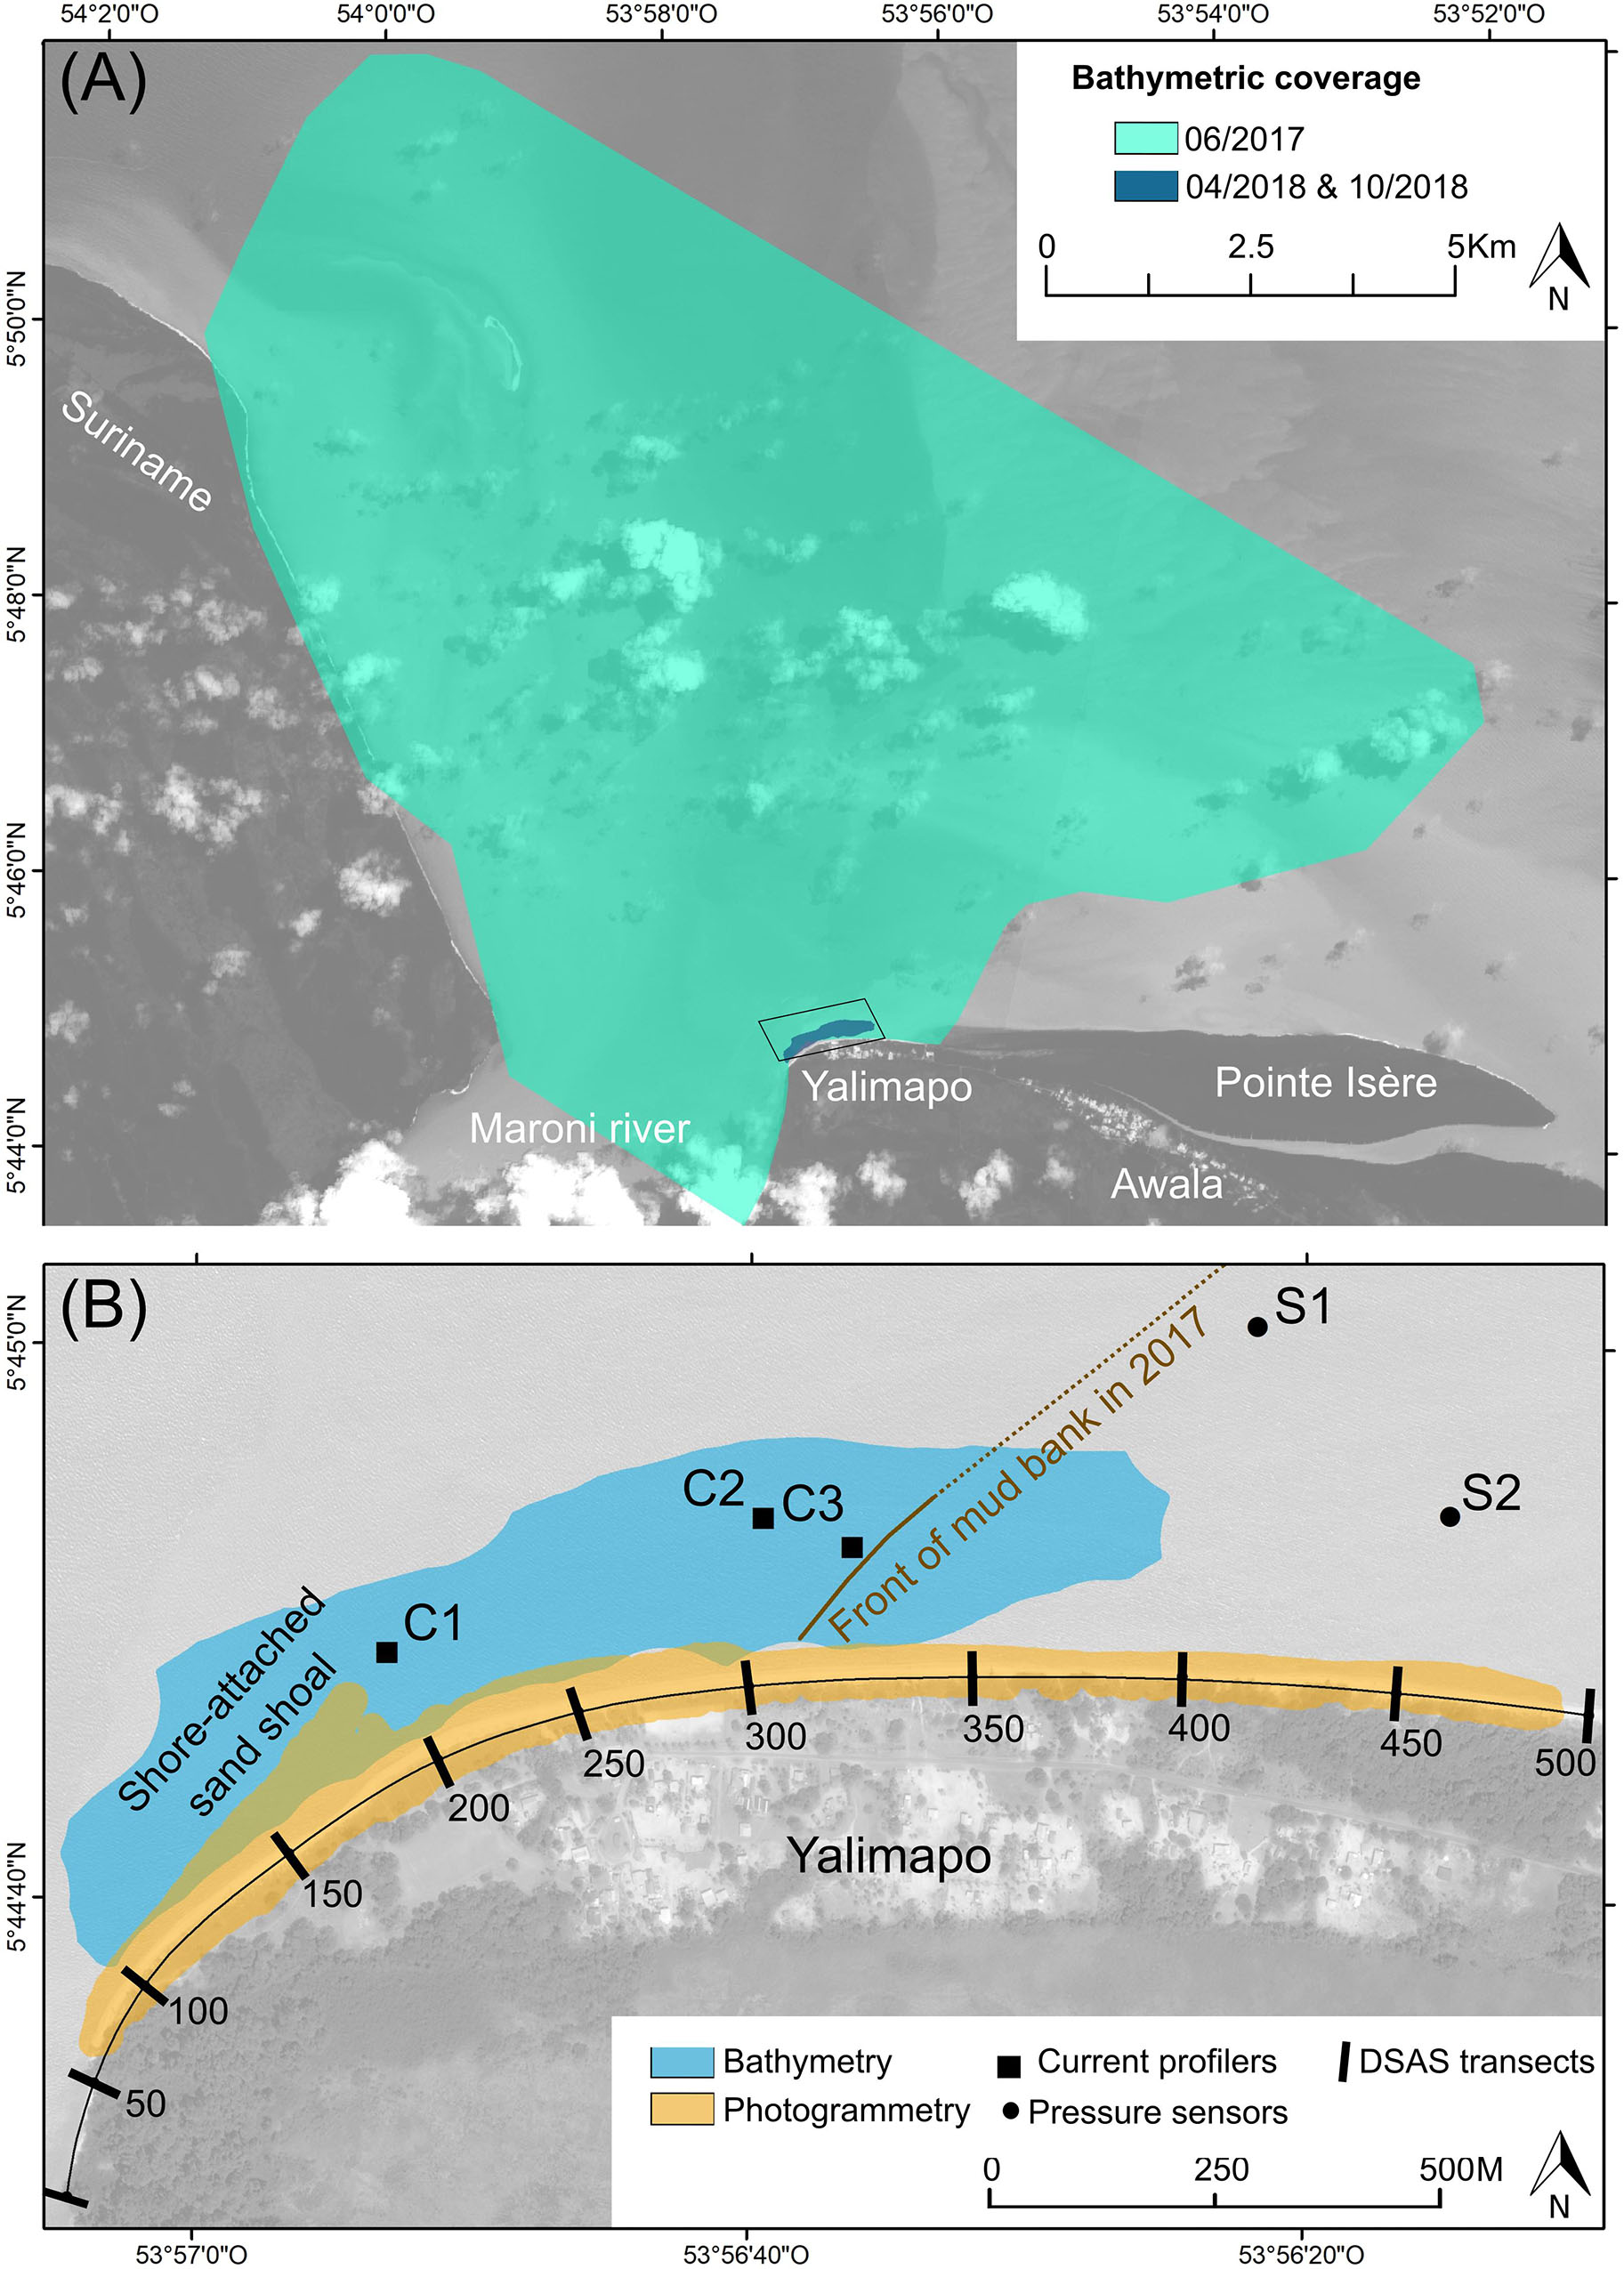
Figure 3. Map of the Maroni estuary showing area of bathymetric coverages in 2017 and location of study area (rectangle) (A); instrument deployment points, transects of multi-decadal (1955–2017) shoreline analysis, and areas of photogrammetric and bathymetric coverages in 2018 (B).
Multi-Decadal Shoreline Change
Multi-decadal shoreline change covering the beach (Figure 3B) was analyzed from ten very-high resolution (0.4–1.5 m) aerial photographs covering 56 years (1955–2012). These included three ortho-photographs and seven photographs in silver-print and digital format. This dataset was complemented for the most recent period (2011–2017) by four PLEIADE and SPOT6/7 satellite images, both with a very high resolution of 50 cm (Supplementary Table S1). The aerial photographs were georeferenced using a second-order polynomial transformation following generation of >500 ground control points (GCPs) and were then merged in order to obtain orthomosaics. As a reference, we used the Universal Transverse Mercator zone 22 North on the World Geodetic System 1984 ellipsoid. To quantify shoreline change, the limit between land and sea was first identified using beach sand vegetation, which stands out in good contrast with non-vegetated areas on French Guiana beaches (Anthony et al., 2002). This delimitation was facilitated by the high resolution of the images. Statistical analyses of shoreline variations were then conducted using the Digital Shoreline Analysis System DSAS v4.4 tool with Arcgis (Thieler et al., 2017). The analysis consisted of a total of 500 transects spaced 10 m apart and drawn perpendicular to a baseline (Figure 3B). The accuracy of the derived shoreline changes depends on a combination of errors from image resolution (50 cm), vectoring (50 cm), and geo-referencing. Given the large number (10–15) of images for each date, we calculated the average of the root mean square errors derived from geo-referencing for each date, and obtained a global mean of 8 m for all dates. We then combined these three sources of error to obtain a total accuracy rounded to ±10 m. The recent period of observation (post 2011) corresponded to one of gradual impingement of a large mud bank migrating westwards toward Suriname (Jolivet et al., 2019). The leading edge of this shore-welded mud was determined from the satellite images.
Field Surveys
River-Mouth Bathymetric Surveys
A bathymetric survey of the entire Maroni estuary was conducted in May 2017 (Figure 3A) using a Valeport Midas echosounder with a single beam dual-frequency (33–210 kH) and integrated DGPS. The GPS precision is ±2 m and that of the echosounder 0.01 m. Hydromagic software was used for synchronization of the data with the GPS positions. The survey was conducted along transects across the estuary at a spacing of 2 km, resulting in the generation of a digital elevation model (DEM) with 200 m-cells. The transect spacing was reduced to 40 m in a 2.5 km-wide zone offshore of Yalimapo, resulting in a DEM with 80 m cells (Figure 3A). Two bathymetric surveys were further conducted in April and October 2018 based on transects spaced 15–45 m along the beach and running offshore for 200–300 m (Figure 3B). The echosounder was synchronized with RTK-GPS with ±1 to 2 cm for X, Y coordinates and ±2 to 3 cm for the Z coordinate. From the corrected data, DEMs with 20 m-cells were computed using the ANUDEM interpolation (Hutchinson et al., 2011).
Beach Photogrammetric Surveys
Four photogrammetric surveys, aimed at highlighting beach morphological changes, sediment transport patterns, and short-term fluctuations in the beach sediment budget, were conducted using a motorized ultralight aircraft on May 29, June 28, September 11, and November 21, 2018 (Figure 3B). The frequency was designed to capture seasonal beach changes. In order to obtain as large a spatial coverage as possible (notably including the beach shoreface) all the surveys were conducted during spring low tides. Aerial photographs were obtained with a Sony Alpha7R camera with a 32 mega-pixel capacity, fixed on the wing of a motorized ultralight. Ground-size pixels, ground distances, and numbers of photographs per survey are shown in Supplementary Table S2.
The images acquired were analyzed using the structure-from-Motion (SfM) workflow (Westoby et al., 2012), with stereo pair-alignment based on GCPs deployed on the beach. The GCPs were made of 50 × 50 cm strips of linoleum painted with a black and white checker pattern, and their centers were accurately geo-referenced with a Trimble Real Time Kinetics (RTK) DGPS. The SfM-photogrammetry workflow was operated using Agisoft Photoscan Professional Software and the dense point cloud processed with CloudCompare free software. The coordinates of the GCPs were used in the dense point cloud construction to obtain X, Y, Z references. We adopted the Universal Transverse Mercator zone 22 North on the World Geodetic System 1984 ellipsoid as our project coordinate system. We obtained 4 DEMs with a 0.50 cm optimal resolution, and compared them for the quantification of temporal changes in morphology and sediment budgets.
In order to assess the quality of our DEMs, elevations were obtained from ground truth points (GTPs) and transects using RTK-DGPS (Supplementary Table S2). We used the same linoleum strips for the GTPs as those used for the GCPs, but the GTP and transect data were not used in the SfM workflow for DEM construction. The RTK base station was deployed on a IGN (French ordnance datum) benchmark, with an X, Y error of 5 cm and a Z error of 0.5 cm. The constructor error margin for the RTK-DGPS is ±1 to 2 cm for X, Y coordinates and ±2 to 3 cm for the Z coordinate. The comparison between our GTPs and control transects with our DEMs highlight errors close to 5 cm for Z (Figure 3). We applied a total error margin, inclusive of the RTK-DGPS error, of 5 cm to our DEM results. Beach profiles and DEM differentials, named differences of DEMs (DoDs), were established from the 2D and 3D data yielded by these surveys. We did not collect data on beach grain-size characteristics. Peron (2014) conducted a detailed analysis of grain sizes on the beach between Awala and Yalimapo, and showed a fine to coarse sand range largely dominated by quartz (>90%).
Wave and Current Measurements
In order to monitor the wave conditions prevailing over the estuarine beach shoreface, two NKE–SP2T pressure sensors (S1, S2) were deployed (Figure 3B) from 10/09/2018 to 15/09/2018 in the course of a spring-to-neap tide cycle on a transect running from the intertidal zone to subtidal shoreface-attached mud. The sensors sampled continuously at 2 Hz. Wave characteristics were evaluated using linear wave theory which is commonly employed for wind waves in shallow water. Wave spectra were calculated over bursts of 20 min using Fast Fourier transforms. A correction factor was applied with a cutoff at 0.5 Hz to account for the non-hydrostatic pressure field. For each burst, significant wave heights (Hs) and peak periods (Tp) were calculated in the spectral window [0.02; 0.5] Hz. A limit of 0.05 Hz was set between the gravity and infra-gravity wave domains. The pressure sensor accuracy is 0.02 m, and wave heights under this value were neglected.
There are no offshore wave data available in the study area. We resorted to wave records (June 2016 to May 2018, but with gaps) from a buoy deployed off Cayenne, 205 km east of the mouth of the Maroni (Figure 1A), beyond the shelf zone of mud-bank influence, by CANDHIS, the French National In Situ Wave Data Archive (Centre d’Archivage National des Données de Houle In Situ1).
In order to gauge the influence of the Maroni estuary and tidal currents on the shoreface of the beach, we measured current velocities from 07/09/2017 to 08/09/2017. Three Nortek Aquadopp current profilers were deployed off the beach (Figure 3B). C1 was deployed in a side-looking position 60 cm above the bed at the edge of the main Maroni channel cutting across the large sand bank that has largely infilled the estuary. C2 and C3 were deployed further east over the estuarine sand bank in an up-looking position and 50 cm from the bed. C3 was moored at the limit between estuarine sand and the mud bank. The frequency of acquisition was 1 MHz with 30 cm bins for C1, and 2 MHz with 10 cm bins for C2 and C3. The instruments were set with a burst measurement of 60 s at 5 min intervals. Mean current directions were averaged for each vertical bin over 7.5 s and interpolated between bins. We discarded data closest to the bed (from 0 to 0.065 m) because of potential contamination by side-lobe interference. Compass precision after calibration was around ±2°.
Results
Multi-Decadal Shoreline Change
The data on the multi-decadal shoreline evolution highlight significant mobility over the 62 year period of analysis (1955–2017), but much of this mobility is encompassed in the aerial photographic coverage between 1955 and 1987, strongly declining thereafter (Figure 4B1). The overall mobility over the entire period of observation exceeds 100 m at transects 105–127, but is within the error margin (±10 m) for 23% of the transects, and barely exceeds this margin (±10–20 m) for another 20% (Figure 4C). The area of beach represented by the transects (75–230) evincing the largest mobility appears to be related to a change in the orientation of the Maroni river-mouth east bank shoreline and to be linked to a shore-attached shoal (Figure 3B). This is a multi-decadal feature identifiable on aerial photographs and in the field at low tide.
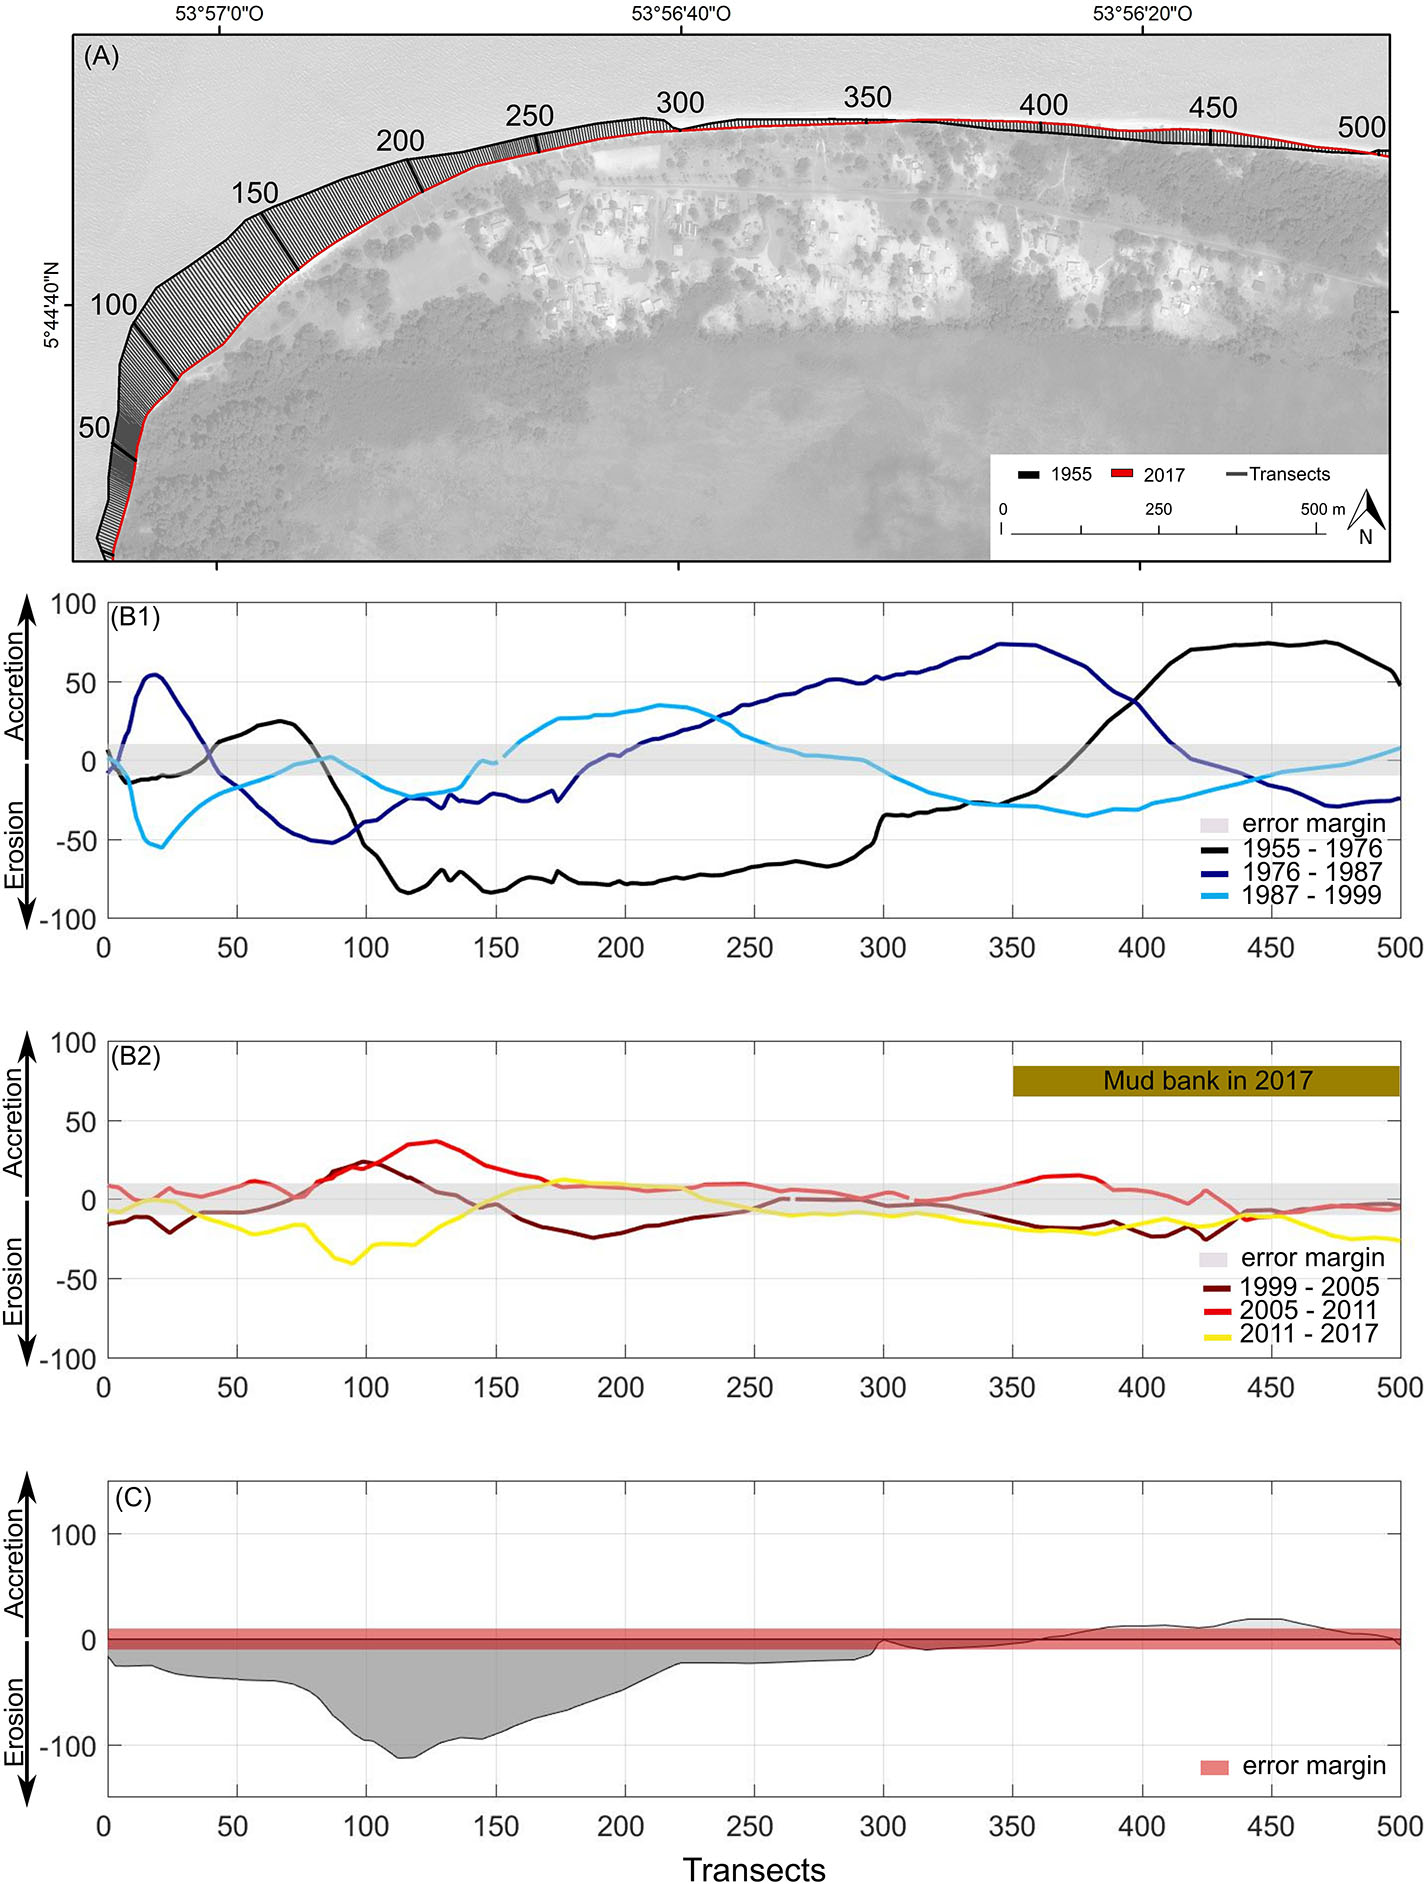
Figure 4. Mobility of Yalimapo beach between 1955 and 2017: (A) transects; (B) shoreline change between 1955 and 1999 (B1), and between 1999 and 2017 (B2); (C) net shoreline variation over the period 1955–2017.
The latest period (2011–2017) has been dominantly characterized by erosion (83% of transects), peaking at nearly 40 m at transects 94 to 95 (Figure 4B2), and marking a clear turn-around from advance to retreat in this area. This period has also been characterized by the gradual encroachment of the front of the shore-attached mud bank on the beach, by nearly 1.5 km between 2011 and 2017 (Figure 4B2). This encroachment has resulted in increasing inland isolation of the eastern part of the beach and the village of Awala, hitherto situated on the beach, by a dense forest of Avicennia germinans mangroves (Figure 5), and the present length of exposed beach has been reduced by about 50%.
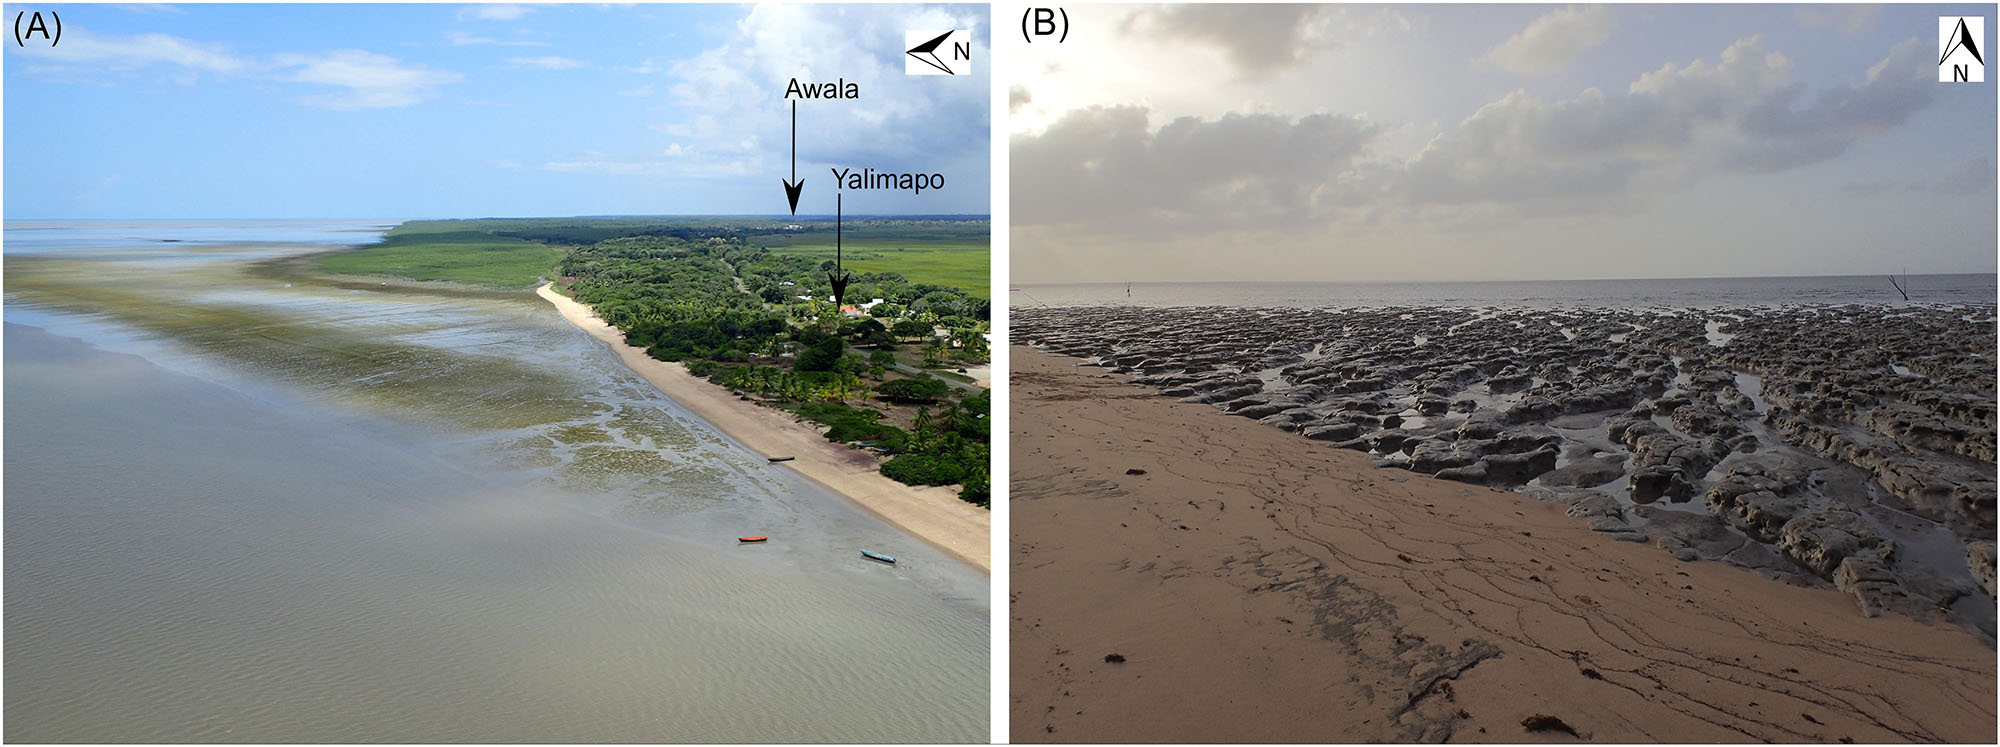
Figure 5. Encroachment of a shore-attached mud bank on Yalimapo beach (see Figure 1B) since 2014, resulting in increasing inland isolation of the eastern part of the beach and of the hitherto beach-front village of Awala (A), and reworked shoreface mud in front of the beach (B). The mud bank is progressively colonized by an advancing front of Avicennia germinans mangroves.
Estuarine Bathymetry and Shoreface Currents
The Maroni estuary is characterized by a wide, relatively shallow platform (Figure 6) with large areas ranging in depth from 2 to 4 m below French hydrographic datum (0 m). The platform is cut by a moderately deep (down to −10 m) and relatively straight single channel running north-northeast. The grain size (sand or mud) of the platform was mapped from the echo-sounder frequency signal (33 MHz = sand; 210 MHz = mud). Although much of the platform is sandy, a large area east of the channel is composed of mud, highlighting the encroachment of the leading edge of a mud bank, parts of which have welded ashore (Figure 5).
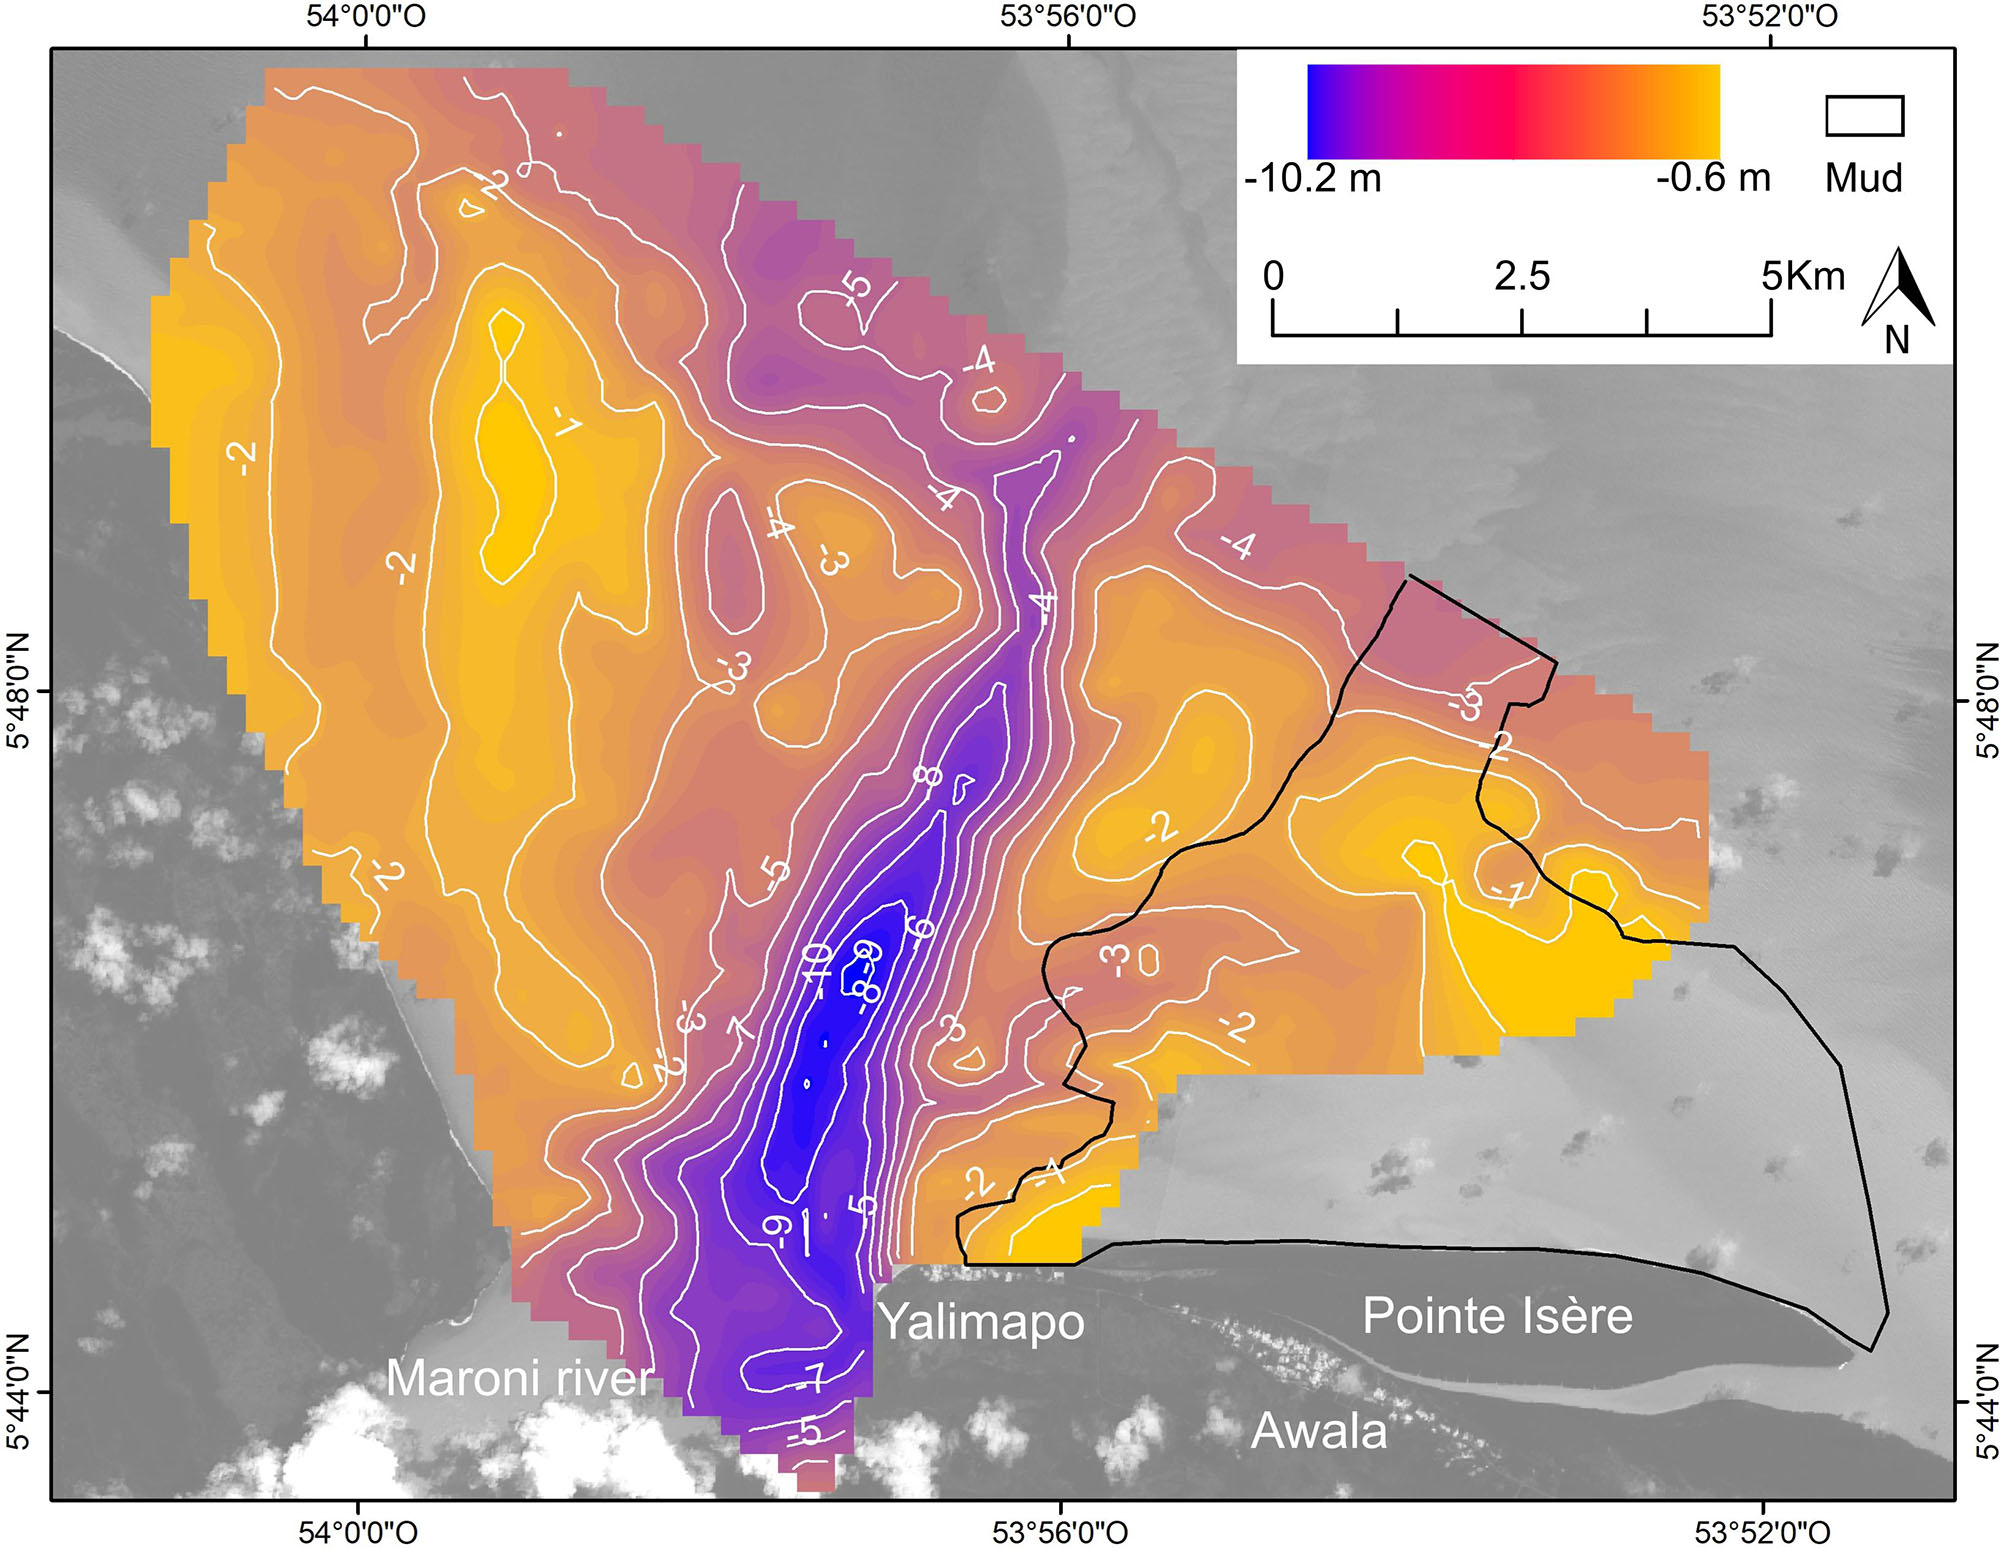
Figure 6. Bathymetry of the Maroni estuary showing advanced sandy infill and a single estuarine channel. Mud (enclosed area) is associated with encroachment, from the east, of a mud bank over the sandy estuarine infill.
The beach shoreface bathymetry highlights several features (Figure 7): (1) the proximity of the Maroni channel to the beach in areas corresponding to transects 0 to 125 (Figure 4A); (2) the shallow (−1 m below 0 datum) shoreface expression of the intertidal beach-attached shoal mentioned above (Figure 2), and shoreface deepening northeast of this feature; and (3) a second zone of more extensive shallowing (with large areas <1 m below 0 datum) corresponding to the shore-attached mud bank (Figures 7A1,A2,B). During the field experiments in 2017 and 2018, the intertidal beach-attached shoal was characterized by abundant dunes composed of medium to coarse quartz sand with broken shells (Figure 8B). The dunes migrated over a hard pavement of packed coarse sand. Based on the terminology of Ashley (1990), these dunes are medium-sized (0.5–2 m), 2D to 3D forms. They evinced net eastward migration under the influence of the strong tidal currents described below.
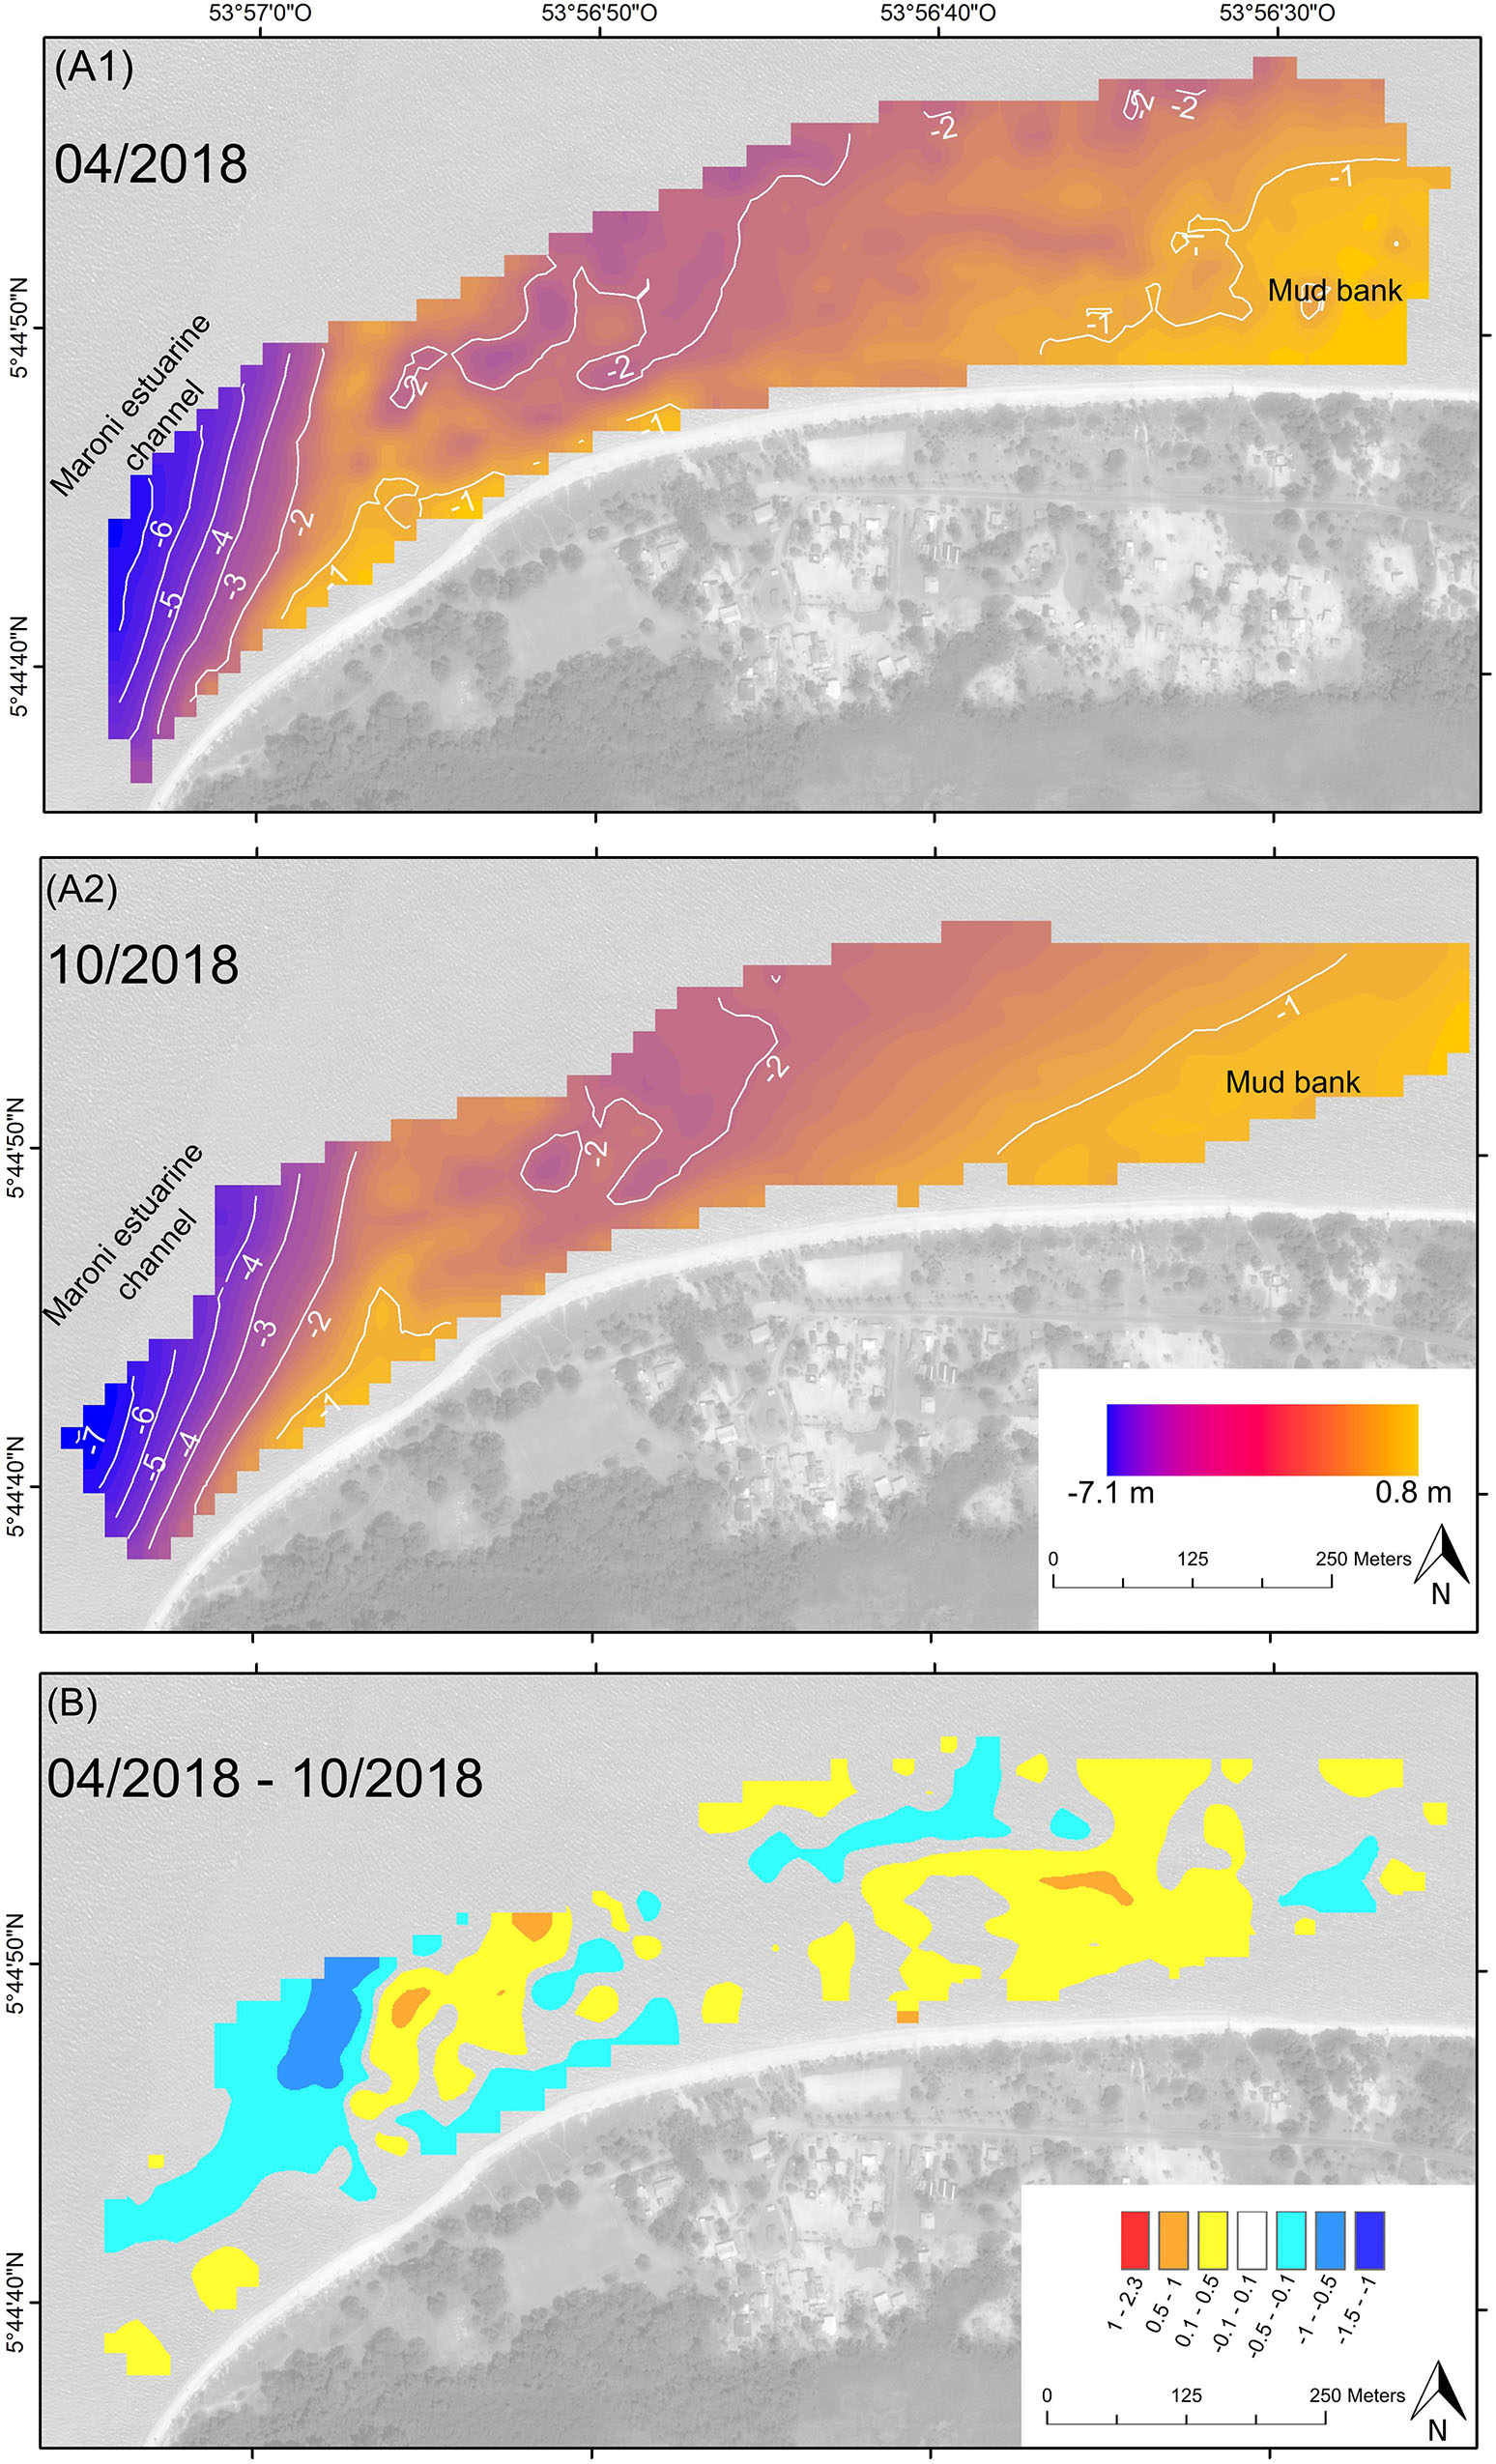
Figure 7. DEMS of shoreface bathymetry adjacent to the beach (A1,A2), and DoD over the study period, showing sediment loss close to the Maroni estuarine channel (B).
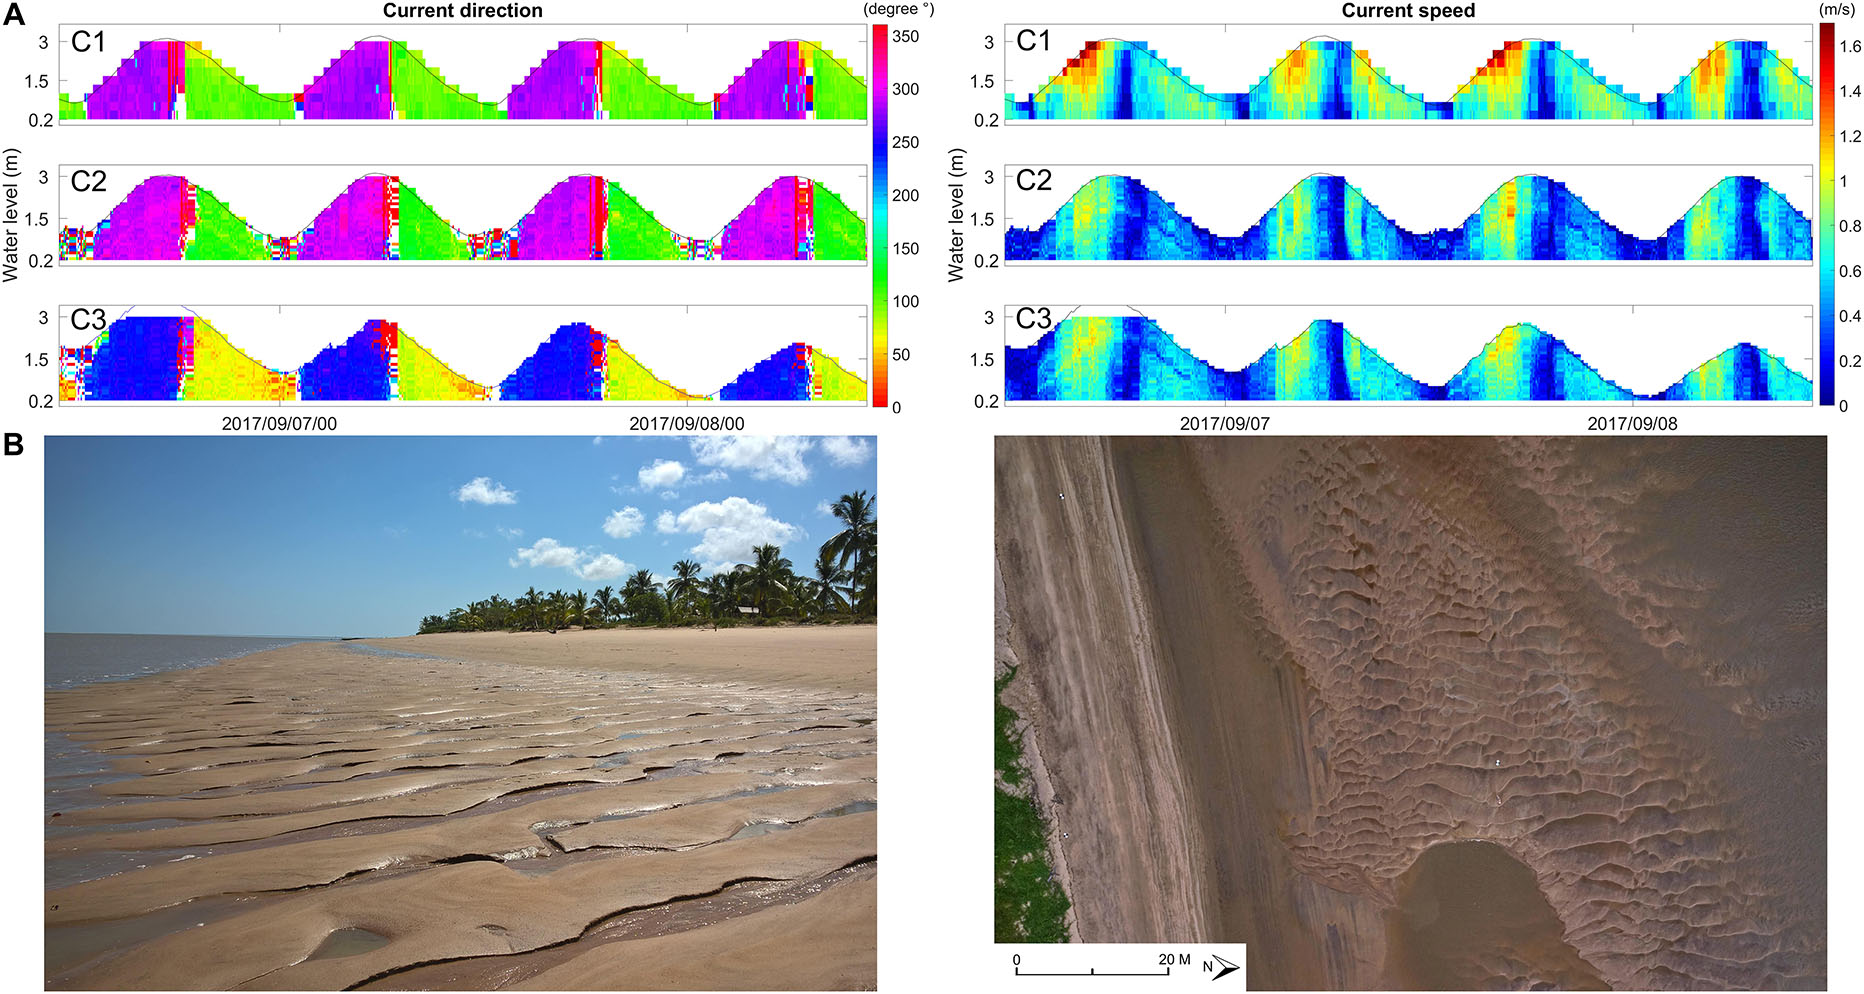
Figure 8. Currents measured near the beach (see Figure 2) over several tidal cycles (A) and photographs of bedforms (2D to 3D dunes) on the shoreface adjacent to the beach (B).
The comparison of the DEMs shows that mild erosion has prevailed near the estuarine channel, although parts of the shoreface mud bank also exhibit lowering between 10/2017 and 04/2018 (Figure 7B). Overall, the innermost muddy shoreface in contact with the beach in its eastern part exhibits stability or mild accretion.
The currents measured during the survey are shown in Figure 8A. The largest current speeds were measured at C1. Directions were clearly bidirectional and controlled by the tide. Speeds were high, attaining a peak of 1.7 m/s in the upper part of the water column but systematically before high water, whereas the lowest speeds (0.2–0.7 m/s) occurred at high and low water. Currents flowed toward the northwest (300–275°) during the flood and to south-southeast (100–150°) during the ebb. C2 showed similar directions but speeds were less. C3 was dominated by currents flowing toward west-northwest (250°) during the flood, and east-northeast (60°) during the ebb.
Short-Term Beach Morphodynamics and Sediment Budget
There is a marked difference in wave heights and periods between the offshore wave characteristics and the data recorded by the pressure sensors inshore (Figure 9). The largest Hs values (Figure 9A1) in winter (December to March) may correspond to northern hemisphere winter storms with relatively long-period waves (>12 s). Much of the spectrum corresponds to trade-wind waves with periods of 5 to 12 s (Figure 9A2).
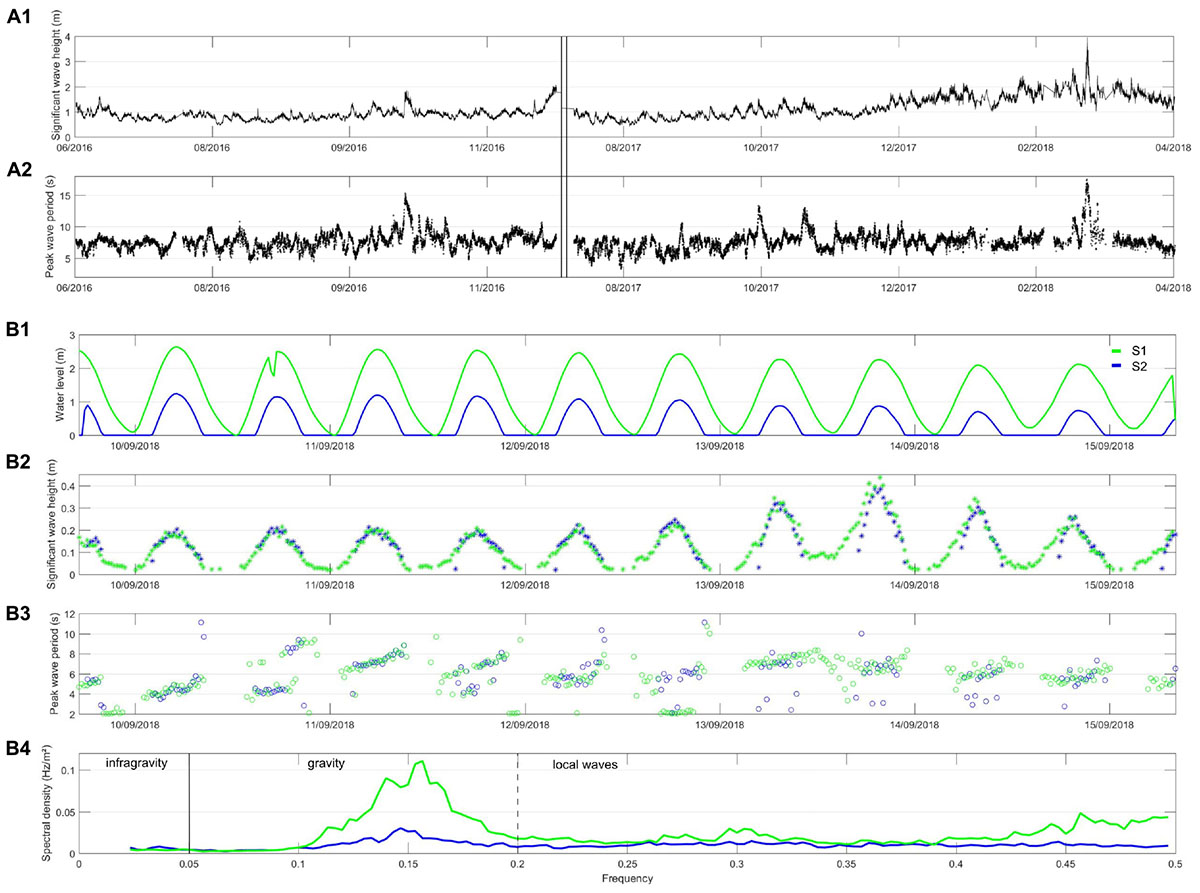
Figure 9. Hydrodynamic conditions during the course of the field experiments. From top to bottom: offshore significant wave heights (A1) and periods (A2) measured by the CANDHIS buoy offshore of Cayenne (see Figure 1A); water levels measured by the pressures sensors (B1); inshore wave heights (B2) and periods (B3) measured by the pressure sensors (see Figure 2); and examples of bursts of wave energy spectral density (B4).
Inshore wave heights recorded during the field experiments in September 2018 were much lower, <0.25 m, and only exceeded 0.45 m (Figure 9B2) in the course of one semi-diurnal tide (Figure 9B1). The 2018 experiment showed wave periods (6–12 s) characteristic of the trade-wind wave regime, in addition to locally generated wind waves. The energy spectrum shows a dominant gravity component (Figure 9B4).
The DoDs constructed from the photogrammetric data are shown in Figure 10A, together with the corresponding sediment budget changes, which highlight net sand loss over the 8 month survey period. The three maps show overall beach sand loss in the March–June 2017 DoD, almost completely mirrored by accretion in the following June–September DoD, and a more alongshore variable pattern in the September–November 2018 DoD (Figure 10A). The latter shows a clear accretion in the eastern half of the beach where erosion had prevailed over the period 2011–2017 (Figure 4B2), accretion along much of the rest of the beach, but loss on the upper beach. This variability is also evinced by the beach profiles depicted in Figure 10B. They show a relatively steep beach, characterized by an upper beach scarp. Profile sediment loss between March and June 2018 had been partially recovered by November 2018, except for the central profile P5. Profile P2, linking the beach and the shore-attached shoal, showed significant mobility.
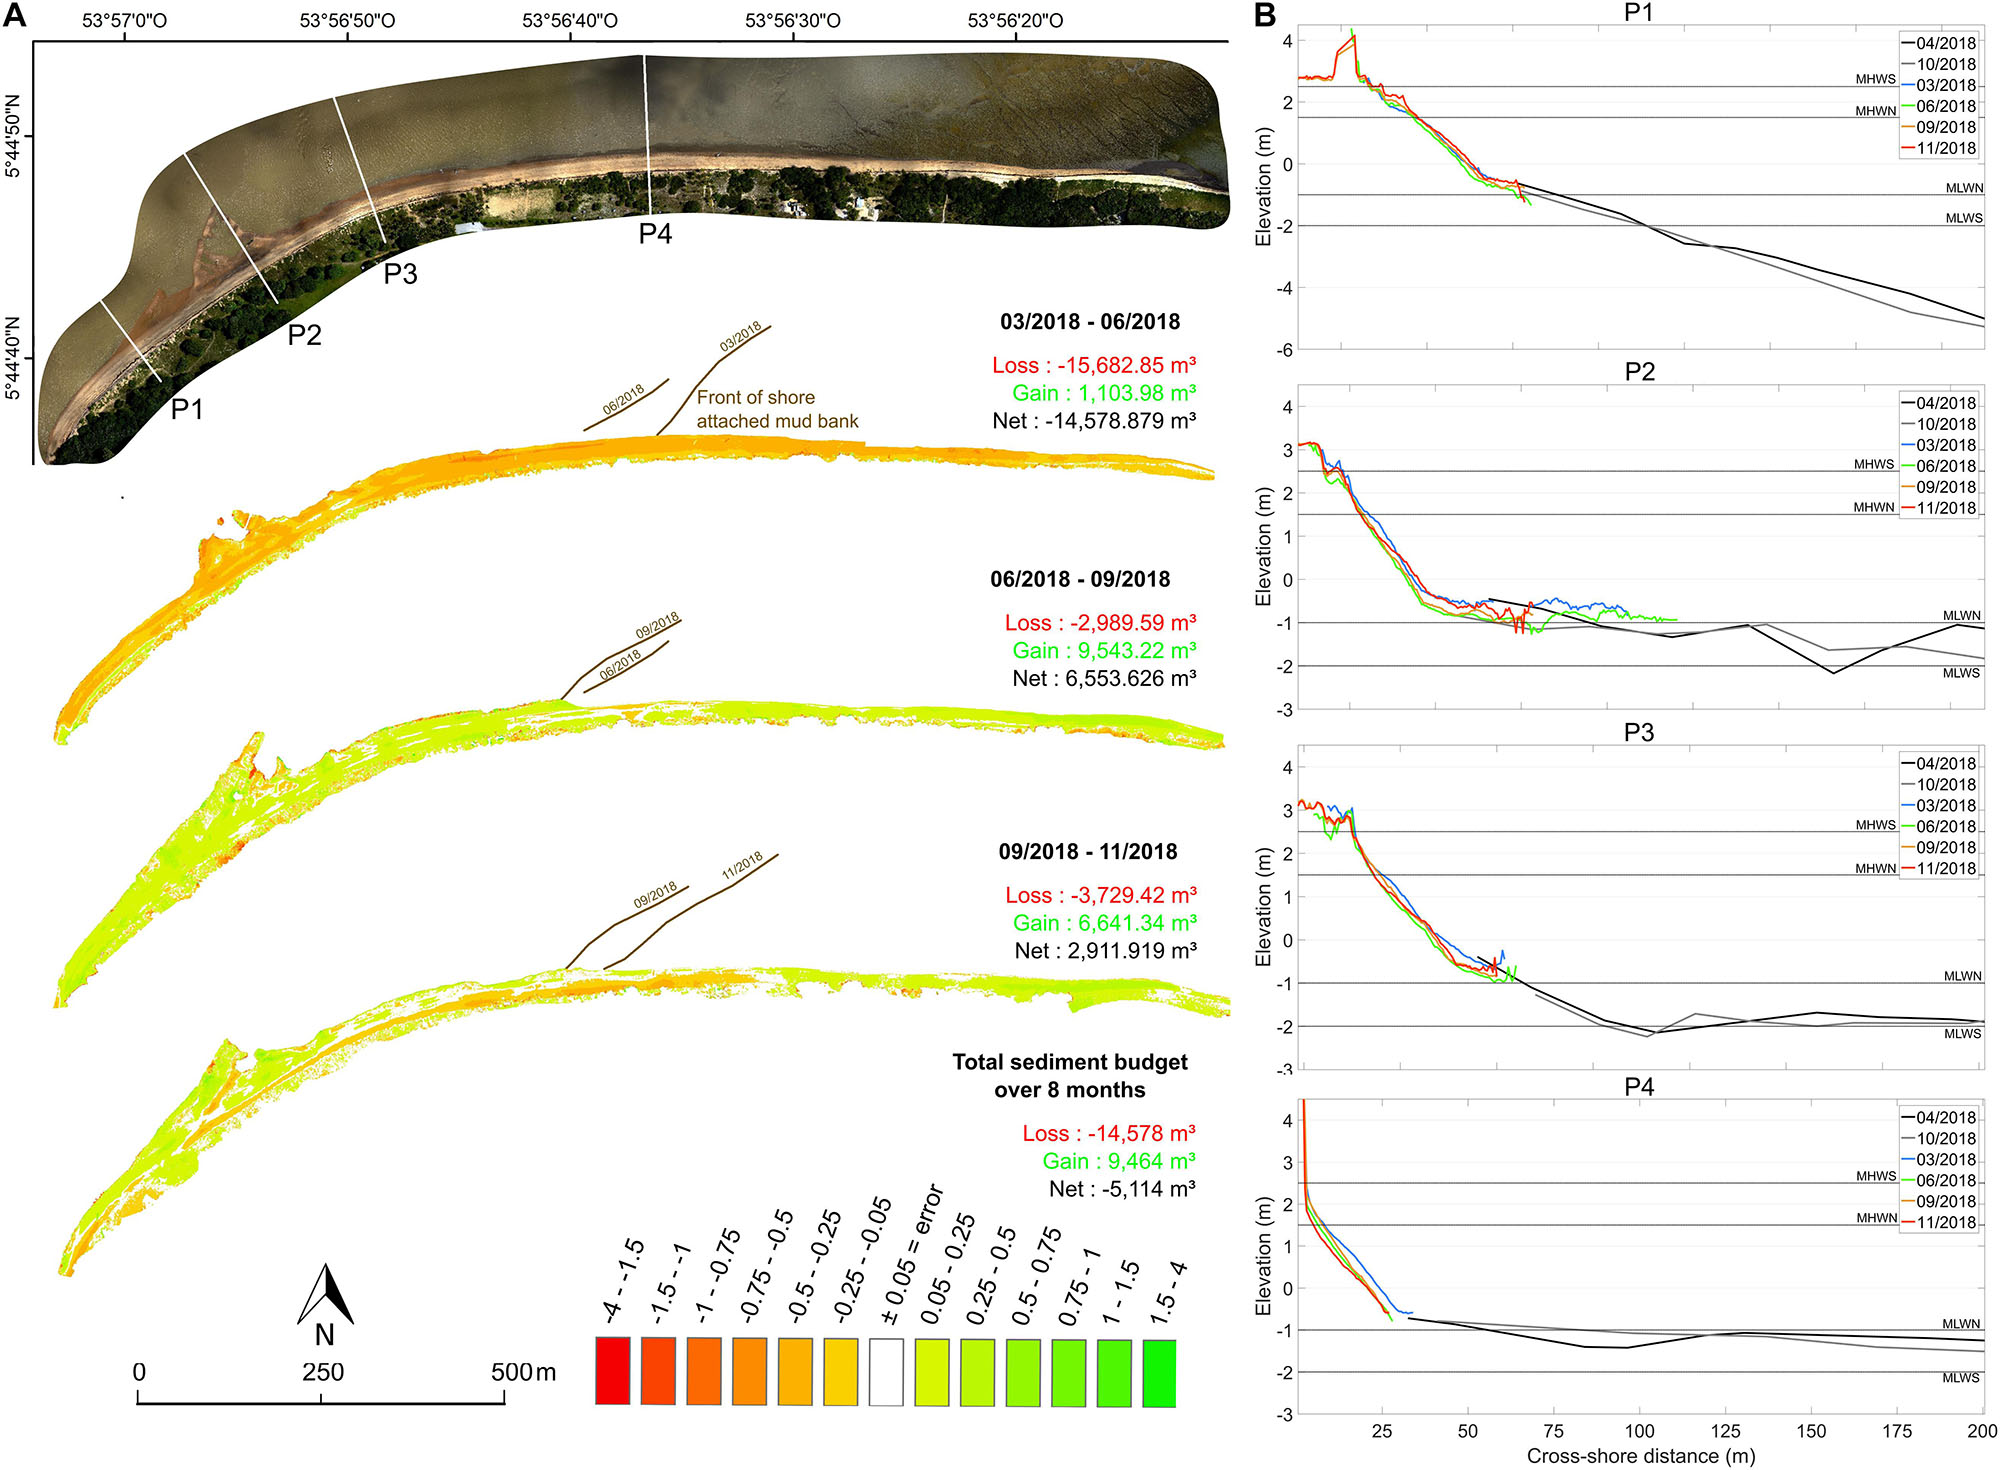
Figure 10. High-density orthophotograph assemblage (March 2018) and three DoDs of the beach obtained from SfM photogrammetry in 2018, together with net budget estimations (A), and examples of beach and shoreface profiles (B).
Discussion
Beaches flanking river mouths are commonly an outgrowth of accumulation of bedload that leads to river channel infill through both lateral accretion of the channel margins and vertical sedimentation (Anthony, 2009). Lateral accretion commonly forms tidal flats that may constitute a low-tide terrace generally flanked by estuarine beaches (e.g., Nordstrom, 1992; Jackson et al., 2002). The west bank of the Maroni River (Suriname) shows a much more prograded chenier plain than the east bank (French Guiana) on which is located the beach studied here. This difference in chenier plain growth in the vicinity of the mouth of the Maroni (Figure 1B) highlights the westward transport of sandy sediments from this river (and others) consistent with the regional wave forcing from the north to northeast quadrant (Anthony et al., 2019; Gardel et al., 2019). It also highlights the limited supply of sand from the former diverted estuarine reach of the neighboring Mana River (Figure 1B). The Maroni river-mouth east-bank beach does not seem to be an outgrowth of the advanced estuarine infill of the Maroni estuary (Figure 6) but is part of an old chenier shoreline associated with the Mana River, which now exits several kilometers to the east of the Maroni (Figure 1B). This is attested by relatively old (>2000 years B.P.) optically stimulated luminescence ages obtained about 200 m behind the present beach (Brunier et al., 2019). The distribution of the chenier ages and the presence of Pre-Columbian settlements in Yalimapo (Gérard Collomb, pers.com, June 2019) suggest relative stability of the beach over a long timescale. The short-term (2018 field surveys) also show a fluctuating pattern of accretion and erosion (Figures 7, 10), although the net negative sediment budgets are consistent with the recent prevailing erosional trend (2011–2017). The two points that can be drawn from this are: (1) the extent to which both the meso-scale and short-term patterns of evolution of the beach are controlled by the template set by mud banks impinging on the Maroni estuary, and (2) the mechanisms that regulate beach adjustment to this template. The implications of the recent eastward shift of the Mana outlet will be discussed later.
The multi-decadal mobility of the beach showed relatively large variability between 1955 and 1999, followed by more muted changes since. The large variability between 1955 and 1999 mirrored significant shoreline changes east of Yalimapo associated with the almost total demise of Pointe Isère (Figure 11), the large mud cape that had diverted the Mana River westwards up to 2011, and since at least the 19th Century (Plaziat and Augustinus, 2004). This erosion included pulses of reworking of inland cheniers behind Pointe Isère between 1972, 1979, and 2001–2011 (Jolivet et al., 2019), as the muddy cape was progressively eroded, and some of the reworked sand from Pointe Isère transported toward the mouth of the Maroni River (Figure 11B). It is interesting to note that erosion has been prevalent over much of the beach in the last few years (2011–2017, Figure 4B2), and in 2018 (Figure 10), generating anxiety regarding loss of land, threats to beach tourism, and diminishing space for nesting marine turtles in Yalimapo. However, given the large past shoreline mobility, prediction of the time frame over which erosion will prevail is hazardous. The reasons for the current prevalent erosion likely reside in modifications of alongshore sand transport on the beach generated by impingement of the mud bank on the eastern part of the beach (Figures 4B2, 6, 10, 11C). This is an outgrowth of the multi-decadal demise of Pointe Isère. Jolivet et al. (2019) documented the sealing of the former mouth of the Mana and the marked eastward shift of the present mouth of the river as a result of the shore-attachment of the bank east of Yalimapo, thus depriving the beach of potential sand supply by this river. These mesoscale changes reflect the utility of adopting a more regional, large-scale (big picture) approach in order to better elucidate local shoreline change.
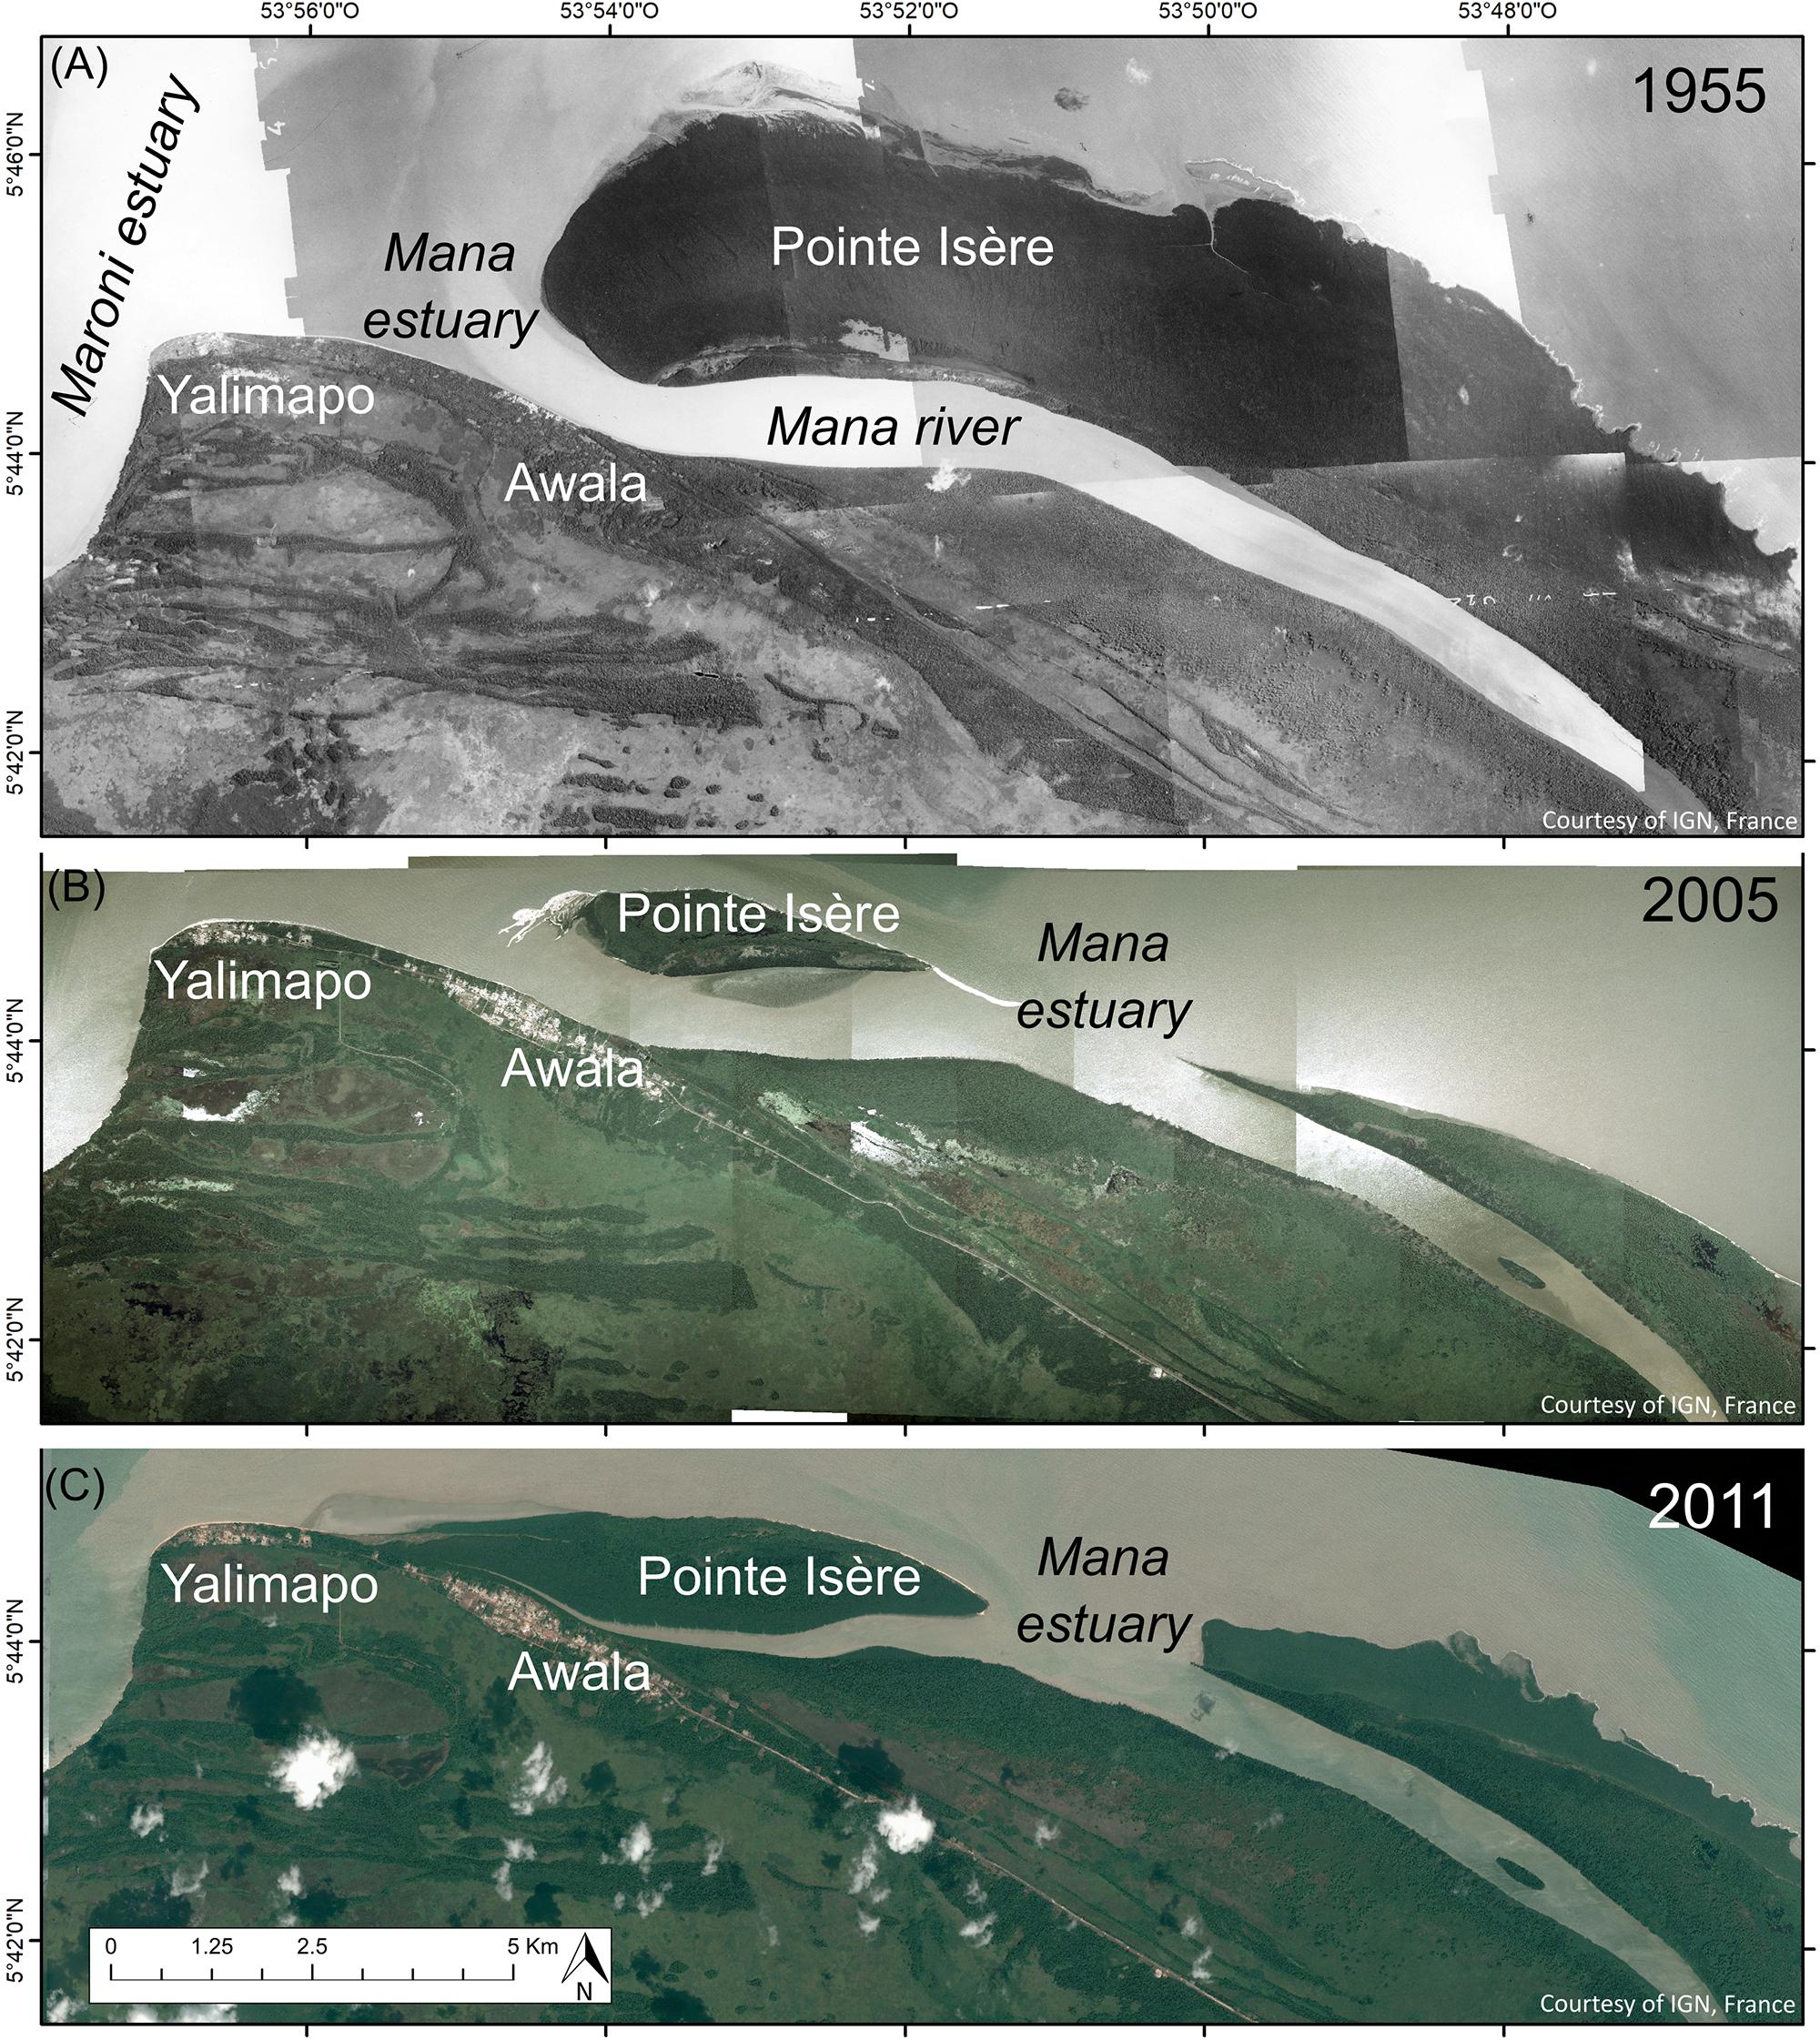
Figure 11. Rapid shoreline changes associated with erosion of much of the mud cape of Pointe Isère between 1955 and 2005 (A,B) and closure of the former mouth of the Mana River between Awala and Yalimapo by shore-welded mangrove-colonized mud that has isolated the beach at Awala from the sea (C).
Overall shoreline change has been most important in the zone where the east bank of the Maroni estuary joins the beach, between transects 75 and 220 (Figure 4). A likely explanation for this local variability is that of mobility of the main Maroni estuarine channel in adjustment to pervasive mud supply and attendant changes in hydrodynamics induced by mud banks. This is reflected in the extremely high turbidity values within the channel resulting from the impingement of the present large mud bank (Sottolichio et al., 2018). Transects 0 to 200 correspond to the most constricted part of the estuary and where the main Maroni estuarine channel is in direct contact with the intertidal beach (Figure 7). In addition to (or as a result of) this channel proximity, much of the shoreline mobility in this sector has been engendered by the migration of the beach-attached shoal identified from both ground and aerial photographs (not shown here). The formation of this shoal was probably initially due to expansion of the fluvial-tidal hydraulic jet of the Maroni with widening of the estuary where the beach changes its orientation to eastward, to form part of the south bank of the hitherto diverted Mana River (Figure 1B). Sand shoal formation of this type is akin to that of a flying spit (Zenkovich, 1967), or a banner bank (Dyer and Huntley, 1999), although the latter type of bank is generally associated with headlands.
The short-term data further highlight this mesoscale variability and show the seasonal cut-and-fill signature typical of the trade wind-wave-influenced French Guiana beaches during inter-bank phases (Dolique and Anthony, 2005), when mud banks do not affect the coast, or of many other tropical beaches with a well-defined seasonal trade-wind or monsoon wave regime (e.g., Tamura et al., 2010; Pereira et al., 2016; Anthony et al., 2017; Arrifin et al., 2018). The beach underwent significant sand loss (Figure 10; −14,579 m3) in response to the high waves that prevailed between March and June 2018 (Figure 9A). Filtering of wave energy does occur, as shown by the pronounced difference between, on the one hand, both the modeled offshore wave data provided by the WWIII model (Figure 2) and the CANDHIS buoy data (Figure 9A), and, on the other, data recorded by the pressure sensors near the beach (Figure 9B). Filtering is caused by the mud banks migrating alongshore but also by the large estuarine sand bank that is infilling the mouth of the Maroni. This filtering effect is proportional to wave energy, and large waves succeed in impacting the beach, as seen from field observations, especially during large spring tides. The high waves between March and June 2018 (Figures 2, 9A) also included equinoctial spring tides during which high-tide dissipation was less. The estuarine sheltering effect from exposure to waves, which commonly results in short-fetch waves, is an overarching influence of estuaries on beach morphodynamics (Jackson et al., 2002).
Wave measurements conducted on other beaches in the Guianas both in the vicinity of river mouths and well away from these river mouths show that incident wave energy is strongly modulated temporally and alongshore by the presence of banks (low waves) or their absence (high waves associated with inter-bank phases), resulting in large short- to mesoscale (>decade) shoreline mobility (Anthony et al., 2002). It is not clear from the available data whether this meso-scale wave variability has also been the case on the beach at Yalimapo but the commonality of this pattern on various other beaches in the Guianas suggests this likelihood, which is also reflected in the multi-decadal variability in beach mobility.
As shown in Figure 10, short-term beach morphological change has been quite variable notwithstanding the ambient low wave-energy context, possibly reflecting a further influence of: (1) progressive impingement on the eastern part of the beach, of shore-attached mud (Figure 10A), (2) sand exchanges between the estuarine bank and the beach, notably in the shore-attached shoal area (Profile P2, Figure 10B), and (3) antecedent beach profile characteristics in feeding back on morphological change. Estuarine beaches are commonly characterized by a relatively wide low gradient terrace, or “low tide terrace,” across which sediment mobilization may occur under relatively high energy (wave) conditions (Jackson et al., 2002). These beaches also commonly exhibit the following features: (1) longshore and transverse bars and biogenic features; (2) swash bars; (3) vegetation and wrack accumulations on the intertidal foreshore; (4) pebbles and/or shells; and (5) small aeolian dunes.
On the Maroni mouth beach, the low-tide terrace corresponds to the adjoining estuarine sand bank (transects 175–500) but the features and patterns of sediment mobilization prevailing on this beach do not correspond to those enumerated above. Low wind speeds, high ambient humidity, and rapid growth and spread of creeping grasses on the backshore considerably limit aeolian activity on the beaches of the Guianas (Anthony et al., 2014). The sediment mobility on the beach is regulated by strong alongshore tidal currents (Figure 8A) that generate important tidal bedforms, notably the 2D–3D hydraulic dunes (Figure 8B). The beach, which is also devoid of aeolian activity, clearly interacts with the strong tidal currents which are typically of a standing tide (notably at C1), and with these bedforms, especially in the shoal-attached area. The high current speeds during the rising tide associated with such a standing tide act not only on the bedforms of the shallow shoreface but also on the adjacent beach face. The estuarine sand bank serves as both a sand source and sink, resulting in the pulses of accretion and erosion evinced by the beach, which were further modulated, up to 2011, by limited sand supply by the Mana River. This relationship is, thus, mediated by the energetic tidal currents and by dissipation of waves over the terrace. Jackson and Nordstrom (1992) showed that under the extremely dissipative conditions prevailing on the low-tide terrace, beach profile change becomes restricted to the steep foreshore. This appears to be the case in the study area where the upper beach tends to show a scarped reflective profile (Figure 10B).
Tidal modulation of waves has been shown to be an important component of the hydrodynamics of Guiana beaches, generated by ambient permanent shoreface mud during both bank and inter-bank phases (Anthony et al., 2019). Field measurements at Yalimapo clearly highlight this tidal modulation and show that high-tide waves are generated by a mix of both trade-wind waves (6–12 s) and short-fetch local sea breezes that generate choppy conditions with periods that do not exceed 5 s (Figure 9). Field observations further show that waves are only active on the upper beach, resulting in local high-tide scarping (Figure 10B). Spring tides no doubt reinforce the high-tide scarping and low-tide dissipation. Under these erosive conditions, downslope transfer of beach sand to the estuarine sand bank is assured by the prevalence of steep reflective beach profiles, which function in a positive short-term morphodynamic feedback loop that maintains profile steepness and recession seen in the short-term (2018) data of parts of the beach (Figure 10B).
The timescales and relationships involved in the multi-decadal evolution and short-term morphodynamics of the beach at Yalimapo, French Guiana, are conceptualized in Figure 12. The net westward sediment transport system and influence of bank and inter-bank alternations that affect the Guianas coast at a regional scale affect the beach and the dynamics of the mouth of the Maroni River. The latter further influences variations in beach morphology and stability through estuarine channel mobility, dissipation of waves by the large estuarine sand sink that is infilling this river mouth, and tidal currents and bedforms.
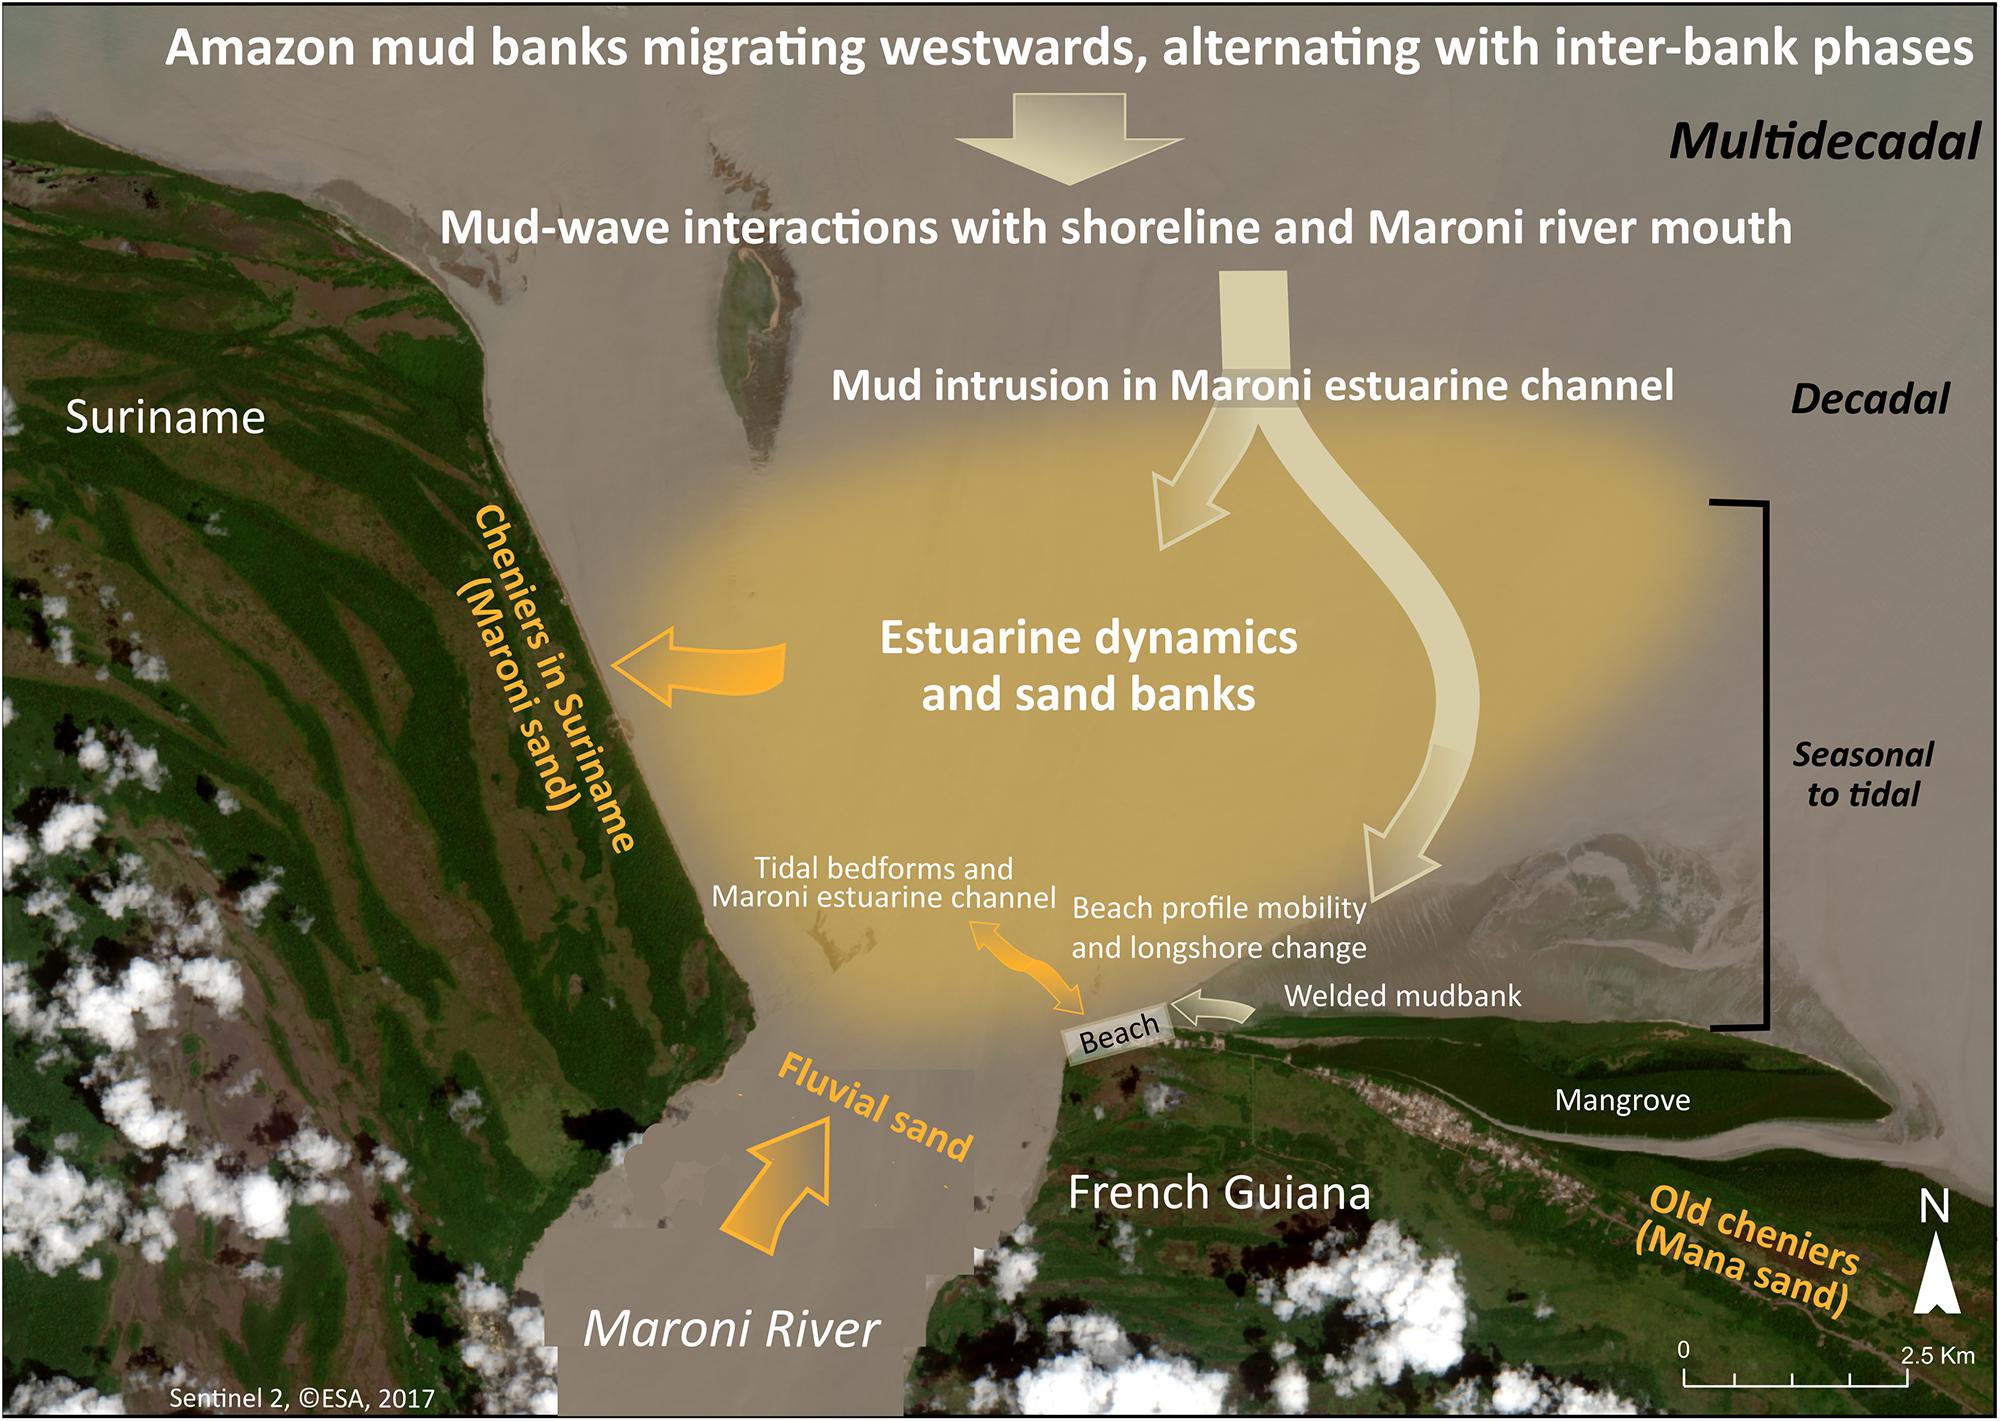
Figure 12. Conceptual model of multi-decadal to short-term changes at Yalimapo beach, French Guiana. The morphology and dynamics of the beach are influenced, at embedded spatial (regional to local) and temporal (multi-decadal to daily) timescales, by the relationship and interactions among various sediment bodies and forces. These are the regional mud banks migrating under wave and wind influence at > decadal to multi-decadal timescales westward from the Amazon to the Orinoco, wave dissipation by these banks and by the large estuarine sand bank infilling the mouth of the Maroni River, and at a timescale of several years, mud intrusion into the mouth of the Maroni and local welding of mud released by the banks onto the beach. Seasonal modulation of wave activity, the local influence of the main Maroni estuarine channel, strong tidal currents on the inner shoreface adjacent to the beach, and sand exchanges, at fortnightly tidal to semi-daily scales between beach and inner-shoreface tidal bedforms, are reflected in beach profile and alongshore mobility at the local scale.
It is important to note that the erosion that has prevailed along much of the beach in the last few years (2011–2017, Figure 4B2), and in 2018 (Figure 10) is having deleterious ecological and sociological effects in the coastal settlements of Awala and Yalimapo (Figure 1) (population in 2018: 1400). The beach was, up to the 1990s, one of the most important turtle-nesting sites on the South American coast, and as the available beach space has receded due to mud encroachment, the number of turtle landings has diminished drastically (Peron, 2014). The villages are inhabited by indigenous Kali’na populations that became sedentary in the late 1940s. Risks posed by shoreline mobility in the Guianas prior to this sedentary lifestyle were accommodated by population mobility to safer areas. Present fears in reaction to the on-going coastal changes concern loss of land, large-scale mangrove development, threats to beach recreation, and to revenue from tourism related to nesting marine turtles. Prior to encroachment of the bank that has welded onshore, Awala had access to the sandy beach and benefited, like Yalimapo, from the advantages of beach-related recreation and tourism. This has been the only accessible sandy beach in western coastal French Guiana (total population in 2018: 60,000), an area of very rapid demographic growth. Much of this tourism is related to turtle-watching during the nesting season. The now completely mud-bound beach of Awala implies that the village is presently totally deprived of revenue from tourism, and direct access to the sea for fishermen has been shut off by a wide mangrove front (Figure 5A). The decrease in the number of turtle landings is also depriving neighboring Yalimapo (Figure 5A), now the only available beach spot in western French Guiana, of much-needed tourist revenue. Given the large past shoreline mobility, prediction of the time frame over which erosion will continue to prevail is hazardous.
Conclusion
The multi-decadal evolution and short-term morphodynamics of the beach at Yalimapo, French Guiana, illustrate the influence of the dynamics of the mouth of the Maroni River at the local scale, and the net westward sediment transport system and influence of bank and inter-bank alternations that affect the Guianas coast at a regional scale. The influence of the Maroni is reflected in variations in beach morphology and stability induced by channel dynamics, tidal currents and bedforms, and dissipation of waves by the large estuarine sand sink that is infilling this river mouth. The bank and inter-bank fluctuations have determined multi-decadal beach mobility through their influence on the wave regime and in mediating sand supply alongshore. These two scales of analysis show how local changes are embedded in, and overprinted by, the pervasive influence of changing mud-bank and inter-bank phases alongshore, a hallmark of the 1500 km-long Guianas shoreline. Changes resulting from these controls include complete isolation of the village of Awala from the sea by mangrove-colonized mud, disastrous for tourism, fishing activities in terms of access to the sea, and to beach recreation. The shortening of the beach as a result of mud encroachment now poses a threat to the village of Yalimapo, the only site in western French Guiana with a still available sandy beach. Reduction of the available beach space is having negative ecological and socio-economic consequences. This reduction is detrimental to turtle-landings on the beach for nesting, the number of which has diminished dramatically over the last decade, and to the income generated by beach tourism geared toward watching turtles nest. It is also nefarious to beach recreation and to fishing.
Data Availability
All datasets generated for this study are included in the manuscript/Supplementary Files.
Author Contributions
MJ, EA, and AG designed the project, conducted the field work, analyzed the data, and wrote the manuscript. GB participated in the field work and data analyses.
Funding
We acknowledge financial support from the European Regional Development Fund for the project OYAMAR. Additional funding was provided within the framework of the projects GUIABEACH, GUIACHENIER, MORPHOMAR, and DYALOG supported by the “Pépinière Interdisciplinaire de Guyane” of the CNRS.
Conflict of Interest Statement
The authors declare that the research was conducted in the absence of any commercial or financial relationships that could be construed as a potential conflict of interest.
Acknowledgments
The Direction de l’Environnement, de l’Aménagement et du Logement (DEAL Guyane) provided access to the CANDHIS offshore wave data. Aerial photographs were provided free of charge by the IGN (French National Institute for Geographic and Forest Information), and downloaded from the website https://remonterletemps.ign.fr/. PLEIADE and SPOT 6/7 images were provided by CNES (distribution Spot Image S.A.). We thank Tanguy Maury and Sylvain Morvan for help during the field work. This is a contribution from the National Observation Service DYNALIT site of Awala-Yalimapo in western French Guiana, and from the French GDR LIGA researcher network. We thank the two reviewers for their constructive suggestions for improvement. MJ acknowledges a Ph.D. grant from the Université de Guyane.
Supplementary Material
The Supplementary Material for this article can be found online at: https://www.frontiersin.org/articles/10.3389/feart.2019.00187/full#supplementary-material
TABLE S1 | Inventory of aerial photographs and satellite images used in the study.
TABLE S2 | Summary of items concerned by the four photogrammetric surveys.
Footnotes
References
Abascal Zorrilla, N. (2019). Dynamics of the Amazonian mud Bank System Through Spatial Observation and Hydro-Sedimentary Modeling: Application to the Coastal Domain of French Guiana. Ph.D thesis, Université de Guyane, Cayenne, French Guiana.
Abascal Zorrilla, N., Gensac, E., Vantrepotte, V., Huybrechts, N., and Gardel, A. (2018). Interest of Landsat8-OLI derived SPM maps for monitoring the subtidal extension of Amazonian mud banks (French Guiana). Remote Sens. 10:1733. doi: 10.3390/rs10111733
Anthony, E. J. (2009). Shore Processes and Their Palaeoenvironmental Applications. Developments in Marine Geology. Amsterdam: Elsevier Science.
Anthony, E. J., Brunier, G., Gardel, A., and Hiwat, M. (2019). Chenier morphodynamics and degradation on the amazon-influenced coast of Suriname, South America: implications for beach ecosystem services. Front. Earth Sci. 7:35. doi: 10.3389/feart.2019.00035
Anthony, E. J., Dussouillez, P., Dolique, F., Besset, M., Brunier, G., Nguyen, V. L., et al. (2017). Morphodynamics of an eroding beach and foredune in the mekong river delta: implications for deltaic shoreline change. Cont. Shelf Res. 147, 155–164. doi: 10.1016/j.csr.2017.06.018
Anthony, E. J., Gardel, A., Dolique, F., and Guiral, D. (2002). Short-term changes in the plan shape of a sandy beach in response to sheltering by a nearshore mud bank, Cayenne, French Guiana. Earth Surface Process. Landforms 27, 857–866. doi: 10.1002/esp.357/full
Anthony, E. J., Gardel, A., and Gratiot, N. (2014). Fluvial sediment supply, mud banks, cheniers and the morphodynamics of the coast of South America between the Amazon and Orinoco river mouths. Geol. Soc. 388, 533–560. doi: 10.1144/sp388.8
Anthony, E. J., Gardel, A., Gratiot, N., Proisy, C., Allison, M. A., Dolique, F., et al. (2010). The amazon-influenced muddy coast of south america: a review of mud bank-shoreline. Earth Sci. Rev. 103, 99–121. doi: 10.1016/j.earscirev.2010.09.008
Anthony, E. J., Gardel, A., Proisy, C., Fromard, F., Gensac, E., Peron, C., et al. (2013). The role of fluvial sediment supply and river-mouth hydrology in the dynamics of the muddy, Amazon-dominated Amapá–Guianas coast, South America: a three-point research agenda. J. South Am. Earth Sci. 44, 18–24. doi: 10.1016/j.jsames.2012.06.005
Arrifin, E. H., Sedrati, M., Akhir, M. F., Daud, N. R., Yaacob, R., and Husain, M. L. (2018). Beach morphodynamics and evolution of monsoon-dominated coasts in kuala terengganu, malaysia: perspectives for integrated management. Ocean Coast. Manag. 63, 498–514. doi: 10.1016/j.ocecoaman.2018.07.013
Ashley, G. M. (1990). Classification of large-scale subaqueous bedforms; a new look at an old problem. J. Sediment. Res. 60, 160–172.
Augustinus, P. G. E. F. (1978). The Changing Shoreline of Surinam (South America). Ph.D. thesis, University of Utrecht, Utrecht.
Augustinus, P. G. E. F., Hazeloff, L., and Kroon, A. (1989). The chenier coast of Suriname: modern and geological development. Mar. Geol. 90, 269–281. doi: 10.1016/0025-3227(89)90129-1
Brunier, G., Tamura, T., Anthony, E. J., Gardel, A., Dussouillez, P., Todisco, D., et al. (2019). “OSL chronology of sandy cheniers in French Guiana,” in Proceedings of the 1st Latin American Physics of Estuaries and Coastal Oceans Conference – LAPECO, Florianopilis.
Dolique, F., and Anthony, E. J. (2005). Short-term profile changes of sandy pocket beaches affected by Amazon-derived mud, Cayenne, French Guiana. J. Coast. Res. 21, 1195–1202. doi: 10.2112/04-0297.1
Dyer, K. R., and Huntley, I. A. (1999). The origin, classification and modelling of sand banks and ridges. Cont. Shelf Res. 19, 1285–1330. doi: 10.1016/s0278-4343(99)00028-x
Gardel, A., Anthony, E. J., Jolivet, M., Huybrechts, N., Lesourd, N., Santos, V., et al. (2019). “Sediment fluxes in the Maroni River mouth, South America: interactions with mud banks and adjacent coasts,” in Proceedings of the 1st Latin American Physics of Estuaries and Coastal Oceans Conference – LAPECO, Florianopilis.
Hutchinson, M. F., Xu, T., and Stein, J. A. (2011). “Recent progress in the ANUDEM elevation gridding procedure,” in Geomorphometry 2011, eds T. Hengel, I. S. Evans, J. P. Wilson, and M. Gould (Redlands, CA: International Society for Geomorphometry), 19–22.
Jackson, N. F., Nordstrom, K. F., Eliot, I., and Masselink, G. (2002). ‘Low energy’ sandy beaches in marine and estuarine environments: a review. Geomorphology 48, 147–162. doi: 10.1016/s0169-555x(02)00179-4
Jackson, N. L., and Nordstrom, K. F. (1992). Site-specific controls on wind and wave processes and beach mobility on estuarine beaches. J. Coast. Res. 8, 88–98.
Jolivet, M., Gardel, A., and Anthony, E. J. (2019). Multi-decadal changes on the mud-dominated coast of western French Guiana: implications for mesoscale shoreline mobility, river-mouth deflection, and sediment sorting. J. Coast. Res. 82, (in press).
Otvos, E. G. (2018). “Cheniers,” in Encyclopaedia of Coastal Science, eds C. Finkl and C. Makowski (Cham: Springer), doi: 10.1007/978-3-319-48657-4_67-5
Pereira, L. C. C., Vila-Concejo, A., and Short, A. D. (2016). “Coastal morphodynamics processes on the macro-tidal beaches of Pará state under tidally-modulated wave conditions,” in Brazilian Beach Systems, eds A. D. Short and A. H. F. Klein (Cham: Springer), 95–124. doi: 10.1007/978-3-319-30394-9_1
Peron, C. (2014). Dynamique Littorale et Comportement de ponte des tortues marines en Guyane française. Ph.D thesis, Université du Littoral Côte d’Opale, Dunkerque.
Plaziat, J. C., and Augustinus, P. G. E. F. (2004). Evolution of progradation/erosion along the French Guiana mangrove coast: a comparison of mapped shorelines since the 18th century with Holocene data. Mar. Geol. 208, 127–143. doi: 10.1016/j.margeo.2004.04.006
Prost, M. T. (1989). Coastal dynamics and chenier sands in French Guiana. Mar. Geol. 90, 259–267. doi: 10.1016/0025-3227(89)90128-X
Pujos, M., Pons, J. C., and Parra, M. (2000). Les minéraux lourds des sables du littoral de la Guyane française : bilan sur l’origine des dépôts de la plate-forme des Guyanes. Oceanol. Acta 24, S27–S35.
Sottolichio, A., Gardel, A., Huybrechts, N., Maury, T., Morvan, S., and Lesourd, S. (2018). “Patterns of circulation and fine sediment dynamics in a tropical estuary under Amazon influence (Maroni Estuary, French Guyana),” in Proceedings of the PECS 2018 Physics of Estuaries and Coastal Seas Meeting 2018, Galveston, TX.
Tamura, T., Horaguchi, K., Saito, Y., Nguyen, V. L., Tateishi, M., Ta, T. O. K., et al. (2010). Monsoon-influenced variations in morphology and sediment of a mesotidal beach on the Mekong River delta coast. Geomorphology 116, 11–23. doi: 10.1016/j.geomorph.2009.10.003
Thieler, R. E., Himmelstoss, E. A., Zichichi, J. L., and Ergul, A. (2017). The Digital Shoreline Analysis System (dsas) version 4.0: An Arcgis Extension for Calculating Shoreline Change. Reston, VA: U.S. Geological Survey.
Westoby, M. J., Brasington, J., Glasser, N. F., Hambrey, M. J., and Reynolds, J. M. (2012). ‘Structure-from-Motion’ photogrammetry: a low-cost, effective tool for geoscience applications. Geomorpholohy 179, 300–314. doi: 10.1016/j.geomorph.2012.08.021
Keywords: river mouth, estuarine beach, Amazon-Orinoco coast, mud bank, beach morphodynamics
Citation: Jolivet M, Anthony EJ, Gardel A and Brunier G (2019) Multi-Decadal to Short-Term Beach and Shoreline Mobility in a Complex River-Mouth Environment Affected by Mud From the Amazon. Front. Earth Sci. 7:187. doi: 10.3389/feart.2019.00187
Received: 21 May 2019; Accepted: 03 July 2019;
Published: 31 July 2019.
Edited by:
Derek W. T. Jackson, Ulster University, United KingdomReviewed by:
Rory Patrick Flood, Queen’s University Belfast, United KingdomChristopher John Hein, College of William & Mary, United States
Copyright © 2019 Jolivet, Anthony, Gardel and Brunier. This is an open-access article distributed under the terms of the Creative Commons Attribution License (CC BY). The use, distribution or reproduction in other forums is permitted, provided the original author(s) and the copyright owner(s) are credited and that the original publication in this journal is cited, in accordance with accepted academic practice. No use, distribution or reproduction is permitted which does not comply with these terms.
*Correspondence: Morgane Jolivet, bW9yZ2FuZS5qb2xpdmV0QGV0dS51bml2LWd1eWFuZS5mcg==