 Luke H. Marsden
 Jürgen W. Neuberg
 Mark E. Thomas
 Patricia A. Mothes
 Mario C. Ruiz
- 1School of Earth & Environment, The University of Leeds, Leeds, United Kingdom
- 2Instituto Geofisico, Escuela Politécnica Nacional, Quito, Ecuador
The understanding of magma ascent dynamics is essential in forecasting the scale, style and timing of volcanic eruptions. The monitoring of near-field deformation is widely used to gain insight into these dynamics, and has been linked to stress changes in the upper conduit. The ascent of magma through the conduit exerts shear stress on the conduit wall, pulling up the surrounding edifice, whilst overpressure in the upper conduit pushes the surrounding edifice outwards. How much shear stress and pressure is produced during magma ascent, and the relative contribution of each to the deformation, has until now only been explored conceptually. By combining flow and deformation modeling using COMSOL Multiphysics, we for the first time present a quantitative model that links magma ascent to deformation. We quantify how both shear stress and pressure vary spatially within a cylindrical conduit, and show that shear stress generally dominates observed changes in tilt close to the conduit. However, the relative contribution of pressure is not insignificant, and both pressure and shear stress must be considered when interpreting deformation data. We demonstrate that significant changes in tilt can be driven by changes in the driving pressure gradient or volatile content of the magma. The relative contribution of shear stress and pressure to the tilt varies considerably depending on these parameters. Our work provides insight into the range of elastic moduli that should be considered when modeling edifice-scale rock masses, and we show that even where the edifice is modeled as weak, shear stress generally dominates the near field deformation over pressurization of the conduit. While our model addresses cyclic tilt changes observed during activity at Tungurahua volcano, Ecuador, between 2013 and 2014, it is also applicable to silicic volcanoes in general.
1. Introduction
Being able to understand what drives temporal variations in seismicity and deformation at volcanoes is essential in interpreting how volcanic systems evolve through time. Tiltmeters are sensitive to deformation, and at basaltic volcanoes they have long since been used to infer pressure changes in a shallow magma reservoir (e.g., Hreinsdóttir et al., 2014). More recently at silicic volcanoes, tiltmeters deployed close to the summit of the volcano have been used to infer pressure variations in or surrounding a volcanic conduit. However, modeling of such deformation by realistic pressure variations often requires the source radius to far exceed that of the assumed conduit (e.g., Voight et al., 1999). Therefore, shear stress has been suggested in several studies as an alternative source of deformation (Beauducel et al., 2000; Green et al., 2006; Neuberg et al., 2018).
The ascent of highly viscous magma generates sustained shear traction at the conduit walls, which pulls up the surrounding edifice and causes deformation at the surface. It thereby provides an important link between ascent dynamics and deformation (Figure 1). Shear stress σs is a function of the ascent velocity v and viscosity η of the magma, such that
where is strain rate, which can be written as ∂v/∂r, the lateral gradient of the magma ascent velocity across the conduit (Neuberg et al., 2006). r is the horizontal distance from the center of the conduit. Therefore, if deformation is driven predominantly by a shear stress source, and the viscosity of the magma and the mechanical properties of the edifice are known, the amount of deformation can be used to estimate the ascent velocity of the magma, a vital parameter in forecasting eruption style.
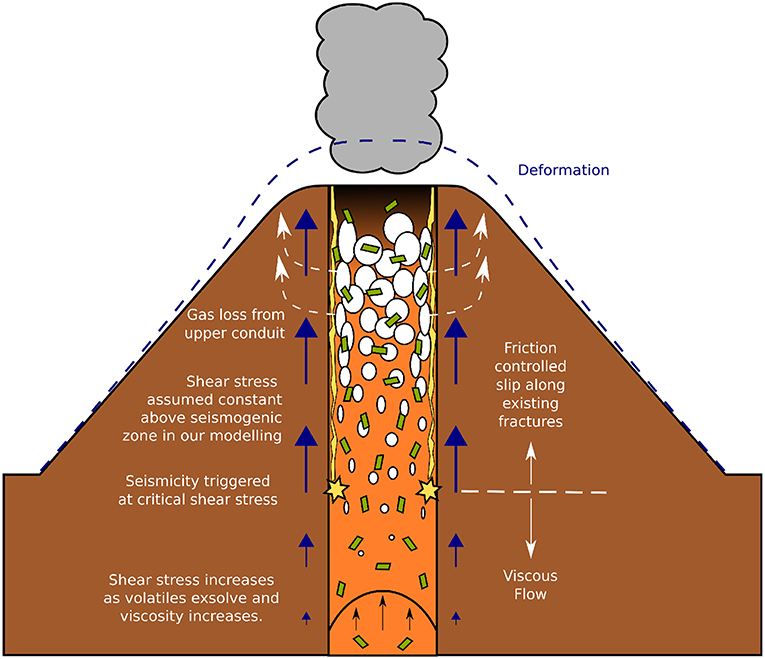
Figure 1. Schematic diagram illustrating how as magma ascends, shear stress is exerted on the conduit walls, inducing deformation. Shear fractures form where the shear stress reaches a critical threshold, triggering low frequency seismicity. Once formed, these fractures move up with the ascending magma, allowing friction controlled slip along them. The shear stress cannot exceed this critical threshold at which brittle failure is induced. The total shear stress is partitioned between low frequency seismicity and the deformation.
Where shear stress reaches a critical value, brittle failure of the melt occurs, triggering low frequency seismicity (Neuberg et al., 2006). Brittle failure occurs where the shear stress σs is greater than the shear strength of the magma, τm. Shear stress in the conduit cannot exceed the value at which magma fractures, hence the shear stress is limited by the shear strength at the depth that low frequency seismicity is observed.
There have been several attempts to conceptually link the shear stress or pressure necessary to achieve observed deformation as magma ascends. Green et al. (2006) showed that shear stress of 0.5 MPa in the upper 1 km of the conduit can explain tilt of 20 μrad at the tiltmeter at Chances Peak, Soufriére Hills volcano, whereas a pressure in excess of 40 MPa is required to model the same tilt using a realistic conduit radius. More recently, Neuberg et al. (2018) showed that shear stress of 20 MPa along a 4.5 km conduit can explain 480 μrad of tilt at the RETU tiltmeter at Tungurahua, whereas an overpressure of several hundreds of MPa would be required. However, the key question remains whether such stress levels are achieved and sustained in a volcanic conduit during ascent of magma, or how shear stress and pressure vary both spatially and temporally within a conduit as a result of various volcanic phenomena.
Through flow modeling, it is possible to simulate realistic magma ascent, where the governing parameters are based on results of several disciplines within volcanology. This allows us to quantify how both pressure and shear stress vary within a volcanic conduit. Thomas and Neuberg (2012) showed that variations in conduit geometry can significantly increase the shear stress locally to potentially induce seismicity through brittle failure of magma, and in further work (Thomas and Neuberg, 2014) identified volatile content and the driving pressure gradient as key parameters in modulating the ascent dynamics and therefore shear stress and pressure. Okumura and Kozono (2017) demonstrated that the transition from viscous flow to friction-controlled slip occurs at a greater depth if the crystal content is higher, as strain localizes in the melt phase where crystals are assumed rigid. However, there is a significant mismatch between the shear stress and pressure values obtained in these studies and the values required in modeling to explain the observed deformation. Shear stress on the order of MPa is only modeled in the uppermost section of the conduit if at all. This poses the question; can shear stress sufficient to explain observed deformation realistically be achieved during magma ascent?
Despite advances in both flow and deformation modeling, few studies have attempted to couple the two. One exception by Albino et al. (2011) demonstrated that the formation of a viscous plug can lead to a localized increase in shear stress in the upper part of the conduit, and induce near-field deformation. By using a simple step function to define the viscosity as a function of depth, due to the plug and underlying magma, they also obtained a step function for shear stress as a function of depth. In reality, the melt viscosity increases gradually as magma ascends and volatiles exsolve.
Moving on from these studies, we investigate whether observed deformation can be explained using realistic depth-dependent pressure and shear stress profiles, obtained through flow modeling. Here, we build upon the 3 phase, 2D axisymmetric flow models of Collier and Neuberg (2006) and Thomas and Neuberg (2014) to simulate more realistic conditions during ascent of magma through a cylindrical conduit. From this, we obtain depth-dependent pressure and shear stress profiles at the conduit-edifice boundary, which we use to drive our deformation modeling. In doing so, we for the first time provide a quantitative model that links magma ascent to observed deformation.
A reference conduit flow model is developed in section 2, with parameters based on Tungurahua volcano, Ecuador, where between July 2013 and June 2014, four Vulcanian explosions coincided with cyclic tilt variations of around 170 μrad, recorded at RETU (Figure 2), located 1 km vertically and 2 km laterally from the summit (Figure 3). Other tiltmeters deployed further down the flanks at Tungurahua are not sensitive to stress changes in or around the conduit (Neuberg et al., 2018). This striking correlation between the tilt and activity is seldom seen at volcanoes, as for logistical reasons tiltmeters are rarely deployed at such close proximity to the conduit at silicic volcanoes with considerable relief. However, even a single strategically deployed tiltmeter can be an invaluable addition to a monitoring network. A considerable decrease in tilt at RETU, alongside an increase in low frequency seismicity, was used to forecast that an eruption was imminent at Tungurahua 3 days prior to the Vulcanian explosion on February 1st, 2014 (Mothes et al., 2015). Supplementary Information regarding the flow model is included in the Supplementary Sections S1, S3, S4. In section 2.4, we present depth-dependent pressure and shear stress profiles extracted from our reference flow model, and use these to drive our deformation models in section 3. Finally, in section 4 we quantify how realistic changes in key parameters, such as the volatile content or driving pressure gradient, can influence pressure, shear stress and therefore tilt through time. We demonstrate how independently inferred processes, such as the gradual solidification of a viscous plug (Hall et al., 2015) or the injection of a volatile rich batch of magma at depth (Samaniego et al., 2011; Andújar et al., 2017), can explain both the amplitude and variations in tilt during the 2013–4 activity at Tungurahua. However, whilst we use observed data at Tungurahua to constrain the model, our findings provide important insight into the source of near-field deformation at silicic volcanoes in general.
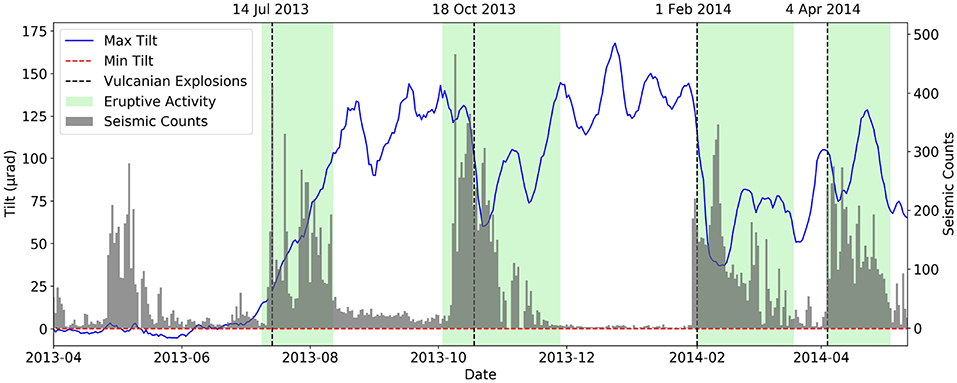
Figure 2. Daily averaged tilt (μrad) and long-period seismic event count recorded at RETU. Each marked period of eruptive activity includes a single Vulcanian explosion.
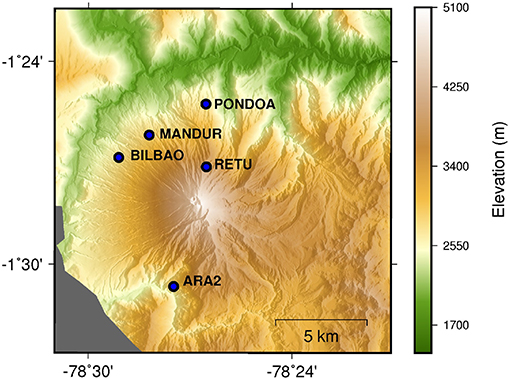
Figure 3. Elevation map showing the location of tiltmeters deployed at Tungurahua volcano (blue dots). Note that due to its proximity to the conduit, only RETU is sensitive to changes in stress in the conduit (Neuberg et al., 2018).
2. Flow Model Set-Up
The 2D axisymmetric flow modeling in this project builds upon the work of Collier and Neuberg (2006) and Thomas and Neuberg (2014), and is performed using the Laminar Flow Module in the finite element software COMSOL Multiphysics 5.3. 1D models have been used successfully to discern volcanic phenomena, such as lava dome extrusion (Melnik and Sparks, 1999) and plug formation (Diller et al., 2006). However, other authors have highlighted the importance of radial changes within conduit flow models (Llewellin and Manga, 2005; Collier and Neuberg, 2006), and quasi 2D models of Tsvetkova and Melnik (2018) have recently showed that the dependence of shear rate on viscosity and therefore ascent dynamics can be significant. The magma is considered a three-phase fluid comprising gas, crystals and melt. While the melt is treated as a Newtonian fluid, the magma viscosity is modulated by the gas and crystal content and strain rate. A cylindrical conduit is represented in 2D axial symmetric domain space as a rectangle, through which isothermal magma ascent is governed by the compressible form of the Navier-Stokes equation
and the continuity equation
where ρ is density, v is the velocity vector, P is pressure, η is the viscosity, F is a volume force vector, in this case gravity, and I is the identity tensor (Faber, 1995). We solve for an equilibrium solution, and time dependent terms and are discarded.
Typically, finite element models use an unstructured mesh (for example a triangular mesh). However, as a simple cylindrical geometry is used for the conduit, a rectangular “mapped” mesh is employed in this case, providing improved stability to the model solver. This allows larger spatial variations in parameters to be modeled, which would face convergence issues when using a unstructured mesh. A mesh refinement study was performed to determine the mesh resolution close to the conduit wall required to model a solution for the shear stress at the conduit wall that is independent of the mesh size. An minimum element size as small as 2 cm at the conduit wall was applied in some tests, increasing toward the conduit center.
A summary of the parameters used in the flow model is presented in Table 2. A no-slip boundary condition is applied at the conduit wall. Pressure boundary conditions are set at the top and base of the conduit as atmospheric and magmastatic plus overpressure, respectively. ρe is the density of the edifice surrounding the conduit, g is acceleration due to gravity, z is the depth in the conduit, Pa is atmospheric pressure, and Pe is excess pressure at the base of the conduit, which is varied between tests (section 4) to account for overpressure in the system.
2.1. Magma Rheology
Magma is typically a multiphase suspension consisting of silicate melt, crystals and bubbles. The relative proportion of these three phases significantly influences the magma rheology, and therefore the eruption dynamics (Dingwell, 1996). At low gas and crystal volume fractions, magma can be considered to behave as a Newtonian fluid, where the viscosity η0 is constant. However, at moderate crystal and gas fractions, the apparent viscosity of the suspension ηs is a function of the shear stress σs and strain rate , such that (Mueller et al., 2011). This is often normalized by the viscosity of the suspending melt η0, to give the relative viscosity as ηr = ηs/η0.
The viscosity of the melt phase has been determined as a function of melt composition and temperature, using the model by Giordano et al. (2008). The melt composition we use has been obtained by Myers et al. (2014) from averaging the composition of matrix glass from scoria bombs of the 2010 eruption of Tungurahua (Table 1).
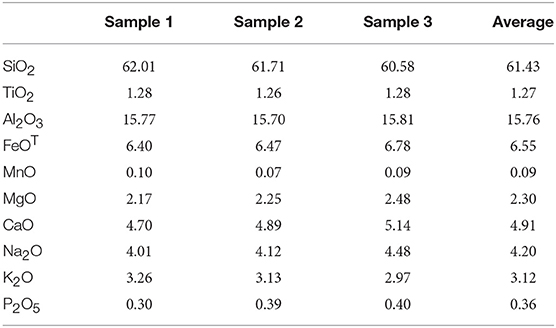
Table 1. Composition of melt phase, from matrix glass of scoria clasts from the 2010 eruption at Tungurahua volcano (Myers et al., 2014).
2.1.1. Crystal Bearing Magma
Crystals increase the viscosity of magma due to energy being dissipated through fluid-particle and particle-particle interactions. The relative viscosity increases exponentially as the crystal content increases, approaching the maximum packing fraction, at which point the suspension becomes jammed (Mueller et al., 2011). More elongate crystals with a higher aspect ratio encompass a larger area during rotation, hence, enhance the particle-particle interactions. From experiments on suspensions of particles over a range of aspect ratios, Mueller et al. (2011) derived the following empirical relationship between the maximum packing fraction and the particle aspect ratio rp.
where the maximum packing fraction for spherical particles , and a fitting parameter b = 1.08, have each been experimentally derived by Mueller et al. (2011). Here, where we assume an aspect ratio of 3 for a predominantly plagioclase and pyroxene crystal phase, . Mueller et al. (2011) found empirically that for diverse crystal suspensions over a range of values for rp, ηr and the crystal volume fraction of the suspension ϕc, that the theoretical model of Maron and Pierce (1956) is able to accurately describe the relative viscosity, hence the rheology.
Romero et al. (2017) assessed thin sections of pyroclastic density current blocks from the February 2014 eruption on Tungurahua, and estimated the crystal volume fraction as ϕc = 0.29. For simplicity, we proceed with the constant value of ϕc = 0.29 in all our models, making the assumption that the ascent time is short relative to the time period of crystallization. Using this value, the relative viscosity of the crystal-bearing suspension ηrc is a factor of 4 greater than the relative viscosity of the melt phase ηr.
2.1.2. Bubbly Magma
The gas volume fraction at any point in the conduit is a function of the solubility of volatiles in the melt, the initial content dissolved in the melt at depth, and the amount of gas that has been able to escape from the system. In our models, we consider only H2O as the most volumetrically significant volatile phase that exsolves from the melt, and use the law from Zhang et al. (2007) to determine the weight percent of H2O, Cw, dissolved in the melt phase:
where T is temperature in degrees Kelvin, P is pressure in MPa, and AI is the sum of the mole fractions of Na, K and Al.
An upper limit is placed upon Cw from estimates of the initial concentration of water dissolved in the melt. Myers et al. (2014) found that melt inclusions from eruptions in 2006 and 2010 contained as much as 4 wt.% H2O. Samaniego et al. (2011) performed a petrological analysis of juvenile blocks and bombs from pyroclastic flow deposits of the 2006 paroxysmal eruptions at Tungurahua. They stated that the observed absence of amphibole suggests that the magmas evolved at a H2O content <4 wt.%, and temperatures higher than 950–1,000°. Andújar et al. (2017) propose that prior to the July 2006 eruption magma was stored at 400 MPa, at 1.000 °C, with an H2O content of 6 wt.%, before ascending to a second storage reservoir at 200 MPa. For our reference model, we use an initial H2O content of 5 wt.%, and assess how varying this value by ±5 wt.% influences the ascent dynamics and associated deformation in section 4.
Equation (7) is valid where the water content dissolved in the melt is in equilibrium with the exsolved water, and assumes instantaneous and homogeneous nucleation and exsolution. This yields a sharp variation in Cw at the nucleation depth. A more gradual onset of exsolution is probably more realistic, and has been implemented by applying a taper function as shown in the Supplementary Section S3 (Equation S6).
Equation (7) provides the mass fraction of H2O that has been exsolved. However, the gas volume fraction ϕg depends on the gas density, which is also pressure and therefore depth dependent. To quantify how ϕg varies with depth, first the number of moles of exsolved H2O per cubic meter, n, must be calculated using the melt density ρm and the molar mass of H2O, M = 0.018 kg
The volume of exsolved H2O, Vg, can then be calculated using the ideal gas equation:
where T is temperature in degrees Kelvin, P is pressure in MPa and Cg is the ideal gas constant. The volume of melt from which gas exsolves is reduced by the fraction of crystals within the magma, therefore, Vg is weighted by the initial melt fraction, ϕm = 1 − ϕc. The gas volume fraction, ϕg, is calculated by
The efficiency by which exsolved volatiles can be released from a volcanic system plays a fundamental role on controlling the eruption style. The gas volume fraction remaining in the magma is a key factor in determining whether magma fragmentation occurs, and therefore whether a subsequent eruption is effusive or explosive (Dingwell, 1996). Additionally, the remaining gas content influences both the viscosity (Llewellin and Manga, 2005) and density (Spera, 2000) of the bulk magma, and therefore provides a top-down control on the magma ascent rate (Thomas and Neuberg, 2014). Therefore, it is important to be able to quantify how much gas is lost from the system.
Independent ascent of bubbles through magma is not considered in this highly viscous system, and therefore gas is assumed to be lost only through permeable flow. Permeable gas flow occurs where the porosity is sufficient for bubbles to be interconnected (Klug and Cashman, 1996). Additionally, gas loss may be facilitated by fractures in the magma (Gaunt et al., 2014). The minimum porosity required for degassing is unclear and varies with crystal volume fraction and strain rate (Laumonier et al., 2011). Also, it is unclear how magma permeability and degassing vary with depth. Therefore, in this study, a simplified forced degassing approach is adopted, where an empirical permeability depth profile is provided. We assume that no permeable degassing pathways exist where ϕg < 0.2, a reasonable compromise based on results of several studies (see the Supplementary Section S4). This corresponds to a depth of 1.600 m in the reference model. This depth is then set as the maximum depth of degassing in all future models. This was derived by iteratively adjusting the maximum gas loss depth and assessing the ϕg depth profile. We assume that all the gas is lost at the surface, to simulate in our flow model the presence of an impermeable plug in the upper conduit (Hall et al., 2015). This is supported by observations of negligible outgassing during periods of quiescence at the Tungurahua (Hidalgo et al., 2015). A cosine taper is used for the gas loss profile to achieve a smooth variation with depth. Our resultant profile for the gas volume fraction is in line with the numerical modeling of Diller et al. (2006), who showed that if the magma and surrounding edifice are permeable, a low vesicularity, dense region forms in the upper conduit.
Bubbles can either increase or decrease the relative viscosity of the bubble suspension ηrg depending on the capillary number Ca, a ratio of the viscous stresses deforming the bubble to the interfacial stresses restoring it (Rust and Manga, 2002).
where Γ is the bubble surface tension and Rb is the bubble radius, where the computation of Rb is documented in the Supplementary Section S1. Bubbles increase the relative viscosity ηrg by distorting the flow paths of the melt, and decrease ηrg by providing free-slip surfaces for flow. The zero shear-rate viscosity ηr0 and infinite shear rate viscosity ηr∞ describe the limits of the influence of bubbles on the viscosity, where the bubbles are considered spherical or at the limit of elongation, respectively, and are functions of the gas volume fraction ϕg, as determined by Llewellin and Manga (2005) where ϕg is <0.5.
The relative viscosity between ηr0 and ηr∞ can be defined using
where K = 6/5 and m = 2 (Mader et al., 2013). ηrg tends asymptotically toward ηr0 at low strain rate, where the bubbles are spherical, and toward ηr∞ at high strain rate, where the bubbles approach the limit of elongation. Hence, spherical bubbles impede flow while elongate bubbles facilitate flow.
2.1.3. Three-Phase Magma
Three-phase suspension experiments from Truby et al. (2015) presented a model for the relative viscosity of three-phase magma. In this model, the bubble-bearing suspension is treated as the “effective medium” in which crystals are suspended, and hence Equations (12) and (6) have been combined to provide the bulk viscosity.
This equation has been tested only for steady flow in the low capillarity regime (spherical bubbles), for 0 ≤ ϕg ≤ 0.3 and 0 ≤ ϕc ≤ 0.85, however Truby et al. (2015) state that the model's applicability is potentially much broader, although subject to experimental validation. To our knowledge, this has not yet been done, nor has an alternative model been suggested for higher capillary numbers. By combining Equations (6) and (14), we extrapolate the trend so it is usable for higher capillary numbers.
Equation (16) is used within our flow models to provide a spatially variant viscosity that accounts for melt, crystals and bubbles.
2.1.4. Why the Bulk Viscosity Needs to Be Scaled Up
Equation (16) provides us with a good representation of how the bulk magma viscosity varies spatially within the conduit. However, this describes the classical flow dynamics within a clean pipe. In reality, a volcanic conduit is filled with rubble from previous eruptions that ascending magma must percolate through and incorporate. For this reason, a Bingham rheology is often used (e.g., Blake, 1990), where a yield strength must be overcome for magma to ascend. Furthermore, based on the available data for Tungurahua, we must consider in our models a range of values for magma temperature, composition, crystal content and aspect ratio, resulting in significant uncertainties in the bulk viscosity. We adopt the concept of a Bingham rheology by scaling up the bulk viscosity derived in Equation (16) by a factor of 10.000, in order to yield suitable values for the ascent velocity (millimeters per second) that are low enough for magma to ascend from chamber depth (7.5–9.5 km, Samaniego et al., 2011) to the surface without fragmentation over the 3 months between each Vulcanian explosion. Due to the large uncertainties in the bulk viscosity, we neglect a further fine-tuning that takes crystallization during magma ascent into account (Melnik and Sparks, 2005).
2.2. Magma Density
The density of the melt phase ρm has been calculated as a function of the composition (Table 1), pressure and temperature, as in Spera (2000), such that the melt density varies spatially within the conduit. The bulk density ρb is a function of the gas volume fraction ϕg and density ρg, and crystal volume fraction ϕc and density ρc.
As H2O is exsolved from the melt as it ascends, the melt density ρm increases, whilst the bulk magma density ρb decreases due to the increased gas volume fraction ϕg. The crystal volume fraction ϕc has been taken from estimates of Romero et al. (2017), who assessed thin sections from pyroclastic density current blocks from the February 2014 eruption on Tungurahua. The crystal assemblage was estimated to consist mainly of 17 % plagioclase (ϕplag), 10 % clinopyroxene (ϕcpx), and 2 % orthopyroxene (ϕopx). Approximations of the density of each crystal phase (ρplag, ρcpx, and ρopx) have been taken from Engineering Toolbox (2009). Given that the density varies quite considerably within the pyroxene group, an average density of 3334 kg/m3 is used for both ρcpx and ρopx. Using this information, we calculate the average crystal density ρc using.
2.3. Accounting for Seismicity
Brittle failure of the magma occurs where the shear stress exceeds the shear strength of the magma, triggering low frequency seismicity (Neuberg et al., 2006). The occurrence of this seismicity marks the critical depth where a crucial change in the flow regime exists, from viscous flow below this level to friction controlled slip above it along existing fractures. The shear stress in the conduit cannot exceed the shear strength of the magma, here assumed to be constant at 1 MPa for simplicity, based on experiments on vesicular magma at low confining pressures (Okumura et al., 2010). To accommodate this, the shear stress profile obtained from our flow model is clipped at 1 MPa, which is reached only in the uppermost section of the conduit in all of our models. As low frequency seismicity is only observed at RETU, located at high elevation, this critical source depth is poorly constrained, but probably in the upper section of the conduit (Bell et al., 2018). A full investigation would also take the depth-dependence of the shear strength of the magma into account.
2.4. Resulting Reference Flow Model
Figure 4 shows how various parameters taken at the conduit center (a–e) and wall (f,g) vary with depth in the solution of the resulting reference flow model, parameterized as in Table 2. The gas volume fraction increases as magma ascends, as volatiles exsolve from the melt. Closer to the surface where gas loss is significant, the gas volume fraction decreases toward zero. The melt and therefore bulk viscosity increase by several orders of magnitude as magma ascends and volatiles exsolve. The bulk density is inversely proportional to the gas volume fraction.
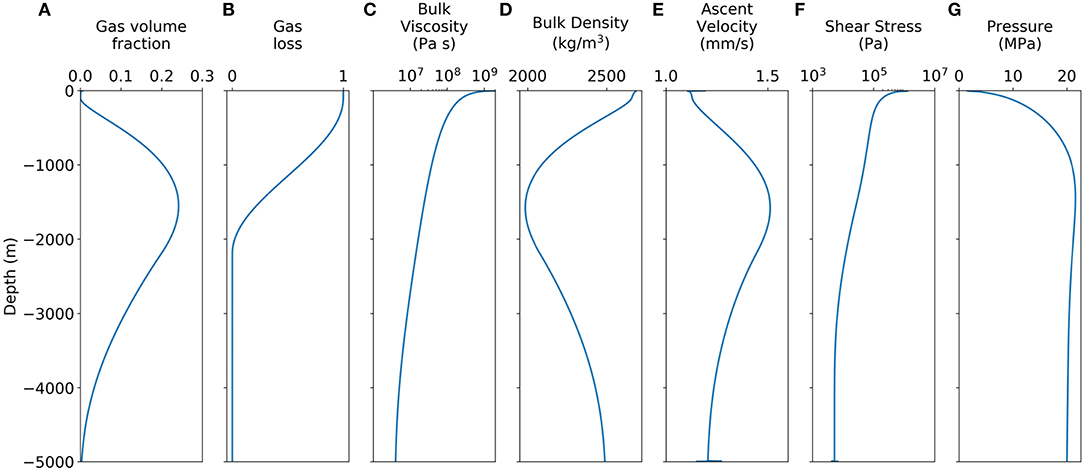
Figure 4. Depth profiles of key variables obtained from the reference flow model. (A–E) Have been extracted from the center of the conduit, (F,G) have been extracted from the conduit wall. Note that the shear stress profile has been clipped at 1 MPa to accommodate low frequency seismicity.
Table 2. Parameters and variables used in the flow model, based on Tungurahua volcano, Ecuador.
2.5. Thermal Boundary Layer
Temperature gradients can develop in the conduit due to the difference in temperature between the ascending magma and the surrounding edifice. Collier and Neuberg (2006) estimated the temperature difference across a 0.3 m thick thermal boundary layer (TBL) at the conduit wall to be 50–200 K (depending on the thermal conductivity of the magma, see Table 2) calculated by running a time-dependent model of constant fluid flow including heat loss. Where a TBL with a temperature difference of 200 K is included in our model, we observe that the velocity and therefore strain rate decreases within the TBL. However, this is counteracted by an increase in viscosity to yield a similar shear stress with or without the TBL (Figure 5). Therefore, a TBL has been excluded from future model runs. We also discard a vertical temperature gradient in the upper conduit in our model, assuming this, similarly, does not extend far into the conduit and, therefore, does not affect the ascent dynamics.
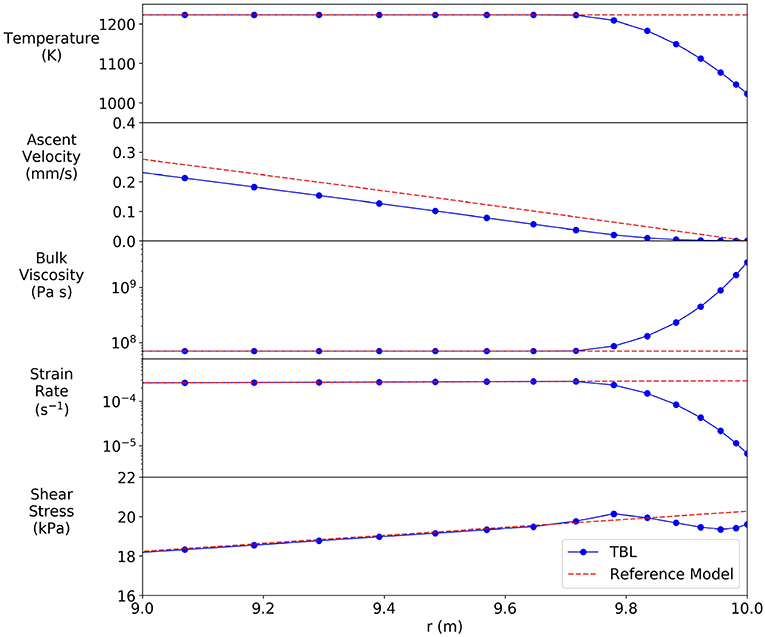
Figure 5. Horizontal profiles of (from top to bottom) temperature, ascent velocity, bulk viscosity, strain rate and shear stress at 2,000 m in the reference flow model. Zoomed to within 1 m of the conduit wall (9 ≤ r ≤ 10). We compare flow models run with (solid) and without (dashed) a TBL of 0.3 m thickness, with a temperature difference of 200 K. Dots show the location of mesh node points. Note that the shear stress at the conduit wall is similar in either case. Instabilities in the strain rate modeled toward the conduit wall arise from the difficulty in modeling such steep changes in melt viscosity with a sufficiently fine mesh size in a FEM.
3. Deformation Model
To investigate the deformation field at Tungurahua, we build upon the 2D axisymmetric modeling of Neuberg et al. (2018) using the Solid Mechanics Module in COMSOL Multiphysics 5.4. The edifice is represented by a homogeneous cone, with the slope angle set to a constant of 26.6° to fix the location of RETU to 1 km vertically and 2 km laterally away from the summit. The base of the slope is 3 km below the summit. Beyond this, the model is extended with a flat surface to a horizontal distance of 100 km from the conduit, and a depth of 100 km from the summit, to avoid numerical boundary effects. A six node triangular mesh is used with an element size of around 50 m across the edifice, extending with distance from the conduit beyond the base of the slope. Roller boundary conditions are applied to exterior lateral model boundaries, such that horizontal displacement is constrained, allowing vertical displacement only. The base of the model is fully constrained in all directions. No constraints are applied to on the upper surface of the model. The depth-dependent shear stress and pressure profiles at the conduit wall, obtained from the flow modeling, are employed along the conduit-edifice boundary to drive the deformation model.
To accurately model the amplitude of the deformation it is imperative to assign realistic values for the mechanical properties (most importantly the elastic modulus) of the volcanic edifice. Volcanic edifices are formed from the deposits of numerous eruptions, effusive and explosive, including lava flows, ignimbrites and ash fall deposits. They are therefore heterogeneous structures, assembled over geologically short time scales of several thousands of years, which makes them inherently unstable (McGuire, 1996). It is therefore very difficult to assign a single overall value for the elastic modulus of a volcanic edifice.
The Young's modulus of intact rock samples of lava flows is often quoted to be on the order of tens of GPa (e.g., Heap et al., 2010). However, volcanic edifices are exposed to successive fracturing due to stress perturbations, and are therefore intersected by faults and fractures (Thomas et al., 2004), which can drastically reduce the strength of the entire rock mass (e.g., Heap et al., 2014). Cyclic stressing experiments by Heap et al. (2010) on intact rock samples of both intrusive and extrusive basalts showed that successive fracturing can reduce the Young's modulus by up to 32 %. Additionally, after deposition, rocks are subject to chemical alteration due to hydrothermal activity and weathering, leading to the formation of primarily clay minerals which are weak in strength (Pola et al., 2014). Heap et al. (2014) sampled andesites from Colima volcano, Mexico, and found the Young's modulus to be as low as 6.38 GPa. The Young's modulus is also known to be lower where the rock porosity is higher (Heap et al., 2014).
Unlike intact rock samples, rock masses do not always behave elastically, but deform and fail along fracture surfaces. Instead of the Young's modulus, we use the deformation modulus Em to quantify how an entire rock mass deforms, similarly defined as the ratio of applied stress to strain exerted, but accounting for elastic and inelastic behavior (Hoek and Diederichs, 2006). The deformation modulus of a volcanic edifice is poorly constrained, in part due to the difficulty in determining Em in the laboratory, as one needs to test a rock mass volume sufficiently large to be a good representation of the heterogeneity in reality. For this reason, the deformation modulus is generally smaller when a larger sample size is used (Pinto de Cunha and Muralha, 1990), and Em can be orders of magnitude lower than the Young's modulus (e.g., Hoek and Diederichs, 2006). Isik et al. (2008) attempted to quantify the deformation modulus of heavily jointed and highly weathered andesites underlying northern Ankara, Turkey, and measured a mean value of Em = 34.8 MPa, with a standard deviation of 25.8 MPa, obtained from pressuremeter tests. Alternatively, Em can be estimated empirically based on other properties of the rock (e.g., Hoek and Diederichs, 2006). However, estimates of Em obtained through any of the discussed methods are only representative of the area around the test or sample site, whilst deeper in the edifice the weakening effects of temperature and degree of alteration may be considerably higher.
To address this uncertainty, the tilt induced by either shear stress, pressure, or both, has been modeled using a suite of different deformation moduli (Figure 6). A Poisson's ratio of 0.25 and edifice density of 2.650 kg/m3 (Hall et al., 1999) are used in each test. Where the deformation modulus Em is 10 MPa, a tilt at RETU of 67 μrad is modeled using shear stress alone, 24 μrad through pressure alone, and 91 μrad where both sources contribute. Where the deformation modulus is a factor of 10 larger, the tilt modeled is a factor of 10 smaller, as stated by Hooke's law. It has been suggested that conduit pressure is able to explain observed changes in tilt if the conduit is surrounded by a weak zone (Voight et al., 2006); however here we show that regardless of the strength of the edifice, shear stress dominates the tilt at Tungurahua. This is despite the shear stress obtained from flow modeling being several orders of magnitude smaller than the pressure at most depths.
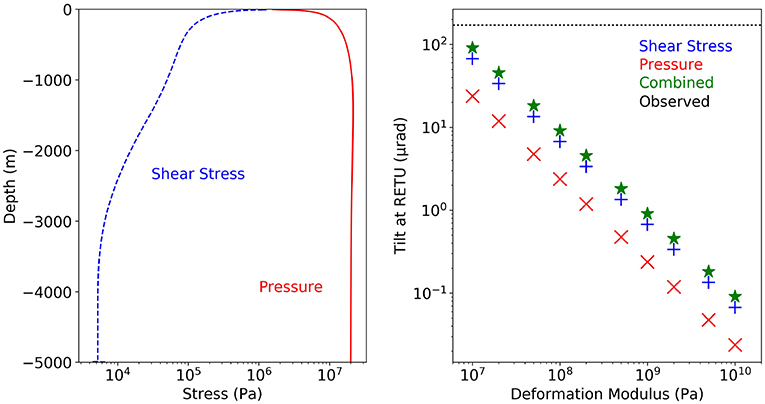
Figure 6. (Left) Shear stress (blue dashed) and pressure (red solid) profiles obtained from the reference flow model. Note the difference in amplitude between the shear and pressure stresses. (Right) Modeled tilt at RETU induced by shear stress (+), pressure (x), or both (star) for a suite of edifice deformation moduli. The tilt modeled due to shear stress is a factor of 2.8 higher than due to pressure, regardless of the deformation modulus used. A deformation modulus of around 10 MPa is required to model 170 μrad of tilt at RETU as observed (black dotted line) (Figure 2).
4. Changes in Tilt Through Time
In this section, we investigate how shear stress and conduit pressure change as key factors to the ascent dynamics, such as the volatile content and driving pressure gradient, are varied. At Tungurahua an increase in tilt of around 140 μrad is observed following the first major explosion in the period of interest on July 14th 2013, before decreasing significantly in the days leading up to the three proceeding major explosions (Figure 2). We use a constant deformation modulus Em of 10 MPa, required to model the observed amplitude of tilt variations using both shear stress and pressure from the reference flow model (Figure 6). In each test we vary only one parameter in our flow model at a time.
Firstly, we consider the July 14th 2013 explosion to be the first event in a sequence. Hall et al. (2015) suggested that the cyclic Vulcanian explosions observed between 2013 and 2014 at Tungurahua were the result of pressurization below tightly sealed viscous plugs. If friction at the conduit wall where this plug has formed is sufficient to impede ascent of magma, the magma ascent velocity and therefore shear stress at the wall would be zero (Equation 1), assuming the magma is behaving as a fluid. Shear stress would still be exerted only in the uppermost section of the conduit where magma completely solidifies. In a transitional regime, a viscoelastic treatment would be appropriate. As pressure increases below the plug, tilt would increase, but as the contribution of pressure to the tilt is small, this change in tilt would be small, as observed prior to the explosion on July 14th 2013 (Figure 2).
Consider that the conduit was vacated following the first eruption, magma would again begin to ascend and fill up the conduit due to the reduction in confining pressure. Pressure and shear stress would be progressively exerted on a greater proportion of the conduit walls, causing tilt to increase through time. This could explain why tilt increases over the weeks following each Vulcanian explosion. Tilt then decreases for several days leading up to the next Vulcanian explosion. Hall et al. (2015) suggested that each eruption is preceded by the formation of a viscous plug in the upper conduit. Should this occur, the ascending magma would decelerate, thus causing shear stress to decrease. As shear stress tends to dominate over pressure (Figure 7), this may explain why tilt decreases prior to the three latter Vulcanian explosions, despite the pressurization of the system. As viscosity continues to increase, the magma goes through the ductile-brittle transition zone and fails in a brittle manner, triggering seismicity and causing shear stress to drop further (Neuberg et al., 2018). However, to appropriately model these transient processes, and quantify the resultant changes in tilt, time dependent models that account for disequilibrium in the system must be developed in future work.
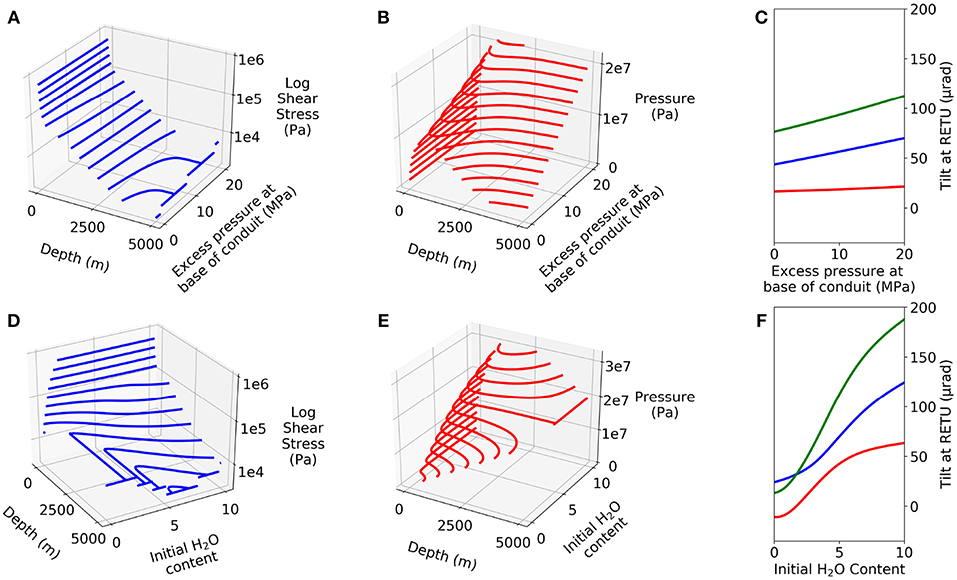
Figure 7. Modeled variations in shear stress (A,D) and pressure (B,E) with depth from flow modeling, and modeled tilt at RETU (C,F), each as a function of the excess pressure at the base of the conduit (A–C) and the initial H2O content (D–F).
Alternative explanations for what has previously triggered major explosions at Tungurahua include the injection of a fresh batch of mafic magma into the magma chamber prior to the paroxysmal events in July and August 2006 (Samaniego et al., 2011), which is potentially volatile rich (Myers et al., 2014; Andújar et al., 2017). This could induce changes in the volatile content of the magma and the pressure at the base of the conduit, which Thomas and Neuberg (2014) previously demonstrated can significantly influence ascent dynamics and therefore pressure and shear stress. Here we attempt to quantify how realistic variations in these parameters will influence the tilt.
Figures 7A–C shows that the tilt induced by both shear stress and pressure increases linearly as a function of the excess pressure in the conduit. While the pressure contributes directly—but little—to the tilt, the ascent velocity and therefore the shear stress are proportional to the pressure gradient, hence the pressure.
An increase in the initial H2O content will result in a higher gas volume fraction and a decrease in the bulk magma density. This will facilitate magma ascent through increased buoyancy. Our results suggest that shear stress is higher, despite the melt viscosity being lower where the H2O content is greater. Again, this points to the dominance of ascent rate over viscosity in the trade-off between the two key parameters. Additionally, this leads to an increase in the exsolved volatile content, hence to a higher pressure in the conduit. Figures 7D–F shows that changing the initial H2O content can significantly influence the shear stress, pressure and resulting tilt, with a maximum combined tilt of 188 μrad for the maximum H2O content of 10 wt.%. Where the H2O content is below 1.5 wt.%, a negative radial tilt induced by pressure reduces the combined tilt to only 13 μrad.
We have shown that observed changes in tilt at RETU, in excess of 100 μrad, can be explained by moderate changes in the volatile content or the increase of excess pressure in the conduit. Interestingly, the relative contribution of shear stress and pressure to the combined modeled tilt varies considerably depending on the volatile content. However, the contribution of shear stress to the combined tilt is always greater or equal to the contribution of pressure in all of our models. In some cases, the shear stress and pressure induce opposing and almost counterbalancing tilts. In other cases, the combined tilt is made up almost entirely of the contribution of shear stress. Obviously there is a trade-off between the change in stress required and the deformation modulus of the edifice, to explain observed tilt variations. It is therefore challenging to estimate how much the volatile content or excess pressure did vary through time from the observed tilt variations alone. However, we suggest that with additional information, such as changes in gas flux or the broader deformation pattern, tilt observations can be used to assess how these parameters are varying through time.
5. Conclusions
• By quantitatively linking magma ascent to deformation for the first time, we confirm that shear stress exerted on the conduit walls generally dominates over pressurization as a deformation source of tilt observed close to the conduit. Whilst our model is tuned to Tungurahua volcano, the contribution of both shear stress and pressure should be considered at all silicic volcanoes.
• Previous attempts to link near-field changes in tilt to overpressure or shear stress have used large values for the applied stress. Here, we have used flow modeling to constrain these values. Our results suggest that for tilt variations at RETU to be the result of changes in either shear stress or overpressure in the conduit, the deformation modulus of Tungurahua's edifice must be lower than previously assumed, perhaps on the order of tens of MPa. This suggests that the edifice is either heavily fractured, highly altered, or highly porous, and most likely a combination of the three.
• Realistic variations in the driving pressure gradient and the volatile content are key parameters in driving changes in shear stress, pressure and therefore tilt through time. These variations could be more pronounced due to the non-linear relationships that exist between discharge rate and both crystallization and gas loss (Melnik and Sparks, 1999). Given the large uncertainties in parameters, such as crystal content and permeability, we neglect crystallization during magma ascent and keep the gas loss profile constant. The relative contributions of shear stress and pressure to the tilt vary considerably as a function of the volatile content.
• As magma refills the conduit following a major eruption, shear stress and pressure are progressively exerted on a greater proportion of the conduit wall. Therefore one may expect tilt to increase as this occurs, as observed following Vulcanian explosions at Tungurahua. However, to properly simulate this, or other transient volcanic processes, fully time dependent flow models must be developed, that are able to keep track of changes in the ascent dynamics.
• A decrease in tilt prior to a major explosion can be explained by a decrease in shear stress as ascending magma grinds to a halt below a fixed plug and a pressurization in the upper conduit. Alternatively, this decrease in tilt could be explained by the onset of seismicity which leads to frictional heating and a subsequent decrease in the magma viscosity. This allows the magma column to accelerate to critical ascent rates without transferring shear stress across the conduit wall. This explanation would require further investigations into the rheology of magma, including frictional heating, and strength recovery of magma. Additionally it is important to quantify how much shear stress reduction is achieved by a seismic swarm and define the seismicity and tilt rates that point to critical magma ascent.
Data Availability
All datasets generated for this study are included in the manuscript and/or the Supplementary Files.
Author Contributions
LM developed the models. JN and MT provided expertize on the governing processes. PM and MR advised on technical aspects of the project.
Funding
LM was funded by a studentship from the NERC-SPHERES Doctoral Training Partnership (NE/L002574/1). JN was partially funded by the Centre for the Observation and Modelling of Earthquakes, Volcanoes and Tectonics (COMET NE/J01978X/1).
Conflict of Interest Statement
The authors declare that the research was conducted in the absence of any commercial or financial relationships that could be construed as a potential conflict of interest.
Acknowledgments
We would like to thank all the staff at the IGEPN, Ecuador, for their ongoing monitoring operations on Tungurahua, and the OVT staff who keep the monitoring equipment optimally functioning, and vigías who provide observations during periods of activity. We acknowledge Amy Collinson for her useful contributions to discussions and for providing help with the modeling. We would like to thank Shigekazu Kusumoto, Oleg Melnik, and Larry Mastin for their constructive reviews.
Supplementary Material
The Supplementary Material for this article can be found online at: https://www.frontiersin.org/articles/10.3389/feart.2019.00219/full#supplementary-material
References
Albino, F., Pinel, V., Massol, H., and Collombet, M. (2011). Conditions for detection of ground deformation induced by conduit flow and evolution. J. Geophys. Res. Solid Earth 116:B06201. doi: 10.1029/2010JB007871
Andújar, J., Martel, C., Pichavant, M., Samaniego, P., Scaillet, B., and Molina, I. (2017). Structure of the plumbing system at Tungurahua Volcano, Ecuador: insights from phase equilibrium experiments on July–August 2006 eruption products. J. Petrol. 58, 1249–1278. doi: 10.1093/petrology/egx054
Beauducel, F., Cornet, F.-H., Suhanto, E., Duquesnoy, T., and Kasser, M. (2000). Constraints on magma flux from displacements data at Merapi volcano, Java, Indonesia. J. Geophys. Res. Solid Earth 105, 8193–8203. doi: 10.1029/1999JB900368
Bell, A. F., Naylor, M., Hernandez, S., Main, I. G., Elizabeth Gaunt, H., Mothes, P., et al. (2018). Volcanic eruption forecasts from accelerating rates of drumbeat long-period earthquakes. Geophys. Res. Lett. 45, 1339–1348. doi: 10.1002/2017GL076429
Blake, S. (1990). “Viscoplastic models of lava domes,” in Lava Flows and Domes, ed J. H. Fink (Berlin; Heidelberg: Springer), 88–126.
Burgisser, A., Poussineau, S., Arbaret, L., Druitt, T. H., Giachetti, T., and Bourdier, J.-L. (2010). Pre-explosive conduit conditions of the 1997 Vulcanian explosions at Soufrière Hills Volcano, Montserrat: I. Pressure and vesicularity distributions. J. Volcanol. Geotherm. Res. 194, 27–41. doi: 10.1016/j.jvolgeores.2010.04.008
Cluzel, N., Laporte, D., Provost, A., and Kannewischer, I. (2008). Kinetics of heterogeneous bubble nucleation in rhyolitic melts: implications for the number density of bubbles in volcanic conduits and for pumice textures. Contrib. Mineral. Petrol. 156, 745–763. doi: 10.1007/s00410-008-0313-1
Collier, L., and Neuberg, J. (2006). Incorporating seismic observations into 2D conduit flow modeling. J. Volcanol. Geotherm. Res. 152, 331–346. doi: 10.1016/j.jvolgeores.2005.11.009
Diller, K., Clarke, A., Voight, B., and Neri, A. (2006). Mechanisms of conduit plug formation: implications for vulcanian explosions. Geophys. Res. Lett. 33:L20302. doi: 10.1029/2006GL027391
Dingwell, D. B. (1996). Volcanic dilemma: flow or blow? Science 273:1054. doi: 10.1126/science.273.5278.1054
Engineering ToolBox (2009). Mineral Densities. Available online at: https://www.engineeringtoolbox.com/mineral-density-d_1555.html
Gardner, J. E., Ketcham, R. A., and Moore, G. (2013). Surface tension of hydrous silicate melts: constraints on the impact of melt composition. J. Volcanol. Geotherm. Res. 267, 68–74. doi: 10.1016/j.jvolgeores.2013.09.007
Gaunt, H. E., Sammonds, P. R., Meredith, P. G., Smith, R., and Pallister, J. S. (2014). Pathways for degassing during the lava dome eruption of Mount St. Helens 2004–2008. Geology 42, 947–950. doi: 10.1130/G35940.1
Giordano, D., Russell, J. K., and Dingwell, D. B. (2008). Viscosity of magmatic liquids: a model. Earth Planet. Sci. Lett. 271, 123–134. doi: 10.1016/j.epsl.2008.03.038
Green, D., Neuberg, J., and Cayol, V. (2006). Shear stress along the conduit wall as a plausible source of tilt at Soufrière Hills volcano, Montserrat. Geophys. Res. Lett. 33:L10306. doi: 10.1029/2006GL025890
Hall, M. L., Robin, C., Beate, B., Mothes, P., and Monzier, M. (1999). Tungurahua volcano, Ecuador: structure, eruptive history and hazards. J. Volcanol. Geotherm. Res. 91, 1–21. doi: 10.1016/S0377-0273(99)00047-5
Hall, M. L., Steele, A. L., Bernard, B., Mothes, P. A., Vallejo, S. X., Douillet, G. A., et al. (2015). Sequential plug formation, disintegration by vulcanian explosions, and the generation of granular pyroclastic density currents at Tungurahua volcano (2013–2014), Ecuador. J. Volcanol. Geotherm. Res. 306, 90–103. doi: 10.1016/j.jvolgeores.2015.09.009
Heap, M., Faulkner, D., Meredith, P., and Vinciguerra, S. (2010). Elastic moduli evolution and accompanying stress changes with increasing crack damage: implications for stress changes around fault zones and volcanoes during deformation. Geophys. J. Int. 183, 225–236. doi: 10.1111/j.1365-246X.2010.04726.x
Heap, M., Lavallée, Y., Petrakova, L., Baud, P., Reuschle, T., Varley, N., et al. (2014). Microstructural controls on the physical and mechanical properties of edifice-forming andesites at Volcán de Colima, Mexico. J. Geophys. Res. Solid Earth 119, 2925–2963. doi: 10.1002/2013JB010521
Hidalgo, S., Battaglia, J., Arellano, S., Steele, A., Bernard, B., Bourquin, J., et al. (2015). SO 2 degassing at Tungurahua volcano (Ecuador) between 2007 and 2013: transition from continuous to episodic activity. J. Volcanol. Geotherm. Res. 298, 1–14. doi: 10.1016/j.jvolgeores.2015.03.022
Hoek, E., and Diederichs, M. S. (2006). Empirical estimation of rock mass modulus. Int. J. Rock Mech. Mining Sci. 43, 203–215. doi: 10.1016/j.ijrmms.2005.06.005
Hreinsdóttir, S., Sigmundsson, F., Roberts, M. J., Björnsson, H., Grapenthin, R., Arason, P., et al. (2014). Volcanic plume height correlated with magma-pressure change at Grímsvötn volcano, Iceland. Nat. Geosci. 7:214. doi: 10.1038/ngeo2044
Isik, N. S., Doyuran, V., and Ulusay, R. (2008). Assessment of deformation modulus of weak rock masses from pressuremeter tests and seismic surveys. Bull. Eng. Geol. Environ. 67, 293–304. doi: 10.1007/s10064-008-0163-0
Klug, C., and Cashman, K. V. (1996). Permeability development in vesiculating magmas: implications for fragmentation. Bull. Volcanol. 58, 87–100. doi: 10.1007/s004450050128
Laumonier, M., Arbaret, L., Burgisser, A., and Champallier, R. (2011). Porosity redistribution enhanced by strain localization in crystal-rich magmas. Geology 39, 715–718. doi: 10.1130/G31803.1
Lensky, N., Lyakhovsky, V., and Navon, O. (2002). Expansion dynamics of volatile-supersaturated liquids and bulk viscosity of bubbly magmas. J. Fluid Mech. 460, 39–56. doi: 10.1017/S0022112002008194
Llewellin, E., and Manga, M. (2005). Bubble suspension rheology and implications for conduit flow. J. Volcanol. Geotherm. Res. 143, 205–217. doi: 10.1016/j.jvolgeores.2004.09.018
Mader, H., Llewellin, E., and Mueller, S. (2013). The rheology of two-phase magmas: a review and analysis. J. Volcanol. Geotherm. Res. 257, 135–158. doi: 10.1016/j.jvolgeores.2013.02.014
Maron, S. H., and Pierce, P. E. (1956). Application of Ree-Eyring generalized flow theory to suspensions of spherical particles. J. Colloid Sci. 11, 80–95. doi: 10.1016/0021-9797(56)90012-1
McGuire, W. (1996). Volcano instability: a review of contemporary themes. Geol. Soc. 110, 1–23. doi: 10.1144/GSL.SP.1996.110.01.01
Melnik, O., and Sparks, R. (1999). Nonlinear dynamics of lava dome extrusion. Nature 402:37. doi: 10.1038/46950
Melnik, O., and Sparks, R. (2005). Controls on conduit magma flow dynamics during lava dome building eruptions. J. Geophys. Res. Solid Earth 110:B02209. doi: 10.1029/2004JB003183
Molina, I., Kumagai, H., Le Pennec, J.-L., and Hall, M. (2005). Three-dimensional P-wave velocity structure of Tungurahua volcano, Ecuador. J. Volcanol. Geotherm. Res. 147, 144–156. doi: 10.1016/j.jvolgeores.2005.03.011
Mothes, P. A., Yepes, H. A., Hall, M. L., Ramón, P. A., Steele, A. L., and Ruiz, M. C. (2015). The scientific–community interface over the fifteen-year eruptive episode of Tungurahua volcano, Ecuador. J. Appl. Volcanol. 4:9. doi: 10.1186/s13617-015-0025-y
Mueller, S., Llewellin, E., and Mader, H. (2011). The effect of particle shape on suspension viscosity and implications for magmatic flows. Geophys. Res. Lett. 38:L13316. doi: 10.1029/2011GL047167
Myers, M. L., Geist, D. J., Rowe, M. C., Harpp, K. S., Wallace, P. J., and Dufek, J. (2014). Replenishment of volatile-rich mafic magma into a degassed chamber drives mixing and eruption of Tungurahua volcano. Bull. Volcanol. 76:872. doi: 10.1007/s00445-014-0872-0
Neuberg, J., Tuffen, H., Collier, L., Green, D., Powell, T., and Dingwell, D. (2006). The trigger mechanism of low-frequency earthquakes on Montserrat. J. Volcanol. Geotherm. Res. 153, 37–50. doi: 10.1016/j.jvolgeores.2005.08.008
Neuberg, J. W., Collinson, A. S., Mothes, P. A., Ruiz, M. C., and Aguaiza, S. (2018). Understanding cyclic seismicity and ground deformation patterns at volcanoes: intriguing lessons from Tungurahua volcano, Ecuador. Earth Planet. Sci. Lett. 482, 193–200. doi: 10.1016/j.epsl.2017.10.050
Okumura, S., and Kozono, T. (2017). Silicic lava effusion controlled by the transition from viscous magma flow to friction controlled flow. Geophys. Res. Lett. 44, 3608–3614. doi: 10.1002/2017GL072875
Okumura, S., Nakamura, M., Nakano, T., Uesugi, K., and Tsuchiyama, A. (2010). Shear deformation experiments on vesicular rhyolite: implications for brittle fracturing, degassing, and compaction of magmas in volcanic conduits. J. Geophys. Res. Solid Earth 115:B06201. doi: 10.1029/2009JB006904
Pinto de Cunha, A., and Muralha, J. (1990). “About LNEC experience on scale effects in the deformability of rock masses,” in International Workshop on Scale Effects in Rock Masses (Loen).
Pola, A., Crosta, G. B., Fusi, N., and Castellanza, R. (2014). General characterization of the mechanical behaviour of different volcanic rocks with respect to alteration. Eng. Geol. 169, 1–13. doi: 10.1016/j.enggeo.2013.11.011
Romero, J. E., Douillet, G. A., Vargas, S. V., Bustillos, J., Troncoso, L., Alvarado, J. D., et al. (2017). Dynamics and style transition of a moderate, vulcanian-driven eruption at Tungurahua (Ecuador) in February 2014: pyroclastic deposits and hazard considerations. Solid Earth 8:697. doi: 10.5194/se-8-697-2017
Ruiz, M. C., Lees, J. M., and Johnson, J. B. (2006). Source constraints of Tungurahua volcano explosion events. Bull. Volcanol. 68, 480–490. doi: 10.1007/s00445-005-0023-8
Rust, A., and Manga, M. (2002). Effects of bubble deformation on the viscosity of dilute suspensions. J. Non-Newton. Fluid Mech. 104, 53–63. doi: 10.1016/S0377-0257(02)00013-7
Samaniego, P., Le Pennec, J.-L., Robin, C., and Hidalgo, S. (2011). Petrological analysis of the pre-eruptive magmatic process prior to the 2006 explosive eruptions at Tungurahua volcano (Ecuador). J. Volcanol. Geotherm. Res. 199, 69–84. doi: 10.1016/j.jvolgeores.2010.10.010
Sparks, R. S. J. (1997). Causes and consequences of pressurisation in lava dome eruptions. Earth Planet. Sci. Lett. 150, 177–189. doi: 10.1016/S0012-821X(97)00109-X
Spera, F. J. (2000). “Physical properties of magma,” in Encyclopedia of Volcanoes, ed H. Sigurdsson (San Diego, CA: Academic Press), 171–190.
Thomas, M. E., and Neuberg, J. (2012). What makes a volcano tick–a first explanation of deep multiple seismic sources in ascending magma. Geology 40, 351–354. doi: 10.1130/G32868.1
Thomas, M. E., and Neuberg, J. W. (2014). Understanding which parameters control shallow ascent of silicic effusive magma. Geochem. Geophys. Geosyst. 15, 4481–4506. doi: 10.1002/2014GC005529
Thomas, M. E., Petford, N., and Bromhead, E. N. (2004). Volcanic rock-mass properties from Snowdonia and Tenerife: implications for volcano edifice strength. J. Geol. Soc. 161, 939–946. doi: 10.1144/0016-764903-166
Truby, J. M., Mueller, S. P., Llewellin, E. W., and Mader, H. M. (2015). The rheology of three-phase suspensions at low bubble capillary number. Proc. R. Soc. A 471:20140557. doi: 10.1098/rspa.2014.0557
Tsvetkova, Y. D., and Melnik, O. (2018). The influence of non-Newtonian properties of magma on flow in a volcanic conduit. Doklady Phys. 63, 485–488. doi: 10.1134/S1028335818110071
Voight, B., Linde, A., Sacks, I., Mattioli, G., Sparks, R., Elsworth, D., et al. (2006). Unprecedented pressure increase in deep magma reservoir triggered by lava-dome collapse. Geophys. Res. Lett. 33:L03312. doi: 10.1029/2005GL024870
Voight, B., Sparks, R., Miller, A., Stewart, R. S., Hoblitt, R., Clarke, A., et al. (1999). Magma flow instability and cyclic activity at Soufrière Hills volcano, Montserrat, British West Indies. Science 283, 1138–1142. doi: 10.1126/science.283.5405.1138
Keywords: shear stress, tilt, pressure, numerical modeling, magma ascent, Tungurahua
Citation: Marsden LH, Neuberg JW, Thomas ME, Mothes PA and Ruiz MC (2019) Combining Magma Flow and Deformation Modeling to Explain Observed Changes in Tilt. Front. Earth Sci. 7:219. doi: 10.3389/feart.2019.00219
Received: 01 May 2019; Accepted: 09 August 2019;
Published: 30 August 2019.
Edited by:
James D. L. White, University of Otago, New ZealandReviewed by:
Shigekazu Kusumoto, University of Toyama, JapanOleg E. Melnik, Lomonosov Moscow State University, Russia
Larry Garver Mastin, United States Geological Survey, United States
Copyright © 2019 Marsden, Neuberg, Thomas, Mothes and Ruiz. This is an open-access article distributed under the terms of the Creative Commons Attribution License (CC BY). The use, distribution or reproduction in other forums is permitted, provided the original author(s) and the copyright owner(s) are credited and that the original publication in this journal is cited, in accordance with accepted academic practice. No use, distribution or reproduction is permitted which does not comply with these terms.
*Correspondence: Luke H. Marsden, ZWVsaG1AbGVlZHMuYWMudWs=