 Sara Mana
 Sidney Hemming2
 Dennis V. Kent
 Christopher J. Lepre
- 1Department of Geological Sciences, Salem State University, Salem, MA, United States
- 2Department of Earth and Environmental Sciences, Lamont-Doherty Earth Observatory, Columbia University, Palisades, NY, United States
- 3Department of Earth and Planetary Sciences, Rutgers University, Piscataway, NJ, United States
- 4Paleomagnetics Laboratory, Lamont-Doherty Earth Observatory, Palisades, NY, United States
In the Koobi Fora region of the northeast Lake Turkana Basin (Kenya) dozens of archeological sites have been studied for decades in order to understand the behavior of Early Pleistocene hominins. Data collected from these sites have been important for demonstrating the manufacture styles of Oldowan stone-tool users, hominin dietary preferences, and processes of Early Stone Age site formation. A particularly rich locality is collection Area 130. Area 130 is noteworthy for hominin fossils KNM-ER 1805 (Homo) and 1806 (Paranthropus) as well as the FxJj 18 site complex, which represents one of the type localities for the Developed Oldowan of Koobi Fora. However, despite research beginning in the late 1960s, and several revisions to the stratigraphy and dating of the Koobi Fora Formation, few published studies provide a detailed chronostratigraphy for Area 130. The lack of a detailed chronostratigraphy has contributed to conflicting interpretations for the dates of the hominin fossils and archaeological sites. Here we present new geochronologic and paleomagnetic data to develop a chronostratigraphic framework that allows us to directly assess the age of the sediments, fossils, and artifacts from Area 130. Individual pumices from the Orange Tuff marker level and a previously unnamed tuff exposed near the FxJj 18 archaeological site complex (referred here as the FxJj 18 tuff) were analyzed for high-precision single crystal 40Ar/39Ar dating and dated at 1.763 ± 0.007 Ma and 1.520 ± 0.005 Ma respectively. Concurrently, we collected orientated paleomagnetic samples from stratigraphic levels of the KBS Member in Area 130 and used them to develop a magnetostratigraphic section. Our findings can be used to refine the sequence and chronology of the archaeological and fossils sites from Area 130 and other penecontemporaneous sites within the Lake Turkana Basin. Our data show that the first appearance of the Developed Oldowan for Koobi Fora does not correlate with any obvious evolutionary changes represented by the local hominin hypodigm nor with the arrival of a cognitively advanced hominin. Therefore we speculate that the advent of this more sophisticated type of stone tool was a response to a change in the diet of the genus Homo.
Introduction
Within the northeast part of the Lake Turkana Basin (Kenya) (Figure 1), dozens of archeological sites from the Koobi Fora Region have been studied since the late 1960s (Harris and Isaac, 1976). Data collected from these sites have been important for interpreting the manufacture styles of Oldowan stone-tool users, hominin dietary preferences, and processes of Early Stone Age site formation (Rogers et al., 1994; Braun et al., 2008; Pobiner et al., 2008). These sorts of behavioral information in combination with the numerous fossil localities from the Koobi Fora Region have been instrumental for understanding the evolution of Early Pleistocene Homo and other taxa.
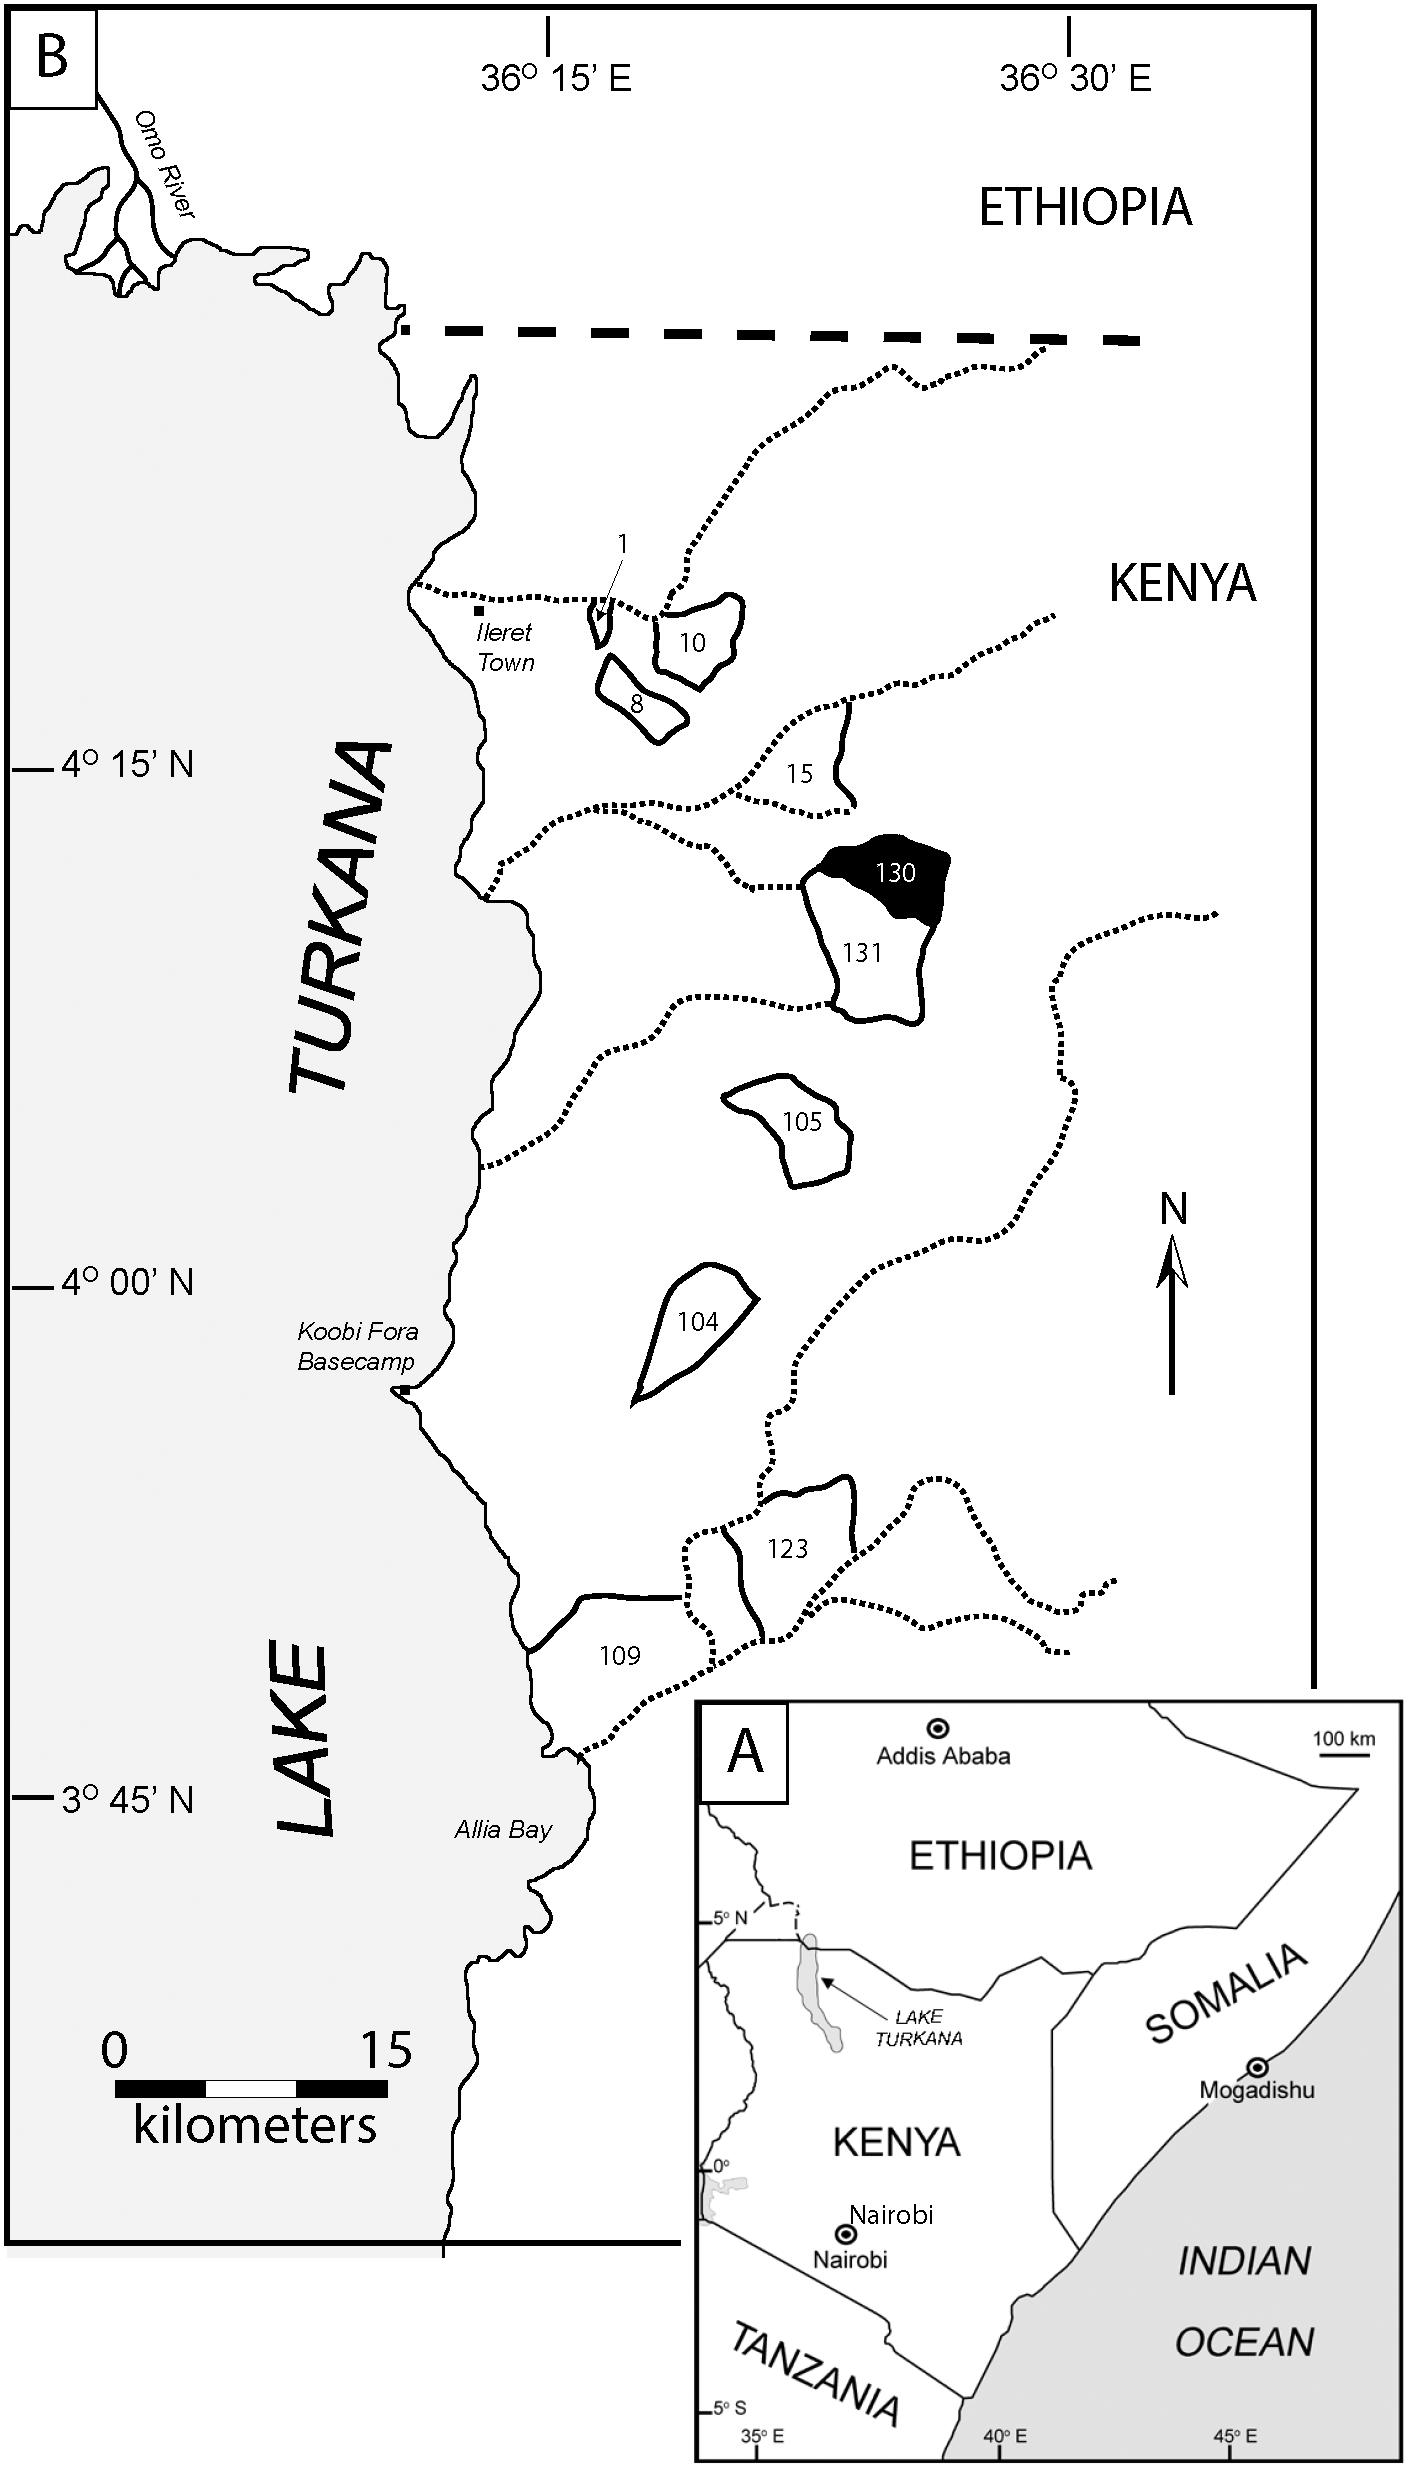
Figure 1. (A) Map of East Africa placing Lake Turkana (northern Kenya) in context. (B) Map of the northeast Turkana Basin showing multiple fossil collection areas of Koobi Fora referred to in this paper. Dotted lines depict the locations of major ephemerals streams. This study focuses on Area 130. Map is modified from Brown and Feibel (1986). Fossil collection area is the name given to a location that has an area of several square kilometers. Multiple fossil sites of hominins and other vertebrates as well as archeological sites are found within these collection areas. The archeological sites range in size from a square meter or two, to tens of square meters. All the fossil and archeological sites discussed in this paper have been previously excavated, mostly during the 1970s.
An important and particularly rich locality for archeological sites is collection Area 130 of Koobi Fora (Figure 2). Area 130 is the discovery location of the FxJj 18 site complex, which is a constituent of the Karari Industry of Koobi Fora (Harris and Isaac, 1976). Isaac et al. (1997) has linked the Karari Industry to the Developed Oldowan A that was defined from archeological sites at Olduvai Gorge, Tanzania (Leakey, 1971). The Karari Industry’s hallmark artifact is a single platform core colloquially known as the Karari scraper (Rogers et al., 1994; Braun et al., 2008). The FxJj 18 site complex arguably represents the type occurrence of the Developed Oldowan of Koobi Fora due to its assemblage having a prominence of Karari scrapers, an abundance of artifacts, and a large range of artifacts types. Other Karari Industry sites only have some Karari scrapers (e.g., FxJj 20) or a small number of artifacts in comparison (e.g., FxJj 16) (Isaac et al., 1997). Moreover, Area 130 is noteworthy for the KNM-ER 1805 and 1806 hominin fossils, representative of Homo and Paranthropus, respectively (Wood, 1991). These hominin fossils are preserved at nearly the same stratigraphic horizon, which probably is an indication of the sympatry of these taxa. The co-occurrence of these Homo and Paranthropus fossils in addition to their direct association with the archeological sites have contributed to debates about which hominins were the manufactures of the stone tools (Shea, 2016). Although there have been ample stratigraphic and dating studies of the Koobi Fora Formation (Brown and Feibel, 1986; McDougall and Brown, 2006; Lepre and Kent, 2015) few of these directly dated the fossil- and archeological-bearing sediments of Area 130. The lack of a detailed chronostratigraphy for the Area 130 sediments has contributed to different interpretations for the dates of the hominin fossils. For example, KNM-ER 1805 was dated by Feibel et al. (1989) at 1.85 Ma; by Gathogo and Brown (2006a) at ∼1.6 Ma; and by McDougall et al. (2012) at 1.75 Ma. Understanding the geologic age of KNM-ER 1805 is important for interpreting the cranial variations comprising the early Homo hypodigm of Koobi Fora, which consists of at least three species (Leakey et al., 2012). The dates of the representative specimens are essential for evaluating proposed anagenetic relationships between the species (Spoor et al., 2007) and unusually high contemporaneous anatomical variation within a single species (Gathogo and Brown, 2006a).
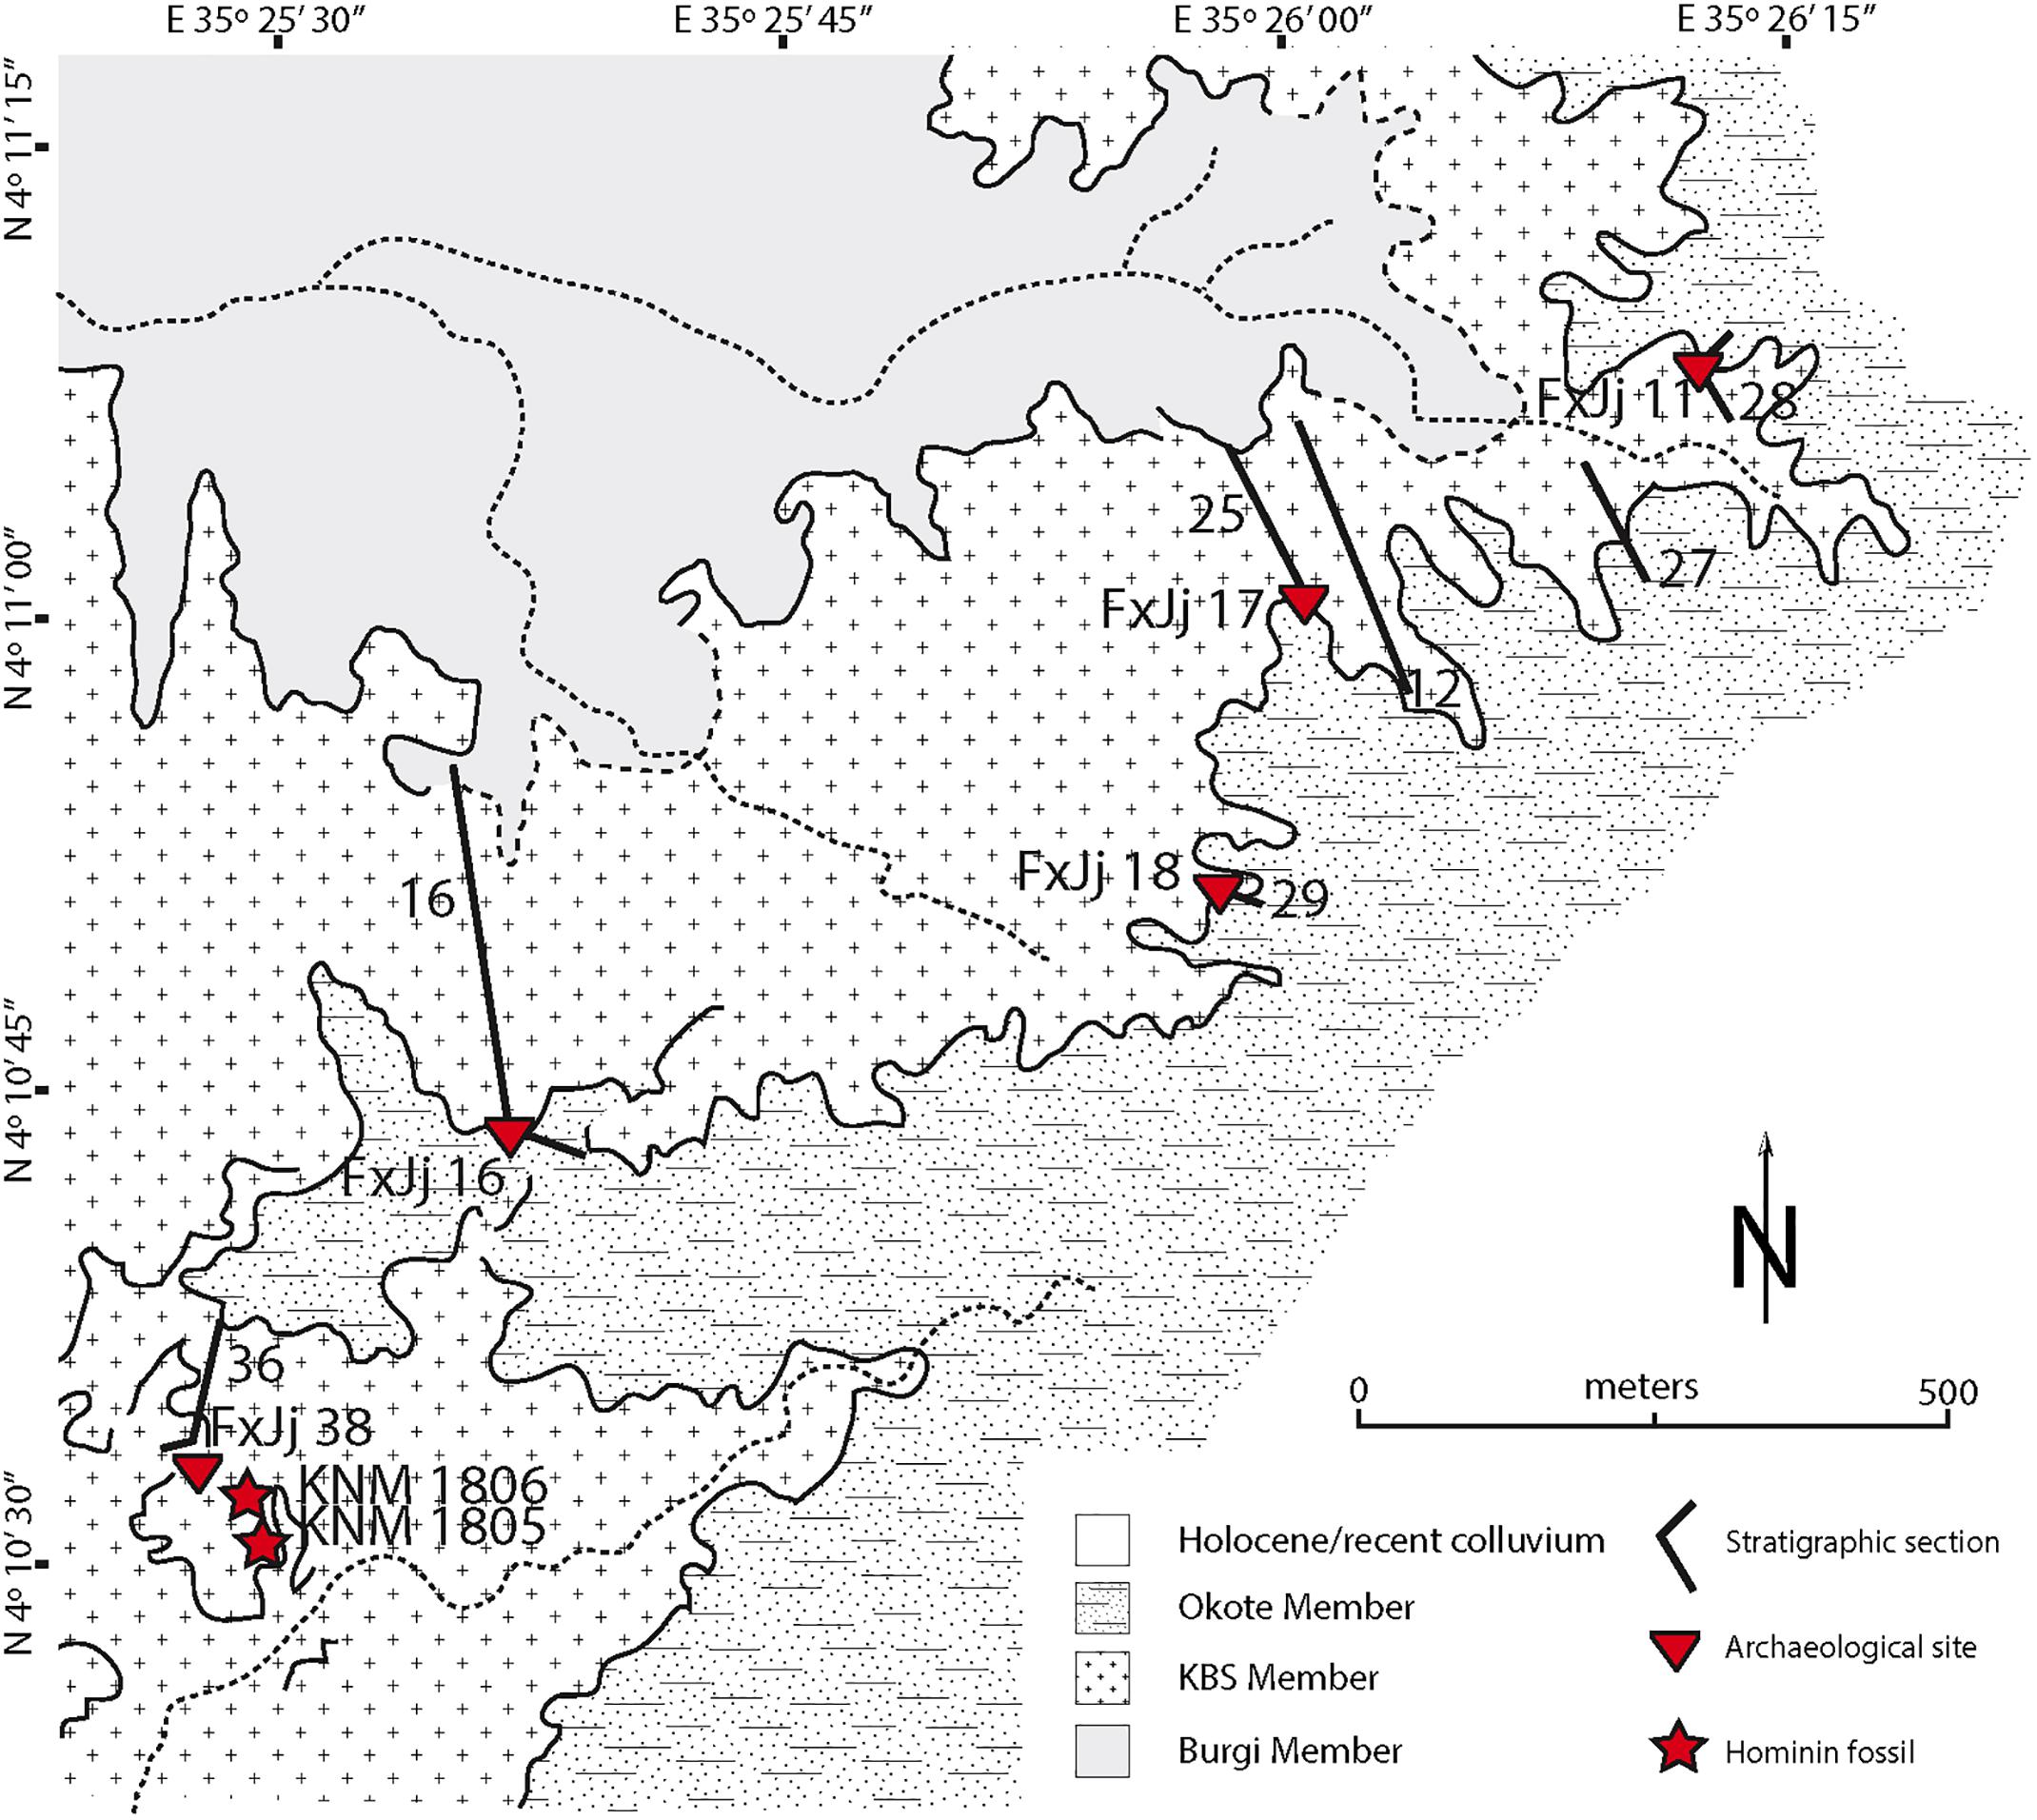
Figure 2. Detailed map after Frank (1976) and Lepre (2017) highlighting the distribution of the various stratigraphic sections studied as well as the location of the major archeological sites and hominin fossils within the area. Stratigraphic sections match the ones described in Figure 3. GPS coordinates for the top of the stratigraphic sections of interest are as follow: 28 (4°11′5.28″N, 36°26′9.66″E), 27 (4°11′0.06″N, 36°26′8.16″E), 12 (4°10′57.06″N, 36°26′1.74″E), 25 (4°10′59.10″N, 36°25′58.56″E), 29 (4°10′50.82″N, 36°25′56.22″E), 16 (4°10′44.76″N, 36°25′36.96″E), and 36 (4°10′35.09″N, 36°25′28.76″E). Solid black lines represent traces of outcrops. Dashed lines are inferred continuation of outcrop traces. Dotted lines are major ephemeral streams flowing generally toward the west.
Here we present a chronostratigraphic framework that allows us to directly assess the age of the sediments, fossils, and artifacts from Area 130 (Figures 2, 3). The framework is based upon the first 40Ar/39Ar dates for tuffaceous marker horizons and magnetostratigraphic data obtained from deposits of Area 130. In this paper, we (1) review the terrain, paleoanthropological sites, and lithostratigraphy of Area 130, (2) present new geochronology and paleomagnetic data, and (3) clarify the lithostratigraphic position of the boundaries for the Burgi, KBS, and Okote Members of the Koobi Fora Formation in Area 130. Furthermore, the implications of our findings are used to refine the sequence and chronology of the archeological and fossils sites from Area 130, and understand the broader patterns of early human evolution in the region.
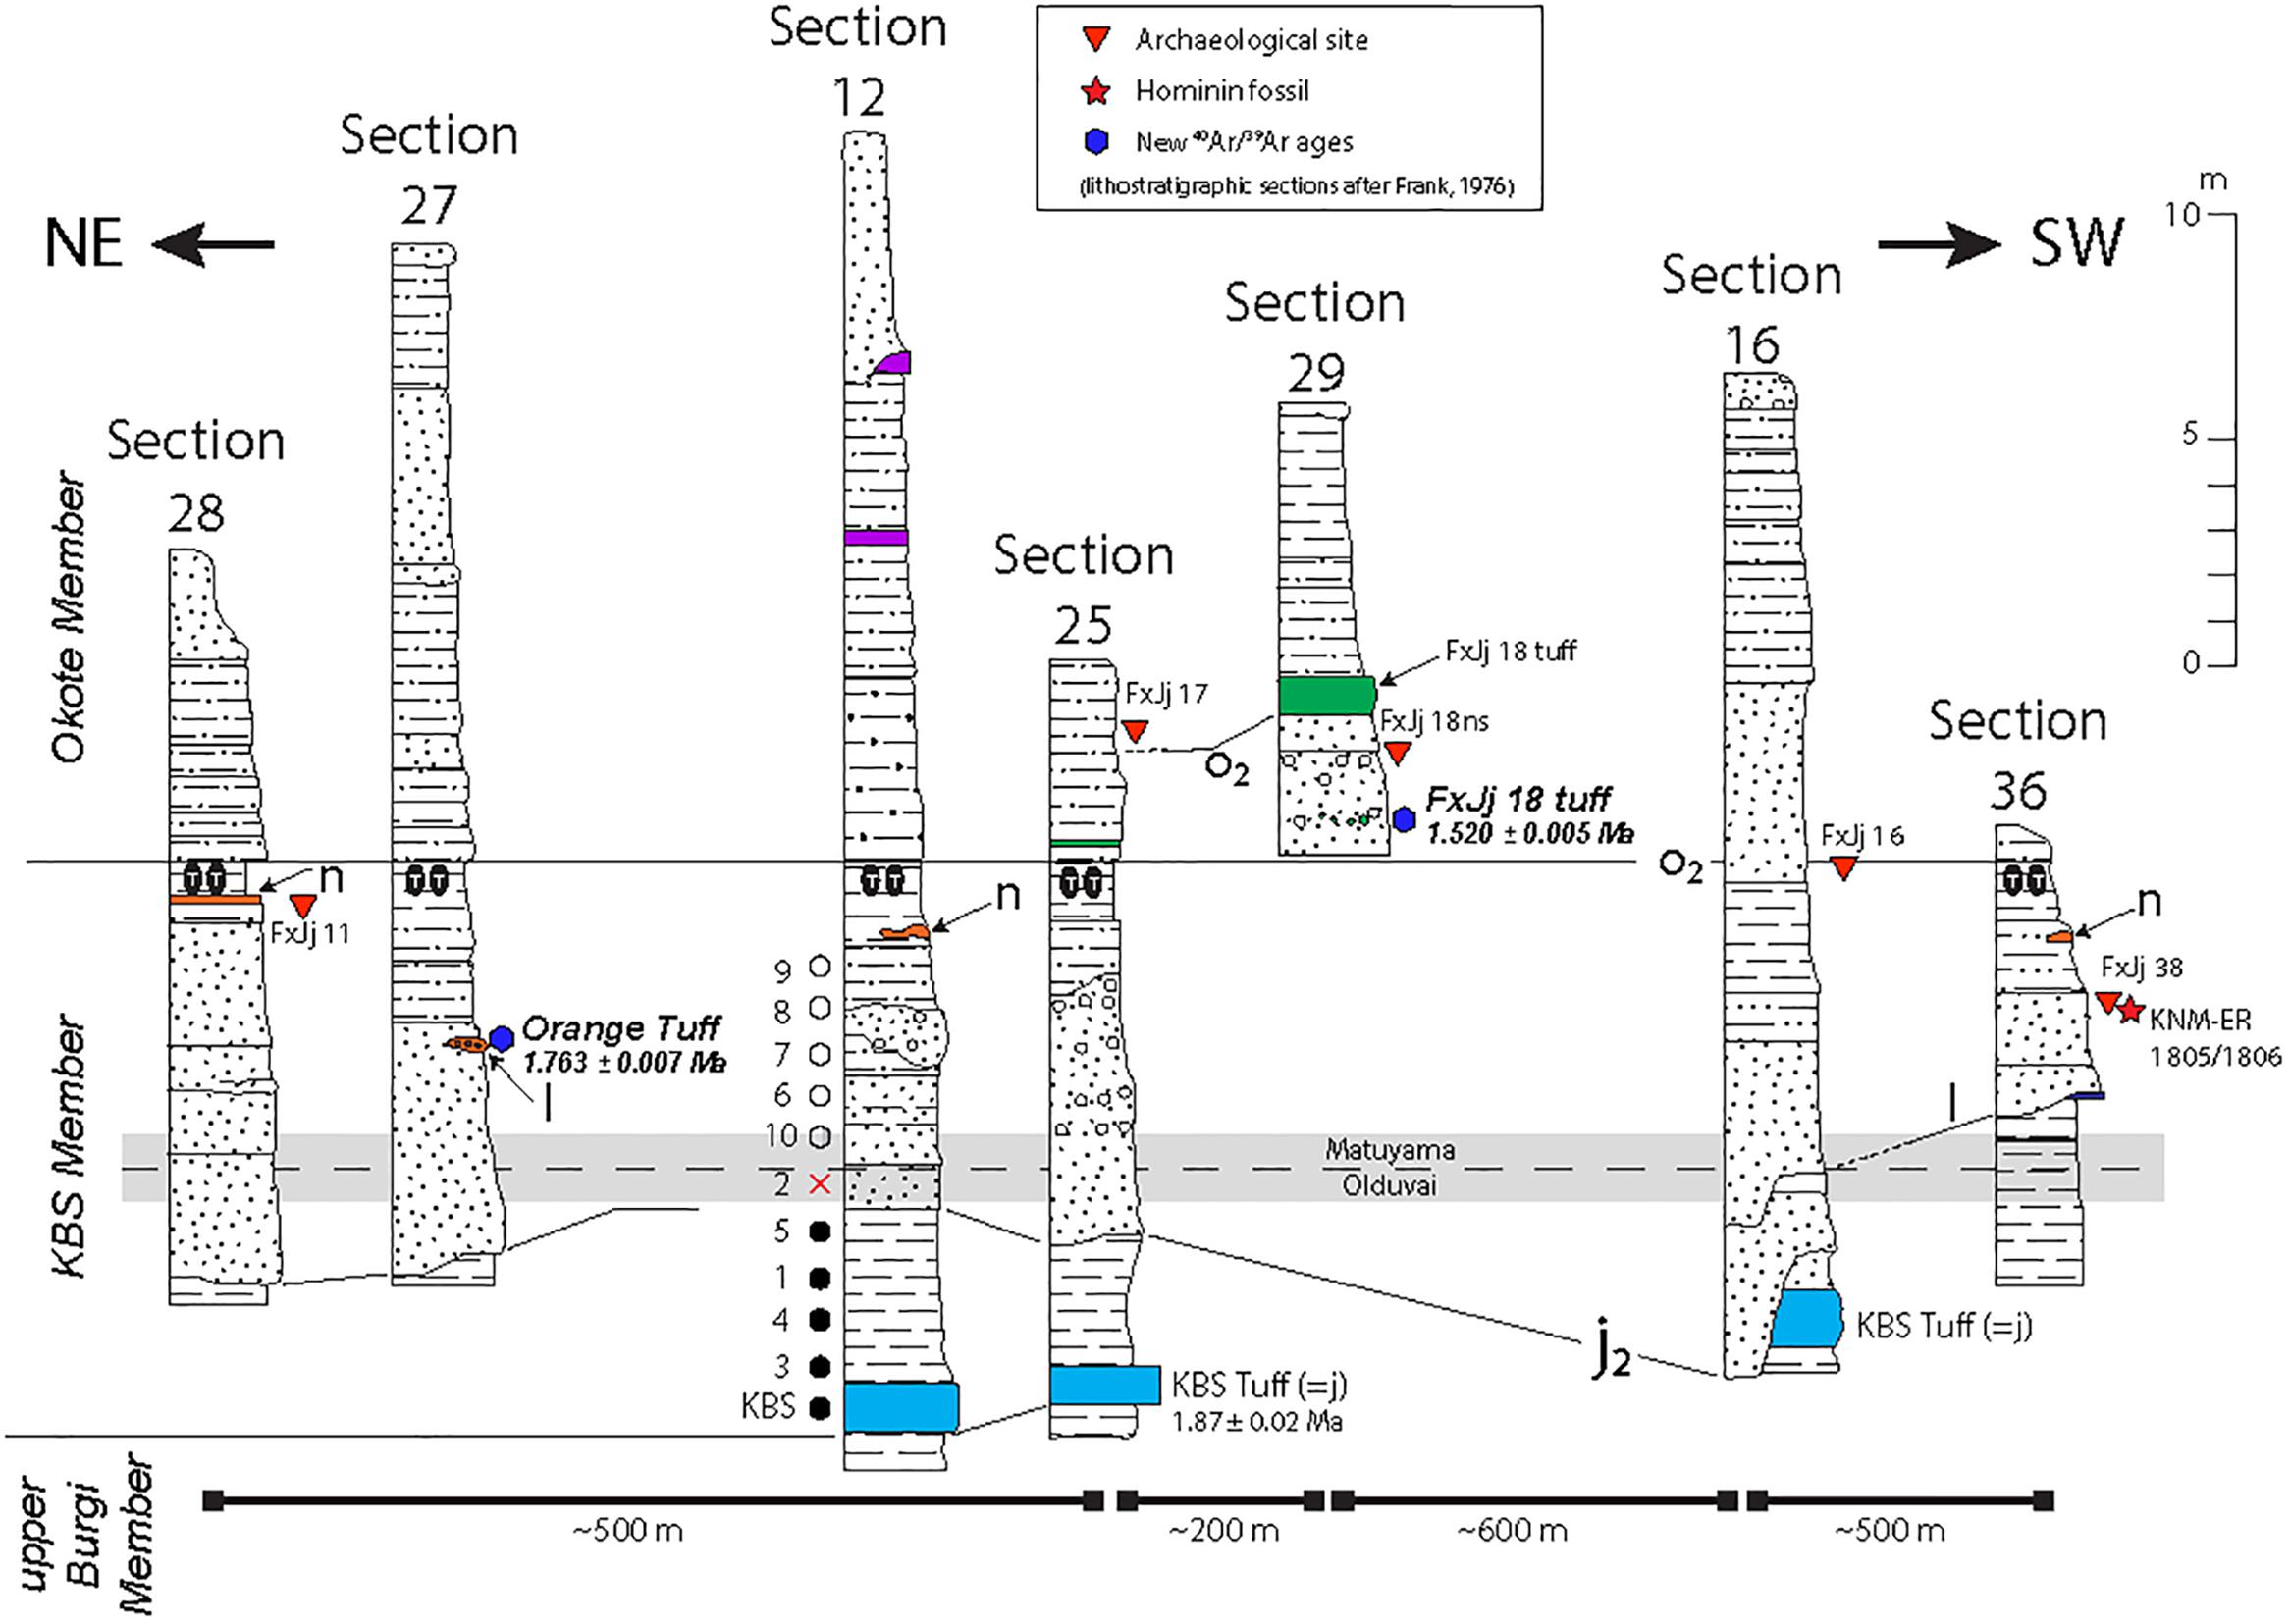
Figure 3. Lithostratigraphic sections modified from Frank (1976). Map view location can be found in Figure 2. Lithological symbols are as follows: open circles = conglomerate, black dots = sandstone, horizontal lines and/or horizontal lines with black dots = mudstone (more/less dots denote coarseness/fineness of the mudstone, ranging from silty claystone to sandy siltstone), black ovals with white Ts indicate well-developed paleosol horizon with carbonate nodules. Purple levels are unnamed tuffs in the study area. Green level is the tuff at archeological site FxJj 18 complex; note green pumices in underlying conglomerates. Along lateral exposure (not depicted) the FxJj 18 tuff merges with the underlying conglomerates and the pumice clasts, which were dated, can be found within the tuff at outcrops exposed between sections 25 and 29. Orange levels are the Orange Tuff where level “n” is fine-grained, while “l” is coarser. Blue levels represent the KBS Tuff. Ages for the Orange Tuff and the FxJj18 Tuff are from this study, age for the KBS Tuff from McDougall and Brown (2006), age for the KBS-Okote boundary from Brown et al. (2006). See section “Review of the Area 130 Stratigraphy” in text for information on alphanumeric mapping units (i.e., j, j2, l, n, and o2) from Frank (1976). Symbols along lower part of section 12 are interpreted paleomagnetic data (numbers match sample analyses reported in Table 1; filled black circles are normal polarity, open circles are reverse polarity, and open circle with gray shading indicates reverse polarity with an intermediate declination direction). Red cross symbol represents a sample with a MAD value >15° and large normal polarity overprint, but has a thermal demagnetization trajectory that clearly bypasses the origin to reveal a reverse polarity direction (see Figure 4 for more detail and orthogonal plots). Additionally we include an estimate location for the Olduvai-Matuyama reversal.
Background to the Study Area
The stratigraphy of the Koobi Fora Formation has been studied over many years and comprehensive stratigraphic records have been described in great detail throughout the Turkana Basin in the Ileret, Karari, Koobi Fora Ridge, Loiyangalani and Allia Bay sub-regions (Brown and Feibel, 1986, 1991; Feibel et al., 1989; Brown et al., 2006; Gathogo and Brown, 2006a, b; McDougall and Brown, 2006; Gathogo et al., 2008). The formation is subdivided into eight members based on the presence of compositionally distinctive volcanic ash layers (for nomenclature see Brown and Feibel, 1986). The stratigraphy across the area is complex; the exposure of each member varies within the sub-regions and members are marked by high lateral and temporal variability. Additionally, although most members can be identified in the field based on their general lithology, in certain areas some members cannot be differentiated as separate formal units because of the lack of exposure of the tuff used to define each formal boundary (e.g., Moiti and Lokochot Members in the Loiyagalani sub-region; Gathogo et al., 2008). There is also a large amount of facies variability within some members. For example, the KBS Member from northeast to southwest varies from fluvial sands, conglomerates, and mudstones to a series of lake-margin, lacustrine, and alluvial deposits across a distance of ∼30 km (Lepre et al., 2007; Lepre, 2017). These difficulties have hampered efforts of dating archeological sites and hominin fossils, and well as underscore the need to individualize chronostratigraphic information for different geographic areas.
Fossil collection area 130 covers ∼15 km2 of Koobi Fora Formation sedimentary outcrops that are exposed along a NE/SW trend. Most of what is available for Area 130 in terms of lithostratigraphic sections, photographs, and description of the sedimentary units comes from graduate student theses and the edited volumes of the Koobi Fora Research Project (e.g., Frank, 1976; Brown and Feibel, 1991). However, these works usually are not peer-reviewed or published, and consequently often provide conflicting information on the stratigraphy of Area 130 that is unresolved. This has contributed to erroneous assumptions when integrating the various types of chrono- and litho-stratigraphic data (Isaac and Behrensmeyer, 1997), and incorrect dates for archeological sites from Area 130 (e.g., Patterson et al., 2017).
Our study focuses on the outcrops exposed in the east-central part of Area 130 (Figures 2, 3). This is nearly 25 km east from the modern shoreline of Lake Turkana and ∼4 km away from the volcanic highlands that form the northeast margin of the lake basin. Area 130 is a headwater location for ephemeral streams that drain west and south to the lake. Streams originating from the Area 130 outcrops erode back the landscape to expose a composite sedimentary section that attains a total thickness of 50–60 m (Frank, 1976). Despite its thickness, the majority of the fossil and archeological sites are derived from a rather thin stratigraphic interval of ∼15 m with the KBS Tuff at its base.
Outcrops consist of mudstones, fluvially reworked and transported rhyolitic tuffs, quartzo-feldspathic sandstones, and basalt clast conglomerates. The outcrops are found in a series of rounded badland-like hills that extend from the easternmost boundaries of central Area 130 for distances of 10’s to 100’s of meter, and can be continuously followed NE/SW for over 2 km (Figure 2). Tectonic dip on the strata is no more than a degree or two into the E/SE.
An abundance of archeological sites and surface scatters of archeological material have been documented from Area 130 (Braun et al., 2008). In our paper, we focus on the original sites described and interpreted by Harris and Isaac (1976): FxJj 11, FxJj 16, FxJj 17, FxJj 18 site complex, and FxJj 38 (Figure 2). The set of observations collected from these original sites shaped the basis for defining the Karari Industry and how it relates to the Oldowan Industrial Complex of Koobi Fora and elsewhere (e.g., Isaac et al., 1997). In contrast, KNM-ER 1805 and KNM-ER 1806 are the only hominin fossils recovered from the outcrops of Area 130 that we have examined for our study (Wood, 1991). KNM-ER 62003 was also recovered from Area 130 but its discovery site is 1-2 km to the NW and associated with the Burgi Member of the formation (Leakey et al., 2012).
Review Of the Area 130 Stratigraphy
It is well established that the sedimentary outcrops of the Koobi Fora Formation in Area 130 are the upper part of the Burgi Member, the KBS Member, and the lower part of the Okote Member (Brown and Feibel, 1991; Isaac and Behrensmeyer, 1997; Brown et al., 2006; Lepre, 2017). Because of the long research history in Area 130 there are several maps and lithostratigraphic datasets that document these members. However, it is at times difficult to interrelate these datasets since the previous research projects had different focuses (e.g., paleontology, archeology, geology) and tended to emphasize the features of the outcrops that were most salient to their objective (e.g., fossil collection, excavation, mapping). Accordingly, we relied upon Frank (1976), which provides a detailed stratigraphic framework for the Area 130 sediments, geological map, and lithological profiles of the outcrops. Frank (1976) described and correlated his stratigraphic sections using alphanumerically coded marker levels that have local and, sometimes, regional significance.
For our review of the Area 130 stratigraphy below, we provide details on how these stratigraphic marker levels relate to the broader stratigraphy of the Koobi Fora Formation. However, not all of the maker levels defined by Frank (1976) can be integrated with the formal type section of the formation because there are pronounced differences between the Area 130 outcrops and the outcrops at which the type section was defined. Furthermore, there is not a single vertical exposure of the type section for the formation. The formal lithostratigraphic succession of the Koobi Fora Formation is an idealized representation that is based upon a series of local sections correlated to each other through tephrostratigraphy (Brown and Feibel, 1986; Feibel et al., 1989). These local sections can be physically separated by more than 30 km. It is also important to note that none of the type sections for the members of the formation can be found in physical superposition at the same outcrop (Brown and Feibel, 1986). In some cases, the local sections are unique and do not compare well with the lithostratigraphy seen in other locations (Gathogo and Brown, 2006a; Gathogo et al., 2008). An example of this is the type section of the Okote Member. The Okote Tuff, which defines the base of this member, is more or less only known from the type section (Brown and Feibel, 1985; Brown et al., 2006). Therefore, interpreting the presence of this member at other localities has relied upon stratigraphic interpolations, assumptions from sedimentary facies associations, and inferences from marker horizons that are in close stratigraphic position with the Okote Tuff at the type section (Brown et al., 2006; Lepre and Kent, 2015).
Three tuffs are described below because of their chronostratigraphic importance for this study of Area 130 (Figure 3): the KBS Tuff, the Orange Tuff, and a tuff the crops out at the FxJj 18 archeological site complex.
Stratigraphic Marker Level j – KBS Tuff
Marker level j is the stratigraphically lowest of the studied successions. It has been interpreted as the KBS Tuff in Area 130 through lithostratigraphic data (Frank, 1976; White et al., 1981) and by glass-shard analyses of trace and minor element compositions (Cerling and Brown, 1982). This tuff is one of the more geographically widespread in the Lake Turkana Basin, known from many Koobi Fora Formation localities and correlative Early Pleistocene outcrops exposed in northwest Kenya and southwest Ethiopia (Brown et al., 2006). It is dated by the single-crystal-sanidine 40Ar/39Ar method to 1.87 ± 0.02 Ma (McDougall and Brown, 2006). The tuff’s base is the boundary between the upper Burgi Member and KBS Member (Brown and Feibel, 1986; Figure 3). As preserved in Area 130 and across the Karari Escarpment, the tuff ranges in thickness from about 25 to 100 cm, comprises medium- to fine-grained rhyolitic glass shards, and locally includes pumices (White et al., 1981). It is largely found as lenticular units that are surrounded by clayey mudstones overprinted with vertic paleosols. Several outcroppings of the KBS Tuff are found at similar stratigraphic levels across the exposures in Area 130.
Stratigraphic Marker Level j2
Stratigraphic marker level j2 can be traced continuously along the outcrops and has been followed for several kilometers into other fossil collections areas of the Karari, such as Area 131 (Frank, 1976). This marker level is defined as a series of sandstones that have a basal erosive contact with interbedded mudstones and lenses of the KBS Tuff. Some literature interprets j2 as a disconformity and refers to it as the “KBS channel complex” or the “post-KBS erosion surface” (Findlater, 1978; Isaac and Behrensmeyer, 1997). Other research argues that j2 is a channel deposit accumulated by cut-and-fill processes and does not associate it with a significant time gap or interpret it as indicative of an unconformity (Brown and Feibel, 1986).
Stratigraphic Marker Levels l and n – Orange Tuff
Area 130 is the type location for the Orange Tuff (Brown et al., 2006). The tuff has a complex stratigraphic occurrence and has a variable lithological composition. In Area 109 (Figure 1), sanidines separated from pumices of the Orange Tuff have been dated by the single-crystal 40Ar/39Ar method to 1.76 ± 0.03 Ma (McDougall et al., 2012).
In Area 130, the tuff occurs as a series of separate, lens-like deposits distributed throughout a ∼5-m-thick interval across some 2 km of lateral outcrop exposure. The lenses vary from a vitric ash composed of sand-sized glass shards to a conglomeratic deposit with pumices, quartzo-feldspathic sands, and pebbles. Frank (1976) mapped the fine-grained variant of this unit as marker level n, whereas at certain outcrops he mapped the coarse variant as level l. In the archeological literature, the coarse variant is referred to as orange pumice gravels (Harris et al., 1997), which is exemplified near archeological site FxJj 38. Beginning at FxJj 11, the fine-grained variant of the Orange Tuff can be traced across the outcrops toward the SW for tens of meters where it coarsens along strike into pumice gravel and eventually pinches out. We collected pumices for dating from a gravel lens near this pinch-out. This gravel lens is a stratum that Frank (1976) designated as one of the occurrences of level l at his stratigraphic section 27 (Figures 2, 3, this study).
Stratigraphic Marker Level o2 and the FxJj 18 Tuff
Level o2 marks the base of the grayish orange tuffaceous siltstone beds in the central portion of Area 130 (Frank, 1976). In the older literature, this is referred to as the Okote tuffaceous silts but now recognized as a lower part of the Okote Member of the Koobi Fora Formation (Brown et al., 2006; Lepre, 2017). The mapping unit designated as level o2 has a variable lithology and stratigraphic position in the study area. This is because it was once thought that only one tuff (the Okote Tuff) was preserved within the interval that is now known as the lower part of the Okote Member, and differences in the lithology and stratigraphic position of this tuff were attributed to fluvial reworking and/or paleo-topography (Frank, 1976; Findlater, 1978; White et al., 1981). Current data indicate the number of distinctive tuffs within the lower part of the Okote Member is at least 25 (McDougall et al., 2012).
According to the work of Frank (1976), the level is 0.8 m above archeological site FxJj 11 in stratigraphic section 28 of the northeast part of Area 130, as well as 2.9 m above FxJj 38 in stratigraphic section 36 of the southwest part of Area 130. However, in the central part of the study area, near the apex of the outcrops, the base of level o2 is marked by a ∼1.5-m-thick, lenticular tuff that effectively caps the FxJj 18 site complex (Frank, 1976). This tuff can be traced laterally to the NE where it pinches out nearly at the same stratigraphic level as archeological site FxJj 17. We refer to this tuff as the “FxJj 18 tuff.” The tuff is a fine-grained vitric ash, which locally includes pumices. Its SW margin intercalates with the conglomerates, sandstones, and mudstones of the FxJj 18 site complex. However, because there are Koobi Fora Formation examples of older pumices being reworked into younger tuff horizons through aqueous depositional processes (Brown and Feibel, 1985), the pumices and tuff at FxJj 18 do not necessarily belong to the same eruptive event.
This tuff exposed at the FxJj 18 site complex does not geochemically correlate to a named tuff of the Koobi Fora Formation (Frank Brown, personal communication to CJL, 2011). However, the FxJj 18 tuff is a constituent of the broadly correlative series of tuff complexes – referred to as the Okote Tuff Complex, the Koobi Fora Tuff Complex, and the Ileret Tuff Complex – that are all allocated to the lower/middle portion of the Okote Member (Cerling and Brown, 1982; Brown et al., 2006). Along the Karari Escarpment and thus in Area 130, it is referred to as the Okote Tuff Complex (Brown and Feibel, 1985). Previous dates for tuffs of this complex fall in the range of 1.6–1.5 Ma (McDougall and Brown, 2006).
A very mature paleosol horizon is overprinted upon the fine-grained sediments that are directly underlying level o2. The paleosol is easily recognized by a well-developed Bk (carbonate) horizon that prominently contrast with the brownish mudstones (Quinn et al., 2007). Lepre (2017) interpreted the contact between the paleosol and stratigraphic marker level o2 as an informal approximation for the boundary between the upper part of the KBS Member and the lower part of the Okote Member. He also inferred that the paleosol is associated with an episode of low/no sediment accumulation lasting on the order of 104–105 years (Lepre, 2017). Other estimates suggest the duration of the hiatus may have been ∼250 kyr (Isaac and Behrensmeyer, 1997; Brown et al., 2006).
Magnetostratigraphy
Methods
For paleomagnetic analyses, we collected 11 orientated, hand-cut, block samples from strata in Area 130. Our samples derived from the outcrop that is represented as stratigraphic section 12 documented by Frank (1976). See Figure 2 for detailed geographic information. We collected upwardly through this section and sampled a ∼10-m-thick stratigraphic interval beginning at the KBS Tuff (Figure 3). In situ azimuths and dips were determined using a compass/inclinometer and fiducial data were scribed onto a sample before removal from the outcrops. These 11 independent block samples were reduced into ∼10 cc cube-shape specimens for analyses. The sample numbers refer to the order they were collected at the outcrops. For some samples (e.g., 130-10), the block was large enough to produce multiple ∼10 cc specimens. In these cases, the specimen labels were appended with lowercase letters and only the specimen with the largest volume/most orthogonal shape was used for experimentation (e.g., 130-10c).
Magnetic remanence measurements were made with a 2G DC- SQUID rock magnetometer in the shielded room at the Paleomagnetics Laboratory of Lamont-Doherty Earth Observatory (Columbia University, United States) (Table 1). We subjected 11 specimens to thermal demagnetization (TD) experiments starting all at an initial step of 100°C. Nine of the 11 specimens were treated to eight steps at 50°C intervals (150–500°C), and seven steps at 25°C intervals (525–675°C), for a total of 16 steps. One specimen (130-10c) was treated to four steps at 100°C (200–500°C) and seven steps at 25°C (525–675°C), for a total of 12 steps. The one specimen from the KBS Tuff was subjected to three steps at 100°C (200–400°C), two steps at 50°C (450 and 500°C) and three steps at 25°C (525–575°C) for a total of nine steps. Principal Component Analysis (PCA; Kirschvink, 1980) was used to fit least-square lines tied to the origin for the final demagnetization trajectories as revealed on orthogonal projection plots (Zijderveld, 1967) (Figure 4).
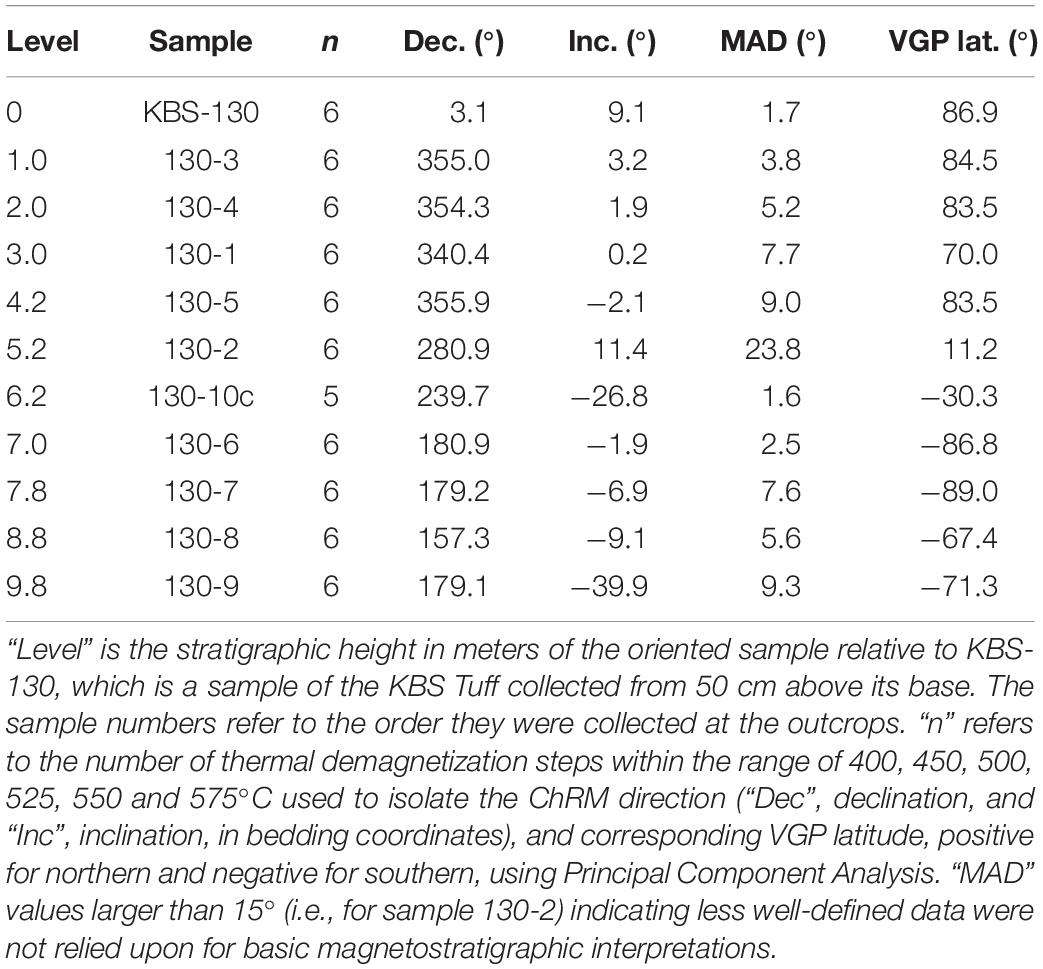
Table 1. Paleomagnetic data for samples from the Area 130 section.
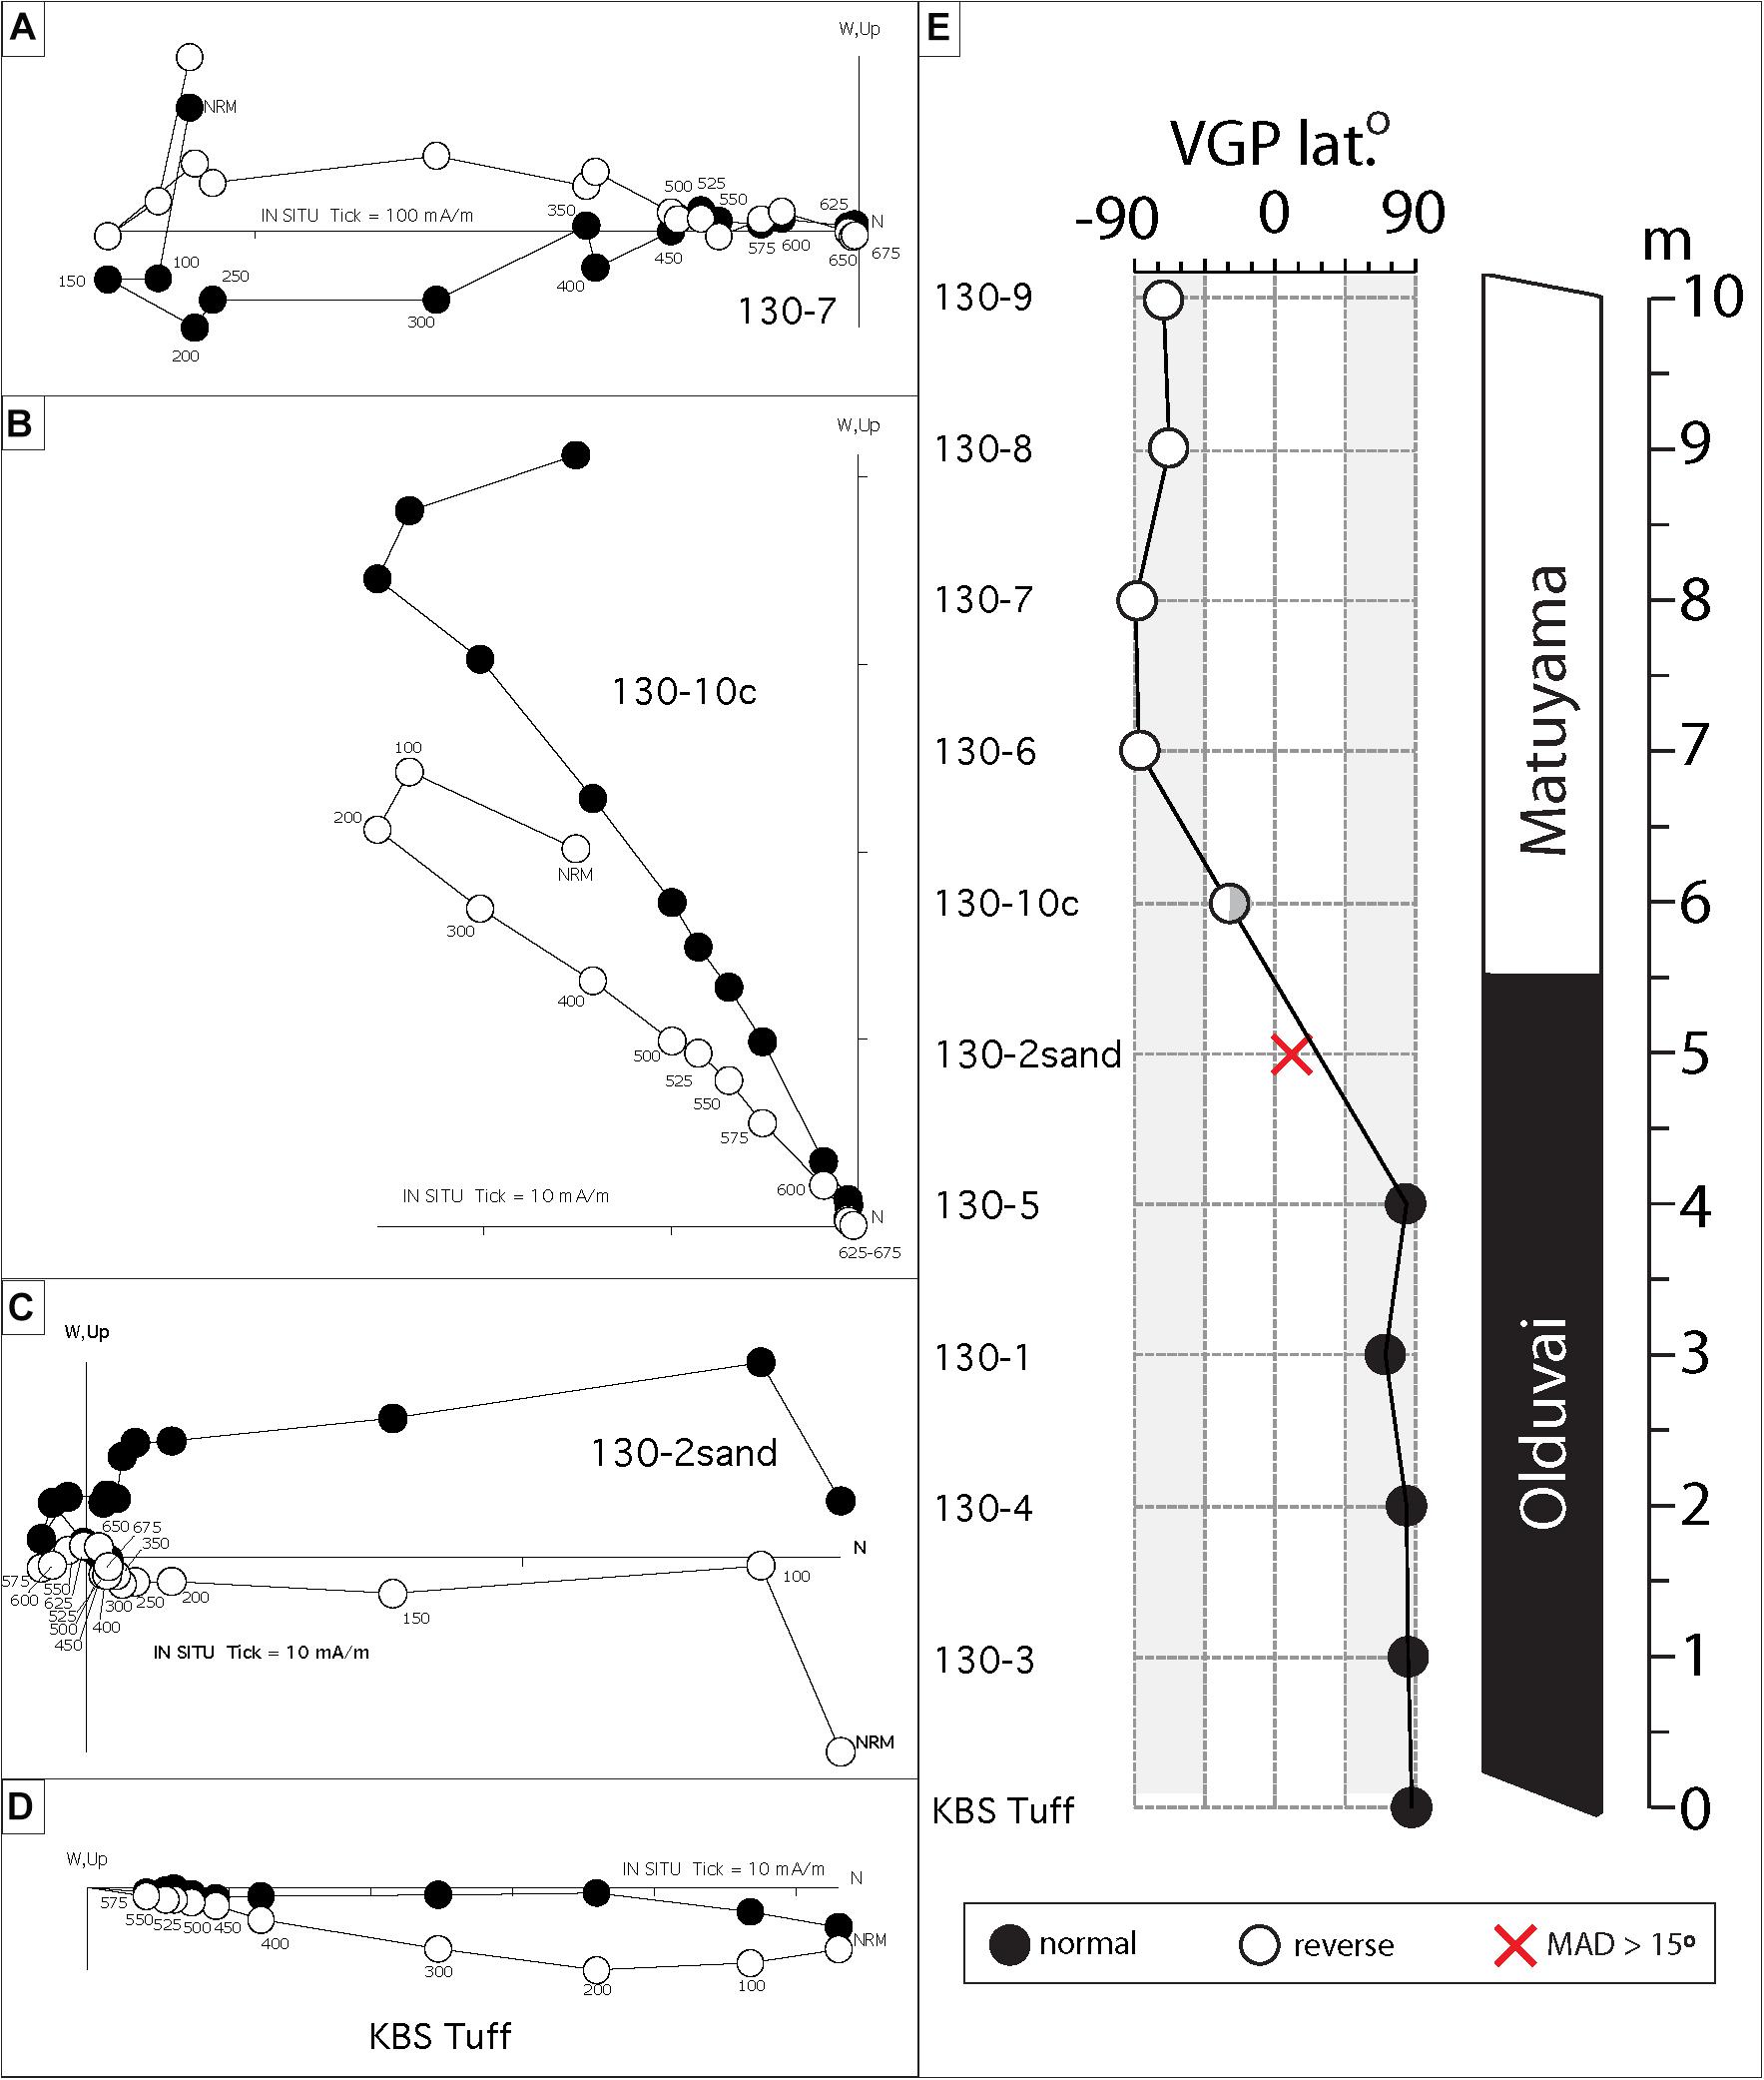
Figure 4. Vector end-point plots of NRM thermal demagnetization data for representative specimens [(A) 130-7, (B) 130-10c, (C) 130-2 sand, and (D) KBS Tuff] from the Area 130 section (see Figure 3 for stratigraphic positions). Open and closed symbols represent the vertical and horizontal projections, respectively, in bedding coordinates. Numbers next to symbols are thermal demagnetization steps in °C. Coherent magnetizations are sometimes present above 575°C and suggest the presence of hematite in these samples. For sample 130-2sand the demagnetization trajectory clearly bypasses the origin and turns around to a reverse direction indicating a relatively strong normal polarity overprint. The Olduvai-Matuyama transition may be close to that sample level. (E) Results indicate the presence of a lower magnetozone of normal polarity from the KBS Tuff upwardly through the stratigraphic level of sample 130-5. An overlying magnetozone of reverse polarity is interpreted from samples 130-6 to 130-9 (filled black circles are normal polarity, open circles are reverse polarity, open circle with gray shading indicates probable reverse polarity with a declination direction within 90° of southerly, while the red cross symbol represents a sample with a MAD value >15° and large normal polarity overprint, but has a thermal demagnetization trajectory that clearly bypasses the origin to reveal a reverse polarity direction).
Magnetostratigraphic Interpretations
Thermal demagnetization experiments adequately resolved characteristic directions in nearly every sample analyzed. The lone exception was for 130-2, which was collected from a silty sandstone layer. Data for this sample were rejected due to a maximum angular deviation (MAD) value that exceeded 15°.
In most cases, the protocol removed a viscous component by TD steps within the range of 100–200°C. Although for several samples the magnetization is coherent after treatments >575°C, suggesting the presence of hematite, the best-defined demagnetization vectors, defined by the lowest MAD values, are usually resolved by five or six consecutive temperature steps within the range of 400–575°C (Figure 4). The component represented by this temperature range is interpreted as the Characteristic Remanent Magnetization (ChRM).
Paleomagnetic analysis of the KBS Tuff indicates normal polarity (shallow northerly ChRM directions), consistent with its radiometric date and other magnetostratigraphic studies (Hillhouse et al., 1986; McDougall et al., 2012). We interpret a lower magnetozone of normal polarity from the KBS Tuff upwardly through the stratigraphic level of sample 130-5. An overlying magnetozone of reverse polarity is interpreted from the stratigraphic positions of samples 130-6 to 130-9. Sample 130-10c has a declination of more than 90°, which could be regarded as reverse, or at least transitional polarity. Hence, we place the stratigraphic position of a paleomagnetic polarity reversal midway between sample 130-5 and 130-6, which respectively have well-defined normal and reverse polarity directions. Consequently, the normal to reverse polarity reversal falls ∼6 m above the base of the KBS Tuff, dated to ∼1.87 Ma (McDougall and Brown, 2006). Therefore, it appears that the normal magnetozone of Area 130 can be correlated to the upper part of the normal Olduvai Subchron (Subchron C2n) and the overlying reverse magnetozone to the succeeding reverse Matuyama Chron (C1r.2r). The normal to reverse polarity reversal is thus correlated to the termination of the Olduvai Subchron, which is dated to ∼1.78 Ma by astrochronology (Lourens et al., 2004).
For some other sections of the Turkana Basin, the top of the normal Olduvai Subchron has a fine-scale structure that is characterized by a reverse-normal-reverse polarity reversal stratigraphy – with the uppermost reverse correlated to the Matuyama Chron (C1r.2r). From Area 104 of Koobi Fora (Figure 1), paleomagnetic directions associated with MAD values >15° have been interpreted as probable evidence for this fine-scale structure of the top of the Olduvai (Lepre and Kent, 2015). We hesitate to interpret sample 130-2 as indicative of similar evidence. Although the MAD value associated with this sample is >15°, the demagnetization trajectory of 130-2 indicates a strong normal polarity overprint and clearly bypasses the origin to ultimately suggest reverse paleomagnetic directions (Figure 4). The Olduvai-Matuyama reversal boundary may in fact be closer to this sample level than above it (Figure 4).
40Ar/39Ar Dating
Methods
We obtained 40Ar/39Ar analyses of single crystals of feldspars from pumice clasts in previously undated tuffaceous strata that crop out in Area 130. The collected pumices were 5–10 cm in diameter. Crystals with density between 2.55 and 2.65 g/cc were separated using LST Heavy Liquids after crushing and sieving these pumices.
Separated crystals were co-irradiated in a 12-pit aluminum disk with two pits filled with Alder Creek sanidine (Turrin et al., 1994), and J values were calculated assuming an age of 1.185 ± 0.0016 Ma (Rivera et al., 2013; see also Niespolo et al., 2017) for 8 h in the USGS TRIGA reactor in Denver. Fifteen crystals of Alder Creek were analyzed from two pits (8 and 7 each in pits 4 and 12). A single J-value of 0.0001199 and associated uncertainty of 3.17e-7 (1 sigma) was calculated for the 15 crystals. The two pits yielded consistent values demonstrating minimal need to account for flux variability and have been combined together resulting into an age of 1.183 ± 0.002 Ma (see Supplementary Figure S1 and Supplementary Table S1). For additional quality control, co-irradiated Bishop Tuff sanidines from a pumice clast were irradiated in the same two pits as the Alder Creek sanidine giving an age of 0.748 ± 0.006 Ma, statistically younger than the zircon age by Crowley et al. (2007) revealing potential method biases at the 2% level.
Irradiated samples were placed in the wells of a copper tray and mounted in the vacuum extraction system for argon measurement at the Argon Geochronology for the Earth Sciences (AGES) Lab of the Lamont-Doherty Earth Observatory. Each sample aliquot was fused with 7 Watts power from a CO2 laser. Released gas was measured on a Micromass VG 5400 noble gas mass spectrometer at Lamont-Doherty Earth Observatory.
Isotopic data from the mass spectrometer were corrected for full system blanks, mass discrimination based on frequent measurements of blanks and air pipettes with approximately 4e-14 moles of argon. Nucleogenic interference corrections are based on Dalrymple et al. (1981). Although these corrections may vary slightly over the years, they are small due to the low Ca/K of the samples, the cadmium shielding and the relatively short irradiation time. Corrections for initial argon assume an atmospheric composition of 298.6 (Lee et al., 2006).
Data are presented on age-probability diagrams created in MassSpec (e.g., as in Deino and Potts, 1992), which assume that the errors for an age determination have a Gaussian distribution.
Results
40Ar/39Ar data are presented in Figure 5 and raw data are available in Supplementary Table S1.
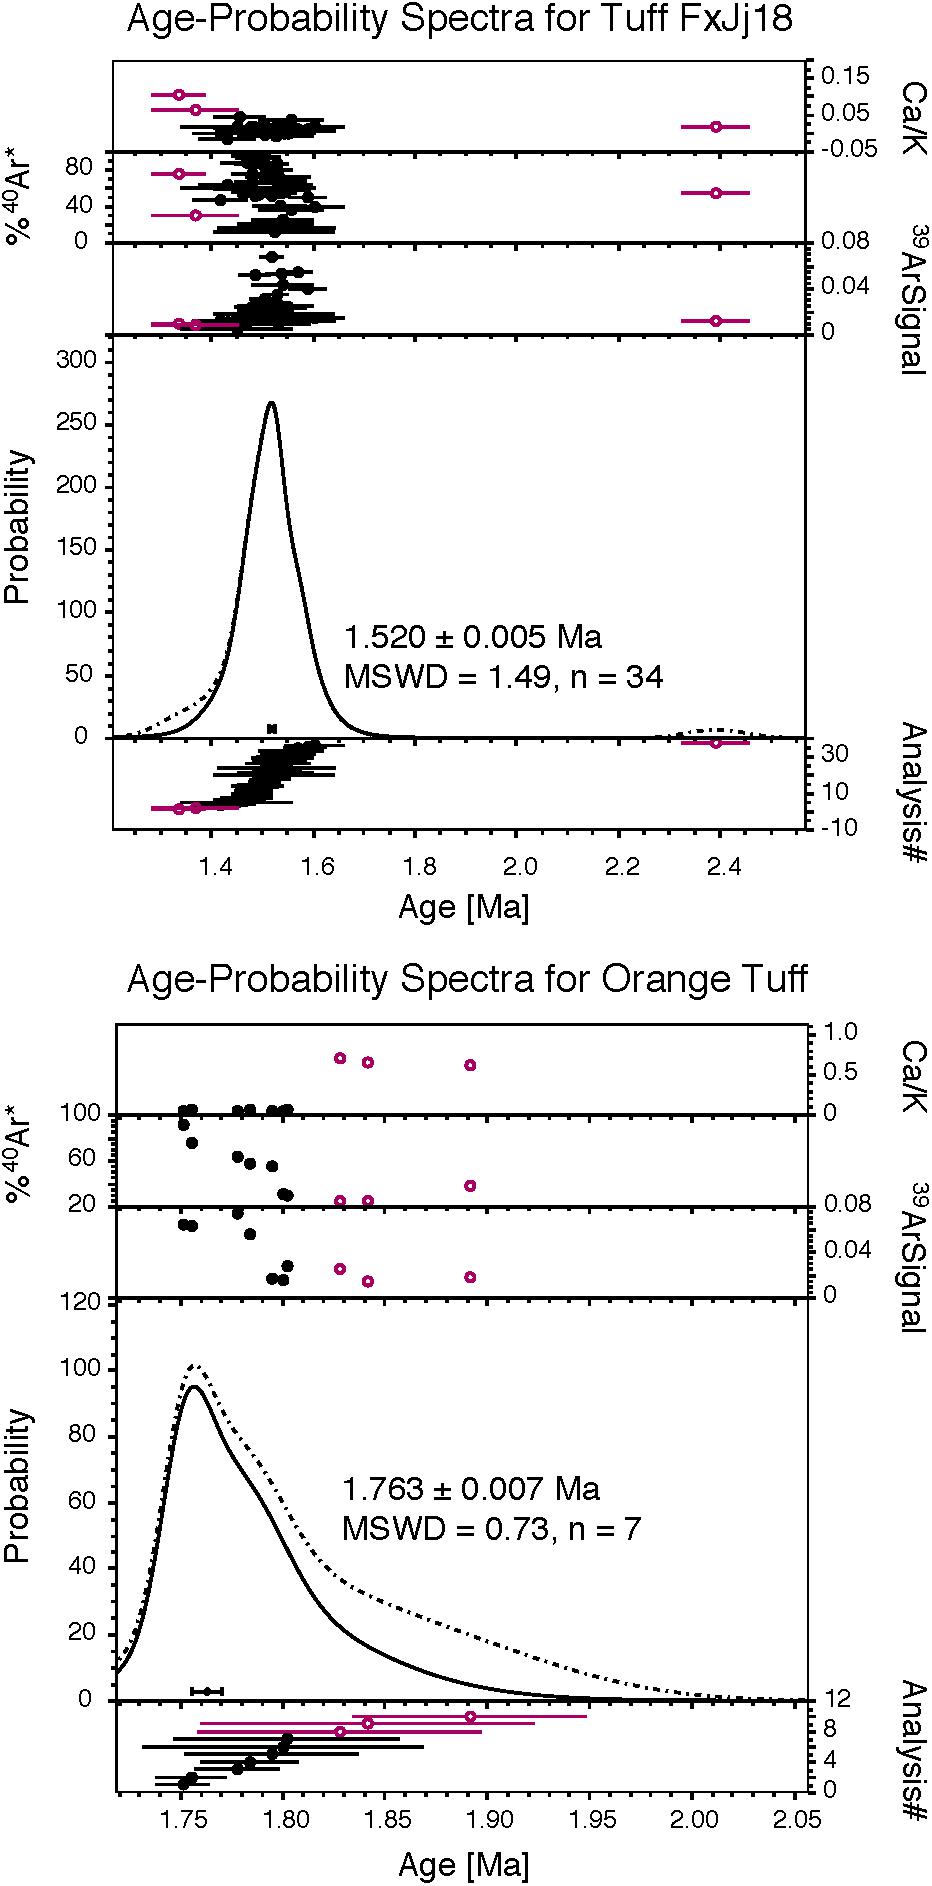
Figure 5. Results of total fusion single crystal 40Ar/39Ar analyses for feldspars from the FxJj18 tuff and the Orange Tuff. All reported errors are 1-sigma. See Supplementary Table S1 for detailed total fusion data and analytical conditions. High Ca/K ratios are used to screen grains that are not sanidines. Empty symbols represent data omitted from the calculated age.
Orange Tuff
Although Area 130 is the type locality for the Orange Tuff, the tuff from Area 130 has never been directly dated (Brown et al., 2006). However, in Area 109 of Koobi Fora (Figure 1), the Orange Tuff has been dated using the 40Ar/39Ar method with a reported date of 1.760 ± 0.026 Ma; this is a calculated arithmetic mean age derived from single-crystal age measurements on feldspars from three pumice clasts (McDougall et al., 2012).
Of the three pumice clasts selected for analyses (GPS coordinates: 4°11′0.06″N, 36°26′8.16″E), two yielded K-feldspar (p1 and p3) while p2 yielded plagioclase. The ages of the clasts yielding K-feldspar are consistent and have been combined together to obtain our best estimate for the age of the Orange Tuff at 1.763 ± 0.007 Ma (Figure 5). This age is consistent with the stratigraphic position of the Orange Tuff in Area 130 below the FxJj 18 tuff (see section “Discussion: Age of the Paleoanthropological Sites” below) and above the KBS Tuff (∼1.87 Ma). Moreover, the Orange Tuff has been correlated with Tuff J of the Shungura Formation of Ethiopia. Tuff J lies within the reverse Matuyama Chron at a level that is some 5 m above the top of the Olduvai Subchron in the Shungura Formation (Brown et al., 1978). As previously discussed, the top of the Olduvai is dated to ∼1.78 Ma. For Area 130, our interpreted position for the Orange Tuff is ∼3 m above the top of the Olduvai. Therefore, there is very good agreement between the dates for the Orange Tuff in Area 109 and Area 130, and the magnetostratigraphic position of the Orange Tuff in Area 130 and Tuff J (Orange Tuff equivalent) in the Shungura Formation. Similarly, the Kayle Tuff-1 of the Konso Formation of Ethiopia has been correlated to the Orange Tuff and is found just above the top of the Olduvai Subchron (Beyene et al., 2013).
FxJj 18 Tuff
Archeological site complex FxJj 18 is preserved through a 3–5 m thick horizon that is comprised of tuff, mudstone, sandstone, and conglomerate (Kaufulu, 1987). Large pumice clasts interstratified with the archeological levels are not common. Pumice clasts were collected from a lens of gravel that intercalates with the tuff at FxJj 18 (GPS coordinates: 4°10′50.97″N, 36°25′56.05″E). Despite their relatively small size, these clasts had visible K-feldspar phenocrysts amenable for single crystal 40Ar/39Ar dating. Two pumices selected for analyses yielded compatible ages which have been combined together resulting into our best estimate of 1.520 ± 0.005 Ma (Figure 5).
Although there have been no efforts to radiometrically date tuffs in Area 130, our age determinations are consistent with expectations for the FxJj 18 tuff. Several studies have used lithostratigraphy, facies data, and the position of the KBS Tuff to infer that the FxJj 18 site complex lies within the lower/middle part of the Okote Member (Isaac and Behrensmeyer, 1997). Lepre (2017) wrongly estimated a date of ∼1.54 Ma for the tuff at FxJj 18. This estimation largely was based on the ∼5 m thickness of strata between the FxJj 18 tuff and the underlying well-developed paleosol that approximates the contact between the top of the KBS and the base of the Okote members in Area 130. The base of the Okote Member has been estimated at 1.56 ± 0.05 Ma (McDougall and Brown, 2006). Our age for the FxJj 18 tuff is consistent with its ∼5 m position above the approximate contact between the two members. However, McDougall and Brown (2006) suggest that a tuff in the Okote Member with a date of 1.51–1.52 Ma should be ∼20 m above the base of this member. One explanation for this discrepancy might be a significant amount of missing strata associated with the depositional hiatus that is represented by the well-developed paleosol (Isaac and Behrensmeyer, 1997; Brown et al., 2006; Lepre, 2017). An additional contribution to the discrepancy might be that the date and error for the base of the Okote Member are estimates inferred from the sedimentation rates of different sub-regions separated by ∼30 km (Brown et al., 2006; McDougall and Brown, 2006).
Discussion: Age of the Paleoanthropological Sites
Paleoanthropological studies use members of the Koobi Fora Formation as a chronostratigraphic tool for segregating the Area 130 archeological sites (Rogers et al., 1994; Isaac and Behrensmeyer, 1997; Braun et al., 2008). In addition, the distinction of a stone tool site as KBS or Okote has been used as an archeological classificatory entity, connoting different hominin behaviors (Rogers et al., 1994; Isaac et al., 1997; Braun et al., 2008). Members of the Koobi Fora Formation are defined by tuffaceous marker horizons (Brown and Feibel, 1986). Each member is delimited at its base by a boundary tuff that the member takes its name from. A member includes all strata between its base and the superjacent boundary tuff of the overlying member. Unambiguously, the KBS Tuff identifies the boundary between the Burgi and KBS Members in Area 130. The stratigraphic level of the boundary between the KBS Member and the Okote Member cannot be identified as clearly because the Okote Tuff has yet to be found cropping out in Area 130. As discussed earlier, Lepre (2017) interpreted that a useful informal boundary for the upper KBS and lower Okote Members in Area 130 resides with the contact between the well-developed paleosol and the overlying stratigraphic marker level o2.
For the Koobi Fora Formation, the use of (un-compacted) sedimentation rates has been the preferred way to date archeological and fossil sites; that is, a site’s geologic age is estimated by linearly interpolating between two dated horizons (Feibel et al., 1989; McDougall et al., 2012). Our particular situation is not well suited for this approach because of the rather thin stratigraphic interval under consideration (∼15 m thick) and the potential hiatus in sediment accumulation represented by the paleosol horizon near the o2 stratigraphic marker level. Moreover, the Orange Tuff and the top of the Olduvai Subchron have nearly the same date, but the Orange Tuff has a variable (i.e., reworked and re-deposited) stratigraphic occurrence.
The most straightforward age determination is for the FxJj 18 site complex, as the archeological levels are interstratified with the tuff and associated sanidine-bearing pumices that we have radiometrically dated to 1.520 ± 0.005 Ma (Figure 5). FxJj 17 is found at approximately 200 m to the northeast of FxJj 18 site complex. It is virtually at the same stratigraphic level as the site complex; thus, the age of FxJj 17 effectively is equal to the age of FxJj 18. FxJj 16 lies a few meters stratigraphically below FxJj 17 and 18. It is contained within a large channel sandstone that incises downward through the stratigraphic marker level o2 and into the well-developed paleosol. FxJj 16 thus has a geological age that is nearly the same as or marginally older than FxJj 18 and FxJj 17. The FxJj 18 archeological site complex and the FxJj 16 and 17 archeological sites are interpreted to be within the Okote Member.
FxJj 11, FxJj 38, KNM-ER 1805, and KNM-ER 1806 are all at nearly the same stratigraphic level and clearly underlie the stratigraphic marker level o2 and the uppermost preserved level of the well-developed paleosol. Therefore, these fossils and archeological sites are below the base of the Okote Member. All can also be placed above the KBS Tuff, indicating that FxJj 11, FxJj 38, KNM-ER 1805, and KNM-ER 1806 belong to the KBS Member.
FxJj 38, KNM-ER 1805, and KNM-ER 1806 were excavated from vertical levels that are within a few decimeters of each other. These three sites are located in the southeast part of the study area. FxJj 11 is located some 1500 m to the northeast and ∼2 m higher within the Area 130 section. All four sites are broadly constrained between 1.78 and 1.52 Ma. These constraints disagree with the interpretation of Feibel et al. (1989) that gave an age for the hominin fossils KNM-ER 1805, 1806 of 1.85 Ma. The alternative age of ∼1.6 Ma proposed by Gathogo and Brown (2006a) is not likely either considering that the Orange Tuff directly overlies or is interbedded with the sediments containing FxJj 11, FxJj 38, KNM-ER 1805, and KNM-ER 1806. Our data suggests that the Orange Tuff has an eruptive age of 1.763 ± 0.007 Ma (Figure 5). Importantly, this tuff clearly crops out above the stratigraphic level of the top of the Olduvai Subchron, which is dated to ∼1.78 Ma. Therefore, the stratigraphic levels of FxJj 11, FxJj 38, KNM-ER 1805, KNM-ER 1806, and the Orange Tuff are younger than 1.78 Ma. McDougall et al. (2012) attained a similar age for KNM-ER 1805 and 1806 suggesting an age of 1.75 ± 0.05 Ma. FxJj 11, FxJj 38, KNM-ER 1805, KNM-ER 1806 clearly allocate to the KBS Member and date very close to the eruptive age of the Orange Tuff at ∼1.76 Ma.
Conclusion
Area 130 of Koobi Fora is a locality particularly rich of artifacts and hominin fossils. Sediments within this area have been excavated and compared to other localities throughout the Koobi Fora region to understand the behavior of Early Pleistocene hominins. Area 130 is especially noteworthy for hominin fossils KNM-ER 1805 (Homo) and 1806 (Paranthropus) as well as the FxJj 18 site complex, which represents one of the type localities for the Developed Oldowan of Koobi Fora. Despite being studied for decades, tight temporal constraints of these sites have been lacking enabling conflicting interpretations for the dates of KNM-ER 1805 and 1806 hominin fossils.
This study presents new high precision single crystal 40Ar/39Ar dating on k-feldspar separates conducted on individual pumices from the Orange Tuff (1.763 ± 0.007 Ma) and the FxJj 18 tuff (1.520 ± 0.005 Ma). Orientated paleomagnetic samples from the strata of the KBS Member were collected and used to develop a magnetostratigraphic section for Area 130. The results of this research suggest that archeological sites FxJj 16, 17, and 18 site complex belong to the Okote Member and date to 1.52 Ma. Archeological sites FxJj 11, 38 and hominin fossils KNM-ER 1805 and 1806 belong to the KBS Member and date to about 1.76 Ma.
Now that the outcrops of Area 130 are better understood stratigraphically and geochronologically, the archeology and hominin fossils can be evaluated with other paleoanthropological sites within the northeast Turkana Basin. A cursory comparison is presented in Figure 6, with select fossil representatives of Homo habilis, Homo erectus, and Paranthropus boisei (Wood, 1991; Spoor et al., 2007; Leakey et al., 2012) and the classic KBS Member sites FxJj 1 and 3 (Isaac et al., 1997). It is apparent from this comparison that the first appearance of the Karari Industry, as defined within archeological sites FxJj 18 and FxJj 20, does not correlate with the evolution of a new taxon. The Karari Industry is regarded as a more sophisticated type of stone tool manufacturing – as compared to the classic KBS sites – and defined as Developed Oldowan, which is taken to indicate a more cognitively advanced stone-tool maker (Rogers et al., 1994; Braun et al., 2008). However, our study demonstrates that the stone-tool innovations of the Karari Industry do not correlated with the arrival of a cognitively advanced hominin. This would seem to point at the environment or a change in hominin behavior as the cause for the stone-tool change. Recent isotopic studies have shown that the genus Homo in the Turkana Basin significantly increased its consumption of C4 resources beginning at 1.65 Ma (Patterson et al., 2019). Therefore, the advent of the Karari Industry may be a response to a change in diet.
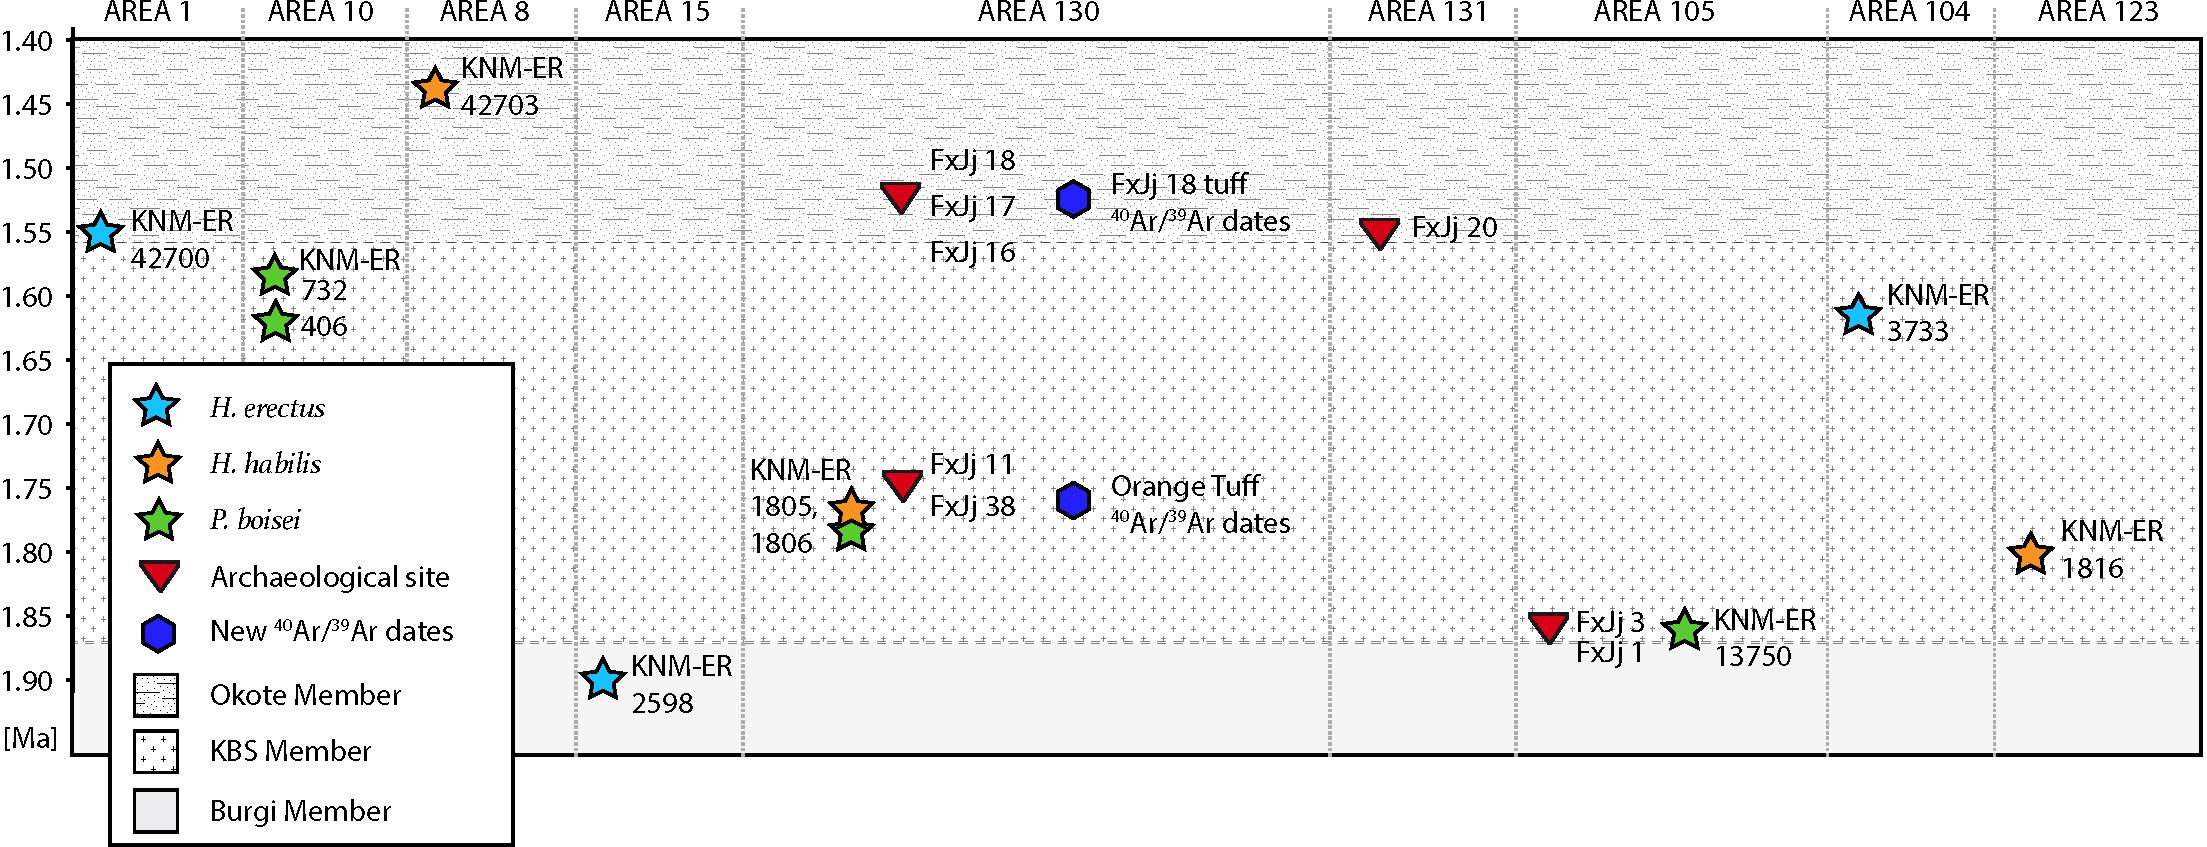
Figure 6. Chronostratigraphic chart showing the position of sites from Area 130 (this study) and their correlations with selected fossils and archeological sites elsewhere in the Koobi Fora Formation. See Figure 1 for geographic location of areas listed at the top of the figure. Age for the KBS Tuff and for the KBS-Okote boundary from McDougall and Brown (2006).
Data Availability
All datasets generated for this study are included in the manuscript/Supplementary Files.
Author Contributions
CL and SM designed the study. CL conducted field research and collected the samples. SM crushed the samples and picked the grains to be dated. SH run the samples for 40Ar/39Ar dating. CL and DK collected and analyzed the paleomagnetic data. SM and CL wrote the manuscript with contributions from SH and DK.
Conflict of Interest Statement
The authors declare that the research was conducted in the absence of any commercial or financial relationships that could be construed as a potential conflict of interest.
Acknowledgments
We are grateful for the opportunity to contribute in this special volume. The Government of Kenya is thanked for allowing the research and its permission to export the rock samples out of the country. National Museums of Kenya kindly provided affiliation. CL conducted the fieldwork (permits NACOSTI/P/15/0767/6515 and NCST/RRI/12/1/BS011/54) and acknowledges the support provided by the Turkana Basin Institute and the Koobi Fora Research Project. The Director of Lamont-Doherty Earth Observatory of Columbia University is acknowledged for contributing critical support for the Paleomagnetics Laboratory. We thank the two reviewers for their thoughtful reviews and constructive suggestions. Lamont-Doherty Earth Observatory contribution #8351.
Supplementary Material
The Supplementary Material for this article can be found online at: https://www.frontiersin.org/articles/10.3389/feart.2019.00230/full#supplementary-material
FIGURE S1 | Results of total fusion single crystal 40Ar/39Ar analyses for Alder Creek and Bishop Tuff standards. All reported errors are 1-sigma. See Supplementary Table S1 for detailed total fusion data and analytical conditions.
TABLE S1 | 40Ar/39Ar total fusion data and analytical conditions.
References
Beyene, Y., Katoh, S., WoldeGabriel, G., Hart, W. K., Uto, K., Sudo, M., et al. (2013). The characteristics and chronology of the earliest acheulean at konso, ethiopia. Proc. Natl. Acad. Sci. U.S.A. 110, 1584–1591. doi: 10.1073/pnas.1221285110
Braun, D. R., Rogers, M. J., Harris, J. W., and Walker, S. J. (2008). Landscape-scale variation in hominin tool use: evidence from the developed oldowan. J. Hum. Evol. 55, 1053–1063. doi: 10.1016/j.jhevol.2008.05.020
Brown, F. H., and Feibel, C. S. (1985). Stratigraphical notes on the okote tuff complex at koobi fora. Kenya. Nature 316, 794–797. doi: 10.1038/316794a0
Brown, F. H., and Feibel, C. S. (1986). Revision of lithostratigraphic nomenclature in the koobi fora region. Kenya. J.Geol. Soc. 143, 297–310. doi: 10.1144/gsjgs.143.2.0297
Brown, F. H., and Feibel, C. S. (1991). “Stratigraphy, depositional environments and palaeogeography of the koobi fora formation,” in Koobi Fora Research Project Volume 3: Stratigraphy, Artiodactyls and Palaeoenvironments, ed. J. M. Harris, (Oxford: Clarendon Press), 1–30.
Brown, F. H., Haileab, B., and McDougall, I. (2006). Sequence of tuffs between the KBS tuff and the chari tuff in the turkana basin, kenya and ethiopia. J. Geol. Soc. 163, 185–204. doi: 10.1144/0016-764904-165
Brown, F. H., Shuey, R. T., and Croes, M. K. (1978). Magnetostratigraphy of the shungura and usno formations, southwestern ethiopia: new data and comprehensive reanalysis. Geophys. J. R. Astron. Soc. 54, 519–538. doi: 10.1111/j.1365-246x.1978.tb05492.x
Cerling, T. E., and Brown, F. H. (1982). Tuffaceous marker horizons in the koobi fora region and the lower omo valley. Nature 299, 216–221. doi: 10.1038/299216a0
Crowley, J. L., Schoene, B., and Bowring, S. A. (2007). U-Pb dating of zircon in the bishop tuff at the millennial scale. Geology 35, 1123–1126.
Dalrymple, G. B., Alexander, E. C. J., Lannphere, M. A., and Kraker, G. P. (1981). Irradiation of samples for 40Ar/39Ar dating using the Geological Survey TRIGA reactor. Virginia: U.S. Geological Survey, Professional Paper.
Deino, A., and Potts, R. (1992). Age–probability spectra for examination of single- crystal 40Ar/39Ar dating results: examples from olorgesailie, southern kenya rift. Q. Int. 13–14, 47–53. doi: 10.1016/1040-6182(92)90009-q
Feibel, C. S., Brown, F. H., and McDougall, I. (1989). Stratigraphic context of fossil hominids from the omo group deposits: northern turkana basin, kenya and ethiopia. Am. J. Phys. Anthropol. 78, 595–622. doi: 10.1002/ajpa.1330780412
Findlater, I. C. (1978). Isochronous surfaces within the plio-pleistocene sediments east of lake turkana. Geol. Soc. Spec. Publ. 6, 415–420. doi: 10.1144/gsl.sp.1978.006.01.28
Frank, H. (1976). Stratigraphy of the Upper Member, Koobi Fora Formation, Northern Karari Escarpment, East Turkana Basin, Kenya. Master’s Thesis, Iowa State University, Ames, IA.
Gathogo, P. N., and Brown, F. H. (2006a). Revised stratigraphy of area 123, koobi fora, kenya, and new age estimates of its fossil mammals, including hominins. J. Hum. Evol. 51, 471–479. doi: 10.1016/j.jhevol.2006.05.005
Gathogo, P. N., and Brown, F. H. (2006b). Stratigraphy of the koobi fora formation (pliocene and pleistocene) in the ileret region of northern kenya. J. Afr. Earth Sci. 45, 369–390. doi: 10.1016/j.jafrearsci.2006.03.006
Gathogo, P. N., Brown, F. H., and McDougall, I. (2008). Stratigraphy of the koobi fora formation (pliocene and pleistocene) in the loiyangalani region of northern kenya. J. Afr. Earth Sci. 51, 277–297. doi: 10.1002/evan.20318
Harris, J. W. K., and Isaac, G. L. (1976). The karari industry: early Pleistocene archaeological evidence from the terrain east of lake turkana. Nature 262, 102–107. doi: 10.1038/262102a0
Harris, J. W. K., Isaac, G. L., and Kaufulu, Z. M. (1997). “Sites in the upper KBS, okote, and chari members: reports,” in Koobi Fora Research Project Volume 5: Plio-Pleistocene Archaeology, eds G. L. Isaac, and B. Isaac, (Oxford: Clarendon Press), 115–223.
Hillhouse, J. W., Cerling, T. E., and Brown, F. H. (1986). Magnetostratigraphy of the koobi fora formation, lake turkana, kenya. J. Geophys. Res. Solid Earth 91, 11581–11595. doi: 10.1016/j.jhevol.2015.06.010
Isaac, G. L., and Behrensmeyer, A. K. (1997). Geological context and paleoenvironments. Koobi Fora Res. Project 5, 12–53.
Isaac, G. L., Harris, J. W., and Kroll, E. M. (1997). The stone artefact assemblages: a comparative study. Koobi Fora Res. Project 5, 262–362. doi: 10.1371/journal.pone.0166788
Kaufulu, Z. M. (1987). Formation and preservation of some earlier stone age sites at koobi fora, northern kenya. South Afr. Archaeol. Bull. 42, 23–33.
Kirschvink, J. L. (1980). The least-squares line and plane and the analysis of palaeomagnetic data. Geophys. J. R. Astron. Soc. 62, 699–718. doi: 10.1111/j.1365-246x.1980.tb02601.x
Leakey, M. D. (1971). Olduvai Gorge Vol. 3, Excavations in Beds I and II, 1960-63. Cambridge: Cambridge University Press.
Leakey, M. G., Spoor, F., Dean, M. C., Feibel, C. S., Antón, S. C., Kiarie, C., et al. (2012). New fossils from koobi fora in northern kenya confirm taxonomic diversity in early homo. Nature 488, 201–204. doi: 10.1038/nature11322
Lee, J.-Y., Marti, K., Severinghaus, J. P., Kawamura, K., Yoo, H.-S., Lee, J. B., et al. (2006). A redetermination of the isotopic abundances of atmospheric Ar. Geochim. Cosmochim. Acta 70, 4507–4512. doi: 10.1016/j.gca.2006.06.1563
Lepre, C. J. (2017). Crevasse-splay and associated depositional environments of the hominin-bearing lower okote member, koobi fora formation (Plio-Pleistocene), kenya. Depositional Rec. 3, 161–186. doi: 10.1002/dep2.31
Lepre, C. J., and Kent, D. V. (2015). Chronostratigraphy of KNM-ER 3733 and other area 104 hominins from koobi fora. J. Hum. Evol. 86, 99–111. doi: 10.1016/j.jhevol.2015.06.010
Lepre, C. J., Quinn, R. L., Joordens, J. C., Swisher, C. C. III, and Feibel, C. S. (2007). Plio-Pleistocene facies environments from the KBS member, koobi fora formation: implications for climate controls on the development of lake-margin hominin habitats in the northeast turkana basin (northwest kenya). J. Hum. Evol. 53, 504–514. doi: 10.1016/j.jhevol.2007.01.015
Lourens, L. J., Hilgen, F. J., Shackleton, N. J., Laskar, J., and Wilson, D. (2004). “The neogene period,” in A Geologic Time Scale 2004, eds F. M. Gradstein, J. G. Ogg, and A. G. Smith, (Cambridge: Cambridge University Press), 409–440.
McDougall, I., and Brown, F. H. (2006). Precise 40Ar/39Ar geochronology for the upper koobi fora formation, Turkana Basin, northern Kenya. J. Geol. Soc. 163, 205–220. doi: 10.1144/0016-764904-166
McDougall, I., Brown, F. H., Vasconcelos, P. M., Cohen, B. E., Thiede, D. S., and Buchanan, M. J. (2012). New single crystal 40Ar/39Ar ages improve time scale for deposition of the omo group, omo-turkana basin, east africa. J. Geol. Soc. 169, 213–226. doi: 10.1144/0016-76492010-188
Niespolo, E. M., Rutte, D., Deino, A. L., and Renne, P. R. (2017). Intercalibration and age of the Alder Creek sanidine 40Ar/39Ar standard. Quat. Geochronol. 39, 205–213. doi: 10.1016/j.quageo.2016.09.004
Patterson, D. B., Braun, D. R., Allen, K., Barr, W. A., Behrensmeyer, A. K., Biernat, M., et al. (2019). Comparative isotopic evidence from East Turkana supports a dietary shift within the genus Homo. Nat. Ecol. Evol. 3, 1048–1056. doi: 10.1038/s41559-019-0916-0
Patterson, D. B., Braun, D. R., Behrensmeyer, A. K., Merritt, S., Zliobaite, I., Reeves, J. S., et al. (2017). Ecosystem evolution and hominin paleobiology at east turkana, northern kenya between 2.0 and 1.4 Ma. Palaeogeogr. Palaeoclimatol. Palaeoecol. 481, 1–13. doi: 10.1016/j.palaeo.2017.05.001
Pobiner, B. L., Rogers, M. J., Monahan, C. M., and Harris, J. W. (2008). New evidence for hominin carcass processing strategies at 1.5 ma, koobi fora, kenya. J. Hum. Evol. 55, 103–130. doi: 10.1016/j.jhevol.2008.02.001
Quinn, R. L., Lepre, C. J., Wright, J. D., and Feibel, C. S. (2007). Paleogeographic variations of pedogenic carbonate δ 13C values from koobi fora, kenya: implications for floral compositions of Plio-Pleistocene hominin environments. J. Hum. Evol. 53, 560–573. doi: 10.1016/j.jhevol.2007.01.013
Rivera, T. A., Storey, M., Schmitz, M. D., and Crowley, J. L. (2013). Age intercalibration of 40Ar/39Ar sanidine and chemically distinct U/Pb zircon populations from the Alder Creek Rhyolite Quaternary geochronology standard. Chem. Geol. 345, 87–98. doi: 10.1016/j.chemgeo.2013.02.021
Rogers, M. J., Harris, J. W., and Feibel, C. S. (1994). Changing patterns of land use by Plio-Pleistocene hominids in the lake turkana basin. J. Hum. Evol. 27, 139–158. doi: 10.1006/jhev.1994.1039
Shea, J. J. (2016). Stone Tools in Human Evolution: Behavioral Differences Among Technological Primates. Cambridge: Cambridge University Press.
Spoor, F., Leakey, M. G., Gathogo, P. N., Brown, F. H., Antón, S. C., McDougall, I., et al. (2007). Implications of new early homo fossils from ileret, east of lake turkana, kenya. Nature 448:688. doi: 10.1038/nature05986
Turrin, B. D., Donnelly-Nolan, J. M., and Hearn, B. C., Jr. (1994). 40Ar/39Ar ages from the rhyolite of Alder Creek, California: age of the Cobb Mountain normal-polarity subchron revisited. Geology 22, 251–254. doi: 10.1130/0091-7613(1994)022<0251:AAAFTR>2.3.CO;2
White, H. J., Burggraf, D. R. Jr., Bainbridge, R. B. Jr., and Vondra, C. F. (1981). “Hominid habitats in the Rift Valley Part 1,” in Hominid Sites: Their Geologic Settings, eds G. Rapp, and C. F. Vondra, (Washington, DC: American Association for the Advancement of Science), 57–113.
Keywords: tuff, Orange Tuff, paleomagnetism, 40Ar/39Ar dating, KNM-ER 1805 and 1806, Paranthropus, Homo
Citation: Mana S, Hemming S, Kent DV and Lepre CJ (2019) Temporal and Stratigraphic Framework for Paleoanthropology Sites Within East-Central Area 130, Koobi Fora, Kenya. Front. Earth Sci. 7:230. doi: 10.3389/feart.2019.00230
Received: 14 May 2019; Accepted: 20 August 2019;
Published: 06 September 2019.
Edited by:
Giancarlo Scardia, São Paulo State University, BrazilReviewed by:
Adrian Parker, Oxford Brookes University, United KingdomAlison Pereira, École Française de Rome, Italy
Copyright © 2019 Mana, Hemming, Kent and Lepre. This is an open-access article distributed under the terms of the Creative Commons Attribution License (CC BY). The use, distribution or reproduction in other forums is permitted, provided the original author(s) and the copyright owner(s) are credited and that the original publication in this journal is cited, in accordance with accepted academic practice. No use, distribution or reproduction is permitted which does not comply with these terms.
*Correspondence: Sara Mana, c21hbmFAc2FsZW1zdGF0ZS5lZHU=; Christopher J. Lepre, bGVwcmVAbGRlby5jb2x1bWJpYS5lZHU=