 Scott T. Henderson
 Matthew E. Pritchard
 Jennifer R. Cooper
 Yosuke Aoki
- 1Department of Earth and Atmospheric Sciences, Cornell University, Ithaca, NY, United States
- 2Earthquake Research Institute, University of Tokyo, Tokyo, Japan
Volcanic islands in remote settings are challenging to study with ground-based instrumentation; nevertheless it is important to define “normal” background activity at these volcanoes because they pose threats to air and sea traffic. A combination of remote sensing methods is critical to adequately characterize volcanic activity, and in this study we present space-based observations of both thermal anomalies and surface deformation at Pagan Island in the Mariana Island Arc. Mt. Pagan produced a large eruption (>0.1 km3) in 1981, and recent smaller eruptions (>0.001 km3) in 2011 and 2012 that triggered volcanic ash advisories. In this study we examine available Interferometric Synthetic Aperture Radar (InSAR) from Envisat and ALOS between October 2004 and June 2010 for precursory deformation leading up to the most recent eruptions. Although we do not observe evidence for shallow magma reservoir inflation, we do observe a zone of subsidence of up to -3 cm/yr located on the northern flank likely caused by continuing scoria compaction of 1981 eruptive deposits. CosmoSkyMed InSAR measurements spanning the October 2012 eruption also shows deposit subsidence, but no detectable co-eruptive deflation. We also present remotely-sensed thermal time series from the MODIS and ASTER instruments spanning over a decade. There are two distinct locations of anomalous surface temperatures on the island, which correlate with previously documented, fumarolically active vents at South Pagan and Mt. Pagan. Ultimately, we did not find thermal or deformation precursors for recent eruptive activity, plausibly because the volcano had an open conduit and persistent degassing during this time period. We compare and contrast the efficacy of various sensor types currently available to characterize transient dynamics at small and remote volcanic islands such as Pagan.
1. Introduction
Of over 1,550 documented Holocene volcanoes on the planet (Siebert et al., 2011), approximately 22% are located on oceanic islands and an additional 8% are submarine. Many of these islands are not routinely monitored with ground-based geophysical equipment, and as a result studies of volcanic deformation at ocean island arc volcanoes have been lacking. However, remote islands are well-suited for satellite-based monitoring. Interferometric Synthetic Aperture Radar (InSAR) surveys have proven to be successful in detecting volcanic deformation for other island arc settings such as the Aleutians (e.g., Lu and Dzurisin, 2014). However, to our knowledge, the only previous InSAR study in the Mariana Arc examined the recent eruption of Anatahan in 2003 (Wicks et al., 2005). Pagan Island is considered to have no permanent population within 100 km (Global Volcanism Program, 2013), but eruptions nevertheless threaten itinerant occupants and air traffic. For example, the May 10, 2003 eruption of Anatahan volcano 200 km to the south (Hilton et al., 2005, and references therein) forced flight cancelations and re-routing (Guffanti et al., 2005). Between December, 2006 and December, 2012 there were 64 advisories for Pagan posted by the Volcano Ash Advisory Center (VAAC, Washington D.C.); however, there have been no warnings posted since then. Pagan Island is one of 11 uninhabited volcanic islands in the northern Mariana Arc, where volcanism is due to the subduction of the Pacific plate beneath the Philippine plate (e.g., Karig, 1971; Bloomer et al., 1989) (Figure 1). The bulk edifice of Pagan Island rises from the East Mariana Ridge at 3 km below sea level forming a small island (approximately 50 km2) with two distinct eruptive centers separated by approximately 10 km: South Pagan (18.075 °N, 145.725 °E, 548 m), and the more recently-active vent at the summit of Mt. Pagan (18.141 °N, 145.786 °E, 570 m). Eruptive products on Pagan Island are predominantly basalt to andesite compositions (48–62% SiO2) and Holocene in age (e.g., Corwin, 1957; Banks et al., 1984; Trusdell et al., 2006; Marske et al., 2011).
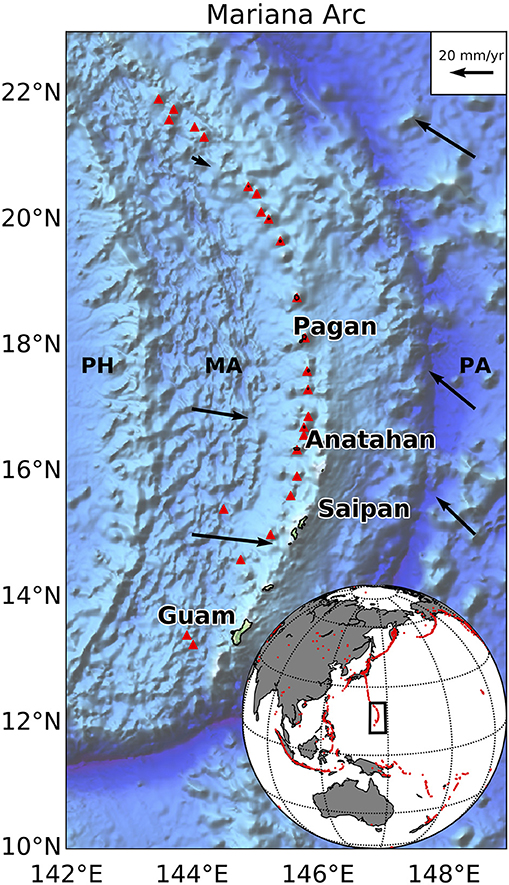
Figure 1. Map showing location of Pagan Island. Bathymetry is from ETOPO1 dataset (Amante and Eakins, 2009), and red triangles represent active volcanoes of the Izu-Bonin-Mariana subregion defined in Siebert et al. (2011). Note that many of these volcanoes are submarine, including all red triangles north of 21 degrees. Plate motion vectors using the Global Strain Rate Model (GSRM v2.1) of Kreemer et al. (2014) are plotted as black arrows with a scale in the upper right. Motion of the Pacific plate (PA) and Mariana plate (MA) are with respect to the Philippine plate (PH).
Since 1669, there have been 17 confirmed eruptions on Pagan Island (Siebert et al., 2011), the largest of which started on May 15, 1981 from the northern Mt. Pagan vent (Banks et al., 1984). The 1981 eruption had a Volcano Explosivity Index (VEI) of 4 (Newhall and Self, 1982) and prompted evacuation of the 53 villagers of Shomuson to Saipan, 200 km to the south. The Commonwealth of the Northern Mariana Islands (CNMI) has since forbidden re-occupation of the island despite the eruption being declared over in May of 1985. However, eruptive activity has persisted intermittently, with five confirmed VEI 1 eruptions (09/1987, 04/1992, 07/1996, 12/2006, 05/2010) and four confirmed VEI 2 eruptions (08/1988, 01/1993, 04/2011, 10/2012) between 1987 and 2012 (Global Volcanism Program, 2013). Several of these small eruptions were fortuitously observed by passers by, suggesting that other small volume eruptions could occur without notice. On April 23, 2011, the Volcanic Alert Level was raised to “Advisory” and Aviation Color Code raised to “Yellow,” when a passing ship noted incandescence at the summit of Mt. Pagan. These advisories have been maintained due to low-level unrest and a persistent gas plume being emitted from the summit of Mt. Pagan; however, a significant reduction in steam and gas emissions since March 2015 prompted the lowering of alerts to “Unassigned” on January 30, 2016 (Sennert, 2016). It is important to note that the “Unassigned” code is for volcanoes where ground-based instrumentation is insufficient to establish that a volcano is in a typical background level, and therefore does not necessarily reflect a return to “Normal” status.
The United States Geological Survey (USGS) has periodically monitored Mt. Pagan since the 1981 eruption. Electronic Distance Measurements (EDM) were used to investigate edifice deformation between 1981 and 1994. Recently, unrest at Mt. Pagan prompted the US Geological Survey to install a geophysical monitoring network in June 2013 that included seven intermediate band seismometers, web cameras, and infrasound arrays. A campaign network of 12 broadband seismometers was also deployed between June 2013 and April 2014, and on these dates plume composition and emission rate measurements were also made. Lyons et al. (2016) analyzed campaign data and explained LP seismicity emanating from repetitive crack collapse at 60 m below and 180 m west of the summit vent. High SO2/H2S ratios (>70) and low CO2/SO2 ratios (≈0.75) suggest a high-temperature, low-pressure magmatic source, and crater thermal measurements made by helicopter radiometer measurements recorded vent temperatures in excess of 273°C (Lyons et al., 2016). Unfortunately, the permanent seismic network is not telemetered, and consequently additional data have not yet been retrieved or analyzed at the time of writing.
The combination of persistent degassing and recurring small-volume eruptions since 1981 is suggestive of a mostly open vent system. For such systems, we do not anticipate edifice-scale deformation due to limited subsurface pressure build up, but localized and short-lived deformation may be detectable preceding eruptive activity (e.g., Chaussard et al., 2013). Therefore, we examine satellite geodetic and thermal measurements leading up to the four most recent eruptions of Mt. Pagan (starting 12/2006, 05/2010, 04/2011, 10/2012, see also Figure 2). Our intent is to identify thermal or deformation eruption precursors at Mt. Pagan in the context of historical activity and previous in-situ measurements. For future monitoring efforts, we also identify advantages and disadvantages of several active satellite sensors that can be used to monitor similar volcanic islands.
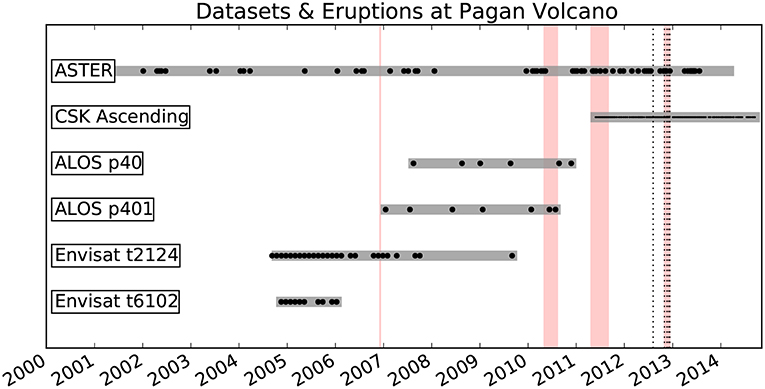
Figure 2. Timeline of remote sensing data with respect to recorded eruptive activity. Gray horizontal lines indicate available data in archives. Black dots indicate dates of acquisitions used in this study: For ASTER, these represent usable cloud-free night-time scenes; for ALOS, these were the only dates available to us; for Envisat, these are all archived dates. Red vertical bars are confirmed eruptive activity (VEI 1-2) (Global Volcanism Program, 2013). MODIS observations are nearly daily since 2000 (not shown), with occurrence of MODVOLC thermal anomaly warnings indicated with vertical dotted lines.
2. Data and Methods
2.1. Electronic Distance Measurements (EDM)
In order to provide context for the InSAR measurements made in this study, we also summarize historical EDM data on Pagan Island. EDM measurements record the line-of-sight separation between monuments over time. Monuments were established immediately following the eruption in 05/1981 and revisited in 03/1983, 09/1990, 05/1992, and 04/1994 (Banks et al., 1984; Moore et al., 1991, 1993; Sako et al., 1995). Unfortunately, many stations were damaged or lost over the years, and consequently not regularly measured. Stations INS and MID (see Figure 3) were reoccupied several times and relative line-of-sight contractions of 26 cm between 05/1981 and 03/1983 were observed. Resurveying the same line in 04/1994 indicated a further 15.6 cm of contraction (Sako et al., 1995).
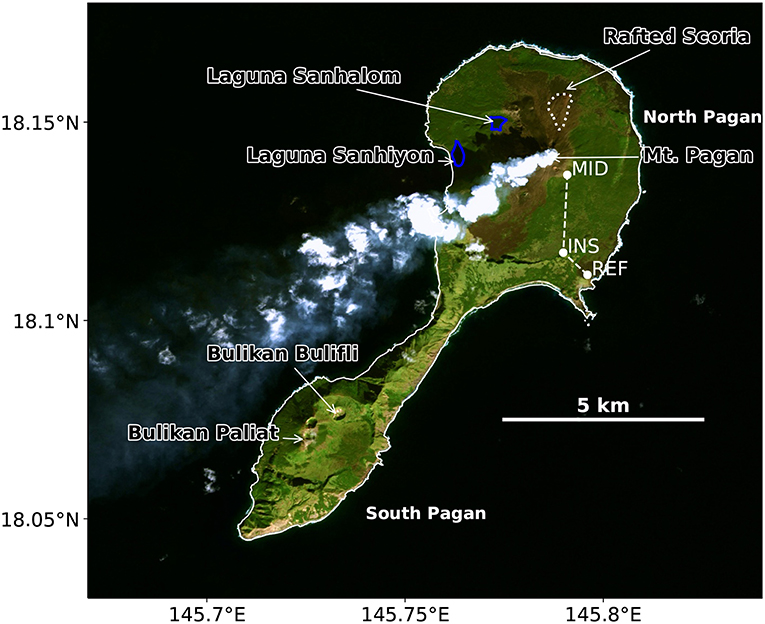
Figure 3. Landsat 8 pan-sharpened RGB image from 2013-12-21 labeling main features on island discussed in text. Plume is clearly visible from Mt. Pagan summit Crater. Past EDM station locations indicated with white dots with shortening lengths indicated by dashed white lines.
2.2. Interferometric Synthetic Aperture Radar (InSAR)
InSAR is a well-established method for measuring surface elevation changes (e.g., Simons and Rosen, 2015). Key advantages of InSAR as a tool for volcano monitoring is the ability to see through clouds (Lu, 2007), and survey entire volcanic arcs on a regular basis (e.g., Pritchard and Simons, 2002; Chaussard and Amelung, 2012; Henderson and Pritchard, 2013). However, not all SAR satellites have regularly obtained imagery over remote islands. For example, for the Northern Mariana Islands there are no archived data from ERS1 and ERS2 satellites, and there are very limited data from Radarsat-1 and TerraSAR-X satellites. While abundant data exist from Radarsat-2 and CosmoSkyMed (CSK) satellites since 2010/04/28 and 2011/05/28, respectively, access to these datasets is restricted. We have utilized all available Envisat, ALOS, and a limited number of CSK scenes in this study (see Table 1 and baseline plots in Supplemental Material).
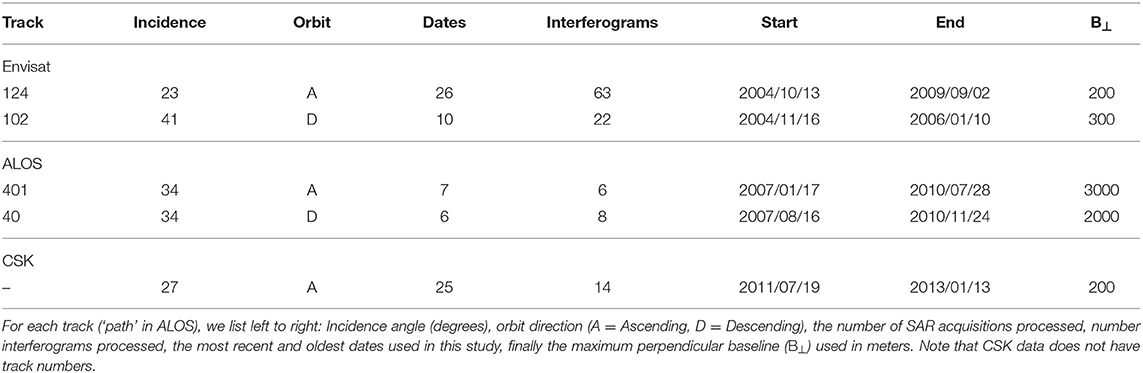
Table 1. Interferograms from Envisat, ALOS, and CSK analyzed during this study.
Envisat and ALOS scenes were processed with ROI_PAC software (Rosen et al., 2004). Because the island is small (approximately 50 km2) and has high relief, we pre-cropped the Envisat and ALOS single frames prior to processing and used a void-filled digital elevation model (SRTMGL3 DEM) interpolated to 30 × 30 m ground resolution (Farr et al., 2007). We unwrapped interferograms with SNAPHU software (Chen and Zebker, 2001). CosmoSkyMed data was processed with ISCE software (release 201609).
2.2.1. Envisat
There are 36 C-band (λ = 5.2 cm) Envisat acquisitions from 2004/10/13 to 2009/09/02. For descending Envisat track 102, we created all possible interferograms with perpendicular baselines less than 300 m, and for ascending Envisat track 124, created pairs with perpendicular baselines less than 200 m.
2.2.2. ALOS
There are 13 L-band (λ = 23.6 cm) ALOS acquisitions between 2007/01/17 and 2010/11/24. We created a total of 14 interferograms for which perpendicular baselines were less than 3,000 m.
2.2.3. CosmoSkyMed
Hundreds of X band (λ = 3.1 cm) CSK acquisitions exist starting in 2011/07/19 until the present (Figure 2). However, not all acquisitions can be processed into interferograms due to incompatible viewing geometries or large perpendicular baselines. Furthermore, data access is costly. We were able to order 25 scenes for a single satellite (CSK4) of the four-satellite constellation. This is the only InSAR dataset examined that spans eruptions of Pagan documented on 2011/04/23 to 2011/09/01 and 2012/10/30 to 2012/12/11. Although the start and end dates of the eruptions are uncertain, a cumulative volume of about 0.002 km2 was extruded between 2011 and 2012 (Global Volcanism Program, 2013).
2.3. Thermal Remote Sensing
Thermal emissions from volcanoes are one of several potential indicators of unrest, and various remote sensing techniques exist for measuring surface temperature from emission spectra (e.g., Harris, 2013). In this study we examined Moderate Resolution Imaging Spectro-radiometer (MODIS) data on the Aqua Satellite, and Advanced Spaceborne Thermal Emission and Reflection Radiometer (ASTER) data from the Terra Satellite (Table 2).
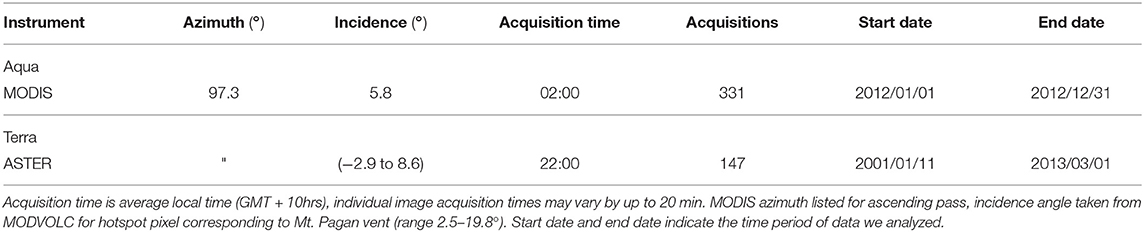
Table 2. Summary of night-time thermal infrared satellite data analyzed in this study.
2.3.1. MODIS
MODVOLC is a near-real-time thermal anomaly detection algorithm based on daily acquisitions of identical MODIS instruments on Aqua and Terra Satellites (Wright, 2004). Specifically, the algorithm uses Calibrated Radiances 5-Min L1B Swath geolocated imagery (MOD021KM and MYD021KM products). Detection is based on a “Normalized Thermal Index,” which is a simple ratio [NTI = (b22 − b32)/(b22 + b32)] of bands 22 (4 μm) and 32 (12 μm). A conservative threshold to flag potential eruptive activity (NTI >−0.8) is used to avoid false positives. The MODIS imagery used in this study is posted at 1 km pixels; however, the resolution varies as a function of angle from nadir (known as the “bow-tie” effect), and approaches 5 km near image swath edges (e.g., Wolfe et al., 1998).
The major benefits of the MODVOLC algorithm are that it is simple to implement, works for near-real-time processing, and provides consistent and approximately daily observations globally dating back to January, 2000 (Terra launched 12/1999, Aqua launched 05/2002). We processed daily night-time MODIS acquisitions from the Aqua satellite using the MODVOLC algorithm, and show the resulting time series for pixels covering the central vent of Mt. Pagan in Figure 4.
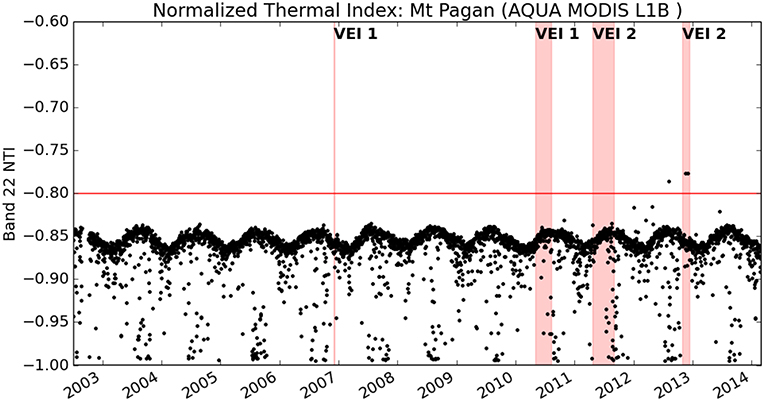
Figure 4. Normalized Thermal Index derived from MODIS Level 1B (MYD021KM), based on the MODVOLC algorithm utilizing band 22 (3.939–3.989 μm) (Wright, 2004). Black dots correspond to maximum NTI values for pixels on Pagan Island, which almost always correspond to the summit crater vent. A clear seasonal signal is visible, as well as anomalous high values during some dates in 2011-2014. Vertical red bars represent spans of eruptive activity as reported in Global Volcanism Program (2013). Horizontal red line indicates alert threshold used in MODVOLC algorithm.
2.3.2. ASTER
ASTER has proven to be an effective tool for remotely monitoring volcanic activity (e.g., Pieri and Abrams, 2004; Urai and Ishizuka, 2011; Jay et al., 2013). ASTER has a much higher spatial resolution (90 × 90 m) compared to MODIS, but has infrequent acquisitions and a smaller footprint of 60 km2 (Figure 5). We used the ASTER kinetic surface temperature product, AST_08 (Gillespie et al., 1998), to generate a time series of surface temperature for eruptive vents on Mt. Pagan (Figure 6). Of 211 total scenes, our assessment includes all 147 night-time scenes spanning 2001/01/11 to 2014/03/04 taken between 22:30 and 22:45 local time (GMT+10). Estimated cloud cover per scene from the metadata gives an average of 53 ± 36%, while a manual review of scenes determined that the central vent of Mt. Pagan appeared cloud-free in 63 scenes (43%). To extract temperatures from raw AST08 data, we converted raw data values to degrees Celsius using the scaling relation T = 0.1*x−273. We then extract land pixels using a land-sea mask for Pagan Island and further mask pixels defined as “suspect” (e.g., partial cloud cover) or “bad” (e.g., full cloud cover) according to the standard Quality Assessment (QA) product that accompanies each scene.
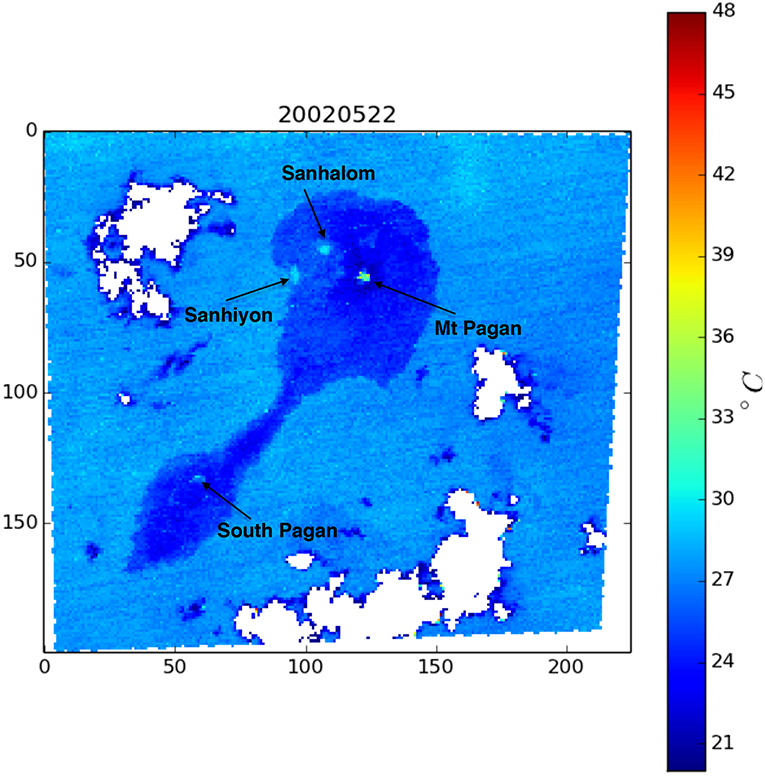
Figure 5. ASTER Product 8 Image showing surface kinetic temperature over Pagan acquired on May 22, 2002. Four distinct thermal ‘hot spots' on Pagan apparent in most ASTER scenes. Two are clearly correlated with lakes on the western side of the island (Laguna Sanhiyon and Laguna Sanhalom). The southern hotspot coincides with the oldest craters of South Pagan, Bulikan Bulifli, which is known to have mud pots and a solfatara field (Trusdell, 2009). The main hotspot on the island is clearly correlated with emissions from the central vent of Mt. Pagan.
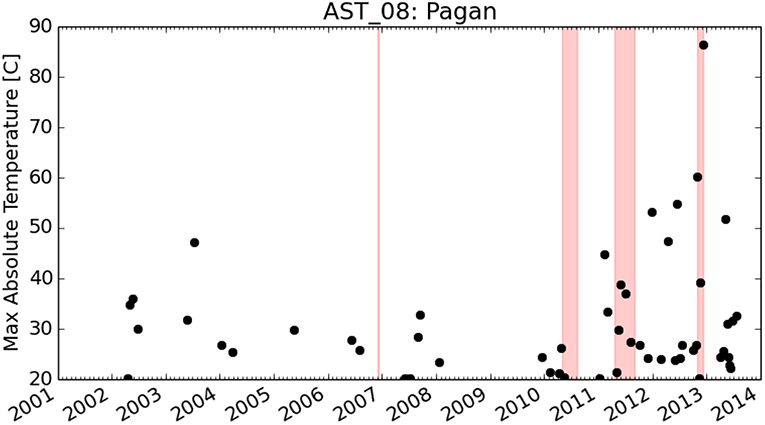
Figure 6. ASTER Product 8: Surface Kinetic Temperature night-time measurements of the maximum single pixel in a 3 × 3 pixel box centered on the central vent of Mt. Pagan. Note that values represent an average temperature for a ground surface area of 8,100 square meters. Red vertical spans indicate eruptive episodes documented in the GVP database (Global Volcanism Program, 2013). No clear pre-eruptive trends in temperature are visible, although anomalously high temperatures are measured during eruptive episodes.
3. Results
3.1. EDM
The spread of EDM daily line length measurements made over week-long field campaigns suggest uncertainties of several centimeters for the −41.6 cm of total displacement between INS and MID between 05/1981 and 04/1994 (Sako et al., 1995). Under the assumption that the measured contraction between INS and MID stations was caused by subsurface reservoir pressure changes, we conducted a simplistic modeling exercise to frame potential signals in more recent InSAR observations. Given the limited observational constraints, we use the model of Mogi (1958), which predicts surface deformation due to a pressure point source in an elastic half-space (ν = 0.25). Because INS and MID are approximately along a radial line outward from the central vent, relative vertical displacements from a point pressure source below the vent would increase their line-of-sight separation, but relative radial displacements would reduce the separation between stations. Although the solution is non-unique, a pressurized point reservoir model at a depth of 1–5 km beneath the central vent and volumetric increase on the order of 0.01 km3 reproduces observed contractions on the order of tens of centimeters.
3.2. InSAR
3.2.1. Spatial and Temporal Coherence
By utilizing SAR data from L-band, C-band, and X-band satellites we are able to comment on the effectiveness of different sensor types and observation strategies for small tropical island environments. Coherence in interferograms is a measure of how well-correlated neighboring pixels are at two acquisition times, and consequently it is an indicator of where relative displacement measurements can be made successfully: We calculated coherence images with a 5 × 5 pixel window average normalized to a scale of 0 to 1. Coherence depends primarily on temporal decorrelation, perpendicular baseline separation, and maximum ground resolution of the SAR platform. We present contours of percentage of coherent pixels (> 0.3) on Pagan for Envisat track 124 (beam 2, incidence = 23°) to illustrate the conditions under which C-band data are viable (Figure 7). Maximum coherence approaches 30% of the island surface area, most of which corresponds to the rough, lightly-vegetated lava flows from the 1981 eruption. However, C-band data are effectively unusable for timespans greater than 3 years and perpendicular baselines greater than 500 m. A stack of C-band interferograms from Envisat (Figure 8) illustrates that coherent regions tend to be localized to sparsely vegetated surfaces on the island. X-band CosmoSkyMed data are only coherent on stable lava flows, even for minimal temporal separations and perpendicular baselines (for example 2011-11-24 to 2011-09-05, dt = 80 days, bperp = 7 m—see Figure 9). L-band ALOS data are known to achieve better coherence for vegetated areas compared to C-band. We find that for a single 3-year ALOS interferogram over Pagan with a 100 m baseline, the percentage of coherent pixels is 65%. This is due to a number of reasons. First, in a heavily vegetated area such as the Mariana Islands, L-band tends to scatter from a lower, more stable, section of the canopy compared to C-band. Second, the intrinsic resolution of ALOS at 34° incidence is approximately 7 × 3 m in range and azimuth directions on Earth's surface (compared to Envisat beam 2: 20 × 4 m). Consequently, more spatial averaging is possible when matching phase observations with the available 30 × 30 m DEM. In the same way, the shallower incidence angle of Envisat beam 6 (incidence = 41°) results in better range resolution (12 × 4 m), and therefore more coherence compared to beam 2.
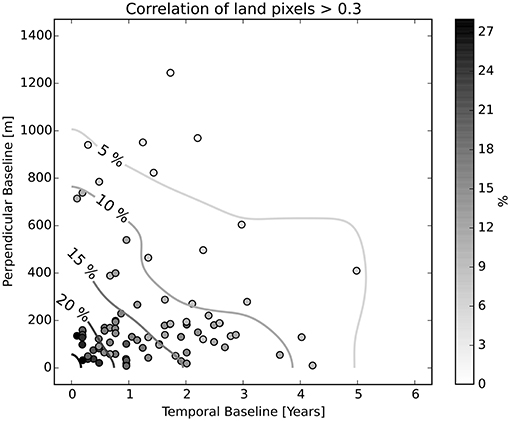
Figure 7. Contours of percentage of coherent pixels (> 0.3) on Pagan for C-band Envisat track 124 interferograms (beam 2/incidence = 23°) as a function of perpendicular and temporal baseline.
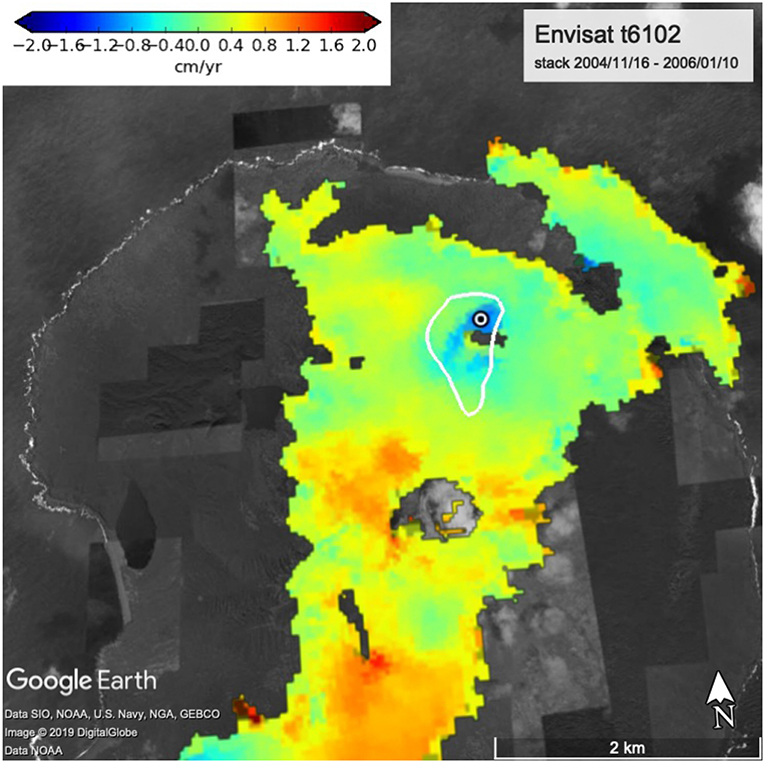
Figure 8. Stack of 22 interferograms from Envisat track 102 showing mean line-of-sight deformation between 2004/11/16 and 2006/01/10. White contour represents the mapped extent of scoria deposits from Trusdell et al. (2006).
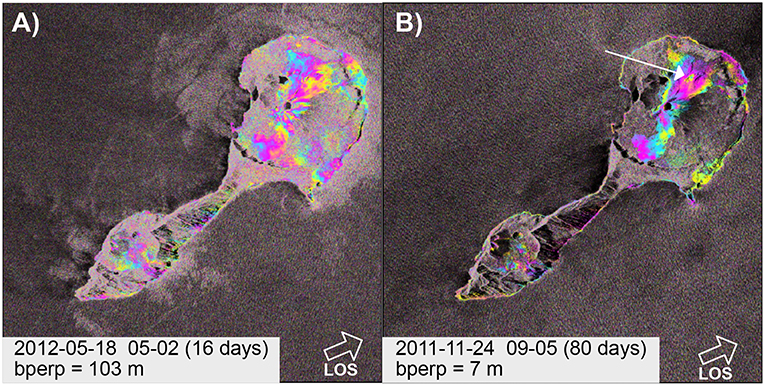
Figure 9. Wrapped interferograms from ascending Cosmo-SkyMed X-band data. (A) Coherence is mostly maintained on lava flows and beaches even for short 16-day timespans. (B) Localized subsidence of northern scoria deposit as seen in ALOS and Envisat interferograms is pointed out by the white arrow. At X-band, the scoria compaction is only observed for timespans greater than 80 days.
3.2.2. Surface Deformation
InSAR data from every sensor and viewing geometry analyzed in this study shows persistent subsidence on the northern edge of the northern lava flow (145.789°E, 18.153°N). This includes Envisat data spanning 10/2004 to 09/2009 (Figure 8), ALOS data spanning 01/2007 to 11/2010 (Figure 10), and CosmoSkyMed data spanning 07/2011 to 01/2013 (Figure 9). Note a gap in observations between the ALOS satellite and first available CosmoSkyMed acquisition. Using all available C-band data the time series of deformation indicates a rate of up to −3 cm/yr in the radar-line of sight (Table 1). We report an average rate given the sparse number of acquisitions and limited temporal sampling.
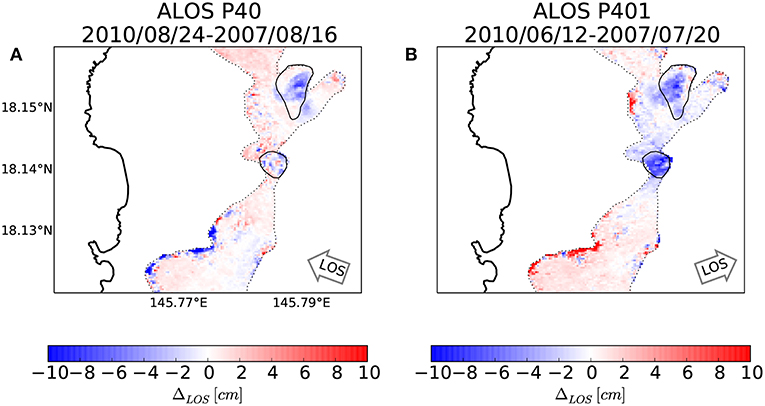
Figure 10. ALOS interferograms showing subsidence of scoria deposits. (A) up to 9 cm of subsidence on north flank. (B) 9 cm of subsidence on north flank, and similar magnitude subsidence seen in summit vent, but is not observed in other interferograms and viewing geometries. Thick black line indicates coastline of Pagan Island. Thin solid black line are extents of scoria deposits from Trusdell et al. (2006). Dotted line corresponds to extents of main flows from 1981 eruption, which is used to crop the interferogram in order to exclude decorrelated vegetated areas.
Importantly, ALOS path 401 also shows subsidence localized on the summit vent and slightly offset to the southwest of approximately −10 cm between January, 2007 and July 2011 (Figure 10).
3.3. Thermal Anomalies
There are four distinct thermal “hot spots” on Pagan apparent in most ASTER scenes (Figure 5). Two are clearly correlated with lakes on the western side of the island (Laguna Sanhiyon and Laguna Sanhalom). Lakes are commonly identified simply due to the higher heat capacity of the water compared to adjacent land. The southern hotspot is coincident with the oldest craters of South Pagan, Bulikan Bulifli, which is known to have mud pots and a solfatara field (Trusdell, 2009). The main hotspot on the island is clearly correlated with emissions from the central vent of Mt. Pagan. Figure 6 indicates temperature fluctuations of tens of degrees centigrade on timescales of days with maximum temperatures approaching 85°C. Note that reported remotely-sensed temperatures are averaged over the large ASTER pixel size (8,100 m2), and consequently ground temperature would be higher.
MODVOLC alerts were only issued 6 times for Pagan during the past decade, all during 2012. A clear seasonal signal is apparent in Figure 4, as well as several outliers during inter-eruptive periods that fall short of the detection threshold. Interestingly, the first MODVOLC detection was 2012/08/06, almost 3 months before the “onset” of the last VEI 2 eruption, which began 2012/10/30 (Global Volcanism Program, 2013). Of the four minor eruptions between 2006 and 2013, only one eruption at the end of 2012 exhibited obvious elevated temperatures exceeding the typical scatter in measurements dating back to 2001 (Figure 4). All other detections coincided with confirmed minor eruptions from the central vent of Mt. Pagan. The last detection was 12/11/2012, which marked the declared ending of the eruptive episode.
4. Discussion
4.1. Surface Deformation
4.1.1. Persistent Reservoirs and Open Conduits
Given the sparse temporal sampling of EDM stations, station separations could accumulate slowly over many years or be coincident with bursts of volcanic activity. In either scenario, the symmetric displacements predicted by our simple reservoir model based on EDM data could result in detectable InSAR deformation gradients on lava flows where coherence is maintained over time. The model constrained by EDM data from 05/1981 to 04/1994 predicts axis-symmetric deformation with a maximum vertical uplift rate of 0.9 m/yr at the summit (corresponding to 0.6–0.8 m/yr in the radar line-of-sight), decaying to negligible uplift at the coast. These rates are well above the noise level in interferograms, but such relative displacements are not observed in our InSAR data spanning 2004/10/13 to 2013/01/13. We therefore do not observe indications of recharge or pressurization of a long-lived reservoir under Mt. Pagan.
In ALOS data, we observed a −10 cm change localized to the scoria deposits in Mt. Pagan crater between January, 2007 and July 2011 (Figure 10). This signal could be due to deposit subsidence; however, we believe the signal is more likely to be of atmospheric origin because it is absent in ALOS path 40 covering a similar time period. Nor do we see any indication of persistent subsidence in that region for different time periods covered by the other satellites.
The absence of observed displacements on Mt. Pagan is likely due to the open nature of magmatic plumbing evidenced by persistent degassing. Eruptions are not always accompanied by deformation signals since it is also possible that erupted material ascended rapidly from greater depths without significantly pressurizing shallow reservoirs (e.g., Chaussard et al., 2013). Future studies with denser temporal sampling would benefit from simultaneous monitoring of both gas emissions and surface deformation. We anticipate that lower gas emissions could be accompanied by surface uplift due to reservoir pressurization.
4.1.2. Deposit Subsidence
The subsidence on the North flank of Mt. Pagan is confined to a particular style of deposit which Trusdell et al. (2006) labels as “Qbc1,” described as “spatter and cinder deposits and ‘a'a” with a “large mass of flow-rafted spatter on the north lower flank.” According to Banks et al. (1984), the northern flank scoria cone was built from a new vent on the northern flank of the volcano during a Strombolian eruptive phase, growing 60 m high and 0.81 km2 in area (24 × 106 m3). This cone was subsequently pushed downslope by later effusive flows from the summit crater of Mt. Pagan, covering the source vent. These predominantly “a” a flows are 3–30 m in thickness. Seismic station PGNE (145.786 E, 18.152 N, 256 m) was installed near the north-flank vent location in May 2013, and the subsurface was noted to be exceptionally hot, potentially causing the station to cease functioning (M. Haney, USGS, personal communication, 2014). It is therefore possible that the buried north vent continues to actively degas and these hot gases escape through available pathways in the overlaying lava flows and scoria. The spatial correspondence of vents and cinder deposits creates uncertainty when attributing subsidence to either a surface or subsurface process, and either very high resolution SAR data or on-ground instrumentation is necessary to disentangle these possible signals.
Lava flows have been observed to subside at high rates several decades after their emplacement. This phenomenon has been documented at Okmok Volcano where basaltic flows from 1958 were subsiding at up to 1.5 cm/yr rates 35 years later, and new flows in 1997 were subsiding at up to 72 cm/yr (Lu and Dzurisin, 2014). Similarly, at New Tolbachik Volcano, basaltic lavas from 1975 were subsiding at up to 2.5 cm/yr 30 years later (Pritchard and Simons, 2004). The subsidence is typically attributed to surface loading and thermo-elastic contraction upon cooling. At Pagan, we clearly see unstable scoria deposits slumping under their own weight decades after their eruption.
4.2. Thermal Anomaly Detection
There are few ground measurements of thermal anomalies at Pagan to compare against remotely sensed measurements. One in-situ measurement of a fumarole indicated a temperature of 76°C, and inaccessible solfataras within the summit crater are thought to be higher (Moore et al., 1993). Measurements of the summit crater taken by radiometer in a helicopter flyover in June 2013 saturated the sensor, indicating temperatures in excess of 273°C (Lyons et al., 2016). The hottest observed temperature in ASTER (12/11/2012) coincides with the declared end of the latest VEI 2 eruption, and therefore likely corresponds to sub-pixel tephra deposits and hot gasses emitted from the central vent. To our knowledge, recent eruptions have not produced effusive flows on the flanks of the volcano and our observation of thermal anomalies confined to the summit crater corroborates this. We did not detect pre-eruptive temporal trends are in ASTER measurements (Figure 6). While ASTER revisit times are generally 16 days, the infrequent cloud-free night-time acquisitions over Mt. Pagan (mean = 31 days, max = 385 days) makes identifying pre-eruptive trends in temperature highly speculative (Figure 6).
It is somewhat surprising that Pagan is seen to have persistent gas emissions and sporadic minor eruptions, but few MODVOLC hotspot alerts. There are several reasons that hotspots may not be detected at Pagan despite the persistence of degassing from the central vent. The obvious reason is the presence of clouds over the island. Another possibility is that the incidence angle of the satellite is such that observations of the crater floor is obscured by steep sided surrounding walls. As a consequence of the large observation footprint (approximately 20 × 20°), a range of viewing geometries is possible. For example, the incidence angle for MODIS frames over Pagan vary from 0 to 65°. Thus in mountainous areas with high relief, ground targets can be obscured for particular azimuth (ascending looks eastward and descending looks westward), or large zenith angle. One study utilizing the Advanced Very High Resolution Radiometer (AVHRR) instrument, which had a comparable viewing geometry to MODIS, found that exposed lava flows are still easily detected at large zenith angles, but small subpixel regions are not (Mouginis-Mark et al., 1994). For Pagan, only sensor zenith angles less than 20° are observed to significantly exceed background levels (Figure 11). The difference in ground pixel size and zenith angle can be clearly seen in Figure 12, which compares images from both MODIS and ASTER within hours of the onset of VEI 2 eruption on 2012/10/30.” Alternative algorithms to be used with MODIS data have been proposed to improve positive hotspot detection rate (e.g., Steffke and Harris, 2011; Coppola et al., 2016). One method that considers the statistical variance of persistent hot pixels has been applied with success at Anatahan volcano (Koeppen et al., 2011). Such a method would likely result in several more detections at Mt. Pagan, for example, see label “A” in Figure 11.
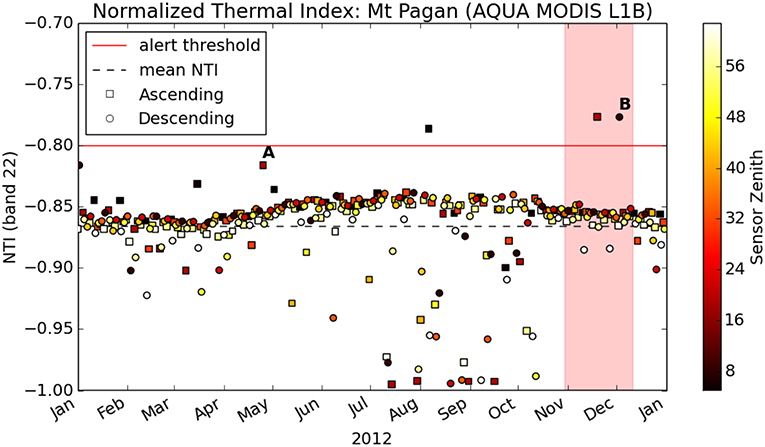
Figure 11. Detailed subset of Figure 4 for 2012 showing Normalized Thermal Index as well as sensor viewing parameters. Square markers indicate ascending observations (looking east) and circles indicate descending observations (looking west). Markers are colored by sensor zenith angle (degrees from vertical). Note that only sensor zenith angles less than 1° have generated alerts. Label “A” corresponds to a near alert on 2012/04/25, and label “B” corresponds to alert on 2012/12/03 during the last eruptive phase of Mt. Pagan (see Figure 12).
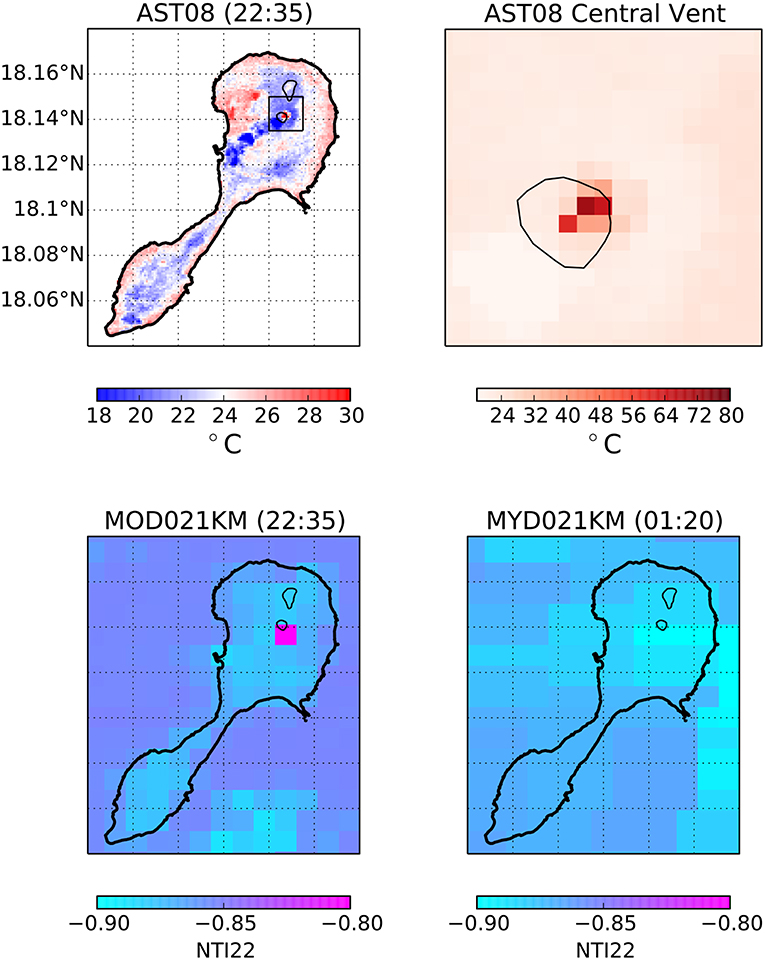
Figure 12. Panel of thermal observations at Pagan 1 day after declared onset of VEI 2 eruption (2012/10/30–2012/12/11). (Upper Left) ASTER Surface Kinetic Temperature (AST08) Image acquired at 22:35 local time. Color scale is centered on mean surface temperature of 24°C. Elevated temperatures that stand out are lakes, central vent of Mt. Pagan, and several pixels within crater of Bulikan Bulifli. Summit vent of Mt. Pagan shown in image to right on separate color scale. (Lower Left) Terra MODIS Normalized Thermal Index (NTI) image acquired simultaneously with ASTER, showing pixel triggering MODVOLC alert aligned with the central vent (sensor zenith angle = 2.5°, sensor azimuth angle = −91°, NTI = −0.79). (Lower Right) Aqua MODIS NTI image acquired 3 h later showing pixel stretching characteristic of large sensor zenith angles (sensor zenith angle = 61.6°, sensor azimuth angle = 96°, NTI = −0.88).
5. Conclusions
Thermal sensing between 2001 and 2013 reveal several manifestations of activity at Pagan, but no clear transient patterns spanning recent eruptive activity. There are 2 distinct thermal anomalies on Pagan Island that correlate with the craters of South Pagan and the central vent of Mt. Pagan observable in ASTER and MODIS data. The MODVOLC hotspot detection algorithm resulted in only 6 archived alerts despite persistent eruptive activity. Incorporation of sensor zenith angle into detection algorithms may be warranted for steep-walled summit craters.
We observed persistent subsidence in multiple InSAR datasets above the north flank vent at Mt. Pagan (spanning at least 2004–2013) at an average maximum line-of-sight rate of −3 cm/yr. The subsidence is spatially correlated with mapped spatter and scoria deposits and likely represents continued compaction of these materials. We did not observe displacements in InSAR measurements elsewhere on the island.
The lack of observed InSAR deformation related to active degassing between 2004-2010 and eruptive activity from April-September 2011 and October-December 2012 could be explained by Pagan having an open vent during these time periods. The lack of deformation recorded by ground-based EDM during many epochs between 1981 and 1994 was noted by previous workers and attributed to the open vent of Pagan (Moore et al., 1991, 1993; Sako et al., 1995). However, EDM did record significant deformation along two lines between 1981 and 1994 (Sako et al., 1995) that we model as a inflation of a shallow magma reservoir, suggesting some closed vent behavior during the 1981–1994 time period. If the same activity recorded by EDM during 1981–1994 occurred during the period of InSAR observations, we calculate that it would have been observed. Therefore, based on the limited evidence, we suggest that while Pagan could mostly be characterized as an open vent volcano from 1981 to 2013, there may be times when it acts like a closed vent volcano.
While this study has focused on observations at Pagan Volcano, the observation techniques can be readily applied to other active volcanic islands globally. While L-band InSAR offers the most coherent observations in vegetated terrain, we have found that C-band interferograms can have up to 20% coherent pixels on Pagan (mainly due to extensive lava flows) for acquisitions separated by up to a year and a perpendicular baseline less than 300 m. This result is encouraging for continued study with other C-band SAR satellites, such as Sentinel-1.
Data Availability
ASTER and MODIS data used in this study is open-access. ASTER kinetic surface temperature product (AST_08, doi: 10.5067/ASTER/AST_08.003) can be obtained from the NASA Land Processes Distributed Active Archive Center (LPDAAC – https://lpdaac.usgs.gov). MODIS/Aqua Calibrated Radiances 5-Min L1B Swath 1 km (MYD021KM doi: 10.5067/MODIS/MYD021KM.006) are available from Atmosphere Archive and Distribution System (LAADS) DAAC. Raw SAR data used in this study is not generally open-access, but imagery can be browsed and obtained from the following servers: The complete ALOS archive is currently hosted by JAXA (https://auig2.jaxa.jp). Envisat data are provided by ESA (https://esar-ds.eo.esa.int). CosmoSkyMed CSK data must be ordered through the Italian Space Agency (http://catalog.e-geos.it).
Author Contributions
SH, MP, and JC conceived and designed the study. YA provided SAR data and contributed to the writing of the manuscript. SH and JC analyzed the data. SH wrote the main text.
Funding
This work was supported by NASA (National Aeronautics and Space Administration) grants NNX12AO31G and NNX12AM24G issued through the Science Mission Directorate's Earth Science Division. CosmoSkyMed was obtained through the COSMO-SkyMed Open Call for Science proposal 172.
Conflict of Interest Statement
The authors declare that the research was conducted in the absence of any commercial or financial relationships that could be construed as a potential conflict of interest.
Acknowledgments
ALOS data provided from the JAXA PIXEL consortium through YA and Yo Fukushima, CSK data access is thanks to the COSMO-SkyMed Open Call for Science proposal # 172, and Envisat data are courtesy the European Space Agency. We thank Maria Furtney for assistance processing SAR data, and Dr. Kevin Reath for helpful comments on MODIS and ASTER products. We also thank editor Valerio Acocella and two reviewers for helpful feedback which improved the quality of this article.
Supplementary Material
The Supplementary Material for this article can be found online at: https://www.frontiersin.org/articles/10.3389/feart.2019.00238/full#supplementary-material
References
Amante, C., and Eakins, B. W. (2009). ETOPO1 1 Arc-Minute Global Relief Model: Procedures, Data Sources and Analysis. NOAA Technical Memorandum NESDIS NGDC-24. National Geophysical Data Center, NOAA. doi: 10.7289/V5C8276M
Banks, N. G., Koyanagi, R. Y., Sinton, J. M., and Honma, K. T. (1984). The eruption of Mount Pagan volcano, Mariana Islands, 15 May 1981. J. Volcanol. Geother. Res. 22, 225–269. doi: 10.1016/0377-0273(84)90004-0
Bloomer, S. H., Stern, R. J., and Smoot, N. C. (1989). Physical volcanology of the submarine Mariana and Volcano Arcs. Bull. Volcanol. 51, 210–224. doi: 10.1007/BF01067957
Chaussard, E., and Amelung, F. (2012). Precursory inflation of shallow magma reservoirs at west Sunda volcanoes detected by InSAR. Geophys. Res. Lett. 39:L21311. doi: 10.1029/2012GL053817
Chaussard, E., Amelung, F., and Aoki, Y. (2013). Characterization of open and closed volcanic systems in Indonesia and Mexico using InSAR time series. J. Geophys. Res. 118, 3957–3969. doi: 10.1002/jgrb.50288
Chen, C. W., and Zebker, H. (2001). Two-dimensional phase unwrapping with use of statistical models for cost functions in nonlinear optimization. J. Opt. Soc. Am. 18, 338–351. doi: 10.1364/JOSAA.18.000338
Coppola, D., Laiolo, M., Delle Donne, D., and Ripepe, M. (2016). Enhanced volcanic hot-spot detection using MODIS IR data: results from the MIROVA system. Geol. Soc. Lond. Spec. Publ. 426, 181–205. doi: 10.1144/SP426.5
Corwin, G. (1957). Military Geology of Pagan, Mariana Islands. Washington, DC: Prepared under the direction of the Chief of Engineers, US Army by the Intelligence Division, Office of the Engineer Headquarters United States Army Japan with personnel of the United States Geological Survey.
Farr, T. G., Rosen, P. A., Caro, E., Crippen, R., Duren, R., Hensley, S., et al. (2007). The shuttle radar topography mission. Rev. Geophys. 45, 1–33. doi: 10.1029/2005RG000183
Gillespie, A., Rokugawa, S., Matsunaga, T., Cothern, J. S., Hook, S. J., and Kahle, A. B. (1998). A temperature and emissivity separation algorithm for advanced spaceborne thermal emission and reflection radiometer (ASTER) images. IEEE Trans. Geosci. Remote Sens. 36, 1113–1126. doi: 10.1109/36.700995
Global Volcanism Program (2013). Volcanoes of the World, Vol. 4.3.1, ed E. Venzke. Washington, DC: Smithsonian Institution. doi: 10.5479/si.GVP.VOTW4-2013
Guffanti, M., Ewert, J. W., Gallina, G. M., Bluth, G. J. S., and Swanson, G. L. (2005). Volcanic-ash hazard to aviation during the 2003–2004 eruptive activity of Anatahan volcano, Commonwealth of the Northern Mariana Islands. J. Volcanol. Geother. Res. 146, 241–255. doi: 10.1016/j.jvolgeores.2004.12.011
Harris, A. (2013). Thermal Remote Sensing of Active Volcanoes: A User's Manual. Cambridge: Cambridge University Press.
Henderson, S. T., and Pritchard, M. E. (2013). Decadal volcanic deformation in the Central Andes Volcanic Zone revealed by InSAR time series. Geochem. Geophys. Geosyst. 14, 1358–1374. doi: 10.1002/ggge.20074
Hilton, D. R., Pallister, J. S., and Pua, R. M. (2005). Introduction to the Special Issue on the 2003 Eruption of Anatahan Volcano, Commonwealth of the Northern Mariana Islands (CNMI). J. Volcanol. Geother. Res. 146, 1–7. doi: 10.1016/j.jvolgeores.2005.01.015
Jay, J. A., Welch, M. D., Pritchard, M. E., Mares, P. J., Mnich, M. E., Melkonian, A. K., et al. (2013). Volcanic hotspots of the central and southern Andes as seen from space by ASTER and MODVOLC between the years 2000 and 2010. Geol. Soc. Lond. Spec. Publ. 380, 161–185. doi: 10.1144/SP380.1
Karig, D. E. (1971). Structural history of the mariana Island arc system. Geol. Soc. Am. Bull. 82:323. doi: 10.1130/0016-7606(1971)82[323:SHOTMI]2.0.CO;2
Koeppen, W. C., Pilger, E., and Wright, R. (2011). Time series analysis of infrared satellite data for detecting thermal anomalies: a hybrid approach. Bull. Volcanol. 73, 577–593. doi: 10.1007/s00445-010-0427-y
Kreemer, C., Blewitt, G., and Klein, E. C. (2014). A geodetic plate motion and Global Strain Rate Model. Geochem. Geophys. Geosyst. 15, 3849–3889. doi: 10.1002/2014GC005407
Lu, Z. (2007). InSAR imaging of volcanic deformation over cloud-prone areas - aleutian Islands. Photogrammetr. Eng. Remote Sens. 73, 245–257. doi: 10.14358/PERS.73.3.245
Lu, Z., and Dzurisin, D. (2014). “InSAR imaging of Aleutian volcanoes,” in InSAR Imaging of Aleutian Volcanoes (Berlin: Springer), 87–345.
Lyons, J. J., Haney, M. M., Werner, C., Kelly, P., Patrick, M., Kern, C., et al. (2016). Long period seismicity and very long period infrasound driven by shallow magmatic degassing at Mount Pagan, Mariana Islands. J. Geophys. Res. 121, 188–209. doi: 10.1002/2015JB012490
Marske, J. P., Pietruszka, A. J., Trusdell, F. A., and Garcia, M. O. (2011). Geochemistry of southern Pagan Island lavas, Mariana arc: the role of subduction zone processes. Contribut. Mineral. Petrol. 162, 231–252. doi: 10.1007/s00410-010-0592-1
Mogi, K. (1958). Relations between the eruptions of various volcanoes and the deformations of the ground surfaces around them. Bull. Earthquake Res. Inst. 36, 99–134.
Moore, R. B., Koyanagi, R. Y., Sako, M. K., Trusdell, F. A., Ellorda, R., and Kojima, G. (1993). Volcanologic Investigations in the Commonwealth of the Northern Mariana Islands, May 1992. USGS Open File Report, 1–37. doi: 10.3133/ofr93541
Moore, R. B., Koyanagi, R. Y., Sako, M. K., Trusdell, F. A., Ellorda, R., and Zane, S. (1991). Volcanologic Investigations in the Commonwealth of the Northern Mariana Islands, September-October 1990. USGS Open File Report, 1–31. doi: 10.3133/ofr91320
Mouginis-Mark, P. J., Garbeil, H., and Flament, P. (1994). Effects of viewing geometry on AVHRR observations of volcanic thermal anomalies. Remote Sens. Environ. 48, 51–60. doi: 10.1016/0034-4257(94)90113-9
Newhall, C. G., and Self, S. (1982). The volcanic explosivity index (VEI) an estimate of explosive magnitude for historical volcanism. J. Geophys. Res. 87, 1231–1238. doi: 10.1029/JC087iC02p01231
Pieri, D., and Abrams, M. (2004). ASTER watches the world's volcanoes: a new paradigm for volcanological observations from orbit. J. Volcanol. Geother. Res. 135, 13–28. doi: 10.1016/j.jvolgeores.2003.12.018
Pritchard, M. E., and Simons, M. (2002). A satellite geodetic survey of large-scale deformation of volcanic centres in the central Andes. Nature 418, 167–171. doi: 10.1038/nature00872
Pritchard, M. E., and Simons, M. (2004). Surveying volcanic arcs with satellite radar interferometry: the central Andes, Kamchatka, and beyond. GSA Today 14, 4–11.
Rosen, P. A., Hensley, S., Peltzer, G., and Simons, M. (2004). Updated repeat orbit interferometry package released. Eos 85:47. doi: 10.1029/2004EO050004
Sako, M. K., Trusdell, F. A., Koyanagi, R. Y., Kojima, G., and Moore, R. B. (1995). Volcanic Investigations in the Commonwealth of the Northern Mariana Islands, April to May 1994. USGS Open File Report, 1–57.
Sennert, S. K. (2016). Global Volcanism Program, 2016. Report on Pagan (United States). Technical Report, Smithsonian Institution and US Geological Survey.
Siebert, L., Simkin, T., and Kimberly, P. (2011). Volcanoes of the World, 3rd Edn. Los Angeles, CA: University of California Press.
Simons, M., and Rosen, P. A. (2015). “3.12 - Interferometric synthetic aperture radar geodesy,” in Treatise on Geophysics, 2nd Edn., 339–385. doi: 10.1016/B978-0-444-53802-4.00061-0
Steffke, A. M., and Harris, A. J. L. (2011). A review of algorithms for detecting volcanic hot spots in satellite infrared data. Bull. Volcanol. 73, 1109–1137. doi: 10.1007/s00445-011-0487-7
Trusdell, F. A. (2009). “Marianas, geology,” in Encyclopedia of Islands, eds R. G. Gillespie and D. A. Clague (University of California Press), 598–603.
Trusdell, F. A., Moore, R. B., and Sako, M. K. (2006). Preliminary geologic map of Mount Pagan Volcano, Pagan Island, Commonwealth of the Northern Mariana Islands. USGS Open File Report, 2006-1386. doi: 10.3133/ofr20061386
Urai, M., and Ishizuka, Y. (2011). Advantages and challenges of space-borne remote sensing for Volcanic Explosivity Index (VEI): the 2009 eruption of Sarychev Peak on Matua Island, Kuril Islands, Russia. J. Volcanol. Geother. Res. 208, 163–168. doi: 10.1016/j.jvolgeores.2011.07.010
Wicks, C., Yarai, H., Lu, Z., and Helz, R. L. (2005). “ENVISAT SAR and InSAR observations of deformation and crater floor elevation change of Anatahan Volcano, Mariana Islands,” in AGU Fall Meeting Abstracts, Vol. 1 (San Francisco, CA), 0884.
Wolfe, R. E., Roy, D. P., and Vermote, E. (1998). MODIS land data storage, gridding, and compositing methodology: level 2 grid. IEEE Geosci. Remote Sens. Mag. 36, 1324–1338. doi: 10.1109/36.701082
Keywords: InSAR, ASTER, MODIS, Pagan Island, Mariana Arc, Volcano deformation, thermal anomalies
Citation: Henderson ST, Pritchard ME, Cooper JR and Aoki Y (2019) Remotely Sensed Deformation and Thermal Anomalies at Mount Pagan, Mariana Islands. Front. Earth Sci. 7:238. doi: 10.3389/feart.2019.00238
Received: 12 April 2019; Accepted: 29 August 2019;
Published: 12 September 2019.
Edited by:
Luis E. Lara, Sernageomin, ChileReviewed by:
Charles Wicks, United States Geological Survey (USGS), United StatesGeoff Kilgour, GNS Science, New Zealand
Copyright © 2019 Henderson, Pritchard, Cooper and Aoki. This is an open-access article distributed under the terms of the Creative Commons Attribution License (CC BY). The use, distribution or reproduction in other forums is permitted, provided the original author(s) and the copyright owner(s) are credited and that the original publication in this journal is cited, in accordance with accepted academic practice. No use, distribution or reproduction is permitted which does not comply with these terms.
*Correspondence: Matthew E. Pritchard, cHJpdGNoYXJkQGNvcm5lbGwuZWR1
†Present address: Scott T. Henderson, Department of Earth and Space Sciences, University of Washington, Seattle, WA, United States
Jennifer R. Cooper, Department of Physics and Astronomy, University of Kansas, Lawrence, KS, United States