 Melissa L. Wrzesien
 Tamlin M. Pavelsky
- Department of Geological Sciences, The University of North Carolina at Chapel Hill, Chapel Hill, NC, United States
Extreme precipitation and runoff events, which often impact natural and social systems more than mean changes, generally occur over regional scales. Future climate projections can be used to estimate how the hydrologic cycle may change, but the coarse resolution of global climate models (GCMs) (>1°) makes it difficult to evaluate regional changes, such as over a single watershed. To estimate changes in hydroclimatic variables at finer spatial resolutions, we dynamically downscale the Community Climate System Model version 4 (CCSM4) with the Weather Research and Forecasting (WRF) regional climate model over the western United States at 9 km spatial resolution. By running WRF at a higher spatial resolution, we estimate future climate conditions, including 99% event magnitude, over 17 watersheds: the Columbia, Lower Colorado, Upper Colorado, the Upper Missouri/Yellowstone, and 12 basins draining the western slope of the Sierra Nevada in California. Over each basin, we compare a historical period (1996–2005) with mid-century (2041–2050) and end-century (2091–2100). From the WRF/CCSM simulations, most basins are projected to have earlier peaks in springtime streamflow. The Columbia and the Lower Colorado watersheds are both expected to experience more extreme wet days, with the 99th percentile of daily precipitation estimated to increase by over 10%. For the Upper Colorado, however, the 99th percentile of daily runoff is projected to decrease by over 30%. Basins in the northern and central Sierra Nevada are projected to have substantial increases in extreme runoff, with doubling of high flow event magnitude possible for some basins. By end-century, the contribution of high-magnitude runoff (>90th percentile) to total runoff is projected to increase from 46 to 56%, when averaged across all 12 Sierra Nevada basins. Though only one realization from a single GCM, the downscaled simulation presented here shows interesting results regarding how extreme events may change; these results can be tested by downscaling other global models with WRF to create an ensemble of dynamically downscaled future projections.
Introduction
Though much work has been done to estimate how climate change will impact the environment and society, research often considers mean changes (e.g., Cayan et al., 2008; Mote and Salathe, 2010; Peacock, 2012), such as how average temperature or annual precipitation may change by the end of the 21st century. However, extreme events often affect natural and social systems more than mean changes, particularly on local-to-regional scales. For example, heavy precipitation on snow cover can cause dramatic snowmelt and substantial streamflow, often leading to extensive flooding; a recent example is the 2017 Oroville Dam crisis in California, which caused the evacuation of more than 180,000 people (Vahedifard et al., 2017; Hollins et al., 2018). Infrastructure must meet design standards to handle such extreme events. However, aspects of the water supply system, such as dams and reservoirs, are designed for present-day climate patterns and generally assume the probability of precipitation or runoff extremes are statistically stationary, an assumption that may not hold true under climate change (Rosenberg et al., 2010; Sterle et al., 2019). While such systems may be able to adapt to increased or decreased annual precipitation by the end of the century, they may not be able to adapt to changes in extreme events.
Global climate models (GCMs), such as those used in Intergovernmental Panel on Climate Change reports (IPCC), for example, are commonly used to project how hydroclimatic variables may change under a warming environment (Taylor et al., 2012; Knutson et al., 2013; Knutti and Sedlacek, 2013). While GCMs are a useful tool for predicting changes over large geographical regions, they are of limited use for regional studies due to coarse spatial resolution and, frequently, bias over individual regions (Maraun et al., 2010; Ehret et al., 2012). Regional climate models (RCMs), on the other hand, are becoming an increasingly useful tool for climate projection via GCM downscaling. Though a GCM can generate more data than an RCM, both temporally and spatially, it is also significantly coarser. In analysis of the resolution dependence of precipitation extremes, van der Wiel et al. (2016) found that magnitude and seasonality of precipitation extreme events dramatically improves when increasing from 200 km to 50 km to 25 km resolution; the largest biases were maintained over the Sierra Nevada, suggesting either further resolution enhancements are necessary or precipitation is poorly constrained over the region in observations. Here we use an RCM over the western United States to provide resolution enhancement in a region where a GCM would only have a few grid points. The tradeoff of using an RCM over a GCM is that fewer years can be integrated due to computational constraints, but this is offset by providing higher resolution information. Ever-increasing computational resources allow for multi-year RCM simulations, providing the ability to simulate historical and future decades for comparison (Liu et al., 2017; Walton et al., 2017). Future projections with RCMs require the use of GCMs for meteorological forcing data as boundary and initial conditions. Since GCMs are often biased on the regional scale, the use of raw GCM data as forcing data would pass the biases onto the RCM simulations.
Multiple methods have been developed for bias correcting GCMs. A commonly used technique is the pseudo global warming (PGW) method (Schar et al., 1996; Hara et al., 2008; Kawase et al., 2009; Rasmussen et al., 2011), which adds a climate change signal from GCMs to reanalysis data. This method allows for easy comparison to historical reanalysis estimates and has been shown to produce reasonable results as an RCM forcing dataset (Liu et al., 2017; Musselman et al., 2017; Gutmann et al., 2018; Letcher and Minder, 2018). However, the PGW method assumes climate variability to be stationary in time; recent work suggests that climate stationarity is not a valid assumption (Christensen et al., 2008; Vannitsem, 2011; Maraun, 2012). Here we use an alternative bias correction approach, described below in section “Bias Correction,” that does not assume stationarity.
Here we estimate historical and future climate over the western United States using simulations from the Weather Research and Forecasting (WRF; Skamarock et al., 2019) RCM forced by a bias-corrected GCM. By simulating historical, mid-century, and end-century decades, we not only evaluate how hydroclimatic variables may change over the 21st century, but, with the multi-year simulations, we also consider extreme events. That is, we estimate how the wettest of wet days may change by the end century. Changing the magnitude of extreme events has implications for built infrastructure, particularly when considering flood control.
We first consider major river watersheds of the western United States – the Columbia, Upper Colorado, Lower Colorado, and Upper Missouri/Yellowstone system (Figure 1A). Evaluating changes over these large river basins will highlight potential regional-scale climate impacts for these heavily managed systems. We then evaluate changes to small basins with headwaters in the Sierra Nevada mountains of California (Figure 1B). Water managers in this region must balance conserving snowmelt-derived streamflow with flood prevention measures (Dettinger et al., 2011); therefore, understanding a possible regime shift for substantial precipitation and runoff events is crucial for local water districts. We end by discussing how potential changes to extreme events may affect water resources and operations in each study region.
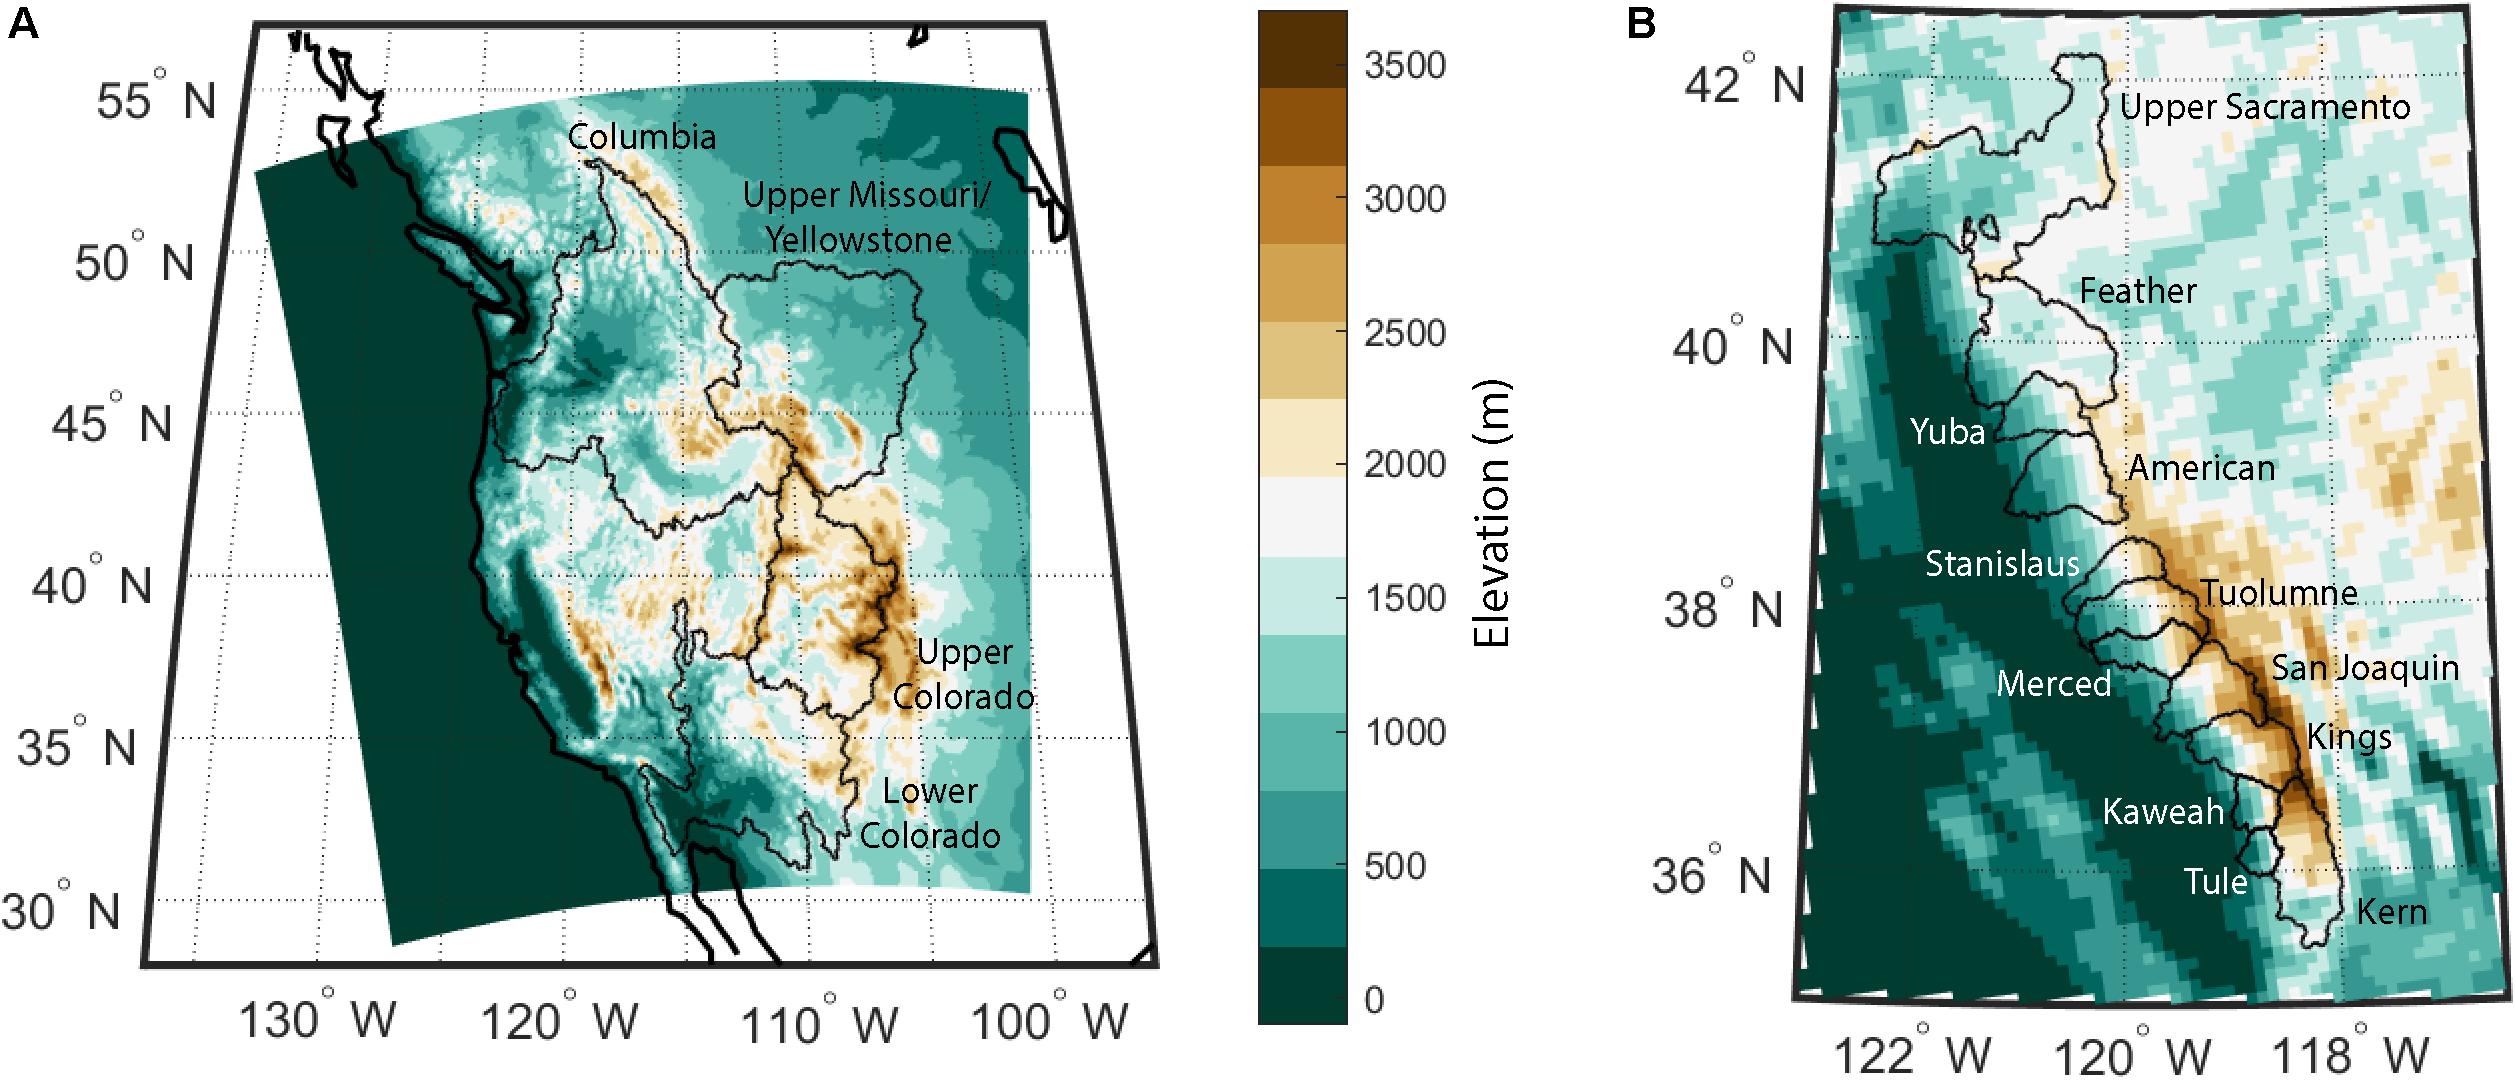
Figure 1. (A) Elevation from 9 km WRF domain over the western United States and Canada. Boundaries of the four large western watersheds are shown in black. (B) Zoomed in elevation, with the same scale, over the Sierra Nevada mountains of California. Twelve basins of interest are outlined in black.
Materials and Methods
Model Domain and Setup
We run WRF version 4.01 (Skamarock et al., 2019) with the Noah land surface model with multi-parameterization options (Noah-MP; Niu et al., 2011). We use a two-way nested domain, where the outer domain has a spatial resolution of 27 km and the inner domain a resolution of 9 km. Previous work suggests a model grid cell resolution of <10 km is necessary for capturing realistic simulations of orographic precipitation (Ikeda et al., 2010; Pavelsky et al., 2011; Rasmussen et al., 2011; Minder et al., 2016; Wrzesien et al., 2017, 2018). The 27 km outer domain covers North America and the eastern Pacific, to capture the moisture source for west coast storms. The 9 km inner domain (Figure 1A) includes the west coast of the United States and Canada and extends as far east as the Colorado Front Range. Since two-way nesting allows for feedback between the nested and parent domain, the finer resolution inner domain simulation essentially overwrites the overlapping outer domain area; therefore, we only analyze the 9 km domain.
Previous work identified modifications to Noah-MP that improve representation of snow accumulation and summer low flows for basins with headwaters in the Sierra Nevada (Holtzman et al., submitted). We incorporate the same modifications here; the largest changes include allowing the microphysics scheme to partition the precipitation into rain and snow (opt_snf = 4 in the WRF namelist) and decreasing the depth of subsurface runoff generation from the deepest soil layer (depth of 1–2 m below surface) to the second-from-top soil layer (depth of 10–30 cm below surface). Holtzman et al. (submitted) also developed a statistical aquifer correction algorithm based on full natural flow (FNF) estimates, which improves simulated baseflow for Sierra Nevada basins. We apply the same correction to WRF streamflow here where daily FNF estimates are available.
Beyond the modifications to Noah-MP, we use the following physics options: the Thompson et al. (2008) cloud microphysics scheme, the Rapid Radiative Transfer Model longwave scheme (Mlawer et al., 1997), the Dudhia shortwave scheme (Dudhia, 1989), the Yonsei University planetary boundary layer scheme (Hong et al., 2006), and the modified Kain–Fritsch convective parameterization for the two outer domains (Kain and Fritsch, 1990, 1993; Kain, 2004). To constrain WRF simulations, particularly over the center of the model domain, two-way spectral nudging is applied to wind, geopotential height, temperature, and water vapor mixing ratio; nudging to temperature and moisture are only applied within the free troposphere, following recent literature on nudging for regional climate purposes (Spero et al., 2014, 2018).
Meteorological forcing data are provided by the Community Climate System Model version 4 (CCSM4; Gent et al., 2011) under a high emissions scenario (RCP 8.5), which was part of the Coupled Model Intercomparison Experiment phase 5 (CMIP5). Bias-corrected WRF intermediate files are available through the National Center for Atmospheric Research’s Research Data Archive (NCAR RDA; dataset ds316.1; Monaghan et al., 2014). Selected variables are bias-corrected with values from ERA-Interim (Dee et al., 2011). The non-bias-corrected simulation is CCSM4 ensemble member 6 (b40.rcp8_5.1deg.007). Below in section “Bias Correction,” we include more details about the bias correction process.
We simulate three decade-long periods: a historic period [water years (WYs) 1996–2005], a mid-century period (WYs 2041–2050), and an end-century period (WYs 2091–2100). Though bias-corrected CCSM4 data are available through NCAR RDA from 1951 to 2100, we only simulate individual decades to represent historical and future climate due to computational constraints of running WRF. We include an additional year in each decadal simulation for model spin-up (WYs 1995, 2040, and 2090), which provides time for the previous snow season to impact soil conditions and allows for land surface state equilibrium (Cosgrove et al., 2003; Barlage et al., 2015); the spin-up years are not included in the analysis presented here. CCSM4 does not include leap days, so each decade simulation covers 3650 days.
Bias Correction
The bias correction method applied here, developed by Bruyère et al. (2013), adjusts the CCSM4 mean toward the ERA-Interim mean, calculated from 1981 to 2005. Over the 1981–2005 reference period, CCSM4 6-hourly data are separated into a monthly mean and a deviation. To calculate the bias-corrected CCSM4, the monthly mean from ERA-Interim and the CCSM4 deviation are combined. Therefore, the Bruyère et al. (2013) method corrects for mean errors in CCSM4 but incorporates the climate variability from CCSM4. The following equations are used in the bias correction:
In the equations, subscript ref stands for the reference period over which the bias correction is calculated; in this case, the years 1981–2005 are used. On the right-hand side, the first term is the monthly mean, and the second term is the deviation from the mean. For future years, the 6-hourly deviations are applied to monthly means of the same historical reference period; therefore, deviations for CCSM4 predictions of 2006–2100 are applied to monthly means of ERA-Interim for the period 1981–2005.
Bias correction is applied to correct the mean bias in both 3-D fields and in surface fields. Corrected 3-D fields include geopotential height, wind, temperature, and humidity, while surface fields include surface pressure, sea level pressure, sea surface temperature, skin temperature, soil temperature, and soil moisture (Bruyère et al., 2013). This method retains the CCSM4 variability in the initial and lateral boundary conditions for WRF; other methods, such as PGW, retain variability from the reanalysis dataset. The Bruyère et al. (2013) method has been used in other studies to bias correct GCMs, including Wang and Kotamarthi (2015) and Pontoppidan et al. (2018).
Percentiles
To evaluate events with substantial precipitation and runoff, we calculate percentiles for each decade from the daily values. We are interested in the wettest days, so we consider the 99th percentile, which occur 37 times per decade. By calculating percentiles with daily values, we miss multi-day extreme events. However, consideration of daily magnitudes of precipitation and runoff demonstrates how the wettest single-day events may change by the middle and end of the 21st century.
Full Natural Flow
To evaluate the reasonableness of the WRF-downscaled streamflow for the historic period, we compare to estimated FNFs for eight Sierra Nevada basins (Huang, 2016). FNF estimates are downloaded from the California Data Exchange Center. By calculating the decade-averaged streamflow from WRF and the FNF estimate, we can determine whether WRF simulations are reasonable. We also use the Sierra Nevada FNF estimates to calibrate the aquifer correction to simulated streamflow.
Results
Prior to comparing future WRF simulations to the historic simulations, we first evaluate whether WRF streamflow estimates capture realistic conditions. By comparing WRF-simulated streamflow and FNF estimates at each percentile (from the 1st to 99th percentile), we see that at large streamflow magnitudes, WRF generally overestimates FNF (Figure 2). The notable exception is the American basin where FNF is larger for the highest percentiles (95th percentile and above). Streamflow magnitudes below the 80–90th percentile, depending on basin, are more comparable between the two datasets.
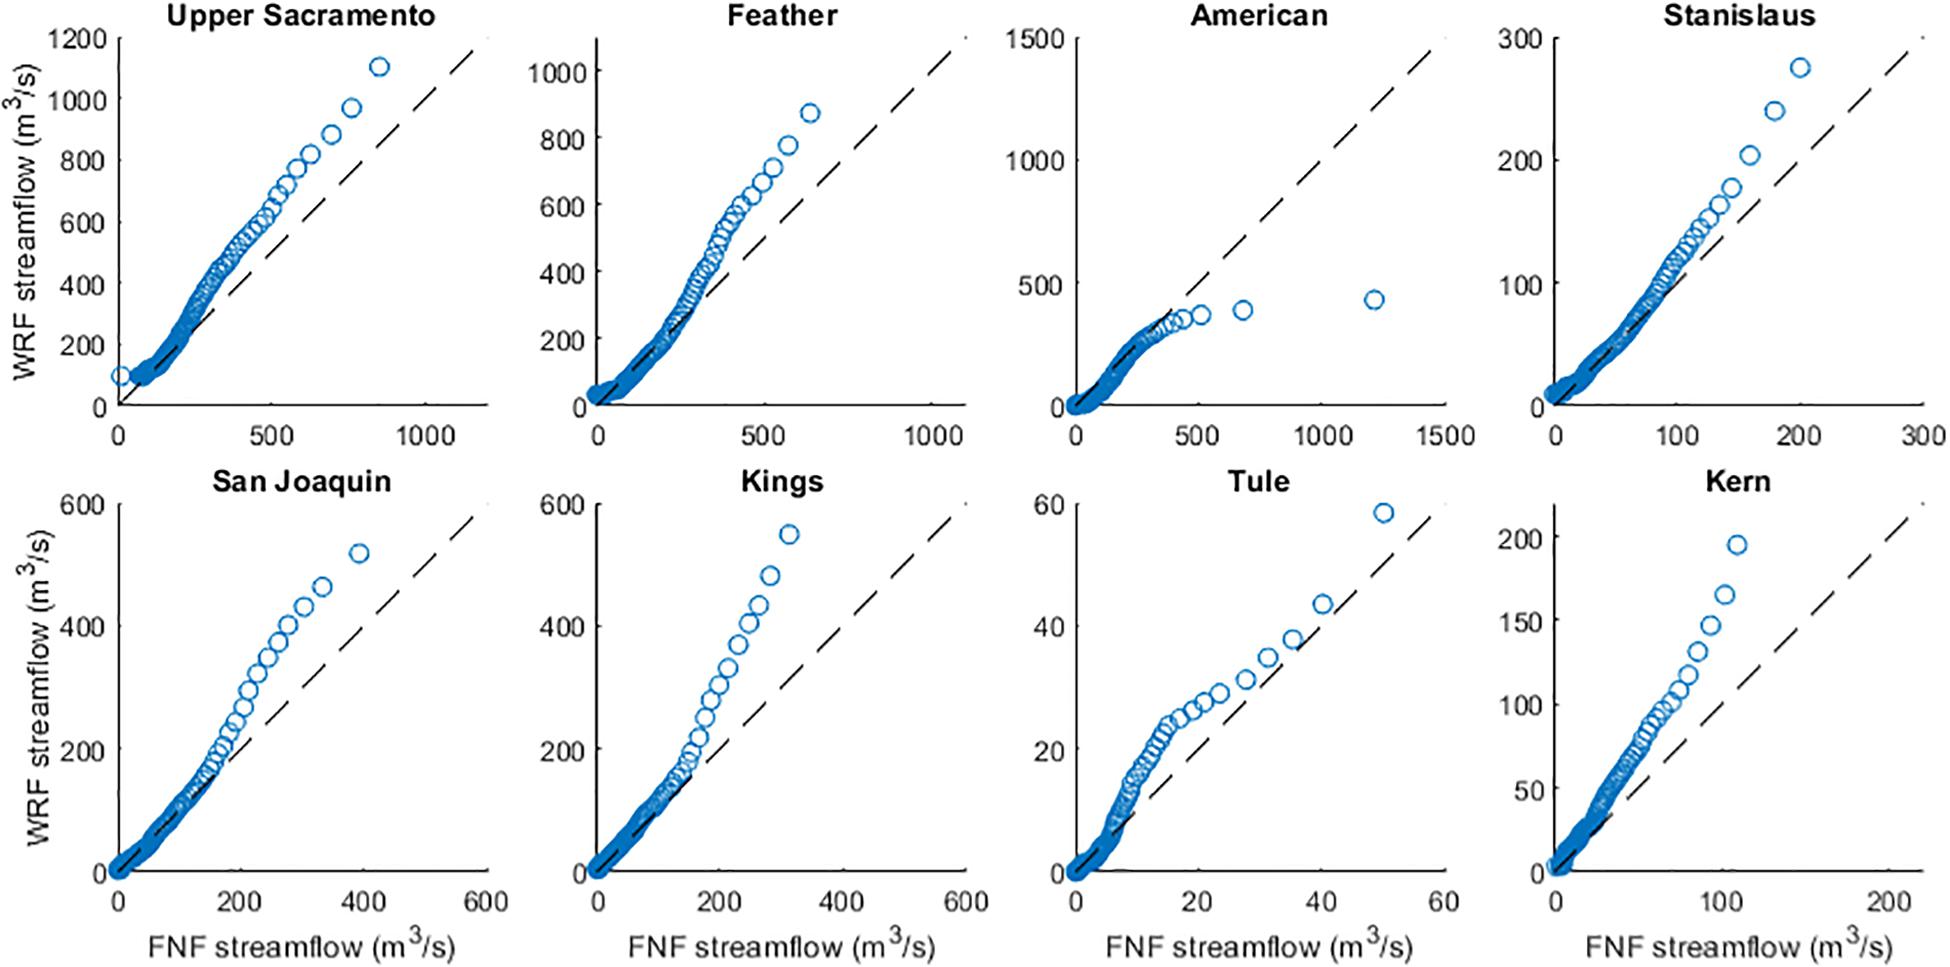
Figure 2. Comparison of daily runoff from WRF and full natural flow for eight Sierra Nevada basins. Daily values are averaged over water years 1996 through 2005.
We next consider how decade-averaged precipitation and runoff is projected to change in the WRF simulations. To test whether there are statistically significant changes in annual precipitation and runoff between the historic decade and end century, we perform a two-sample t-test. We note that each decadal sample only has 10 values, potentially decreasing the statistical power of the t-test. Below and in Table 1, we report which decadal changes are statistically significant. When comparing average annual precipitation from the historical period to the end-century, we see a dipole pattern in the model domain (Figure 3). Precipitation is projected to increase in the northern half of the domain and along the west coast, matching with the spatial patterns of the 99th percentile values (Figure 4). Decreases are expected in the southern portion of the WRF domain. We can further split precipitation into snowfall and rainfall. As expected in a warming scenario, large decreases are projected for snowfall (Figure 5). In the Upper Colorado, changes to total precipitation are largely driven by decreases to snowfall: average annual total precipitation in the Upper Colorado is expected to decline by 11.6% by 2100 (Table 1), where snow is projected to decline by 29.1% (significant at the 95% confidence level), and rainfall is projected to increase by 1.5%. In the other three basins, projected changes to rainfall have larger magnitudes than snowfall changes.
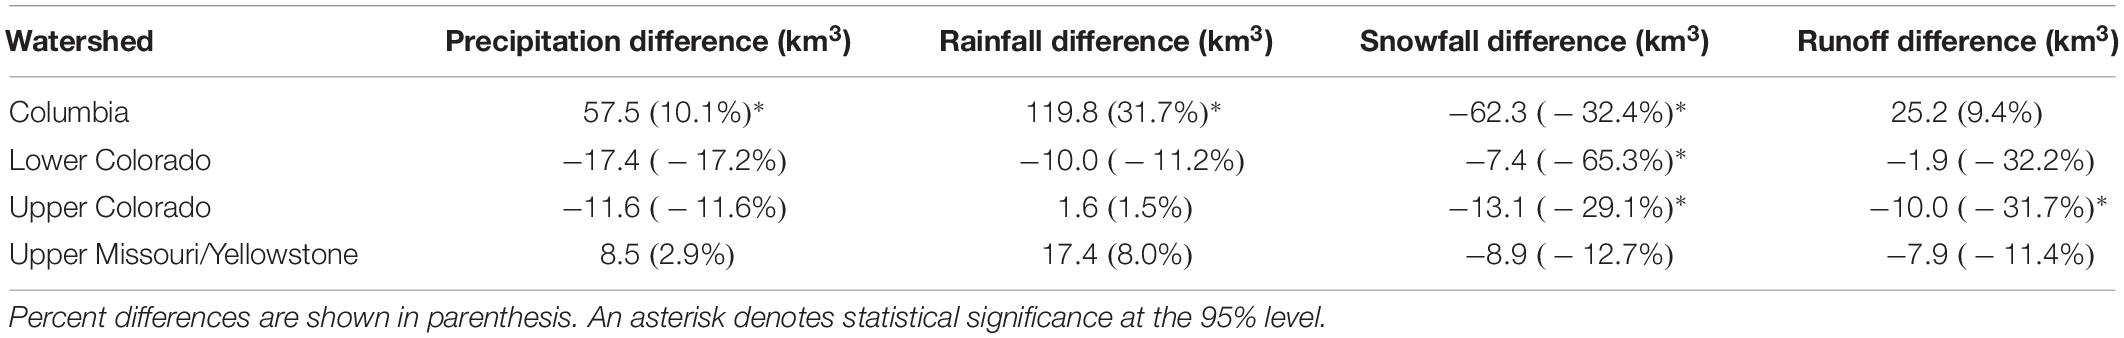
Table 1. Change in volume of hydroclimate variables between end-century and historic average values for western watersheds.
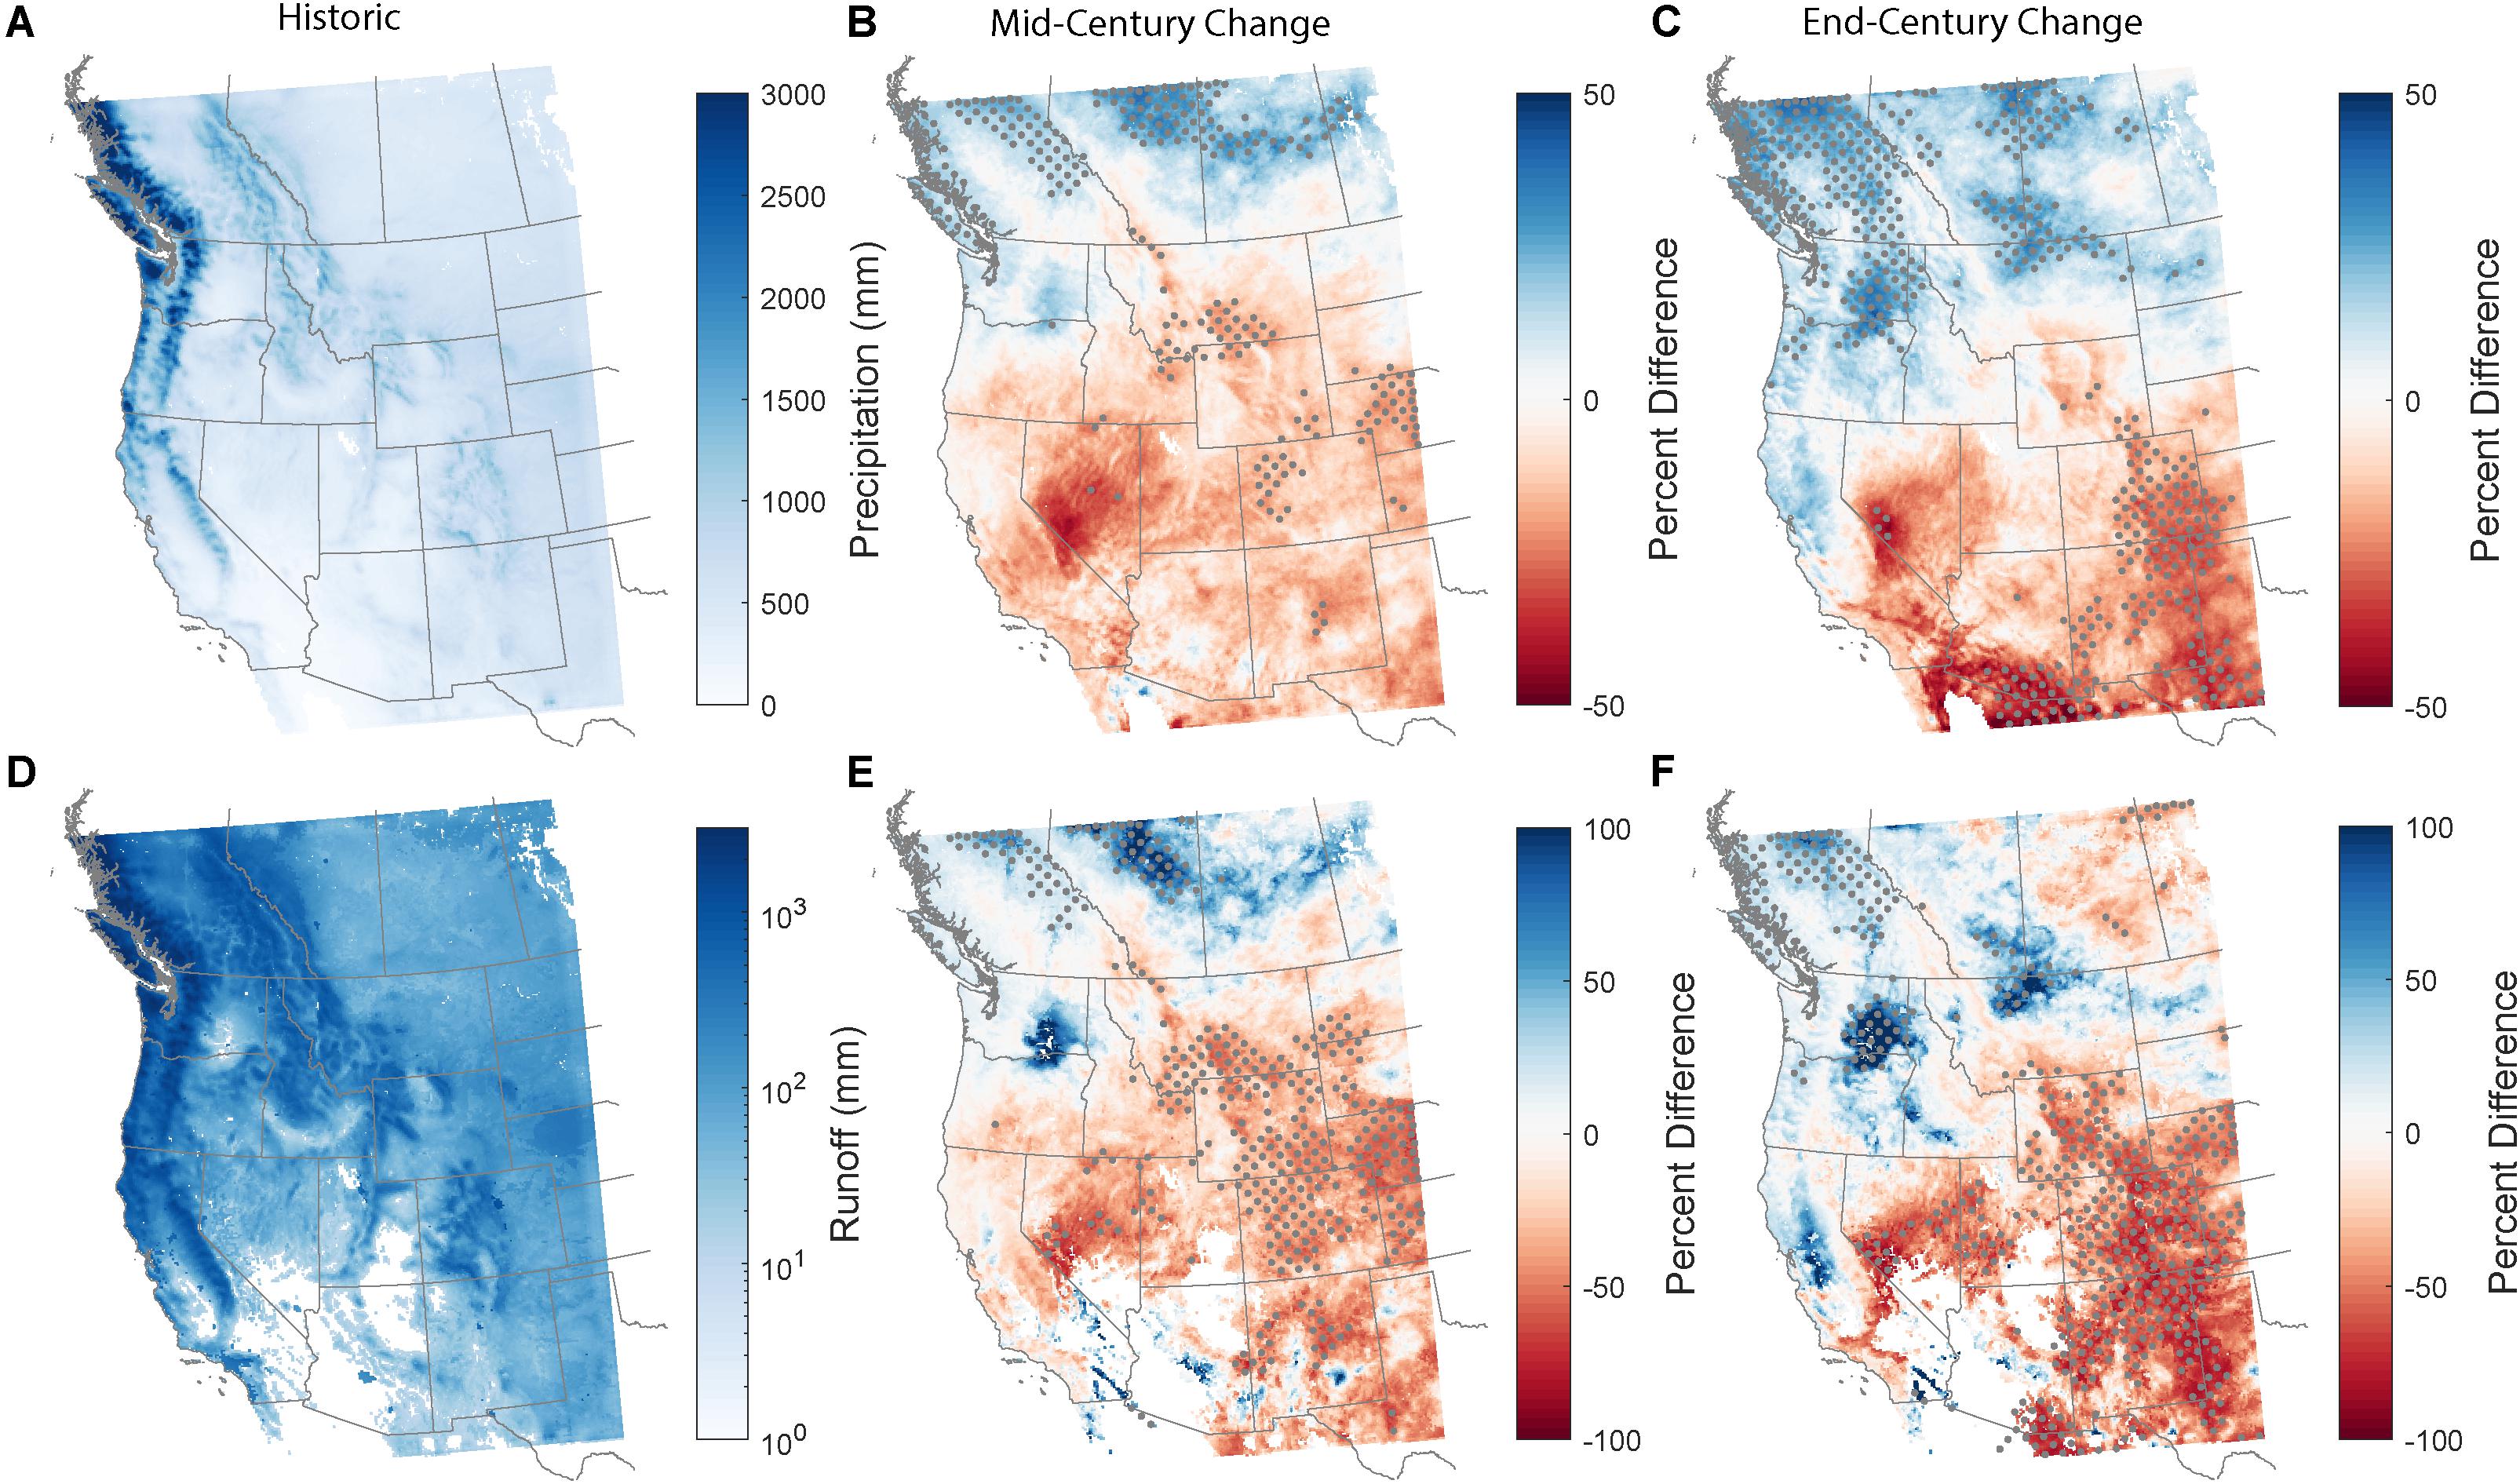
Figure 3. (A) Average annual total precipitation from WRF/CCSM for the historical decade. (B,C) Percent difference in annual precipitation when comparing the mid-century (B) and end-century (C) decades to the historic. (D) Average annual total runoff from WRF/CCSM for the historical decade. (E,F) Percent difference in annual runoff when comparing the mid-century (E) and end-century (F) decades to the historic. Stippling indicates regions with a statistically significant change by mid- or end-century at the 95% confidence level.
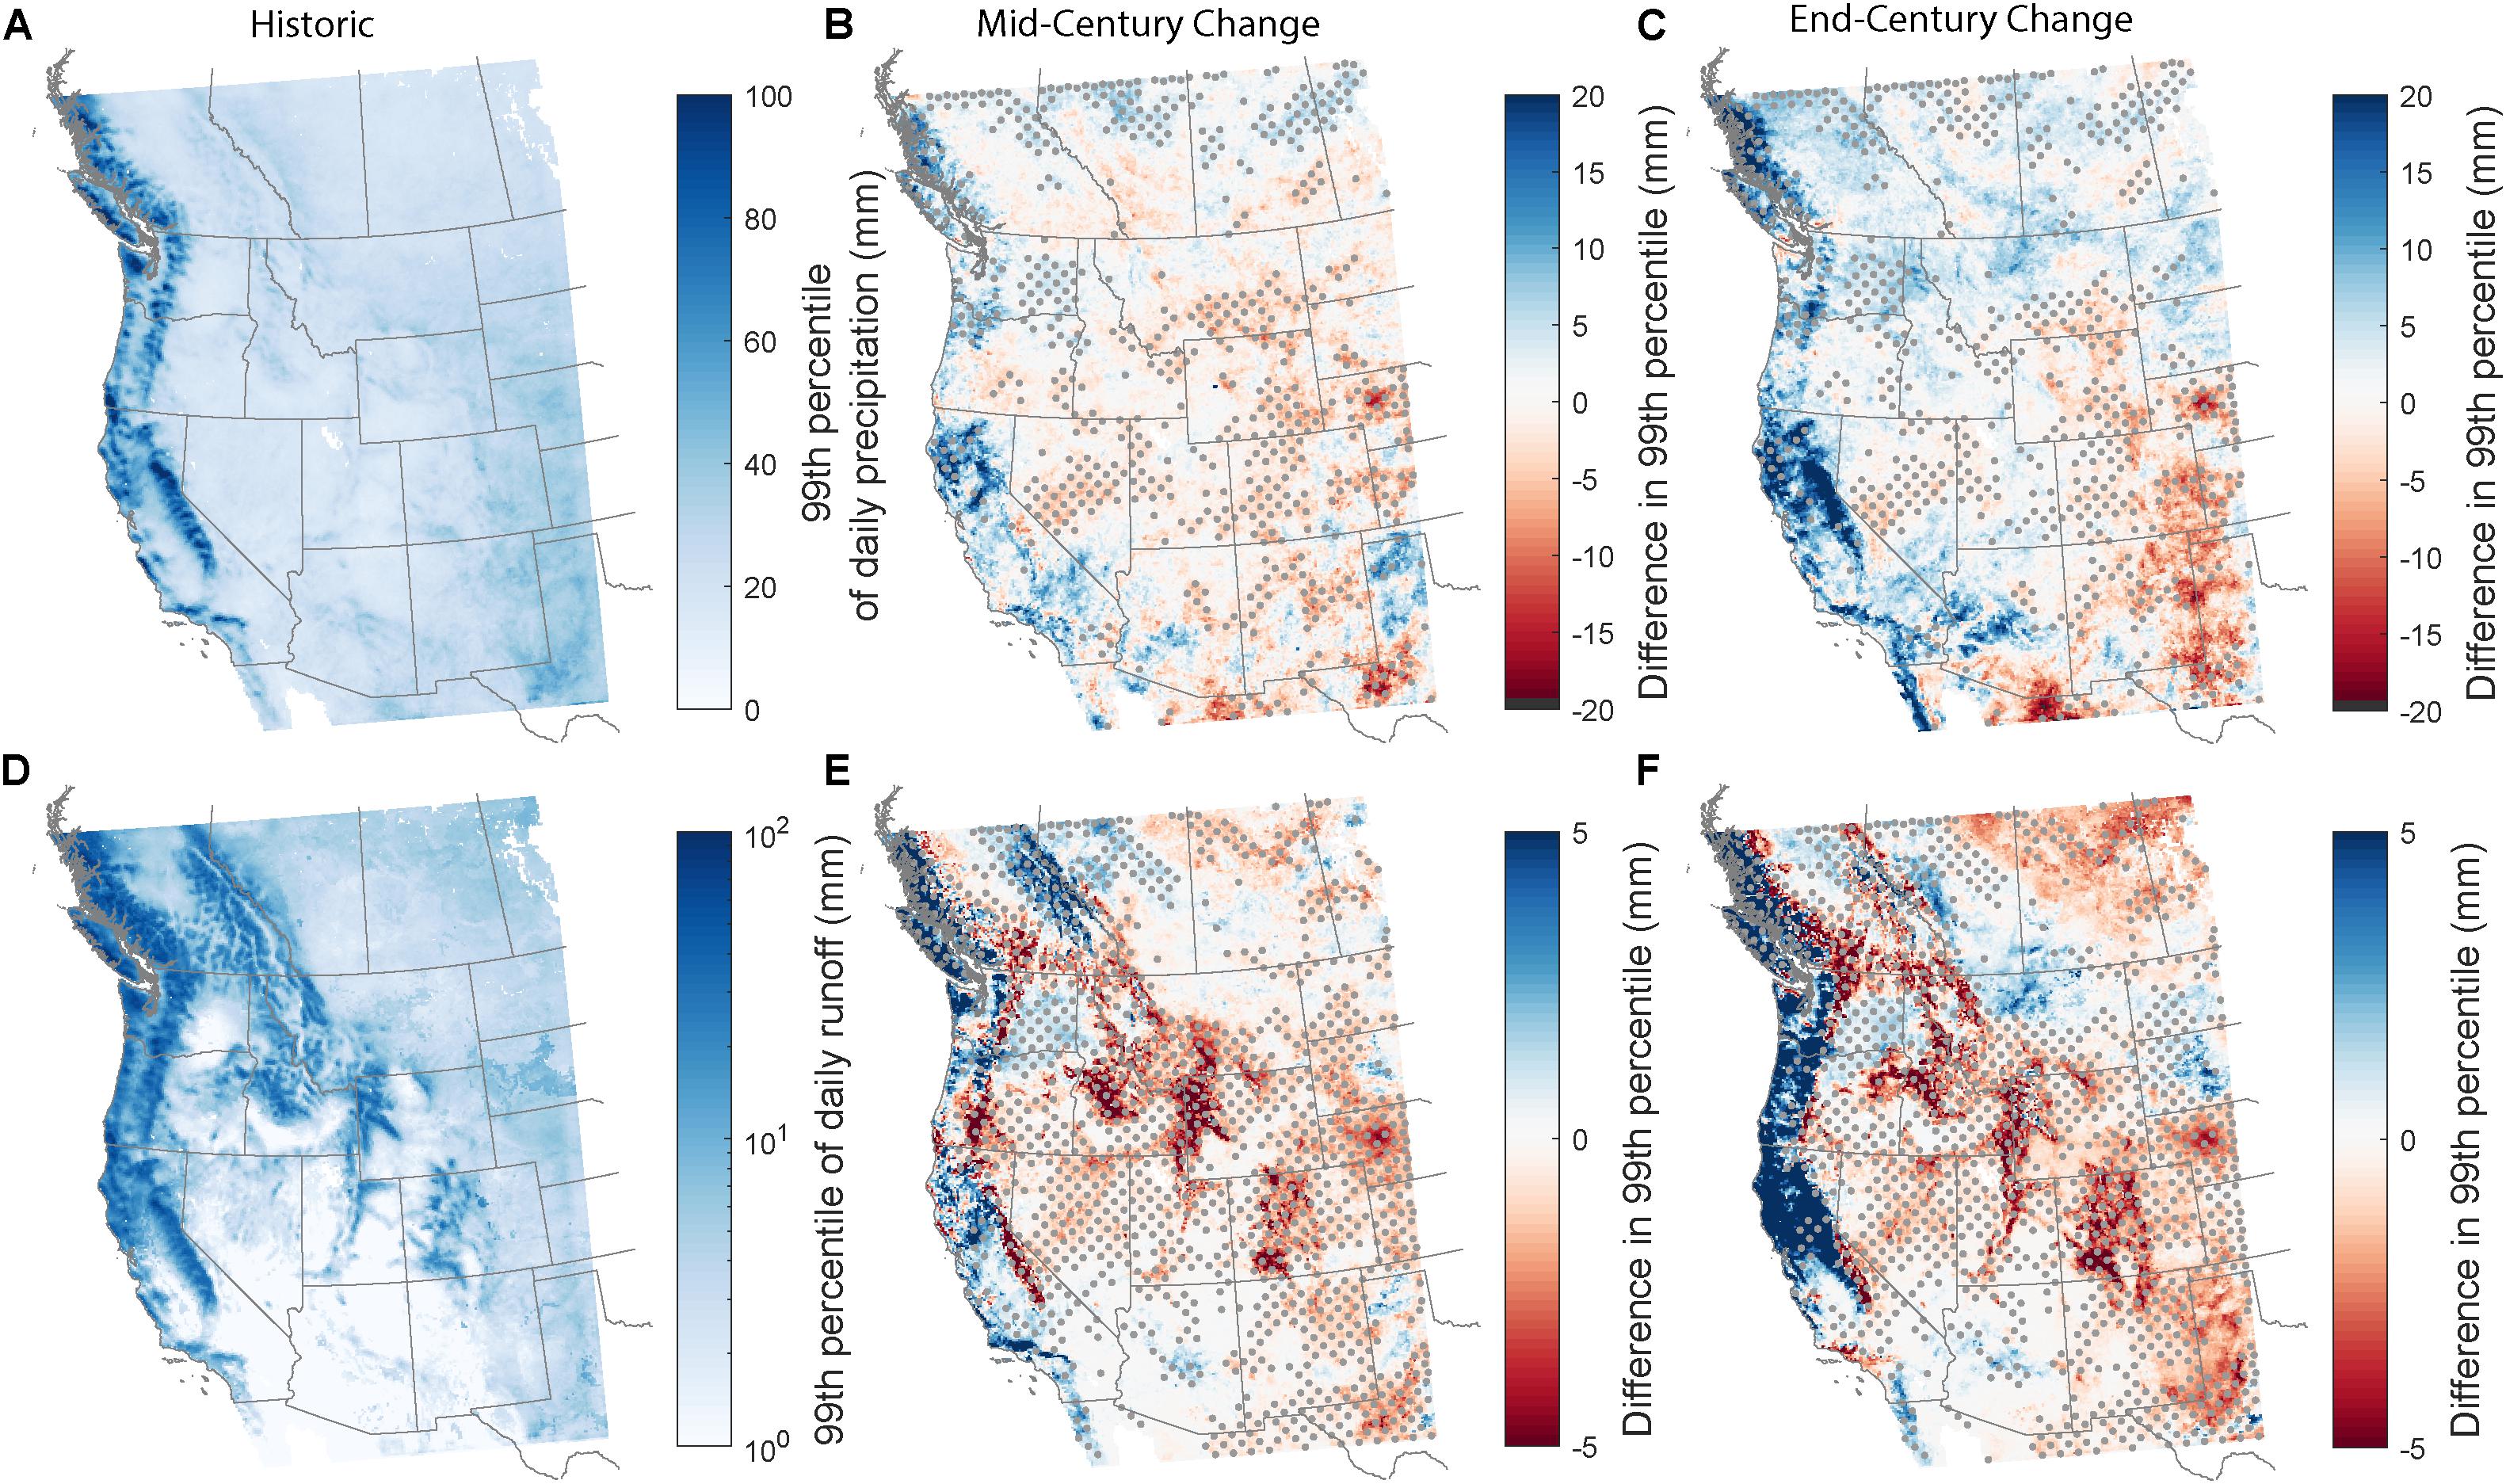
Figure 4. (A) Grid cell values for the 99th percentile of daily precipitation for the WRF/CCSM historic decade. (B,C) Differences in magnitude of grid cell value of 99th percentile of daily precipitation when comparing the mid-century (B) and end-century (C) decades to the historic decade. (D–F) Same as (A–C) but for the 99th percentile of daily runoff. Stippling indicates regions with a statistically significant change by mid- or end-century at the 95% confidence level.
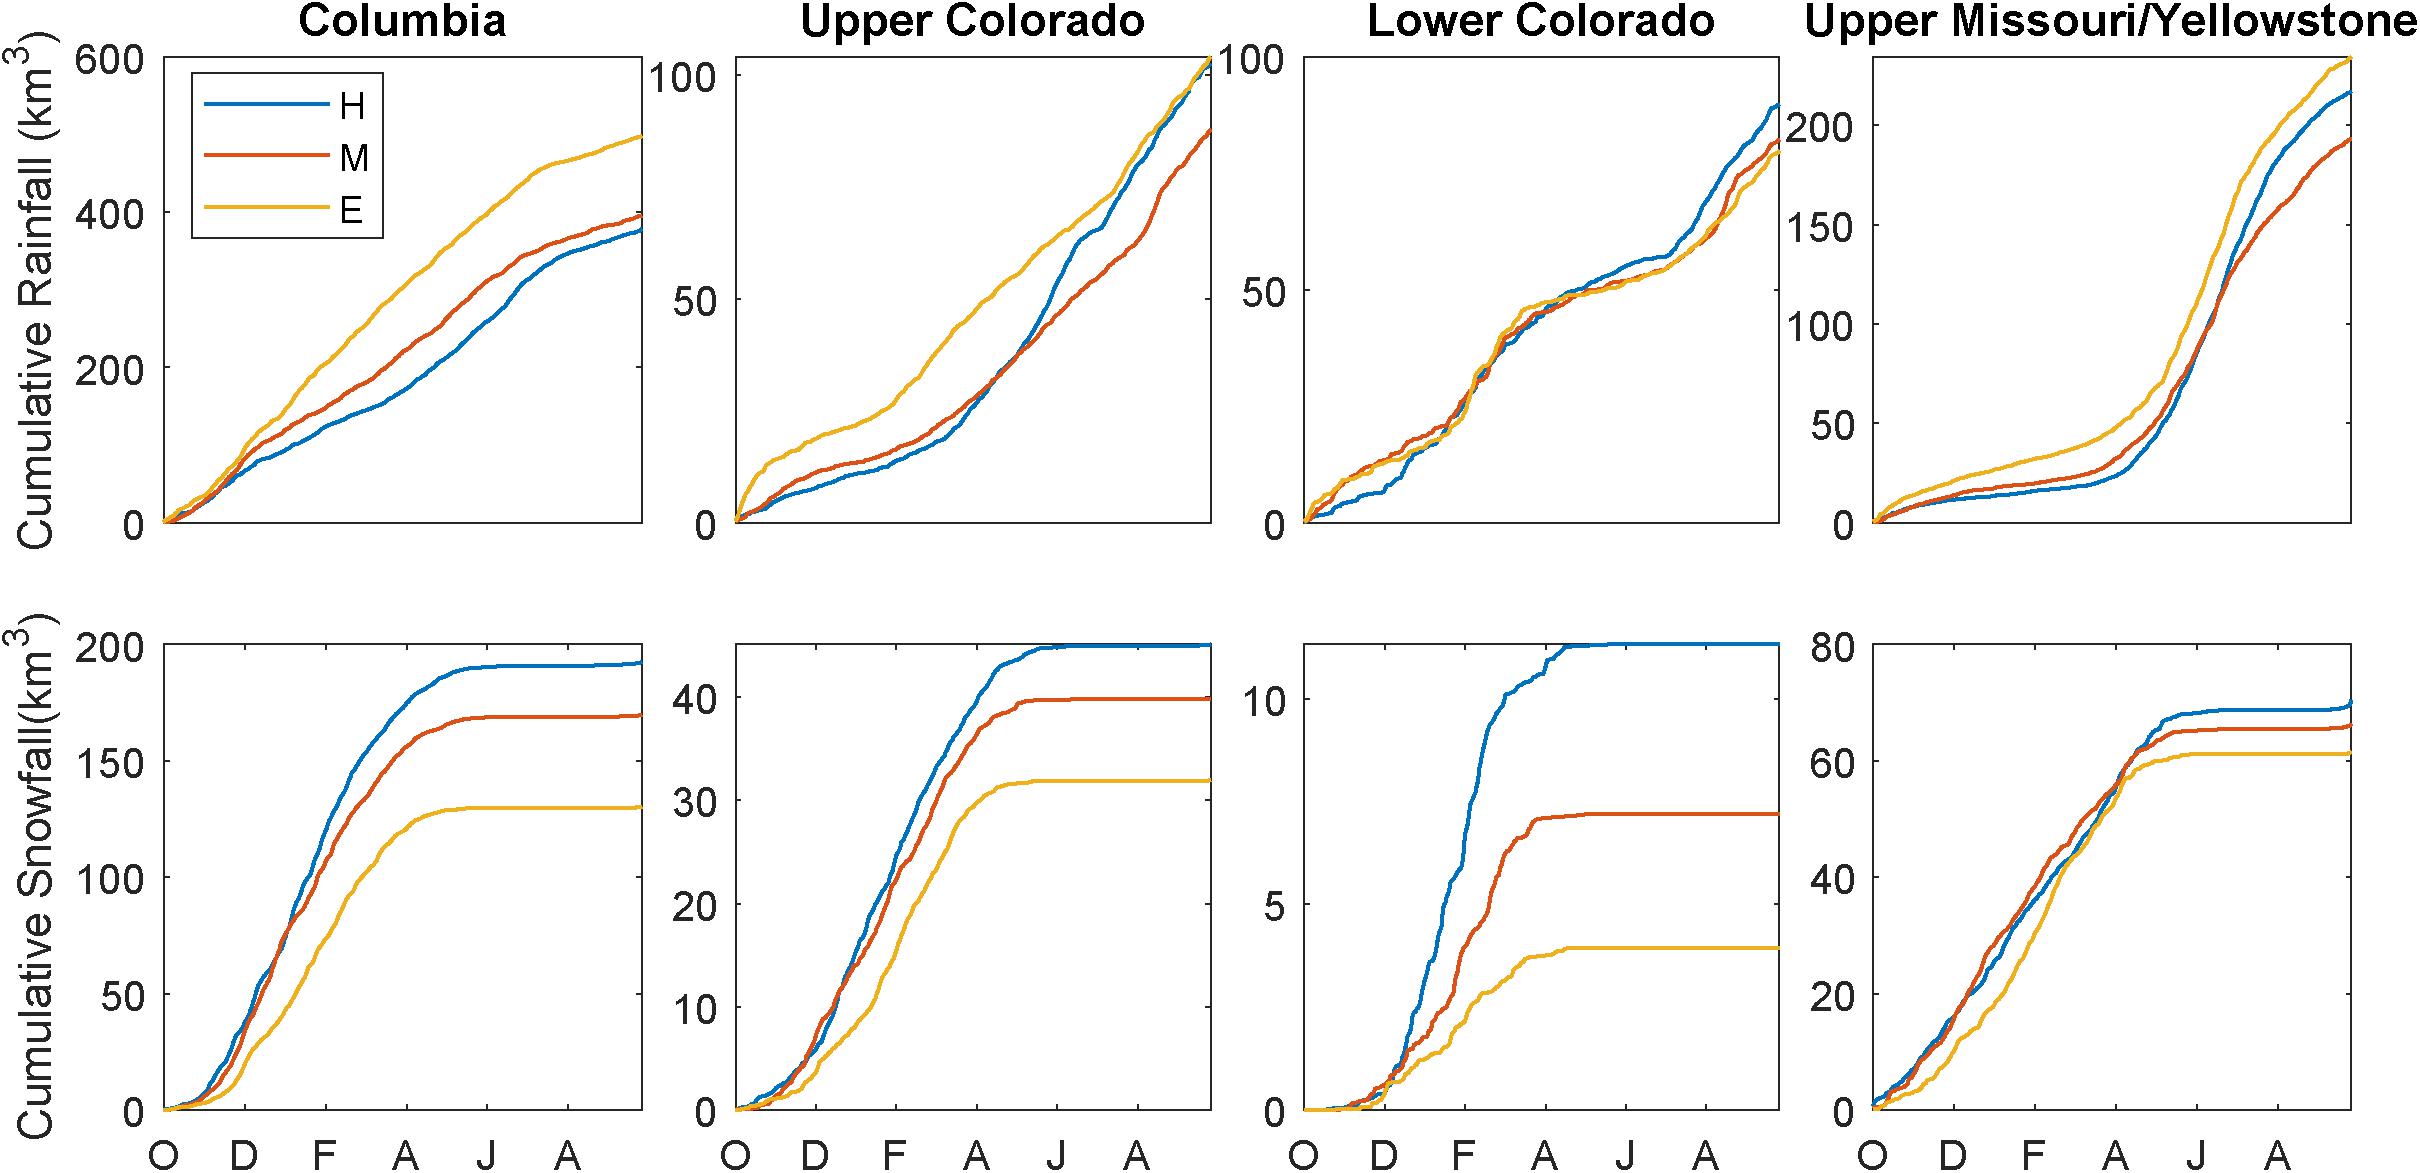
Figure 5. Comparison of average annual cumulative rainfall (top row) and snowfall (bottom row) for the four western watersheds for the historic (blue), mid-century (orange), and end-century (yellow) decades.
Changes to annual runoff follow similar spatial patterns as precipitation, with increases along the Pacific coast and decreases in the eastern half of the domain (Figure 3). The desert southwest is projected to have less annual streamflow by the last decade of the 21st century, while the Pacific Northwest can expect increased streamflow. Of the four large watersheds, only the Columbia River basin is projected to increase annual total runoff (9.4%; not significant at the 95% confidence level), likely driven by the projected increase in annual precipitation (31.7%; significant at the 95% confidence level; Table 1). Of the other three basins, all are projected to have less annual streamflow, with the Upper Colorado (−31.7%) and Lower Colorado (−31.2%) having the largest declines; however, when comparing end-century changes to annual runoff, only the Upper Colorado has a statistically significant change.
In addition to differences in runoff amount, runoff timing is expected to change. Average hydrograph changes are clearest for the Columbia and Upper Colorado River Basins (Figure 6), two regions that receive significant amounts of snowfall in the historic simulation. In both watersheds, the end-century hydrograph peaks earlier and has a smaller magnitude than the historic hydrograph. Snowfall often has a delayed impact on streamflow since it can accumulate for several months until spring snowmelt, while rainfall generally impacts streamflow much more quickly. Earlier peaks in streamflow are consistent with a shift from snowfall to rainfall, as demonstrated in the Columbia and Upper Missouri/Yellowstone basins (Figure 5). In the Columbia, a larger fraction of runoff occurs in the winter months (December through March), suggesting that precipitation that fell as snowfall in the historic period may transition to rainfall by the end-of-century. In all basins except the Upper Missouri/Yellowstone, snow water storage is also expected to decrease (Figure 6). For the two watersheds with larger amounts of snow accumulation (Columbia and Upper Colorado), maximum SWS declines by over 40% by end-century. Interestingly, WRF results suggests day of peak SWS also shifts later.
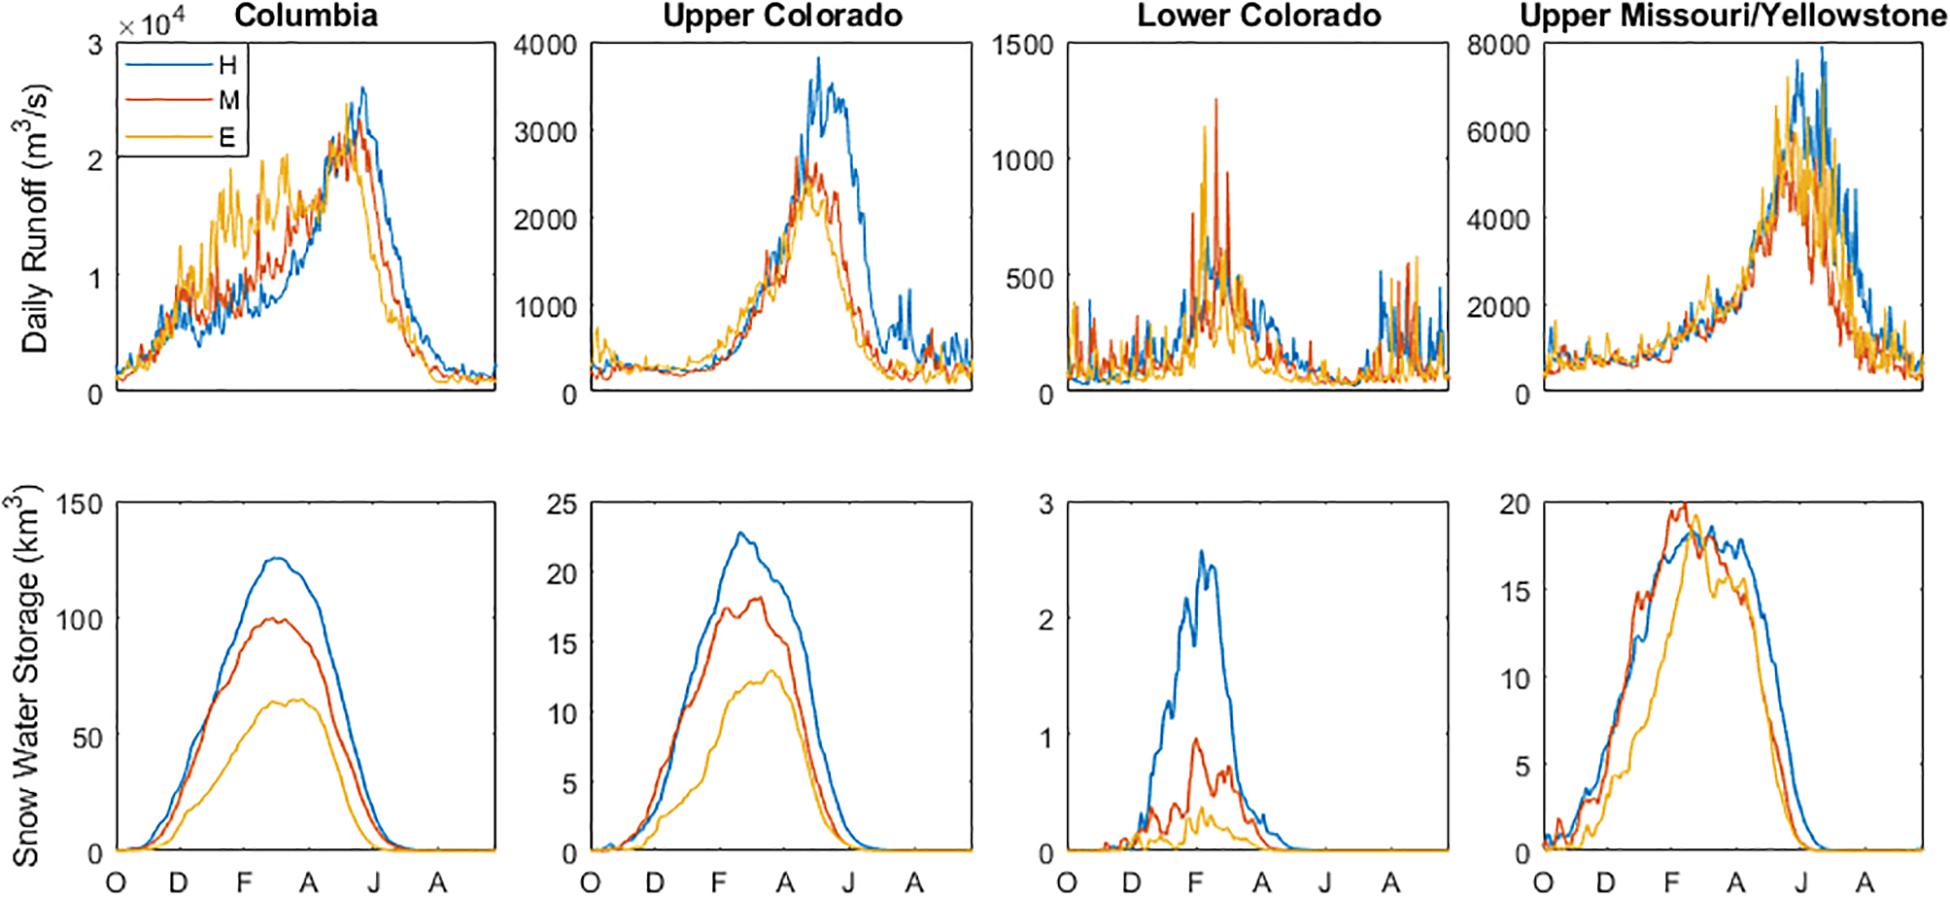
Figure 6. Average daily runoff (top row), and snow accumulation (bottom row) over each western watershed for the historic (blue), mid-century (orange), and end-century (yellow) periods.
All four watersheds are projected to have decreases in daily runoff by end-century for spring and summer months (Figure 7). Decreases in the Columbia and Upper Colorado are largest in May through July, which coincides with the snowmelt period. The Columbia watershed has positive values throughout the winter, which agrees with the higher streamflow values in the end-century hydrograph (Figure 6A). These larger winter/early spring streamflow values are driven by increased rainfall during the winter (Figure 5A). Throughout the 21st century, the snowfall in the Columbia watershed is projected to decrease and the rainfall is projected to increase. The Lower Colorado has the smallest changes by end-century, though it is the driest watershed of the four. Changes to daily runoff in the Upper Missouri/Yellowstone occur between June and September as the hydrograph maximum shifts earlier (Figure 6).
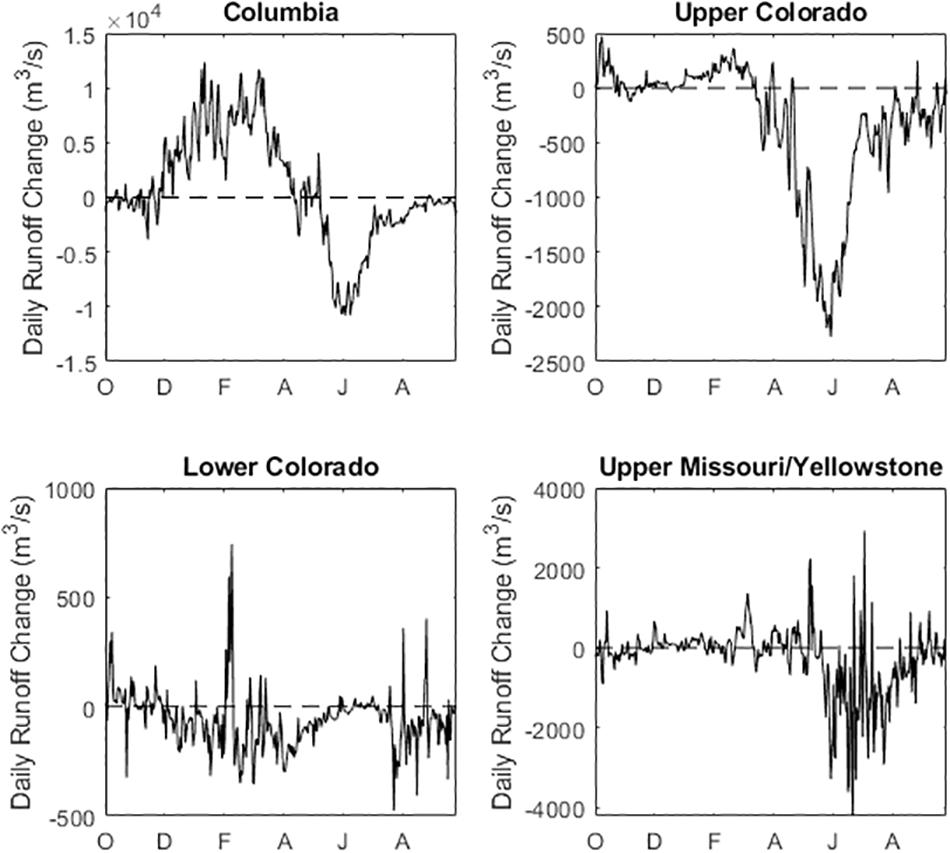
Figure 7. Difference in decade-averaged annual hydrographs for western watersheds. Daily runoff change is calculated by subtracting historic values from end-century hydrograph.
To examine extreme events, we first consider how the 99th percentile of precipitation and runoff change across the full model domain. We have chosen the 99th percentiles of the entire record to isolate the most extreme precipitation occurrences, which provides 37 samples. A two-sample Kolmogorov–Smirnov test is used to determine statistical significance of the changes in extremes. This method has been previously applied to changes in hydrologic extreme distributions (e.g., Russo and Sterl, 2012; Donat et al., 2013; Harder et al., 2015; Erler and Peltier, 2016). Moreover, even with a GCM, previous research has used similar sample sizes to quantify hydrologic extremes and significance. For example, 100 and 20 samples were taken to characterize 1-year and 5-year United States precipitation extremes by van der Wiel et al. (2016). Rejection of the null hypothesis supports that the samples from the historical and future periods are from different distributions. Tables 2, 3 report statistical significance of each projected change; all projected changes to runoff are statistically significant. Since we perform significance tests on all extreme events (>99th percentile) together, calculating the percent change at an individual percentile may result in projected changes that do not appear significant. For example, for the San Joaquin basin, the magnitude of 99th percentile runoff events is projected to increase by 1% (Table 3), yet the full distribution of end-century extreme runoff events in the San Joaquin is significantly different from the historic distribution. Along the west coast, 99th percentile values of daily precipitation are increasing, signifying that wet days are getting wetter, particularly by the end-century (Figure 4). For 2091–2100, increases are most prominent over the Sierra Nevada and southwest British Columbia. The four western watersheds – the Columbia, Upper Colorado, Lower Colorado, and Upper Missouri/Yellowstone – are projected to have increases in magnitude of percentiles (Table 2). The Columbia River basin has the largest increase, with the average amount of precipitation during an extreme event projected to increase by 12%. Runoff patterns are similar to those for precipitation: the wettest runoff days are expected to increase along the western coast of the United States and Canada, particularly along the windward side of the coastal mountain ranges (Figures 4E,F). By the end-century, decreases in extreme runoff are most notable in the Upper Colorado River basin, where basin-averaged daily runoff is estimated to decrease by 31 for the 99th percentile.
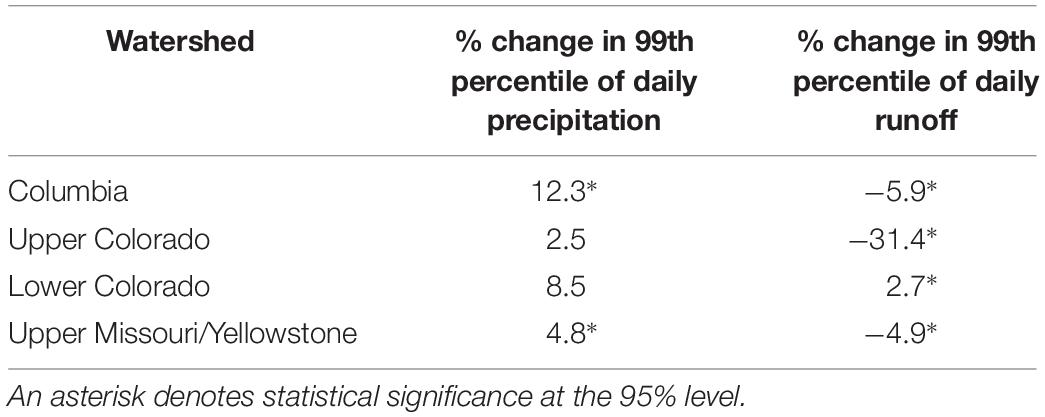
Table 2. Percent change by end-century in daily precipitation and runoff percentiles for western watersheds.
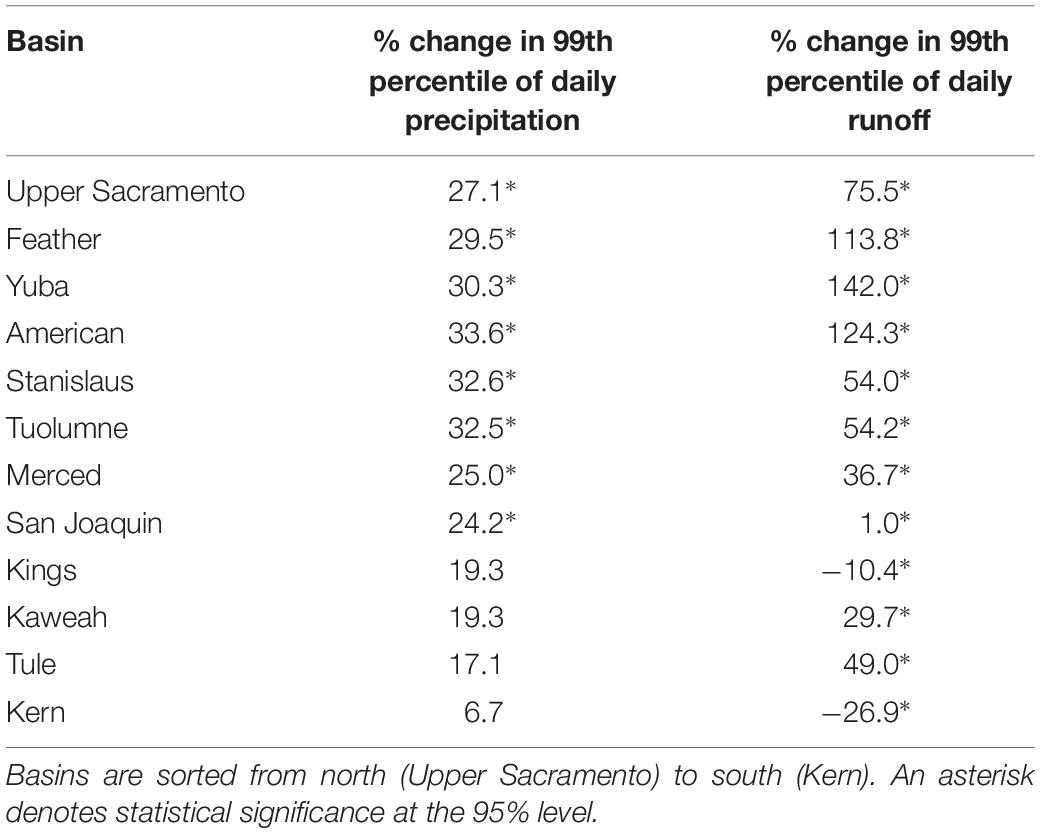
Table 3. Percent change by end-century in daily precipitation and runoff percentiles for Sierra Nevada basins.
For a more local view, we also consider 12 basins with headwaters in the Sierra Nevada mountains. For all 12 basins, the streamflow hydrographs shift earlier in the season (Figure 8), consistent with decreasing snow accumulation (Figure 9). In the historical decade, streamflow decays to baseflow conditions in late July or early August; by the end century, streamflow decays to baseflow as early as June for some basins (e.g., American and Feather). From the decade-averaged hydrographs, it appears there are more flashy events in the winter and early spring, suggesting basins are either receiving increased rainfall or snowfall is melting shortly after deposition.
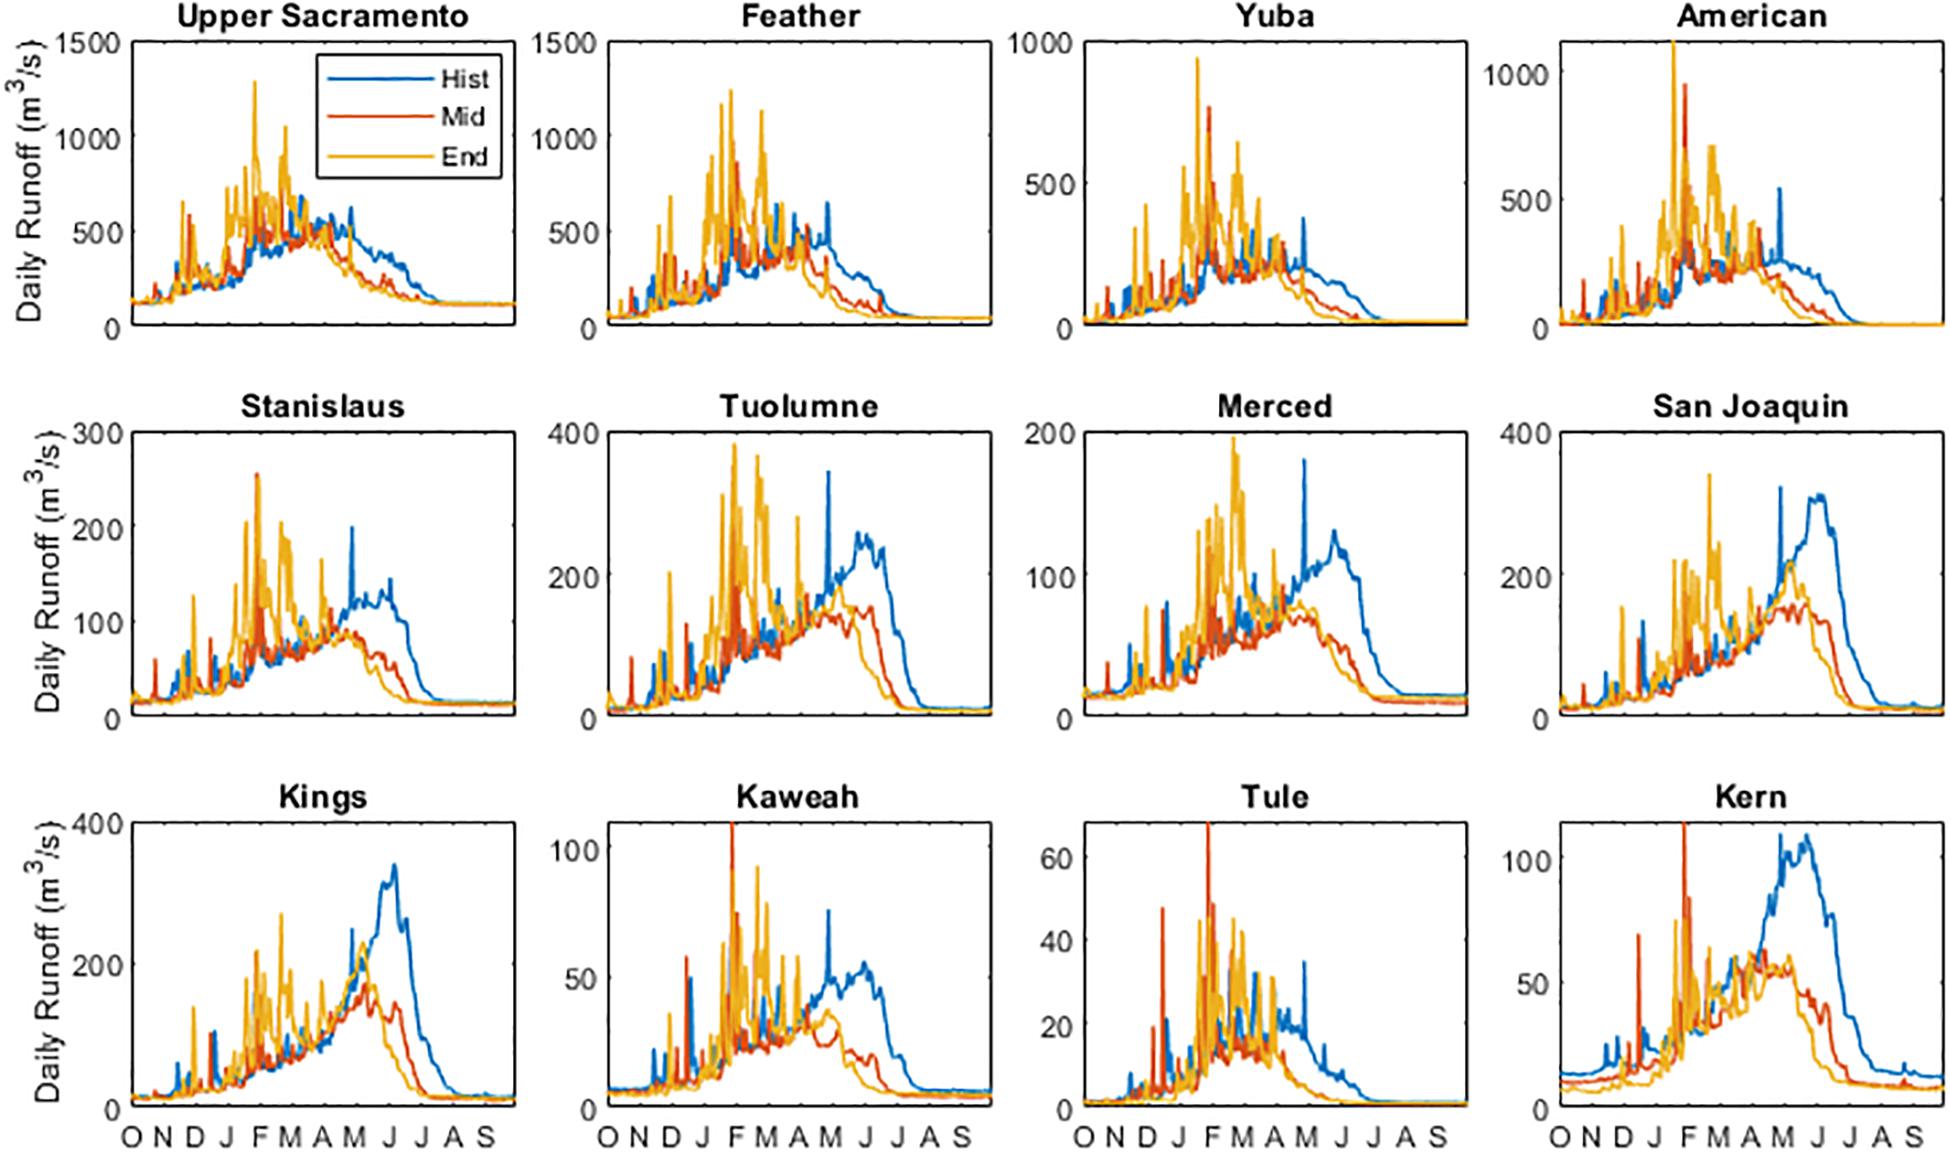
Figure 8. Average hydrographs for basins with headwaters in the Sierra Nevada mountains for the historic (blue), mid-century (orange), and end-century (yellow) decades.
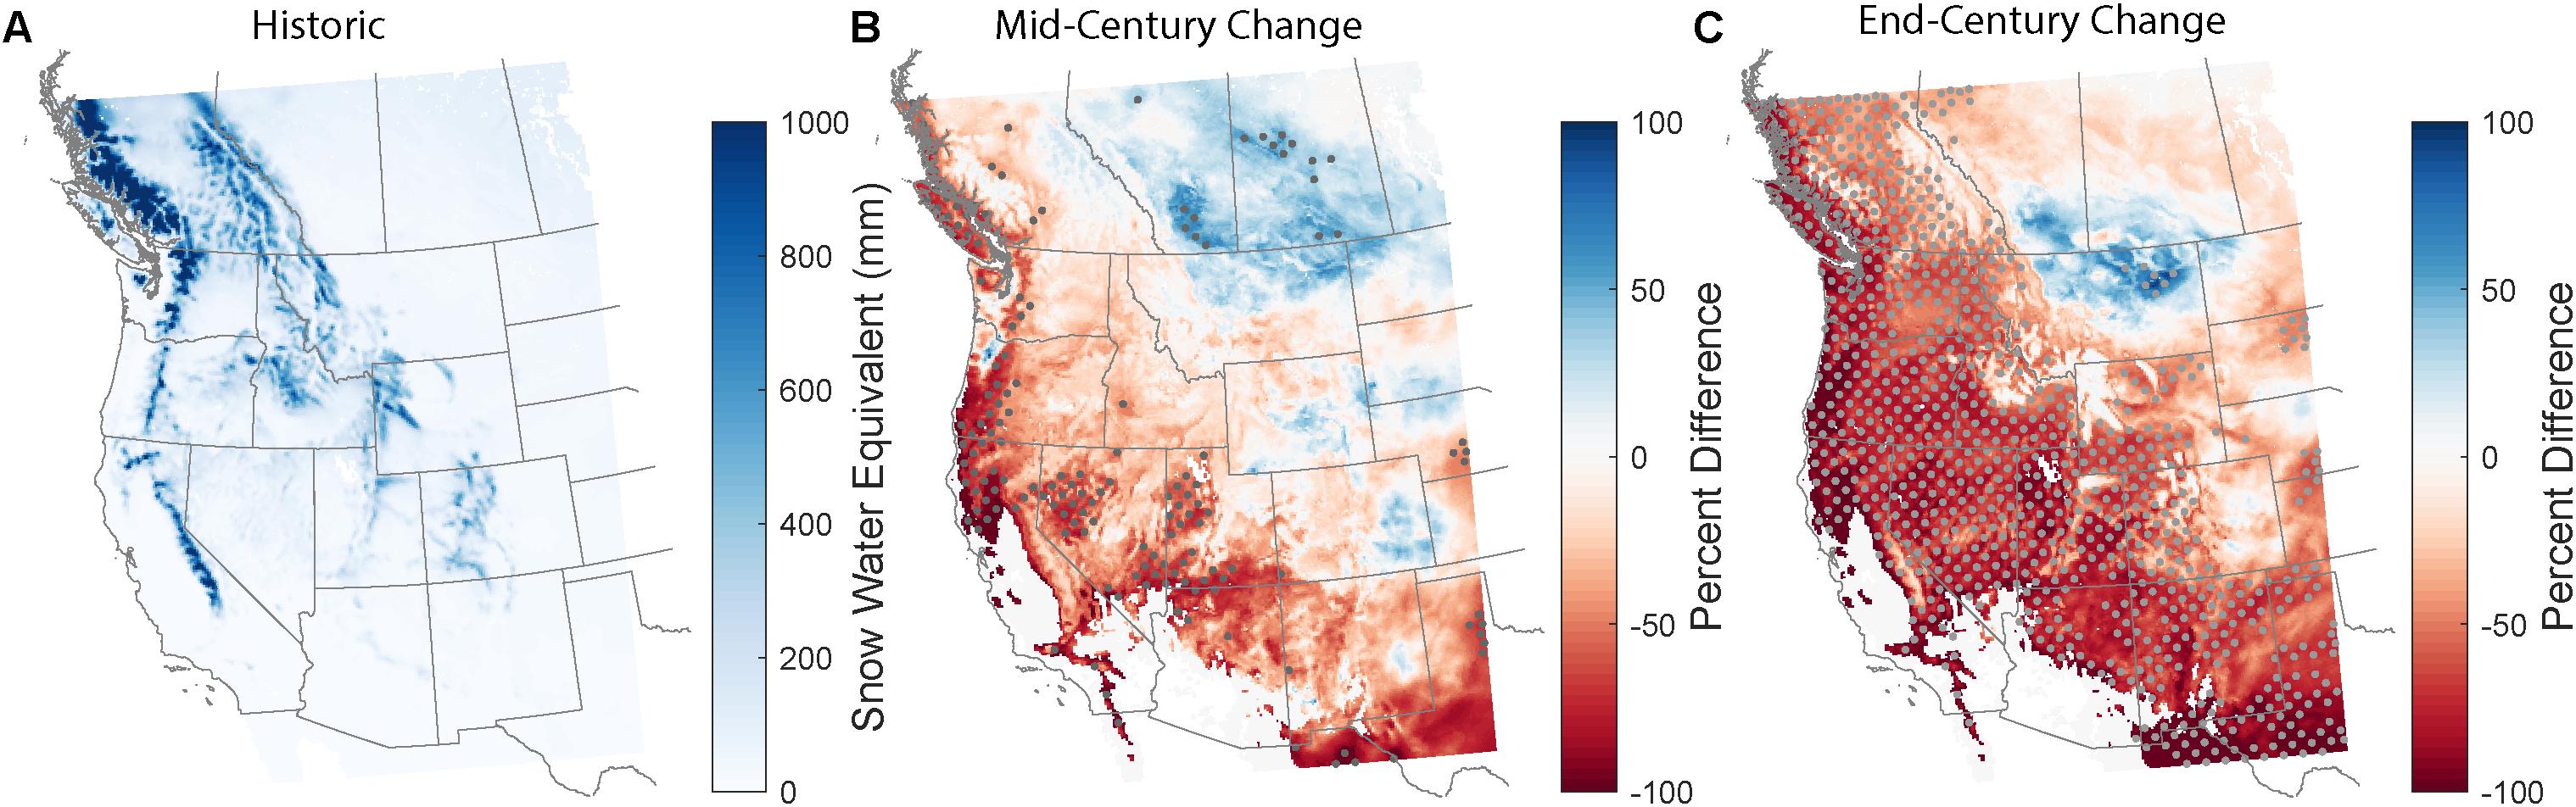
Figure 9. (A) Average annual maximum snow water equivalent (SWE) from WRF/CCSM for the historical decade. (B,C) Percent difference in peak SWE when comparing the mid-century (B) and end-century (C) decades to the historic. Stippling indicates regions with a statistically significant change by mid- or end-century at the 95% confidence level.
For extreme events, all basins are projected to have increases in the magnitude of the 99th percentile precipitation events (Table 3). Projected changes are statistically significant for 8 of the 12 basins; those that do not have statistically significant changes are in the southern Sierra Nevada. Wet days getting wetter may increase flood risks for regions downstream. For days with substantial runoff, the magnitude of the 99th percentile of daily streamflow is projected to increase for all basins other than the Kern and the Kings. The Yuba, American, and Feather basins are all projected to have 99th percentile magnitude increases greater than 100%. Projected changes to extreme runoff are statistically significant for all 12 basins (Table 3). Though extreme events are projected to have higher magnitudes by end-century, daily streamflow at other percentiles decreases for all basins (Figure 10). Streamflow magnitudes are similar for the mid-century and end-century decades. Declines at the 50th percentile between historical and end-of-century are particularly large for Kaweah, Kern, and Tuolumne basins.
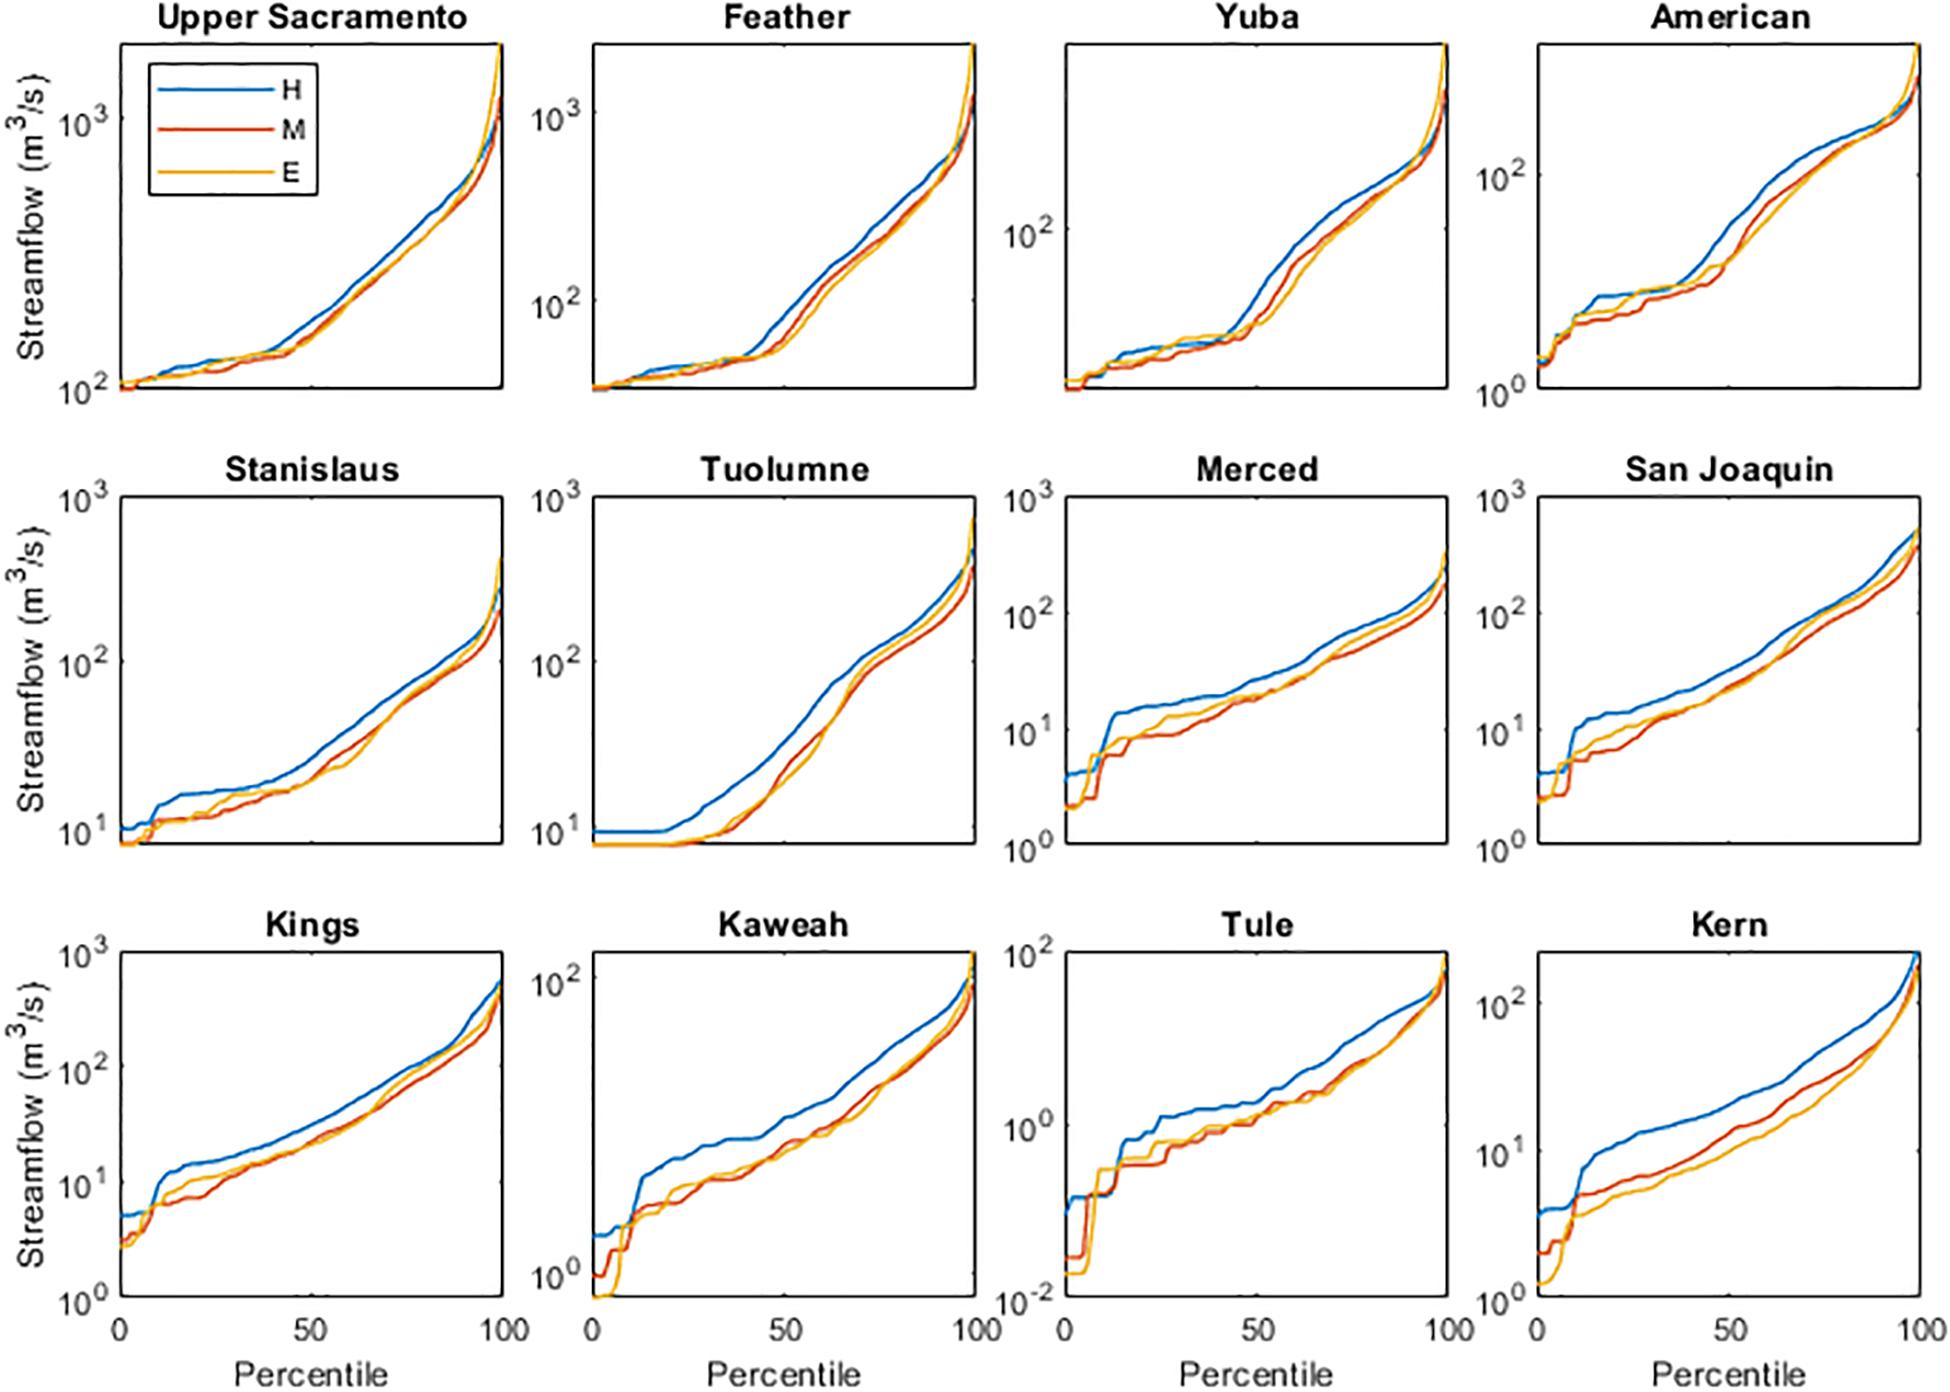
Figure 10. Daily streamflow values at each percentile for 12 Sierra Nevada basins for the historic (blue), mid-century (orange), and end-century (yellow) periods.
We also consider how the contribution of extreme events to total precipitation and runoff may change throughout the 21st century. We first select all days with non-zero precipitation or runoff for each Sierra Nevada basin. By accumulating precipitation/runoff by percentile (i.e., summing all precipitation values in the 1st–10th percentile, 11th–20th percentile, etc.), we compare the amount of percentile-binned precipitation or runoff to the decadal total. Though an annual analysis would also be informative, it would not consider the most extreme events that occur only a handful of times per decade. Even on a decadal time scale, we see that the events in the highest percentile have the largest contribution to total precipitation (Figure 11) and runoff (Figure 12) for each basin. Though changes by end-century are small for precipitation, extreme runoff events by 2091–2100 will have a larger contribution to total runoff; for example, in the Yuba basin, the contribution of >90th percentile events is projected to increase from 41 to 58%. Increases to percent contribution are largest in the northern basins: the Upper Sacramento, Feather, Yuba, American, and Stanislaus are all projected to have increases larger than ten percentage points.
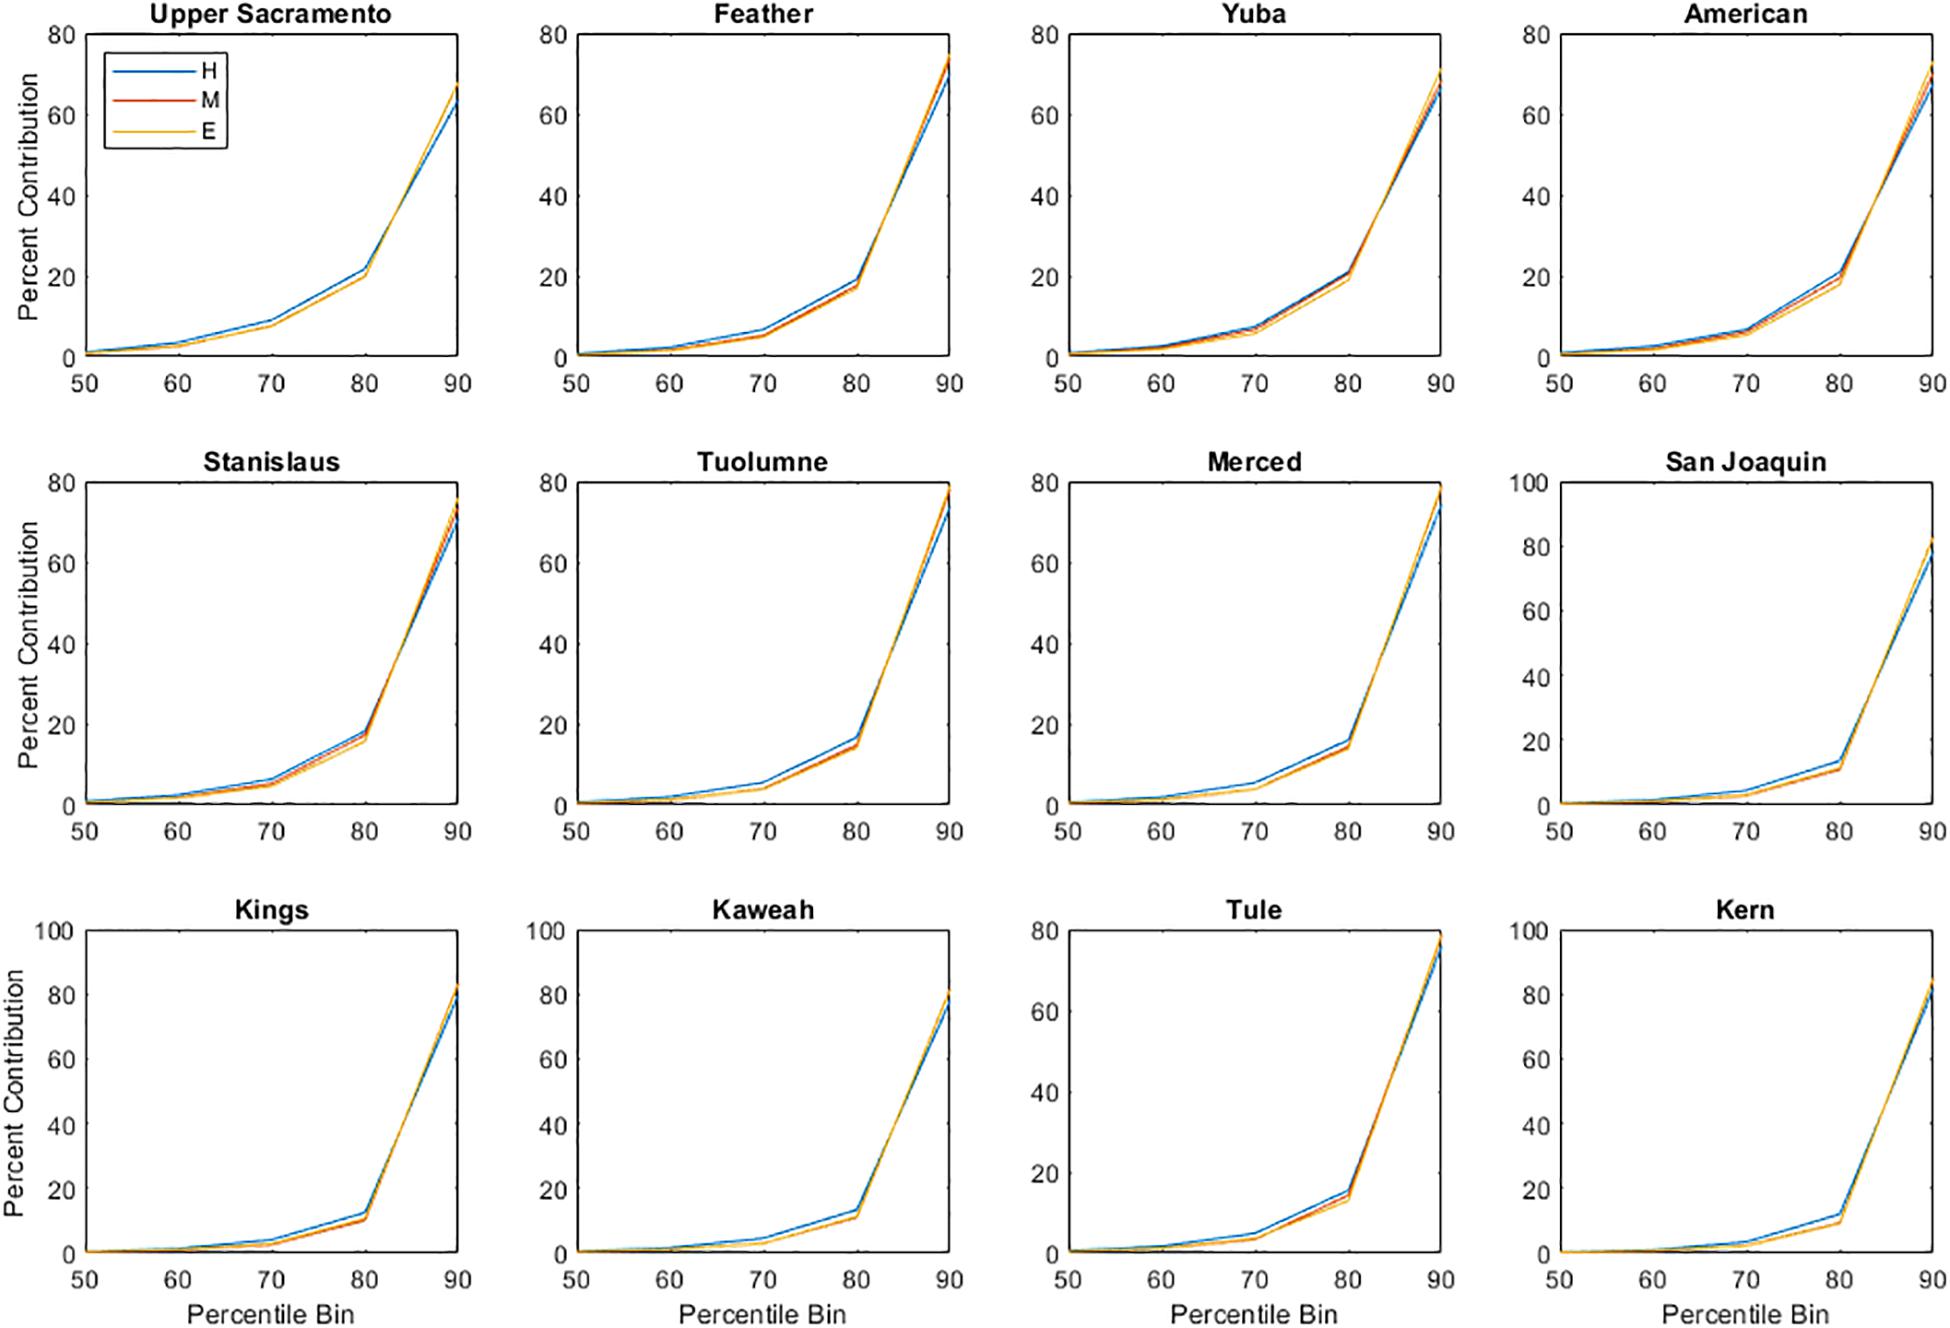
Figure 11. Percent contribution of precipitation within each percentile bin to total precipitation, accumulated across each decade, for each Sierra Nevada basin. Percentile bins <50th are not shown due to their small contribution to total precipitation. Basins are sorted from north (Upper Sacramento) to south (Kern).
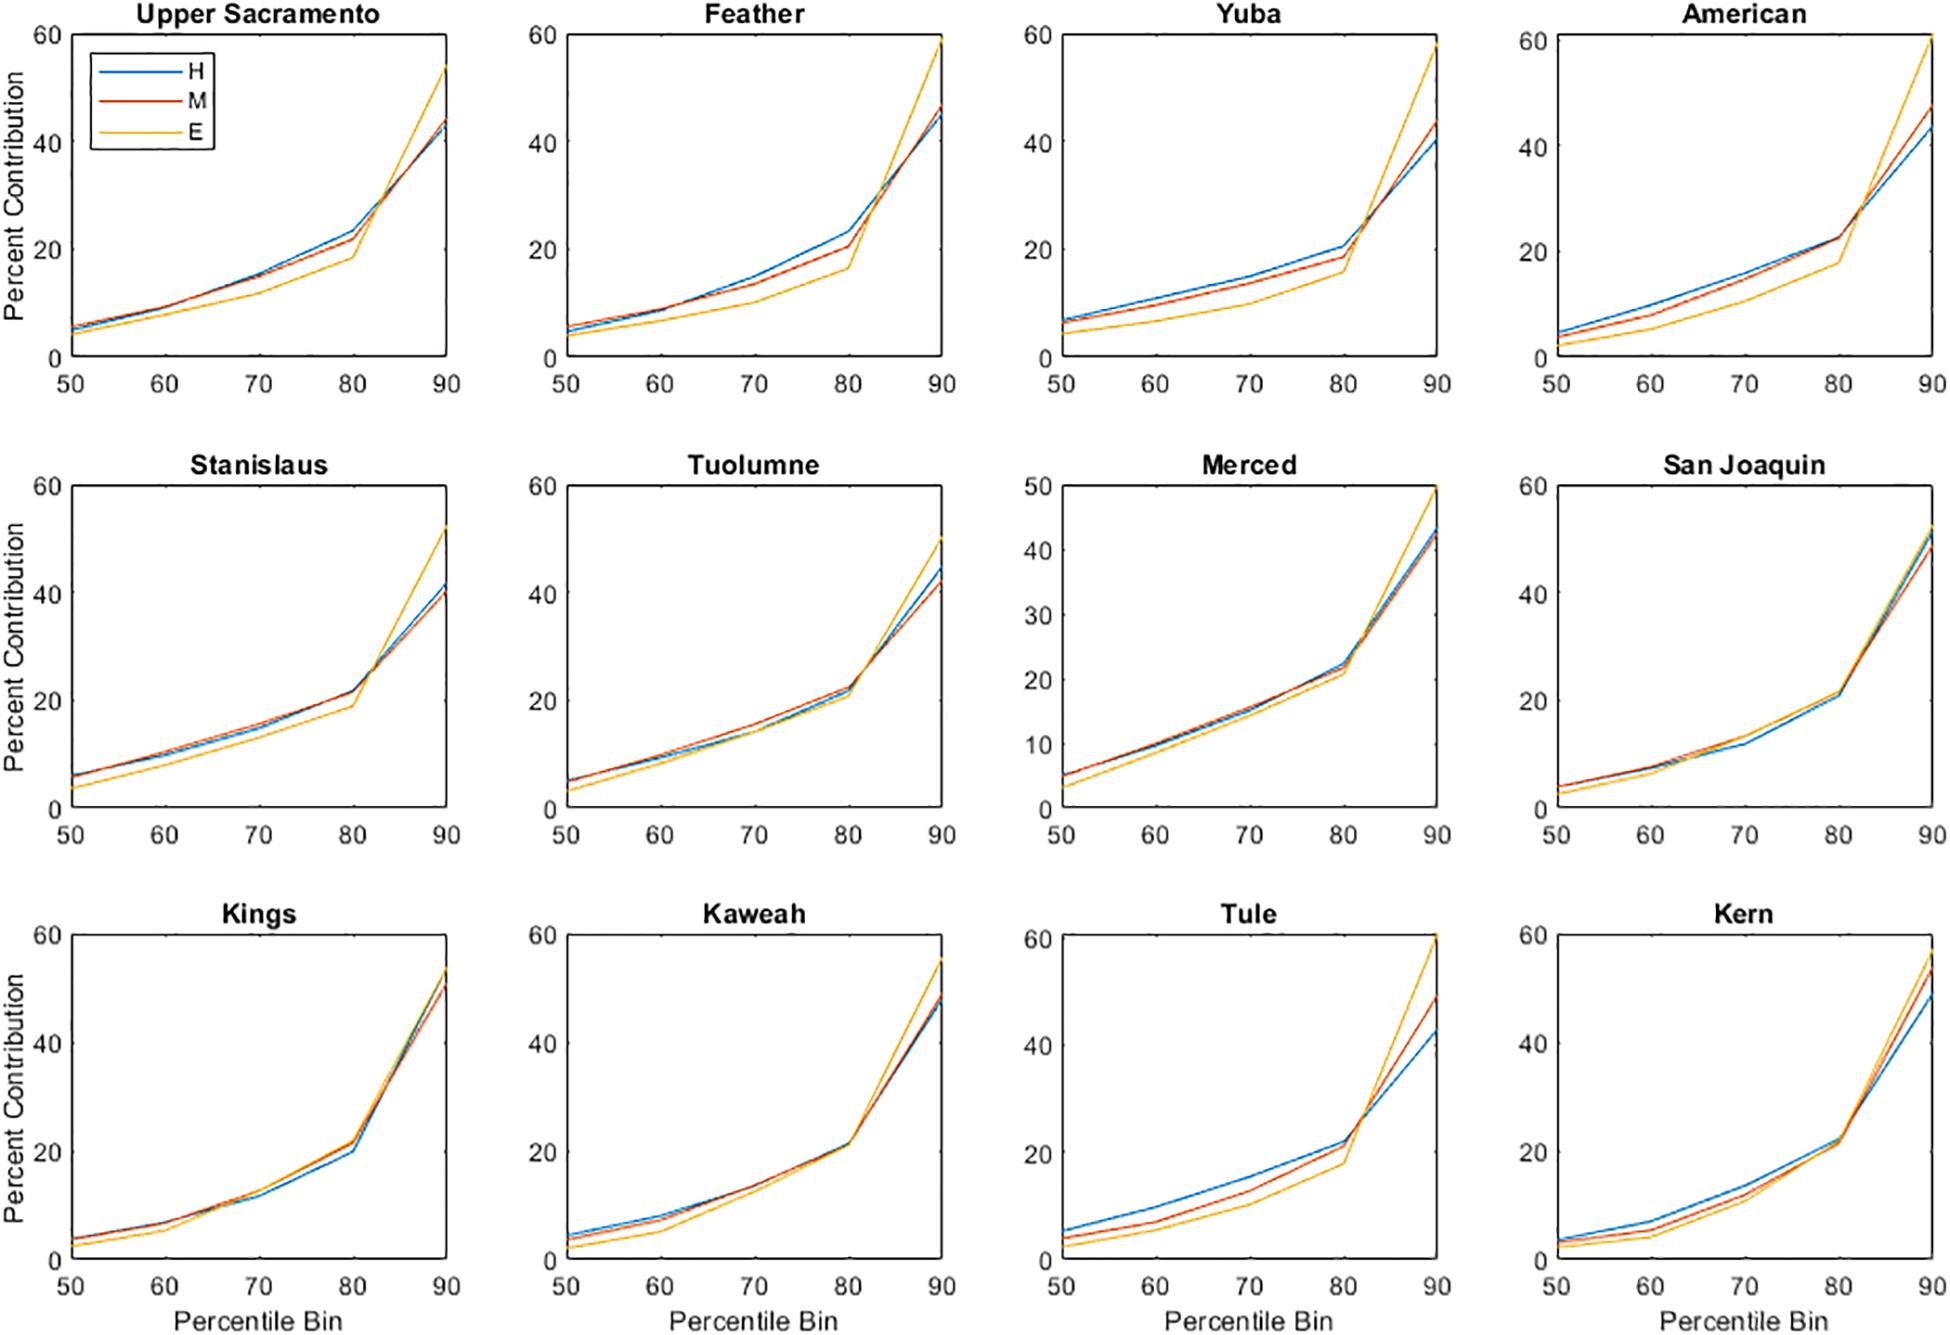
Figure 12. Percent contribution of runoff within each percentile bin to total runoff, accumulated across each decade, for each Sierra Nevada basin. Percentile bins <50th are not shown due to their small contribution to total runoff. Basins are sorted from north (Upper Sacramento) to south (Kern).
As all Sierra Nevada basins are projected to have statistically significant changes to extreme runoff, we can develop hypotheses regarding contributors to changes in high magnitude runoff events. Since precipitation and runoff are more coupled over small basins such as these, we consider the relationship between extreme runoff and extreme precipitation. By comparing all days with precipitation or runoff greater than the 99th percentile (37 days per decade), we see that for 8 of the 12 basins, at least one-third of the days with extreme runoff coincide with an extreme precipitation days (Table 4), suggesting it is the intense precipitation driving the runoff in those cases. By end-century, most basins have at least one-half of extreme runoff days coinciding with days of extreme precipitation. To allow for a lag between precipitation and runoff, we consider whether days with extreme runoff occur within 5 days of an extreme precipitation event. For most basins, and particularly those in the northern Sierra Nevada, we see increases in the number of extreme runoff days that coincide with intense precipitation. Increases in time coincidence may be due to a shift from snowfall, which is not directly tied to same-day or same-week runoff, to rainfall, which is. To consider seasonality of extreme events, we compare timing of all 37 extreme runoff and precipitation events for each Sierra Nevada basin over the historic and end-century period (Figure 13). We also compare the average timing of the snowmelt season (colored bars in Figure 13A). In the southern basins, historic runoff events coincide with the melt season, suggesting that historic extreme streamflow is often due to snowmelt events. Alternatively, by end-century, many of the extreme runoff events occur prior to the snowmelt season, suggesting these high-magnitude events may be due to precipitation, likely as rain.
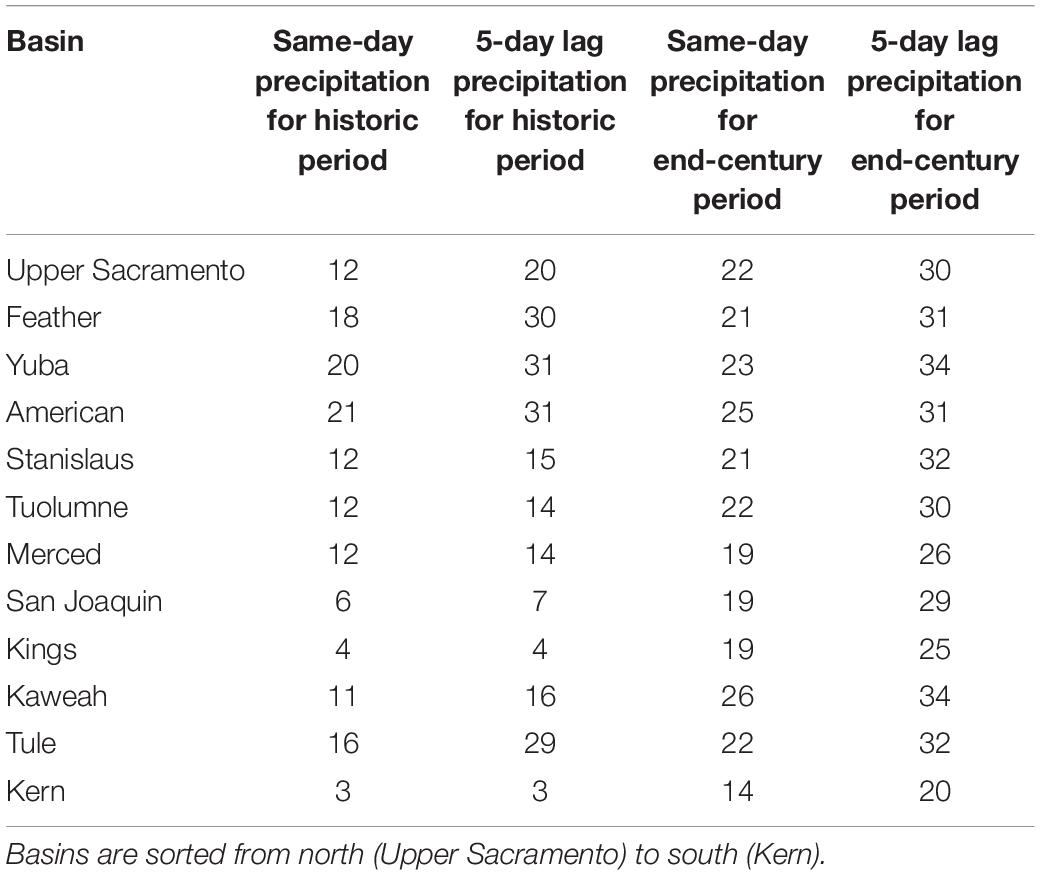
Table 4. Number of extreme runoff events (at or above the 99th percentile; maximum of 37) that coincide with an extreme precipitation event for both same-day precipitation and a lag time of up to 5 days.
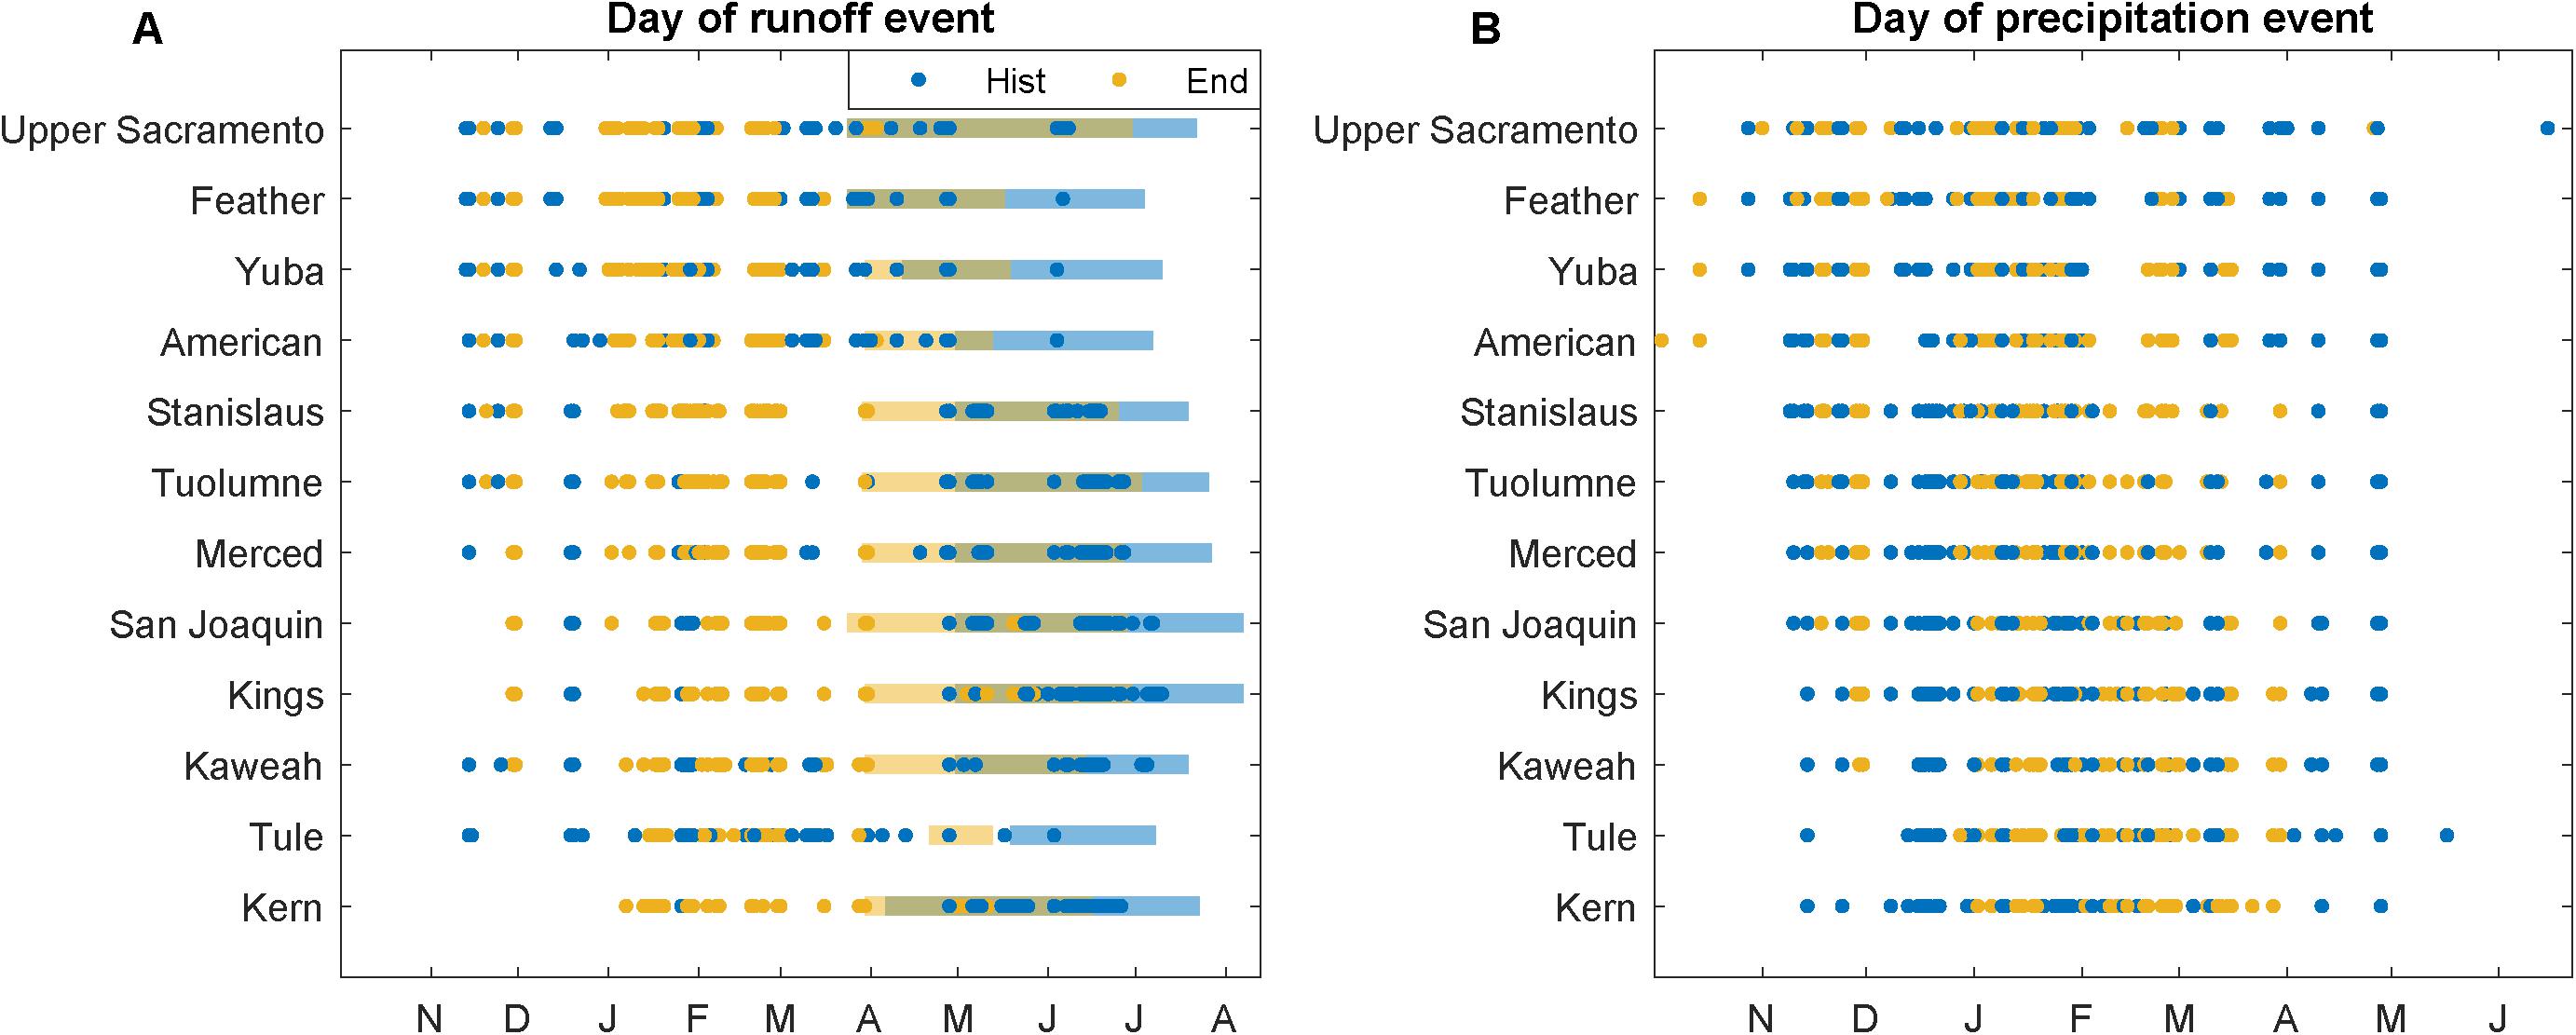
Figure 13. Timing of extreme (A) runoff and (B) precipitation events for each Sierra Nevada basin for the historic and end-century periods. Events at or above the 99th percentile are shown, for a total of 37 events. In (A), colored bars indicate the average snowmelt season over each decade.
Despite the increase in time coincidence in extreme events when we account for a lag between precipitation and runoff, when we evaluate precipitation totals, we see less of a relationship between runoff magnitude and antecedent precipitation conditions. That is, we compare the correlation between extreme runoff and same-day precipitation versus the precipitation accumulated over 5 days prior to the day of extreme runoff (Table 5). In the historic period, all basins except the Kern have stronger correlations for same-day runoff and precipitation. In the Kern, antecedent precipitation amounts resulted in a larger R2. In the end century, only runoff in the American basin has a stronger correlation with antecedent precipitation conditions. This result suggests that for most Sierra Nevada basins, large precipitation events lead to high magnitude runoff, often with little lag time. Projected end-century changes are not large, with increases to R2 values only in the northern basins and the Kern to the south.

Table 5. Coefficient of determination for relationship between extreme runoff (at or above the 99th percentile) and precipitation, both for same-day precipitation and accumulated precipitation for 5 days prior to the extreme runoff event.
Discussion and Conclusion
We consider estimates of future hydroclimatic variability for the western United States and southwestern Canada and the effects of climate change on extreme events. That is, we compare how the 99th percentile of daily precipitation and runoff may change throughout the 21st century. Though we are most interested in changes from the historical decade to future decades, it is important to check whether WRF is performing as expected. Therefore, we first confirm whether WRF produces reasonable estimates of precipitation and streamflow. Much work has been done to compare WRF-simulated precipitation to both in situ and gridded datasets (Caldwell et al., 2009; Leung and Qian, 2009; Qian et al., 2010; Gutmann et al., 2012; Cardoso et al., 2013; Warrach-Sagi et al., 2013), and the consensus is that WRF estimates are reasonably skilled at capturing realistic precipitation patterns and magnitudes (Hughes et al., 2017). Recent work suggests that atmospheric models such as WRF provide better estimates of precipitation in mountainous regions than precipitation gauge networks (Lundquist et al., 2019); known errors in observational networks pose major challenges to validating climate simulations. Therefore, we do not aim to evaluate WRF-simulated precipitation in this work and instead focus on precipitation changes throughout the 21st century. For streamflow, though, less work has been done to evaluate whether WRF simulations are reasonable.
Here we evaluate the performance of WRF streamflow by comparing to estimates of FNF for basins in the Sierra Nevada (Figure 2). Since GCMs like CCSM4 are not constrained by observations, we do not expect CCSM4-forced WRF simulations to match FNF perfectly (Taylor et al., 2012). A below-average year in the historic record may not be a below-average year in CCSM4. However, by comparing streamflow magnitudes at each percentile (Figure 2), we can determine whether the distribution of streamflow values is similar between WRF and FNF. At the highest values of daily streamflow, WRF estimates are almost always larger than FNF. Only the American basin has larger values for FNF at the highest percentiles. Streamflow estimates for the Tule basin are similar between the two datasets. While it is apparent that WRF overestimates the largest flow days when compared to FNF, that does not preclude the use of WRF-downscaled streamflow when projecting future changes. We can assume that historic, mid-century, and end-century estimates of WRF streamflow are all likely biased high for the largest events. Since we are interested in changes between decades, the potential WRF bias does not affect our analysis. However, future work should aim to improve the performance of WRF for high flow events.
Across the full model domain, there is a dipole pattern in precipitation change (Figure 3), where annual precipitation is projected to increases in the Pacific Northwest, along the California coast, and in southwest Canada, while decreases are projected in the desert southwest and toward the Great Plains of the United States. The spatial pattern of precipitation changes is similar to that reported in other studies (Gutzler and Robbins, 2011; Kumar et al., 2013; Baker and Huang, 2014). Increased precipitation in the Pacific Northwest and decreased precipitation in the southwest United States is consistent with a projected poleward shift of midlatitude storm tracks (Yin, 2005; Salathé, 2006; Mbengue and Schneider, 2013). For annual precipitation, the Columbia and Upper Missouri/Yellowstone have end-century increases of 10.1 and 2.9%, respectively (Table 1). Both the Lower (−17.2%) and Upper Colorado (−11.6%) have decreased average annual precipitation in the end-century WRF simulations. By partitioning rainfall and snowfall, we can understand how the different phases of precipitation will change. As expected in a warming climate, all four watersheds will have decreased total snowfall; the Lower Colorado (−65.3%) has the largest decrease, though it is the watershed with the smallest amount of historical snowfall. In the historic period, the Columbia receives the most annual snowfall, and it is expected to decline by 32.4% by the last decade of the 21st century. Alternatively, all watersheds except the Lower Colorado are projected to have increases in rainfall. The Columbia has the largest increase at 31.7%; despite the large decrease in snowfall, the large increase in rainfall leads to a positive change in total precipitation. The decrease in Upper Colorado total precipitation is driven by the 29.1% decrease in snowfall.
Comparing end-century precipitation to historical simulations, all four western watersheds have projected increases in the magnitude of daily extreme events for the 99th percentile (Table 2). In the Columbia watershed, the 99th percentile of daily precipitation, or an event that occurs roughly three times a year, is projected to increase from 24.5 to 27.5 mm over the full domain (a volume increase of 2.0 km3). Such events may increase the risk of flooding, depending on the timing of the rainfall. If soils are already saturated or if a rain-on-snow event occurs, likelihood of flooding increases. Other work projects increased flood risk by the end of the 21st century for the Columbia watershed (Rosenberg et al., 2010; Salathé et al., 2014; Tohver et al., 2014). While end-century changes aren’t projected to be as large for the other three watersheds (Table 2), increases in heavy precipitation events could cause localized flooding.
While precipitation changes are mostly uniform for the four western watersheds, daily runoff changes have more variability. For the 99th percentile, streamflow magnitude is expected to decrease for all but the Lower Colorado basin (Table 2). The Upper Colorado is projected to have the largest change, with decreases of 31.4% for the 99th percentile of daily runoff. Additionally, the annual total runoff volume for the Upper Colorado is estimated to decrease from 31.4 to 21.4 km3, a decrease of nearly 32% (Table 1). Therefore, not only are extreme events expected to decrease in magnitude, likely decreasing the risk of flash flooding, annuals flows will decrease, following with previously published work on potential drying of the Colorado River (Christensen and Lettenmaier, 2006; Rajagopalan et al., 2009; Dawadi and Ahmad, 2012; Ficklin et al., 2013; Livneh et al., 2017; Udall and Overpeck, 2017); when decreased flows are coupled with decreased annual precipitation, the likelihood for drought or not meeting water demands increases.
In contrast, the Lower Colorado basin is projected to have an increase of 2.7% for the 99th percentile of daily runoff, though, annual runoff is expected to decrease by 32.2%. Increases in extreme event magnitude and decreases in annual total suggest that a large fraction of yearly streamflow may come from only a few events. For some years in the Colorado River basin, present-day flows are less than the allocated total (Christensen et al., 2004). Projected decreases in annual flow by end-century may strain an already-stressed system.
All Sierra Nevada basins examined here are projected to have decreased snowfall and snow accumulation (Figure 9) and decreased daily streamflow at most percentiles (Figure 10). As a warm maritime mountain range that receives most of its snow accumulation from a handful of storms (Margulis et al., 2016), it is not surprising that the majority of the basins are expected to have less snowfall and snow accumulation by end-century. With present-day conditions, annual spring snowmelt coincides with higher water demand. If streamflow begins to peak earlier in the spring, as reported in other studies (Dettinger et al., 2004; Stewart et al., 2004; Maurer et al., 2007; Schwartz et al., 2017) and as we suggest here (Figure 8), local management strategies will need to adapt (Sterle et al., 2019). Operational reservoir managers in the Sierra Nevada must balance capturing runoff for societal use with managing flood risk (Dettinger et al., 2011). Should the magnitude or timing of high flow events change, as we show for all 12 Sierra Nevada basins (Figure 13), reservoirs may need to be held at lower capacity or run the risk of mismanaging a potential flood event.
Unlike the larger western watersheds, which integrate increases and decreases to runoff and precipitation across very large drainage areas, projected changes to extreme precipitation and runoff are more closely coupled in the smaller Sierra Nevada basins (Table 3). All 12 basins are projected to have increases in magnitude of extreme precipitation (statistically significant for the northern half of the mountain range), and most Sierra Nevada basins have increased magnitude of extreme runoff events (all statistically significant). In the northern and central basins, projected increases to high flow events often exceed a 100% increase (Table 3). Southern basins, particularly the Kings and Kern, are projected to have smaller changes in extreme runoff or even decreases. Decreases to annual streamflow (Figures 3F, 11) and increases in extreme runoff (Table 3) suggest that an increased proportion of Sierra Nevada streamflow will occur during extreme high flow events. We see this behavior when considering how the contribution of each runoff percentile to total runoff may change by end-century (Figure 12); for all Sierra Nevada basins, events at the >90th percentile will make up a larger proportion of total runoff. Similar results have been reported for an increased proportion of annual precipitation that occurs during heavy rainfall events (New et al., 2001; Groisman et al., 2005; Wuebbles et al., 2014). Though the most extreme events may only occur a few times a year, a doubling of streamflow, as projected for the American, Stanislaus, and Tuolumne basins with increases >100%, will require careful flood control management. The Feather basin, which includes the Oroville Dam, is projected to have increases of 114% for 99th percentile runoff events, which occur roughly three times a year; with increased high flows, flood crises such as the 2017 Oroville event may become more frequent by end-century.
For the Sierra Nevada basins, all are projected to have increases in the contribution of high magnitude precipitation to extreme runoff (Table 4). In the southern basins, increases are particularly large: where only 8 and 11% of extreme runoff events coincided with extreme precipitation in the historic simulations for the Kern and Kings basins, respectively, by the end century, 38 and 51% of the >99th percentile runoff events are projected to coincide with extreme precipitation. We suggest a shift from snowmelt to rainfall as the dominant cause of extreme runoff events, particularly in the southern Sierra Nevada where, by end-century, most high-magnitude runoff events occur prior to the spring snowmelt period (Figure 13A). If precipitation magnitude does increase for extreme events as a result of climate change, as recent literature suggests (Dominguez et al., 2012; Scoccimarro et al., 2013; Wuebbles et al., 2014), it follows that extreme runoff events and the risk of flooding will also increase.
A major limitation to this study is the short time periods available for comparing historical and future climate. Here we consider decadal snapshots of western United States climate throughout the 20th and 21st centuries; longer, perhaps 30+ years of simulations are necessary for assessing climate variability. However, due to the high computational cost of WRF, multi-decade, high-resolution simulations are not possible. Previous studies that use WRF to project climate change impacts are also limited by computational cost, with most simulations running for ∼10 years (Liu et al., 2017; Musselman et al., 2017; Schwartz et al., 2017; Musselman et al., 2018). Decade-scale simulations have also been used to evaluate changes to extreme events from WRF (Prein et al., 2017), and Gao et al. (2012) used a similar approach to ours in estimating changes between a historical and future period, though they compare over a 3 year period. Through advances in computational resources, WRF is an increasingly useful tool in climate projections, though limitations still exist. The computational cost of an RCM such as WRF is one of the tradeoffs between RCMs and GCMs; as described in the introduction, RCMs may not provide as much data as a GCM, but they allow for higher resolution information over regions that often have high biases in GCMs (van der Wiel et al., 2016).
Recent literature suggests a large ensemble approach is likely the best method for projecting future climate and changes to extreme events (Kay et al., 2015; van der Wiel et al., 2019). As computational resources continue to improve, a large ensemble of WRF simulations, similar to the Community Earth System Model Large Ensemble Project (Kay et al., 2015), may be possible. Until then, long-term, high-resolution climate projections are likely only possible through tools like the Intermediate Complexity Atmospheric Research Model (ICAR; Gutmann et al., 2016) or hybrid dynamical-statistical downscaling (Walton et al., 2015; Sun et al., 2016; Schwartz et al., 2017).
Results presented here are one representation of future hydroclimate conditions from a single downscaled GCM. Though the Bruyère et al. (2013) method only bias corrects a single GCM at a time, it does not make any assumptions about climate stationarity, like the PGW method. Future work, however, should prioritize the downscaling of multiple bias corrected GCMs to create an ensemble of possible scenarios, whether through dynamical downscaling or less computationally expensive tools like ICAR. Regardless of the method, downscaling GCMs to higher spatial resolution will improve understanding of not only mean hydroclimate changes but also of extreme events, whether heat waves, droughts, or, as we examine here, heavy precipitation and streamflow that can result in flooding. Since many river networks in western United States and Canada are managed systems, regional-scale predictions of future hydroclimate are crucial for ensuring infrastructure is prepared for possible regime shifts in extreme event intensity.
Data Availability Statement
The datasets generated for this study are available on request to the corresponding author.
Author Contributions
MW and TP analyzed the data and wrote the manuscript. MW performed the model simulations.
Funding
This research was funded by NSF Innovations at the Nexus of Food, Energy and Water Systems (INFEWS) grant CNS-1639268 (PI G. Characklis, UNC).
Conflict of Interest
The authors declare that the research was conducted in the absence of any commercial or financial relationships that could be construed as a potential conflict of interest.
Acknowledgments
We thank Sarah B. Kapnick for helpful discussions that greatly improved the manuscript. We also acknowledge the two reviewers for critically reading the manuscript and suggesting improvements. WRF simulations used the Extreme Science and Engineering Discovery Environment (XSEDE) Stampede2 at the Texas Advanced Computing Center, The University of Texas at Austin, through allocation TG-ATM19008.
References
Baker, N. C., and Huang, H. P. (2014). A comparative study of precipitation and evaporation between CMIP3 and CMIP5 climate model ensembles in semiarid regions. J. Clim. 27, 3731–3749. doi: 10.1175/jcli-d-13-00398.1
Barlage, M., Tewari, M., Chen, F., Miguez-Macho, G., Yang, Z. L., and Niu, G. Y. (2015). The effect of groundwater interaction in North American regional climate simulations with WRF/Noah-MP. Clim. Change 129, 485–498. doi: 10.1007/s10584-014-1308-8
Bruyère, C. L., Done, J. M., Holland, G. J., and Fredrick, S. (2013). Bias corrections of global models for regional climate simulations of high-impact weather. Clim. Dyn. 43, 1847–1856. doi: 10.1007/s00382-013-2011-6
Caldwell, P., Chin, H. N. S., Bader, D. C., and Bala, G. (2009). Evaluation of a WRF dynamical downscaling simulation over California. Clim. Change 95, 499–521. doi: 10.1007/s10584-009-9583-5
Cardoso, R. M., Soares, P. M. M., Miranda, P. M. A., and Belo-Pereira, M. (2013). WRF high resolution simulation of Iberian mean and extreme precipitation climate. Int. J. Climatol. 33, 2591–2608. doi: 10.1002/joc.3616
Cayan, D. R., Maurer, E. P., Dettinger, M. D., Tyree, M., and Hayhoe, K. (2008). Climate change scenarios for the California region. Clim. Change 87, S21–S42. doi: 10.1007/s10584-007-9377-6
Christensen, J. H., Boberg, F., Christensen, O. B., and Lucas-Picher, P. (2008). On the need for bias correction of regional climate change projections of temperature and precipitation. Geophys. Res. Lett. 35:L20709. doi: 10.1029/2008gl035694
Christensen, N., and Lettenmaier, D. P. (2006). A multimodel ensemble approach to assessment of climate change impacts on the hydrology and water resources of the Colorado River Basin. Hydrol. Earth Syst. Sci. Discuss. 3, 3727–3770. doi: 10.5194/hessd-3-3727-2006
Christensen, N. S., Wood, A. W., Voisin, N., Lettenmaier, D. P., and Palmer, R. N. (2004). The effects of climate change on the hydrology and water resources of the Colorado River basin. Clim. Change 62, 337–363. doi: 10.1023/B:CLIM.0000013684.13621.1f
Cosgrove, B. A., Lohmann, D., Mitchell, K. E., Houser, P. R., Wood, E. F., Schaake, J. C., et al. (2003). Land surface model spin-up behavior in the North American Land Data Assimilation System (NLDAS). J. Geophys. Res. Atmos. 108:8845. doi: 10.1029/2002JD003316
Dawadi, S., and Ahmad, S. (2012). Changing climatic conditions in the Colorado River Basin: implications for water resources management. J. Hydrol. 430, 127–141. doi: 10.1016/j.jhydrol.2012.02.010
Dee, D. P., Uppala, S. M., Simmons, A. J., Berrisford, P., Poli, P., Kobayashi, S., et al. (2011). The ERA-Interim reanalysis: configuration and performance of the data assimilation system. Q. J. R. Meteorol. Soc. 137, 553–597. doi: 10.1002/qj.828
Dettinger, M. D., Cayan, D. R., Meyer, M. K., and Jeton, A. E. (2004). Simulated hydrologic responses to climate variations and change in the Merced, Carson, and American River basins, Sierra Nevada, California, 1900–2099. Clim. Change 62, 283–317. doi: 10.1023/b:clim.0000013683.13346.4f
Dettinger, M. D., Ralph, F. M., Das, T., Neiman, P. J., and Cayan, D. R. (2011). Atmospheric rivers, floods and the water resources of California. Water 3, 445–478. doi: 10.3390/w3020445
Dominguez, F., Rivera, E., Lettenmaier, D. P., and Castro, C. L. (2012). Changes in winter precipitation extremes for the western United States under a warmer climate as simulated by regional climate models. Geophys. Res. Lett. 39:L05803.
Donat, M. G., Alexander, L. V., Yang, H., Durre, I., Vose, R., and Caesar, J. (2013). Global land-based datasets for monitoring climatic extremes. Bull. Am. Meteorol. Soc. 94, 997–1006. doi: 10.1175/bams-d-12-00109.1
Dudhia, J. (1989). Numerical study of convection observed during the winter monsoon experiment using a mesoscale two-dimensional model. J. Atmos. Sci. 46, 3077–3107. doi: 10.1175/1520-04691989046<3077:Nsocod>2.0.Co;2
Ehret, U., Zehe, E., Wulfmeyer, V., Warrach-Sagi, K., and Liebert, J. (2012). HESS opinions” Should we apply bias correction to global and regional climate model data?”. Hydrol. Earth Syst. Sci. 16, 3391–3404. doi: 10.5194/hess-16-3391-2012
Erler, A. R., and Peltier, W. R. (2016). Projected changes in precipitation extremes for western Canada based on high-resolution regional climate simulations. J. Clim. 29, 8841–8863. doi: 10.1175/jcli-d-15-0530.1
Ficklin, D. L., Stewart, I. T., and Maurer, E. P. (2013). Climate change impacts on streamflow and subbasin-scale hydrology in the Upper Colorado River Basin. PLoS One 8:e71297. doi: 10.1371/journal.pone.0071297
Gao, Y., Fu, J. S., Drake, J. B., Liu, Y., and Lamarque, J. F. (2012). Projected changes of extreme weather events in the eastern United States based on a high resolution climate modeling system. Environ. Res. Lett. 7:044025. doi: 10.1088/1748-9326/7/4/044025
Gent, P. R., Danabasoglu, G., Donner, L. J., Holland, M. M., Hunke, E. C., Jayne, S. R., et al. (2011). The community climate system model version 4. J. Clim. 24, 4973–4991. doi: 10.1175/2011jcli4083.1
Groisman, P. Y., Knight, R. W., Easterling, D. R., Karl, T. R., Hegerl, G. C., and Razuvaev, V. N. (2005). Trends in intense precipitation in the climate record. J. Clim. 18, 1326–1350. doi: 10.1371/journal.pone.0123793
Gutmann, E., Barstad, I., Clark, M., Arnold, J., and Rasmussen, R. (2016). The intermediate complexity atmospheric research model (ICAR). J. Hydrometeorol. 17, 957–973. doi: 10.1175/JHM-D-15-0155.1
Gutmann, E. D., Rasmussen, R. M., Liu, C. H., Ikeda, K., Bruyere, C. L., Done, J. M., et al. (2018). Changes in hurricanes from a 13-Yr convection-permitting pseudo-global warming simulation. J. Clim. 31, 3643–3657. doi: 10.1175/Jcli-D-17-0391.1
Gutmann, E. D., Rasmussen, R. M., Liu, C. H., Ikeda, K., Gochis, D. J., Clark, M. P., et al. (2012). A comparison of statistical and dynamical downscaling of winter precipitation over complex terrain. J. Clim. 25, 262–281. doi: 10.1175/2011jcli4109.1
Gutzler, D. S., and Robbins, T. O. (2011). Climate variability and projected change in the western United States: regional downscaling and drought statistics. Clim. Dyn. 37, 835–849. doi: 10.1007/s00382-010-0838-7
Hara, M., Yoshikane, T., Kawase, H., and Kimura, F. (2008). Estimation of the impact of global warming on snow depth in Japan by the pseudo-global-warming method. Hydrol. Res. Lett. 2, 61–64. doi: 10.3178/hrl.2.61
Harder, P., Pomeroy, J. W., and Westbrook, C. J. (2015). Hydrological resilience of a Canadian Rockies headwaters basin subject to changing climate, extreme weather, and forest management. Hydrol. Process. 29, 3905–3924. doi: 10.1002/hyp.10596
Hollins, L., Eisenberg, D., and Seager, T. (2018). Risk and resilience at the Oroville Dam. Infrastructures 3:49. doi: 10.3390/infrastructures3040049
Hong, S. Y., Noh, Y., and Dudhia, J. (2006). A new vertical diffusion package with an explicit treatment of entrainment processes. Monthly Weather Rev. 134, 2318–2341. doi: 10.1175/Mwr3199.1
Huang, G. (2016). Estimates of Natural and Unimpaired Flows for the Central Valley of California: Water Years 1922–2014. Sacramento, CA: California Department of Water Resources.
Hughes, M., Lundquist, J. D., and Henn, B. (2017). Dynamical downscaling improves upon gridded precipitation products in the Sierra Nevada, California. Clim. Dyn. doi: 10.1007/s00382-017-3631-z
Ikeda, K., Rasmussen, R., Liu, C. H., Gochis, D., Yates, D., Chen, F., et al. (2010). Simulation of seasonal snowfall over Colorado. Atmos. Res. 97, 462–477. doi: 10.1016/j.atmosres.2010.04.010
Kain, J. S. (2004). The Kain-Fritsch convective parameterization: an update. J. Appl. Meteorol. 43, 170–181. doi: 10.1175/1520-04502004043<0170:Tkcpau>2.0.Co;2
Kain, J. S., and Fritsch, J. M. (1990). A one-dimensional entraining detraining plume model and its application in convective parameterization. J. Atmos. Sci. 47, 2784–2802. doi: 10.1175/1520-04691990047<2784:Aodepm>2.0.Co;2
Kain, J. S., and Fritsch, J. M. (1993). “Convective parameterization for mesoscale models: the Kain-Fritsch scheme,” in The Representation of Cumulus Convection in Numerical Models, eds K. A. Emanuel, and D. J. Raymond, (Boston, MA: American Meteorological Society), 165–170. doi: 10.1007/978-1-935704-13-3_16
Kawase, H., Yoshikane, T., Hara, M., Kimura, F., Yasunari, T., Ailikun, B., et al. (2009). Intermodel variability of future changes in the Baiu rainband estimated by the pseudo global warming downscaling method. J. Geophys. Res. Atmos. 114:D241. doi: 10.1029/2009jd011803
Kay, J. E., Deser, C., Phillips, A., Mai, A., Hannay, C., Strand, G., et al. (2015). The Community Earth System Model (CESM) large ensemble project: a community resource for studying climate change in the presence of internal climate variability. Bull. Am. Meteorol. Soc. 96, 1333–1349. doi: 10.1175/bams-d-13-00255.1
Knutson, T. R., Zeng, F. R., and Wittenberg, A. T. (2013). Multimodel assessment of regional surface temperature trends: CMIP3 and CMIP5 twentieth-century simulations. J. Clim. 26, 8709–8743. doi: 10.1175/Jcli-D-12-00567.1
Knutti, R., and Sedlacek, J. (2013). Robustness and uncertainties in the new CMIP5 climate model projections. Nat. Clim. Change 3, 369–373. doi: 10.1038/Nclimate1716
Kumar, S., Merwade, V., Kinter, J. L. III, and Niyogi, D. (2013). Evaluation of temperature and precipitation trends and long-term persistence in CMIP5 twentieth-century climate simulations. J. Clim. 26, 4168–4185. doi: 10.1175/jcli-d-12-00259.1
Letcher, T. W., and Minder, J. R. (2018). The simulated impact of the snow albedo feedback on the large-scale mountain-plain circulation east of the Colorado rocky mountains. J. Atmos. Sci. 75, 755–774. doi: 10.1175/Jas-D-17-0166.1
Leung, L. R., and Qian, Y. (2009). Atmospheric rivers induced heavy precipitation and flooding in the western U.S. simulated by the WRF regional climate model. Geophys. Res. Lett. 36:L03820. doi: 10.1029/2008gl036445
Liu, C. H., Ikeda, K., Rasmussen, R., Barlage, M., Newman, A. J., Prein, A. F., et al. (2017). Continental-scale convection-permitting modeling of the current and future climate of North America. Clim. Dyn. 49, 71–95. doi: 10.1007/s00382-016-3327-9
Livneh, B., Badger, A. M., and Lukas, J. J. (2017). “Assessing the robustness of snow-based drought indicators in the Upper Colorado River basin under future climate change,” Paper Presented at the World Environmental and Water Resources Congress 2017, Reston, VA.
Lundquist, J., Hughes, M., Gutmann, E., and Kapnick, S. (2019). Our skill in modeling mountain rain and snow is bypassing the skill of our observational networks. Bull. Am. Meteorol. Soc. doi: 10.1175/BAMS-D-19-0001.1
Maraun, D. (2012). Nonstationarities of regional climate model biases in European seasonal mean temperature and precipitation sums. Geophys. Res. Lett. 39:L06706. doi: 10.1029/2012gl051210
Maraun, D., Wetterhall, F., Ireson, A. M., Chandler, R. E., Kendon, E. J., Widmann, M., et al. (2010). Precipitation downscaling under climate change: recent developments to bridge the gap between dynamical models and the end user. Rev. Geophys. 48, 1–34. doi: 10.1029/2009rg000314
Margulis, S. A., Cortes, G., Girotto, M., and Durand, M. (2016). A landsat-era sierra nevada snow reanalysis (1985-2015). J. Hydrometeorol. 17, 1203–1221. doi: 10.1175/Jhm-D-15-0177.1
Maurer, E. P., Stewart, I., Bonfils, C., Duffy, P. B., and Cayan, D. (2007). Detection, attribution, and sensitivity of trends toward earlier streamflow in the Sierra Nevada. J. Geophys. Res. Atmos. 112:12.
Mbengue, C., and Schneider, T. (2013). Storm track shifts under climate change: what can be learned from large-scale dry dynamics. J. Clim. 26, 9923–9930. doi: 10.1175/jcli-d-13-00404.1
Minder, J. R., Letcher, T. W., and Skiles, S. M. (2016). An evaluation of high-resolution regional climate model simulations of snow cover and albedo over the Rocky Mountains, with implications for the simulated snow-albedo feedback. J. Geophys. Res. Atmos. 121, 9069–9088. doi: 10.1002/2016jd024995
Mlawer, E. J., Taubman, S. J., Brown, P. D., Iacono, M. J., and Clough, S. A. (1997). Radiative transfer for inhomogeneous atmospheres: RRTM, a validated correlated-k model for the longwave. J. Geophys. Res. Atmos. 102, 16663–16682. doi: 10.1029/97jd00237
Monaghan, A. J., Steinhoff, D. F., Bruyere, C. L., and Yates, D. (2014). NCAR CESM Global Bias-Corrected CMIP5 Output to Support WRF/MPAS Research. Boulder, CO: Research Data Archive at the National Center for Atmospheric Research, Computational and Information Systems Laboratory. doi: 10.5065/D6DJ5CN4
Mote, P. W., and Salathe, E. P. (2010). Future climate in the Pacific Northwest. Clim. Change 102, 29–50. doi: 10.1007/s10584-010-9848-z
Musselman, K. N., Clark, M. P., Liu, C. H., Ikeda, K., and Rasmussen, R. (2017). Slower snowmelt in a warmer world. Nat. Clim. Change 7, 214–219. doi: 10.1038/Nclimate3225
Musselman, K. N., Lehner, F., Ikeda, K., Clark, M. P., Prein, A. F., Liu, C., et al. (2018). Projected increases and shifts in rain-on-snow flood risk over western North America. Nat. Clim. Change 8, 808–812. doi: 10.1038/s41558-018-0236-4
New, M., Todd, M., Hulme, M., and Jones, P. (2001). Precipitation measurements and trends in the twentieth century. Int. J. Climatol. 21, 1889–1922. doi: 10.1002/joc.680
Niu, G. Y., Yang, Z. L., Mitchell, K. E., Chen, F., Ek, M. B., Barlage, M., et al. (2011). The community Noah land surface model with multiparameterization options (Noah-MP): 1. Model description and evaluation with local-scale measurements. J. Geophys. Res. Atmos. 116:D12109. doi: 10.1029/2010jd015139
Pavelsky, T. M., Kapnick, S., and Hall, A. (2011). Accumulation and melt dynamics of snowpack from a multiresolution regional climate model in the central Sierra Nevada, California. J. Geophys. Res. Atmos. 116, 15–32. doi: 10.1029/2010jd015479
Peacock, S. (2012). Projected twenty-first-century changes in temperature, precipitation, and snow cover over North America in CCSM4. J. Clim. 25, 4405–4429. doi: 10.1175/Jcli-D-11-00214.1
Pontoppidan, M., Kolstad, E. W., Sobolowski, S., and King, M. P. (2018). Improving the reliability and added value of dynamical downscaling via correction of large-scale errors: a norwegian perspective. J. Geophys. Res. Atmos. 123, 11875–11888. doi: 10.1029/2018jd028372
Prein, A. F., Rasmussen, R. M., Ikeda, K., Liu, C., Clark, M. P., and Holland, G. J. (2017). The future intensification of hourly precipitation extremes. Nat. Clim. Change 7, 48–52. doi: 10.1038/nclimate3168
Qian, Y., Ghan, S. J., and Leung, L. R. (2010). Downscaling hydroclimatic changes over the Western US based on CAM subgrid scheme and WRF regional climate simulations. Int. J. Climatol. 30, 675–693. doi: 10.1002/joc.1928
Rajagopalan, B., Nowak, K., Prairie, J., Hoerling, M., Harding, B., Barsugli, J., et al. (2009). Water supply risk on the Colorado River: can management mitigate? Water Resour. Res. 45:W08201. doi: 10.1029/2008WR007652
Rasmussen, R., Liu, C. H., Ikeda, K., Gochis, D., Yates, D., Chen, F., et al. (2011). High-resolution coupled climate runoff simulations of seasonal snowfall over colorado: a process study of current and warmer climate. J. Clim. 24, 3015–3048. doi: 10.1175/2010jcli3985.1
Rosenberg, E. A., Keys, P. W., Booth, D. B., Hartley, D., Burkey, J., Steinemann, A. C., et al. (2010). Precipitation extremes and the impacts of climate change on stormwater infrastructure in Washington State. Clim. Change 102, 319–349. doi: 10.1007/s10584-010-9847-0
Russo, S., and Sterl, A. (2012). Global changes in seasonal means and extremes of precipitation from daily climate model data. J. Geophys. Res. Atmos. 117:D01108. doi: 10.1029/2011JD016260
Salathé, E. P. Jr. (2006). Influences of a shift in North Pacific storm tracks on western North American precipitation under global warming. Geophys. Res. Lett. 33:L19820. doi: 10.1029/2006GL026882
Salathé, E. P., Hamlet, A. F., Mass, C. F., Lee, S.-Y., Stumbaugh, M., and Steed, R. (2014). Estimates of twenty-first-century flood risk in the pacific northwest based on regional climate model simulations. J. Hydrometeorol. 15, 1881–1899. doi: 10.1175/jhm-d-13-0137.1
Schar, C., Frei, C., Luthi, D., and Davies, H. C. (1996). Surrogate climate-change scenarios for regional climate models. Geophys. Res. Lett. 23, 669–672. doi: 10.1029/96gl00265
Schwartz, M., Hall, A., Sun, F. P., Walton, D., and Berg, N. (2017). Significant and inevitable end-of-twenty-first-century advances in surface runoff timing in California’s Sierra Nevada. J. Hydrometeorol. 18, 3181–3197. doi: 10.1175/Jhm-D-16-0257.1
Scoccimarro, E., Gualdi, S., Bellucci, A., Zampieri, M., and Navarra, A. (2013). Heavy precipitation events in a warmer climate: results from CMIP5 models. J. Clim. 26, 7902–7911. doi: 10.1175/jcli-d-12-00850.1
Skamarock, W. C., Klemp, J. B., Dudhia, J., Gill, D. O., Liu, Z., Berner, J., et al. (2019). A Description of the Advanced Research WRF Version 4. Technical Note 556. Boulder, CO: National Center for Atmospheric Research.
Spero, T. L., Nolte, C. G., Mallard, M. S., and Bowden, J. H. (2018). A Maieutic exploration of nudging strategies for regional climate applications using the WRF model. J. Appl. Meteorol. Climatol. 57, 1883–1906. doi: 10.1175/Jamc-D-17-0360.1
Spero, T. L., Otte, M. J., Bowden, J. H., and Nolte, C. G. (2014). Improving the representation of clouds, radiation, and precipitation using spectral nudging in the Weather Research and Forecasting model. J. Geophys. Res. Atmos. 119, 11682–11694. doi: 10.1002/2014jd022173
Sterle, K., Hatchett, B. J., Singletary, L., and Pohll, G. (2019). Hydroclimate variability in snow-fed river systems: local water managers’ perspectives on adapting to the new normal. Bull. Am. Meteorol. Soc. 100, 1029–1048. doi: 10.1175/Bams-D-18-0031.1
Stewart, I. T., Cayan, D. R., and Dettinger, M. D. (2004). Changes in snowmelt runoff timing in western North America under abusiness as usual’climate change scenario. Clim. Change 62, 217–232. doi: 10.1023/b:clim.0000013702.22656.e8
Sun, F. P., Hall, A., Schwartz, M., Walton, D. B., and Berg, N. (2016). Twenty-first-century snowfall and snowpack changes over the Southern California Mountains. J. Clim. 29, 91–110. doi: 10.1175/Jcli-D-15-0199.1
Taylor, K. E., Stouffer, R. J., and Meehl, G. A. (2012). An overview of CMIP5 and the experiment design. Bull. Am. Meteorol. Soc. 93, 485–498. doi: 10.1175/Bams-D-11-00094.1
Thompson, G., Field, P. R., Rasmussen, R. M., and Hall, W. D. (2008). Explicit forecasts of winter precipitation using an improved bulk microphysics scheme. Part II: implementation of a new snow parameterization. Monthly Weather Rev. 136, 5095–5115. doi: 10.1175/2008mwr2387.1
Tohver, I. M., Hamlet, A. F., and Lee, S. Y. (2014). Impacts of 21st-Century climate change on hydrologic extremes in the Pacific Northwest Region of North America. J. Am. Water Resour. Assoc. 50, 1461–1476. doi: 10.1111/jawr.12199
Udall, B., and Overpeck, J. (2017). The twenty-first century Colorado River hot drought and implications for the future. Water Resour. Res. 53, 2404–2418. doi: 10.1002/2016wr019638
Vahedifard, F., AghaKouchak, A., Ragno, E., Shahrokhabadi, S., and Mallakpour, I. (2017). Lessons from the Oroville dam. Science 355, 1139–1140. doi: 10.1126/science.aan0171
van der Wiel, K., Kapnick, S. B., Vecchi, G. A., Cooke, W. F., Delworth, T. L., Jia, L., et al. (2016). The resolution dependence of contiguous US precipitation extremes in response to CO2 forcing. J. Clim. 29, 7991–8012. doi: 10.1175/jcli-d-16-0307.1
van der Wiel, K., Wanders, N., Selten, F. M., and Bierkens, M. F. P. (2019). Added value of large ensemble simulations for assessing extreme river discharge in a 2°C warmer world. Geophys. Res. Lett. 46, 2093–2102. doi: 10.1029/2019gl081967
Vannitsem, S. (2011). Bias correction and post-processing under climate change. Nonlinear Process. Geophys. 18, 911–924. doi: 10.5194/npg-18-911-2011
Walton, D. B., Hall, A., Berg, N., Schwartz, M., and Sun, F. (2017). Incorporating snow albedo feedback into downscaled temperature and snow cover projections for California’s Sierra Nevada. J. Clim. 30, 1417–1438. doi: 10.1175/jcli-d-16-0168.1
Walton, D. B., Sun, F. P., Hall, A., and Capps, S. (2015). A Hybrid dynamical-statistical downscaling technique. Part I: development and validation of the technique. J. Clim. 28, 4597–4617. doi: 10.1175/Jcli-D-14-00196.1
Wang, J. L., and Kotamarthi, V. R. (2015). High-resolution dynamically downscaled projections of precipitation in the mid and late 21st century over North America. Earths Fut. 3, 268–288. doi: 10.1002/2015ef000304
Warrach-Sagi, K., Schwitalla, T., Wulfmeyer, V., and Bauer, H. S. (2013). Evaluation of a climate simulation in Europe based on the WRF-NOAH model system: precipitation in Germany. Clim. Dyn. 41, 755–774. doi: 10.1007/s00382-013-1727-7
Wrzesien, M. L., Durand, M. T., Pavelsky, T. M., Howat, I. M., Margulis, S. A., and Huning, L. S. (2017). Comparison of methods to estimate snow water equivalent at the mountain range scale: a case study of the California Sierra Nevada. J. Hydrometeorol. 18, 1101–1119. doi: 10.1175/Jhm-D-16-0246.1
Wrzesien, M. L., Durand, M. T., Pavelsky, T. M., Kapnick, S. B., Zhang, Y., Guo, J. Y., et al. (2018). A new estimate of north american mountain snow accumulation from regional climate model simulations. Geophys. Res. Lett. 45, 1423–1432. doi: 10.1002/2017gl076664
Wuebbles, D., Meehl, G., Hayhoe, K., Karl, T. R., Kunkel, K., Santer, B., et al. (2014). CMIP5 climate model analyses: climate extremes in the United States. Bull. Am. Meteorol. Soc. 95, 571–583.
Keywords: climate change, extreme events, precipitation, runoff, downscaling
Citation: Wrzesien ML and Pavelsky TM (2020) Projected Changes to Extreme Runoff and Precipitation Events From a Downscaled Simulation Over the Western United States. Front. Earth Sci. 7:355. doi: 10.3389/feart.2019.00355
Received: 07 October 2019; Accepted: 24 December 2019;
Published: 21 January 2020.
Edited by:
Alfonso Fernandez, University of Concepción, ChileReviewed by:
Enrico Scoccimarro, Euro-Mediterranean Center on Climate Change, Ca’ Foscari University of Venice, ItalyThanh Ngo-Duc, University of Science and Technology of Hanoi, Vietnam
Copyright © 2020 Wrzesien and Pavelsky. This is an open-access article distributed under the terms of the Creative Commons Attribution License (CC BY). The use, distribution or reproduction in other forums is permitted, provided the original author(s) and the copyright owner(s) are credited and that the original publication in this journal is cited, in accordance with accepted academic practice. No use, distribution or reproduction is permitted which does not comply with these terms.
*Correspondence: Melissa L. Wrzesien, d3J6ZXNpZW5AdW5jLmVkdQ==