 Sarah J. Boulton
- School of Geography, Earth and Environmental Sciences, University of Plymouth, Plymouth, United Kingdom
Knickpoints have long been recognized as key geomorphic features that can be used to reveal the landscape evolution of a region. In particular, mobile knickpoints resulting from relative base-level fall record a landscape in the process of change and can encode information about the timing and rate of landscape response. Here, digital elevation model analysis is undertaken to; (a) identify topographic lineaments related to active faulting, and (b) extract geomorphic metrics and document associated knickpoints for rivers on Guadalcanal and Makira (San Cristobal) part of the Solomon Island chain. These islands have been experiencing uplift of up to 2 mm/year since at least the mid Holocene on the upper (Pacific) plate of the San Cristobal Trench of the Solomon Island Forearc. For Guadalcanal, 23 out of 53 studied rivers exhibit slope-break knickpoints, characteristic of base-level fall, and 27 new topographic lineaments with ∼E-W orientation are identified. By contrast, on Makira 14 of 41 studied rivers have slope-break knickpoints, where the rivers are steeper below the knickpoint than above. In addition, 76 new lineaments are inferred, trending NE-SW and likely to be extensional faults. For both Guadalcanal and Makira there is a good correlation between knickpoint elevation/catchment area and distance upstream from the sea, and a weak correlation between relief and knickpoint elevation. There are no clear relationships between the knickpoints and the new topographic lineaments. These data indicate that both islands are undergoing active river incision caused by regional tectonic uplift along an active subduction zone. On Makira, river steepness (ksn) scales with uplift, and K, coefficient of erosion, is in the range 1 × 10⁻⁵ – 7 × 10⁻⁶ m0.1yr–1, while K can be estimated as 1 × 10⁻⁵ – 5 × 10⁻⁸ m0.1yr–1 for Guadalcanal. Calculation of K for steady-state rivers demonstrates a rock strength control on the fluvial response and highlights the importance of lithology on river evolution. Furthermore, the distinct landscape response of the two islands supports the hypothesis that there are different arc segments present along the Solomon Arc and suggests that the Holocene uplift rates for Guadalcanal may not be representative of long-term uplift.
Introduction
Research into quantitative landscape evolution has undergone a revolution over the last 40 years, with the advent of high-quality global digital elevation models (DEMs) (Finnegan et al., 2005; Pipaud et al., 2015; Harel et al., 2016), the development of sophisticated computer models of landscape evolution (van der Beek et al., 2002; Whipple and Tucker, 2002; Sklar and Dietrich, 2006; DiBiase et al., 2010) and advances in geochronology (Gosse and Phillips, 2001; Balco et al., 2008). In particular, the study of fluvial geomorphology has been a major focus of the landscape evolution community because bedrock rivers transmit base-level changes to the entire watershed and set the hillslope angle; controlling erosion and sediment deposition (e.g., Snyder et al., 2000; Whipple, 2004; DiBiase et al., 2010).
One application of fluvial geomorphic analysis has been the study of regional uplift and faulting, where the location and slip rate of individual active faults can even be determined, through the recognition of features indicative of rivers responding to changing boundary conditions, for example an increase in uplift rate or a fall in relative base-level (e.g., Kirby and Whipple, 2001; Boulton and Whittaker, 2009; Kent et al., 2017). Changing boundary conditions cause a characteristic transient landscape response that has been widely recognized across a range of tectonic and climatic regimes, typified by the formation of incised bedrock channels with a knickpoint at the upstream extent of steepened channels (Wobus et al., 2003; Bishop et al., 2005; Harkins et al., 2007; Boulton and Whittaker, 2009; Haviv et al., 2010; Kirby and Whipple, 2012; Miller et al., 2012; Ferrier et al., 2013; Miller, 2013; Ortega et al., 2013; Regalla et al., 2013; Boulton et al., 2014; Castillo et al., 2017; Kent et al., 2017). The identification, quantification and analysis of rivers and knickpoints, and other features linked to landscape rejuvenation, routinely utilizes global DEM datasets to investigate regional trends in fluvial geomorphology. Therefore, this remote approach to landscape analysis is especially useful in areas that were previously lacking data owing to either accessibility issues or the subtlety of landscape expression (e.g., Oguchi et al., 2003; Ganas et al., 2005; Marliyani et al., 2016; Menier et al., 2017).
In this study, the tropical islands of Guadalcanal and Makira/San Cristobal, part of the Solomon Islands, are investigated. These islands face considerable hazard and risk from significant seismic activity along the adjacent Australia-Pacific plate boundary. Not only are the islands susceptible to the effects of earthquakes and tsunamis but increased landslide hazard is also common in regions experiencing landscape rejuvenation, because tectonic uplift and river incision causes steepening of hillslopes and increased erosion and mass wasting (Malamud et al., 2004; Ouimet et al., 2007; Gallen et al., 2011; Parker et al., 2015; Bennett et al., 2016; Rao et al., 2017). However, limited research into the geology or geomorphology of the islands has been undertaken in recent years. As a result there is little information available on the potential impact of a range of geological hazards that could affect these islands. As populations in the Global South are some of the most vulnerable to geohazards, the lack of recent research presents a significant research gap.
Furthermore, Holocene uplift data (Chen et al., 2011) exist for the two islands allowing a range of fluvial metrics to be compared to the regional uplift field in a tropical island setting with contrasting bedrock lithology. The availability of independently determined uplift data allow relationships between river steepness and uplift to be assessed and the coefficient of erosion, K, potentially to be determined. K is one of the most difficult of the landscape metrics to calculate and remains unconstrained in many field studies leading to uncertainties the parametrization of this variable in landscape evolution models (Roy et al., 2016; Forte et al., 2016; Yanites et al., 2017). Consequently, determining the natural variation of K is an important challenge for the landscape evolution community.
Therefore, in this study DEMs are used to undertake landscape analysis for Guadalcanal and Makira in the Solomon Island chain that have well-constrained uplift and subsidence rates (Chen et al., 2011). The landscape analysis is used to: (a) identify previously unrecognized active faults; (b) determine the controls on fluvial network development; (c) investigate the relationship between river steepness and uplift, and (d) assess the potential implications for geohazards on the islands.
Geological Background
The Solomon Island forearc occupies an 800 km long segment of the Australia-Pacific plate boundary in the southwest Pacific Ocean (Mann et al., 1998; Cowley et al., 2004; Kuo et al., 2016). Formed of a collage of crustal units, the islands are surrounded by deep ocean floor and sit on an uplifted tectonic block (Figure 1). The block is bound by two trench systems: the New Britain–San Cristobal trench (or South Solomon trench system) to the SW and the North Solomon trench to the NE. Today most active subduction occurs along the New Britain-San Cristobal trench with only slight convergence along the North Solomon trench (Mann et al., 1998; Miura et al., 2004; Chen et al., 2011). As with other subduction zones, the Solomon Islands forearc can be divided into segments, with three major tectonic regimes or ‘super-segments’ determined through differences in plate motion, seismic activity and uplift/subsidence rates (Chen et al., 2011). Guadalcanal – Makira is the southernmost of the three segments (the others being the New Georgia Islands and Bougainville Island) and has been further subdivided into five sub-segments by Chen et al. (2011), based primarily upon different histories of vertical tectonic motions across the region. The convergence direction along this segment is oblique, with the Australian Plate subducting along the San Cristobal Trench at 93 mm/yr (Figure 1). As a consequence, the Guadalcanal – Makira segment can be effected by large megathrust earthquakes along the trench and has experienced a number of Mw > 7.0 earthquakes, including an Mw 7.9 earthquake on the 30th April 1939 (Thirumalai et al., 2015; Kuo et al., 2016). In addition, the region experiences frequent lower magnitude seismicity along the subduction zone interface and in the upper plate (Figure 1).
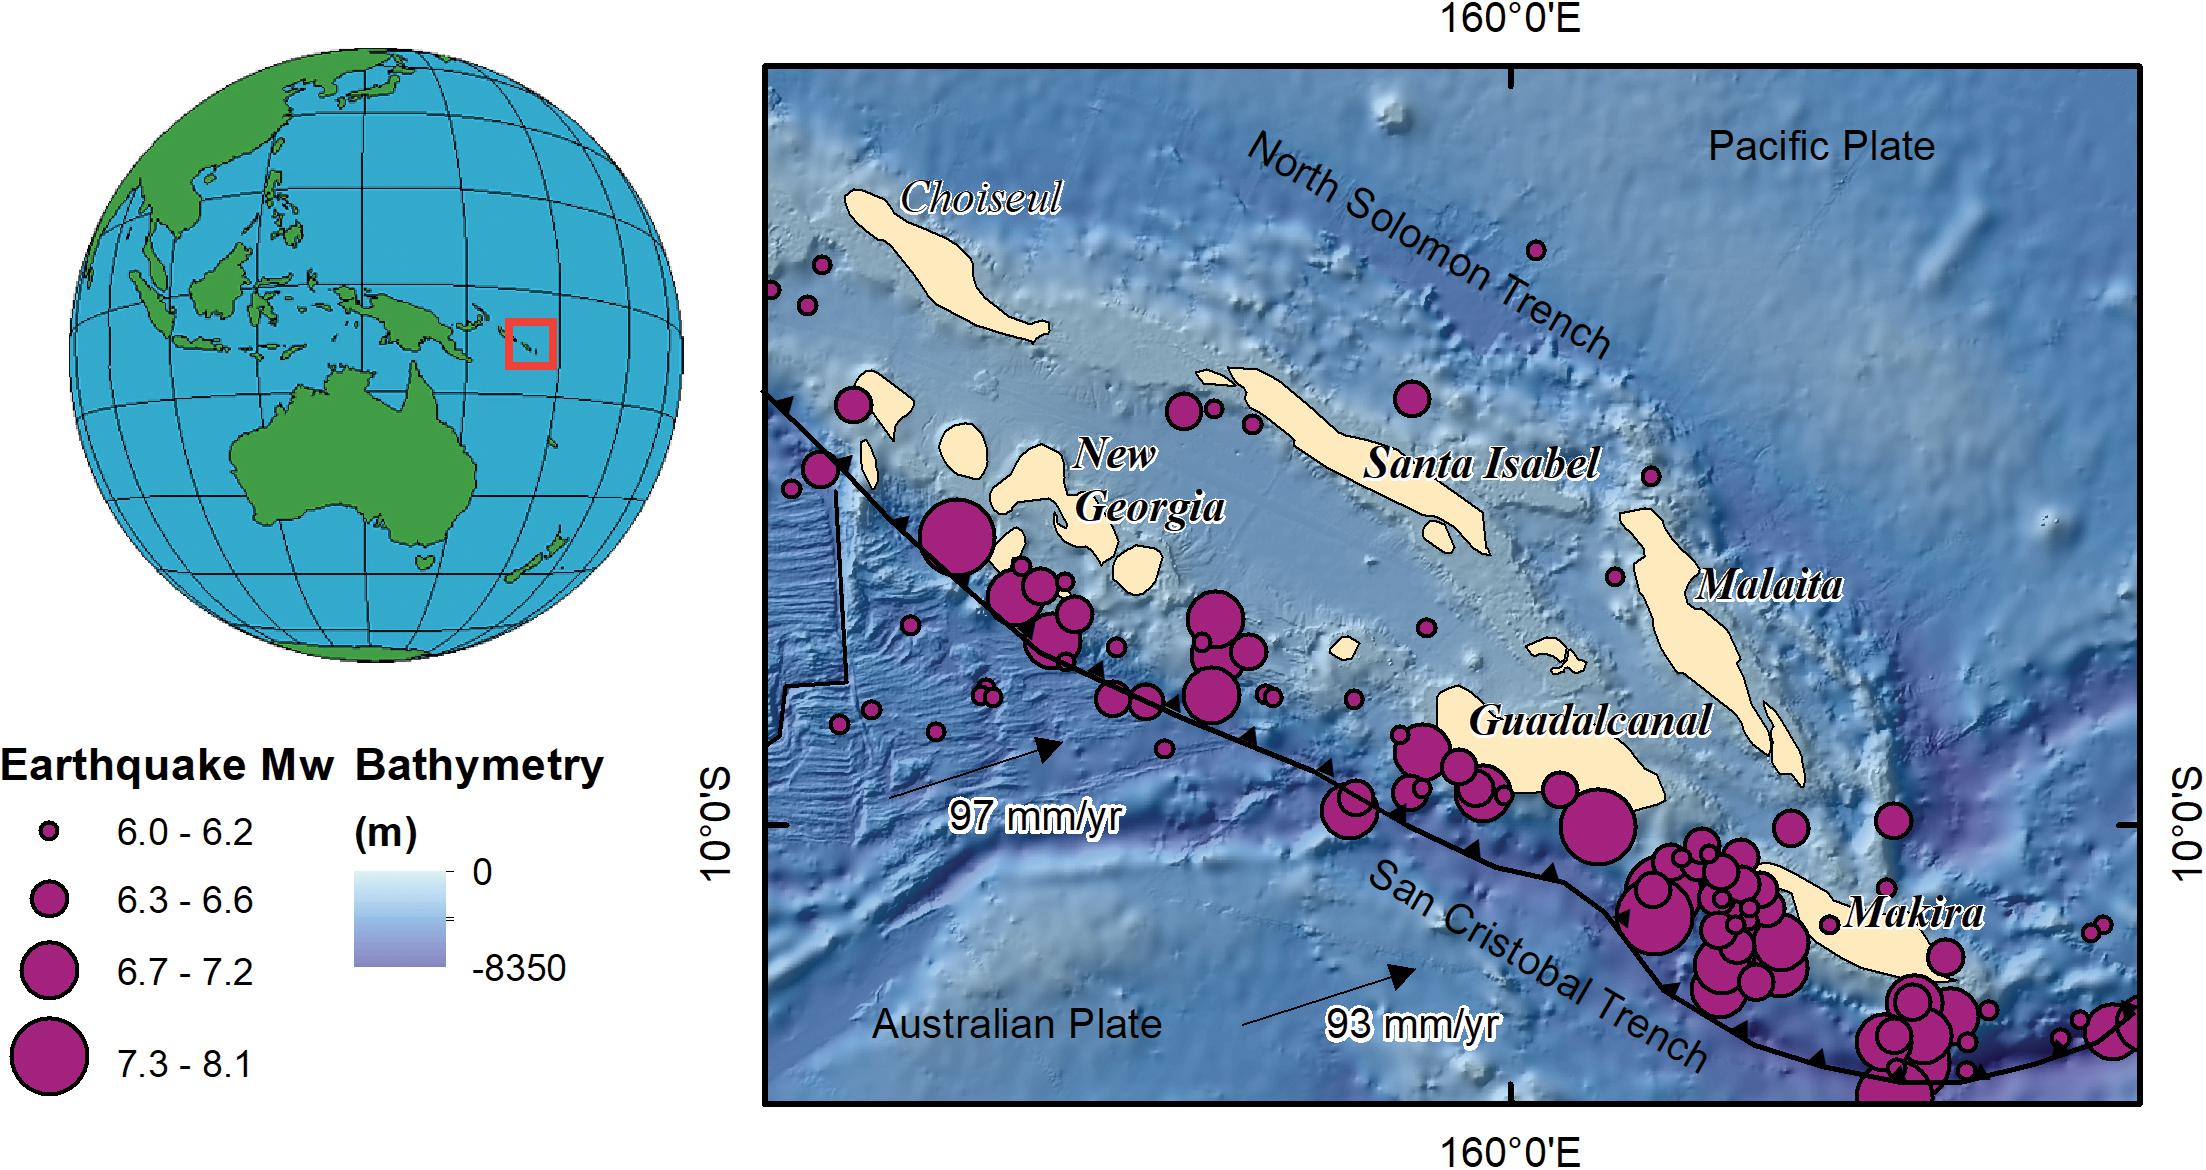
Figure 1. Plate tectonic setting of the Solomon Island Arc with the islands of Guadalcanal and Makira forming the southernmost major islands with Mw > 6 earthquakes for the period 1980 to present shown (USGS, 2019). Bathymetric data is the GEBCO_2019 Grid (GEBCO Compilation Group 2019). Plate velocities from Chen et al. (2011).
Geology of Guadalcanal
Guadalcanal is the largest island in the Solomon Island chain (Figure 2A), ∼ 150 km in length and 45 km wide, with the highest topography located along the southern half of the island reaching a maximum of 2335 m above sea level at Mount Popomanaseu. The drainage and topographic divides of the island are offset to the south along much of the island, although in western Guadalcanal the divides are centrally located in the volcanic zone (Petterson et al., 1999; Chen et al., 2011).
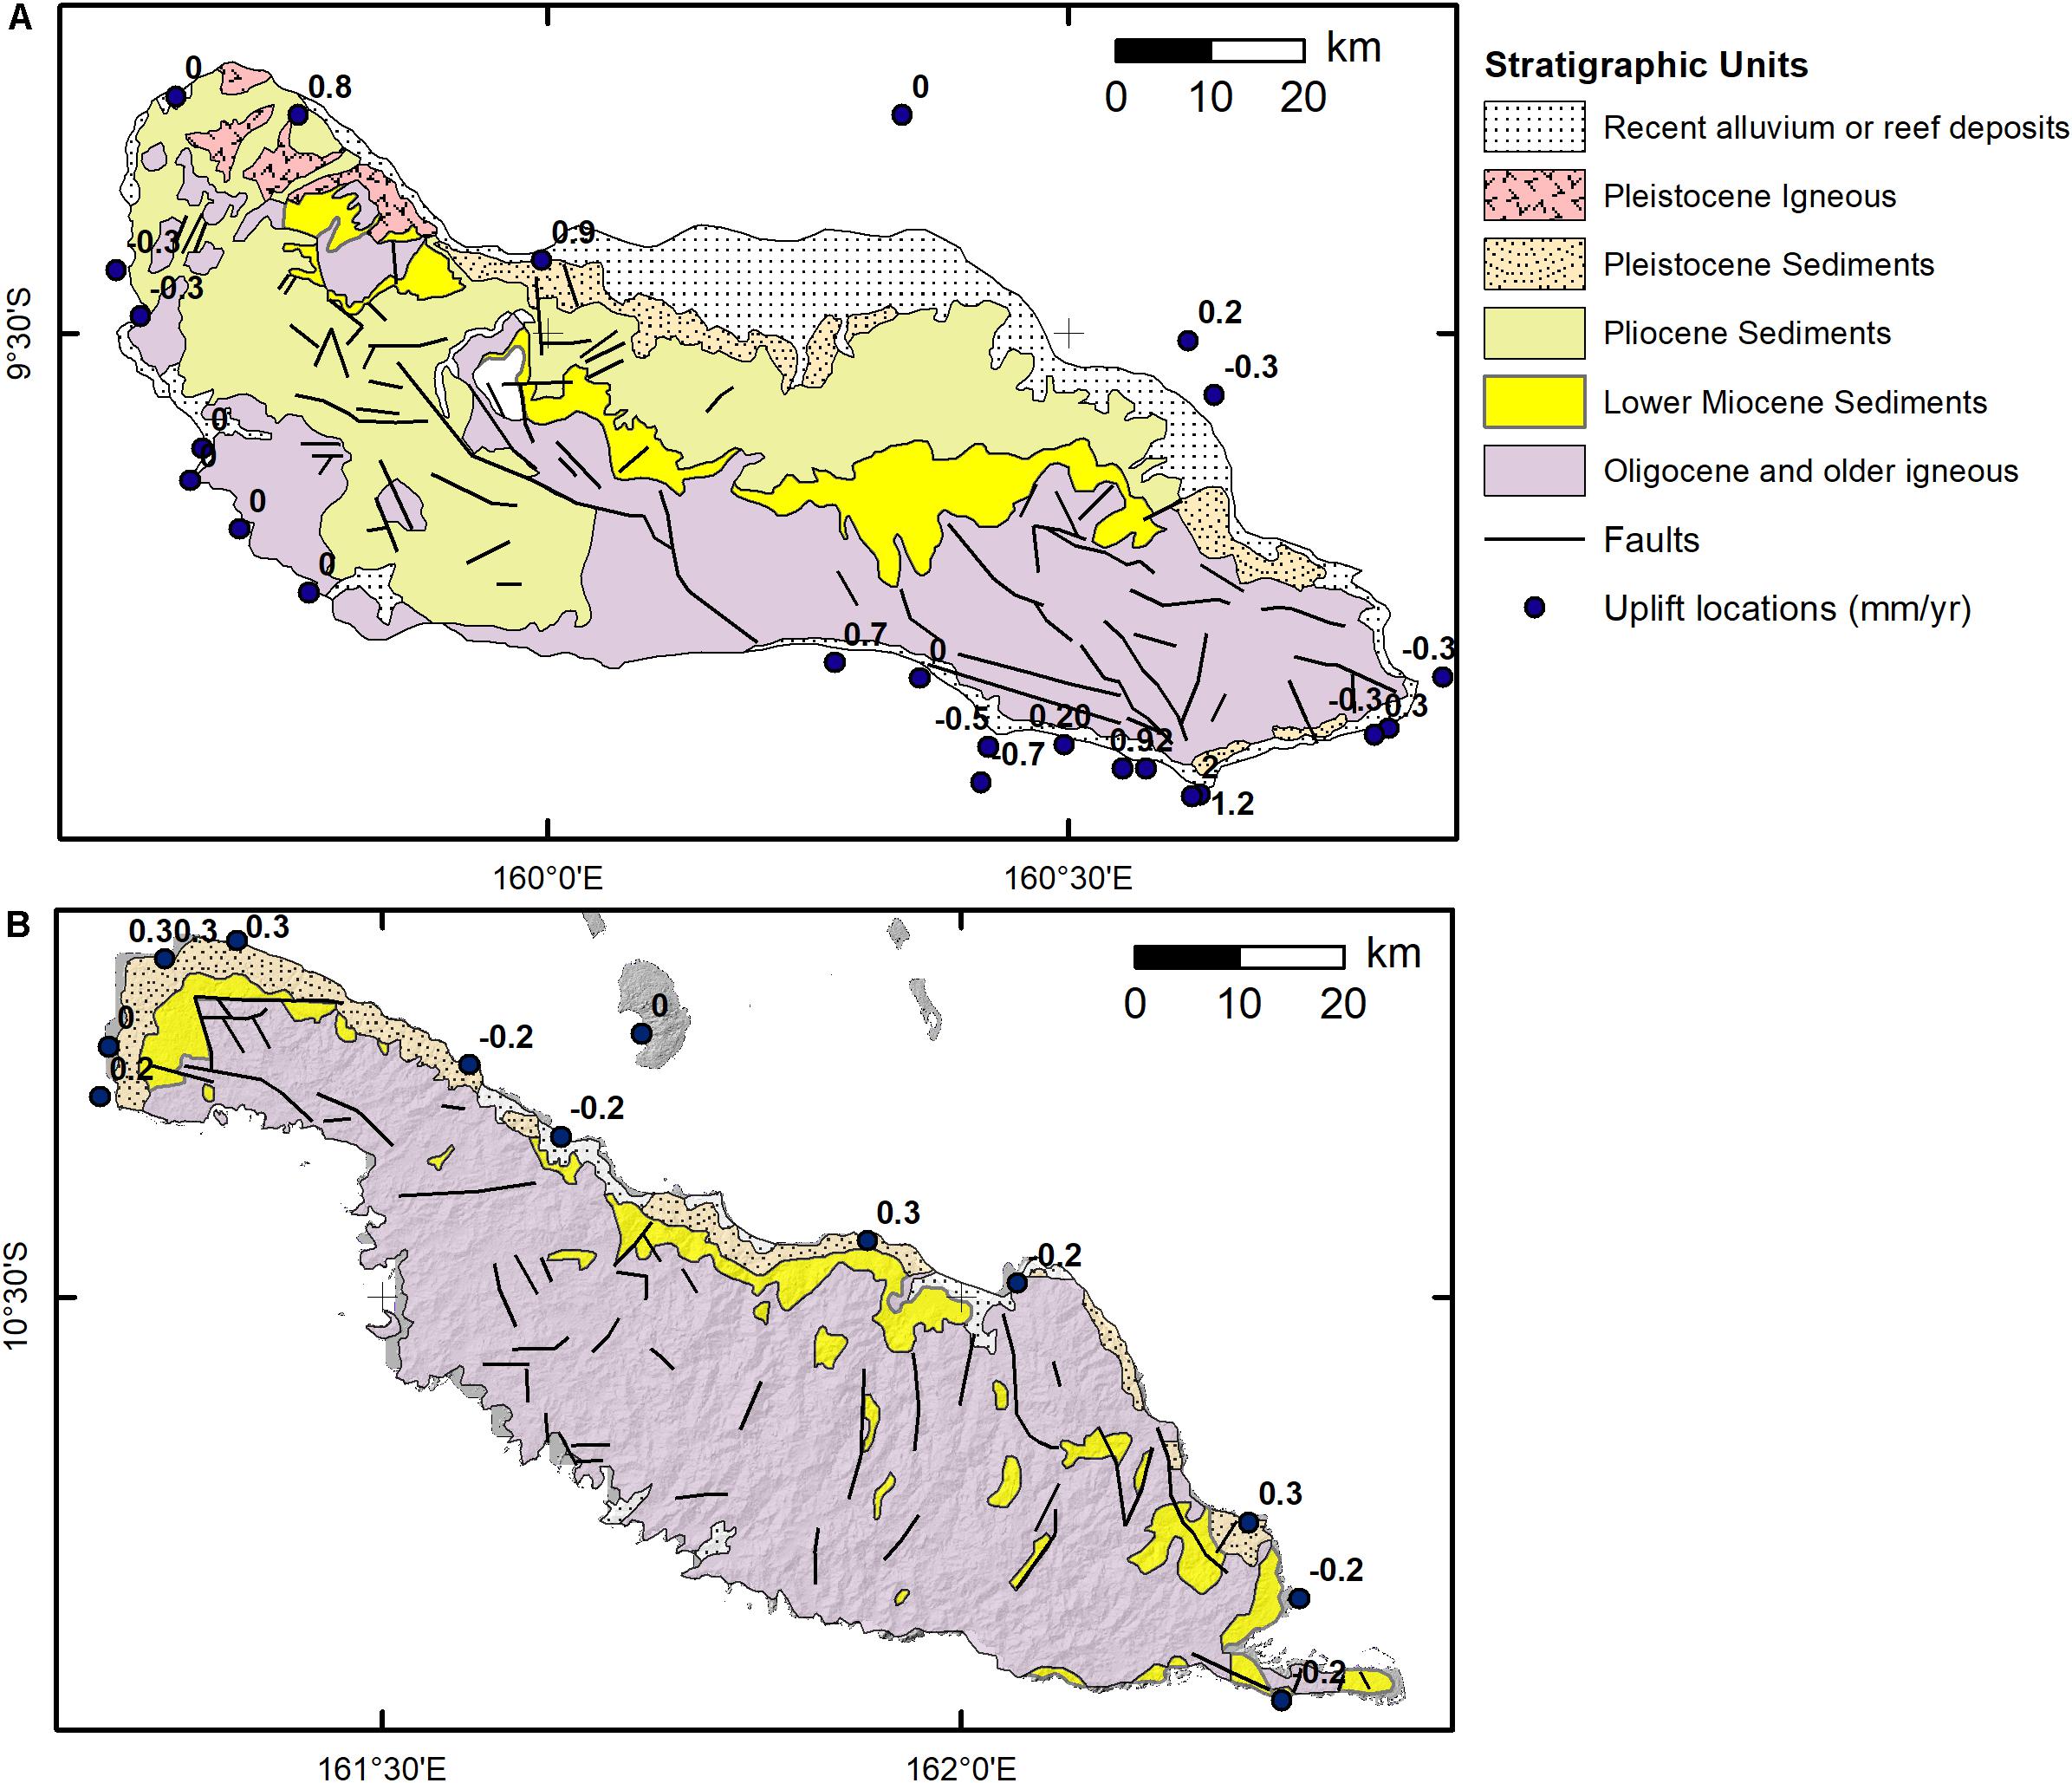
Figure 2. Geological maps [simplified from Department of Geological Surveys (1969)] of (A) Guadalcanal and (B) Makira showing mapped faults and uplifted coral reef locations used to interpolate the uplift field (Chen et al., 2011).
Basement rocks are exposed in the south and west of Guadalcanal forming part of the South Solomon MORB (Mid Ocean Ridge Basalt) Terrain (Petterson et al., 1997, 1999). The basement lithology of the terrain is mainly composed of basaltic lavas with interbedded pelagic sediments and cross-cut by a range of intrusive sills and dykes (Hackman, 1980; Ridgway, 1987). Overlying is a cover sequence dating from the Oligocene to the Pleistocene, dominantly composed of basaltic or andesitic lavas and volcaniclastic sediments (Hackman, 1980; Cowley et al., 2004). Pliocene deposits consist of siltstones, mudstones and shales, inter-bedded with sandstones and conglomerates (Petterson et al., 1999). Published maps (Department of Geological Surveys, 1969) indicate that faulting is predominantly located in the basement rocks with ENE-SWS to NE-SE-trending faults dominant (Figure 2A).
Quaternary to Recent sediments are composed of alluvial deposits, located along the central-north sector of the island, which has raised Pleistocene coralline reef terraces up to 800 m above sea level (Hackman, 1980; Petterson et al., 1999). Estimates of Holocene uplift rates come from the work of Chen et al. (2011), who identified two different sub-segments or uplift zones on Guadalcanal. Coral reefs are submerged at the eastern end of the island, indicating that the area is subsiding. However, to the west Holocene reefs are found at increasing elevations reaching a maximum of 15 m above sea-level suggesting uplift rates of up to 2 mm/yr (Chen et al., 2011) (Figure 2A). Interestingly Chen et al. (2011) postulate the presence of an unidentified offshore active fault owing to the presence of adjacent regions of uplift and subsidence along the southern coast. By contrast, in the western part of the island reefs on the north coast indicate maximum uplift rates of 0.8–0.9 mm/yr (Figure 2A) while much of the southern coast appears to be stable or subsiding at the present time (Chen et al., 2011).
Geology of Makira
The island of Makira (previously known as San Cristobal) is located to the east of Guadalcanal (Figure 1), and is ∼ 140 km long and ∼ 40 km wide. The topography is lower than Guadalcanal with a maximum elevation of 1056 m. The highest topography lies in the center and west of the island, yet the drainage divide is offset to toward the south, whereas the topographic divide is located centrally along island (Chen et al., 2011).
The basement sequence forms the Makira Terrain, a composite Cretaceous-Oligocene MORB with plateau basalts (Petterson et al., 1999) comprising a sequence of basaltic, doleritic and gabbroic intrusions (Figure 2B). The cover sequence comprises Upper Miocene – Lower Pliocene deposits formed of various breccias, calcareous sandstones and siltstones with interbedded basaltic sheets and a Quaternary-recent sequence of alluvium, raised reef, beach, and mangrove sediments (Tejada et al., 1996; Tejada, 2002).
Makira is also structurally complex and dominated by block faulting (Petterson et al., 1999). To the east faults mainly strike NNE-SSW; whereas, toward the west, faults strike ESE to NNE (Figure 2B). Petterson et al. (1997) explained these structures as the result of the oblique collision between the Australian and Pacific plates causing transpressive sinistral strike-slip deformation.
Chen et al. (2011) also determined that Makira is composed of two arc sub-segments based upon uplift trends. A significant part of the island is characterized by an uplifting northern coast with uplift rates of ∼ 0.3 mm/yr (Figure 2B) and a stable or subsiding southern coast. The westernmost part of the island experiences similar rates of uplift but the presence of extensive reefs combined with the gross geomorphology led Chen et al. (2011) to assign this region a different Quaternary uplift history.
Climate
The Solomon Islands have a warm, humid tropical climate with an annual temperature of ∼26°C and two seasons; the dry season from May to October and the rainy season from November to April. The average annual rainfall is 2000 – 5000 mm but varies owing to the relative influence of the El Niño-Southern Oscillation (ENSO), the Asian-Australian Monsoon and the Indian Ocean Dipole (e.g., Abram et al., 2009). Palaeoclimate records suggest that the ENSO was active throughout the Holocene but that overall Holocene climates were cooler and dryer than today and ENSO oscillations weaker (Tudhope et al., 2001; Abram et al., 2009).
Materials and Methods
Mapping of Morphostructural Lineaments
Topographic or physiographic lineaments have long been recognized as aligned landforms that can be observed at a range of scales and related to underlying crustal structures such as faults and folds (O’Leary et al., 1976). As availability of low cost and free DEMs have revolutionized the extraction of fluvial geomorphology, so too have they become ubiquitous in the mapping of landforms at a range of scales (e.g., Onorati et al., 1992; Smith et al., 2001; Smith and Clark, 2005). Here, the ALOS World 3D 30 m DEM was used to manually map topographic lineaments on both islands as this dataset has a higher apparent resolution than the SRTM DEM (Boulton and Stokes, 2018).
Smith and Clark (2005) recommend using a range of visualization methods when developing geomorphic maps, to avoid problems in relief-shading causing directional bias in the resulting dataset. They found that no one visualization technique surpassed the advantages of using two or more complementary methods to delimit lineaments, especially where landforms are subdued. In this study, a combination of relief-shaded DEMs (four layers were used, produced with the Hillshade tool in ArcGIS 10.6 with sun azimuth set at 045, 135, 225, and 315°), curvature and slope visualization methods were used to identify natural topographic lineaments. In addition, tectonic geomorphic features such as truncated spurs, triangular facets, offset valleys etc., were identified to focus only on the lineaments that are likely to be caused by active faults. However, based upon the available data, active from inactive faults cannot be conclusively separated and all lineaments would need ground truthing in order to fully identify the type of causative structure and determine the sense of motion and activity level. Infrastructure maps were used to cross-check results and avoid mapping any anthropogenic features.
River Profile Analysis
Three broad models describing fluvial erosion have been developed: detachment-limited; transport-limited and hybrid models (e.g., Tucker and Whipple, 2002; Whipple and Tucker, 2002). In detachment-limited systems the steady-state (where erosion equals uplift) river gradient is controlled by the strength of the channel substrate and relative base-level fall; these rivers are characteristically bedrock rivers.
These models of river behavior predict the relationship between slope, S, and upstream drainage area, A, in the form:
where Θ is the concavity index and ks the steepness index.
As eq. (1) subsumes within ks the uplift rate of a given area (Eq. 2) this term should vary systematically with uplift at steady state (Whipple and Tucker, 1999, 2002), a conclusion that has been supported by a range of empirical studies (i.e., Snyder et al., 2000; Kirby and Whipple, 2001; Safran et al., 2005; Cyr et al., 2010; DiBiase et al., 2010). The erosion coefficient, K, encompasses several factors including rock strength, channel width and runoff, yet despite recent modeling and empirical studies this variable remains poorly constrained (Stock and Montgomery, 1999; Snyder et al., 2000; Roy et al., 2016; Bernard et al., 2019).
In addition, the stream power model predicts that the shape of the river will be concave-up under presumed steady-state conditions (Figure 3A) (Whipple and Tucker, 2002; Kirby et al., 2003). However, where uplift ≠ erosion, the river is no longer in steady-state and non-equilibium geomorphic features (i.e., knickpoints) may develop (Figures 3C,E). Knickpoints are recognized in the field as steeper channel reaches through to waterfalls and have been classified into two end member morphologies: vertical-step and slope-break (Figures 3D,F), based upon their form on slope-area graphs (Haviv et al., 2010).
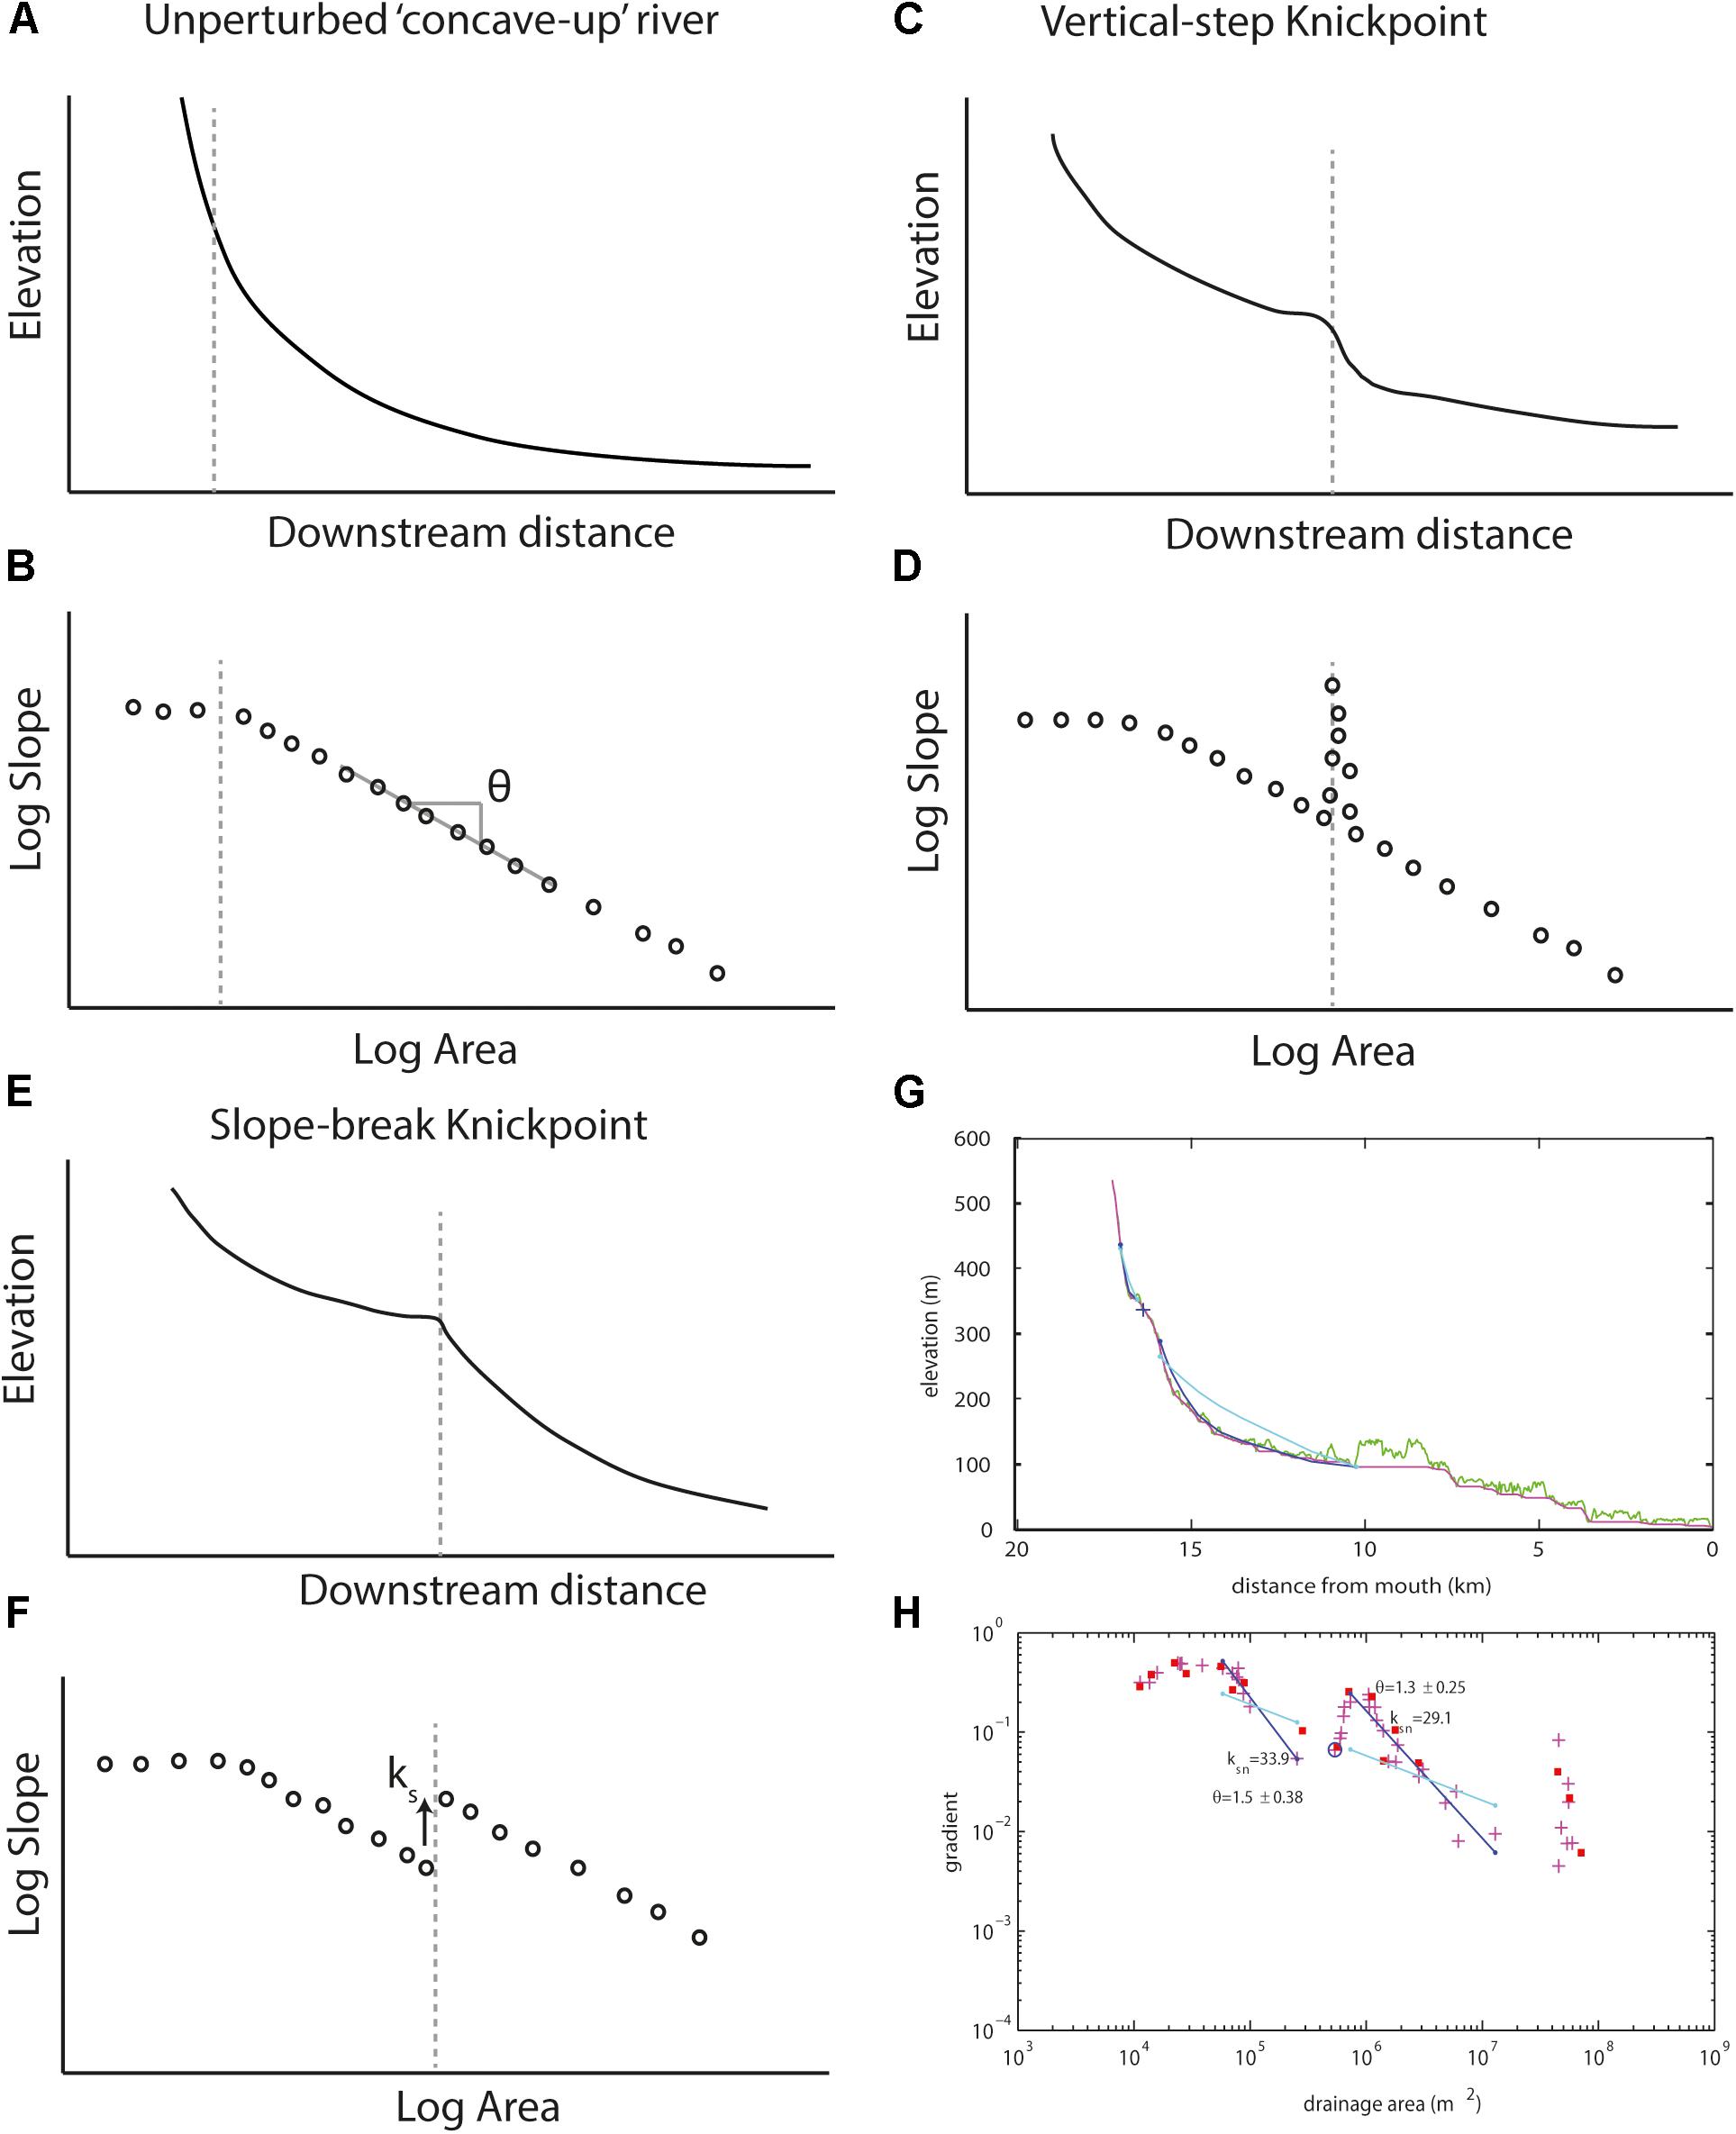
Figure 3. Conceptual diagram showing the river long profile and slope-area graphs for rivers in steady state (A,B), rivers with a vertical step knickpoint (C,D) and rivers with a slope-break knickpoint (E,F) (adapted from Wobus et al., 2006; Kirby and Whipple, 2012). Note that the steepeness index (the intercept - ks) increases downstream across a slope-break knickpoint but not across a vertical step knickpoint. (G,H) Show an example of a river profile and slope-area plot, respectively, from the study area. This is river 21 from the island of Makira, the green line is the raw DEM river profile and the purple is the smoothed profile.
Slope-break knickpoints (Haviv et al., 2010; Kirby and Whipple, 2012) develop in response to a change in the base-level of the system, forcing the fluvial system from one steady state to another. For example, changes in boundary conditions can result from an increase in rock uplift as a result of the initiation of new faults, the increase in slip rate on existing faults, or permanent eustatic sea-level fall (Wobus et al., 2003, 2006; Goldrick and Bishop, 2007; Harkins et al., 2007; Marliyani et al., 2016). The slope-break knickpoint transmits the new base-level to the catchment as a migrating wave through the river system. The horizontal celerity is a function of drainage area, so as the knickpoint travels through the drainage system the celerity decreases as catchment area decreases (Whipple and Tucker, 1999; Crosby and Whipple, 2006). Therefore, within a single catchment the knickpoints will migrate at a rate proportional to drainage area and at any given time will occur at a constant elevation within the landscape assuming that prior to perturbation the landscape was in equilibrium (Crosby and Whipple, 2006). However, differences in knickpoint elevation can be observed as a result of spatial variation in uplift rates along a fault, climatic variations across a study area or where the pre-existing landscape was not in steady-state (Bishop et al., 2005). Where knickpoint dispersal is the result of variations in uplift rate along normal fault arrays, the height of the knickpoint has been shown to correlate with the slip rate on faults (Boulton and Whittaker, 2009; Whittaker and Boulton, 2012; Gallen and Wegmann, 2017; Kent et al., 2017). This observation means that in regions without independent means to determine uplift rates the transient river profile provides a mechanism by which fault activity can be evaluated.
By contrast vertical-step knickpoints are generally stationary, anchored in space as a result of a discrete change in channel conditions, such as a more resistant bedrock lithology, a debris flow or landslide causing the deviation away from steady state conditions (Phillips and Lutz, 2008; Haviv et al., 2010; Kirby and Whipple, 2012). Vertical-step knickpoints can also mark the position of faults in the landscape where there is marked lithological change across the structure (Whipple, 2004; Wobus et al., 2006; Kirby and Whipple, 2012; Liu et al., 2019). In general, the significance of vertical-step knickpoints is more relevant to smaller channel-scale heterogeneities rather than regional-scale trends in uplift or sea-level fall.
Longitudinal river profiles were extracted from the SRTM 30 m DEM (Farr et al., 2007; USGS, 2019) using a combination of the Matlab stream profiler tool and the ArcGIS suite of programs using the ArcHydrology toolbox (Tarboton et al., 1991) to create a hydrologically sound DEM and to extract the river network. Major river systems were extracted that drain the islands of Guadalcanal and Makira where drainage area exceeds 105 m2 (cf. Kirby and Whipple, 2001, 2012). The SRTM DEM is of higher quality than the ASTER DEM for the region, this is in line with observations elsewhere (e.g., Boulton and Stokes, 2018). This analysis was completed before the ALOS World dataset was released, and previous research shows that DEM choice has little effect on the results of river profile analysis (e.g., Wobus et al., 2006; Boulton and Stokes, 2018). Channel slope, S, and upstream drainage area, A, were plotted on SA log-log plots and used to calculate the channel concavity, Θ, and the steepness index, ks, through slope regression (Figure 3). As the concavity determines ks, a reference concavity Θref (Wobus et al., 2006) is used to calculate the normalized steepness index, ksn. A standard Θref = 0.45 is used to be consistent with other studies (e.g., Wobus et al., 2003, 2006; Ouimet et al., 2009; DiBiase et al., 2010; Miller et al., 2012; Cyr et al., 2014) allowing for inter-study comparison.
Knickpoints were identified based upon observed breaks in scaling on the SA plots (Figure 3). On rivers where knickpoints were identified, Θ and ksn were calculated separately for channel reaches above and below the knickpoint(s). Knickpoints were also mapped onto the DEM so that any spatial relationships between knickpoint locations and lithological boundaries based upon the published map (Department of Geological Surveys, 1969) or inferred faults from DEM analysis could be identified.
Uplift Rates
Uplift values were interpolated across the two islands using the dated Holocene coral database of Chen et al. (2011). This was achieved in ArcMap using a spline with barriers tool. The spline interpolation technique was chosen as this technique honors the original datapoints (i.e., the output surface passes through the input points) and the barriers to take into account possible discontinuities in the uplift field across proposed arc segments. A disadvantage of this method is that the resultant uplift field is restricted to the x, y extent of the input points.
Results
Guadalcanal Lineaments
There are limited structural data available for Guadalcanal, although the published geological map (Department of Geological Surveys, 1969) includes 69 faults mapped primarily in the igneous basement but also deforming the Pliocene sediments (Figure 4A). The dominant trend of these mapped faults is NE-SW, with secondary fault trends in the SE-NW quadrant. Interestingly, the SE-NW orientated structures have longer mapped traces (up to 50 km) but are less common than the shorter NE-SW trending faults. Both sets of faults can be found across the whole island and there are no clear patterns of cross-cutting relationships suggesting that these two sets of structures could be a conjugate fault system (Figure 4).
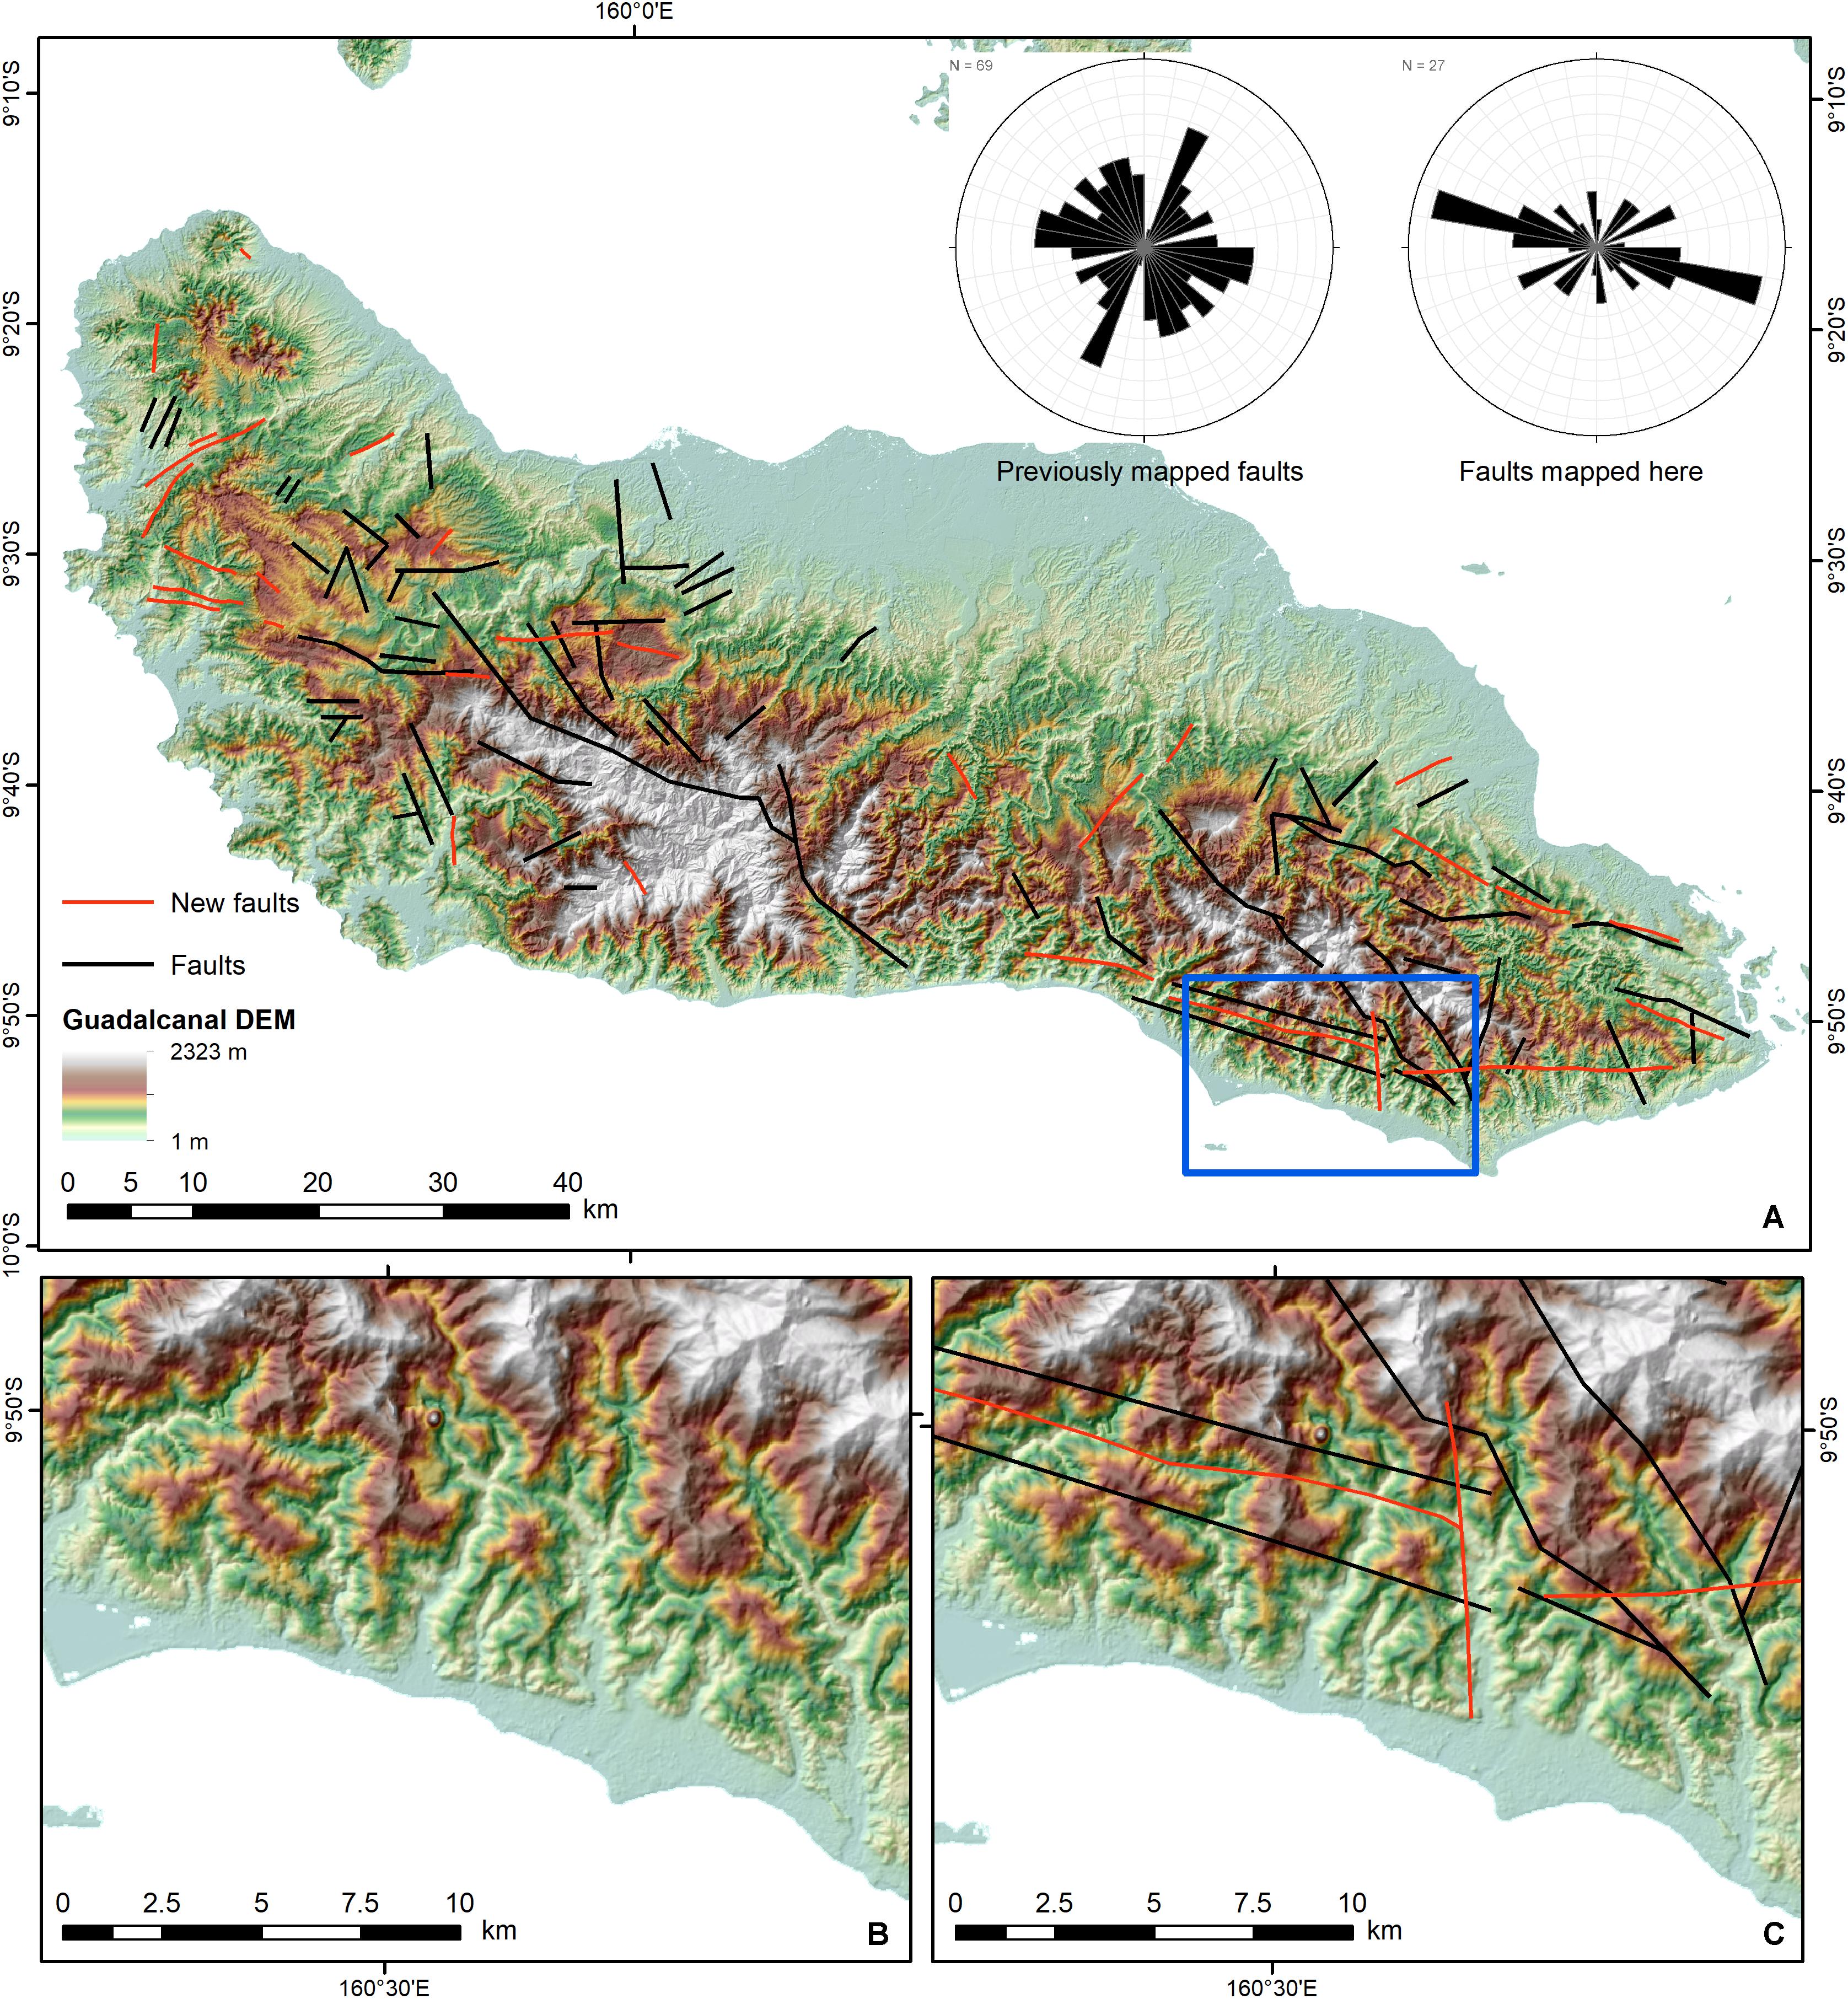
Figure 4. (A) ALOS World 3D 30 m DEM (©JAXA) of Guadalcanal showing existing faults from the published mapping data (Department of Geological Surveys, 1969) and inferred topographic lineaments, rose diagrams showing the orientations of both datasets are shown in the top right corner. (B,C) Raw and interpreted DEM for the area shown in the blue box on part (A).
Interestingly, many of these previously mapped faults do not have a clear topographic expression. Only 27 lineaments were identified through the topographic analysis of the DEM. The majority of these structures are oriented ESE-WNW, with few lineaments striking NE-SW. In some cases, the traces of the new faults are located close to mapped structures suggesting that these could be the same fault but that errors in location could have resulted in slight mismatches between datasets. For example in the south of the island (Figures 4B,C), a topographic lineament was identified based upon truncated spurs and aligned valleys, with transverse and offset streams. This new lineament is located in between two previously identified subparallel structures trending ESE-WNW, which have limited topographic expression. These ESE-WNW striking structures appear to be truncated by a cross-cutting N-S lineament with triangular facets forming the western-side of a river valley (Figures 4B,C). Other mapped lineaments are present in this area but do not have clear topographic expression.
Guadalcanal Rivers
On the island of Guadalcanal, 57 river profiles that drain radially from the central high topography to the coast were extracted from the SRTM 30 m DEM (Figure 5, Table 1, and Supplementary Figure S1). Twenty-five rivers flow to the north, these are in general longer (average length 48.7 km; longest river 13 at 69.95 km) than the 32 rivers that flow southwards (average 16.7 km, longest rivers are rivers 33 and 40 both 33 km long). Of the 57 river profiles extracted, 24 contain one or more knickpoints, while the remaining 33 rivers have river long profiles without any marked discontinuities.
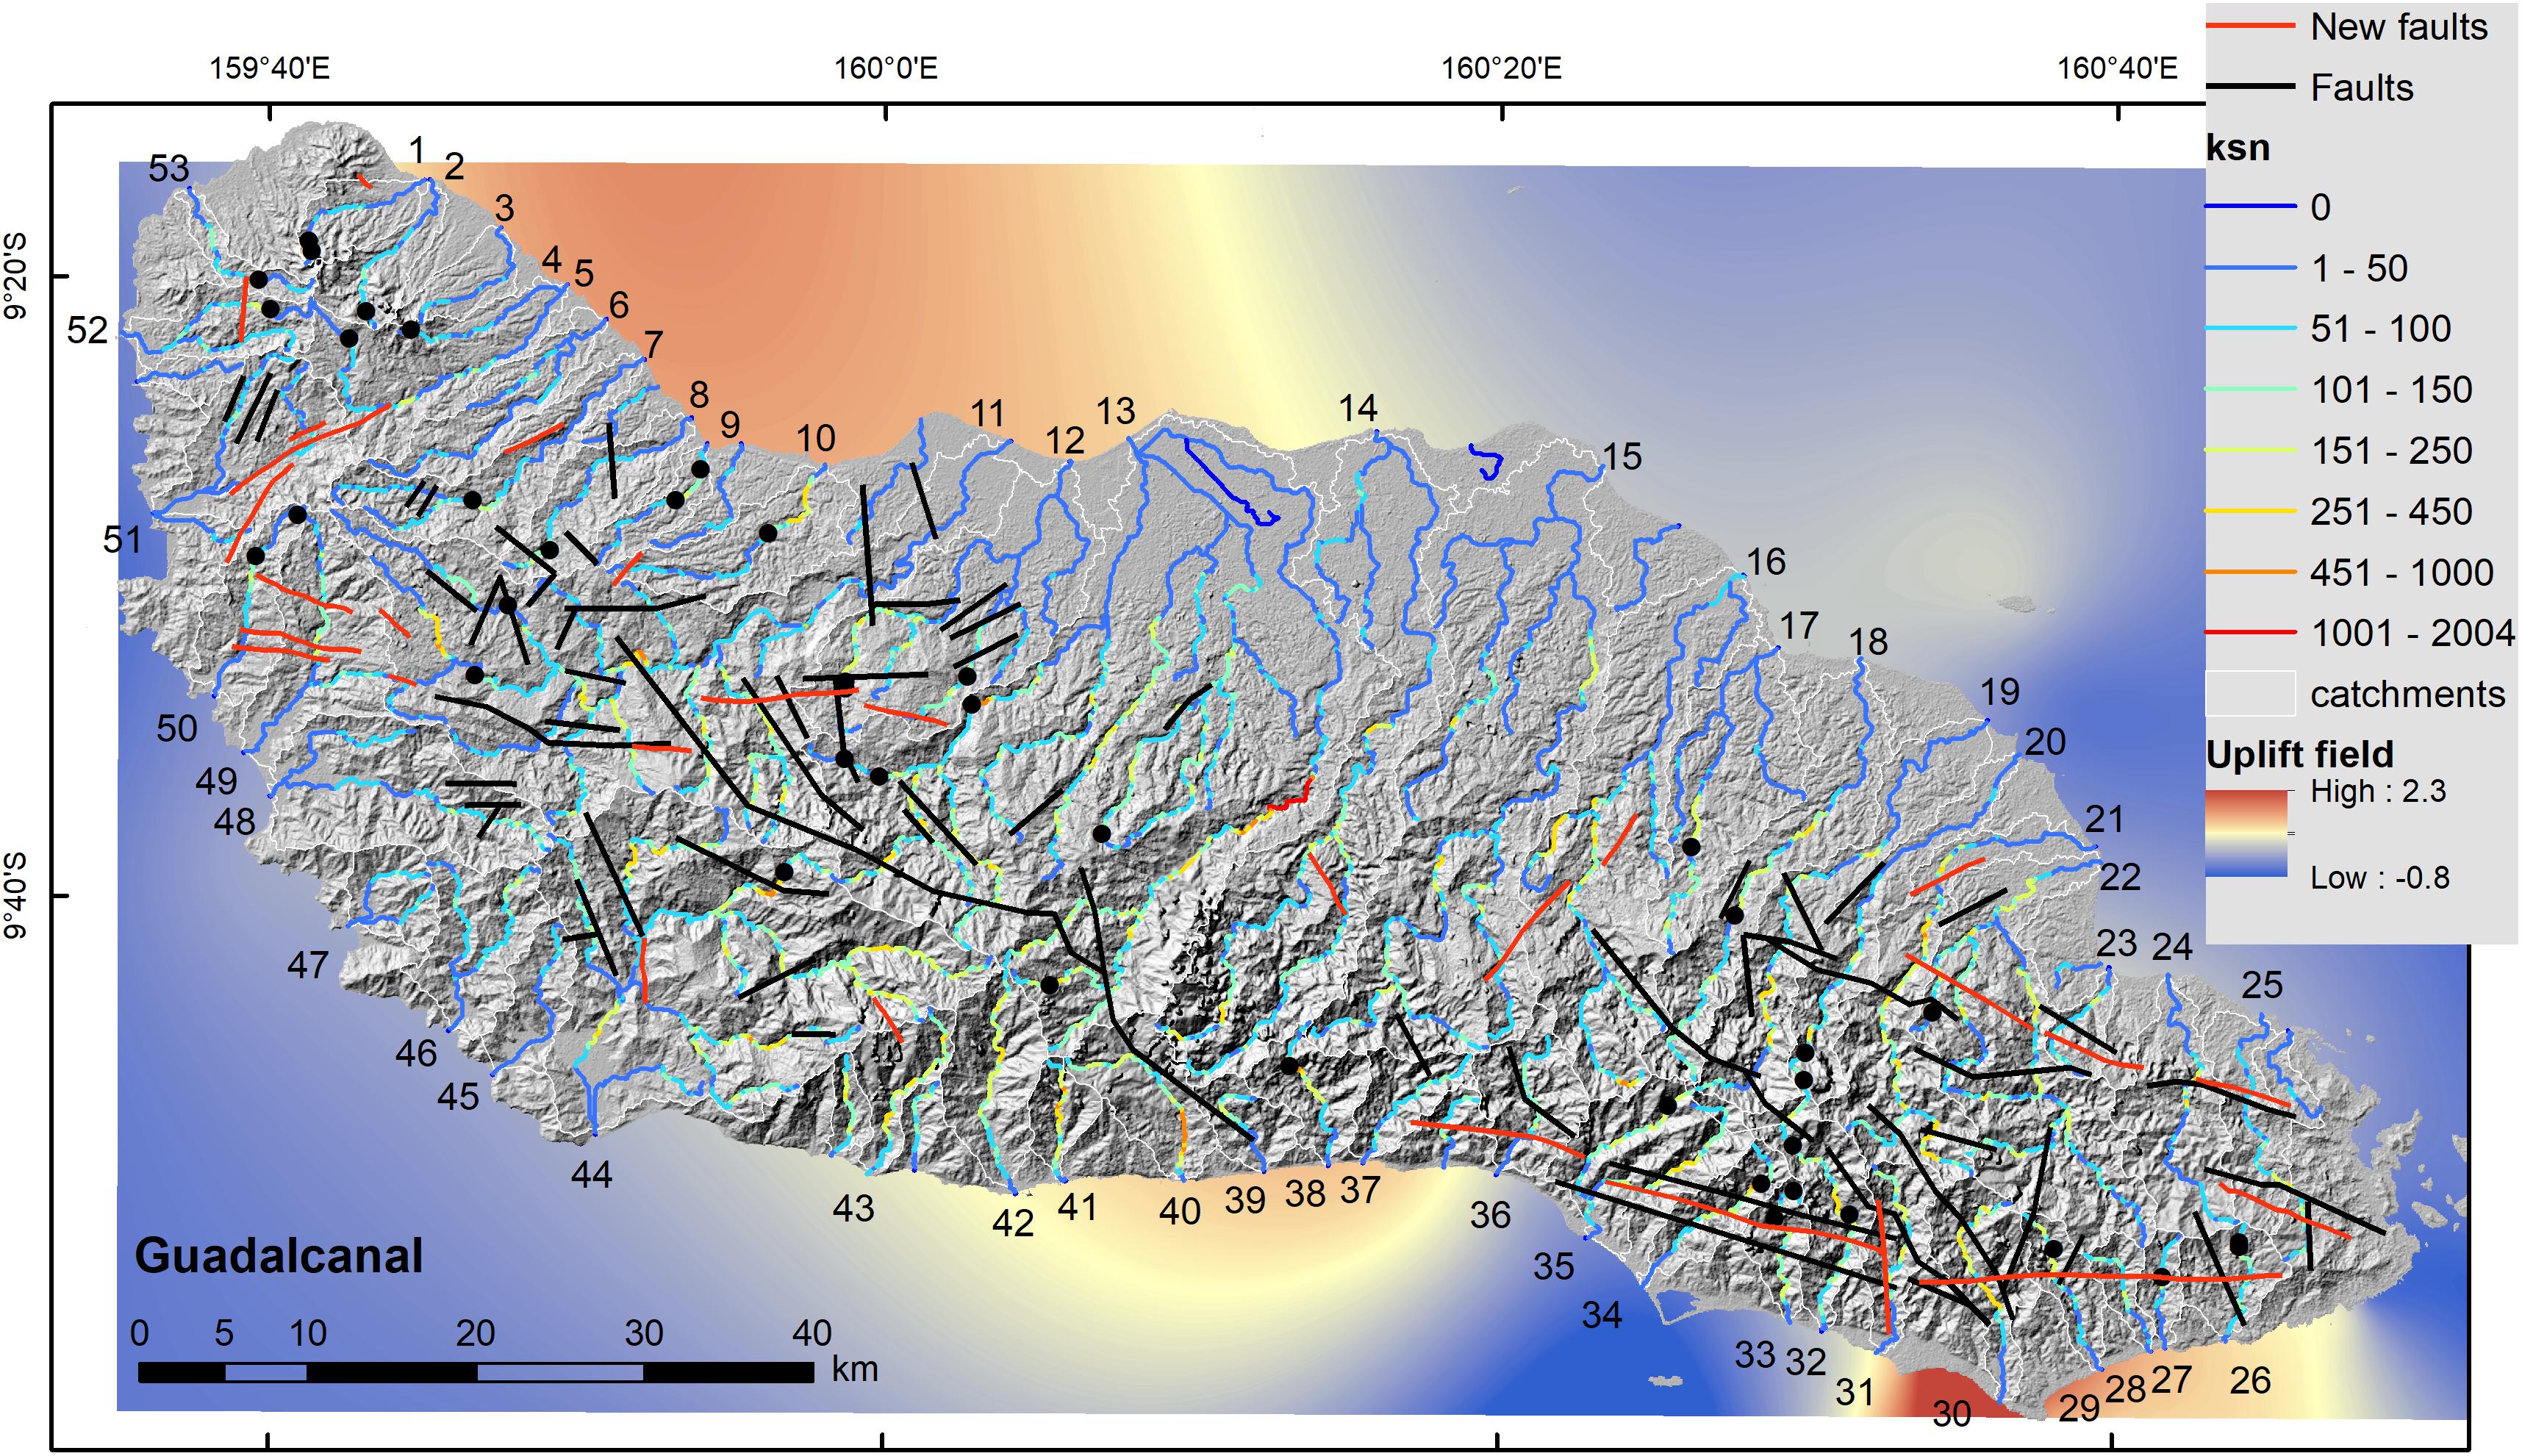
Figure 5. Hillshade map derived from the 30 m SRTM DEM (USGS, 2019) for the island of Guadalcanal showing the rivers extracted for analysis shaded by ksn, identified slope-break knickpoints (black circles), major faults identified from analysis of the DEM and based upon existing mapping data (Department of Geological Surveys, 1969) and the interpolated uplifted field.
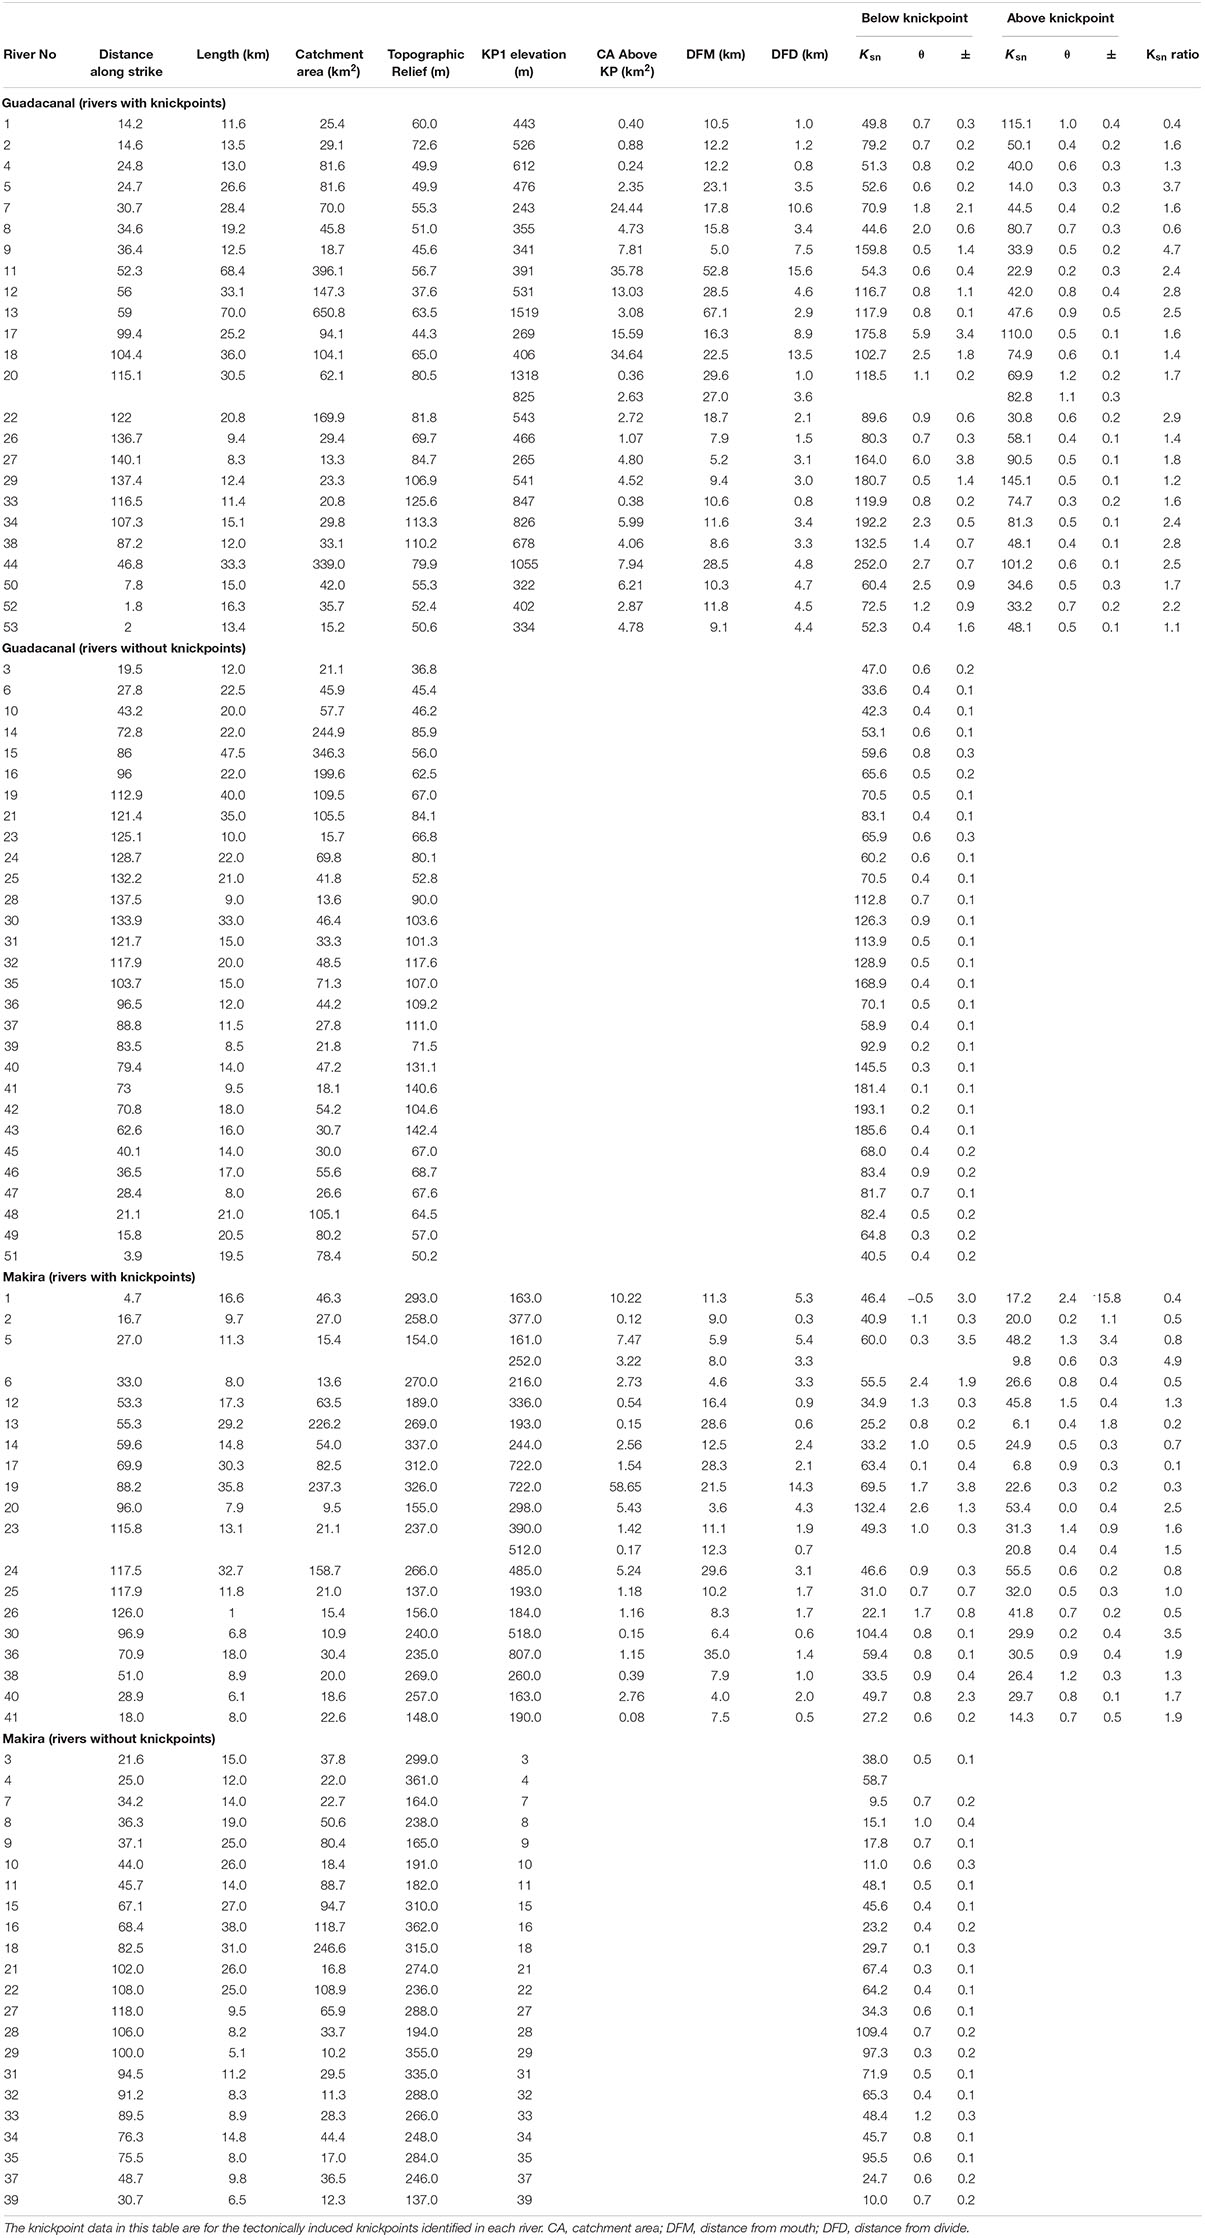
Table 1. Data extracted for the rivers considered in this study.
Rivers without knickpoints more commonly flow to the south coast of the island (18 rivers), than to the north (11 rivers). The average concavity (θ) for all rivers across the island is 0.49, with little variation between the southerly flowing rivers (θ = 0.46) and the northerly flowing ones (θ = 0.54). Whereas the steepness index does vary significantly between the south and north from 111.1 to 59.2 m0.9, respectively.
By contrast, rivers flowing northwards contain the majority of the knickpoints, where 14 rivers have a single prominent knickpoint, and rivers 1 and 20 have two clear knickpoints. Above the knickpoint (in the river headwaters) the average θ = 0.62 and the steepness index (ksn) = 58.9 m0.9; while downstream of the knickpoint, θ = 1.4 and ksn = 87.9 m0.9. A similar pattern is seen in the 10 rivers containing knickpoints that drain to the south, upstream of the knickpoint θ = 0.5 and ksn = 71.5 m0.9, while downstream θ = 0.8 and ksn = 130.7 m0.9. Therefore, there is a consistent pattern of over-steepened (θ > 0.8) rivers downstream of the knickpoint in both the northern and southern rivers, although in general the southern rivers are steeper and shorter than in the north. These rivers show the typical geometry of slope-break knickpoints and the location of mapped knickpoints does not clearly correlate with either mapped geological boundaries or faults.
Where there are two knickpoints observed in the river profiles this observation holds true for the higher knickpoint; whereas, for the lower elevation knickpoint there is a decrease in ksn downstream across the knickpoint. This knickpoint morphology is more characteristic of vertical-step knickpoints, with spike in the values on the SA plot. These knickpoints will not be considered further as it is likely that such knickpoints are the result of lithological discontinuities.
When analyzing slope-break knickpoint formation and behavior, the vertical and horizontal components of knickpoint retreat need to be considered. The horizontal knickpoint retreat distance was measured from the coast; in the absence of a clear causative fault, this datum provides a constant reference elevation with which to compare rivers within and across islands. When the upstream distance of the knickpoint is compared to the total drainage area (Figure 6A) of the catchment there is a good (r2 = 0.8) correlation between the two variables with a power law relationship (L ∼ A0.56), demonstrating that in larger river catchments the knickpoints have migrated further upstream, for example in river 13 with a drainage area of 650 km2 the knickpoint is 67 km upstream, whereas along river 8 with a catchment area of 45 km2 this knickpoint is ∼ 16 km upstream. This observation is consistent with observations from numerous other studies (e.g., Crosby and Whipple, 2006; Harkins et al., 2007; Miller et al., 2012; Whittaker and Boulton, 2012; Kent et al., 2017) and with theoretical predictions from simple stream power models (L = A0.5). A similar scaling relationship is observed between the downstream distance from the drainage divide and the catchment area upstream of the knickpoint (Figure 6B). It is important to note that knickpoints from northwards and southwards flowing rivers plot together and that there is no difference in the scaling relationships of the two groups.
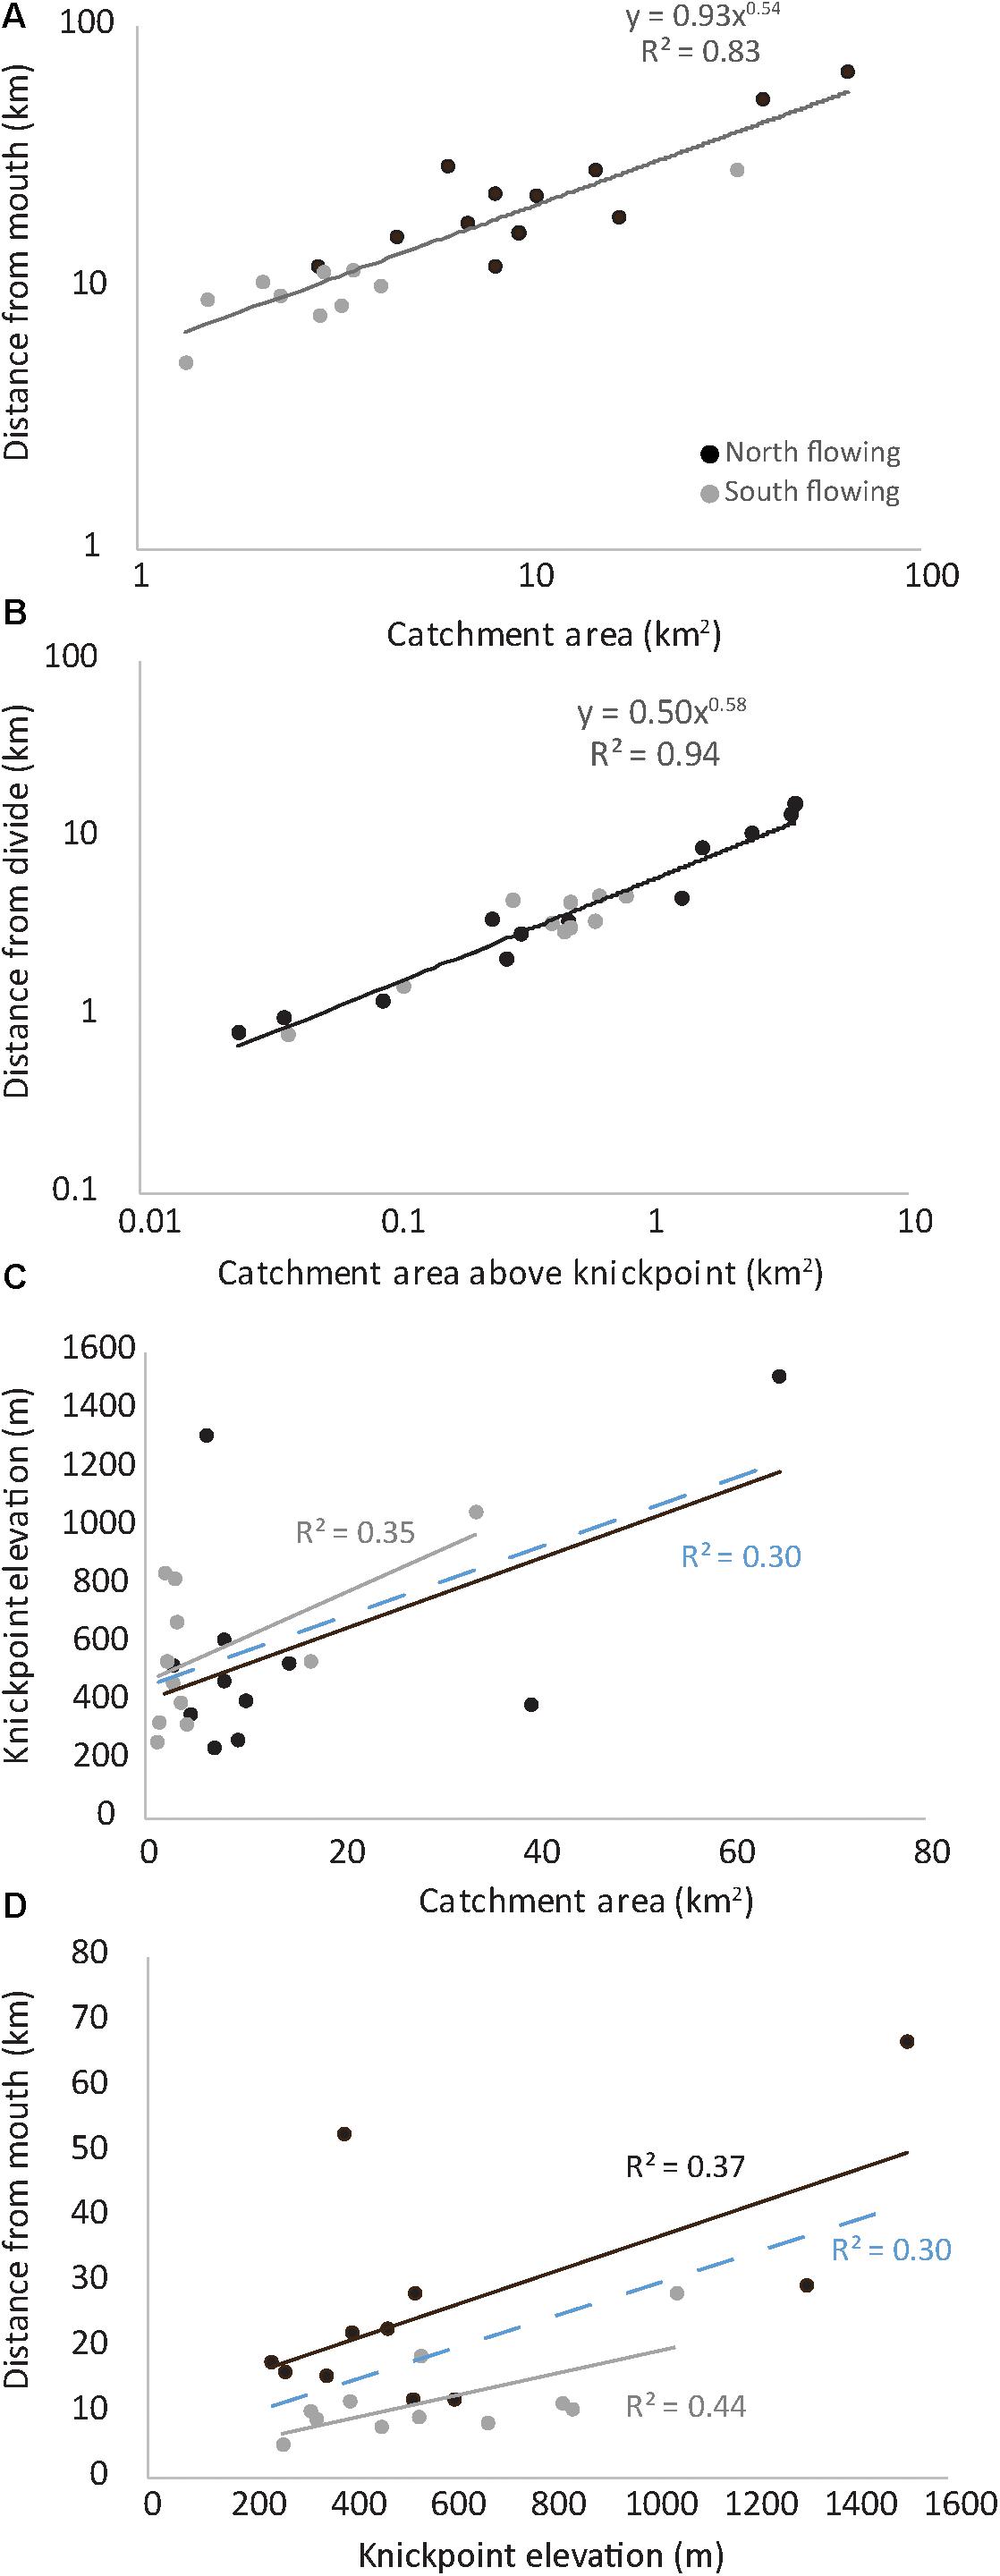
Figure 6. Graphs showing a range of knickpoint variables for Guadalcanal where black circles are knickpoints on north flowing rivers and gray are on south flowing rivers, similarly regression lines are black and gray for north and south rivers, respectively and the blue lines are for all data points. (A) Distance from mouth against total catchment area, (B) Distance from divide against catchment area above the knickpoint, (C) Knickpoint elevation (above sea-level) against total catchment area and (D) distance from mouth against knickpoint elevation.
When the relationship between the elevation of the slope-break knickpoints and the catchment areas of their rivers is examined (Figure 6C), to investigate the vertical component of knickpoint migration, there is a weak correlation (r2 = 0.3) between higher elevation knickpoints occurring in larger catchments across the whole island. Similarly, there is a weak relationship (r2 = 0.3) between the knickpoint elevation and the upstream distance of the knickpoint from the mouth of the river at sea-level (Figure 6D). When the upstream distance of knickpoints is compared between the rivers draining to the north and the south, this relationship is slightly strengthened (r2 = 0.37 and 0.44, respectively).
Yet, when the elevation of the knickpoints is considered along the strike of the island there is no clear distinction between the two sets of the knickpoints, with the majority of knickpoints falling in the 200 – 600 m above sea-level range with only six knickpoints found at higher elevations, present in rivers on both sides of the island (Figure 7). The majority of knickpoints appear to plot close to the average elevation along the island. When the ksn above and below the knickpoint is plotted along the strike of island both sides of the island show a general increase in steepness from the NW to the SE (Figure 8A) from 72 to 180 m0.9. While there is a clear separation in ksn values above and below identified knickpoints. It is interesting to note that ksn values from rivers without knickpoints span the whole range of the observed values. In addition, the ratio of ksn change from above to below the knickpoint is fairly constant along the length of the island and there is no clear trend in behavior (Figure 8B).
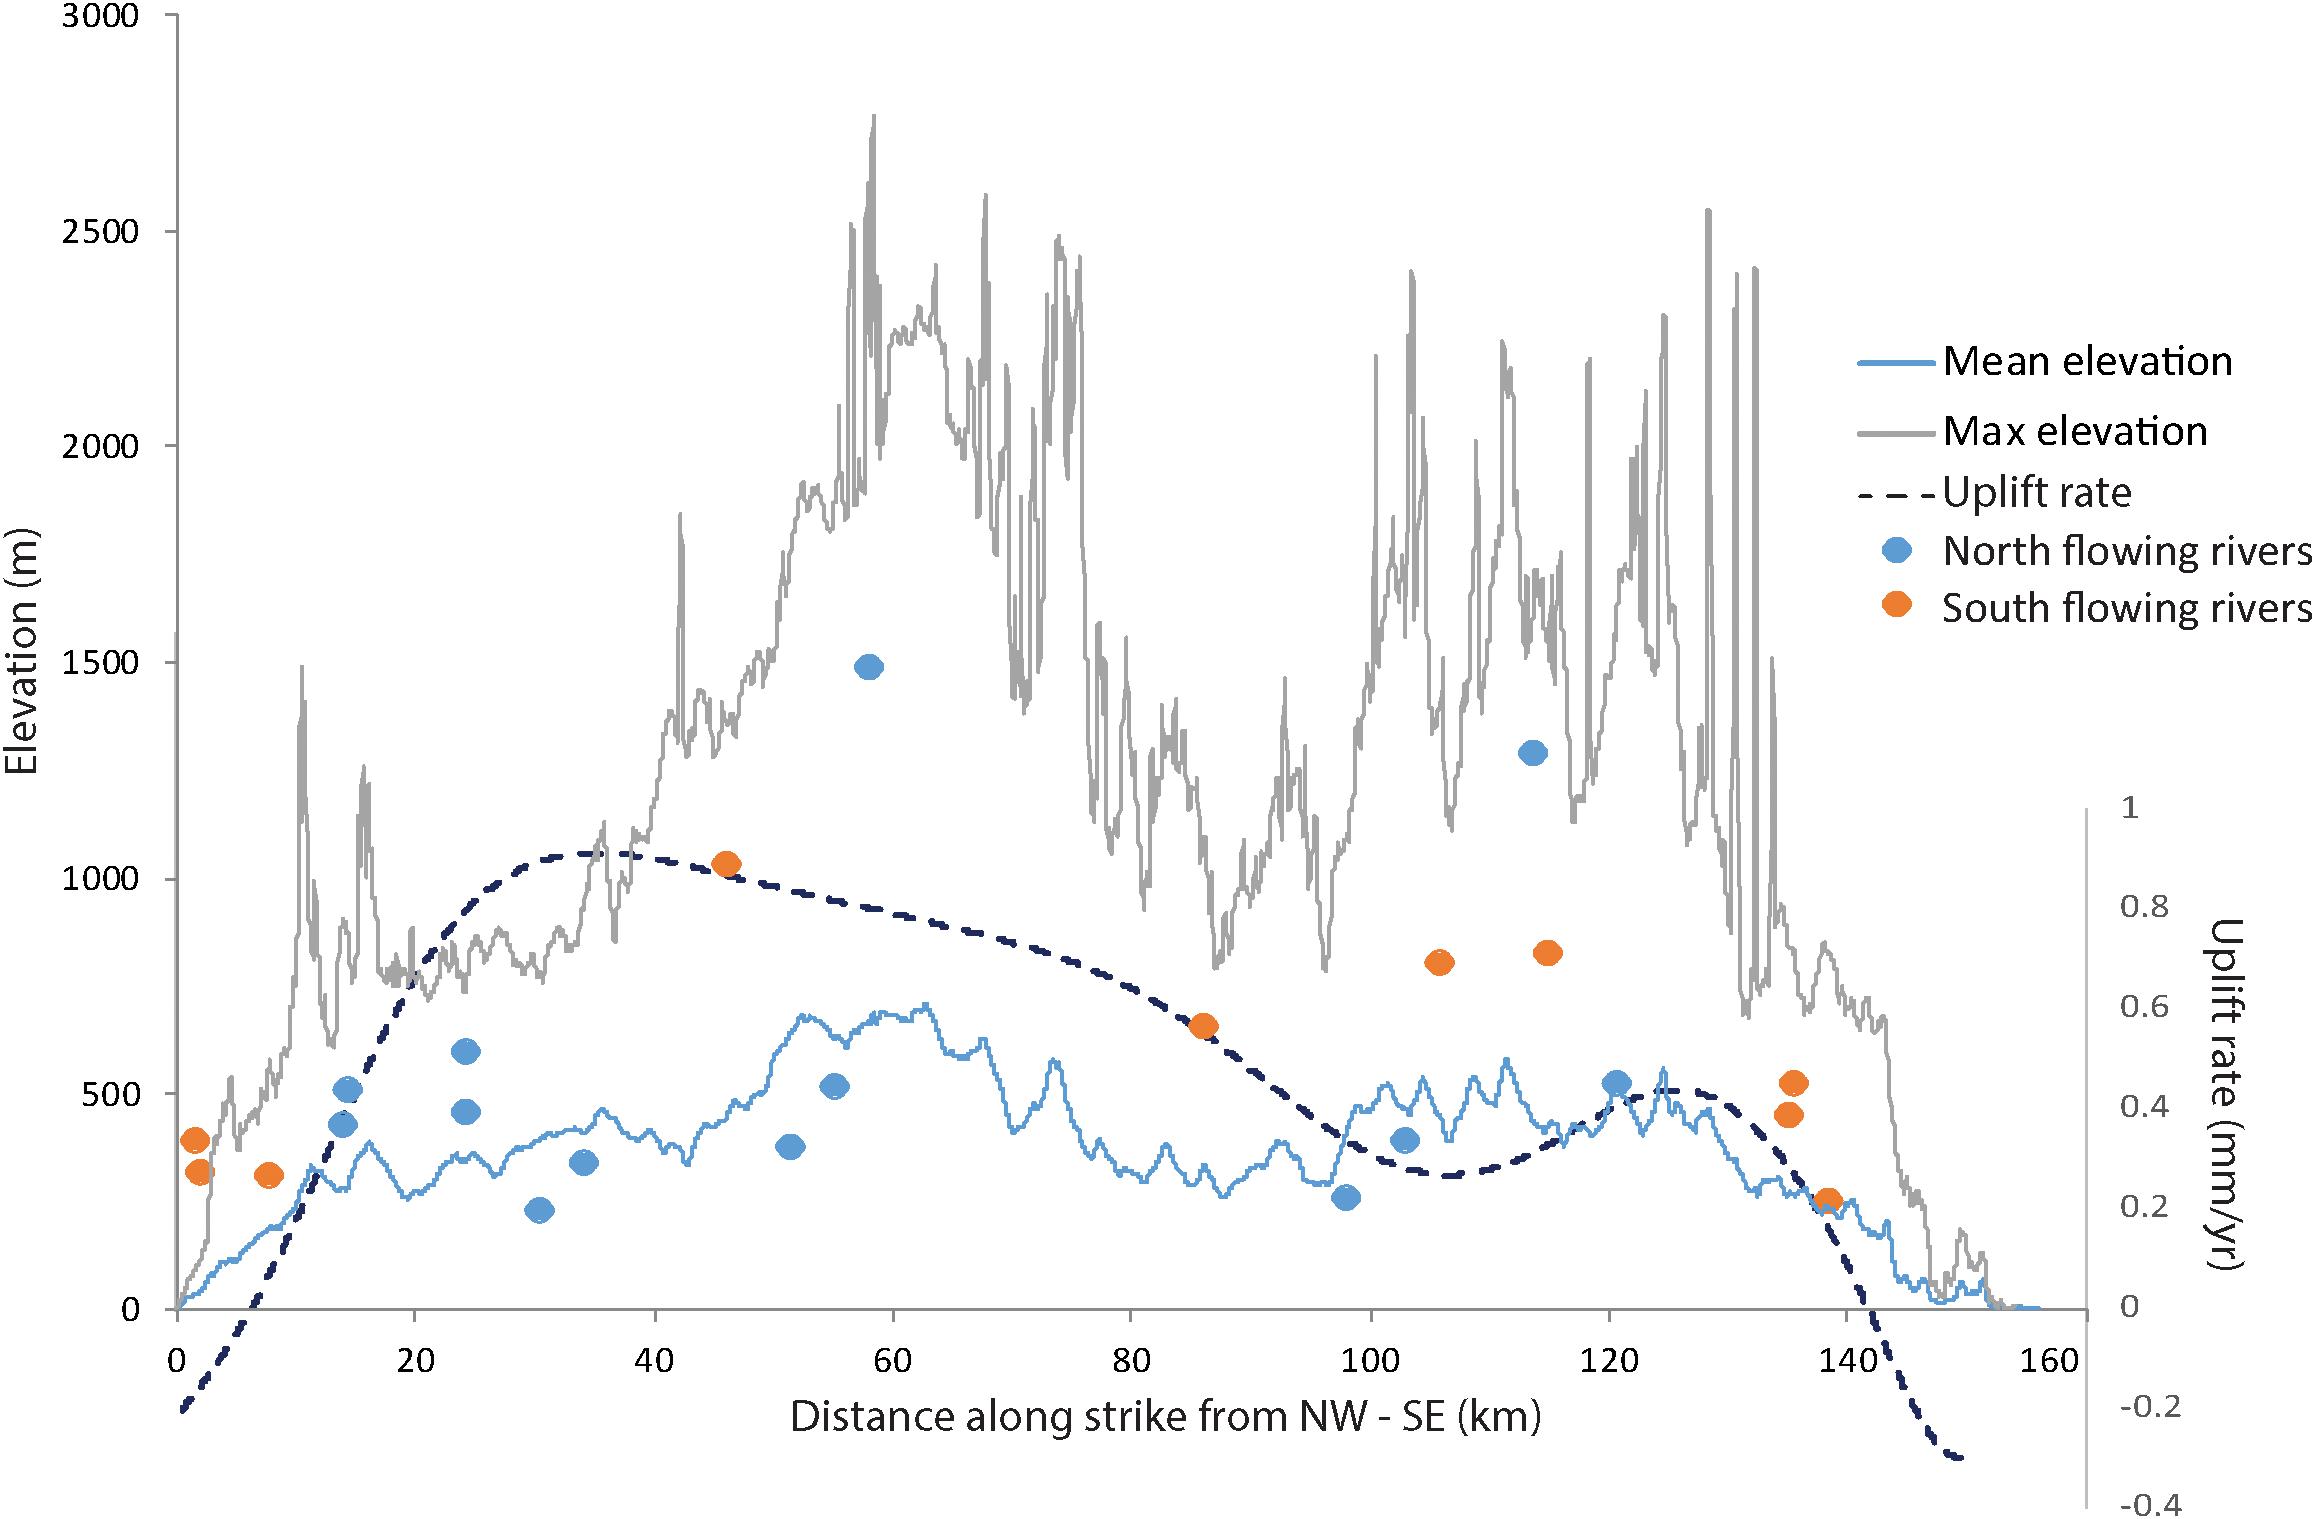
Figure 7. Graph showing the distance along the strike of the island axis from NW – SE against mean (blue) and maximum (gray) elevation, knickpoint elevation (blue north/orange south) and interpolated uplift field for the island of Guadalcanal. Note that the maximum elevation value are affected by errors in the DEM.
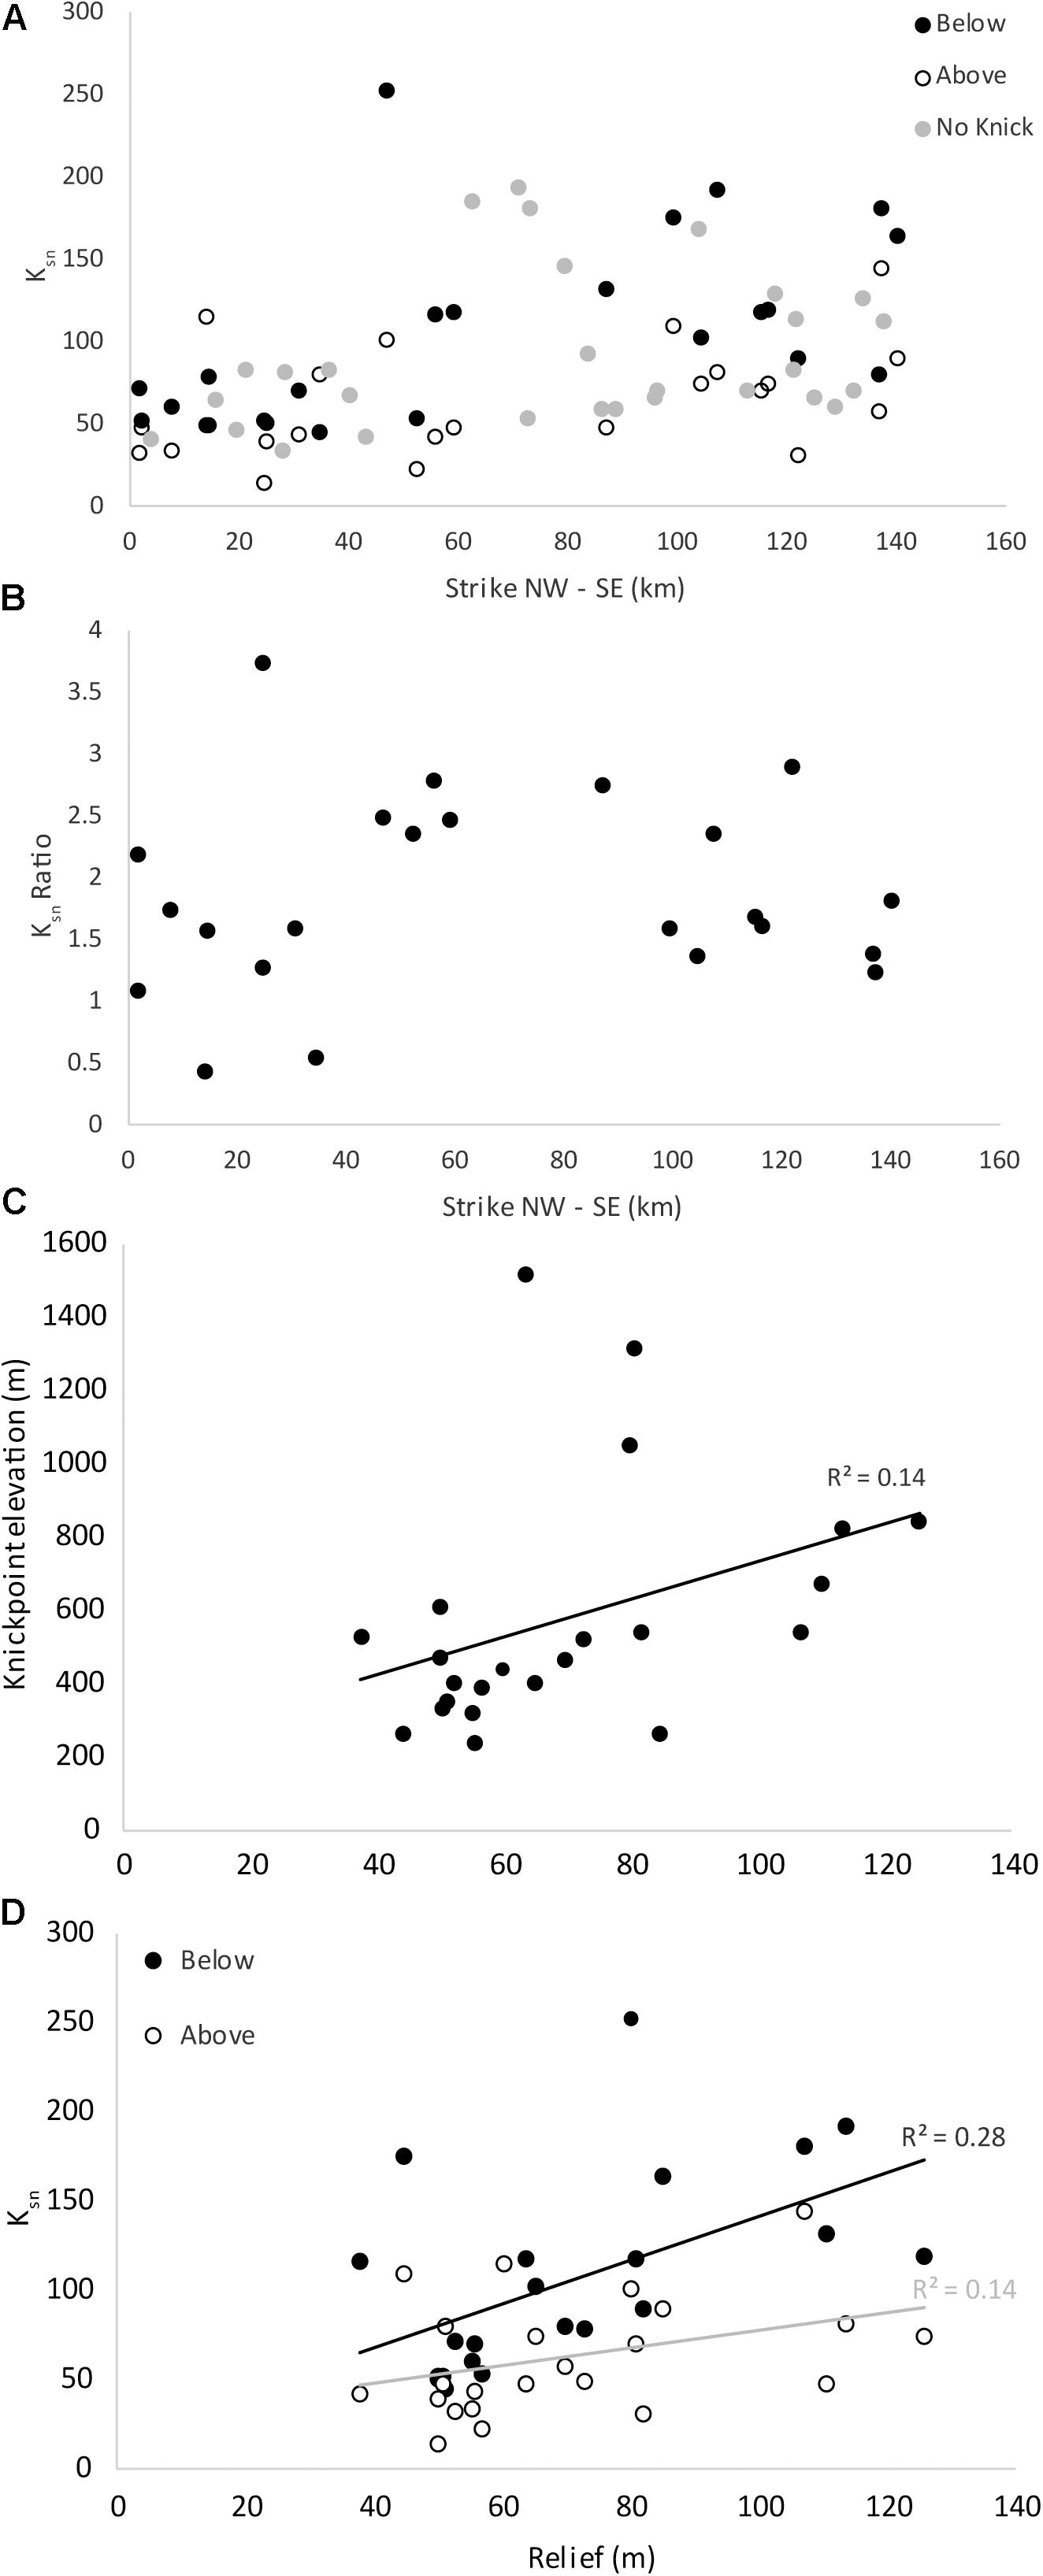
Figure 8. (A) Ksn against distance along strike of Guadalcanal showing the difference in value for the river above and below the knickpoints (where present) and ksn for the whole river (where knickpoints are absent). (B) Ksn ratio (below knickpoint/above knickpoint) of rivers with knickpoints along the island of Guadalcanal. (C) Knickpoint elevation and (D) Ksn against topographic relief for Guadalcanal.
When knickpoint elevation and ksn values are compared to the geomorphic relief of the topography it is apparent the both knickpoint height and ksn are higher where the topographic relief is greater (Figure 8C), although there is only a weak correlation (r2 = 0.28) between ksn downstream of knickpoints than between upstream values or overall knickpoint elevation (Figure 8D).
Makira Lineaments
In comparison to Guadalcanal there are fewer mapped structures on the published map of Makira (Department of Geological Surveys, 1969), 52 faults (Figure 9A) are shown with almost all located in the basement geology that dominates the island. The published faults are mainly NW-SE and E-W striking structures with minor ∼ N-S striking faults.
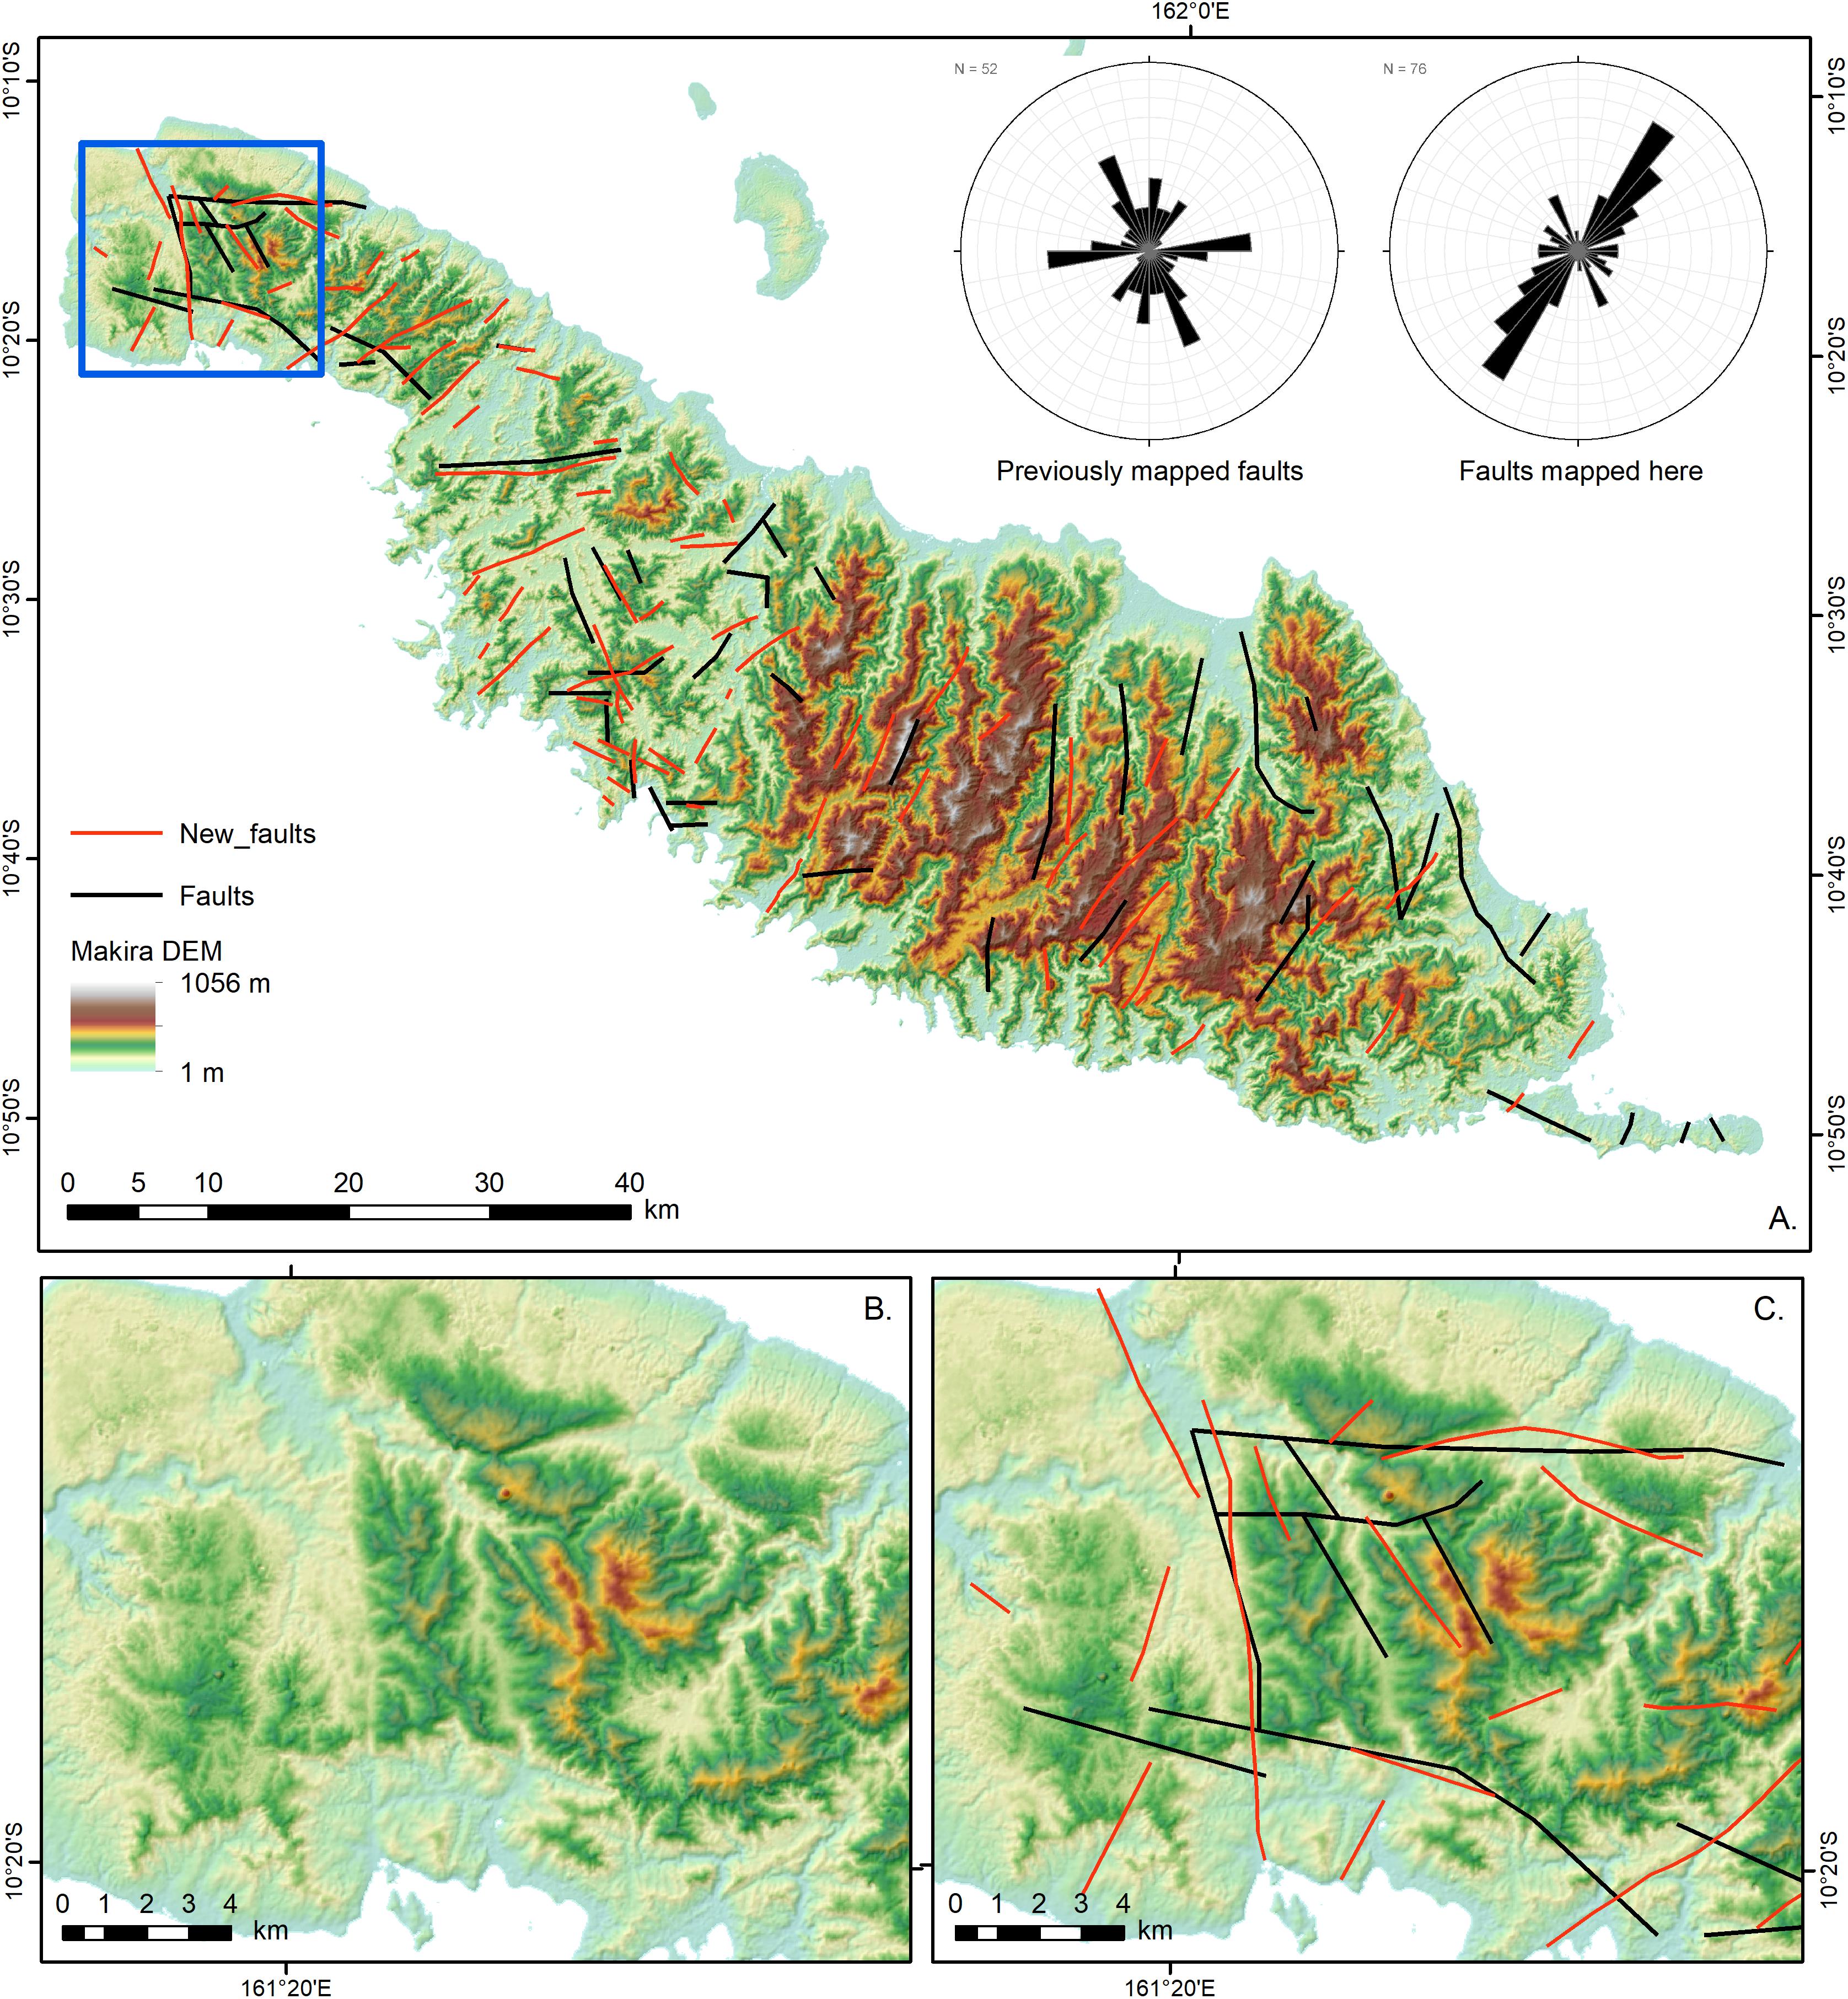
Figure 9. (A) ALOS World 3D 30 m DEM (©JAXA) of Makira showing existing faults from the published mapping data (Department of Geological Surveys, 1969) and inferred topographic lineaments, rose diagrams showing the orientations of both datasets are shown in the top right corner. (B,C) Raw and interpreted DEM for the area shown in the blue box on part (A).
A significant number of topographic lineaments were identified for Makira, with a total of 76 potential faults identified from the DEM (Figure 9). Many, such as those in the NW of the island (Figures 9B,C) have strong topographic expression, with changes in elevation, offset topographic features and aligned river systems along the strike of the features. The majority of these topographic lineaments strike NE-SW across the whole island, although structures striking E-W/NW-SE are more common in the western part of the island and could be conjugate structures to the dominant NE-SW striking features. As for Guadalcanal, some lineaments with topographic expression are coincident with previously mapped faults but many are newly recognized here.
Makira Rivers
The island of Makira is a similar size to Guadalcanal, although fewer large rivers are present on this island. In total 41 rivers were analyzed with 26 draining to the north coast and 15 flowing to the south (Figure 10, Table 1, and Supplementary Figure S2). The average length of the rivers is greater for northward than for southward flowing rivers, at 35.7 and 15.3 km, respectively. Nineteen rivers show clear knickpoints along their profile, with 10 draining northwards and only 5 rivers draining to the south exhibiting knickpoints.
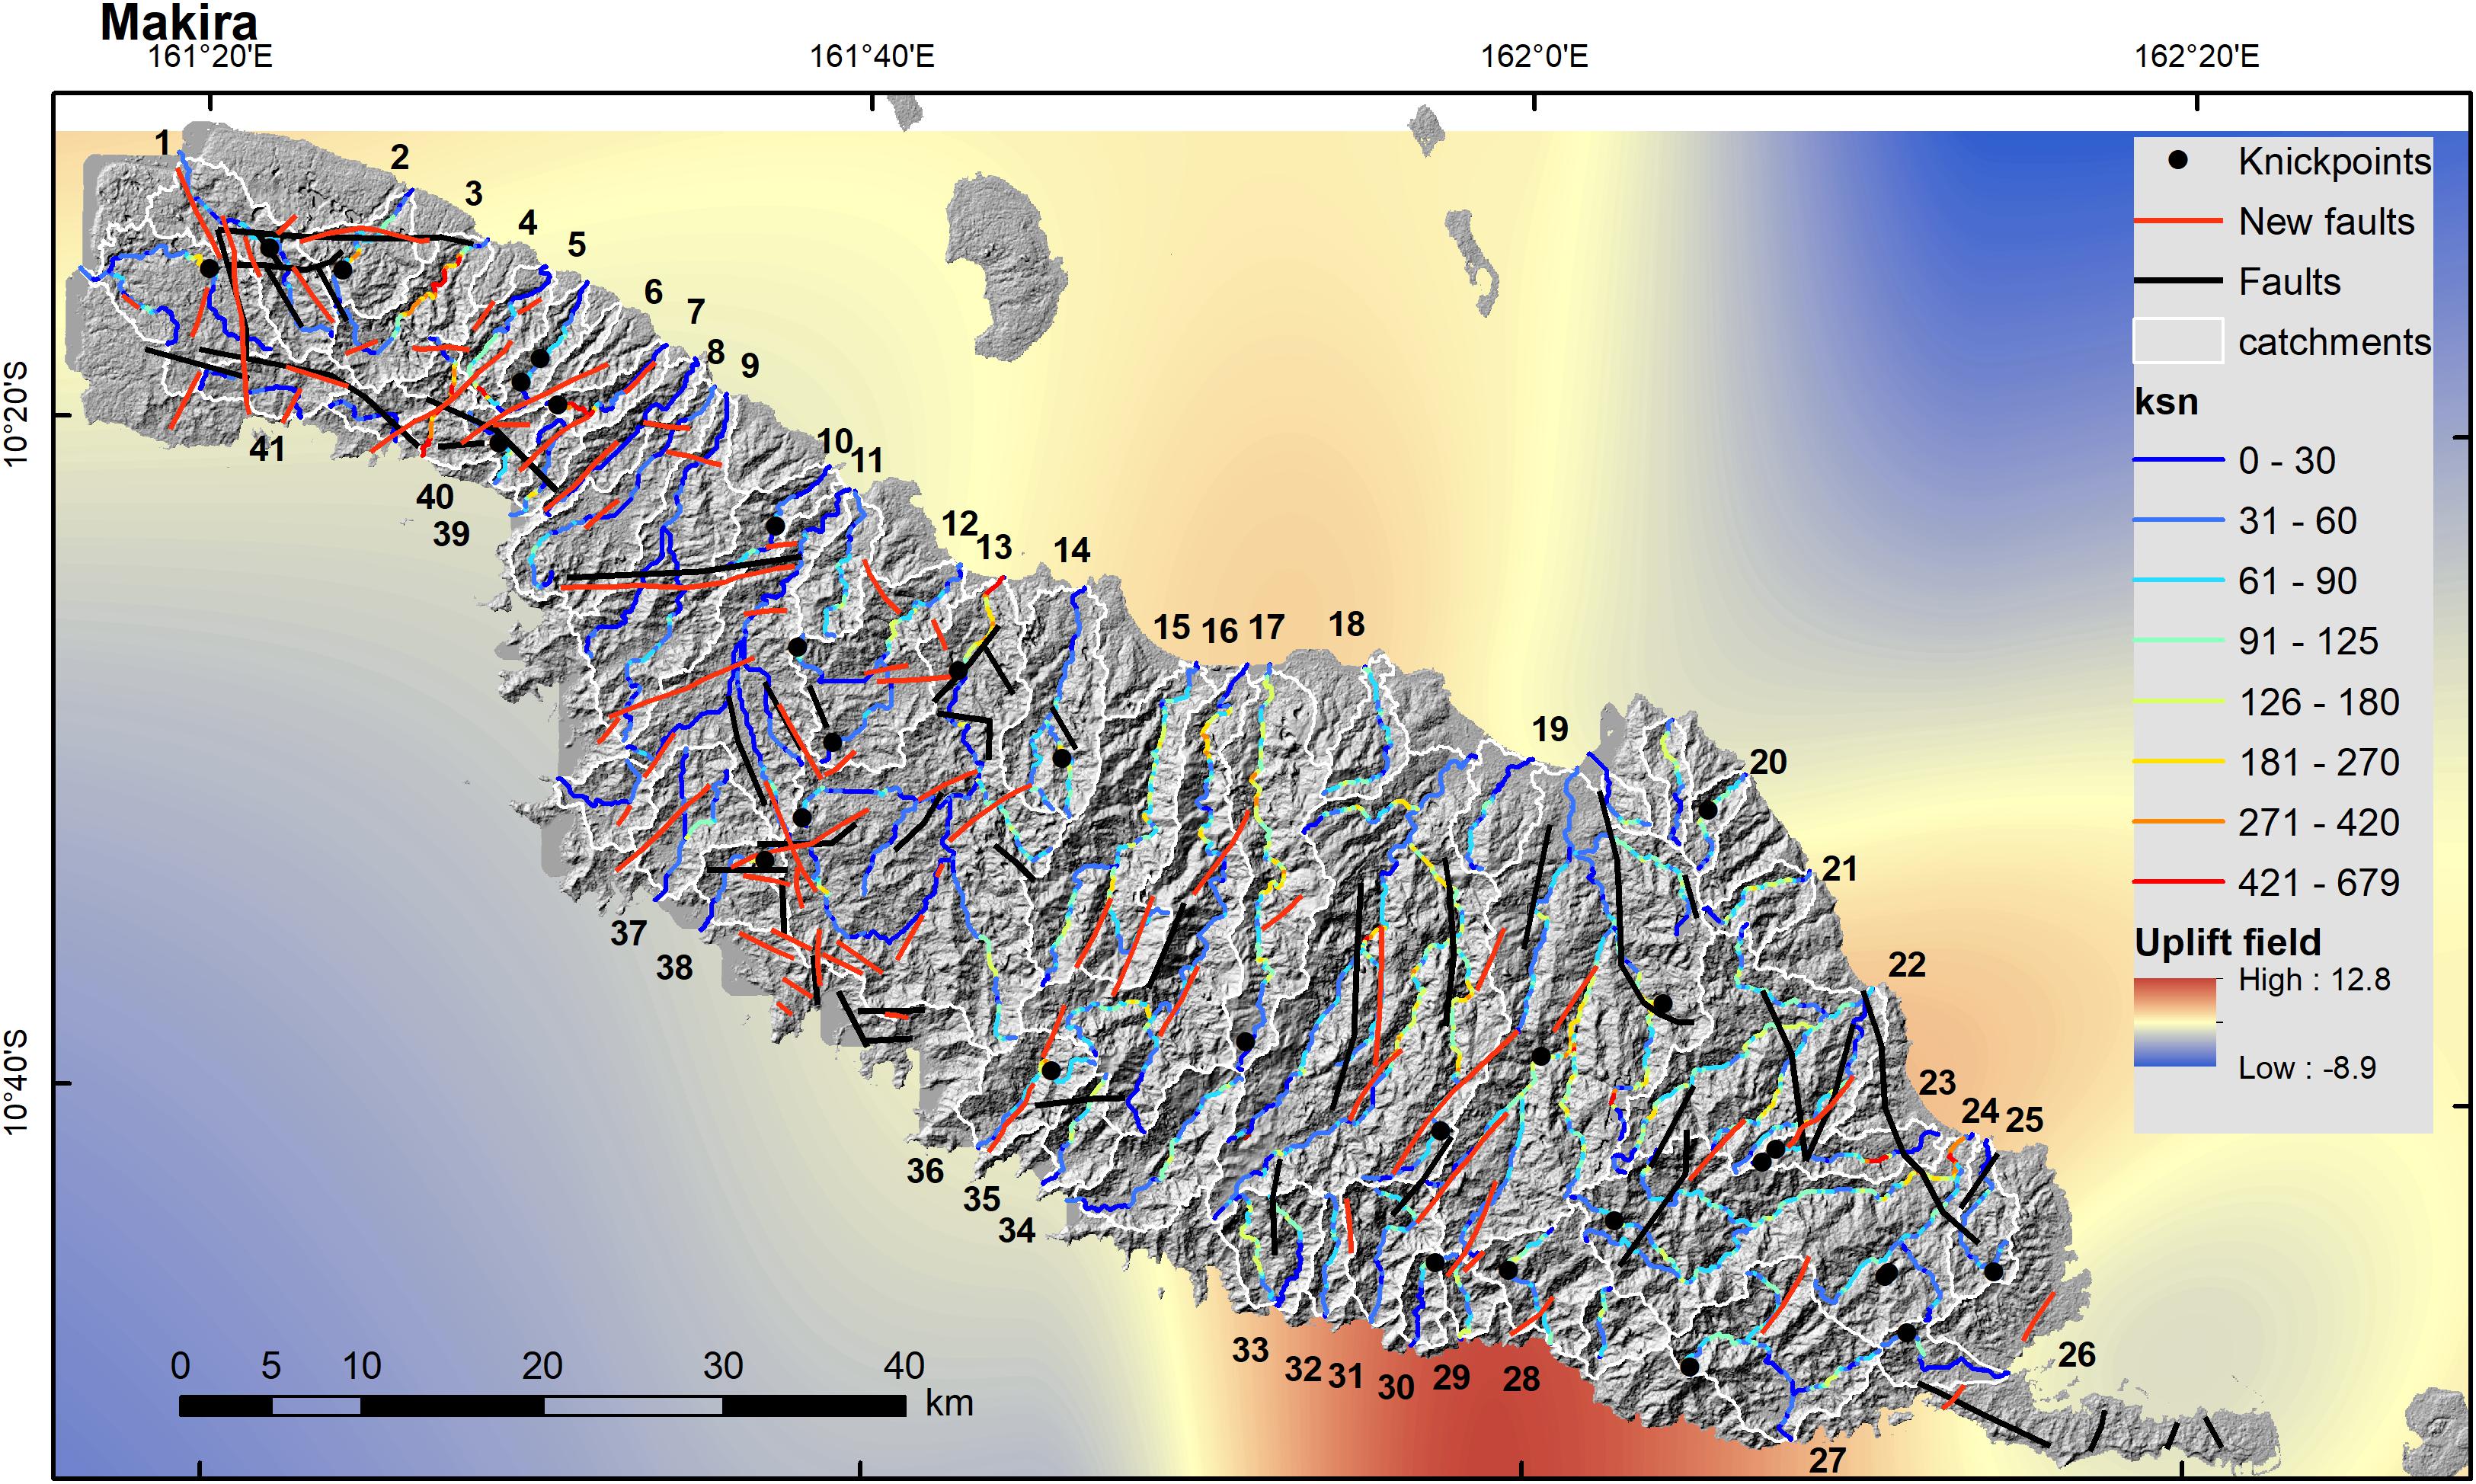
Figure 10. Hillshade map derived from the 30 m SRTM DEM (USGS, 2019) for the island of Makira showing the rivers extracted for analysis shaded by ksn, identified slope-break knickpoints (black circles) and major faults identified from analysis of the DEM and based upon existing mapping data (Department of Geological Surveys, 1969).
The average concavity (θ) for all rivers across the island that do not have knickpoints is 0.57, with some variation between the southerly flowing rivers (θ = 0.64) and the northerly flowing ones (θ = 0.5). Similarly, the steepness index varies between the south and north from 60.2 to 35.7 m0.9, respectively, consistent with the southern rivers being steeper than northern rivers. This relationship was also observed on Guadalcanal to the north.
Rivers flowing northwards contain the majority of the knickpoints, where most rivers have a single prominent knickpoint, and rivers 5 and 23 have two clear knickpoints. Above the knickpoint (in the river headwaters) the average θ = 0.78 and ksn = 28.9 m0.9 and downstream of the knickpoint, θ = 1.1 and ksn = 50.8 m0.9. A similar pattern is seen in the five rivers containing knickpoints that drain to the south, upstream of the knickpoint θ = 0.79 and ksn = 26.1 m0.9, while downstream θ = 0.8 and ksn = 54.8 m0.9. Therefore, there is a consistent pattern of steeper rivers downstream of the knickpoint in both the northern and southern rivers, although in general the concavity of the rivers above and below knickpoints is similar but overall higher than in the rivers without knickpoints. In addition, the location of these knickpoints does not clearly correlate with mapped geological boundaries with the majority of knickpoints falling within the older igneous and volcanic complex. Although some knickpoints do appear to fall close to faults, overall these characteristics are typical of slope-break knickpoints.
When the upstream distance of the knickpoint is compared to the total drainage area (Figure 11A) of the catchment there is a good (r2 = 0.7) correlation between the two variables with a power law relationship (L ∼ A0.57), demonstrating that in larger river catchments the knickpoints have migrated further upstream. Rivers flowing to the north and south plot in the same field demonstrating a similarity in behavior across the island. Interestingly this relationship is virtually the same as for Guadalcanal (Figure 6A), although for the Makira the correlation is not quite so strong. The scaling relationship between knickpoint distance from divide and the catchment area above the knickpoint also shows a strong correlation (r2 = 0.96) consistent with theoretical models of stream power (Figure 11B).
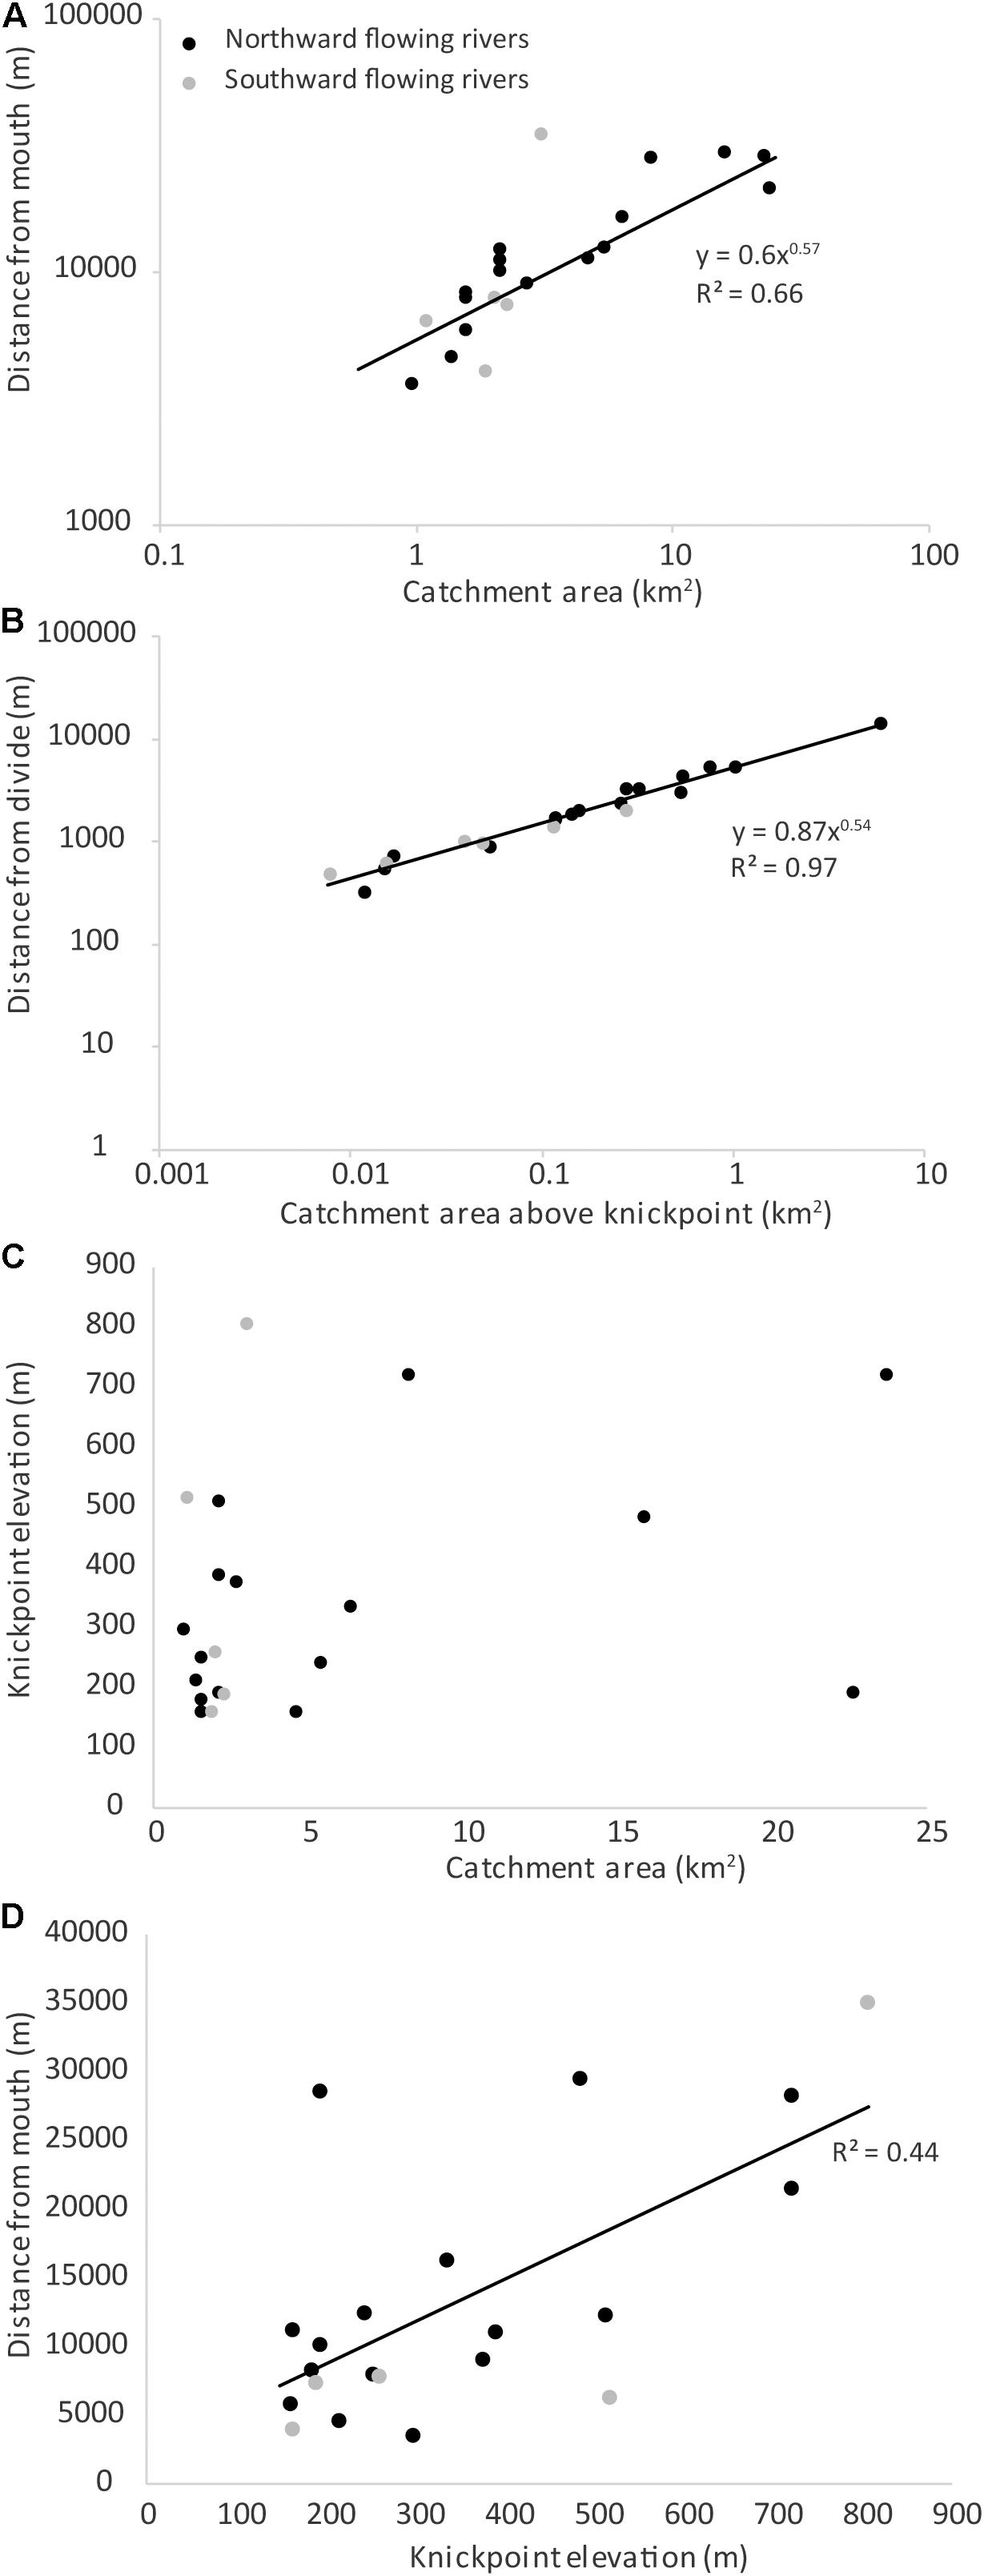
Figure 11. Graphs showing a range of knickpoint variables for Makira where black circles are knickpoints on north flowing rivers and gray are on south flowing rivers. (A) Distance from mouth against total catchment area, (B) Distance from divide against catchment area above the knickpoint, (C) Knickpoint elevation (above sea-level) against total catchment area and (D) distance from mouth against knickpoint elevation.
In contrast to Guadalcanal there is no clear relationship between catchment area and ksn (Figure 11C), although in general knickpoint elevation does increase as the distance from the river mouth increases (Figure 11D). This pattern becomes stronger when the knickpoint elevation is considered along the strike of the island (Figure 12). In the northern 60 km of the island, the maximum elevation of the topography is ∼600 m, while mean elevation is ∼200 m. The elevations of knickpoints reflect the overall topography ranging from 160–380 m in elevation, the majority of the knickpoints fall around the mean elevation of the topography with few sitting high up in the catchments. Whereas, in the central part of the island maximum and mean elevations increase, with maximum elevations reaching > 1000 m. Here knickpoints are mostly high in elevation located near the maximum elevation. Interestingly for the island of Makira there is a clear relationship between the topography and the interpolated uplift rates, with the lower topography found in the north and south of the island correlating with zones of subsidence or low rates of uplift. The inflection points between areas of subsidence and uplift closely correspond to the margins of the topographically higher central part of the island, where uplift rates reach > 0.6 mm/yr (Chen et al., 2011).
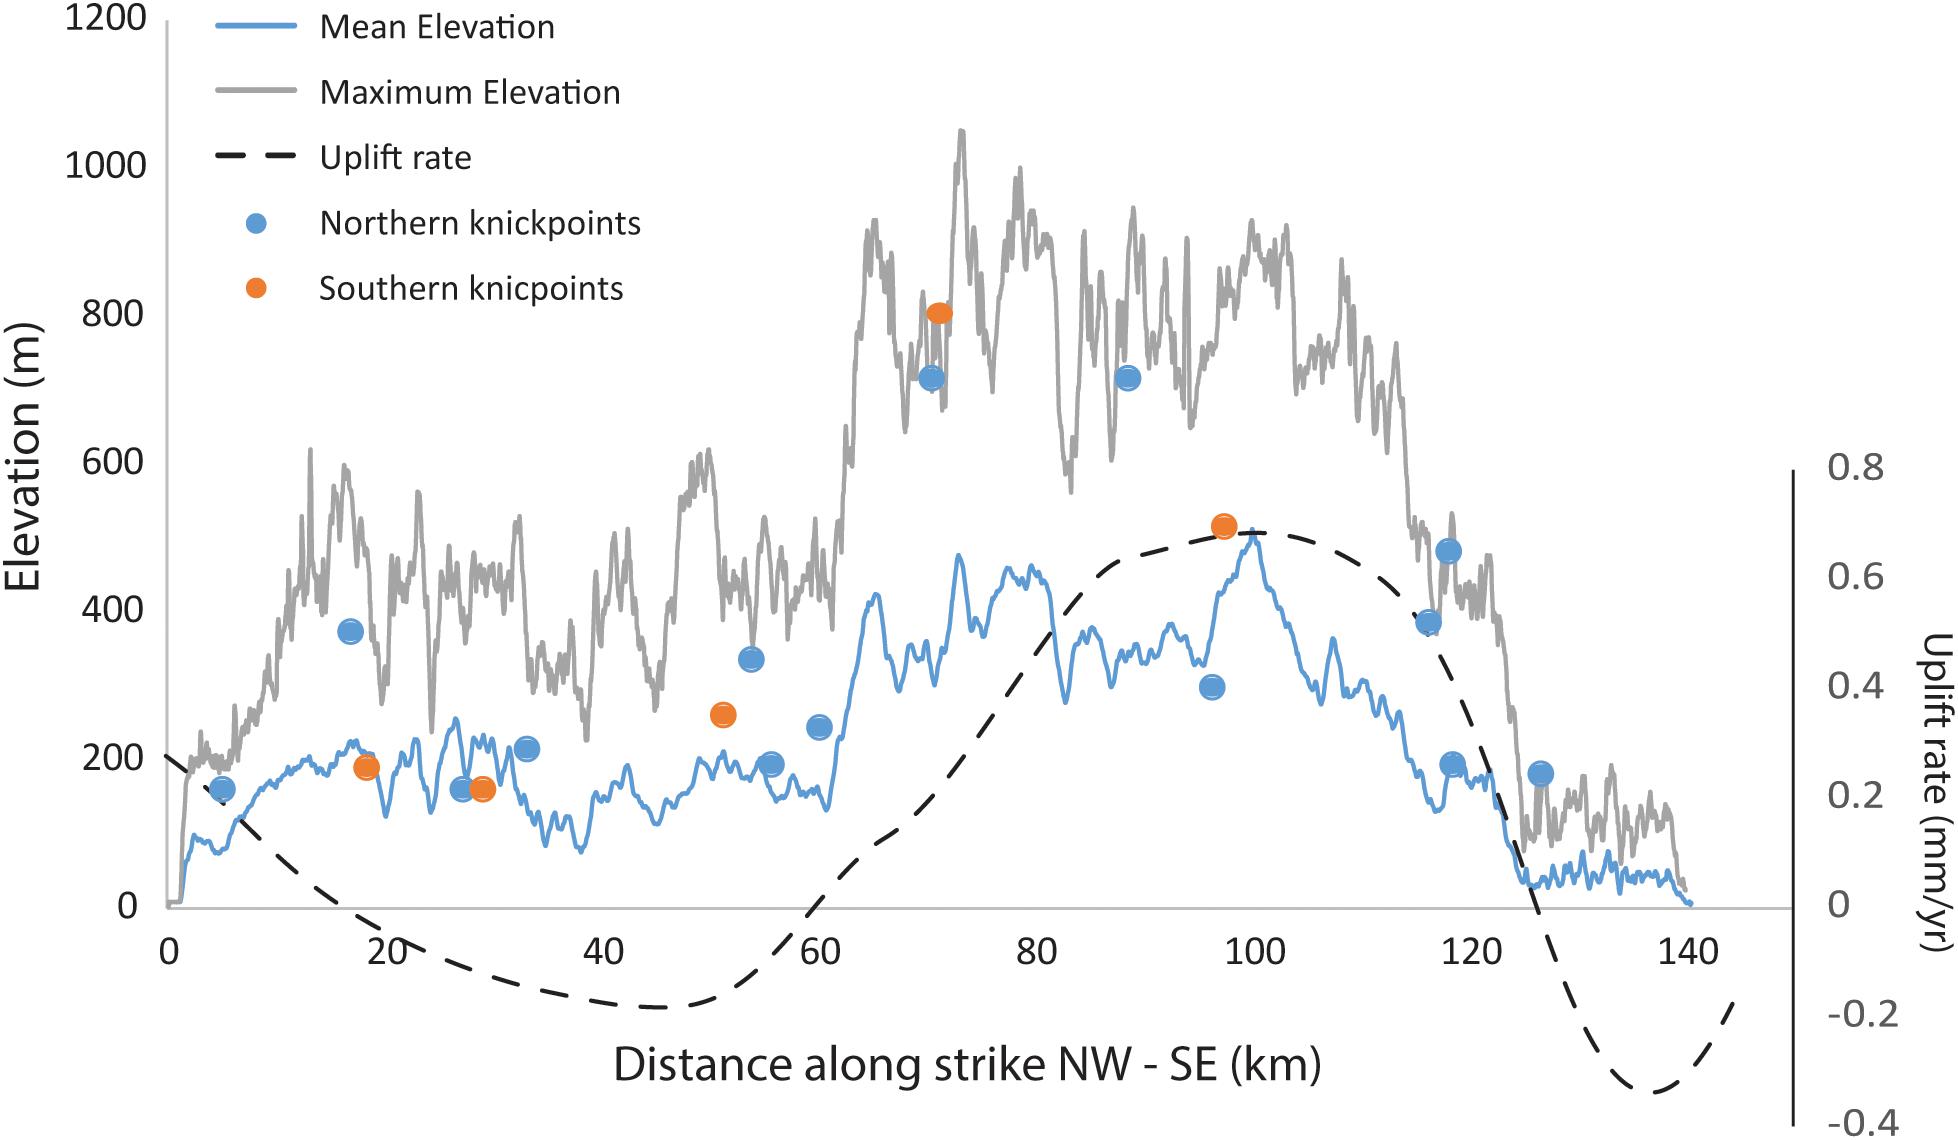
Figure 12. Graph showing the distance along the strike of the island axis from NW – SE against mean (blue) and maximum (gray) elevation, knickpoint elevation (blue north/orange south) and interpolated uplift field for the island of Makira.
When the ksn values are considered along the strike of the island (Figure 13A) a similar pattern is observed, with values above and below the knickpoint generally lower in the north and extreme south, while they are up to two times higher in the south central part of the island. This trend is not as clear in the ratio between steepness index above and below the knickpoint but interestingly ksn ratios are higher in southern catchments than in northern ones (Figure 13B). However, when topographic relief is considered there is only a weak positive trend with knickpoint elevation (Figure 13C). No trend is apparent with relief is compared to ksn, with ksn being rather invariant with respect to relief (Figure 13D).
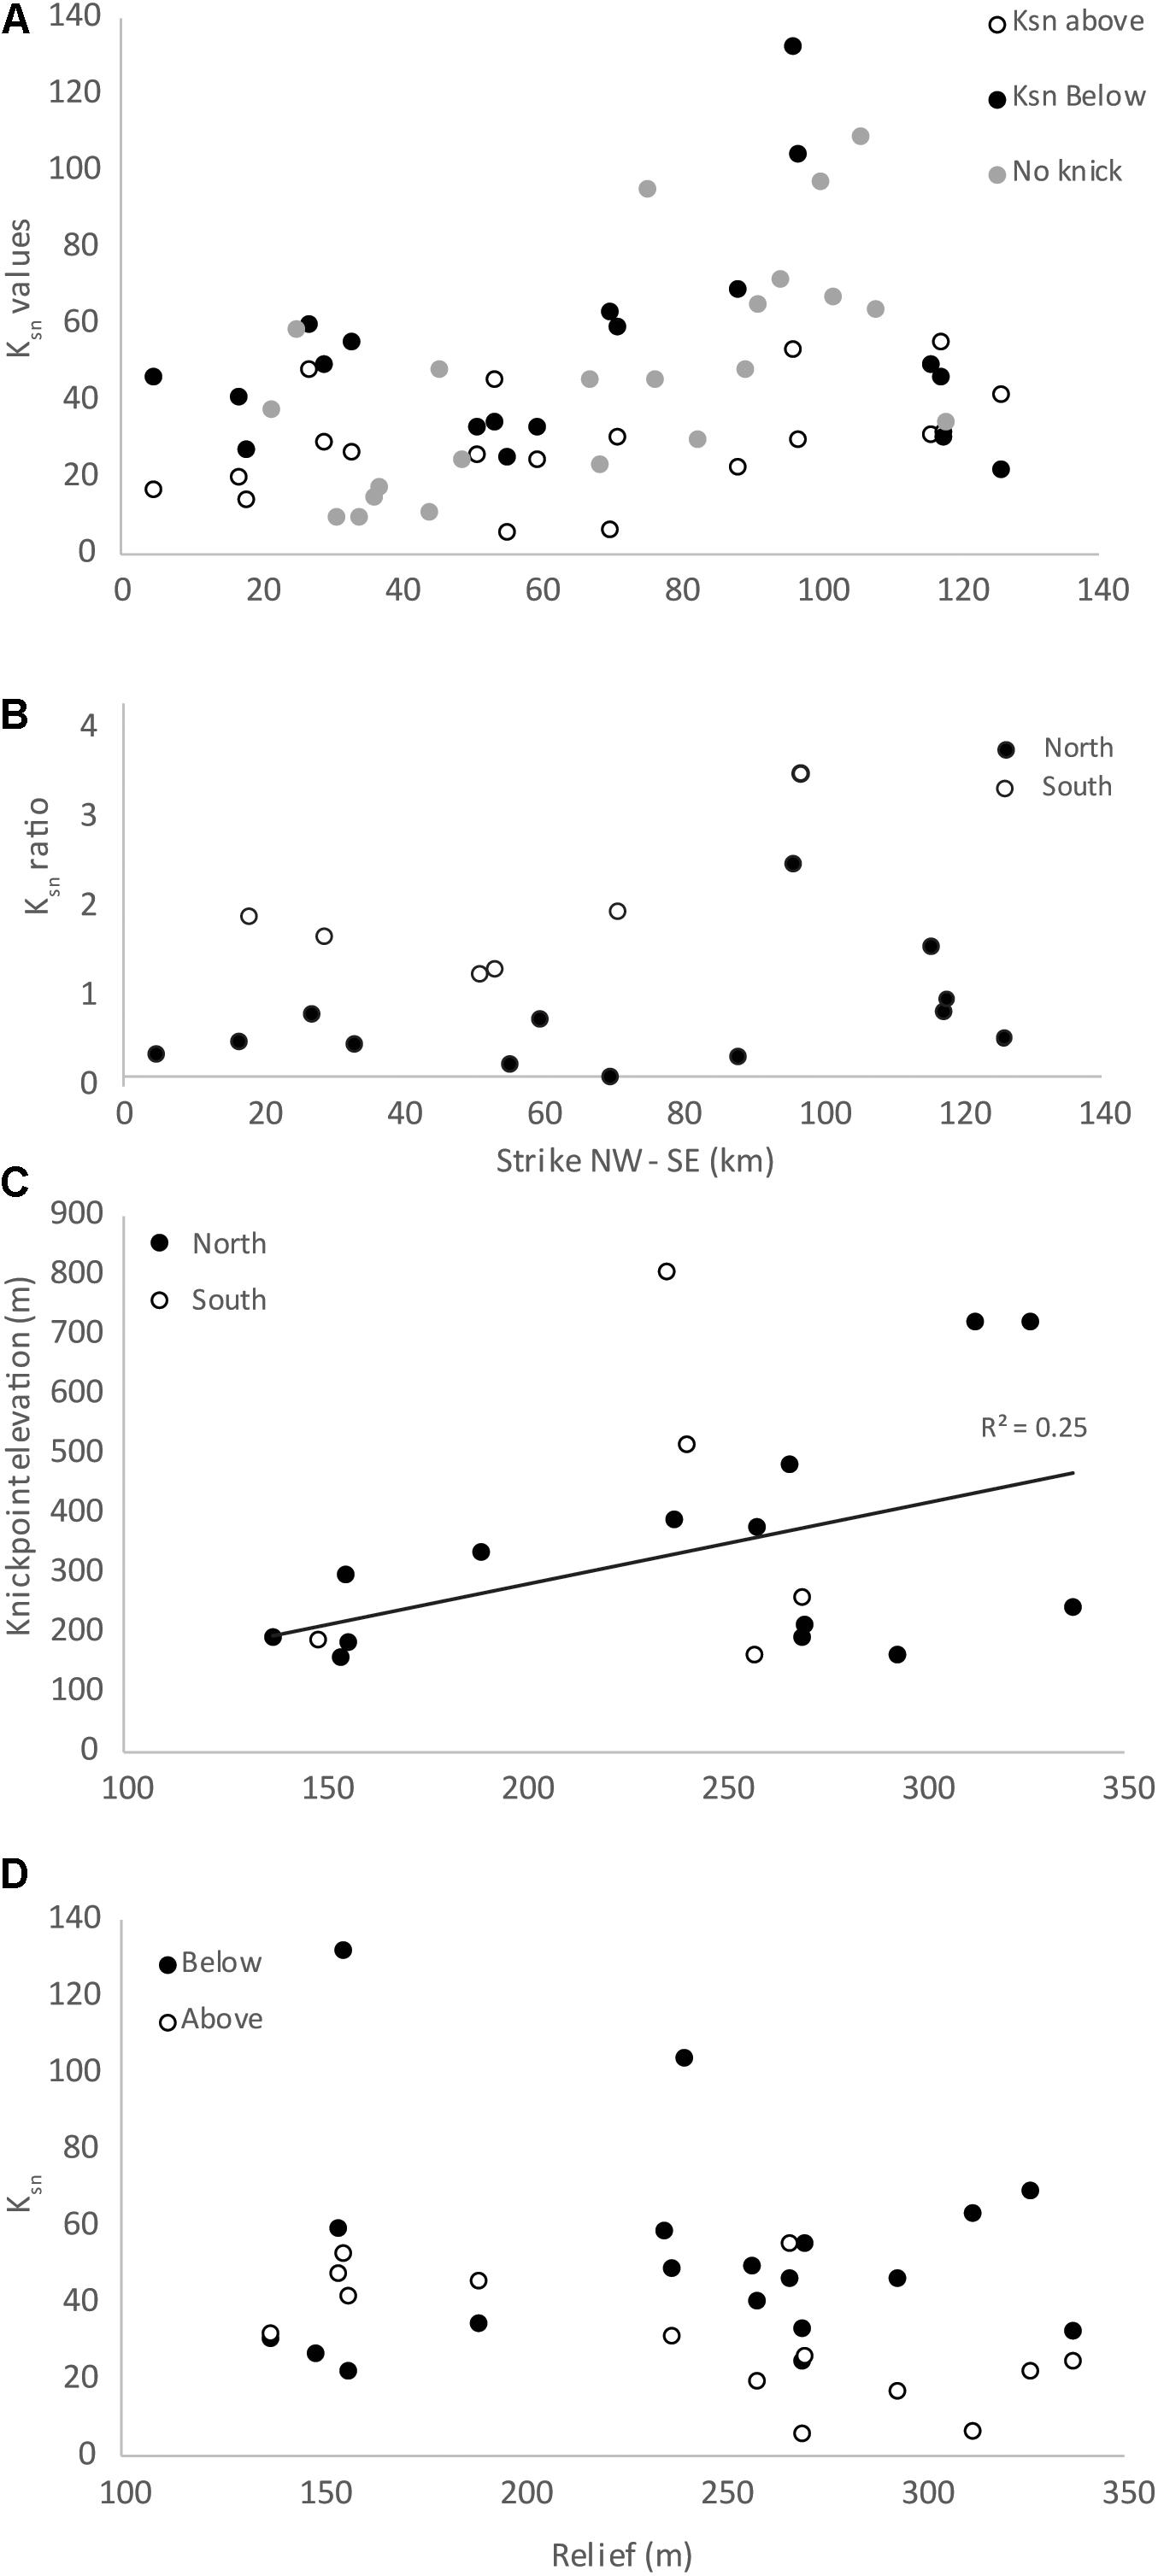
Figure 13. (A) Ksn against distance along strike of Makira showing the difference in values for rivers above and below the knickpoints (where present) and ksn for the whole river (where knickpoints are absent). (B) Ksn ratio (below knickpoint/above knickpoint) of rivers along the island of Makira. Figure 8. (C) Knickpoint elevation and (D) Ksn against topographic relief for Makira.
Discussion
Origin and Implications of Knickpoints
Slope-break knickpoints have been identified along river systems on both Guadalcanal and Makira. These geomorphic features typically form along bedrock rivers responding to a relative base-level fall, which causes a transient wave of incision to propagate up through the catchments as the river adjusts to the new boundary conditions. However, what caused the formation of the knickpoints observed on Guadalcanal and Makira? Were knickpoints triggered by eustatic sea-level fall, localized faulting or regional tectonic uplift?
In the Pacific, eustatic sea-level has experienced two periods of significant sea-level fall in the last 140 kyrs. Firstly, at 140 ka the sea-level was ∼135 m lower than present, and at the climax of the last glacial (20 Ka; Woodroffe and Horton, 2005). This eustatic fall in base-level has been implicated in the formation of knickpoints described on the Pacific islands of Tahiti (Ye et al., 2013) and Hawaii (Seidl et al., 1994). However, the knickpoints described on these islands are morphologically waterfalls rather than steep fluvial reaches, the majority of rivers are typically < 10 km in length and many have linear river profiles. Furthermore, the knickpoints typically occur near the coast as hanging-valleys. Neither Seidl et al. (1994) nor Ye et al. (2013) classified the observed waterfalls as vertical-step or slope-break but they may be vertical-step in nature. Therefore, the morphology of the eustatic sea-fall generated waterfalls previously recorded on other Pacific Islands is dissimilar to those recognized on Guadalcanal and Makira.
In addition, knickpoints developed as the result of sea-level fall would be expected to have the following characteristics. Firstly, knickpoints would be expected to occur in all rivers, except those that are short so that in the response time of the system the knickpoints would have migrated through the catchment (or the knickpoints would be trapped at a threshold drainage area [c.f., Crosby and Whipple, 2006]). Secondly, knickpoints would have formed at the same time and thus show consistent scaling, and knickpoint elevation within and across catchments should be in a narrow band. Finally, where lithology and climate are similar there should be no variations in ksn or ksn ratio across the island. By contrast, knickpoints forming as a result of a change in the rate of uplift, or potentially a switch from subsidence to uplift, would show along strike variations in the ksn values, as ksn is known to positively scale with uplift (e.g., Snyder et al., 2000). In this scenario, if the uplift affected an entire island or arc segment, all rivers would also be affected. Therefore, the key discriminating factor to determine the likely mechanism of knickpoint formation is the ksn of the river systems.
For the island of Makira, ksn values (Figure 13) show an increase toward the south, with a peak in values at 110 km along strike. This pattern correlates with the inferred uplift rates across the island (Figure 12), where uplift rates reach a maximum ∼0.7 mm/yr at 110 km along strike, and is also reflected in the elevation of the knickpoints also reaching maximum heights in the southern half of the island (c.f. Boulton and Whittaker, 2009). When the inferred uplift rate at the mouth of the rivers is plotted against ksn values for steady-state rivers there is a positive, although weak, linear relationship (Figure 14) reflecting these previous observations.
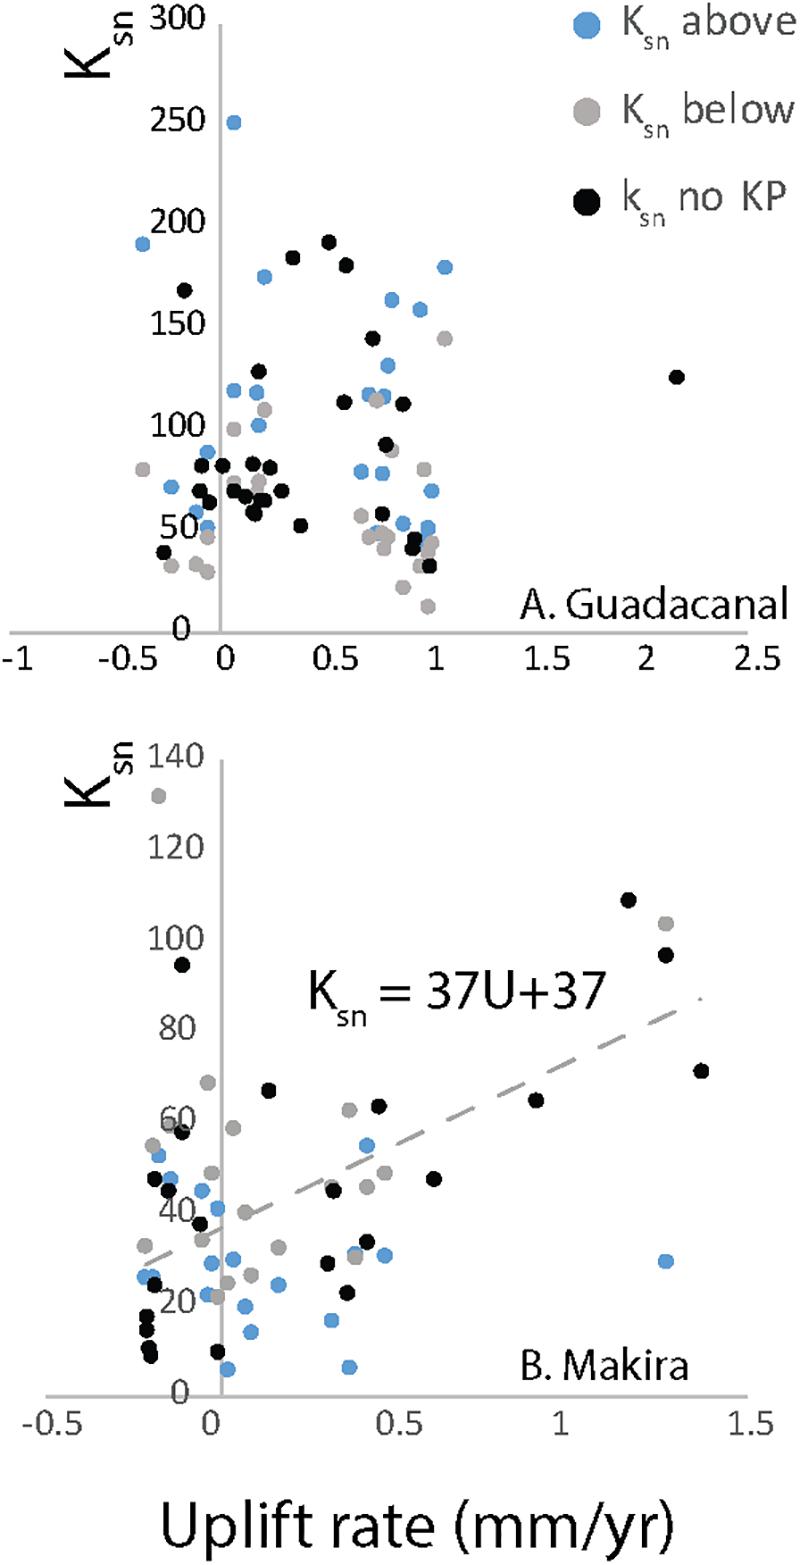
Figure 14. (A,B) Plots of ksn against interpolated uplift rates of the islands of Guadalcanal and Makira, respectively.
By contrast on the island of Guadalcanal, ksn values along strike are fairly constant (average ksn = 67 m0.9) from 0 to 50 km (Figure 7), with an increase in ksn to an average of 100 m0.9 in the southern two thirds on the island. Yet, when the uplift values are interpolated from available data the uplift field of the island is also fairly constant at ∼ 1 – 0.4 mm/yr but showing an overall decrease to the south. Although, ksn and relief are positively correlated, the topography appears decoupled from the uplift data available and the correlation between ksn and uplift rates is invariant (Figure 14).
There is no clear pattern of knickpoint location upstream of potentially active faults, as would be expected if knickpoints were generated because of changes in motion along individual structures. Indeed, on both islands knickpoints are present along rivers that apparently do not cross faults (either previously published or inferred from DEM analysis carried out in this study). In addition, on both islands knickpoints are more common in the longer northwards flowing rivers than on the southwards flowing rivers, which tend to be steeper than those flowing to the north. These observations suggest; (a) a regional rather than local control on knickpoint formation, and (b) that knickpoints may have already completely migrated through the short steep southern rivers implying that the timing of knickpoint formation was longer ago than the response times of the rivers. Some rivers have response times of millions of years, albeit in drier climates (e.g., Italy ∼1–2 × 10⁶ Myr [Whittaker et al., 2007]), but even in tropical climates response times are likely > 25 Ka (Whipple, 2001).
In summary, although the evidence for Guadalcanal is somewhat equivocal, the patterns of knickpoints and the correlation between ksn and uplift rates for Makira demonstrate that the landscape is transiently responding to regional uplift along the subduction zone as opposed to eustatic sea-level fall. Therefore, this is likely also to be the cause of knickpoints on the nearby island of Guadalcanal. Uplift, and the associated base-level fall trigger knickpoint formation and propagation when there is an increase in the uplift rate. A question remains over when and why this increase in uplift might have taken place, but uplift could be linked to variable rates of strain accumulation that has been evidenced elsewhere in the Solomon Arc (Thirumalai et al., 2015).
Uplift Dependent Channel Steepness
It is of note that the fluvial geomorphic responses are distinct given that rates of uplift and climate are similar for the two islands. There is a positive, albeit weak, correlation (R2 = 0.4) between uplift and ksn for rivers without knickpoints for Makira. Whereas, there is no correlation between these variables along river reaches upstream or downstream of knickpoints (Figure 14). On Guadalcanal, there is no clear correlation between inferred uplift and ksn for any river reaches (Figure 14). This dichotomy could be the result of a recording bias, for example the rates derived from uplifted coral reefs of Makira are more representative of long-term uplift rates but on Guadalcanal the uplift recorded by the coral reefs could be representative only of short interseismic strain and are not equal to the longer term rates to which the rivers are responding. This explanation is also consistent with Guadalcanal and Makira being located on two different arc segments and having different uplift histories (Chen et al., 2011).
However, the contrast in fluvial response equally could be a result of the more complex bedrock geology of Guadalcanal, compared to Makira that is dominated by basement MORB (Figure 2). The assumption that channel gradient varies linearly with tectonic forcing is only true where K (erodibility coefficient) is uniform across the region (Whipple and Tucker, 1999; Snyder et al., 2000). As K embeds rock strength, regional lithological variability can result in K scaling over several orders of magnitude (Stock and Montgomery, 1999). Therefore, different bedrock geology can explain the contrasting landscape response and the lack of scaling between ksn and uplift (U) on Guadalcanal.
Cyr et al. (2010) state that the channel longitudinal profile must be in steady-state so that U as well as K is uniform along the channel to determine K. This condition therefore appears likely to be satisfied for the concave-up rivers on Makira (although the relationship is weak) and explains why there is no correlation between the variables where knickpoints are present, as these rivers are not in steady-state. Furthermore, the linear ksn to U scaling implies that the n exponent in Eq. (2) is ∼1, which is consistent with a range of other studies across a range of climatic zones (i.e., Wobus et al., 2006; Burbank and Anderson, 2011; D’Arcy and Whittaker, 2014). Therefore, assuming that U = E in the concave-up rivers, one can derive values of K in the range 1 × 10⁻⁵ – 7 × 10⁻⁶ m0.1yr–1 for Makira where uplift is positive using the results of the stream profile analysis and the interpolated uplift field (eq. 2). K can also be estimated for Guadalcanal using ksn for the rivers without knickpoints, assuming U = E and n = 1, deriving values of K in the range 1 × 10⁻⁵ – 5 × 10⁻⁸ m0.1yr–1. The spread of values likely reflect a combination of factors that are difficult to quantify given existing data, such as precipitation gradients across the island, variability in channel morphology or local rock strength variations not captured by regional scale mapping. These values are consistent with values reported elsewhere; for example, Stock and Montgomery (1999) reported values in the range of 10–2 to 10–7 m0.2yr–1 for a range of rock types across a number of climatic zones. Similarly, Brocard and Van der Beek (2006) determined that for bedrock rivers in the French Alps K = 1.1 – 4.7 × 10⁻⁵ m0.4 yr–1 and van der Beek and Bishop (2003) determined that K = 7 × 10⁻⁷ m0.4 yr–1 for a river crossing crystalline basement rocks in SE Australia. Therefore, it is likely that the larger range of K parameter values estimated for Guadalcanal reflect the greater variation in bedrock lithologies present on this island compared to Makira, especially the presence of presumably weaker sedimentary rocks (sandstones, siltstones) in addition to the stronger basement lithologies found on both islands (Katz et al., 2000). These data support the hypothesis that rock strength is a key control on landscape evolution in the Solomon Islands.
Geohazard Implications
As demonstrated above the fluvial geomorphology on the islands of Guadalcanal and Makira is transiently responding to a base-level fall that is interpreted as the result of regional uplift modulated by rock strength along this segment of the Solomon Islands Forearc. Although it is well known that this region can be affected by strong (>7.0 Mw) megathrust earthquakes, this research highlights the landscape vulnerability to the tectonic activity along the subduction zone.
Firstly, it is probable that at least some of the mapped faults pose a hitherto unquantified earthquake hazard and warrant further investigation. Although, many of the mapped faults on the islands of Guadalcanal and Makira have no clear expression in the landscape that is identifiable through DEM analysis, it is not clear if these faults are inactive or if high erosion rates and/or vegetation cover obscure activity on these faults. The DEM (Figure 9) also shows that the many of the major river systems have developed parallel to the NE-SW faults on Makira and the current mapping of the structures may underestimate the faulting as a result of fluvial erosion obscuring fault traces.
Furthermore, the topographic lineament analysis undertaken here has revealed new lineaments on both islands that have previously not been recognized (Figures 2, 4, 9), although a greater number have been identified on Makira than on Guadalcanal. On Guadalcanal, previously mapped faults are consistent with the new lineament analysis (Figure 4). These faults are described as high-angle structures with vertical slip and a minor strike-slip component of motion, which are mainly confined to the underlying basement (Coleman, 1965). Therefore, it is likely that the new lineaments mapped here for Guadalcanal are the surface expression of the NW-SE-striking vertical (normal?) slip faults. By contrast, many more potential faults have been identified on Makira through lineament analysis than are present on the Department of Geological Surveys (1969) map (Figure 9). These lineaments show a dominant NE-SW trend, previously determined as the ‘master’ faults set by Petterson et al. (2009) and are consistent with their partial mapping of the eastern part of the island. Petterson et al. (2009) state that these faults are also normal faults similar to those on Guadalcanal. The normal faults are indicative of upper plate extension, which has been described in subduction zones worldwide particularly where plate motion is oblique to the trench (e.g., Whittaker et al., 1992; Upton et al., 2003). While the normal faults described here are not responsible for the >7.0 Mw megathrust earthquakes, active normal faults > 12 km in length could still generate earthquakes of 5.0 – 6.0 Mw (Wells and Coppersmith, 1994).
Secondly, there is a weak relationship on Makira between uplift and various landscape metrics, including relief and channel steepness. While ksn values are not directly convertible into rock uplift rates, river profile analysis can be used to identify steeper channels and thus regions more likely to be experiencing relatively higher erosion and uplift rates. There is a well-documented linkage between landscape transience, river incision and landsliding especially where bedrock lithologies are similar (Ouimet et al., 2007; Gallen et al., 2011; Bennett et al., 2016). As the knickpoint migrates through the system, the downstream portion of the river steepens and incises to the new base-level. Consequently, gorge formation and development of hillslopes with angles > 45° are typical. Landslides have been shown to be common downstream of knickpoints and are a key process in the erosion of landscapes (e.g., Gallen et al., 2011; Bennett et al., 2016). Therefore, in river reaches downstream of the knickpoints on Guadalcanal and Makira, the incidence of landslides will likely be higher than upstream of the knickpoints.
In addition to landslides triggered by incision, earthquakes induce many landslides (Keefer, 1984); where the density of landsliding increases with earthquake magnitude (Keefer, 2000; Meunier et al., 2008). Furthermore, earthquakes likely ‘prime’ landscapes increasing the likelihood of further landsliding; a concept referred to as preconditioning (Parker et al., 2015). Therefore, in the Solomon Islands landslides may be triggered co-seismically or by rainfall but present a clear hazard along steep catchments.
Conclusion
Topographic lineament and river profile analyses, using DEMs, were undertaken on the islands of Guadalcanal and Makira that form the southernmost part of the Solomon Island chain and have well defined uplift fields. Situated on two different arc segments the bedrock geology and fluvial geomorphology shows marked similarities and differences between the two islands. Lineament analysis is consistent with existing mapping, showing that both islands have previously unrecognized NE-SW and ESE-WNW striking faults, likely to be extensional in nature. Fifty-seven rivers for Guadalcanal and forty-one rivers for Makira were selected for river profile analysis. On both islands, rivers flowing to the north were overall less steep and longer than the rivers flowing to the south coast and northern rivers were more likely to contain slope-break knickpoints. There is a weak correlation between knickpoint elevation and topographic relief for both Makira and Guadalcanal, but for Makira there is no clear correlation between relief and ksn, while the rivers of Guadalcanal do have a weak correlation between these parameters. By contrast, there is a weak positive linear relationship between river steepness index and interpolated uplift rates for Makira, as predicted by stream-power erosion laws, which allows K, the erosion coefficient, to be calculated. The origin of these knickpoints is likely to be the result of tectonic uplift along the arc, and reinforces that these islands are subject to not only high-magnitude earthquakes, but that river incision and knickpoint migration are also likely to result in hillslope instabilities and landsliding. The differences between the geomorphic response of the two islands, given climatic similarities, is probably the result of the more complex bedrock geology of Guadalcanal in comparison to Makira, highlighting the importance not only of tectonic but lithological control on landscape evolution. The differences in the bedrock geology, structural grain and geomorphology also support the hypothesis that these islands are located on different segments of the Solomon Arc.
Data Availability Statement
The SRTM 30 m datasets used in this study can be downloaded from the USGS EarthExplorer website https://earthexplorer.usgs.gov/. The ALOS World 3D 30 m DEM is available from JAXA https://www.eorc.jaxa.jp/ALOS/en/aw3d30/index.htm. The bathymetry data is an extract from the General Bathymetric Chart of the Oceans (GEBCO) downloaded from https://www.gebco.net/. The earthquake data were downloaded from the USGS Earthquake Catalog https://earthquake.usgs.gov/earthquakes/search/.
Author Contributions
The author confirms being the sole contributor of this work and has approved it for publication.
Conflict of Interest
The author declares that the research was conducted in the absence of any commercial or financial relationships that could be construed as a potential conflict of interest.
Acknowledgments
Thanks to the guest editor AS, the two reviewers, Jesse Zondervan, and Alex Whittaker for useful discussions and comments that have improved this research.
Supplementary Material
The Supplementary Material for this article can be found online at: https://www.frontiersin.org/articles/10.3389/feart.2020.00010/full#supplementary-material
FIGURE S1 | River long profiles for the island of Guadalcanal. See Figure 5 for location of each river.
FIGURE S2 | River long profiles for the island of Makira. See Figure 10 for location of each river.
References
Abram, N. J., McGregor, H. V., Gagan, M. K., Hantoro, W. S., and Suwargadi, B. W. (2009). Oscillations in the southern extent of the indo-pacific warm pool during the mid-holocene. Q. Sci. Rev. 28, 2794–2803. doi: 10.1016/j.quascirev.2009.07.006
Balco, G., Stone, J. O., Lifton, N. A., and Dunai, T. J. (2008). A complete and easily accessible means of calculating surface exposure ages or erosion rates from 10Be and 26Al measurements. Q. Geochronol. 3, 174–195. doi: 10.1016/j.quageo.2007.12.001
Bennett, G. L., Miller, S. R., Roering, J. J., and Schmidt, D. A. (2016). Landslides, threshold slopes, and the survival of relict terrain in the wake of the mendocino triple junction. Geology 44, 363–366. doi: 10.1130/g37530.1
Bernard, T., Sinclair, H. D., Gailleton, B., Mudd, S. M., and Ford, M. (2019). Lithological control on the post-orogenic topography and erosion history of the Pyrenees. Earth Planet. Sci. Lett. 518, 53–66. doi: 10.1016/J.EPSL.2019.04.034
Bishop, P., Hoey, T. B., Jansen, J. D., and Lexartza Artza, I. (2005). Knickpoint recession rate and catchment area: the case of uplifted rivers in Eastern Scotland. Earth Surf. Process. Landf. 30, 767–778. doi: 10.1002/esp.1191
Boulton, S. J., and Stokes, M. (2018). Which DEM is best for analyzing fluvial landscape development in mountainous terrains? Geomorphology 310, 168–187. doi: 10.1016/j.geomorph.2018.03.002
Boulton, S. J., Stokes, M., and Mather, A. E. (2014). Transient fluvial incision as an indicator of active faulting and Plio-Quaternary uplift of the Moroccan High Atlas. Tectonophysics 633, 16–33. doi: 10.1016/j.tecto.2014.06.032
Boulton, S. J., and Whittaker, A. C. (2009). Quantifying the slip rates, spatial distribution and evolution of active normal faults from geomorphic analysis: field examples from an oblique-extensional graben, southern Turkey. Geomorphology 104, 299–316. doi: 10.1016/j.geomorph.2008.09.007
Brocard, G. Y., and Van der Beek, P. A. (2006). Influence of incision rate, rock strength, and bedload supply on bedrock river gradients and valley-flat widths: field-based evidence and calibrations from western Alpine rivers (southeast France). Geol. Soc. Am. Special Pap. 398, 101–126.
Burbank, D. W., and Anderson, R. S. (2011). Tectonic Geomorphology, 2nd Edn. Hoboken, NJ: John Wiley & Sons.
Castillo, M., Ferrari, L., and Muñoz-Salinas, E. (2017). Knickpoint retreat and landscape evolution of the Amatlán de Cañas half-graben (northern sector of Jalisco Block, western Mexico). J. South Am. Earth Sci. 77, 108–122. doi: 10.1016/j.jsames.2017.05.003
Chen, M.-C., Frohlich, C., Taylor, F. W., Burr, G., and van Ufford, A. Q. (2011). Arc segmentation and seismicity in the Solomon Islands arc. SW Pacific. Tectonophysics 507, 47–69. doi: 10.1016/J.TECTO.2011.05.008
Coleman, P. J. (1965). Stratigraphical and Structural Notes on the British Solomon Islands with Reference to the First Geological Map, 1962. Report No. 29, Vol. 2. Millbank: British Solomon Islands, 17–33.
Cowley, S., Mann, P., Coffin, M. F., and Shipley, T. H. (2004). Oligocene to recent tectonic history of the central solomon intra-arc basin as determined from marine seismic reflection data and compilation of onland geology. Tectonophysics 389, 267–307. doi: 10.1016/J.TECTO.2004.01.008
Crosby, B. T., and Whipple, K. X. (2006). Knickpoint initiation and distribution within fluvial networks: 236 waterfalls in the Waipaoa River. North Island. N. Z. Geomorphol. 82, 16–38. doi: 10.1016/j.geomorph.2005.08.023
Cyr, A. J., Granger, D. E., Olivetti, V., and Molin, P. (2010). Quantifying rock uplift rates using channel steepness and cosmogenic nuclide-determined erosion rates: examples from northern and southern Italy. Lithosphere 2, 188–198. doi: 10.1130/L96.1
Cyr, A. J., Granger, D. E., Olivetti, V., and Molin, P. (2014). Distinguishing between tectonic and lithologic controls on bedrock channel longitudinal profiles using cosmogenic 10Be erosion rates and channel steepness index. Geomorphology 209, 27–38. doi: 10.1016/j.geomorph.2013.12.010
D’Arcy, M., and Whittaker, A. C. (2014). Geomorphic constraints on landscape sensitivity to climate in tectonically active areas. Geomorphology 204, 366–381. doi: 10.1016/j.geomorph.2013.08.019
Department of Geological Surveys (1969). Geological Map of the Solomon Islands, 2nd Edn. Kolkata: Department of Geological Surveys.
DiBiase, R. A., Whipple, K. X., Heimsath, A. M., and Ouimet, W. B. (2010). Landscape form and millennial erosion rates in the san gabriel mountains. CA. Earth Planet. Sci. Lett. 289, 134–144. doi: 10.1016/J.EPSL.2009.10.036
Farr, T. G., Rosen, P. A., Caro, E., Crippen, R., Duren, R., Hensley, S., et al. (2007). The shuttle radar topography mission. Rev. Geophys. 45:RG2004.
Ferrier, K. L., Huppert, K. L., and Perron, J. T. (2013). Climatic control of bedrock river incision. Nature 496, 206–209. doi: 10.1038/nature11982
Finnegan, N. J., Roe, G., Montgomery, D. R., and Hallet, B. (2005). Controls on the channel width of rivers: implications for modeling fluvial incision of bedrock. Geology 33, 229–232. doi: 10.1130/G21171.1
Forte, A. M., Yanites, B. J., and Whipple, K. X. (2016). Complexities of landscape evolution during incision through layered stratigraphy with contrasts in rock strength. Earth Surf. Process. Landf. 41, 1736–1757. doi: 10.1002/esp.3947
Gallen, S. F., and Wegmann, K. W. (2017). River profile response to normal fault growth and linkage: an example from the Hellenic forearc of south-central Crete. Greece. Earth Surf. Dynam. 5, 161–186. doi: 10.5194/esurf-5-161-2017
Gallen, S. F., Wegmann, K. W., Frankel, K. L., Hughes, S., Lewis, R. Q., Lyons, N., et al. (2011). Hillslope response to knickpoint migration in the southern appalachians: implications for the evolution of post-orogenic landscapes. Earth Surf. Process. Landf. orms 36, 1254–1267. doi: 10.1002/esp.2150
Ganas, A., Pavlides, S., and Karastathis, V. (2005). DEM-based morphometry of range-front escarpments in Attica, central Greece, and its relation to fault slip rates. Geomorphology 65, 301–319. doi: 10.1016/j.geomorph.2004.09.006
Goldrick, G., and Bishop, P. (2007). Regional analysis of bedrock stream long profiles: evaluation of Hack’s SL form, and formulation and assessment of an alternative (the DS form). Earth Surf. Process. Landf. 32, 649–671. doi: 10.1002/esp.1413
Gosse, J. C., and Phillips, F. M. (2001). ‘Terrestrial in situ cosmogenic nuclides: theory and application’. Q. Sci. Rev. 20, 1475–1560. doi: 10.1016/S0277-3791(00)00171-2
Harel, M. A., Mudd, S. M., and Attal, M. (2016). Global analysis of the stream power law parameters based on worldwide 10Be denudation rates’. Geomorphology 268, 184–196. doi: 10.1016/j.geomorph.2016.05.035
Harkins, N., Kirby, E., Heimsath, A., Robinson, R., and Reiser, U. (2007). Transient fluvial incision in the headwaters of the Yellow River, northeastern Tibet. China. J. Geophys. Res.: Earth Surf. 112, 1–21. doi: 10.1029/2006JF000570
Haviv, I., Enzel, Y., Whipple, K. X., Zilberman, E., Matmon, A., Stone, J., et al. (2010). Evolution of vertical knickpoints (waterfalls) with resistant caprock: Insights from numerical modeling. J. Geophys. Res.: Earth Surf. 115:F03028. doi: 10.1029/2008JF001187
Katz, O., Reches, Z., and Roegiers, J.-C. (2000). Evaluation of mechanical rock properties using a Schmidt Hammer. Int. J. Rock Mech. Min. Sci. 37, 723–728. doi: 10.1016/s1365-1609(00)00004-6
Keefer, D. K. (2000). Statistical analysis of an earthquake-induced landslide distribution—the 1989 Loma Prieta, California event. Eng. Geol. 58, 213–249.
Kent, E., Boulton, S. J., Whittaker, A. C., Stewart, I. S., and Cihat Alçiçek, M. (2017). Normal fault growth and linkage in the Gediz (Alaşehir) Graben, Western Turkey, revealed by transient river long-profiles and slope-break knickpoints. Earth Surf. Process. Landf. 42, 836–852. doi: 10.1002/esp.4049
Kirby, E., and Whipple, K. (2001). Quantifying differential rock-uplift rates via stream profile analysis. Geology 29:415. doi: 10.1130/0091-7613(2001)029<0415:qdrurv>2.0.co;2
Kirby, E., and Whipple, K. X. (2012). Expression of active tectonics in erosional landscapes. J. Struct. Geol. 44, 54–75. doi: 10.1016/j.jsg.2012.07.009
Kirby, E., Whipple, K. X., Tang, W., and Chen, Z. (2003). Distribution of active rock uplift along the eastern margin of the tibetan plateau: inferences from bedrock channel longitudinal profiles. J. Geophys. Res. 108: B42217. doi: 10.1029/2001jb000861
Kuo, Y.-T., Ku, C.-S., Chen, Y.-G., Wang, Y., Lin, Y.-N. N., Chuang, R. Y., et al. (2016). Characteristics on fault coupling along the Solomon megathrust based on GPS observations from 2011 to 2014. Geophys. Res. Lett. 43, 8519–8526. doi: 10.1002/2016GL070188
Liu, Z., Han, L., Boulton, S. J., Wu, T., and Guo, J. (2019). Quantifying the transient landscape response to active faulting using fluvial geomorphic analysis in the Qianhe Graben on the southwest margin of Ordos, China. Geomorphology 351:106974. doi: 10.1016/j.geomorph.2019.106974
Malamud, B. D., Turcotte, D. L., Guzzetti, F., and Reichenbach, P. (2004). ‘Landslide inventories and their statistical properties’. Earth Surf. Process. Landf. 29, 687–711. doi: 10.1002/esp.1064
Mann, P., Taylor, F. W., Lagoe, M. B., Quarles, A., and Burr, G. (1998). Accelerating late quaternary uplift of the New Georgia Island Group (Solomon island arc) in response to subduction of the recently active Woodlark spreading center and Coleman seamount. Tectonophysics 295, 259–306. doi: 10.1016/S0040-1951(98)00129-2
Marliyani, G. I., Arrowsmith, J. R., and Whipple, K. X. (2016). Characterization of slow slip rate faults in humid areas: cimandiri fault zone. Indonesia. J. Geophys. Res. 121, 2287–2308. doi: 10.1002/2016JF003846
Menier, D., Mathew, M., Pubellier, M., Sapin, F., Delcaillau, B., Siddiqui, N., et al. (2017). Landscape response to progressive tectonic and climatic forcing in NW Borneo: implications for geological and geomorphic controls on flood hazard. Sci. Rep. 7:457. doi: 10.1038/s41598-017-00620-y
Meunier, P., Hovius, N., and Haines, J. A. (2008). Topographic site effects and the location of earthquake induced landslides. Earth Planeta. Sci. Lett. 275, 221–232. doi: 10.1016/j.epsl.2008.07.020
Miller, S. R. (2013). Neogene rejuvenation of central appalachian topography: evidence for differential rock uplift from stream profiles and erosion rates. Earth Planet Sci. Lett. 369–370, 1–12. doi: 10.1016/J.EPSL.2013.04.007
Miller, S. R., Baldwin, S. L., and Fitzgerald, P. G. (2012). Transient fluvial incision and active surface uplift in the woodlark rift of eastern papua new guinea. Lithosphere 4, 131–149. doi: 10.1130/L135.1
Miura, S., Suyehiro, K., Shinohara, M., Takahashi, N., Araki, E., and Taira, A. (2004). Seismological structure and implications of collision between the ontong java Plateau and Solomon Island Arc from ocean bottom seismometer–airgun data. Tectonophysics 389, 191–220. doi: 10.1016/j.tecto.2003.09.029
Oguchi, T., Aoki, T., and Matsuta, N. (2003). Identification of an active fault in the Japanese Alps from DEM-based hill shading. Comput. Geosci. 29, 885–891. doi: 10.1016/s0098-3004(03)00083-9
O’Leary, D. W., Friedman, J. D., and Pohn, H. A. (1976). Lineament, linear, lineation: some proposed new standards for old terms. Geol. Soc. Am. Bull. 87, 1463–1469.
Onorati, G., Poscolieri, M., Ventura, R., Chiarini, V., and Crucilla, U. (1992). The digital elevation model of Italy for geomorphology and structuralgeology. Catena 19, 147–178. doi: 10.1371/journal.pone.0122070
Ortega, J. A., Wohl, E., and Livers, B. (2013). Waterfalls on the eastern side of rocky mountain national park, Colorado, USA. Geomorphology 198, 37–44. doi: 10.1016/j.geomorph.2013.05.010
Ouimet, W. B., Whipple, K. X., and Granger, D. E. (2009). Beyond threshold hillslopes: channel adjustment to base-level fall in tectonically active mountain ranges. Geology 37, 579–582. doi: 10.1130/G30013A.1
Ouimet, W. B., Whipple, K. X., Royden, L. H., Sun, Z., and Chen, Z. (2007). The influence of large landslides on river incision in a transient landscape: eastern margin of the Tibetan Plateau (Sichuan. China). GSA Bull. 119, 1462–1476. doi: 10.1130/B26136.1
Parker, R. N., Hancox, G. T., Petley, D. N., Massey, C. I., Densmore, A. L., and Rosser, N. J. (2015). Spatial distributions of earthquake-induced landslides and hillslope preconditioning in northwest South Island, New Zealand. Earth Surf. Dyn. 3, 501–525. doi: 10.5194/esurf-3-501-2015
Petterson, M., Babbs, T., Neal, C. R., Mahoney, J. J., Saunders, A. D., Duncane, R. A., et al. (1999). Geological–tectonic framework of Solomon Islands, SW Pacific: crustal accretion and growth within an intra-oceanic setting. Tectonophysics 301, 35–60. doi: 10.1016/S0040-1951(98)00214-5
Petterson, M. G., Magu, R., Mason, A., Mahoa, H., Tolia, D., Neal, C. R., et al. (2009). A first geological map of Makira, Solomon Islands: stratigraphy, structure and tectonic implications. SOPAC Tech. Bull. 11, 151–169.
Petterson, M. G., Neal, C. R., Mahoney, J. J., Kroenke, L. W., Saunders, A. D., Babbs, T. L., et al. (1997). Structure and deformation of north and central Malaita, Solomon Islands: tectonic implications for the Ontong Java Plateau-Solomon arc collision, and for the fate of oceanic plateaus. Tectonophysics 283, 1–33. doi: 10.1016/S0040-1951(97)00206-0
Phillips, J. D., and Lutz, J. D. (2008). Profile convexities in bedrock and alluvial streams. Geomorphology 102, 554–566. doi: 10.1016/j.geomorph.2008.05.042
Pipaud, I., Loibl, D., and Lehmkuhl, F. (2015). ‘Evaluation of TanDEM-X elevation data for geomorphological mapping and interpretation in high mountain environments — A case study from SE Tibet, China. Geomorphology 246, 232–254. doi: 10.1016/j.geomorph.2015.06.025
Rao, G., Cheng, Y., Lin, A., and Yan, B. (2017). ‘Relationship between landslides and active normal faulting in the epicentral area of the AD 1556 M∼8.5 Huaxian Earthquake, SE Weihe Graben (Central China). J. Earth Sci. 28, 545–554. doi: 10.1007/s12583-017-0900-z
Regalla, C., Kirby, E., Fisher, D., and Bierman, P. (2013). Active forearc shortening in Tohoku, Japan: constraints on fault geometry from erosion rates and fluvial longitudinal profiles. Geomorphology 195, 84–98. doi: 10.1016/j.geomorph.2013.04.029
Ridgway, J. (1987). Neogene displacements in the Solomon Islands Arc. Tectonophysics 133, 81–93. doi: 10.1016/0040-1951(87)90282-4
Roy, S. G., Tucker, G. E., Koons, P. O., Smith, S. M., and Upton, P. (2016). A fault runs through it: modeling the influence of rock strength and grain-size distribution in a fault-damaged landscape. J. Geophys. Res.: Earth Surf. 121, 1911–1930. doi: 10.1002/2015JF003662
Safran, E. B., Bierman, P. R., Aalto, R., Dunne, T., Whipple, K. X., and Caffee, M. (2005). Erosion rates driven by channel network incision in the Bolivian Andes. Earth Surf. Process. Landf. 30, 1007–1024. doi: 10.1002/esp.1259
Seidl, M. A., Dietrich, W. E., and Kirchner, J. W. (1994). Longitudinal profile development into bedrock: an analysis of hawaiian channels. J. Geol. 102, 457–474. doi: 10.1086/629686
Sklar, L. S., and Dietrich, W. E. (2006). ‘The role of sediment in controlling steady-state bedrock channel slope: implications of the saltation-abrasion incision model’. Geomorphology 82, 58–83. doi: 10.1016/j.geomorph.2005.08.019
Smith, M. J., and Clark, C. D. (2005). Methods for the visualization of digital elevation models for landform mapping. Earth Surf. Process. Landf. 30, 885–900. doi: 10.1002/esp.1210
Smith, M. J., Clark, C. D., and Wise, S. M. (2001). Mapping glacial lineaments from satellite imagery: an assessment of the problems and development of best procedure. Slovak Geol. Mag. 7, 263–274.
Snyder, N. P., Whipple, K. X., Tucker, G. E., and Merritts, D. J. (2000). Stream profiles in the mendocino triple junction region, northern California. GSA Bull. 112, 1250–1263. doi: 10.1130/0016-7606(2000)112<1250:lrttfd>2.0.co;2
Stock, J. D., and Montgomery, D. R. (1999). Geologic constraints on bedrock river incision using the stream power law. J. Geophys. Res.: Solid Earth 104, 4983–4993. doi: 10.1029/98jb02139
Tarboton, D. G., Bras, R. L., and Rodriguez–Iturbe, I. (1991). On the extraction of channel networks from digital elevation data. Hydrol. Process. 5, 81–100. doi: 10.1002/hyp.3360050107
Tejada, M. L. G. (2002). Basement geochemistry and geochronology of central malaita, solomon Islands, with implications for the origin and evolution of the ontong Java Plateau. J. Petrol. 43, 449–484. doi: 10.1093/petrology/43.3.449
Tejada, M. L. G., Mahoney, J. J., Duncan, R. A., and Hawkins, M. P. (1996). Age and geochemistry of basement and alkalic rocks of malaita and santa isabel, solomon Islands, southern margin of ontong Java Plateau. J. Petrol. 37, 361–394. doi: 10.1093/petrology/37.2.361
Thirumalai, K., Taylor, F. W., Shen, C.-C., Lavier, L. L., Frohlich, C., Wallace, L. M., et al. (2015). Variable Holocene deformation above a shallow subduction zone extremely close to the trench. Nat. Commu. 6:7607. doi: 10.1038/ncomms8607
Tucker, G. E., and Whipple, K. X. (2002). Topographic outcomes predicted by stream erosion models: sensitivity analysis and intermodel comparison. J. Geophys. Res. Solid Earth 107, ETG 1-1–ETG 1-16. doi: 10.1029/2001JB000162
Tudhope, A. W., Chilcott, C. P., McCulloch, M. T., Cook, E. R., Chappell, J., Ellam, R. M., et al. (2001). Variability in the El Niño-southern oscillation through a glacial-interglacial cycle. Science 291, 1511–1517. doi: 10.1126/science.1057969
Upton, P., Koons, P. O., and Eberhart-Phillips, D. (2003). Extension and partitioning in an oblique subduction zone, New Zealand: constraints from three-dimensional numerical modeling. Tectonics 22:1068.
USGS (2019). Earthquake Catalog. Available at: https://earthquake.usgs.gov/earthquakes/search/
van der Beek, P., and Bishop, P. (2003). Cenozoic river profile development in the Upper Lachlan catchment (SE Australia) as a test of quantitative fluvial incision models. J. Geophys. Res. Solid Earth 108, 1–28. doi: 10.1029/2002JB002125
van der Beek, P., Champel, B., and Mugnier, J. L. (2002). Control of detachment dip on drainage development in regions of active fault-propagation folding. Geology 30, 471–474.
Wells, D. L., and Coppersmith, K. J. (1994). New empirical relationships among magnitude, rupture length, rupture width, rupture area, and surface displacement. Bull. Seismol. Soc. Am. 84, 974–1002.
Whipple, K. X. (2001). Fluvial landscape response time: how plausible is steady-state denudation? Am. J. Sci. 301, 313–325. doi: 10.2475/ajs.301.4-5.313
Whipple, K. X. (2004). Bedrock rivers and the geomorphology of active orogens. Annu. Rev. Earth Planet. Sci. 32, 151–185. doi: 10.1146/annurev.earth.32.101802.120356
Whipple, K. X., and Tucker, G. E. (1999). Dynamics of the stream-power river incision model: implications for height limits of mountain ranges, landscape response timescales, and research needs. J. Geophys. Res.: Solid Earth 104, 17661–17674. doi: 10.1029/1999JB900120
Whipple, K. X., and Tucker, G. E. (2002). Implications of sediment-flux-dependent river incision models for landscape evolution. J. Geophys. Res. Solid Earth 107, ETG3–1–ETG3–20. doi: 10.1029/2000JB000044
Whittaker, A., Bott, M. H. P., and Waghorn, G. D. (1992). Waghorn, Stresses and plate boundary forces associated with subduction plate margins. J. Geophys. Res. 97, 933–911.
Whittaker, A. C., and Boulton, S. J. (2012). Tectonic and climatic controls on knickpoint retreat rates and landscape response times. J. Geophys. Res.: Earth Surf. 117:F02024.
Whittaker, A. C., Cowie, P. A., Attal, M., Tucker, G. E., and Roberts, G. P. (2007). Bedrock channel adjustment to tectonic forcing: implications for predicting river incision rates. Geology 35, 103–106. doi: 10.1130/G23106A.1
Wobus, C., Whipple, K. X., Kirby, E., Snyder, N., Johnson, J., Spyropolou, K., et al. (2006). “Tectonics from topography: Procedures, promise, and pitfalls,” in Tectonics, Climate, and Landscape Evolution: Geological Society of America Special Paper, eds S. D. Willett, N. Hovius, M. T. Brandon, and D. M. Fisher (Boulder, CA: Geological Society of America).
Wobus, C. W., Hodges, K. V., and Whipple, K. X. (2003). Has focused denudation sustained active thrusting at the Himalayan topographic front? Geology 31, 861–864. doi: 10.1130/G19730.1
Woodroffe, S. A., and Horton, B. P. (2005). Holocene sea-level changes in the Indo-Pacific. J. Asian Earth Sci. 25, 29–43. doi: 10.1016/J.JSEAES.2004.01.009
Yanites, B. J., Becker, J. K., Madritsch, H., Schnellmann, M., and Ehlers, T. A. (2017). Lithologic effects on landscape response to base level changes: a modeling study in the context of the Eastern Jura Mountains, Switzerland. J. Geophys. Res.: Earth Surf. 122, 2196–2222. doi: 10.1002/2016jf004101
Keywords: knickpoints, river geomorphology, Solomon Islands, uplift, faults
Citation: Boulton SJ (2020) Geomorphic Response to Differential Uplift: River Long Profiles and Knickpoints From Guadalcanal and Makira (Solomon Islands). Front. Earth Sci. 8:10. doi: 10.3389/feart.2020.00010
Received: 06 August 2019; Accepted: 17 January 2020;
Published: 06 February 2020.
Edited by:
Afroz Ahmad Shah, Universiti Brunei Darussalam, BruneiReviewed by:
Jonathan D. Paul, Imperial College London, United KingdomManoj Joseph Mathew, Universiti Teknologi PETRONAS, Malaysia
Copyright © 2020 Boulton. This is an open-access article distributed under the terms of the Creative Commons Attribution License (CC BY). The use, distribution or reproduction in other forums is permitted, provided the original author(s) and the copyright owner(s) are credited and that the original publication in this journal is cited, in accordance with accepted academic practice. No use, distribution or reproduction is permitted which does not comply with these terms.
*Correspondence: Sarah J. Boulton, c2FyYWguYm91bHRvbkBwbHltb3V0aC5hYy51aw==