 Peru Bilbao-Lasa1*
 Julius Jara-Muñoz2
 Kevin Pedoja3,4,5
 Irantzu Álvarez6
 Arantza Aranburu1
 Eneko Iriarte7
 Ibon Galparsoro8
- 1Department of Mineralogy and Petrology, Faculty of Science and Technology, University of the Basque Country (UPV-EHU), Leioa, Spain
- 2Institut für Erd- und Umweltwissenschaften, University of Potsdam, Potsdam, Germany
- 3CNRS, Normandiepc Université, Caen, France
- 4UCBN, M2C, Caen, France
- 5CNRS, UMR 6143 M2C, Caen, France
- 6Department of Graphic Expression and Engineering Projects, UPV/EHU, Bilbao, Spain
- 7Department of Historical Sciences and Geography, University of Burgos (UBU), Burgos, Spain
- 8AZTI, Herrera Kaia Portualdea z/g, Pasaia, Spain
Submerged sequences of marine terraces potentially provide crucial information of past sea-level positions. However, the distribution and characteristics of drowned marine terrace sequences are poorly known at a global scale. Using bathymetric data and novel mapping and modeling techniques, we studied a submerged sequence of marine terraces in the Bay of Biscay with the objective to identify the distribution and morphologies of submerged marine terraces and the timing and conditions that allowed their formation and preservation. To accomplish the objectives a high-resolution bathymetry (5 m) was analyzed using Geographic Information Systems and TerraceM®. The successive submerged terraces were identified using a Surface Classification Model, which linearly combines the slope and the roughness of the surface to extract fossil sea-cliffs and fossil rocky shore platforms. For that purpose, contour and hillshaded maps were also analyzed. Then, shoreline angles, a geomorphic marker located at the intersection between the fossil sea-cliff and platform, were mapped analyzing swath profiles perpendicular to the isobaths. Most of the submerged strandlines are irregularly preserved throughout the continental shelf. In summary, 12 submerged terraces with their shoreline angles between approximately: −13 m (T1), −30 and −32 m (T2), −34 and 41 m (T3), −44 and −47 m (T4), −49 and 53 m (T5), −55 and 58 m (T6), −59 and 62 m (T7), −65 and 67 m (T8), −68 and 70 m (T9), −74 and −77 m (T10), −83 and −86 m (T11) and −89 and 92 m (T12). Nevertheless, the ones showing the best lateral continuity and preservation in the central part of the shelf are T3, T4, T5, T7, T8, and T10. The age of the terraces has been estimated using a landscape evolution model. To simulate the formation and preservation of submerged terraces three different scenarios: (i) 20-0 ka; (ii) 128-0 ka; and (iii) 128-20 ka, were compared. The best scenario for terrace generation was between 128 and 20 Ka, where T3, T5, and T7 could have been formed.
Introduction
Marine terraces are geomorphic features of ancient shorelines, which constitute the geological record of past sea-level positions (Lajoie, 1986; Burbank and Anderson, 2011). About 1020 sequences of coastal indicators including the one related to the last interglacial maximum (Marine Isotopic Stage, MIS5e) have been reported in literature (compilations in Pedoja et al., 2014, 2018). Due to the lack of high resolution data, difficulties in carrying out direct observations and dating of underwater landforms, the submerged parts of the coastal sequences are totally neglected and studies dealing with submerged marine terraces are rather scarce (e.g. Passaro et al., 2011; Johnson et al., 2014; Jara-Muñoz et al., 2017; Ricchi et al., 2018). The analysis of submerged marine terraces and sea stacks, combined with sea level variations and tectonic settings, helps us to elucidate the Quaternary coastal evolution of the SE Bay of Biscay.
Galparsoro et al. (2010) were the first to attempt the characterization of submerged features and identified eight submerged marine terraces in the SE Bay of Biscay at approximately: −37, −52, −56, −70, −73, −75, −87, and −92 m below sea level.
In this study we use a high resolution bathymetrical model of the Bay of Biscay down to depths of −116 m, to map submerged shoreline angles using morphometric analysis. Alongside, the detection of sea-stacks was carried out to better define the number and distribution of the submerged terraces. Due to the lack of dating, to constraint the chronology of the successive submerged marine terraces we used numerical modeling.
Background
The study area is located on the SE Bay of Biscay of the continental shelf, N of Iberian Peninsula. It represents a coastal stretch estimated to be of ∼ 150 km (Galparsoro et al., 2010; Figure 1).
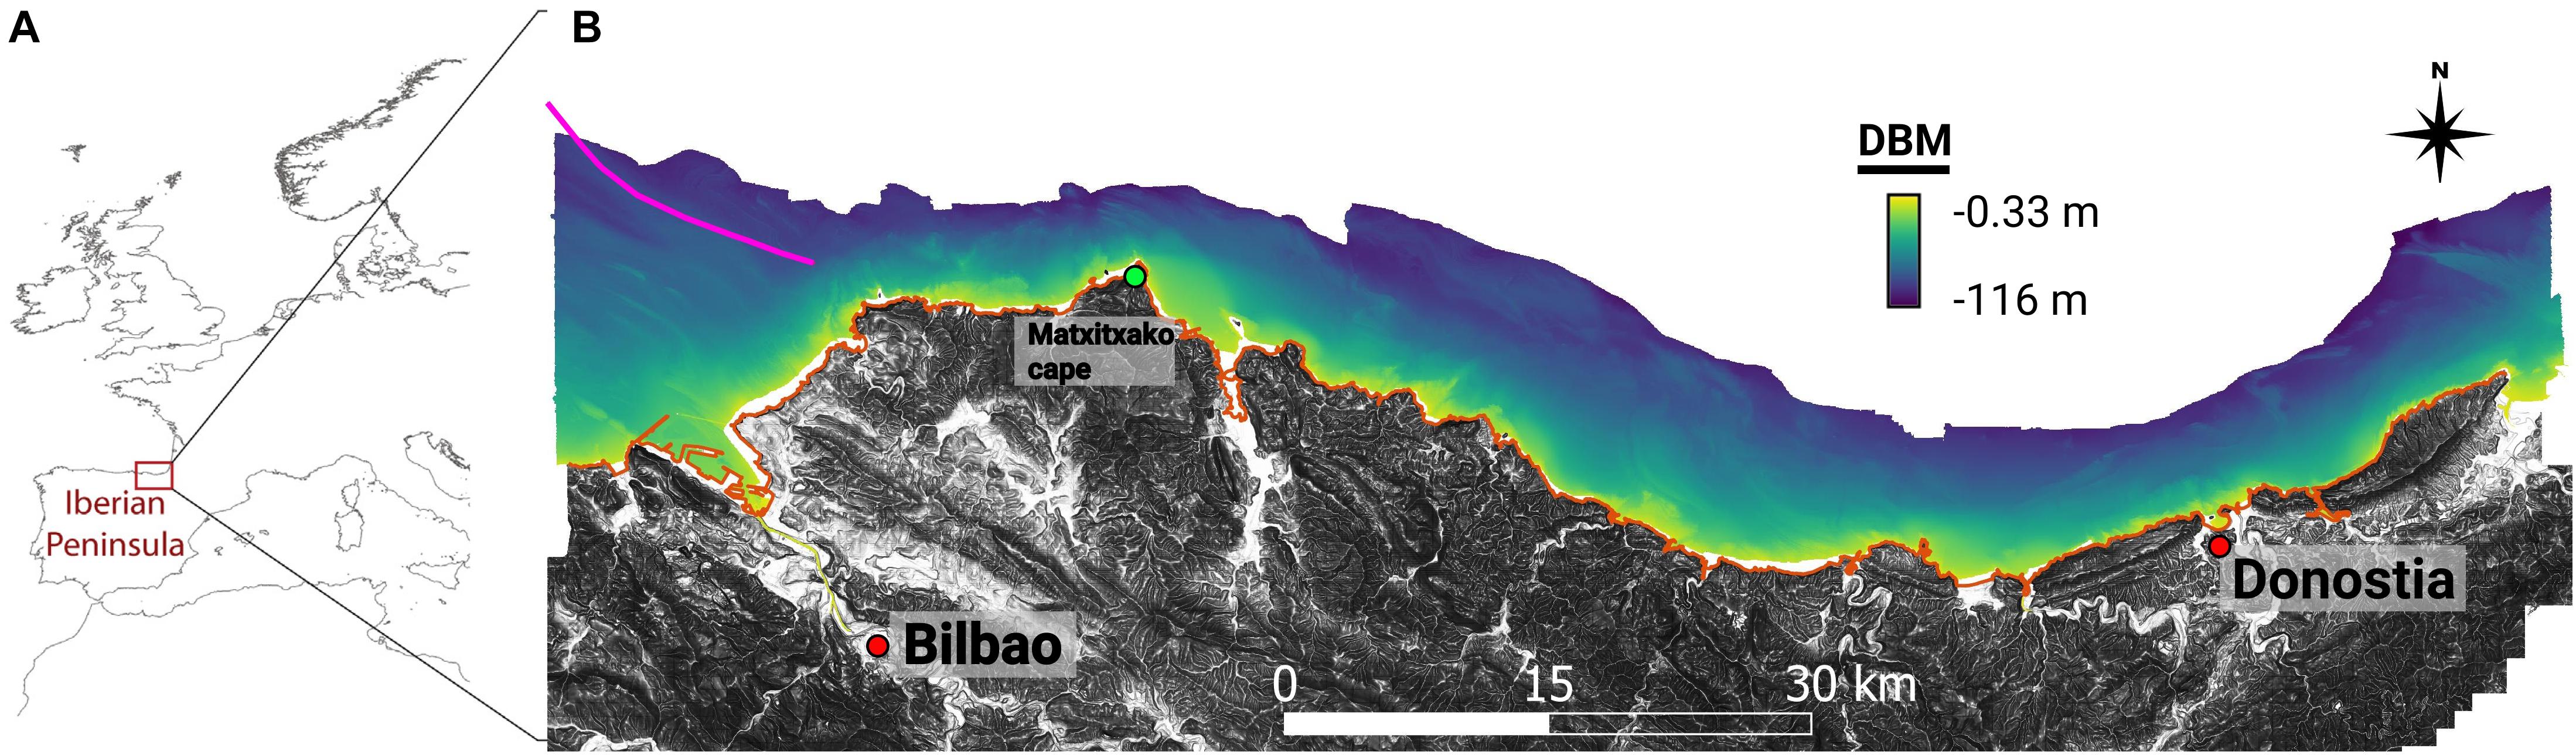
Figure 1. The study area. (A) Location in Western Europe. (B) Digital Bathymetric Model (DBM) of 5 m resolution. The violet line represents the fault described as active during Pliocene or possibly Quaternary times (IGME and ENRESA, 1998).
Geology of the Study Area
The substratum of the studied coastal stretch is mainly composed of Cretaceous and Tertiary flysch, and at some sites, urgonian limestones are also outcropping (Ábalos, 2016; Euskal Kostaldeko Geologia Sinplifikatua, 2017). The submerged sequence of marine terraces is located on a passive margin that experienced uplift during Upper Cretaceous – Miocene times, in the Alpine orogeny (García-Mondéjar et al., 1985). Along the Cantabric Margin, various uplift rates have been reported: 0.06 – 0.15 mm/yr (Jiménez-Sánchez et al., 2006; Jimenez-Sánchez et al., 2011), 0.07 – 0.15 mm/yr (Alvarez-Marrón et al., 2008) or 0.08 mm/yr (Aranburu et al., 2015). Regarding neotectonics, the Quaternary Active Faults Database of Iberia (QAFIv3) (IGME, 2015) does not report any fault in the area. Nevertheless, taking into account the neotectonic map (IGME and ENRESA, 1998), to the east of the study zone a fault is mapped and proposed to have been active during Pliocene or possibly Quaternary times (Figure 1).
The modern coastline is roughly E-W oriented. More than 70% of it is characterized by moderate to high sea-cliffs (20–150 m). Sandy beaches (predominantly of “pocket” type) make around 21 km (14%) (Pascual et al., 2004). Cape Matxitxako constitutes the main headland of this part of the Basque coast, where the continental shelf is the narrowest 7 km (Uriarte, 1998; Figure 1).
Oceanography of the SE Bay of Biscay
The southern coast of the Bay of Biscay is exposed to large storms from the NW, due to the North Atlantic low pressure systems (Galparsoro et al., 2010). Strong NW swell waves dominate and are the most common sea state within the study area (Galparsoro et al., 2010). Using the information of the Bilbao offshore buoy Liria et al. (2009) summarized that in summer the swell waves period is <10 s more than 75% of the time with representative heights of 1.5 m. In winter the swell waves have higher period (i.e., 13 s), and heights >2 m more than% 50 of the time. Several times a year, significant swell wave heights can exceed 5 m, and with return periods of 20 years the waves can reach 10 m.
Marine Terraces and Past Sea-Level Positions
Marine terraces are geomorphic markers that constitute the geological record of past sea level positions (Lajoie, 1986; Burbank and Anderson, 2011). These features are composed by a sub-planar surface that dips seaward, and are limited landward by a steep fossil sea-cliff (Lajoie, 1986; Figure 2). The intersection between the shore platform and the sea-cliff is called the shoreline angle, which represents the maximum height that reached the sea level in the marine terrace formation (Lajoie, 1986). Staircase sequences of coastal terraces, either marine, coral reef or sedimentary are present along several coasts, in any geodynamical context, due to the combination of sea-level variations and landmass uplift (Pedoja et al., 2011, 2014).
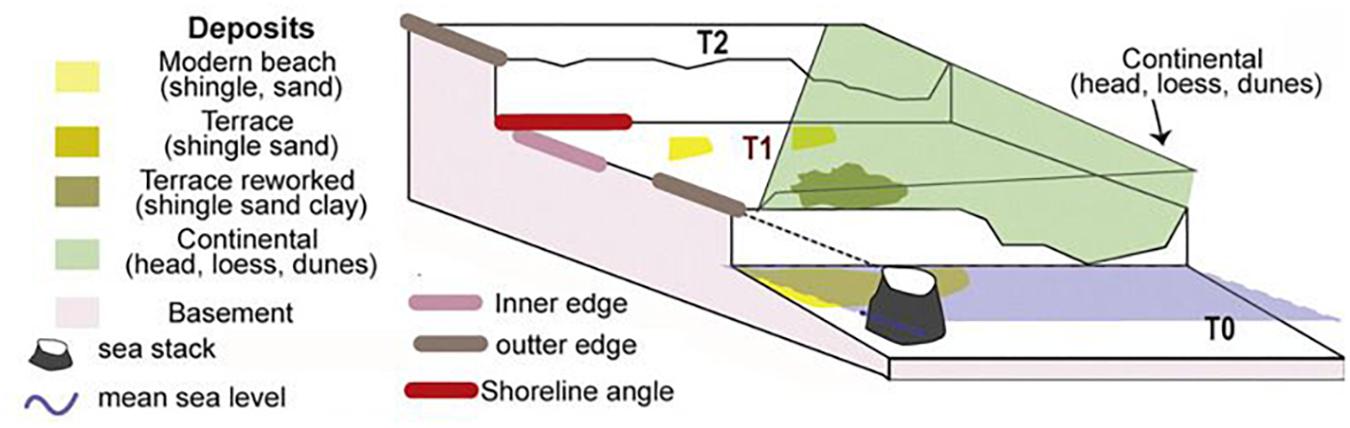
Figure 2. Marine terrace characteristics and sea-stacks (modified from Pedoja et al., 2018). T0, Modern rocky shore platform; T1, Marine terrace 1; T2: Marine terrace 2.
Rocky shores are dominated by erosive processes which leave morphological remnants such as arches, sea-stacks or active sea-cliff (Sunamura, 1992). More specifically, sea-stacks, are rocky columns that were originally part of the cliff, but that nowadays are separated from the mainland, creating an islet (Figure 2). The depth of the top of the sea-stack, if flat, can give an approximation of the depth of the immediately above terrace whereas its base lies on a former platform (Figure 2).
Materials and Methods
We used a 5 m resolution bathymetric Digital Bathymetric Model (DBM) of the Basque continental shelf until a depth of −116 m (with respect to the mean sea-level in Alicante). The DBM was generated through a Multibeam Echosounder between 2005 and 2008, with a high-resolution SeaBat 8125 and SeaBat 7125 MBESs (RESON, 2002, 2006; Galparsoro et al., 2010). Most of the work was carried out using the SeaBat 7125 model; its operational frequency is 400 kHz, producing 256 beams in a 128° angle swath and using up to 50 swaths per second. The beam width is 0.5° along-track and 1° across-track, producing very small footprints; these, in turn, result in high horizontal resolution digital elevation models (DEM). The MBES was coupled with an Agp132 (TRIMBLE) global position system, receiving differential corrections. An OCTANS III (IXSEA) gyrocompass and motion sensor was utilized, to compensate for the movement of the vessel. Furthermore, a portable SVP 15 (RESON) was used, to measure sound velocity profiles throughout the entire water column (Ernstsen et al., 2006). The software package PDS2000 was used to integrate the MBES data, with the information from all the auxiliary sensors during the surveys – data acquisition and synchronization. This software was used in real-time, as well as in the post-processing of the integrated data. Tidal correction was applied using the nearest tide gauge and 1 m resolution seafloor DBM was produced in projected coordinate UTM, Zone 30 N (WGS84). The DBM was generalized into a 5 m grid, in order to increase the speed of computational processing; finally, it was exported into ESRI grid format and integrated into a Geographic Information System (Galparsoro et al., 2009).
The information relative to the seafloor type was obtained from the spatial data infrastructure of the Basque Government1. Different lithostratigraphic maps are available for the emerged part of our study area, with different scale and detail levels. The lithologies of the studied coastal stretch were provided by the Basque Coast Geopark (Euskal Kostaldeko Geologia Sinplifikatua, 2017), as well as from mapping by Ábalos (2016).
Morphometric Analysis
To detect the submerged fossil rocky-shore platforms and sea-cliffs, various methods were combined. First, we developed a Surface Classification Model (SCM) using TerraceM® (Jara-Muñoz et al., 2019; Figures 3A,B). The SCM linearly combines the slope and the roughness of the terrain to discriminate different geomorphic elements of submerged marine terraces. Using the seafloor type map from the spatial data infrastructure of the Basque Government, we selected from the DBM only the areas that laid on rocky and mixed (rocky/sedimentary) sea floors. Then, potential fossil sea-cliffs were isolated, by combining slope threshold values of 0.5°, 1°, and 2° and roughness threshold values of 0.3, 0.6, and 0.9.
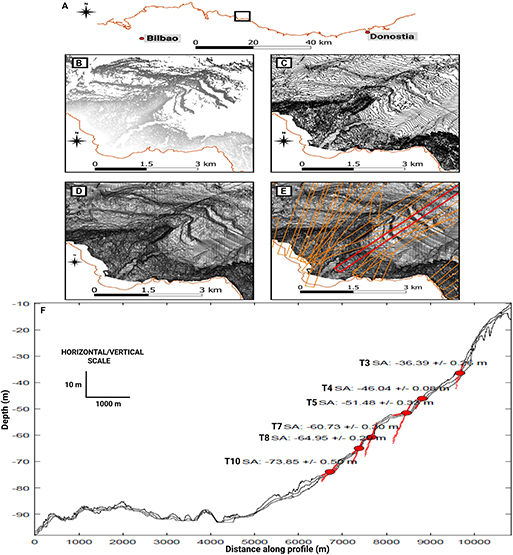
Figure 3. Submerged fossil sea-cliffs detection and shoreline angle mapping. (A) Study area coastline, the black box highlights the area detailed in the next figures. (B) Surface Classification Model map. (C) Contour map. (D) Hillshaded map. (E) Bathymetric swath profiles. The red swath profile is represented in (F). Bathymetric swath profile with shoreline angles (SA) and associated marine terraces.
To identify the submerged sea-cliffs, we also extracted a contour map from the DBM (Figure 3C) and the hillshaded map (angle of light incision set at 0°, and a vertical exaggeration factor at the maximum available value: 99.9). Such hillshaded map, discriminates the sediment bodies from the rocky seafloor areas and highlights other features such as submerged channels (Figure 3D).
To get the most accurate position and depth of the successive submerged shoreline angles, we used bathymetric swath profiles. We used a swath width of 250 m based on the resolution of the bathymetric datasets, orienting the profiles perpendicular to the trace of the fossil sea-cliffs (Figure 3E). We used the maximum topography from swath profiles to determine the location of shoreline angles, considering that the maximum topography represent the original terrace morphology without the effects of erosion. For that purpose, we marked two points to define the fossil sea-cliff and another two points to define the fossil platform. Then lineal regressions are calculated upon the segments enclosed by the points, and extrapolated to find the intersection that marks the position of the shoreline angle (Figure 3F). Vertical errors of shoreline angles are based on the extrapolation of the 2σ ranges of the linear regressions (Jara-Muñoz et al., 2019). The shoreline points lying on mainly sedimentary bodies were avoided, as they could underestimate their original height.
We used the original 5 m resolution DBM to map the shoreline angles of submarine terraces, to generate the hillshaded and contour maps. Instead we used a resampled version of 20 m/px in the detection and visualization of paleocliffs with the Surface Classification Model of TerraceM. The overall results are consistent after carrying out this resampling, as it can be observed comparing them with the hillshaded and contour maps.
Sea-Stack Analysis
Sea-stacks are relicts of eroded ancient marine terraces, and can be used to reconstruct the initial marine terrace morphology. The flat top of a given stack can indicate the depth of the terrace, above which the stack is emplaced. Such approach helps to detect the presence of submerged terraces in areas where nowadays their original morphology has been eroded and their shoreline angles are not detected. Thus, it could help to complete the sequence of terraces.
Sea-stacks are characterized by closed isobaths on the contour map, determinable with geographical information system (GIS). Then, we measured the range of the potential stacks from the bottom to the top, and we kept only the ones whose height is >2 m. Some of the closed isobaths were found on sedimentary zones, and consequently were not taken into account. Moreover, because some closed isobaths can be holes and depressions instead of sea stacks, the obtained close isobaths were also analyzed manually and the holes removed and discarded. Finally, the depth of the top of each stack was extracted from the bathymetry.
Such method to detect sea-stack through the analyze of closed isobaths has also its limitations. First, the real height of the stack could be underestimated in some occasions. Second, the detected feature can be a wide islet, without a columnar morphology. Third, the top of the sea-stack can be sharp instead of flat.
Modeling Marine Terraces Generation
Landscape evolution models (LEM) can be useful to estimate the age of marine terraces, especially when direct sampling and dating are difficult, as for submerged sequences of marine terraces. Herein, we used a landscape evolution model based on the wave energy dissipation theory proposed by Sunamura (1992). The model assumes wave erosion as a linear function of the rate of wave energy dissipation (Sunamura, 1992) that follows an exponential increase in relation to depth landward (Jara-Muñoz et al., 2019). The model allows simulating the generation and erosion of submerged terraces during a certain period of time, for different morphologic, climatic, and tectonic conditions.
For this study, a composite sea-level curve was generated combining various sea-level data. In this study we infer that marine terraces formed before MIS 5e have a lower probability to be preserved due to erosion from subsequent sea-level variations (e.g. Jara-Muñoz et al., 2016). Indeed, terraces before the MIS 5e may have been affected by strong wave erosion during the episode of sea-level rise that preceded the MIS 5e and former highstand periods before. For that reason, we used a composite sea-level curve truncated at 128 ka. Our composite sea-level curve for Upper Pleistocene (Figure 4) was obtained combining the sea level curves used by Arz et al. (2007), Stanford et al. (2011), and Grant et al. (2012). The sea-level curve of Stanford et al. (2011) is itself a combination of previously published sea-level curves (Lighty et al., 1982; Shinn et al., 1982; Robbin, 1984; Macintyre et al., 1985, 1995, 2004; Digerfeldt and Hendry, 1987; Fairbanks, 1989; Chappell and Polach, 1991; Bard et al., 1996, 2010; Hanebuth et al., 2000, 2009; Yokoyama et al., 2000, 2001; Cutler et al., 2003; Toscano and Lundberg, 2003; Peltier and Fairbanks, 2006).
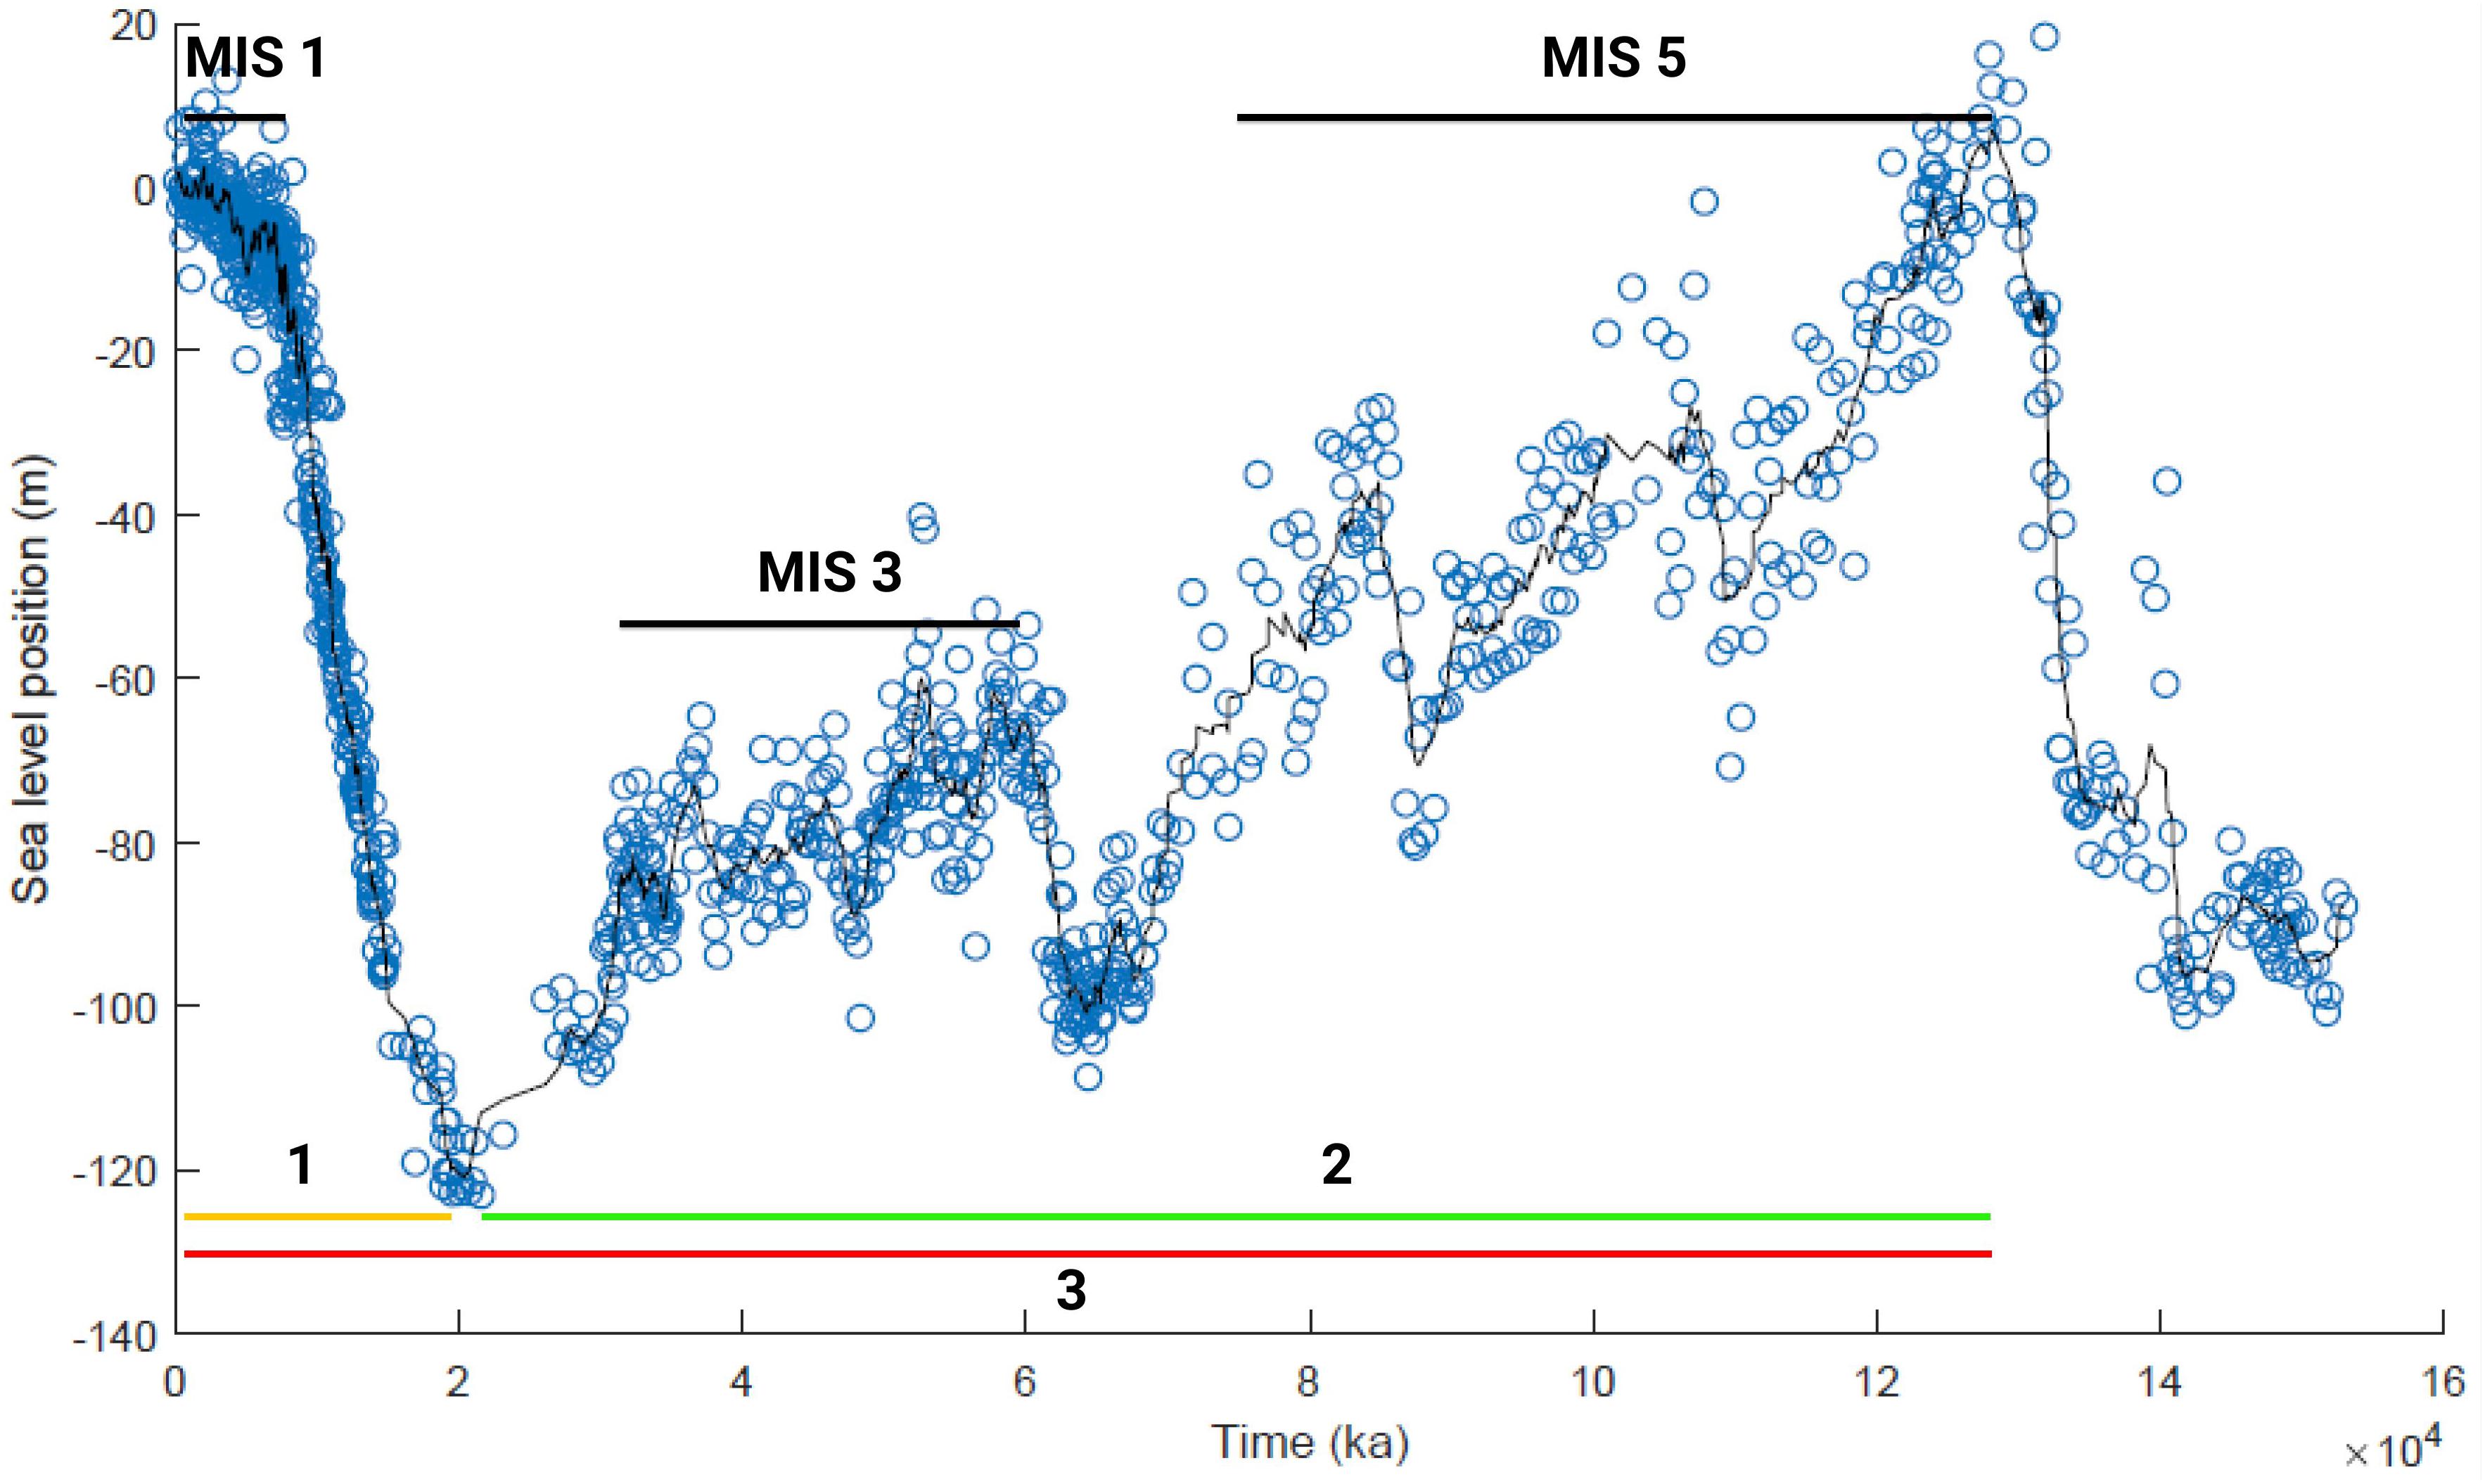
Figure 4. The generated sea-level curve, and the tested three scenarios. MIS, marine isotopic stages from Railsback et al. (2015).
We performed several sensitivity tests to find the best scenarios that may favor the development and preservation of submerged marine terraces (Figure 4):
• Scenario 1: The submerged terraces were formed between 20 ka and present (the yellow line in Figure 4).
• Scenario 2: The submerged terraces were formed between 128 and 20 ka (the green line in Figure 4).
• Scenario 3: The submerged terraces were formed between 128 ka and present (the red line in Figure 4).
The wave height of the study area was estimated from 9 years of radar altimetry measurements (produced and distributed by the AVISO website of the French Spatial Agency, CNES, at www.aviso.com as part of the Ssalto/Duacs ground-processing segment). Different latitude/longitude positions were tested to extract the wave height. We selected wave height values between 3.7 and 3.4 m which are the 90% percentile of the data obtained in our study area (Supplementary Figure S1), assuming that these waves would be the most erosive ones related to storm events (Jara-Muñoz et al., 2016).
To constraint uplift rates in this area we used the database of Pedoja et al. (2018) based on the MIS5e benchmark widely distributed along the western coast of Europe. Estimates in the proximities to our study area, show uplift rates of 0.049 m/ka (Supplementary Figure S1), in Castro Urdiales (Guilcher, 1972; Flor and Flor-Blanco, 2014) and in Pointe Saint Martin (Biarritz) (Deler, 1932).
The initial slope of the model was constrained by measurements along predefined profiles in the continental shelf. For that, two points were selected on the profile, and using the distance and elevation differences, the inclination was calculated. The slopes from the bottom to the top of the profile were lower than 2° in most cases. For modeling values of 0.5°, 1°, 1.5°, and 2° were tested.
We constraint the initial erosion rates based on previous studies close to our study area. To the West of our study area, in the coast of Lapurdi, mean coastal retreat ranges from 0.05 to 0.5 m/yr, but are typically of 0.15 m/yr (Aubié et al., 2011). To the East, in Galicia, Perez-Alberti et al. (2013) reported rates between 0.09 and 1.18 m/yr (typically between 0.21–0.38 m/yr) in granites. Even though in the model the input data is not directly the cliff retreat, for the initial erosion rates, values of 0.25, 0.5, 0.75, and 1 m/yr were tested. In scenario 1 (i.e., sequence formed during 0–20 ka), the initial erosion rates tested for 2° of slope, were only 0.25 and 0.5 m/yr.
Results
The Submerged Marine Terrace Sequence of the SE Bay of Biscay
The Surface Classification Model (SCM), the hillshaded map and the isobath map reveal a staircase morphology of the continental shelf, with irregularly distributed and preserved submerged marine terraces. In advance, the submerged marine terraces mapped are the ones that present a better preserved and recognizable fossil sea-cliffs. Submerged terraces are recognized from the eastern part of the study area until Barrika to the West, but the best preserved sequence is observed in the central part, especially in front of Ogeia (Figures 5A,B). The low general slope of the continental shelf has to be taken in mind, and note, that even the fossil sea-cliffs are highlighted clearly in some areas (e.g. Figure 3C), the slope of some of those cliffs can be of very low degree.
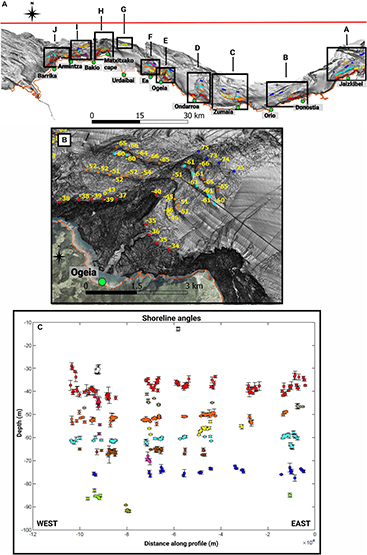
Figure 5. Shoreline angle distribution in the study area. (A) General distribution of submerged marine terraces, with detected shoreline angles in circles. The red line corresponds to the profile along which the shoreline angles are represented on (C). (B) Amplified segment in front of Ogeia (box E). Circles represent shoreline angles and the numbers their depths. Dotted blue lines represent submerged channels. (C) Shoreline angles along the profile. From top to bottom: Light gray, T1; White, T2; Red, T3; Garnet, Mix between T3 and T4; Dark gray, T4; Orange, T5; Violet, not assigned terrace level, as its depth notably increases to the south. Yellow, T6; Light blue, T7; Brown, T8; Pink, T9; Dark blue, T10; Light green, T11; Dark green, T12.
The detected submerged terraces distribution along the continental shelf and the main characteristics of the stretches that we defined are summarized on Tables 1, 2. The images of each continental shelf segment are available in the Supplementary Material (Supplementary Figures S2–S9, S16) and in the Supplementary Video.
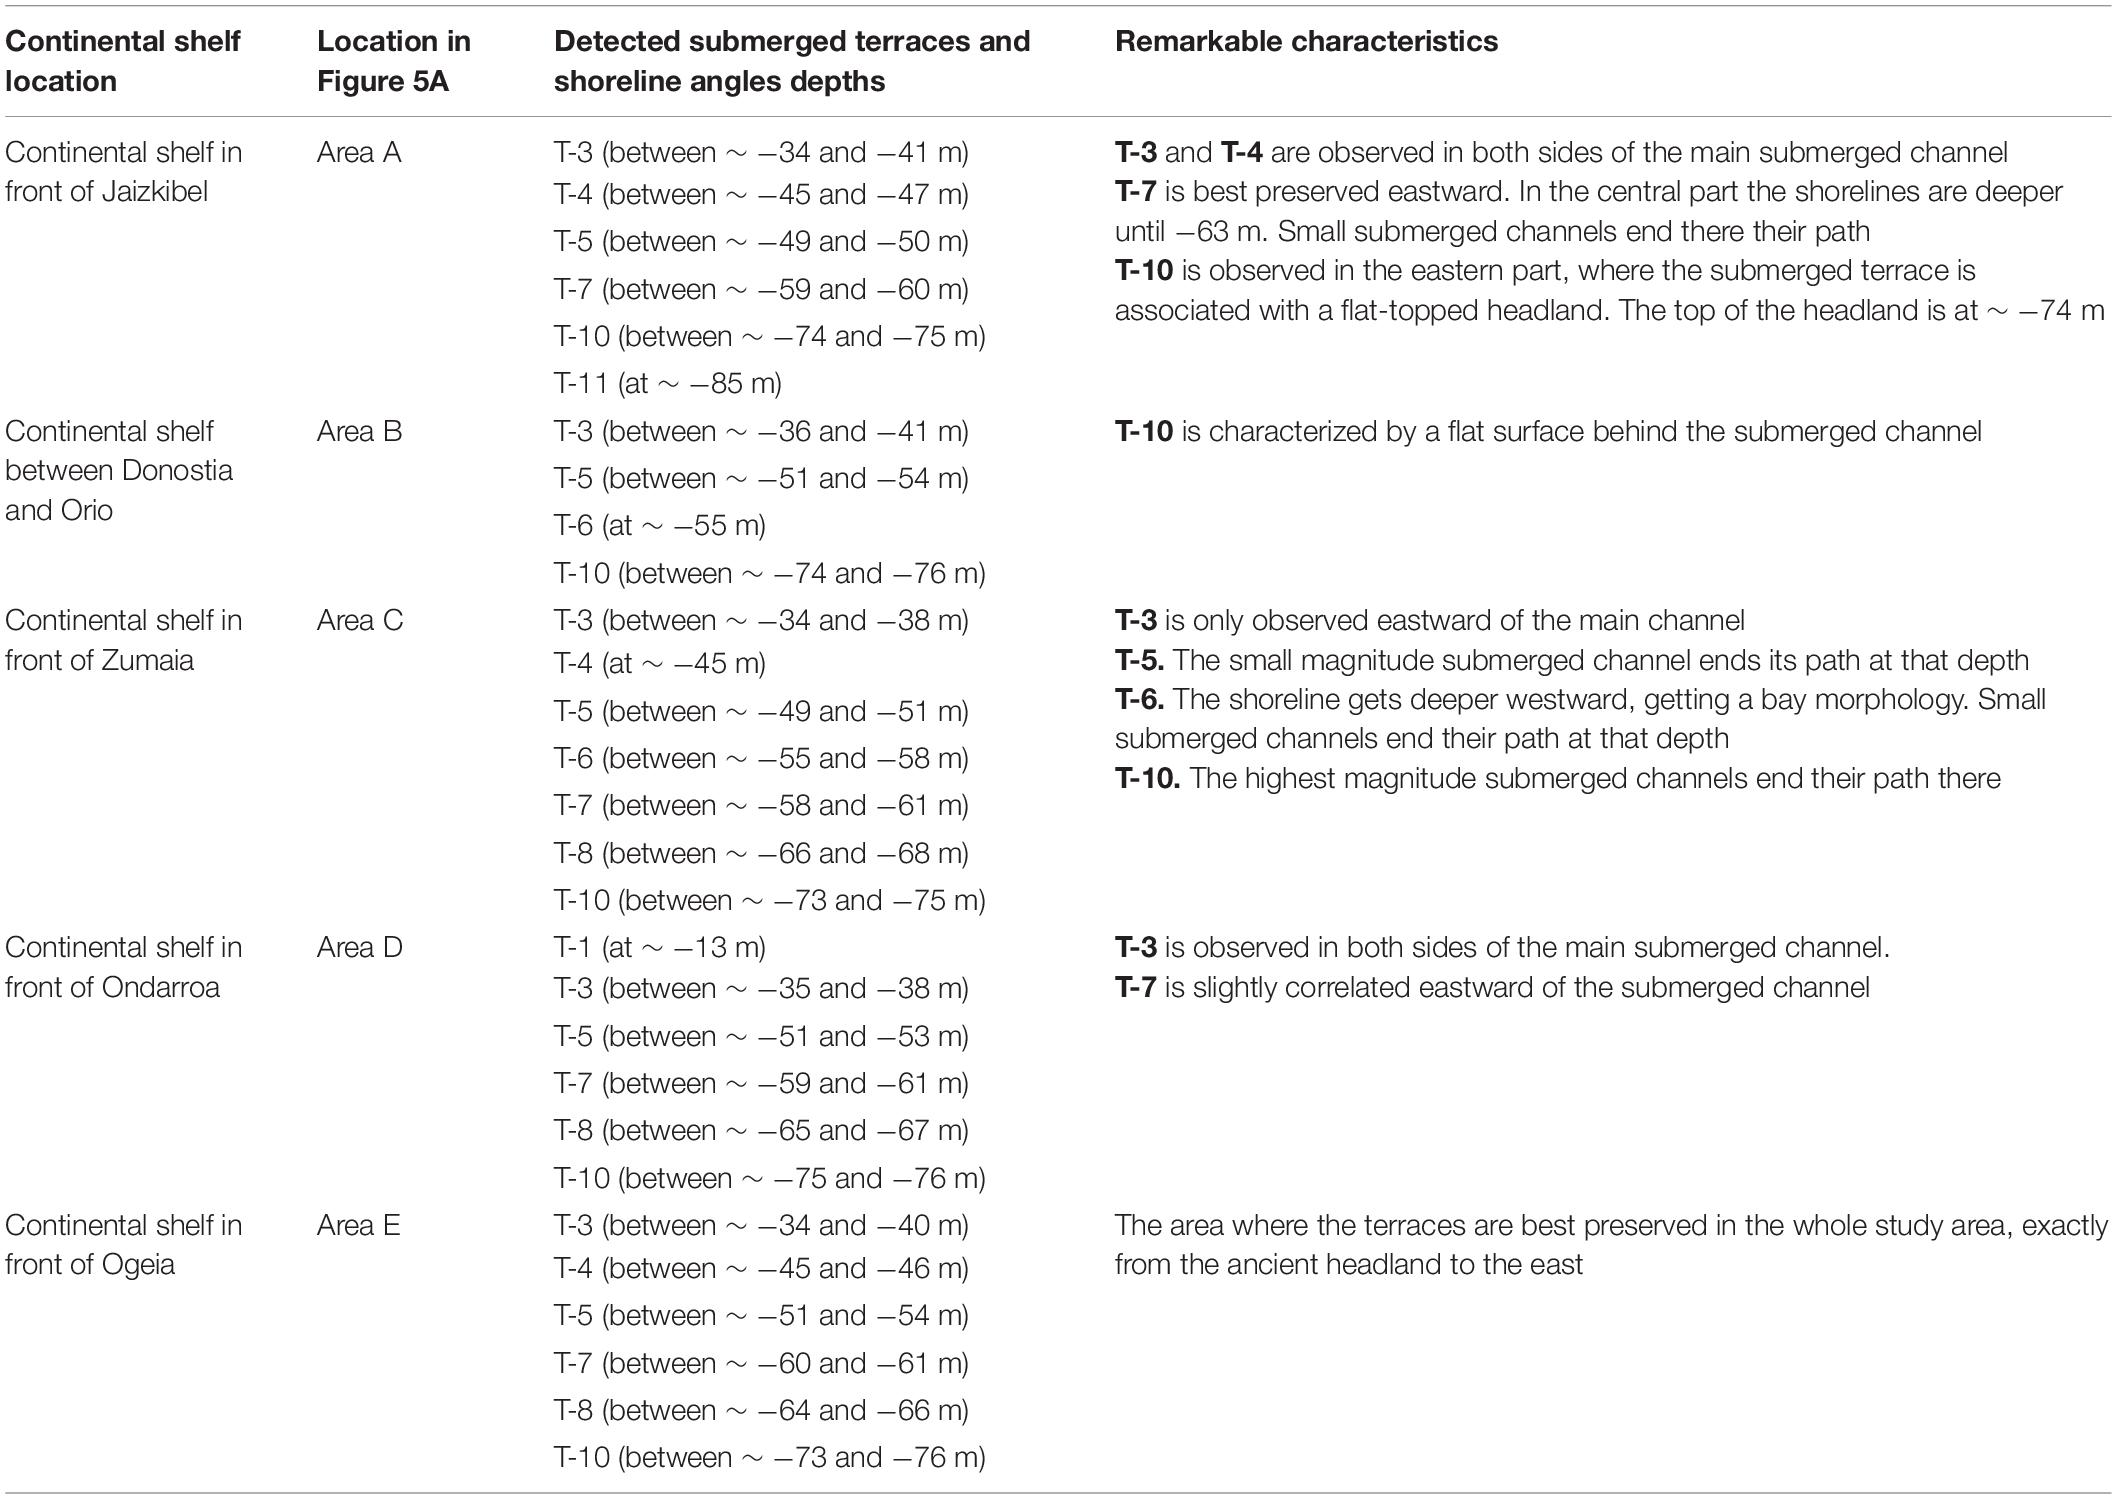
Table 1. Submerged marine terrace distribution from Jaizkibel to Ogeia in segments of the continental shelf with the most remarkable characteristics.
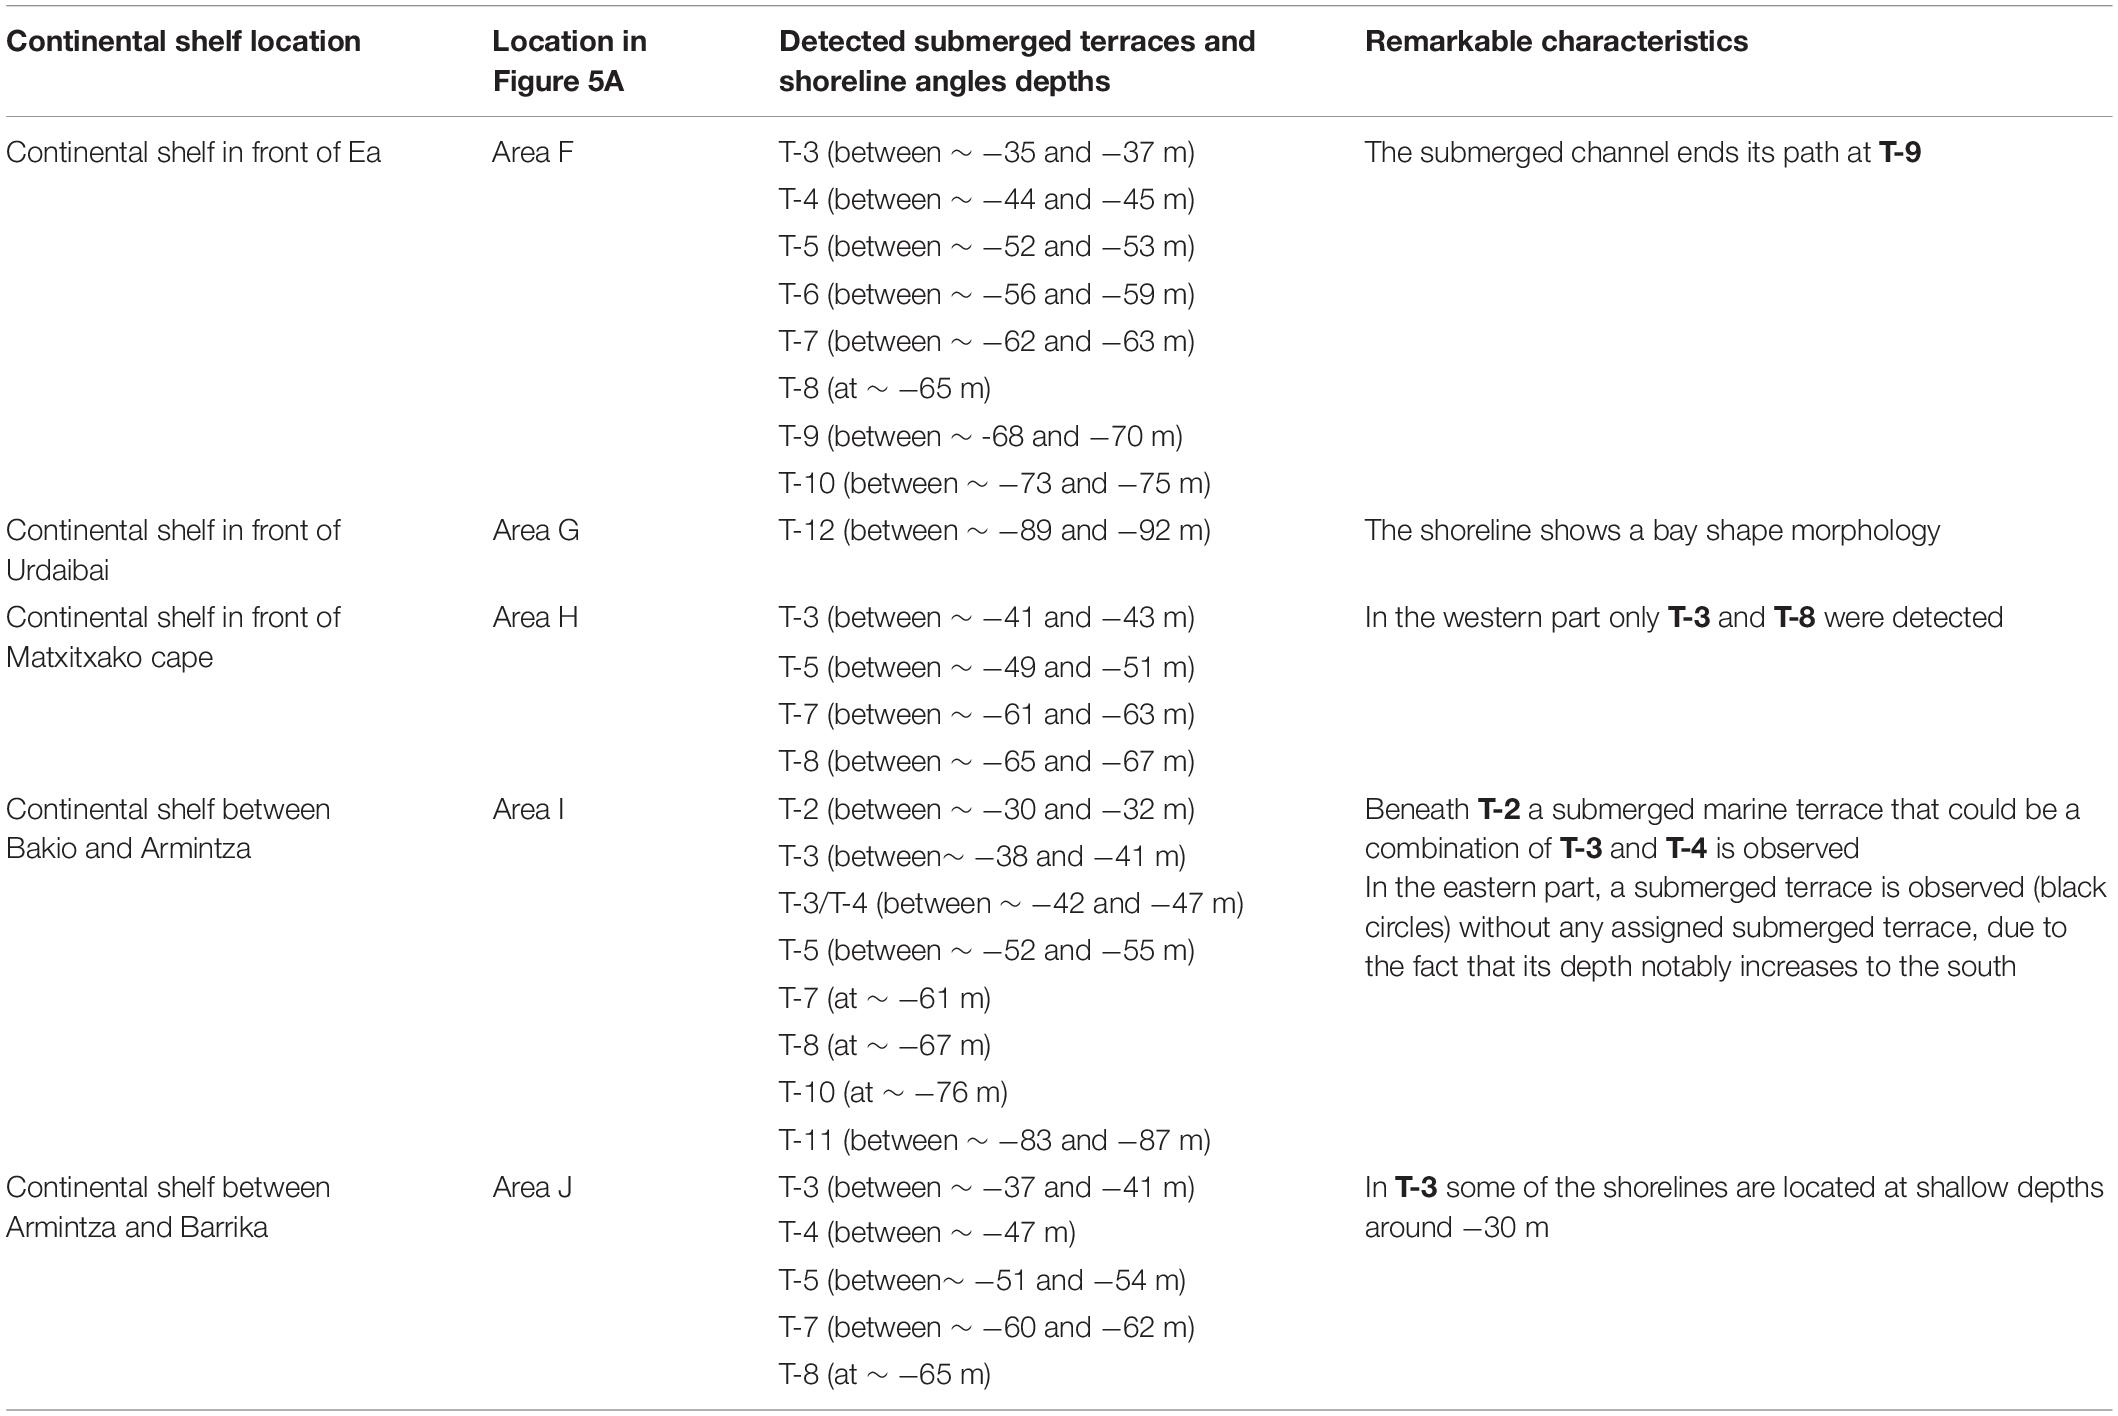
Table 2. Submerged marine terrace distribution from Ea to Barrika in segments of the continental shelf with the most remarkable characteristics.
We detected 12 submerged marine terraces in our study area with their shoreline angles drowned between: ∼−13 m (T1), ∼−30 and −32 m (T2), ∼−34 and 41 m (T3), ∼−44 and −47 m (T4), ∼−49 and 53 m (T5), ∼−55 and 58 m (T6), ∼−59 and 62 m (T7), ∼−65 and 67 m (T8) ∼−68 and 70 m (T9), ∼−74 and −77 m (T10), ∼−83 and −86 m (T11), and ∼−89 and 92 m (T12). Nevertheless, the ones that show more lateral continuity and are best preserved, especially in the central part of the continental shelf, and correspond to T3, T4, T5, T7, T8, and T10 (Figure 5C).
Sea-Stacks Frequency at Different Depths and Their Distribution
Quantitatively, the sea-stack top depth and frequency histogram (minimum height 2 m), highlights depths where the number of the stacks is higher than at other depths: −19 m, −26 m, −29 and 30 m, −50, 256 m, −54 m, −61 m, −75 and 76 m, −83 m, −90 m and −93 and 94 m. There are two differentiated groups: one between ∼−32 and ∼−17 m with a higher amount of stacks (more than 50 in some cases) and another between ∼−32 and ∼−95 m, for which there are less stacks (mainly less than 30). In this last group, the number of peaks is especially high at three depths: −54, −75/−76 and −90 m (Figure 6).
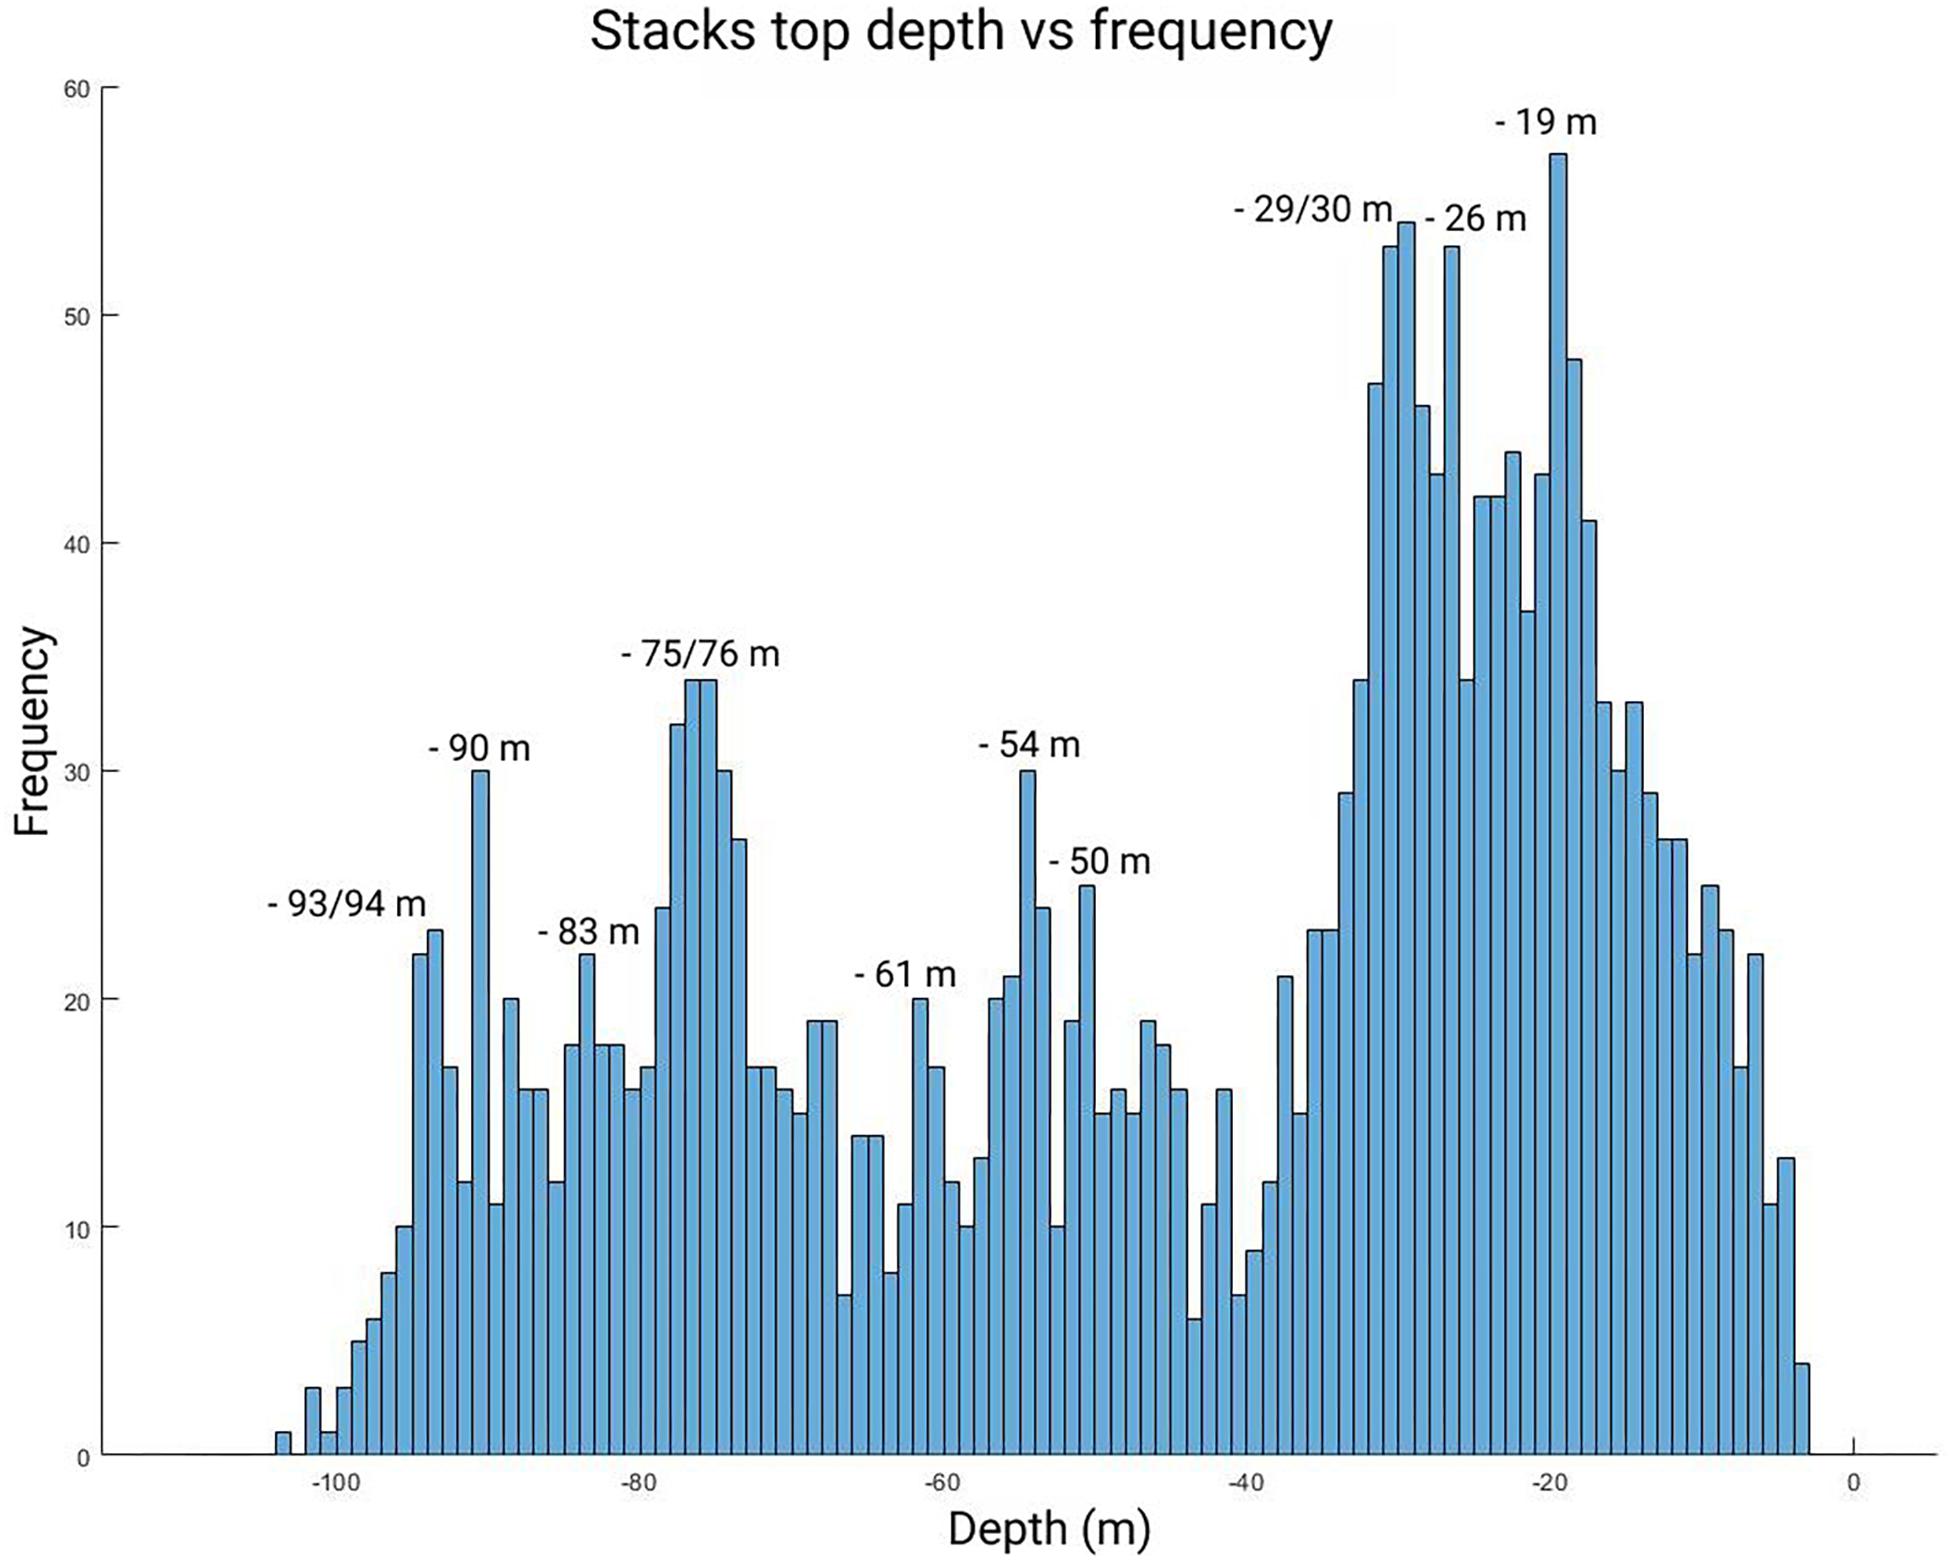
Figure 6. Sea-stacks top depth and frequency. At –19, –26, –29/30, –50, –54, –61, –75/76, –83, –90, and –93/–94 m the number of peaks is higher. Moreover, there is a difference in the number of stacks on shallower and deeper than ∼ –32 m.
Qualitatively, in some zones there is a concentration of sea-stacks whose top coincide at a similar depth, and that seem to indicate eroded ancient platforms or stands in sea-level. Some of those potential levels are highlighted in Figures 7, 8. The rest of the areas are available in Supplementary Figures S10–S15.
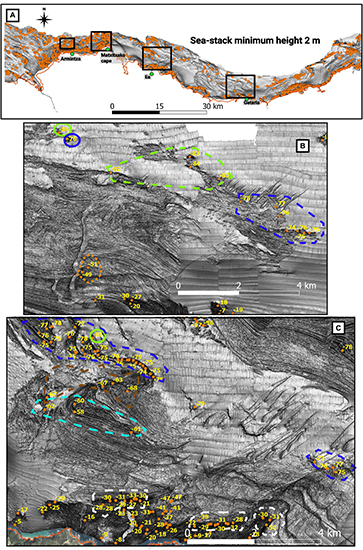
Figure 7. Sea stacks distribution whose height is minimum 2 m represented by orange circles. The numbers indicate the depth of the top of the stacks. (A) Sea stacks distribution in the study area. (B) and (C) Areas in front of Getaria and Ea, respectively. Dotted lines highlight stacks that could be associated with previously detected submerged terraces. White, T2; Orange, T5; Light blue, T7; Brown, T8; Dark blue, T10; Light green, T11.
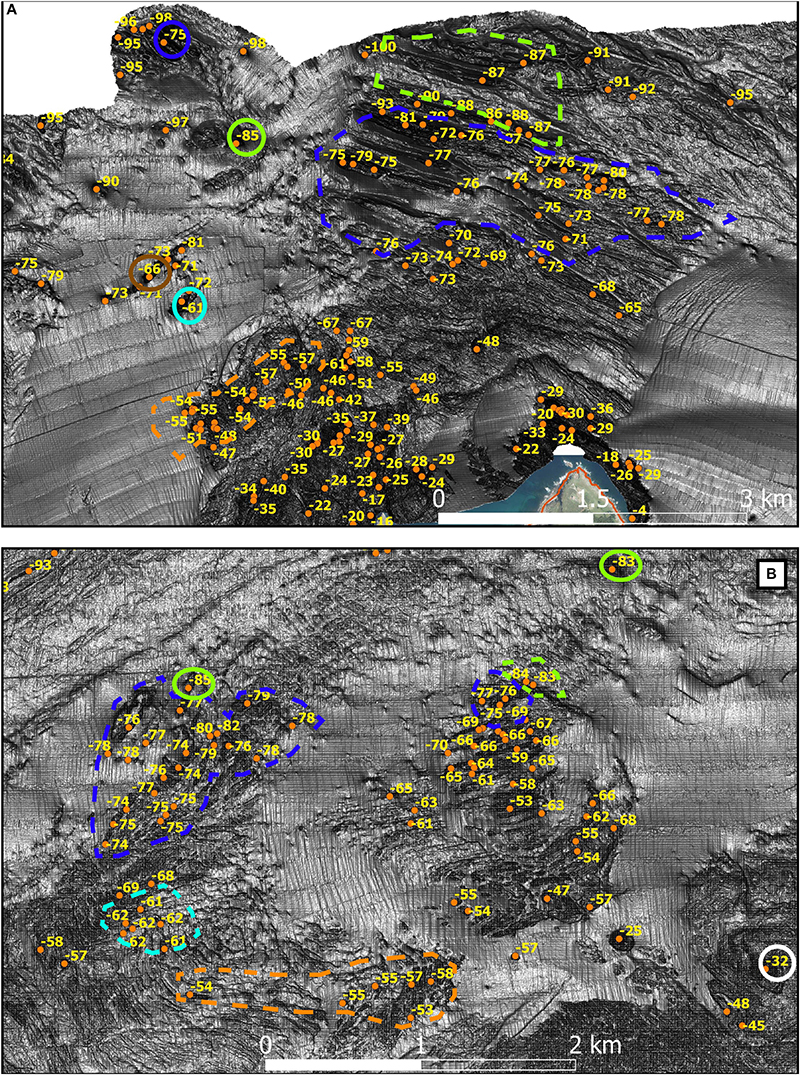
Figure 8. Sea stacks distribution whose height is minimum 2 m represented by orange circles. The numbers indicate the depth of the top of the stacks. (A,B) Areas in front of Matxitxako cape and Armintza, respectively. Locations are in Figure 7A. Dotted lines highlight stacks that could be associated with previously detected submerged terraces. White, T2; Orange, T5; Light blue, T7; Brown, T8; Dark blue, T10; Light green, T11.
Modeling Submerged Marine Terrace Sequence Generation
The best time span for submerged marine terrace creation is between the Last Interglacial Maximum and the Last Glacial Maximum (LGM). In this scenario, well developed submerged terraces are generated at ∼−6, ∼−36, ∼−52, ∼−68 and ∼−118 m. Other lower magnitude shoreline angles are detected at ∼−80 and ∼−97 m (Figure 9A). The profile generated between MIS5e until nowadays, shows a smoothed and curved profile, with very low magnitude cliffs. Along this profile, the inflection points at ∼−36 and ∼−68 m are remarkable (Figure 9B). The large morphological differences between both scenarios are due to the effect of the last period of sea-level rise after the LGM. Thus, the last transgression would have reworked the former coastal landscape and eroded older geomorphic evidences of past sea-level positions, giving as a result an smoothed surface.
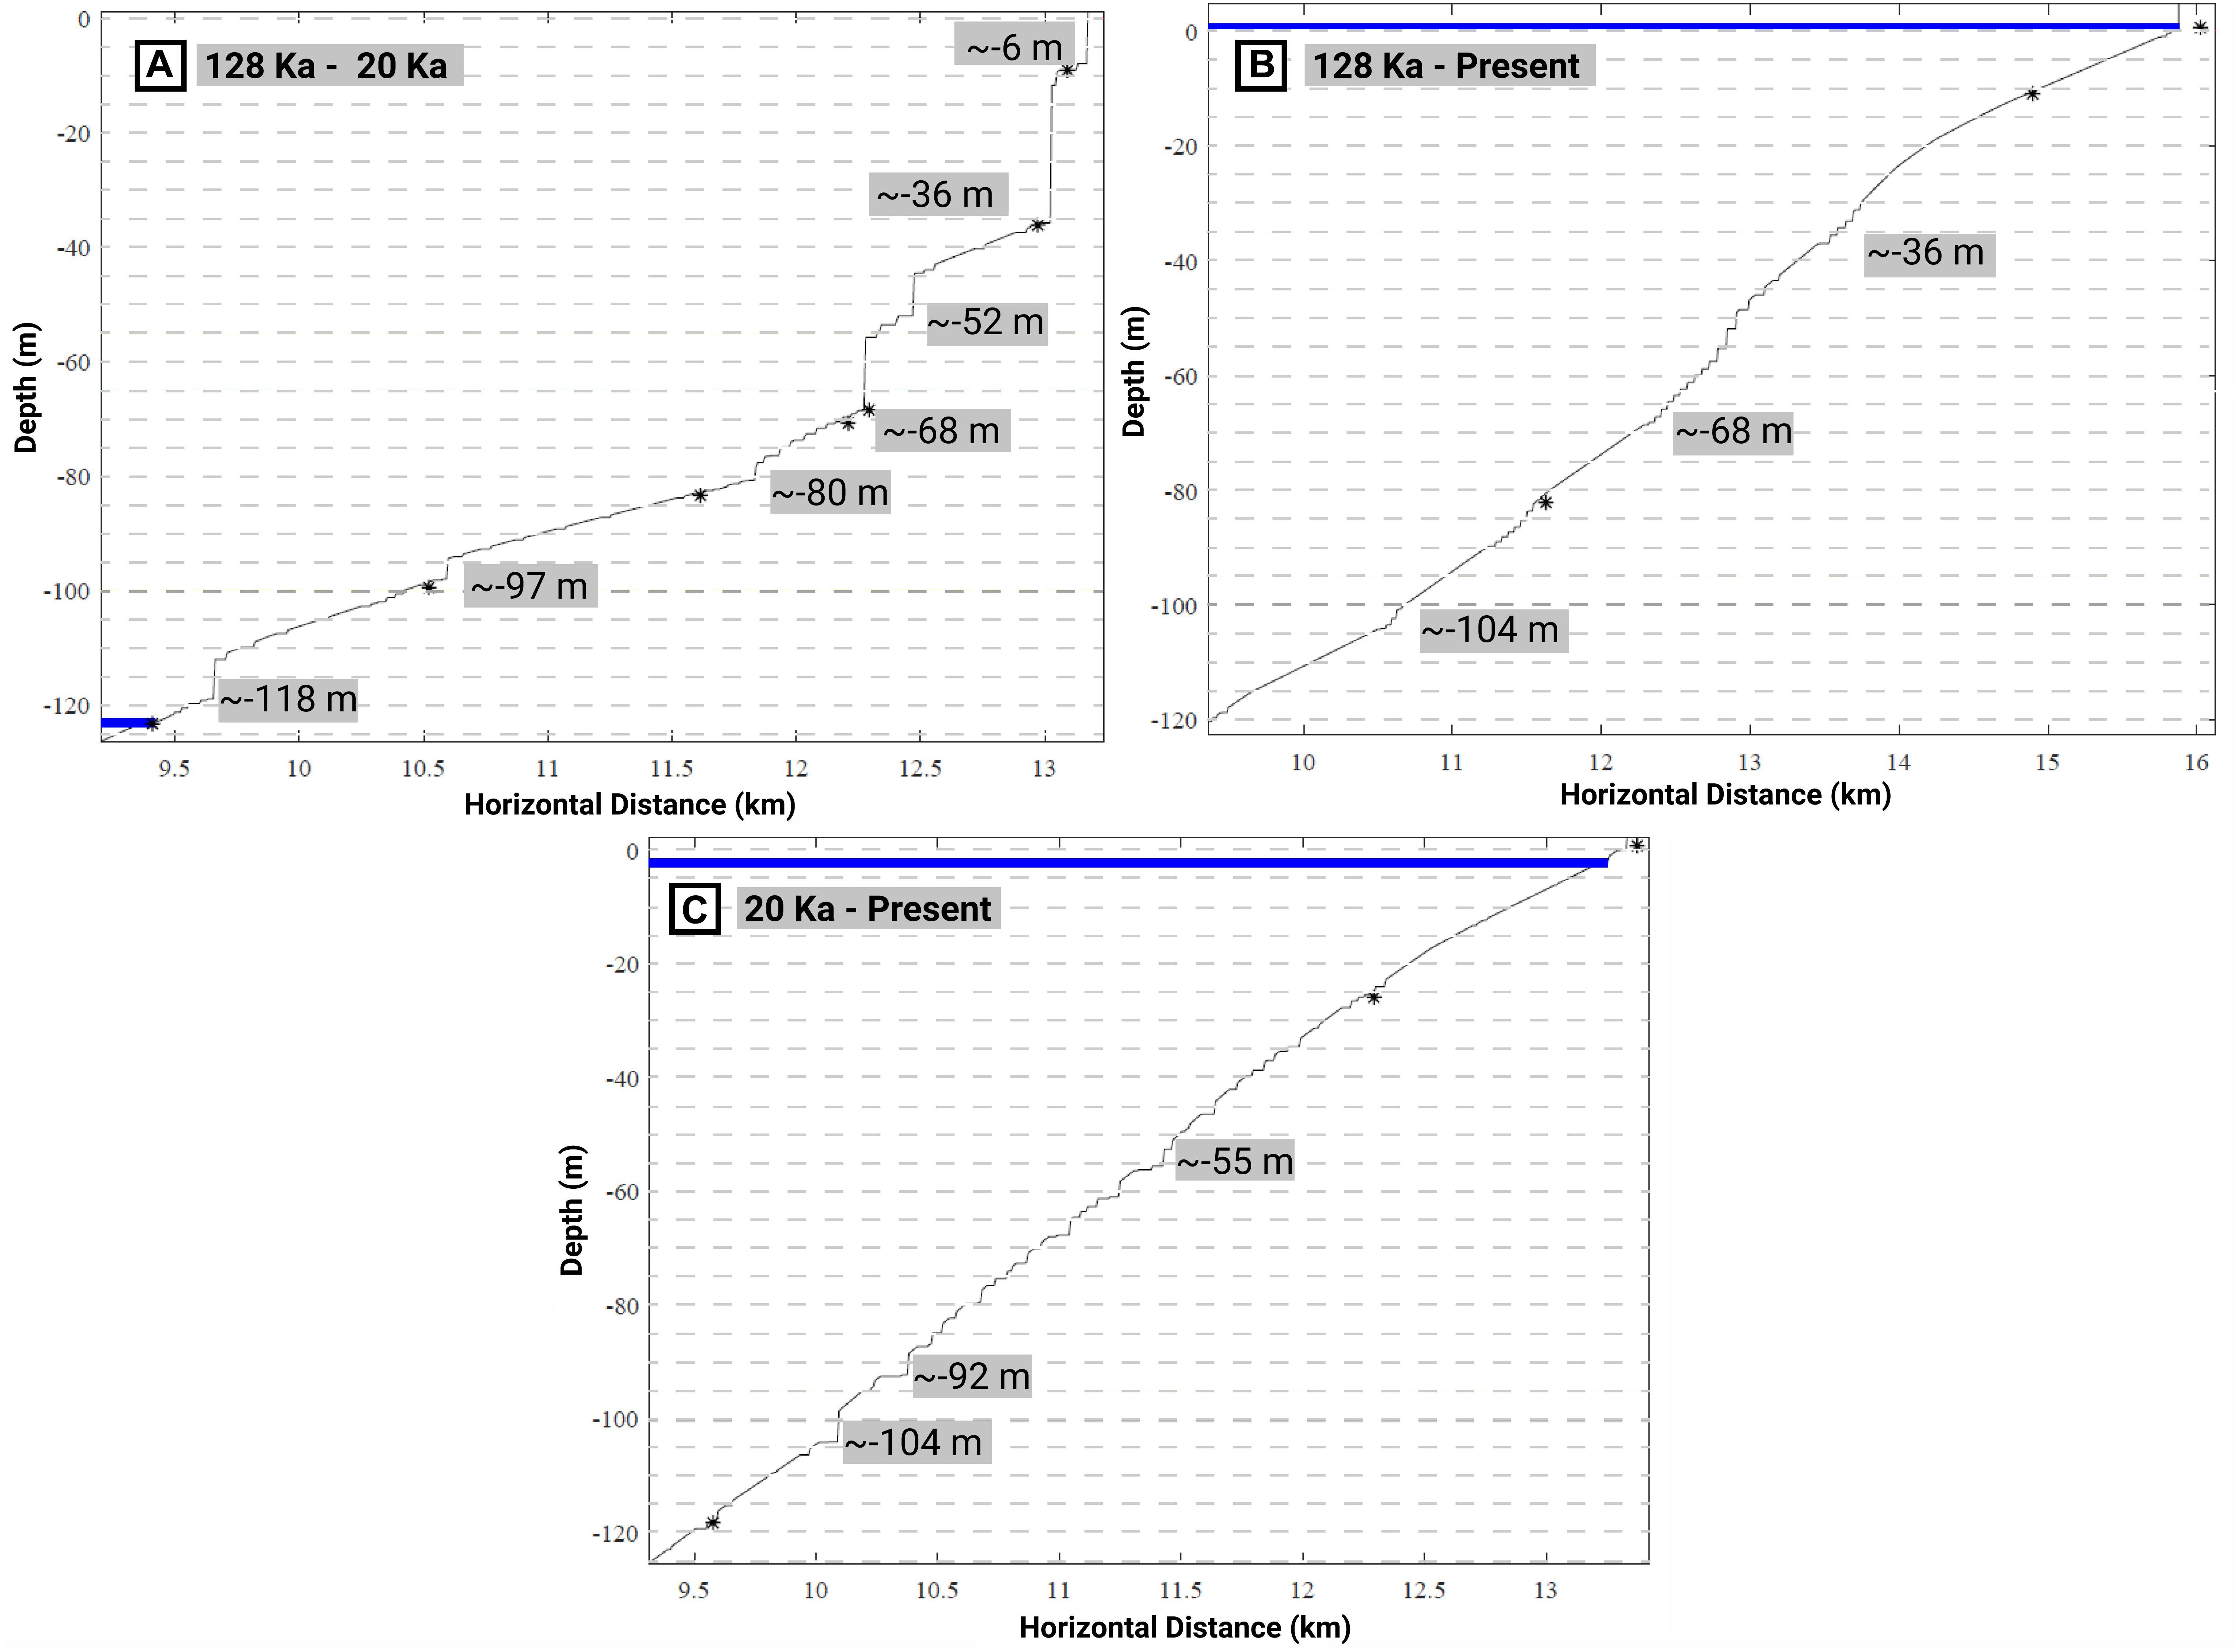
Figure 9. Modeled profiles of the LEM for the three scenarios tested for the formation of the sequence of submerged marine terraces (A–C). Numbers in gray boxes are the depth of the detected submerged shorelines within the models. Dashed lines indicate depth every 5 m. Asterisks are shorelines automatically extracted by the LEM. The slope and initial erosion rates to generate those profiles were set 2° and 1 m/a for scenarios (A,B); and 0.5 m/a, respectively, for scenario (C).
The scenario related to the last transgression, is characterized by a profile with poorly marked cliffs where the main shorelines are located at ∼−92 and ∼−104 m (Figure 9C). In this scenario the maximum initial erosion rate considered for modeling was of 0.5 m/yr.
Discussion
Processes Implied in the Submerged Marine Terraces Distribution
In the attempt to elucidate the factors that control the location and spatial variability of the submerged marine terraces, we analyzed the effects of wave climatology, lithology and stratification direction. Nevertheless, didn’t observe clear control from a single factor but what we suppose is the combination of these variables.
Wave Climatology
Wave direction and energy, can affect to the formation and development of rocky shore platforms (e.g. Trenhaile, 1999). The data available from the Bilbao offshore buoy (Boya de Bilbao-Vizcaya, 2019), record main wave directions of N292.5°E and N315°E (Figure 10A). Considering the present coastline direction, the marine terrace sequence is best preserved in zones where the coastline is located parallel to wave direction. In this sense, the presence of Matxitxako cape, could act as a barrier, reducing the energy of the waves eastward of that point. The study carried out by Galparsoro et al., 2008 regarding the annual power distribution along the coast, could be correlated with waves energy along our study area (Figure 10B). Their figure (Figure 10B) confirms the low energy in the central segment of the analyzed coastal stretch. In the best preserved submerged marine terrace sequence (Figures 3C, 5B), it is also visible the effect of wave direction in terrace preservation. To the east of the headland (which would be protected from the waves) the levels are clearly preserved, whereas the western flank, exposed to the main wave direction, exhibit submerged terraces that are not equally developed.
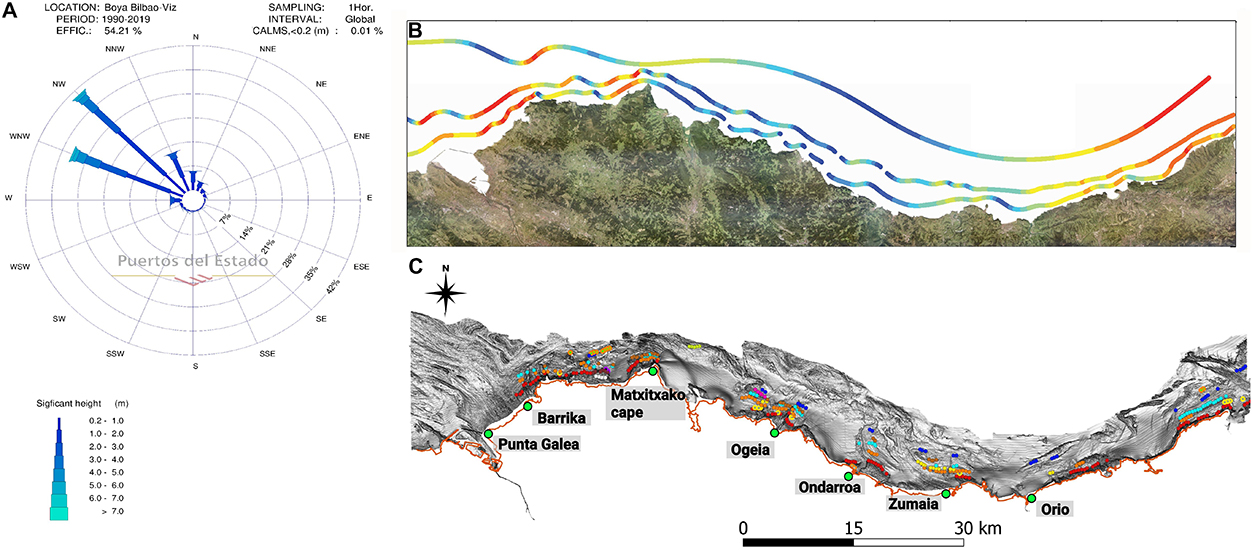
Figure 10. Wave climatology and shoreline angles distribution. (A) Bilbao offshore buoy wave direction and height map (Boya de Bilbao-Vizcaya, 2019). (B) Annual power map from Galparsoro et al. (2008), which could be correlated with wave energy (red colors indicate highest power, and blue the lowest ones). (C) Distribution of detected shoreline angles.
From Barrika to the west no drowned shorelines were detected along most of the coast (Figure 10C). One fact that could explain the lack of shorelines could be that this coastal stretch is orthogonal to main wave direction and waves energy reaches its highest values at that sector. Such strong hydrodinamics conditions certainly would not favor the preservation of previously formed submerged terraces. Such observation would fit with observations made onshore as the coastal stretch Barrika to Punta Galea exhibits one of the best preserved and recognized rasa in our study area.
Nevertheless, the relation between high wave energy conditions and the lack of submerged marine terraces preservation, does not occur along all the studied shore. From Orio to the east and on the eastern flank of the Matxitxako cape, the modern coastline is perpendicular to wave direction (high hydodinamic), but some drowned marine terraces are well preserved. On the other hand, in front of Zumaia, Ondarroa and around Ogeia, with low hydrodinamics, the preserved submerged marine terraces distribution is different in each zone (Figure 10). Such observations suggests that other factors aside wave climatology influence the distribution of submerged marine terraces in this area.
Lithology
Several authors have pointed out on the effect of lithology and rock resistance in cliff recession rates, and hence in rocky shore platform generation (e.g. Sunamura, 1992; Woodroffe, 2002; Prémaillon et al., 2018). The main part of the studied coast is composed by flysch type rock successions from the Cretaceous period, and the Paleocene and the Eocene epochs. Secondly, at some sites, the Urgonian limestone (Cretaceous) also outcrops, with variable extent depending on the considered map (Figures 11A,B).
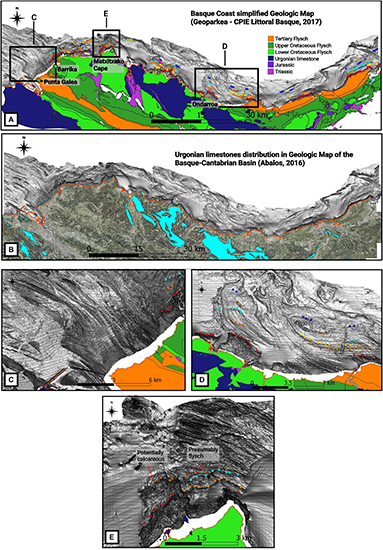
Figure 11. Relationship between the submerged terraces and lithology. (A) Lithologic map modified from the Basque Coast (Euskal Kostaldeko Geologia Sinplifikatua, 2017). (B) Urgonian limestone distribution in Ábalos (2016). Note the limestone extension difference between (A,B). (C,D) Areas with stratified flysch type successions. Marine terraces are mainly preserved in (D) area. (E) A high wave energy area, where submerged terraces are preserved. This could be due to the potentially calcareous rocks substratum in the eastern part, which are more resistant than flysch type rocks.
The stratification of flysch type rocks is notorious on the seafloor and can be followed in the hillshaded map, from Ondarroa to the east, with well developed submerged marine terraces (Figure 11D); and between Barrika and Punta Galea where no submerged marine terraces are detected (Figure 11C). Among flysh type sequences, some parts are more siliciclastic, more carbonaceous or the number and thickness of turbidites may vary, which affect to the generation and characteristics of rocky shore platforms (Baceta et al., 2012). Nevertheless, not such a big difference in submerged marine terrace preservation would be expected between those areas with quite similar lithological characteristics, suggesting that other factors are affecting the submerged marine terraces distribution offshore those coastal stretches.
The differential preservation potential of the submerged terraces seems somehow controlled by lithology in the eastern part of Matxitxako cape (Figure 11E). There, a submerged marine terrace is detected, in spite of being within a high wave energy area. We infer that there the seafloor could be carbonated, as onshore, there is a carbonated unit close to this area. The limestones, are comparatively more resistant to erosion than flysch, increasing the preservation potential of marine terraces. This carbonated unit could also act as a barrier, protecting the submerged terraces carved in presumably flysch unit substrate.
Stratification Direction
As stated before by Everard et al. (1964) or Trenhaile (1987) the dip, strike and thickness of the bedding influences the generation and development of modern rocky-shore platform. In our study area, the disposition of the stratification relative to the current shoreline has been highlighted in the littoral zone of the Basque Coast Geopark to explain the different morphologies of present coastline (Baceta et al., 2012).
On the continental shelf, submerged marine terraces are detected with variable bedding strikes. Parallel, oblique or perpendicular to the shoreline (e.g. Figures 11C,D, 12A–C). Note that around Punta Galea (Figure 11C), the stratification is perpendicular to the coastline and are not well preserved submerged marine terraces, whereas in other areas of the shelf under the same perpendicular strikes, submerged terraces are detected (e.g. Figure 11D).
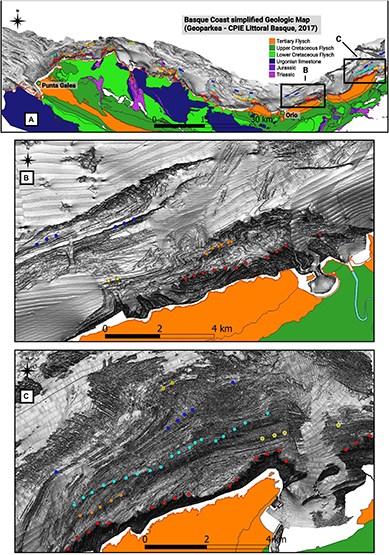
Figure 12. Relationship between submerged marine terraces and bedding. (A) Distribution of the detected shoreline angles in the study area. Boxes highlight the areas detailed in figures (B,C). (B,C) Oblique or parallel bedding in high wave energy areas, which could explain why some submerged terraces are preserved at this site, and not at other sites experiencing similar hydrodynamics within the same lithology as in Punta Galea (Figure 11C).
The effect of the stratification is suggested for the area from Orio to the east, with high wave energy conditions and flysch type substrate, but where submerged terraces are preserved (Figures 12B,C). Along this coastal stretch, the bedding is oblique or sub-parallel along most of the continental shelf. According to Trenhaile (1987), the beddings which are parallel and with a high dip angle relative to the coast, are the most resistant to erosion. Such bedding disposition could explain why some submerged terraces are preserved in these areas of high hydrodynamics and not at other sites of similar wave energy conditions such as in front of Punta Galea, where the bedding is perpendicular to the wave direction (Figure 11C).
Sea-Stacks Implications in Submerged Marine Terraces Sequence
The fact that the number of stacks is higher at certain depths, is probably associated to the submerged terrace levels, as some of the stacks could have been part of ancient rocky shore platforms. Such interpretation can be suggested for the −29/30, −54, −75/76, and −90 m stacks, that could correlate with the submerged marine terraces at ∼−30/−32 m (T2), ∼−49/53 m (T5), ∼−74/−77 m (T10) and ∼−89/−92 m (T12).
The areas shallower than 30 m can give valuable information, as it is the area with the higher amount of sea-stacks and a shoreline was only detected at ∼−13 m. Nevertheless, the number of sea-stacks at −19 and −26 m is considerably higher than at other depths. This can be because sea level has stayed for longer time at those depths, even though the submerged marine terrace morphology is not observed at present.
Aside from it, the presence of these stacks grouped at certain sites and depths, suggests the presence of former rocky shore platforms, which helps to complete the terrace sequence in places where nowadays no shorelines are present (Figures 7, 8 and Supplementary Figures S10–S15).
Marine Terrace Generation Age Constraints
Submerged Marine Terraces That Fit With LEM Results
The submerged marine terraces generated on the scenario between MIS 5e and the Last Glacial Maximum, could fit with T3, T5, and T8. The main uncertainties come from two variables used to obtain those results. First, the best initial erosion rate for the generation of the staircase morphology was set at 1 m/yr, which is probably too high, taking into account the calculated cliff recession rates of 0.05 and 0.5 m/yr (mainly 0.15 m/yr) for the rocky shore platform in the rest of the Basque coast (Aubié et al., 2011). Second, the best staircase morphology is generated with a platform gradient set at 2°. In profiles generated by the LEM with such initial slope, the width of the continental shelf between 0 and −120 m is ∼ 6 km (Figure 9B), whereas the width of the continental shelf off the Basque coast most generally exceed 6 km (Figure 1).
Submerged Marine Terraces That Do Not Fit With LEM Results
T4, T7, and T10 were not detected in the scenarios tested in the LEM. In the case of T4 and T7, these are generally narrower submerged marine terraces, so we could infer shorter morphogenesis times, that are not reproduced in the models generated by the LEM. One hypothesis is, that they were generated between the Last Glacial Maximum (LGM) and present. We correlate the depth of those submerged terraces with the curves derived by Stanford et al. (2011) (Figure 13), that present episodes for which sea level seems to be rather stable and characterized by lower sea-level change rates (Figure 13A). In other word, we compared the depth of these periods of sea-level stability (Figure 13B) with the depth of terraces identified from the bathymetry.
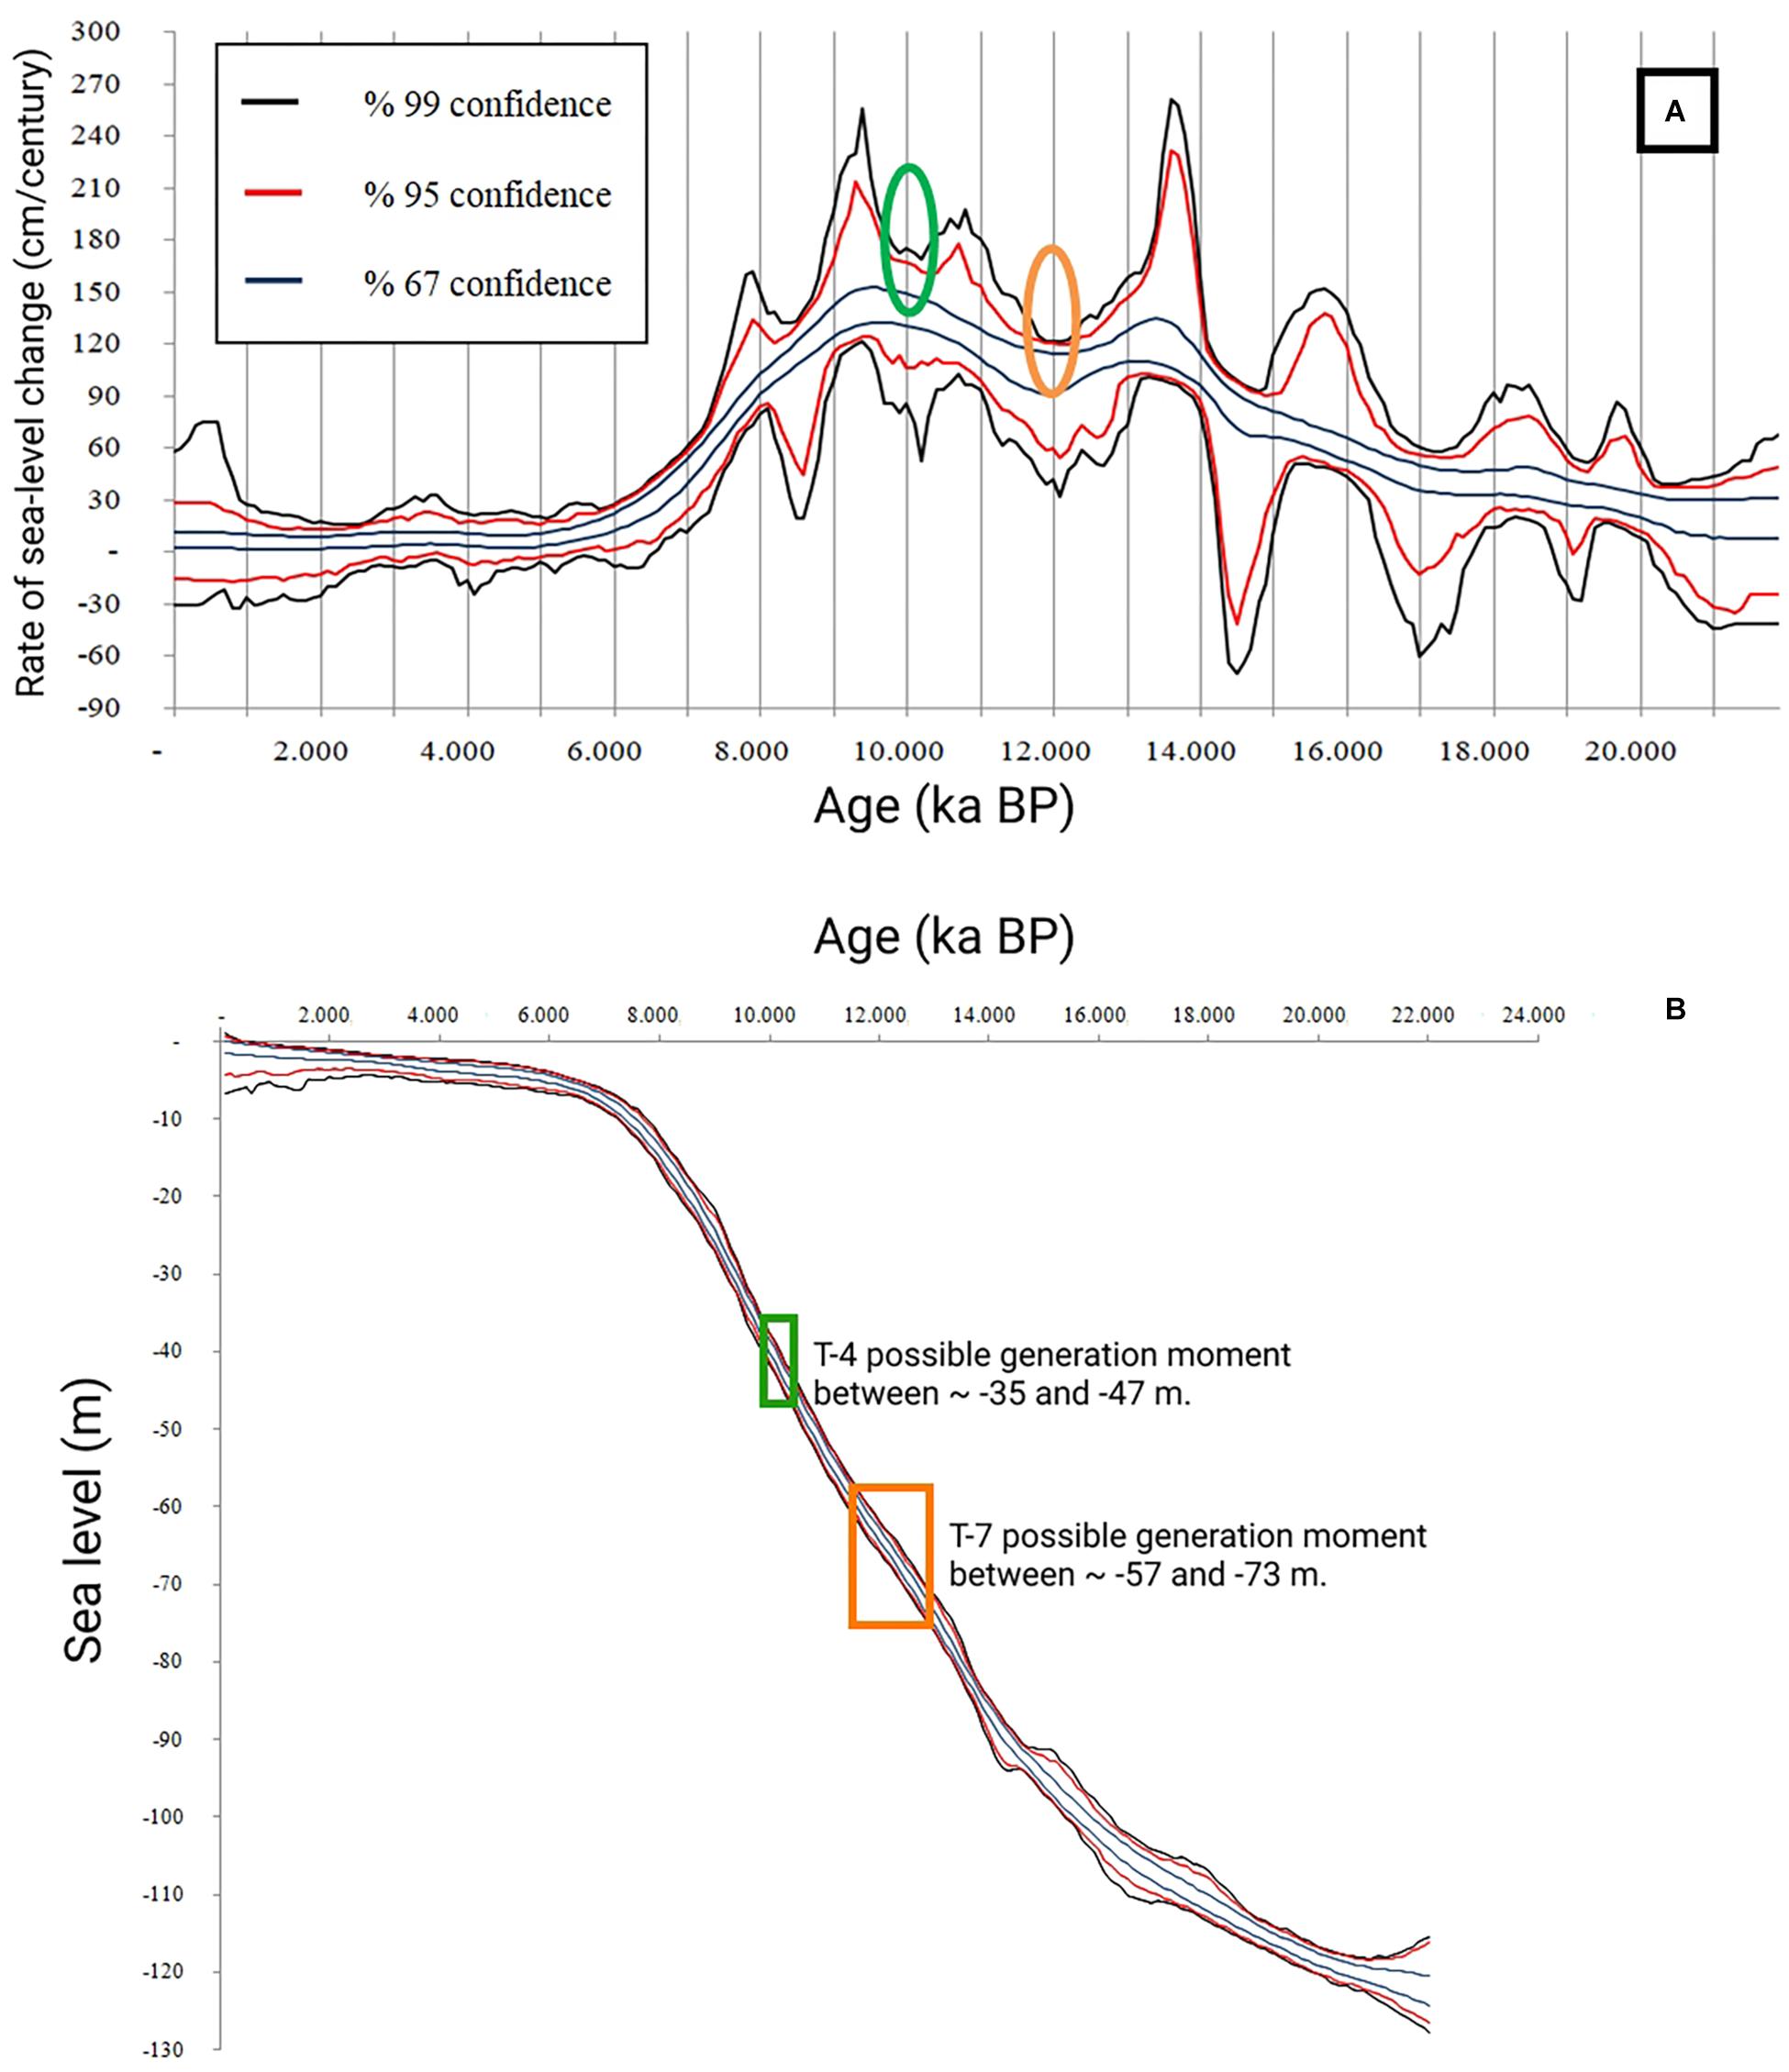
Figure 13. T4 and T7 possible generation moment. (A) Stanford et al. (2011) rate of sea-level change, where T-4 and T-7 could have been generated. Green circle, the possible moment of T4 generation. Orange circle, the possible moment of T7 generation. (B) Extrapolated depths for the previously mentioned periods, in the sea level curve of Stanford et al. (2011).
Sea-level change minima that could coincide with the described marine terraces are highlighted by the green and orange ellipses on Figure 13A, Those two periods would range between approximately 11.5 and 12.8 ka and between 9.8 and 10.4 ka. Then, using the sea-level curve of Stanford et al. (2011) (Figure 13B), the depths in those periods were calculated. Between 11.5 and 12.8 ka the sea level would be between −57 and −73 m in the 99% confidence curves, and between −60 and −68 m in the 67% confidence curves; whereas between 9.8 and 10.4 ka sea level would be between −35 m and −47 m in the 99% confidence curve. These depths could coincide with terrace levels T7 and T4, respectively.
The second hypothesis would be that these generally narrower submerged marine terraces were generated prior to the last transgression. In front of Ogeia, T-7 is barely distinguishable in the western part, while in the eastern part the sequence is best preserved (Figures 3C, 5B). Such morphological disymmetry for the submerged terraces could mean that the terraces were eroded during the last transgression, and hence, they were previously generated. Aside from this, considering that the sea stacks can be remnants of ancient rocky shore platforms, the ones grouped at depths of −61 m (Figures 8A,B), could indicate that previously a terrace was carved into that substrate. The occurrence of these stacks at that depth could support the idea that some terraces were generated prior to the last transgression.
Regarding T-10, due to its extension, planar character in some places, and all its associated stacks that are close to that submerged marine terrace depth, it could have been generated previous to MIS5e.
The terrace generation and erosion process could be as follows. T-10 could have been generated before MIS5e. Then, prior to the Last Glacial Maximum, T-3, T-4, T-5, T-7, and T-8 could be formed. With the last transgression, the ancient sea-cliffs and rocky shore platforms may have been smoothed or totally eroded.
Another factor that should be considered, is the inheritance or reoccupation. Some of the present rocky-shore platforms could have been generated not only during the present sea level, but also in past moments when sea level was similar to the recent one like at MIS5e (Trenhaile et al., 1999; Trenhaile, 2001, 2002, 2018; Blanco Chao et al., 2003; Pedoja et al., 2018). A similar scenario may have occurred for submerged marine terraces which could be reoccupied at certain depths in several times during past sea level oscillations. In other word, the generation of the submerged terraces might be in part polygenic, and their generation could have started before MIS5e.
The reason for their preservation, could be related to a combination of wave climatology (energy and direction), lithology, and bedding strike at different segments of the continental shelf. Another point could be the general low slope of the shelf. A low slope platform would dissipate more wave energy, and waves wouldn’t be able to erode completely the previous terraces, enhancing their partial preservation (Trenhaile, 2014; Jara-Muñoz et al., 2016).
Conclusion
The analysis of a high-resolution submerged DEM of the Bay of Biscay, reveals a staircase morphology, with irregularly preserved and distributed submerged marine terraces along the continental shelf. In total, 12 submerged terraces were detected. Six of them show more lateral continuity and are better preserved along the continental shelf; theirs shoreline angles are found between ∼−34 and 41 m (T3), ∼−44 and −47 m (T4), ∼−49 and 53 m (T5), ∼−59 and 62 m (T7), ∼−65 and 67 m (T8) and ∼−74 and −77 m (T10). We propose a novel analyze of drowned sea-stack analysis to detect marine terraces with poorly detectable shoreline angles.
Within the current stage of knowledge, we were not able to discriminate or to connect the submerged terrace and shoreline setting with a single variable. Rather, the degree of generation and preservation of fossil shorelines and submerged marine terraces, seems to depend on an interplay of variables such as wave climatology, lithology and bedding direction that would act simultaneously.
In absence of dating, we propose, through numerical modeling that submerged terraces T3, T5, and T8 could have been generated between MIS 5e and the Last Glacial Maximum. Nevertheless, the submerged terraces T4, T6, and T10, do not fit with that scenario. T4 and T6, could have been created during the last transgression, but the fact that at some places they seem to be partially eroded at those depths suggests a previous formation. Regarding T10, due to its extension in some places and the number of sea stacks that are associated to that submerged terrace, its generation probably took place before MIS5e.
Data Availability Statement
The datasets generated for this study are available on request to the corresponding author.
Author Contributions
PB-L conducted the primary data analysis and prepared the manuscript. JJ-M generated the stacked sea level curve, the landscape evolution model, and helped in the data analysis, discussion, and in the preparation of the manuscript. KP, EI, IÁ, AA, and IG helped in the data analysis, discussion, and in the preparation of the manuscript.
Funding
PB-L is beneficiary of a predoctoral grant from the Basque Government (PRE_2018_2_0290). Financial support was also provided by the research project IT 1029-16-GBV6 from the Basque Government and US18/14 from the University of the Basque Country.
Conflict of Interest
IG was employed by the company AZTI-Tecnalia.
The remaining authors declare that the research was conducted in the absence of any commercial or financial relationships that could be construed as a potential conflict of interest.
Acknowledgments
We thank AZTI-Tecnalia for providing the digital elevation model of the submerged continental shelf. The two reviewers are acknowledged for their constructive and helpful comments that improved the manuscript.
Supplementary Material
The Supplementary Material for this article can be found online at: https://www.frontiersin.org/articles/10.3389/feart.2020.00047/full#supplementary-material
Footnotes
References
Ábalos, B. (2016). Geologic map of the Basque-Cantabrian Basin and a new tectonic interpretation of the Basque Arc. Int. J. Earth Sci. (Geol Rundsch) 105, 2327–2354. doi: 10.1007/s00531-016-12916
Alvarez-Marrón, J., Hetzel, R., Niedermann, S., Menéndez, R., and Marquínez, J. (2008). Origin, structure and exposure history of a wave-cut platform more than 1 Ma in age at the coast of northern Spain: a multiple cosmogenic nuclide approach. Geomorphology 93, 316–334. doi: 10.1016/j.quaint.2014.09.025
Aranburu, A., Arriolabengoa, M., Iriarte, E., Giralt, S., Yusta, I., Martínez-Pillado, V., et al. (2015). Karst landscape evolution in the littoral area of the Bay of Biscay (north Iberian Peninsula). Quat. Int. 364, 217–230. doi: 10.1016/j.quaint.2014.09.025
Arz, H. W., Lamy, F., Ganopolski, A., Nowaczyk, N., and Pätzold, J. (2007). Dominant Northern Hemisphere climate control over millennial-scale glacial sea-level variability. Quat. Sci. Rev. 26, 312–321. doi: 10.1016/j.quascirev.2006.07.016
Aubié, S., Mallet, C., Favennec, J., and Avec la collaboration de Hoareau, A. (2011). Caractérisation de l’aléa Érosion (2020-2040) de la Côte Aquitaine Dans le Cadre de l’étude Stratégique de Gestion du Trait de Côte: Observatoire de la Côte Aquitaine. Rapport BRGM/RP-59095-FR, 59 ill. Orléans: BRGM, 97.
Baceta, J. I., Orue-Etxebarria, X., Apellaniz, E., Martín Rubio, M., and Bernaola, B. (2012). El Flysch del litoral Deba-Zumaia. Una ventana a los Secretos de Nuestro Pasado Geológico. Leioa: Servicio Editorial de la Universidad del Pais Vasco/Euskal Herriko Unibertsitateko Argitalpen Zerbitzua. 138.
Bard, E., Hamelin, B., Arnold, M., Montaggioni, L., Cabioch, G., Faure, G., et al. (1996). Sea level record from Tahiti corals and the timing of deglacial meltwater discharge. Nature 382, 241–244. doi: 10.1038/382241a0
Bard, E., Hamelin, B., and Delanghe-Sabatier, D. (2010). Deglacial meltwater pulse 1B and younger dryas sea levels revisted with boreholes at Tahiti. Science 327, 1235–1237. doi: 10.1126/science.1180557
Blanco Chao, R., Costa Casais, M., Martínez Cortizas, A., Pérez Alberti, A., and Trenhaile, A. S. (2003). Evolution and inheritance of a rock coast: western Galicia, northwestern Spain. Earth Surf. Proc. Landf. 28, 757–775. doi: 10.1002/esp.496
Boya de Bilbao-Vizcaya (2019). Ministerio de Fomento del Gobierno de España; Puertos del Estado. Banco de Datos Oceanográficos de Puertos del Estado (in Spanish). Available online at: www.puertos.es (accessed February 05, 2020).
Chappell, J., and Polach, H. (1991). Post-glacial sea-level rise from a coral record at Huon Peninsula, Papau New Guinea. Nature 349, 147–149. doi: 10.1038/349147a0
Cutler, K. B., Edwards, R. L., Taylor, F. W., Cheng, H., Adkins, J., Gallup, C. D., et al. (2003). Rapid sea-level fall and deep-ocean temperature change since the last interglacial Period. Earth Planet. Sci. Lett. 206, 253–271. doi: 10.1016/s0012-821x(02)01107-x
Deler, Y. (1932). Esquisse morphologique de la côte basque française entre l’embouchure de l’Adour et celle de la Bidassoa. Rev. Géograph. Pyrénéés Sud-Ouest Tome 3, 18–63. doi: 10.3406/rgpso.1932.4044
Digerfeldt, G., and Hendry, M. D. (1987). An 8000 yr Holocene sea-level records from Jamaica: implications for interruption of Caribbean reef and coastal history. Coral Reefs 5, 165–169. doi: 10.1007/bf00300959
Ernstsen, V., Noormets, R., Hebbeln, D., Bartholomé, A., and Flemming, B. (2006). Precision of high-resolution multibeam echo sounding coupled with high-accuracy positioning in a shallow water coastal environment. Geo-Mar. Lett. 26, 141–149. doi: 10.1007/s00367-006-0025-3
Euskal Kostaldeko Geologia Sinplifikatua (2017). Geoparkea-CPIE Littoral Basque. Available online at: https://geoparkea.eus/en/science-education/euskal-kostaldeko-geologia-sinplifikatua (accessed April 29, 2019).
Everard, C. E., Lawrence, R. H., Witherick, M. E., and Wright, L. W. (1964). “Raised beaches and marine geomorphology,” in Present Views on Some Aspects of the Geology of Cornwall and Devon, eds K. F. G. Hosking and G. J. Shrimpton, (Truro: Royal Geological Society of Cornwall), 283–310.
Fairbanks, R. G. (1989). A 17,000-year glacio-eustatic sea level record: influence of glacial melting rates on the Younger Dryas event and deep-ocean circulation. Nature 342, 637–642. doi: 10.1038/342637a0
Flor, G., and Flor-Blanco, G. (2014). Raised Beach in the Cantabrian Coast Landscapes and Landforms of Spain, eds F. Gutierrez and M. Gutierrez Dordrecht: Springer Sciences, 239–248.
Galparsoro, I., Borja, Á, Bald, J., Liria, P., and Chust, G. (2009). Predicting suitable habitat for the European lobster (Homarus gammarus), on the Basque continental shelf (Bay of Biscay), using Ecological-Niche Factor Analysis. Ecol. Modell. 220, 556–567. doi: 10.1016/j.ecolmodel.2008.11.003
Galparsoro, I., Borja, Á., Legorburu, I., Hernández, C., Chust, G., Liria, P., et al. (2010). Morphological characteristics of the Basque continental shelf (Bay of Biscay, northern Spain); their implications for Integrated Coastal Zone Management. Geomorphology 118, 314–329. doi: 10.1016/j.geomorph.2010.01.012
Galparsoro, I., Liria, P., Legorburu, I., Ruiz-Minguela, P., Pérez, G., Marqués, J., et al. (2008). Atlas de energía del oleaje. La planificación espacial marina como herramienta en la selección de zonas adecuadas para la instalación de captadores. Rev. Investig. Marina 1:9.
García-Mondéjar, J., Hines, F.M., Pujalte, V., and Reading, H.G. (1985). “Sedimentation and tectonics in the western Basque Cantabrian area (Northern Spain) during cretaceous and Tertiary times,” in Proceedings 6th European Regional Meeting Excursion Guidebook, eds M.D. Milá, and J. Rosell, (Genève: International Labour Organization), 309–392.
Grant, K. M., Rohling, E. J., Bar-Matthews, M., Ayalon, A., Medina-Elizalde, M., Bronk Ramsey, C., et al. (2012). Rapid coupling between ice volume and polar temperature over the past 150,000 years. Nature 491, 744–747. doi: 10.1038/nature11593
Guilcher, A. (1972). La plage ancienne de Castro-Urdiales (province de Santander, Espagne) et son inérêt morphologique. Norois 74, 365–367. doi: 10.3406/noroi.1972.3825
Hanebuth, T., Stattegger, K., and Bojanowski, A. (2009). Termination of the Last Glacial Maximum sea-level lowstand: the Sunda Shelf data revisted. Global Planet. Change 66, 76–84. doi: 10.1016/j.gloplacha.2008.03.011
Hanebuth, T., Stattegger, K., and Grootes, P. M. (2000). Rapid flooding of the Sunda shelf: a late-glacial sea-level record. Science 288, 1033–1035. doi: 10.1126/science.288.5468.1033
IGME (2015). QAFI v.3: Quaternary Faults Database of Iberia. Available online at: http://info.igme.es/QAFI (accessed January 01, 2020).
IGME and ENRESA (1998). Mapa Neotectonico y Sismotectonico de España (Escala 1:1000000) y Memoria, Vol. 2. Madrid: IGME and ENRESA, 399 Available online at: http://info.igme.es/qafi/Download.aspx (accessed May 20, 2019).
Jara-Muñoz, J., Melnick, D., Pedoja, K., and Strecker, M. R. (2019). TerraceM-2: a matlab R interface for mapping and modeling marine and lacustrine terraces. Front. Earth Sci. 7:255. doi: 10.3389/feart.2019.00255
Jara-Muñoz, J., Melnick, D., and Strecker, M. R. (2016). TerraceM: a MATLAB(®) tool to analyze marine and lacustrine terraces using high-resolution topography. Geosphere 12, 176–195. doi: 10.1130/ges01208.1
Jara-Muñoz, J., Melnick, D., Zambrano, P., Rietbrock, A., González, J., Argandoña, B., et al. (2017). Quantifying offshore fore-arc deformation and splay-fault slip using drowned pleistocene shorelines, Arauco Bay, Chile. J. Geophys. Res. 122, 4529–4558. doi: 10.1002/2016jb013339
Jiménez-Sánchez, M., Aramburu, A., Martos, E., and Domínguez-Cuesta, M. (2006). Cuevas prehistóricas como Patrimonio Geológico en Asturias: métodos de trabajo en la cueva de Tito Bustillo. Trabajos Geología 26, 163–174.
Jimenez-Sánchez, M., Stoll, H., Giralt, S., Aranburu, A., Moreno, A., Domínguez-Cuesta, M. J., et al. (2011). “Marine terrace uplifting rates in the Cantabrian shore: contribution of U-Th speleothem dating,” in Deformation Mechanisms, Rheology and Tectonics DRT Meeting, Oviedo.
Johnson, S. Y., Hartwell, S. R., and Dartnell, P. (2014). Offset of latest pleistocene shoreface reveals slip rate on the hosgri strike-slip fault, offshore Central California. Bull. Seismol. Soc. Am. 104, 1650–1662. doi: 10.1785/0120130257
Lajoie, K. R. (1986). “Coastal tectonics,” in Active Tectonics ed. R. Wallace, (Washington, D.C: National Academy Press), 95–124.
Lighty, R. G., Macintyre, I. G., and Stuckenrath, R. (1982). Acropora palmata reef framework: a reliable indicator of sea-level in the western Atlantic for the past 10,000 years. Coral Reefs 1, 125–130. doi: 10.1007/bf00301694
Liria, P., Garel, E., and Uriarte, A. (2009). The effects of dredging operations on the hydrodynamics of an ebb tidal delta: Oka Estuary, northern Spain. Cont. Shelf Res. 29, 1983–1994. doi: 10.1016/j.csr.2009.01.014
Macintyre, I. G., Littler, M. M., and Littler, D. S. (1995). Holocene history of Tobacco Range, Belize, Central America. Atoll Res. Bull. 430, 1–18. doi: 10.5479/si.00775630.430.1
Macintyre, I. G., Toscano, M. A., Lighty, R. G., and Bond, G. B. (2004). Holocene history of the mangrove islands of Twin Cays. Belize, Central America. Atoll Res. Bull. 510, 1–16. doi: 10.5479/si.00775630.510.1
Macintyre, I. G., Multer, H. G., Zankl, H. L., Hubbard, D. K., Weiss, M. P., and Stuckenrath, R. (1985). “Growth and depositional facies of a windward reef complex (Nonsuch Bay, Antigua, W.I.),” in Proceedings of the Fifth International Coral Reef Congress Tahiti 6 (Stanford, CA: Stanford University), 605–610.
Pascual, A., Cearreta, A., Rodríguez-Lázaro, J., and Uriarte, A. (2004). “Geology and palaeoceanography. Elsevier oceanography series,” in Oceanography and Marine Environment of the Basque Country, eds Á Borja and M. Collins, (Amsterdam: Elsevier), 53–73. doi: 10.1016/s0422-9894(04)80041-2
Passaro, S., Ferranti, L., and de Alteriis, G. (2011). The use of high-resolution elevation histograms for mapping submerged terraces: tests from the Eastern Tyrrhenian Sea and the Eastern Atlantic Ocean. Quat. Int. 232, 238–249. doi: 10.1016/j.quaint.2010.04.030
Pedoja, K., Husson, L., Johnson, M. E., Melnick, D., Witt, C., Pochat, S., et al. (2014). Coastal staircase sequences reflecting sea-level oscillations and tectonic uplift during the quaternary and neogene. Earth Sci. Rev. 132, 13–38. doi: 10.1016/j.earscirev.2014.01.007
Pedoja, K., Jara-Muñoz, J., De Gelder, G., Robertson, J., Meschis, M., Fernandez- Blanco, D., et al. (2018). Neogene-quaternary slow coastal uplift of Western Europe through the perspective of sequences of strandlines from the Cotentin Peninsula (Normandy. France). Geomorphology 303, 338–356. doi: 10.1016/j.geomorph.2017.11.021
Pedoja, K., Husson, L., Regard, V., Cobbold, P. R., Ostanciaux, E., Johnson, M. E., et al. (2011). Relative sea-level fall since the last interglacial stage: are coasts uplifting worldwide? Earth Sci. Rev. 108, 1–15. doi: 10.1016/j.earscirev.2011.05.002
Peltier, W. R., and Fairbanks, R. G. (2006). Global ice volume and Last Glacial Maximum duration from an extended Barbados sea-level record. Quat. Sci. Rev. 25, 3322–3337. doi: 10.1016/j.quascirev.2006.04.010
Perez-Alberti, A., Pires, A., Freitas, L., and Chamine, H. (2013). Shoreline change mapping along the coast of Galicia, Spain. Proc. Inst. Civil Eng. Mar. Eng. 166, 125–144. doi: 10.1680/maen.2012.23
Prémaillon, M., Regard, V., Dewez, T., and Auda, Y. (2018). GlobR2C2 (Global Recession Rates of Coastal Cliffs): a global relational database to investigate coastal rocky cliff erosion rate variations. Earth Surf. Dynam. 6, 651–668. doi: 10.5194/esurf-6-651-2018
Railsback, L. B., Gibbard, P. L., Head, M. J., Voarintsoa, N. R. G., and Toucanne, S. (2015). An optimized scheme of lettered marine isotope substages for the last 1.0 million years, and the climatostratigraphic nature of isotope stages and substages. Quat. Sci. Rev. 111, 94–106. doi: 10.1016/j.quascirev.2015.01.012
Ricchi, A., Quartau, R., Ramalho, R. S., Romagnoli, C., Casalbore, D., and Ventura, et al. (2018). Marine terrace development on reefless volcanic islands: new insights from high-resolution marine geophysical data offshore Santa Maria Island (Azores Archipelago). Mar. Geol. 406, 42–56. doi: 10.1016/j.margeo.2018.09.002
Robbin, D. M. (1984). “A new holocene sea-level curve for the upper florida keys and florida reef tract,” in Environments of South Florida, Present and Past, ed. P. J. Gleason, (Miami, FL: Miami Geological Society), 437–458.
Shinn, E. A., Hudson, J. H., Halley, R. B., Lidz, B., Robbin, D. M., and Macintyre, I. G. (1982). Geology and sediment accumulation rates at Carrie Bow Cay, Belize. Smithsonian Contr. Mar. Sci. 12, 63–75.
Stanford, J. D., Hemingway, R., Rohling, E. J., Challenor, P. G., Medina-Elizalde, M., and Lester, A. J. (2011). Sea-level probability for the last deglaciation: a statistical analysis of far-field records. Global Planet. Change 79, 193–203. doi: 10.1016/j.gloplacha.2010.11.002
Toscano, M. A., and Lundberg, J. (2003). Early Holocene sea-level record from submerged fossil reefs on the southeast Florida margin. Geology 25, 255–258.
Trenhaile, A. S. (1999). The width of shore platforms in Britain, Canada, and Japan. J. Coastal Res. 15, 355–364.
Trenhaile, A. S. (2001). Modelling the Quaternary evolution of shore platforms and erosional continental shelves. Earth Surf. Process. Landforms 26, 1103–1128. doi: 10.1002/esp.255
Trenhaile, A. S. (2002). Rock coasts, with particular emphasis on shore platforms. Geomorphology 48, 7–22. doi: 10.1016/s0169-555x(02)00173-3
Trenhaile, A. S. (2014). Modelling the effect of Pliocene–Quaternary changes in sea level on stable and tectonically active land masses. Earth Surf. Process. Landforms 39, 1221–1235. doi: 10.1002/esp.3574
Trenhaile, A. S. (2018). Shore platform erosion and evolution: implications for cosmogenic nuclide analysis. Mar. Geol. 403, 80–92. doi: 10.1016/j.margeo.2018.05.005
Trenhaile, A. S., Pérez-Alberti, A., Martínez Cortizas, A., Costa Casais, M., and Blanco-Chao, R. (1999). Rock coast inheritance: an example from Galicia, northwestern Spain. Earth Surf. Proc. Landf. 24, 605–621. doi: 10.1002/(sici)1096-9837(199907)24:7<605::aid-esp977>3.0.co;2-1
Uriarte, A. (1998). Sediment Dynamics on the Inner Continental Shelf of the Basque Country (N. Spain). PhD. Thesis, University of Southampton, Southampton. 302.
Woodroffe, C. D. (2002). Coasts: Form, Process and Evolution. Cambridge: Cambridge University Press.
Yokoyama, Y., Deckker, P. D., Lambeck, K., Johnston, P., and Fifield, L. K. (2001). Sea-level at the last glacial maximum: evidence from northwestern Australia to constrain ice volumes for oxygen isotope stage 2. Paleoceanogr. Paleoclimatol. Paleoecol. 165, 281–297. doi: 10.1016/s0031-0182(00)00164-4
Keywords: marine terrace, submerged sequence, digital bathymetric model, TerraceM, numerical modeling, Bay of Biscay
Citation: Bilbao-Lasa P, Jara-Muñoz J, Pedoja K, Álvarez I, Aranburu A, Iriarte E and Galparsoro I (2020) Submerged Marine Terraces Identification and an Approach for Numerical Modeling the Sequence Formation in the Bay of Biscay (Northeastern Iberian Peninsula). Front. Earth Sci. 8:47. doi: 10.3389/feart.2020.00047
Received: 25 October 2019; Accepted: 12 February 2020;
Published: 02 March 2020.
Edited by:
Randel Tom Cox, The University of Memphis, United StatesReviewed by:
Noureddine Elmejdoub, Gabes University, TunisiaJulio Garrote, Complutense University of Madrid, Spain
Copyright © 2020 Bilbao-Lasa, Jara-Muñoz, Pedoja, Álvarez, Aranburu, Iriarte and Galparsoro. This is an open-access article distributed under the terms of the Creative Commons Attribution License (CC BY). The use, distribution or reproduction in other forums is permitted, provided the original author(s) and the copyright owner(s) are credited and that the original publication in this journal is cited, in accordance with accepted academic practice. No use, distribution or reproduction is permitted which does not comply with these terms.
*Correspondence: Peru Bilbao-Lasa, cGVydS5iaWxiYW9AZWh1LmV1cw==