 Emily A. Wei
 James J. Holmes
 Neal W. Driscoll
- Scripps Institution of Oceanography, University of California, San Diego, San Diego, CA, United States
The Inner California Borderlands is a complex margin where sediment delivery to the basin floor is largely routed through canyon-channel-gully systems. Using nested geophysical surveys, piston and gravity cores from the Eastern Gulf of Santa Catalina, this study compares two canyon systems and investigates how tectonics, shelf width, gradient, and autogenic processes influence turbidite emplacement timing and grain size. One end-member canyon is the Dana Point Canyon, which is ∼2 km from the San Juan Creek drainage and has a concave-up channel profile. The other end-member system consists of the San Onofre North and South (SON and SOS) canyons that are detached from San Mateo Creek by a wide 10 km shelf and they traverse a tectonically deformed slope with multiple ponded basins. Radiocarbon ages sampled from eight cores reveal that turbidite deposition at Dana Point persists during the sea-level lowstand of Marine Isotope Stage (MIS) 2 through the subsequent transgression and highstand. On the contrary, turbidite emplacement adjacent to the SON and SOS canyons occurs mostly during MIS 2 and ceases around 8 ka. The main regional control on turbidite timing is the wide shelf adjacent to the SON and SOS canyons that is formed by a broad uplifted anticline. This anticline separates the SON and SOS canyons from a riverine source during the sea-level transgression. Much of the tectonic deformation offshore of San Onofre was created by transpression along the right-lateral Newport Inglewood-Rose Canyon Fault Zone. Second-order controls on local turbidite emplacement include small synclines and anticlines that form ponded basins and accommodate deformation on the San Mateo Fault Zone. These basins engender deposition and intervening steep slopes promote sediment bypass. Complex bathymetry offshore San Onofre also affects channel gradient by either accelerating or decelerating flow. Turbidity flow dynamics modified by gradient changes offshore of San Onofre have the ability to modulate channel architecture and grain size. The implications of this work are that tectonically deformed morphology complicates the timing of turbidite emplacement throughout a sea-level cycle and the interpretation of turbidites as paleoseismic records in such regions.
Introduction
Studying submarine canyons has both societal and scientific relevance. Not only do submarine canyons serve as conduits for terrigenous material across margins to the deep sea (Allen, 2008), but fan deposits at the base of submarine canyons can also serve as significant hydrocarbon reservoirs when filled with sand- or silt-prone sequences (Mayall and Stewart, 2000; Stow and Mayall, 2000; Pettingill and Weimer, 2002; Mayall et al., 2006). Large catastrophic flows through channels in the eastern Gulf of Santa Catalina (GoSC) can be a significant geohazard to marine infrastructure (Paull et al., 2002; Xu et al., 2010). For these reasons, it is important to understand the evolutionary processes that shape canyon morphology and stacking patterns through time in sedimentary basins.
The Inner California Borderlands (ICB) is a complex, tectonically active margin that is characterized by narrow continental shelves dissected by numerous canyon-channel systems (Normark et al., 2009). As distances between river mouths and canyon heads are short, the ICB is an ideal place to study source-to-sink processes and sediment routing (Normark et al., 2009; Covault et al., 2010; Romans et al., 2016). Sediment flux to submarine canyons can occur either as particles that settle out of suspension or sediment gravity flows that move downslope. Hereafter we will refer to sediment gravity flows as turbidity currents, as the deposits we observe are graded. Turbidity currents can transport large quantities of sediment (Talling et al., 2015); nevertheless, they have not been observed to traverse entire submarine canyon-channel systems (Fildani, 2017; Symons et al., 2017). Plausible triggers for turbidity currents include river floods, storm events, tsunami wave loading, sediment loading, internal tides, and earthquakes (Goldfinger et al., 2007; Xu et al., 2010; Talling et al., 2013). Storm waves can rework shelf sediment and advect it to canyon heads as a turbid layer (Xu et al., 2010). Since multiple mechanisms are capable of producing turbidity currents, it can be difficult to distinguish seismo-turbidites from those produced by tsunamis, storms, and sediment loading. Some studies have argued that seismo-turbidites can be distinguished by wide areal extent, multiple coarse-fraction pulses, variable mineralogical provenance, greater depositional mass, and coarser texture than the storm-generated events (Nakajima and Kanai, 2000; Goldfinger et al., 2007; Goldfinger, 2011). Other studies cite concerns for using turbidites as records of paleoseismic activity, as geologic dating lacks the time resolution to determine whether a fault ruptured as a whole or whether it ruptured in segments over a time period of days, years, or even decades (Nelson et al., 1995; Atwater et al., 2014). Furthermore, Sumner et al. (2013) and Atwater et al. (2014) have discussed uncertainties with methods used to evaluate paleoseismic deposits, such as the confluence test (Goldfinger et al., 2003), synchronous turbidite deposition in multiple basins (Gràcià et al., 2010), large turbidite volumes (Talling et al., 2015), and correlating turbidites to historically recorded earthquakes (Sumner et al., 2013). As such, there is still debate as to whether deep-sea turbidites are reliable paleo-seismometers (Sumner et al., 2013; Atwater et al., 2014).
Morphologic factors such as bathymetry and shelf width may also exert important controls on sediment flux to canyons (Xu et al., 2010; Damuth and Olson, 2015). Distance from a river source and shelf width may change throughout sea-level cycles. Sequence stratigraphic models predict that the greatest delivery of sediment to canyons and basin floor occurs during falling stages in sea-level and sea-level lowstands when rivers deposit directly into the canyon-channel system (e.g., Vail et al., 1977; Mitchum, 1985; Posamentier et al., 1991). Nonetheless, recent studies have proposed that sea-level is subordinate to the distance between the canyon head and shoreline (Covault et al., 2010; Blum et al., 2013; Gamberi et al., 2015) and proposed that distances < 5 km result in canyons characterized by active sand transport (Sweet and Blum, 2016). Secondary factors can exert controls on sediment flux to the deep sea, including ponded basins, which may serve as local depocenters that trap flow deposits (Prather et al., 1998; Damuth and Olson, 2015). Intraslope basins formed by diapirs or tectonic deformation may influence trends in bathymetry and subsequently the morphology of submarine canyons (Damuth, 1994; Damuth and Olson, 2015; Qin et al., 2019).
Recent research on submarine canyons in the Eastern GoSC (e.g., Covault et al., 2007, 2011; Normark et al., 2009) used cores from submarine fans and channel thalwegs to propose that shelf width and sea-level exert the largest controls on the timing of turbidite emplacement. Nevertheless, these studies did not conduct in-depth analyses on local deformation and gradient changes that may influence gravity flows. Comparisons between the San Onofre North (SON), South (SOS), and Dana Point canyons present an opportunity to study the interplay of tectonically controlled wide shelves and local ponded basins on the timing of turbidite emplacement. The shelf offshore of San Onofre has a maximum width of ∼10 km that deviates from narrower (∼2 km) shelves offshore of much of the ICB and Dana Point (Figure 1C). By comparing the Dana Point to the SON and SOS canyon-channel systems, the overarching goal of this research is to test the hypothesis that the wide shelf exerts broad controls on the timing of turbidite emplacement to the deep basins. The highly deformed slope offshore of San Onofre presents an opportunity to examine how ponded basins and gradients cause variances in depositional timing downslope.
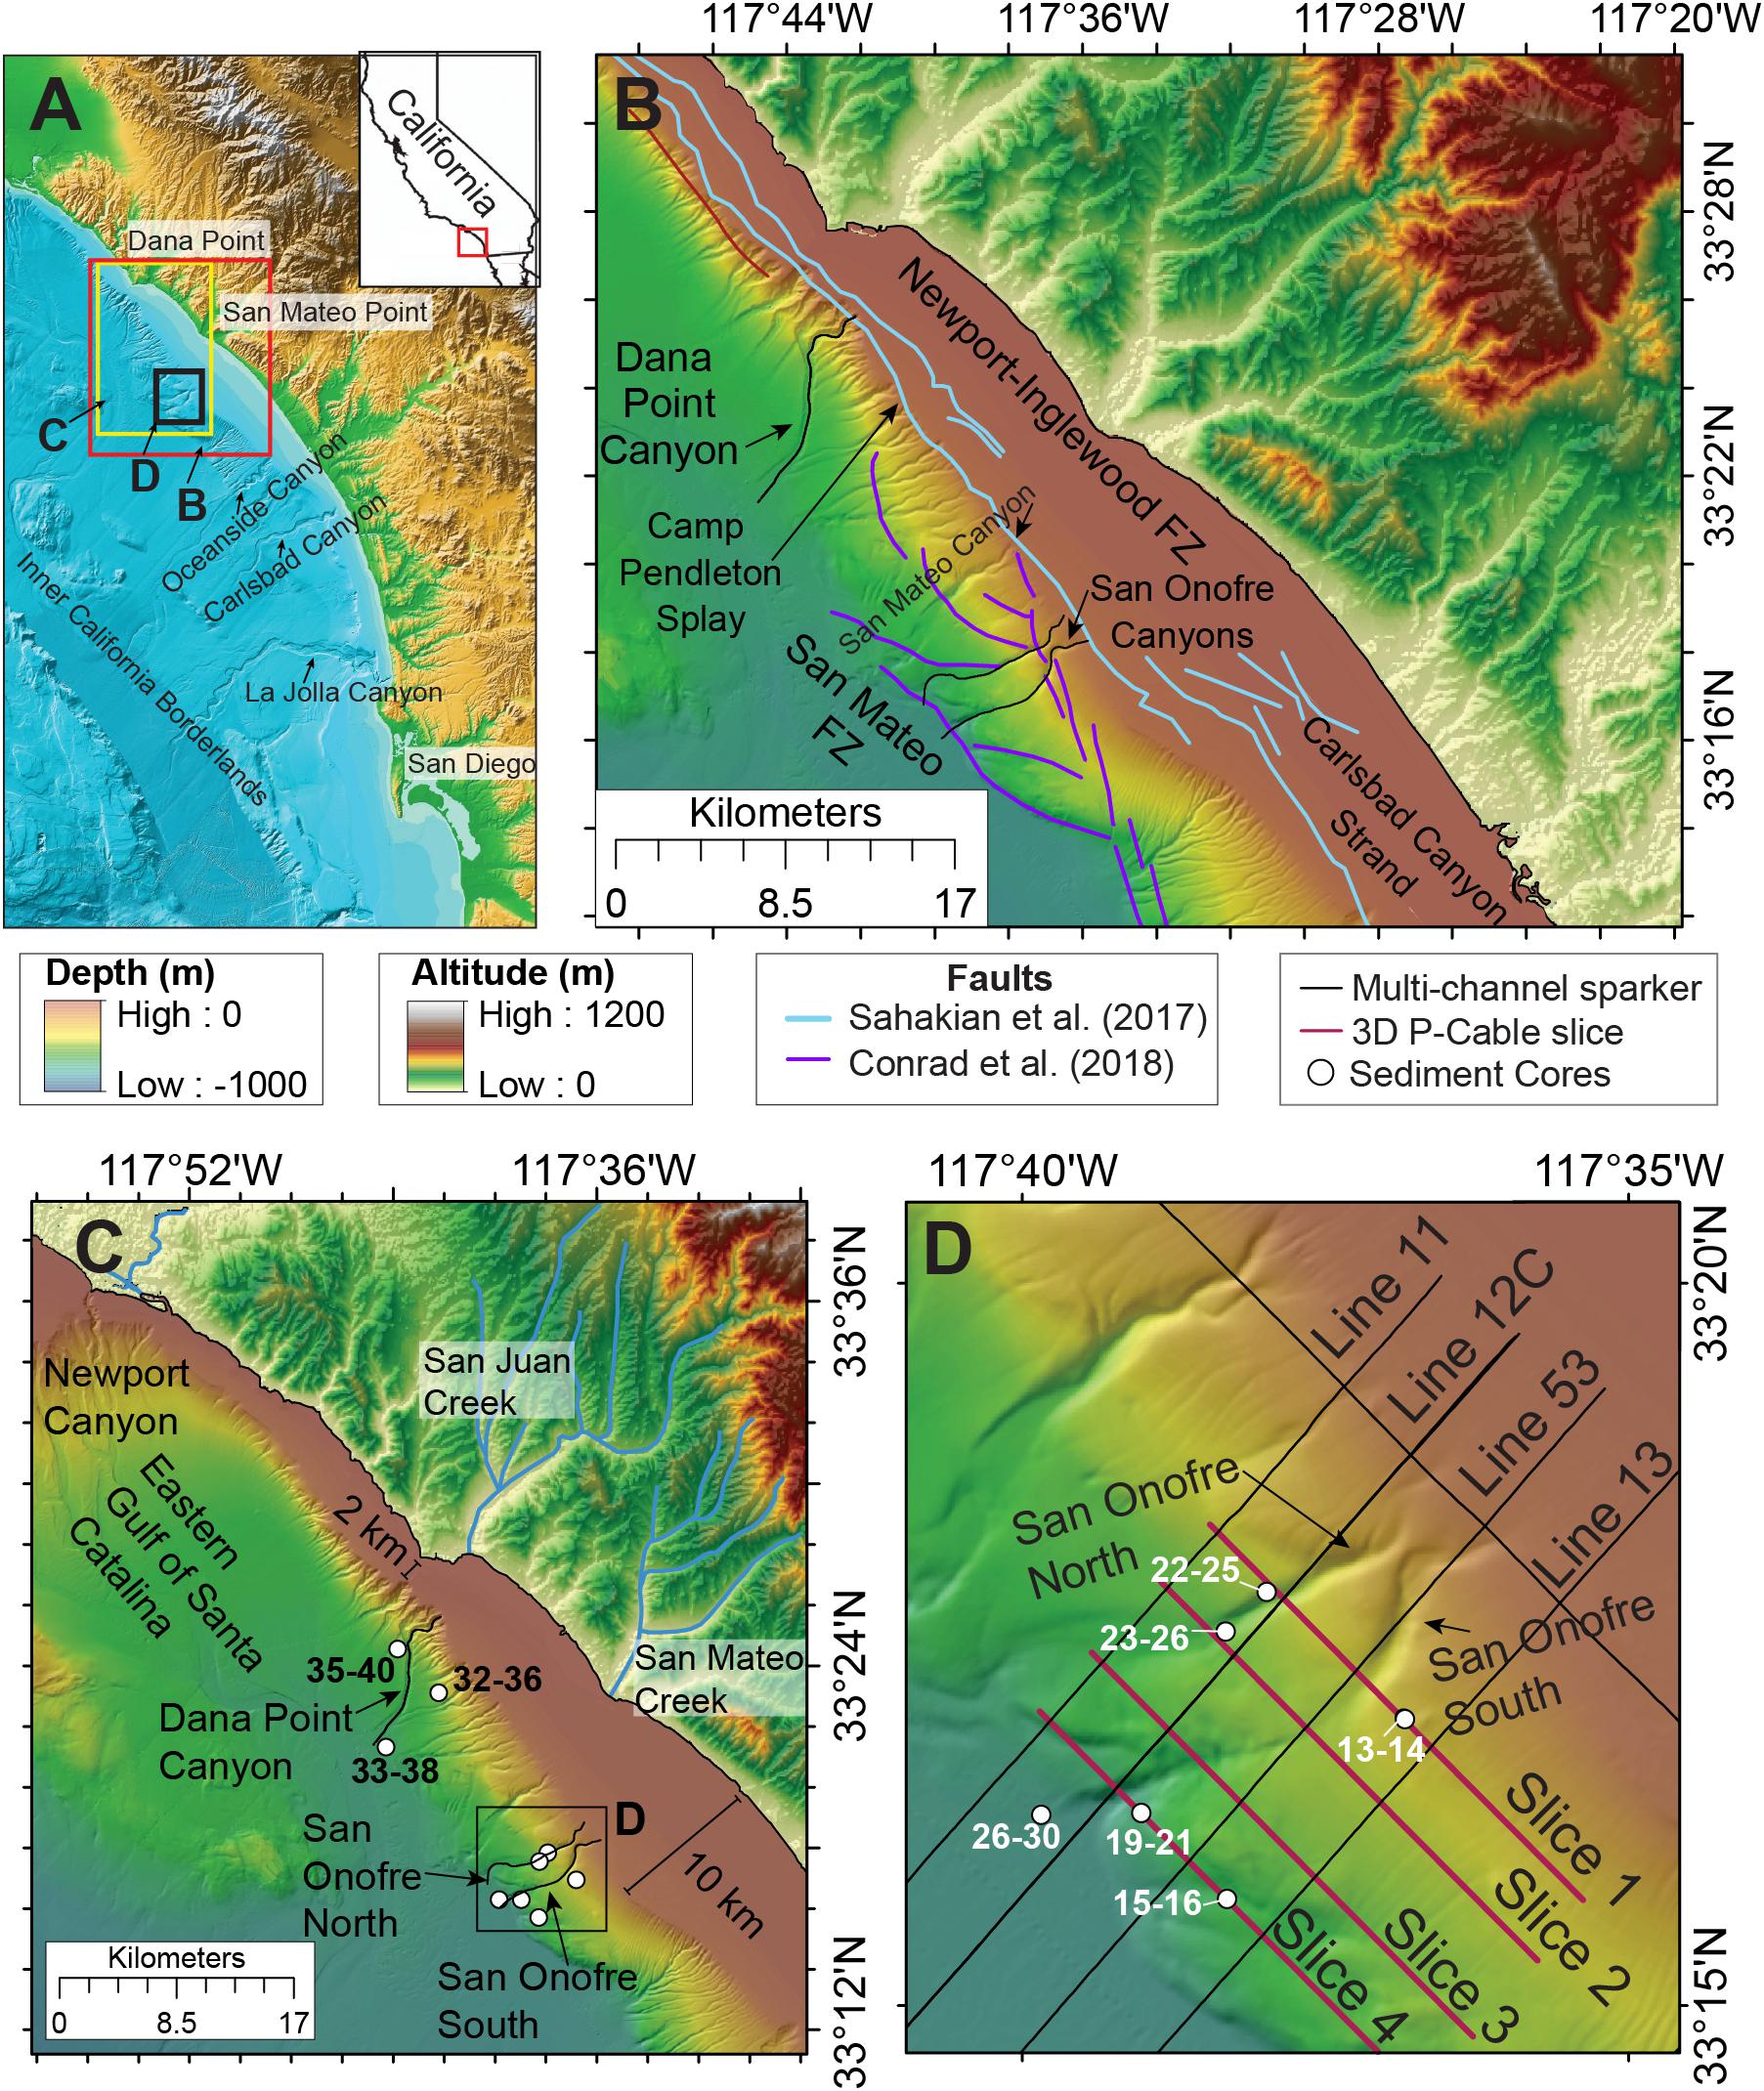
Figure 1. (A) The Inner California Borderlands (ICB) is a tectonically active region located offshore of Southern California. This study focuses on the portion of the margin with the wide continental shelf. The locations of insets B, C, and D are shown. (B) Previously mapped active faults within the study area are shown. Blue faults are from Sahakian et al. (2017) and purple faults are from Conrad et al. (2018). FZ = Fault Zone. (C) Location of Dana Point and San Onofre North and South canyons. The area shown in inset D is outlined by the black box. (D) The study area offshore of San Onofre. This study uses 2D Sparker Multi-channel seismics shown by the black lines and slices of 3D P-cable Sparker seismics shown by the red lines. Gravity Cores (GC) and Jumbo Piston Cores (JPC) are labeled with white circles. Bathymetry from Dartnell et al. (2015).
Geologic Setting
Geomorphology of the Inner California Borderlands
The Inner California Borderlands is a complex seismically active region off Southern California that is highly deformed (Ehlig, 1977; Crouch, 1979; Legg, 1991; Crouch and Suppe, 1993; Magistrale, 1993; Nicholson et al., 1994; Bohannon and Geist, 1998; Meade and Hager, 2005; Ryan et al., 2009, 2012; Maloney et al., 2016). Such deformation is responsible for the characteristic basin and ridge basement structure observed in the ICB bathymetry. The main basins within the ICB are the GoSC and the San Diego Trough (SDT). Our coring locations focus on the Eastern GoSC (Figure 1).
Strike-Slip Tectonics Offshore San Onofre
Much of the complex tectonic deformation in the ICB occurred during the Oligocene to the late Miocene, when the ICB underwent block rotation, extension, and transcurrent faulting associated with microplate capture and formation of the Transverse Ranges (Lonsdale, 1991; Nicholson et al., 1994; ten Brink et al., 2000). As plate motion became more northerly during the late Miocene, deformation of this region created a vast system of basins and ridges that dominates ICB bathymetry (Atwater and Stock, 1998; Maloney et al., 2016). After the late Miocene, deformation in the ICB decreased dramatically and changed in style (Maloney et al., 2016).
Sediment dispersal in the study area is affected most by the active Newport-Inglewood Fault, which is part of the Newport-Inglewood/Rose-Canyon (NIRC) Fault (Figure 1B; Klotsko et al., 2015; Sahakian et al., 2017). The right-lateral strike-slip NIRC Fault trends northwest-southeast, has been active since at least the Miocene in the north, and it is estimated to accommodate 0.5–2 mm a–1 of Pacific-North American plate boundary motion (Freeman et al., 1992). The NIRC fault exhibits much variability from south to north. The NIRC Fault Zone is characterized by compression offshore of San Onofre and to the south near La Jolla, whereas it is characterized by extensional deformation and divergence near Carlsbad (Maloney et al., 2016). Where the shelf is wide, two segments of the NIRC fault are separated by a stepover of 1 km (Figure 1B). The left lateral jog between these two segments engenders transpression and forms an anticlinal feature responsible for the widening of the shelf in this region (Sahakian et al., 2017). The anticlinal feature is onlapped by younger sediment (Sahakian et al., 2017). Deformation offshore San Onofre is older than at other locations to the north or south on the NIRC fault (Sahakian et al., 2017), as the transgressive surface is not displaced (Klotsko et al., 2015). It is estimated that fault activity pre-dates 100 ka (Sahakian et al., 2017). Furthermore, it is possible that the central section of the NIRC fault has not experienced surface rupture from recent historical events such as the 1933 M 6.4 Long Beach earthquake (Sahakian et al., 2017). The slope offshore San Onofre is deformed by the San Mateo (SM) Fault Zone, which consists of steeply to moderately northeast-dipping fault strands (Maloney et al., 2016; Conrad et al., 2018). Deformation within the SM Fault Zone includes strike-slip, normal, and reverse offset, with the greatest amount of deformation on the lower slope (Conrad et al., 2018). Many of these faults exhibit cross-cutting relationships and are difficult to resolve, which explains multiple interpretations of faults across this region (Conrad et al., 2018).
Canyon Systems in the ICB
The Dana Point and San Onofre canyons are detached from small creeks that may be primary sediment sources to the canyons. South of Dana Point, the San Juan Creek has an annual sediment discharge of 98 Mt a–1 (Warrick and Farnsworth, 2009) and contributes to the Dana Point Canyon. Just north of San Onofre, the San Mateo Creek discharges 2.7 Mt a–1 of sediment (Warrick and Farnsworth, 2009) and is detached from the head of San Mateo Canyon. Previous studies speculate that sediment discharge from the San Mateo Creek was higher in the past, as evidenced by the creek’s construction of a subaerial delta (Kennedy and Tan, 2007).
Main canyons in the Eastern Gulf of Santa Catalina include the Newport, Oceanside, Carlsbad, San Mateo, and La Jolla canyon-channel systems as well as numerous small gullies (Prins and Postma, 2000; Covault et al., 2007; Covault and Romans, 2009; Normark et al., 2009; Covault and Graham, 2010). It is estimated that about half of the canyons and most of the small gullies were active during the LGM and became inactive during the post-glacial transgression when canyon heads were stranded on the upper slope (Normark et al., 2009). The Newport Canyon remains active in the present day, as it is fed directly by the Santa Ana River, the San Diego Creek, and indirectly by littoral drift from other rivers (Normark et al., 2009; Warrick and Farnsworth, 2009). Another canyon that is presently active is the La Jolla Canyon, which is sourced by littoral drift (Normark et al., 2009). The La Jolla Canyon represents the end of the littoral cell, as it is bounded to the south by resistant Cretaceous rocks that trap sediment (Inman and Brush, 1973; Normark et al., 2009; Le Dantec et al., 2010). Both the Oceanside and Carlsbad canyons are not presently active, as they were drowned during the post-glacial transgression (Normark et al., 2009). Gullies on the margin are not necessarily connected to rivers and creeks onshore (Piper et al., 1990) and it is proposed that they could form where coastal geomorphology focuses rip currents during storms (Normark et al., 2009).
Materials and Methods
2D multi-channel seismic reflection data were collected in August 2013 on the R/V New Horizon and R/V Melville using a 2 kJ three-tip EG&G sparker source and 48-channel streamer. Group spacing of 6.25 m and 6.25 m shot spacing allows reflectors to be resolved to approximately 1.5 s two-way travel time (Sahakian et al., 2017). Data were stacked at 1500 m/s and processing included poststack f-k migration using a water velocity of 1500 m/s (Driscoll et al., 2013; Sahakian et al., 2017). Based on observations from the 2D dataset, a high-resolution 3D data set was acquired using a 3D P-Cable system with 14 streamers with 8 channels per streamer, 6.25 m group spacing, 3.125 m shot spacing, and a 2 kJ three-tip EG&G sparker source. This study uses a data grid of 39 km2 collected over the continental slope and the 2D seismic data are published in Driscoll et al. (2013) and Sahakian et al. (2017). 3D data were processed by Geotrace Technologies.
High-resolution bathymetry from Dartnell et al. (2015) was visualized in ArcMap 10 to examine canyon geomorphology. Gradient maps were constructed and used to delineate thalwegs of the canyon-channel systems. Two-dimensional profiles starting at the canyon head were taken through the canyon-channel thalwegs using the 3D analyst tool. At intervals of 0.5 km from the canyon head, across-channel profiles were oriented perpendicular to the channel in order to calculate channel relief.
In January 2016, 64 Gravity (GC) and Jumbo-piston cores (JPC) were collected onboard the R/V Thompson. Additionally, 546 km of Compressed High Intensity Radar Pulse (CHIRP) data were collected near coring targets. The survey and coring targets were designed to image faults and paleochannels that could potentially serve as piercing points. Trigger cores were deployed with the JPCs. GC and JPC targets were selected from previously collected Sparker and Boomer Multichannel as well as CHIRP seismic profiles. In some cases, drift in ship position caused the cores to be offset from the profiles, in which case the core locations were projected orthogonally onto the profile. On board, whole intact cores were scanned for magnetic susceptibility, gamma density, P-wave velocity, and resistivity using a GeoTek Core-logger. Cores were split and observations of color, grain size, sediment structures, and general lithology were recorded.
54 samples were collected for radiocarbon dating, preferentially from planktonic foraminifera (Table 1). As some samples did not contain sufficient planktonic foraminifera for age dating, benthic foraminifera were used in these samples. Fragmented foraminifera and foraminifera that showed signs of diagenesis were avoided. For 9 samples, both planktonic and benthic samples were collected in order to define a reservoir age. 48 samples were analyzed at the National Ocean Sciences Accelerator Mass Spectrometry facility at the Woods Hole Oceanographic Institution and produced an age using the Libby half-life of 5568 years and following the convention of Stuiver and Pollach (1977). The remaining samples were analyzed at the WM Keck Carbon Cycle Accelerator Mass Spectrometry facility at the University of California Irvine following the same conventions. The 14C ages were converted using the CALIB program version 7.0.4 (Stuiver and Reimer, 1993) with a reservoir age of 800 for planktonic foraminifera < 12,000 year and a reservoir age of 1100 for planktonic foraminifera > 12,000 year (Southon et al., 1990; Kienast and McKay, 2001; Kovanen and Easterbrook, 2002). Based on the 9 samples that acquired ages for both benthic and planktonic foraminifera, we calculated an average difference in reservoir age of 900 years. For this difference in reservoir age, benthic foraminifera < 12,000 year would have a reservoir age of 1700 year, which is comparable to the reservoir age of 1750 for benthic foraminifera used by Mix et al. (1999), Covault et al. (2010), Brothers et al. (2015), and others. Thus, we used this value of 1750 years for a benthic reservoir age. Age-depth models for cores containing more than two dates were constructed using the Bacon software version 2.3.3 (Blaauw and Christen, 2011) using the reservoir ages as mentioned above and calibrated using the Marine 13 curve (Supplementary Figure S1). The Bacon software divided each core into 20 cm thick vertical sections and estimated accumulation rates for each section through millions of Markov Chain Monte Carlo iterations (Blaauw and Christen, 2011). This version of the Bacon software allows users to input abrupt events of sedimentation such as slumps and turbidites (Blaauw and Christen, 2011). Nevertheless, the software assumes that there are no hiatuses between these rapid sedimentation events (Blaauw and Christen, 2011) and does not account for sediment reworking in cores. The bounding depths of sand layers with abrupt basal contacts were inputted into the software as rapid periods of deposition in the age-depth models. If sand layers were bound by radiocarbon dates, the date of the sand layer was taken as an average of the corrected dates. If the sand layers were lacking bracketing radiocarbon ages, the age of the base of the sand layer was determined using the age-depth model produced by the Bacon software. In sections where turbidites are amalgamated, turbidites were distinguished by their erosive basal boundary and the age of the center of each turbidite was extrapolated using the age-depth model.
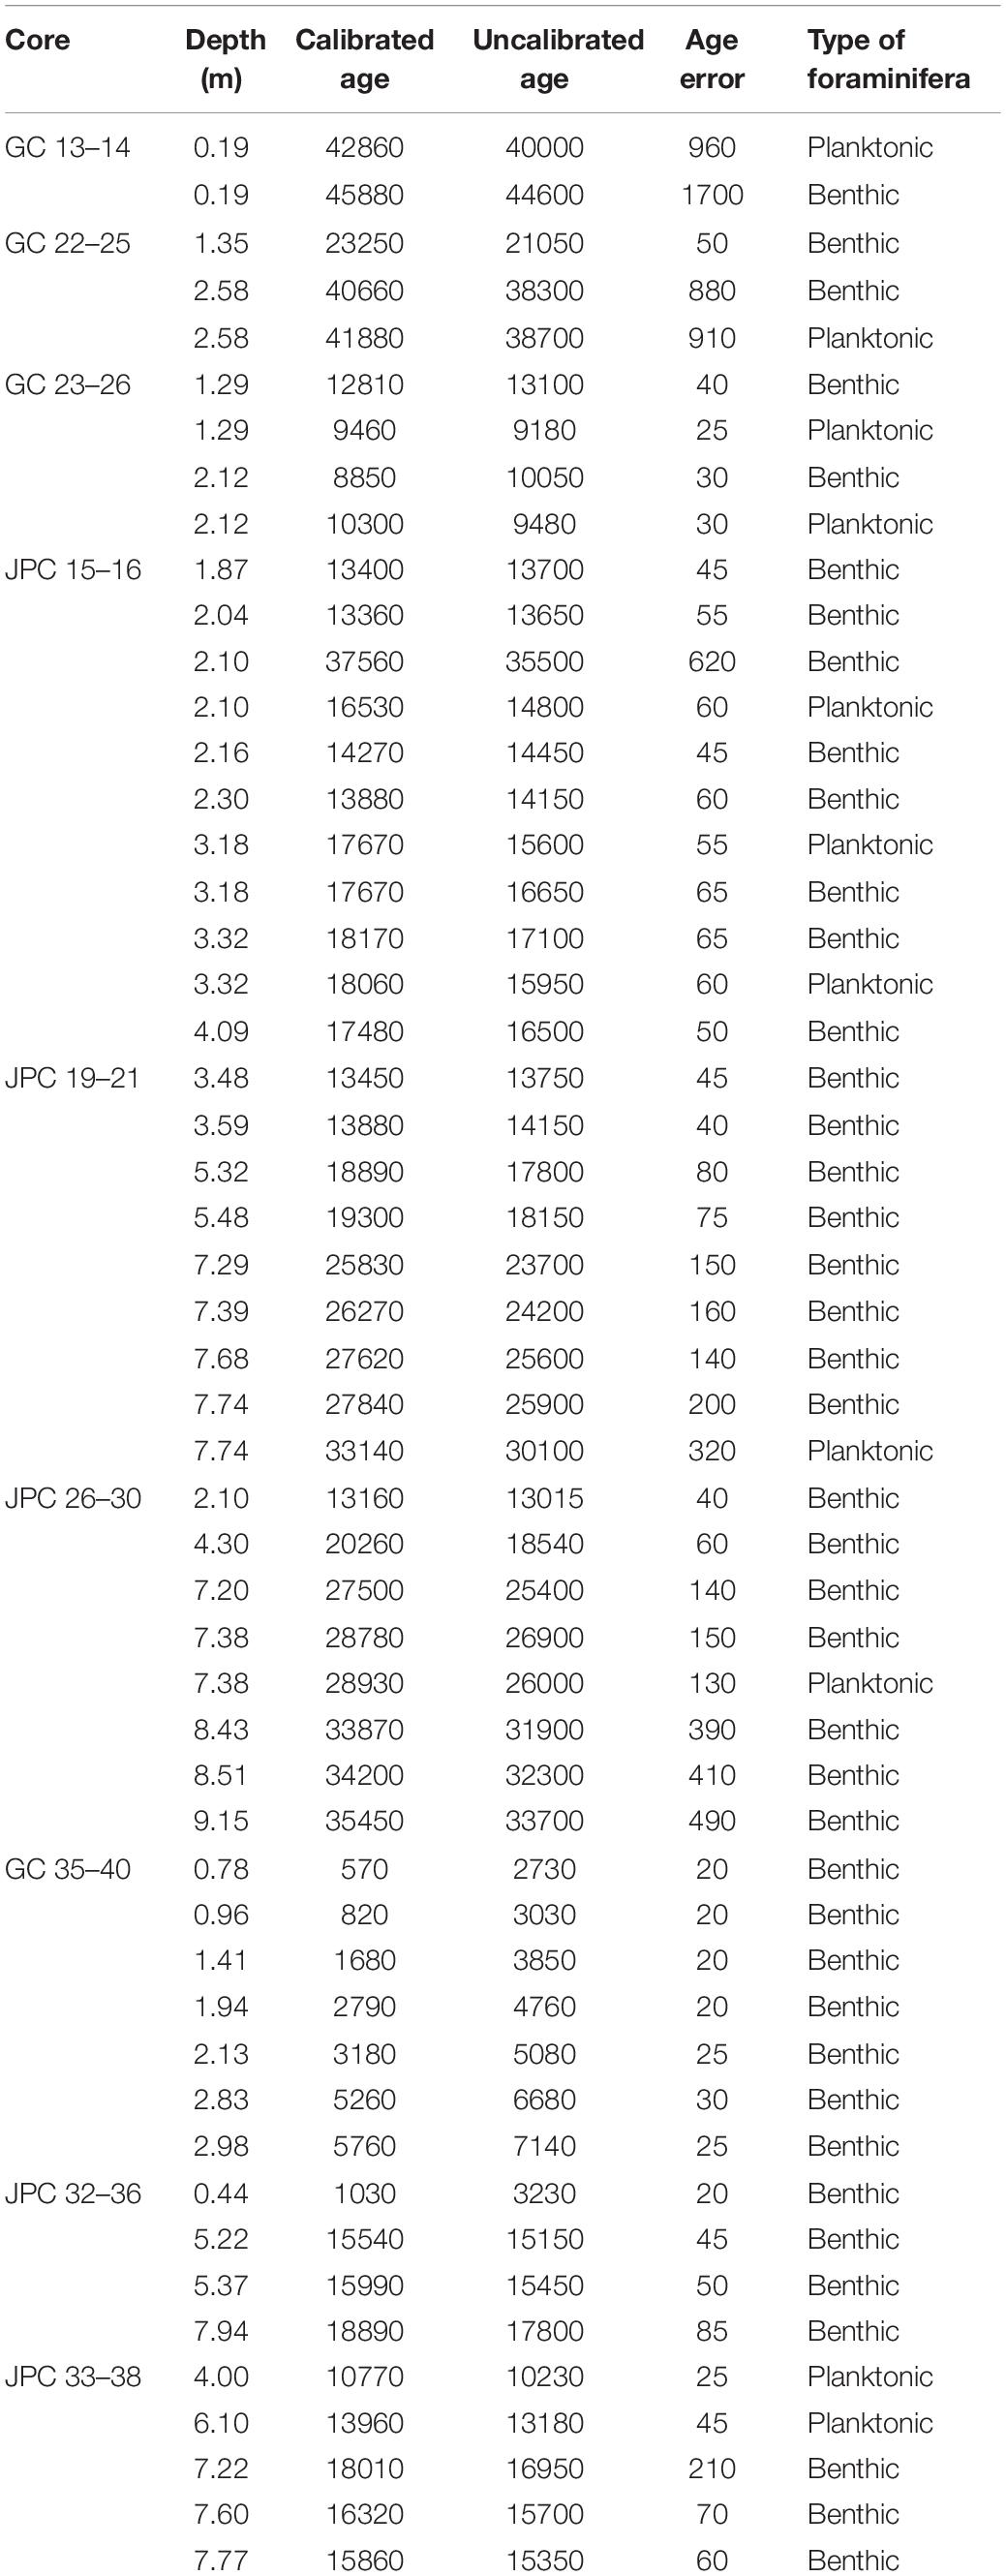
Table 1. Radiocarbon ages used in this study.
Results
San Onofre North and South (SON and SOS) Canyon-Channel Geomorphology
The SON and SOS canyon-channel have respective lengths of 9.61 and 9.74 km and sinuosities of 1.15 and 1.10. Bathymetric profiles through the SON, SOS, and Dana Point canyons reveal marked variability in gradient (Figures 2A–C). The upper, middle, and lower slopes of each canyon are defined by changes in gradient. The SON Canyon-channel is characterized by a steep concave-up profile (maximum of ∼13°) in the middle slope between the depths of 240 and 680 m (Figure 2A). The characteristic feature of the SOS Canyon-channel is the gently sloping and smooth terraced feature (average ∼4.5°) in the middle slope between the depths of 430 and 480 m, above and below which the average gradient increases to ∼7° (Figure 2B). The lower slope has higher rugosity than the upper or middle slopes due to mounded features between 500 and 800 m that increase channel gradient for short distances (Figures 2B, 3). On the slope map, these mounded features are crescentic in plan-view, are perpendicular to the SOS canyon, and exhibit steeper gradients (Figure 2D). We fit a linear regression to the morphology and subtracted the average slope from the bathymetric profile to reveal five mounded features, with three low-amplitude mounds with wavelengths ranging from 260 to 307 m and two larger mounds with longer wavelengths of 613 and 641 m (Figure 3).
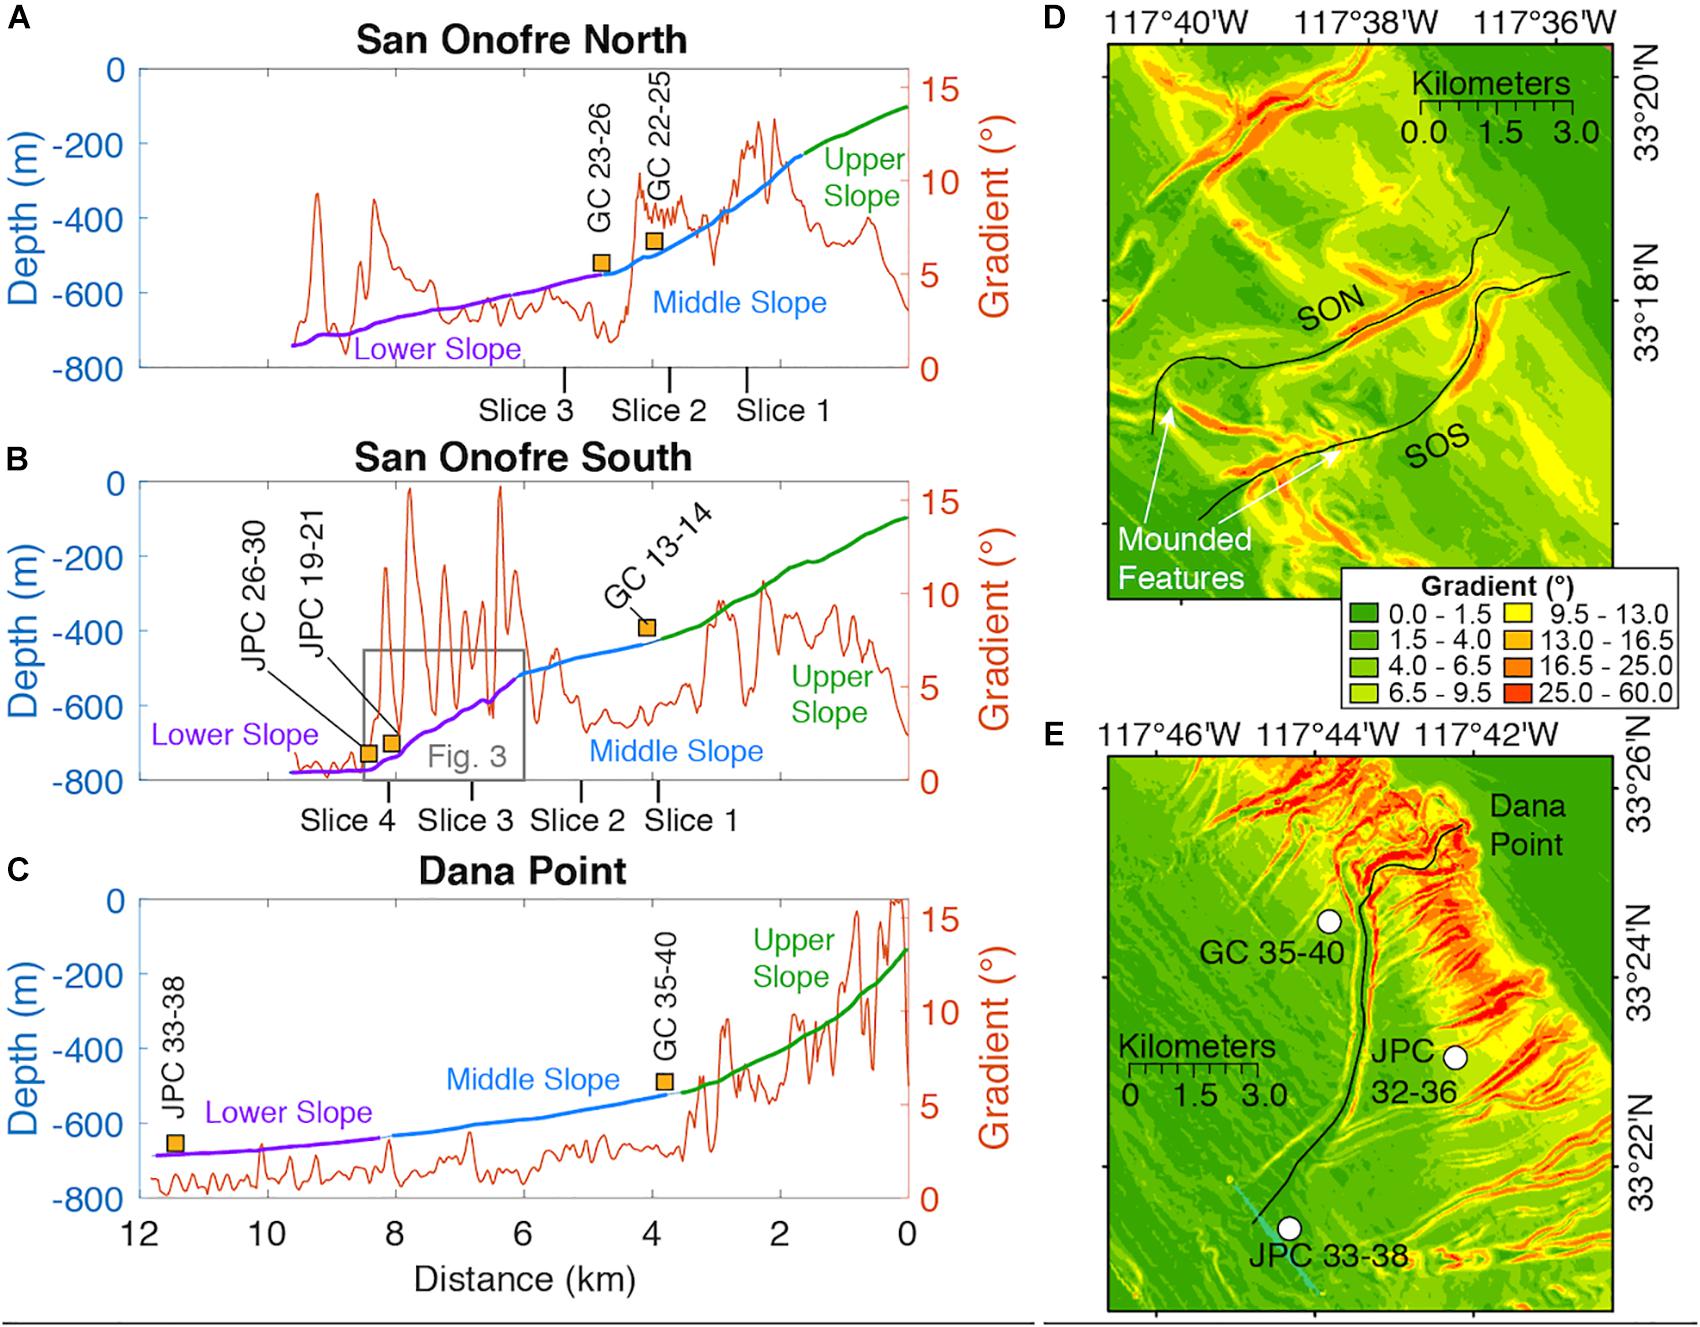
Figure 2. (A–C) Bathymetric profiles of the San Onofre North, San Onofre South, and Dana Point Canyons are plotted with channel gradient. The channel profiles are subdivided into the Upper, Middle, and Lower slope. The locations of sediment cores are projected onto profiles as yellow squares. The intersections of Sparker 3D seismic slices are shown by the vertical black lines. In (B), the location of Figure 3 is highlighted. (D,E) Gradient maps offshore of San Onofre and Dana Point. SON = San Onofre North, SOS = San Onofre South. Green colors represent gentler gradients and red colors represent steeper gradients. The bathymetric profile through the channel is shown by the black line.
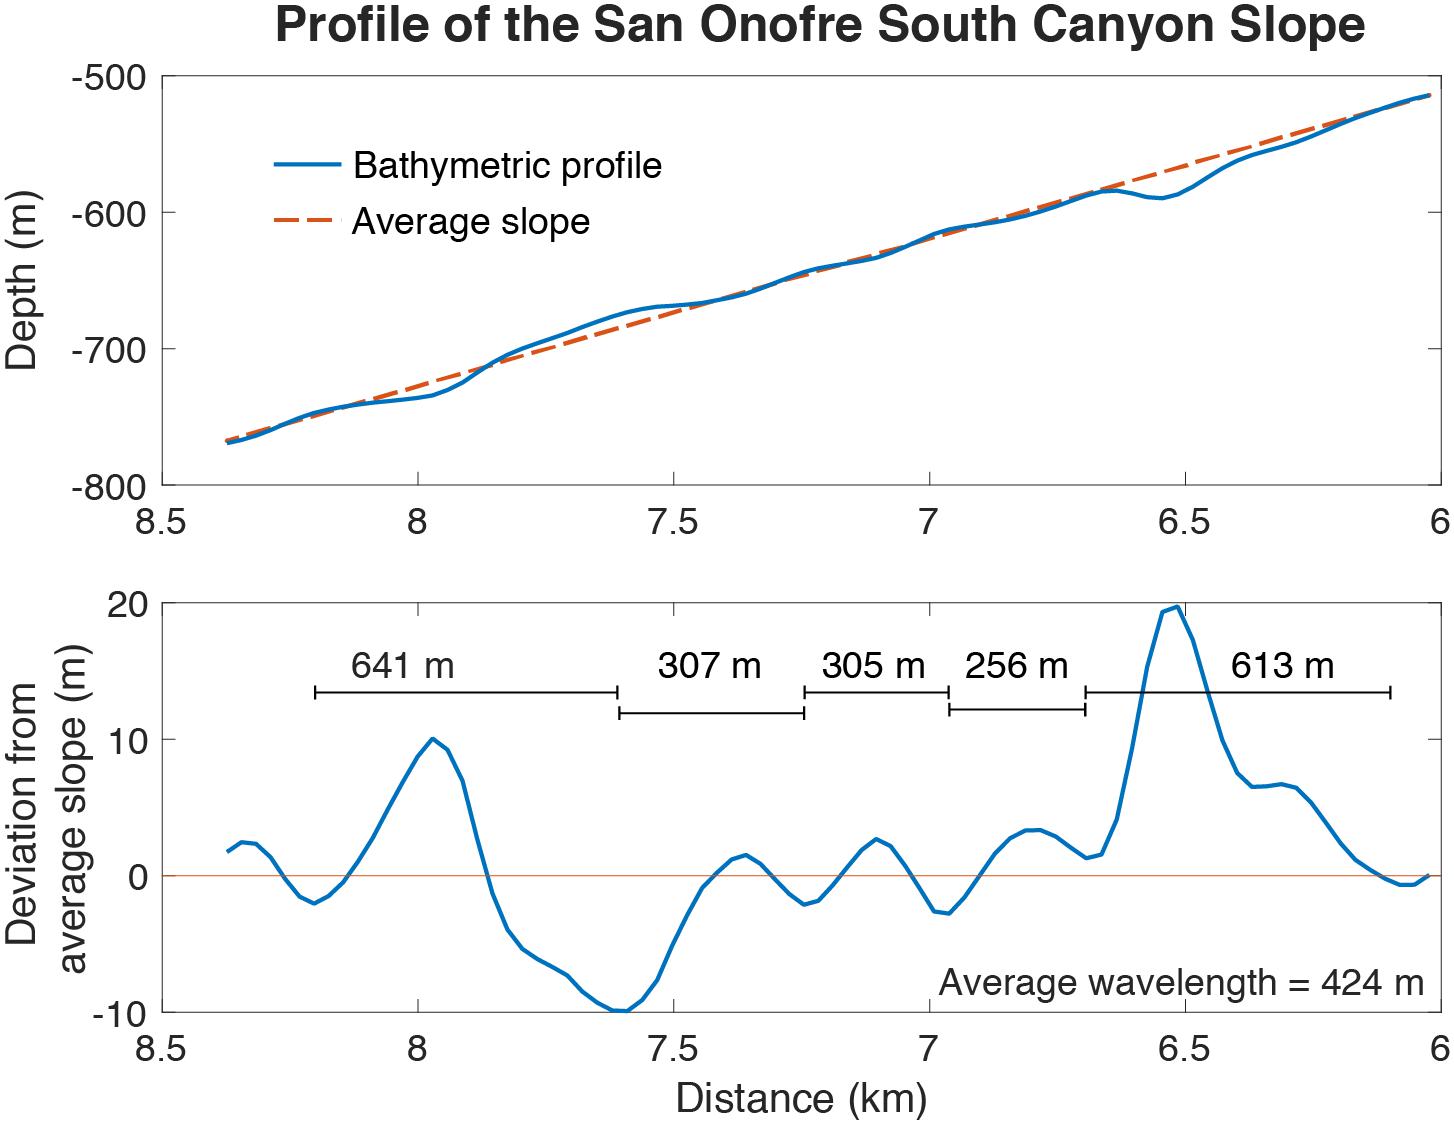
Figure 3. (Top) The bathymetric profile from the lower slope of the San Onofre South Canyon is plotted in blue and has undulatory features. The dashed orange line is the average slope for this length of the canyon. (Bottom) Subtracting the average slope from the bathymetric profile reveals undulatory features with amplitudes ranging from 2 to 15 m and wavelengths ranging from 256 to 641 m.
We examined cross-sections of the SON and SOS canyons to calculate channel relief (Figures 4A,B). In both the SON and SOS canyon-channels, deeper channel depths are spatially coincident with steeper channel gradients (Figure 4B). The SON and SOS canyon-channels are narrow and v-shaped in the middle slope and widen in the lower slope (Figures 4C,D), consistent with other canyon-channel systems on the California margin and worldwide (e.g., Menard, 1955; Normark, 1970; Covault et al., 2011). The SON channel exhibits the greatest relief of 70 m between Slices 1 and 2 at approximately 3 km on the channel profile (Figure 4B) and this maximum incision is spatially coincident with a decrease in channel gradient. Where the channel has greatest relief, it is characterized by a v-shape in cross-section 4 (Figure 4C). Maximum relief of the SOS channel is farther downslope, between Slices 3 and 4 (Figure 4B), where the channel widens and has an asymmetrical v-shape near cross-section 8 (Figure 4D).
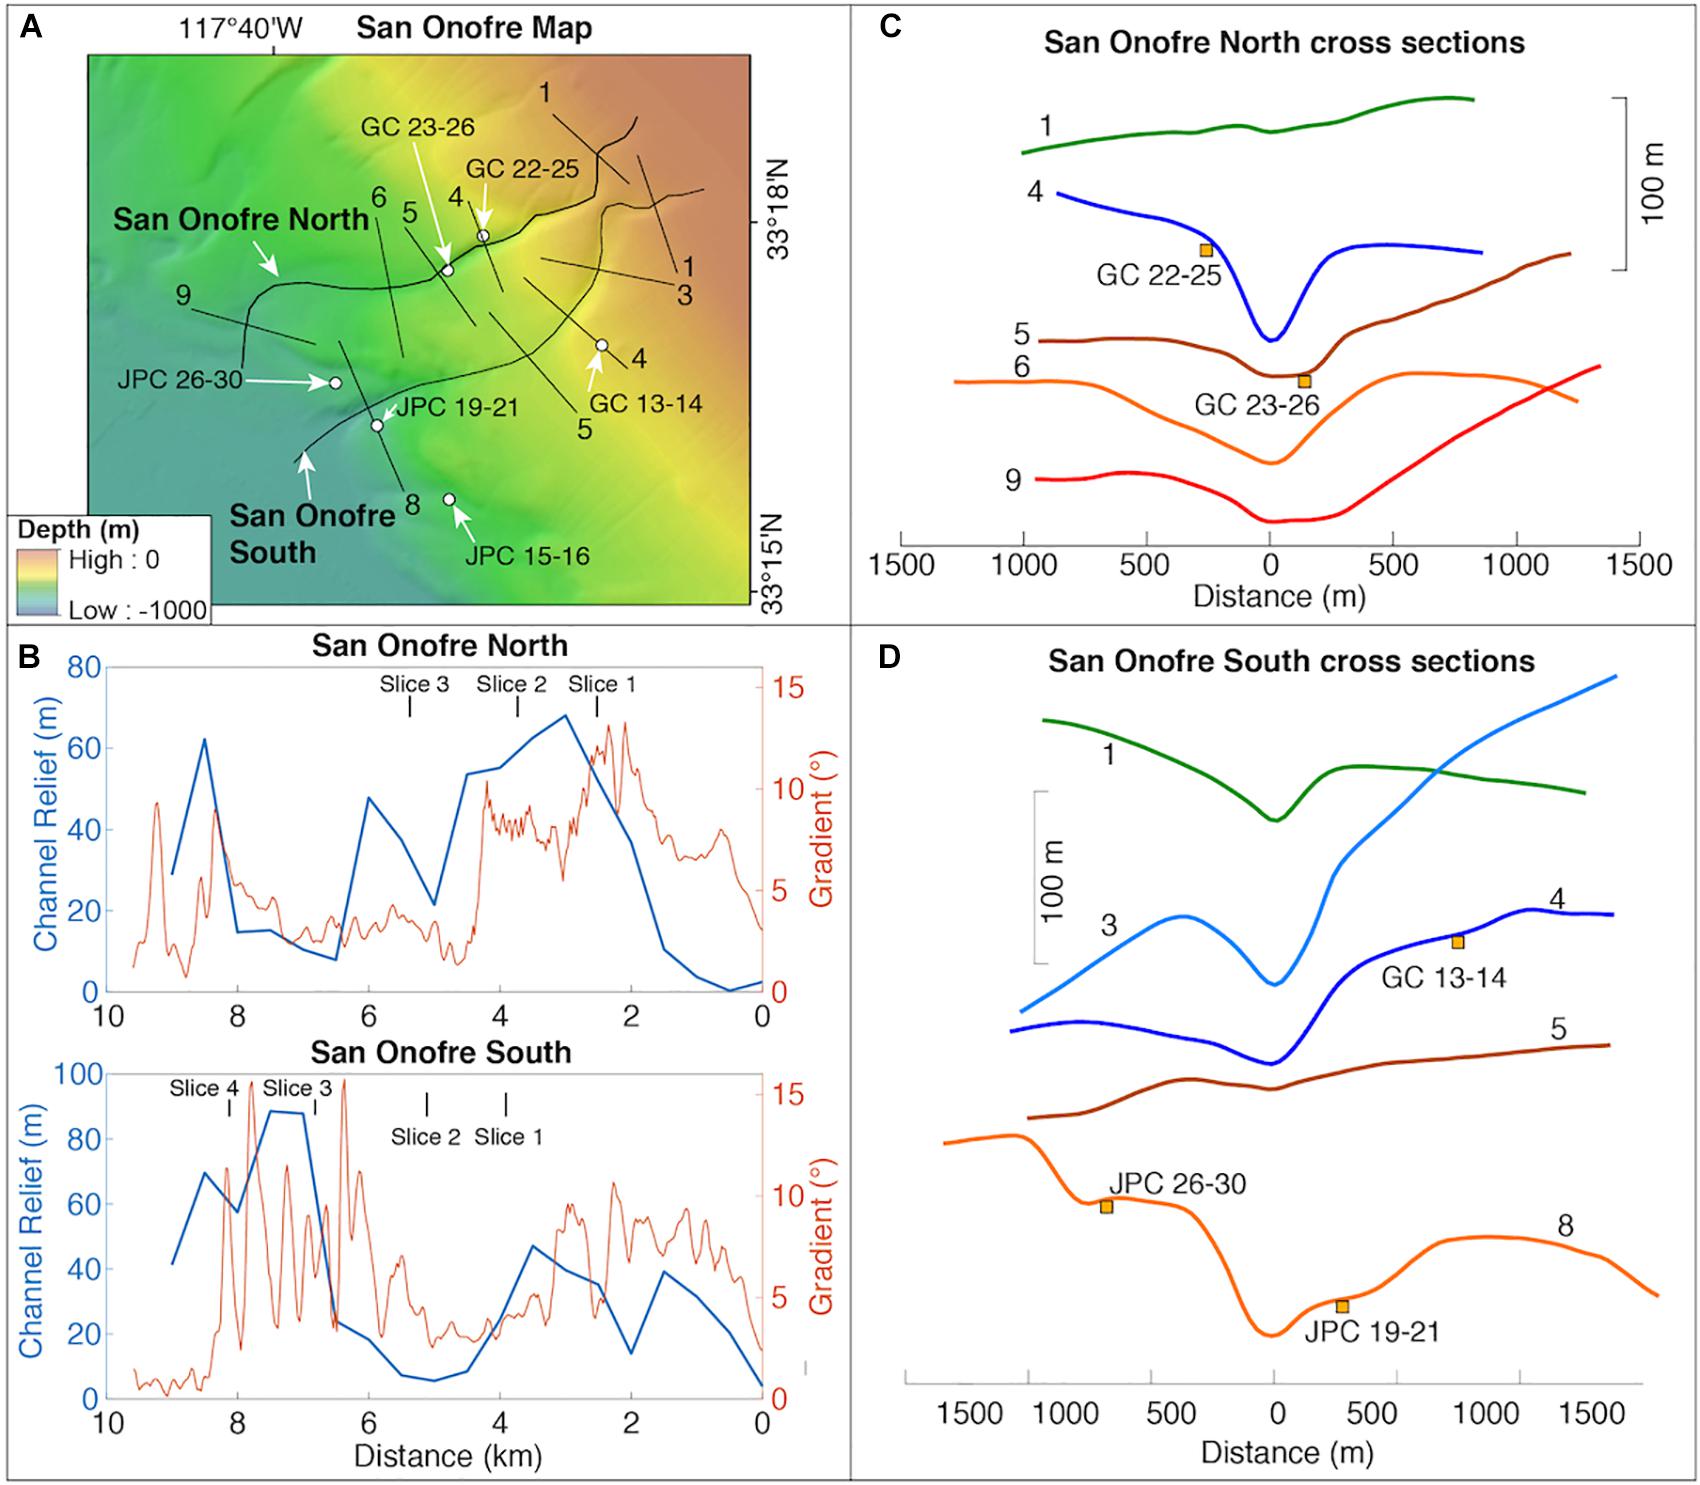
Figure 4. (A) Bathymetry of the San Onofre North (SON) and South (SOS) Canyons. Cross-sections numbers correspond to their distance (in km) from the start of the bathymetric profile and are shown in panels C and D. Sediment cores are labeled. (B) Channel relief is plotted relative to channel slope for the two canyons. The intersections of the 3D Multichannel Sparker slices with the canyons are indicated at the top of the plots. (C,D) Cross sections through the SON and SOS canyon-channels are plotted. Horizontal and vertical scales are shown. Sediment cores were projected onto cross-sections and are indicated by yellow boxes.
The head of the SON channel, shown in cross-section 1, exhibits minimum width (302 m), depth (3.7 m), and cross-sectional area (708 m2; Figure 4C). While the SON channel exhibits maximum width (1185 m) and cross-sectional area (18650 m2) in cross-section 8, SON channel depth reaches a maximum at cross-section 3 (68 m; Figures 4B,C). In contrast to the SON channel, minimum width (492 m), depth (5.5 m), and cross-sectional area (1216 m2) are located in the middle slope cross-section 5 (Figures 4B,D). Like the SON channel, width, depth, and cross-sectional area reach maximums in cross-sections 7 and 9, with widths of 3412 m, depths of 83 m, and cross-sectional areas of 87270 m2 (Figures 4B,D).
Stratigraphy of the San Onofre Slope and Canyons
Sparker dip profiles through the study area reveal the internal structure of sediment packages along the slope. Four sediment units were delineated based on sequence stratigraphic principles (e.g., Mitchum et al., 1977; Vail et al., 1977; Christie-Blick and Driscoll, 1995). The upper boundaries of many of the packages can be defined by toplapping reflectors against the base of the overlying unit. The uppermost sediment package on the slope is the Pink Unit that infills local bathymetric lows in all dip profiles and pinches out where there are local bathymetric highs (Figure 5). In strike profiles, the Pink Unit exhibits continuous high-amplitude reflectors that distinguish it from the underlying Blue Unit (Figures 6A,B). In dip profiles, the underlying Blue Unit also infills local bathymetric lows and is not present everywhere on the slope (Figure 5). Low-amplitude reflectors within the Blue Unit exhibit toplap in strike profiles, especially over bathymetric highs (Figures 6A,B). Orange Unit reflectors exhibit toplap in dip Line 11 against the Blue Unit (Figure 5A), and in dip Line 53, flat-lying reflectors in the Blue Unit terminate against the Orange Unit (Figure 5C). Green Unit reflectors exhibit some toplap against the overlying Orange Unit around 5 km in dip Line 53 and around 7 km in dip Line 13 (Figures 5C,D). The lower boundary of the Green Unit is delineated by a high amplitude reflector in strike Slice 1 and the northwest portion of Slice 3 (Figures 6A,C) and this lower boundary truncates underlying reflectors in Slice 4 (Figure 6D). Sediment packages below the Green Unit were not interpreted.
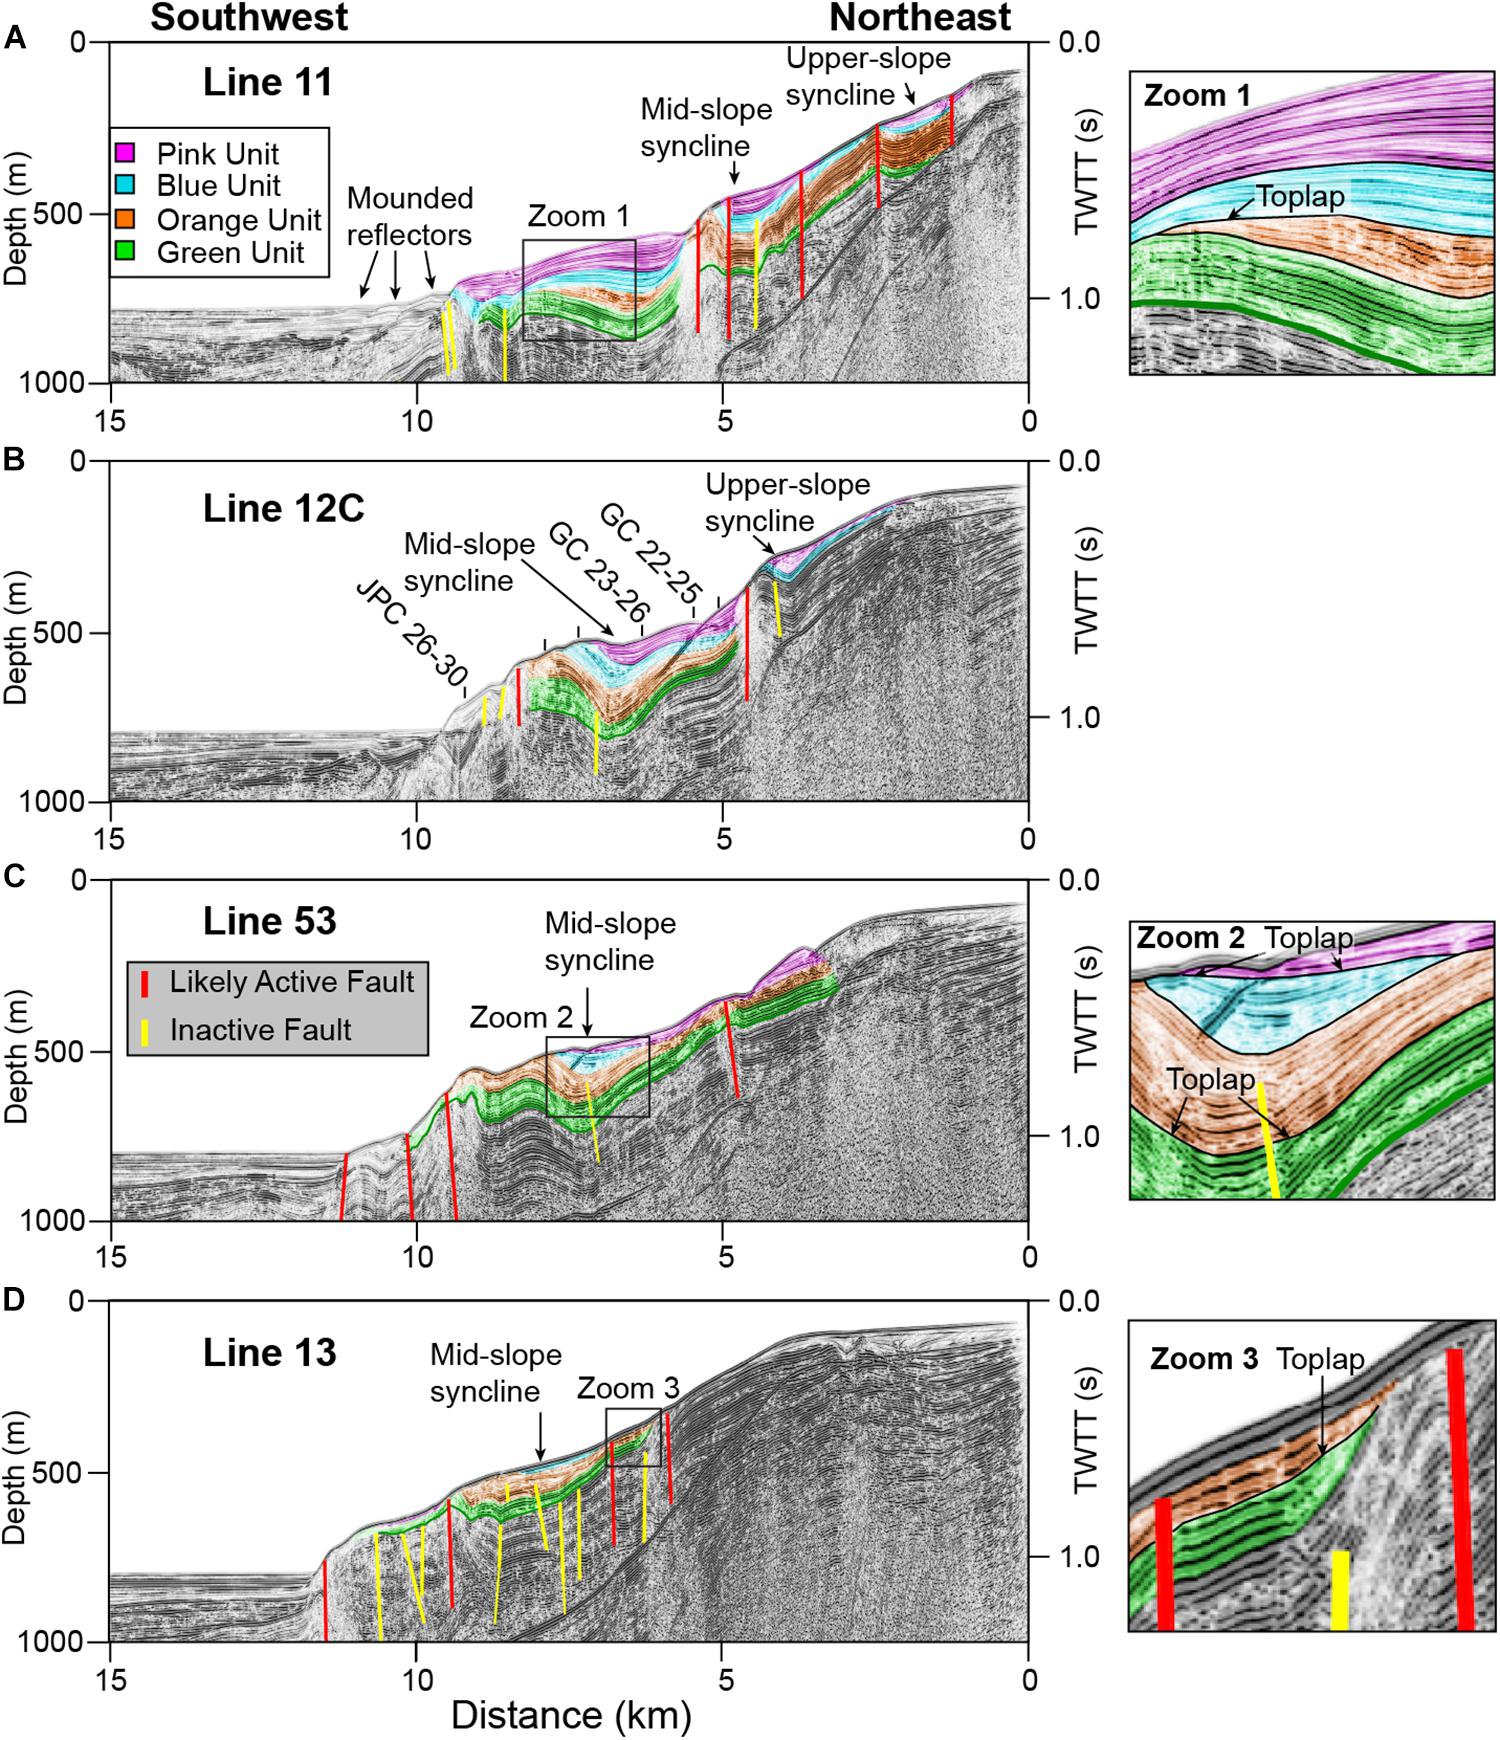
Figure 5. Sparker seismic dip profiles offshore San Onofre reveal the internal structure of the slope and are organized with the northernmost profile at the top and southernmost profile at the bottom. (A) Line 11 is located northwest of the SON canyon, (B) Line 12C intersects the SON canyon, (C) Line 53 intersects the SOS canyon, and (D) Line 13 is southeast of the SOS canyon. The continental slope is characterized by a mid-slope syncline that decreases gradient that is bound by anticlines that increase gradient. Lines 11 and 12C contain upper slope synclines. The mid- and upper-slope synclines act as ponded basins that trap sediment. Mounded features are shown at the slope-basin transition in Line 11. Colors of Units are shown in panel A. Active faults offset reflectors just below the seafloor are shown in red. Inactive faults offset deeper reflectors and are shown in yellow. Sediment cores are projected onto seismic lines. Locations of lines are shown in Figure 1. At right are enlargements of areas that show toplapping relationships. Vertical Exaggeration = 5.6. For uninterpreted seismic profiles, see Supplementary Figure S2.
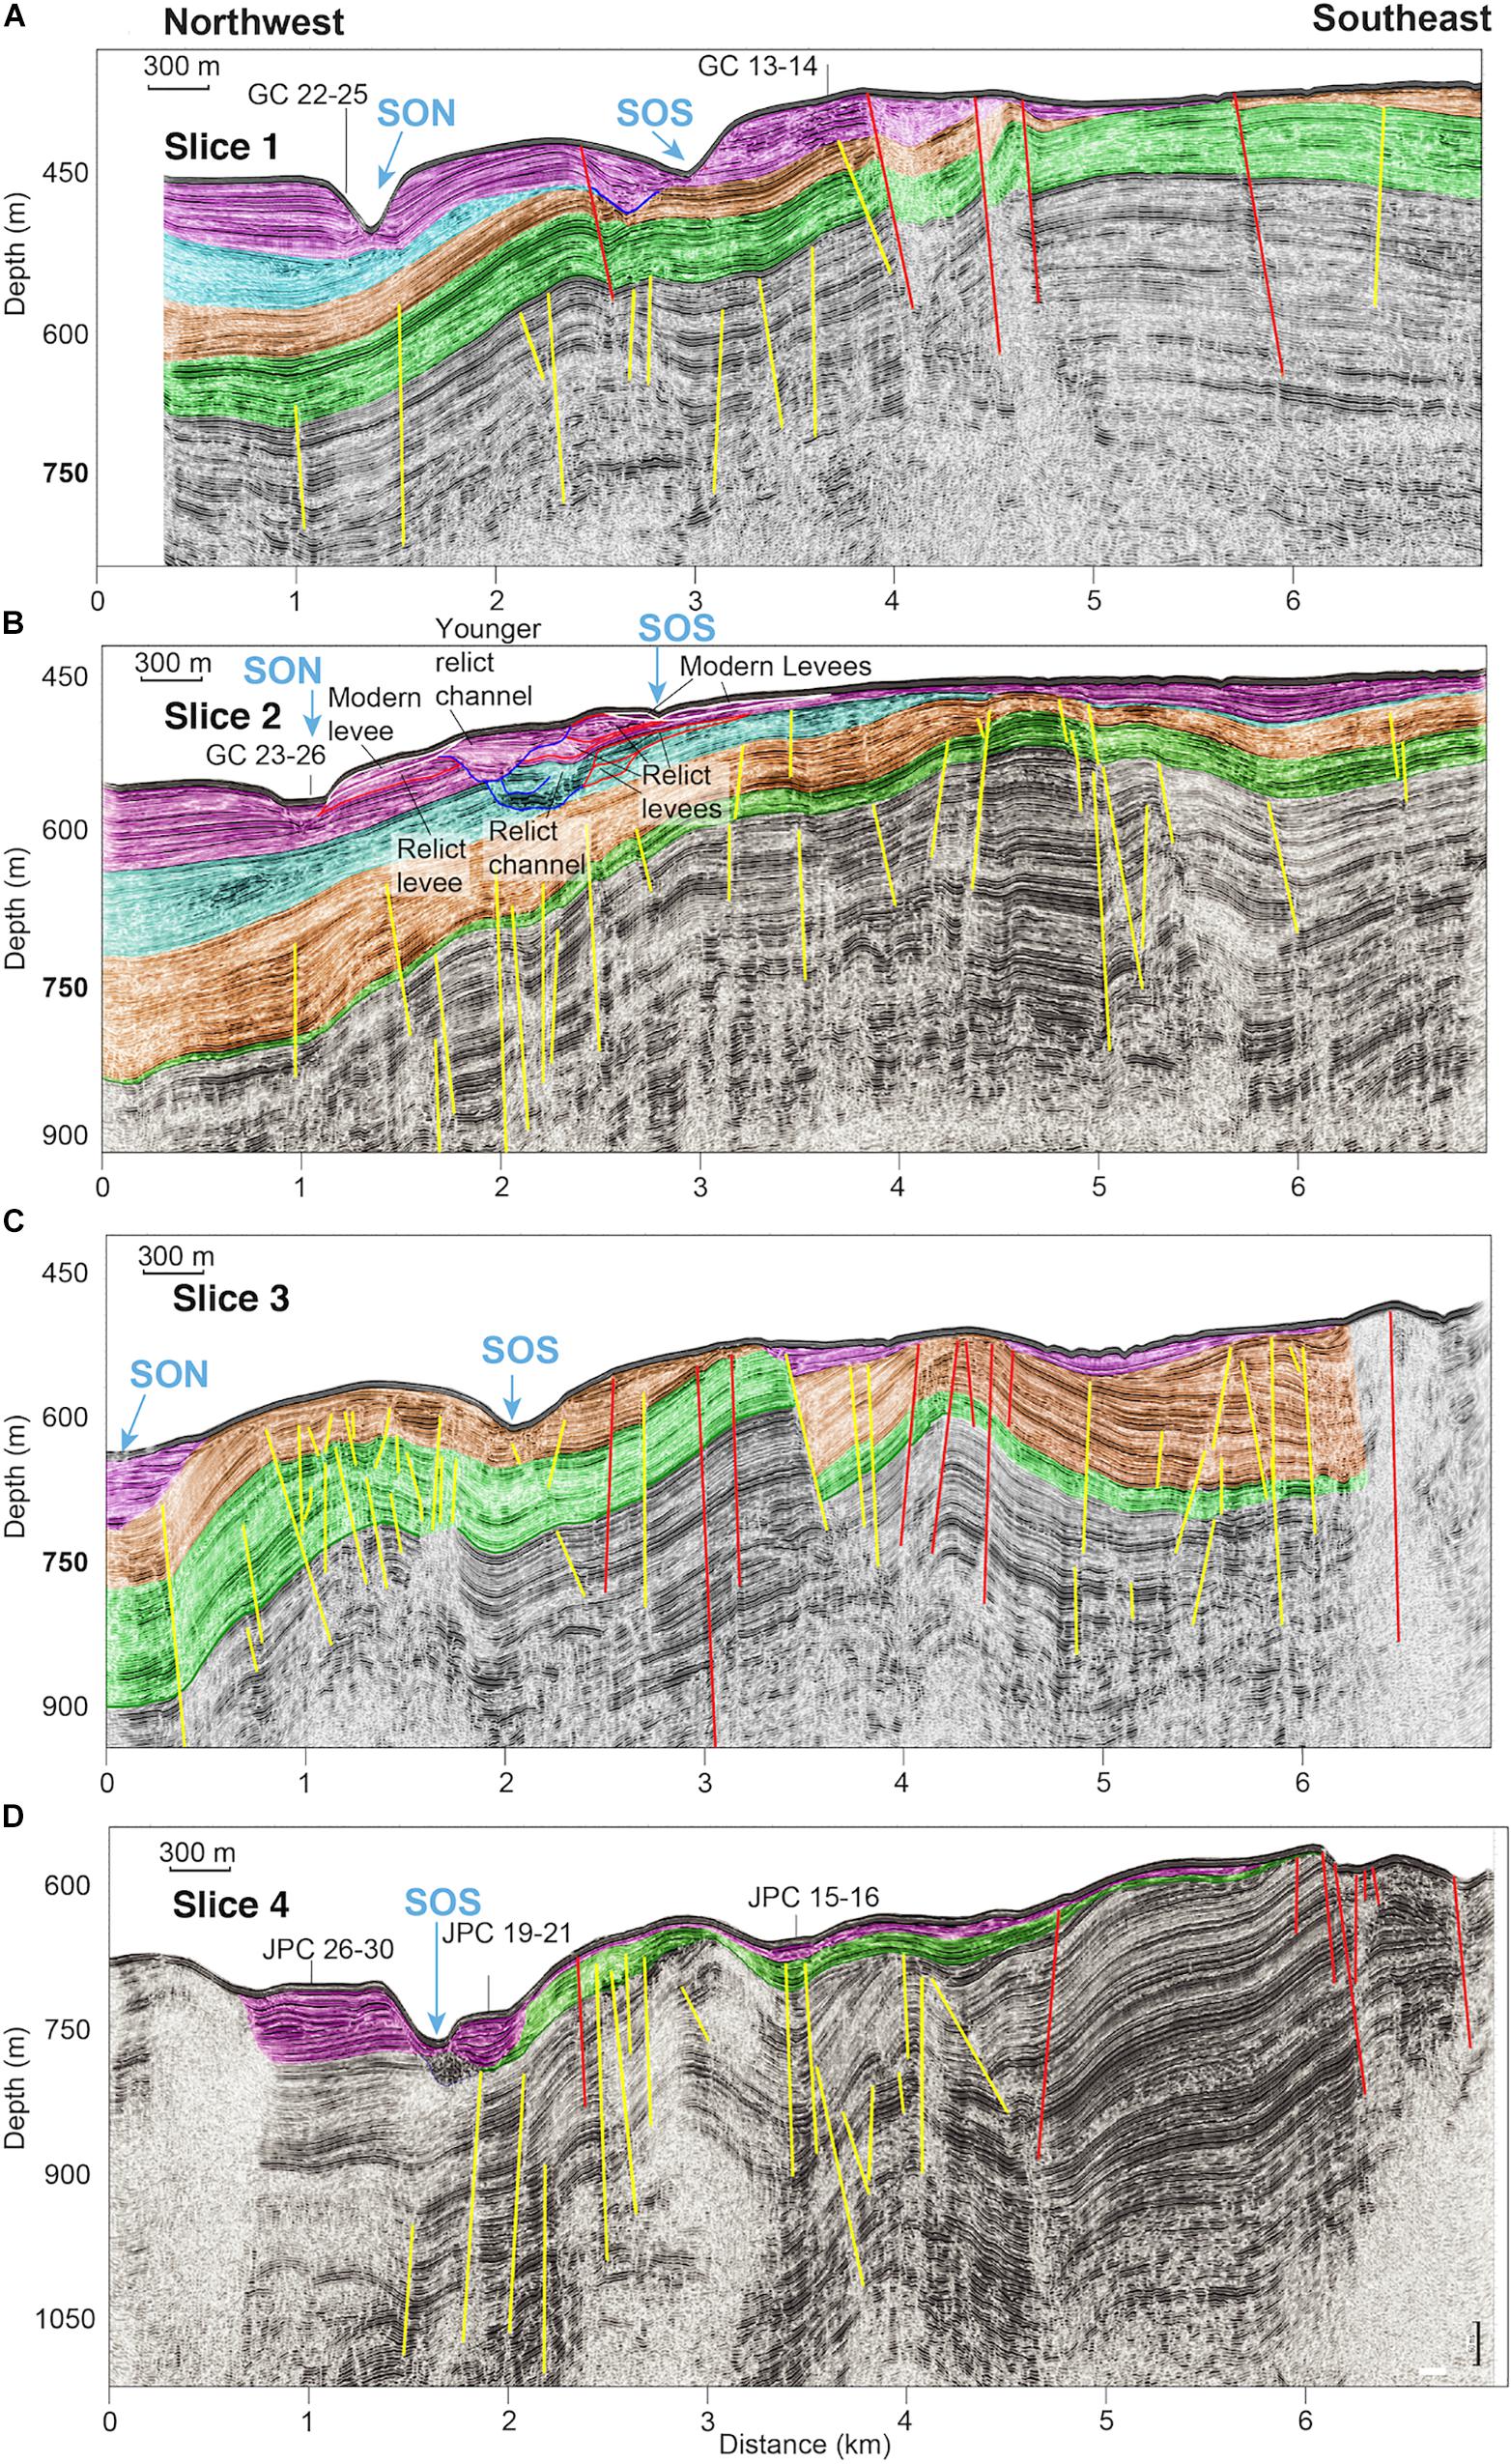
Figure 6. Strike slices along the San Onofre margin reveal the internal architecture of the slope and channel elements. (A) Slice 1 and (B) slice 2 are located on the middle slope. (C) Slice 3 and (D) slice 4 are located on the lower slope. This anticline controls the location of the SON and SOS canyons ad well as the thickness of Pink, Blue, Orange, and Green units. The shallowest (easternmost) slice is at the top and the deepest slice (westernmost) is at the bottom. Sediment cores are projected onto seismic slices. Locations of lines are shown in Figure 1. Vertical Exaggeration = 5.1. For uninterpreted seismic profiles, see Supplementary Figure S3.
Dip profiles through the survey area (Figure 5) reveal that in general, portions of the slope with steep gradients are along anticline limbs. Conversely, portions of the slope with gentler gradients correspond to infilled synclines. Upper slope synclines appear only in the two northern dip profiles (Figures 5A,B). Some faults bounding the upper-slope syncline appear to offset reflectors just below the seafloor (Figure 5A). The upper-slope syncline is separated from a mid-slope syncline by an anticline that is cross-cut by a recent fault and obscured by gas-wipeout (Figures 5A,B). In contrast to the upper-slope syncline, the mid-slope syncline is observed in all dip profiles (Figure 5). Note that the local mid-slope and upper-slope synclines are completely infilled by sediment (Figure 5). Deformation within the mid-slope syncline appears to have along-margin variability. Faults at the syncline boundaries in lines 12C, 53, and 13 appear to deform the uppermost reflectors; nevertheless, faults cross-cutting the mid-slope syncline appear to have deformed only the Green and Orange units (Figures 5A–C). In these three lines, only Green and Orange units exhibit sediment thickening toward cross-cutting faults in the mid-slope syncline (Figures 5A–C). At the slope-basin transition, recent sediment onlaps slope deposits (Figure 5B). This recent sediment has an undulatory bathymetric expression and appears to step northeast through time (Figure 5A). The most seaward undulatory feature is onlapped by aggrading reflectors (Figure 5A). Four slices from 3D P-Cable data oriented along-strike to the margin reveal that the most prominent feature shaping the slope offshore of San Onofre is a prominent anticline that is clearly imaged in Slice 2 (Figure 6B). Sediment thins across the anticline crest and thicken away from the crest (Figure 6B).
Channel and overbank deposit geometry appear to correspond to variations in channel gradient. Pink Unit deposits adjacent to the SON channel have aggradational reflector character in Slices 1, 2, and 4 (Figures 6A,B,D). The SON channel incises into 16 m of aggradational Pink Unit deposits in Slice 1 (Figure 6A). In Slice 2, the SON channel incises into 18 m of Pink Unit deposits, above which a u-shaped feature is infilled with discontinuous, wavy reflectors (Figure 6B). Overbank deposits with gull-wing geometries that converge away from the channel are defined as channel levees, after Qin et al. (2016). Modern Pink Unit levees to the northwest of SON have maximum thicknesses of 82 m in Slice 1 and 87 m in Slice 2 (Figure 6B). Modern levees to the southeast of SOS are thick in Slice 1 and thin in Slice 2 (Figures 6A,B), whereas Pink Unit levees in between the SON and SOS channels are complicated by cross-cutting relationships. In Slice 2, the relict SOS channel may have truncated relict levee deposits from the SON canyon. Broadening in Slice 3, the SON channel is partially infilled with a Pink Unit deposit that unconformably aggrades into a NW-SE trending synform (Figure 6C). The SON channel is not present in Slice 4 (Figure 6D). Levees bounding the SOS channel exhibit more variability. In Slice 1, the SOS channel has an asymmetric v-shape that is adjacent to dipping wavy reflectors in the northwest levee and conformable reflectors in the southeast levee (Figure 6A). In Slice 2, the SOS channel is extremely narrow and shallow, and is bordered to the northwest by discontinuous, wavy reflectors (Figure 6B). The SOS channel in Slice 3 appears to be located in a local syncline and truncates reflectors in the Orange Unit (Figure 6C). In Slice 3, note the lack of Pink Unit channel levees. In the lower slope Slice 4, the SOS channel exhibits asymmetry, with thick levees to the northwest and thinner levees to the southeast that form a bench-like feature (Figure 6D).
Deformation on this margin is complex, as evidenced by the multiple synclines imaged in dip profiles that create local accommodation (Figure 5), anticlines imaged in dip profiles that increase gradient (Figure 5), and a prominent anticline imaged in strike slices that appears to exert control on SON and SOS locations as well as Pink Unit levee thickness (Figure 6). 3-dimensional seismic fence diagrams provide an unprecedented view of the synclines and anticlines (Figure 7). Overall, the SON and SOS channels are located on the flank of the broad antiform in Slices 1 and 2 in the middle slope (Figures 6A,B, 7). The SON channel thalweg is located at deeper depths than the SOS channel thalweg (Figures 6A,B, 7), since accommodation for the SOS channel is limited, as it is located proximal to the antiform. The lack of accumulation adjacent to the SOS channel in Slices 1–2 is coincident with its v-shape and as the SOS channel moves into a synform in Slices 3–4, channel width increases (Figures 6A,B, 7).
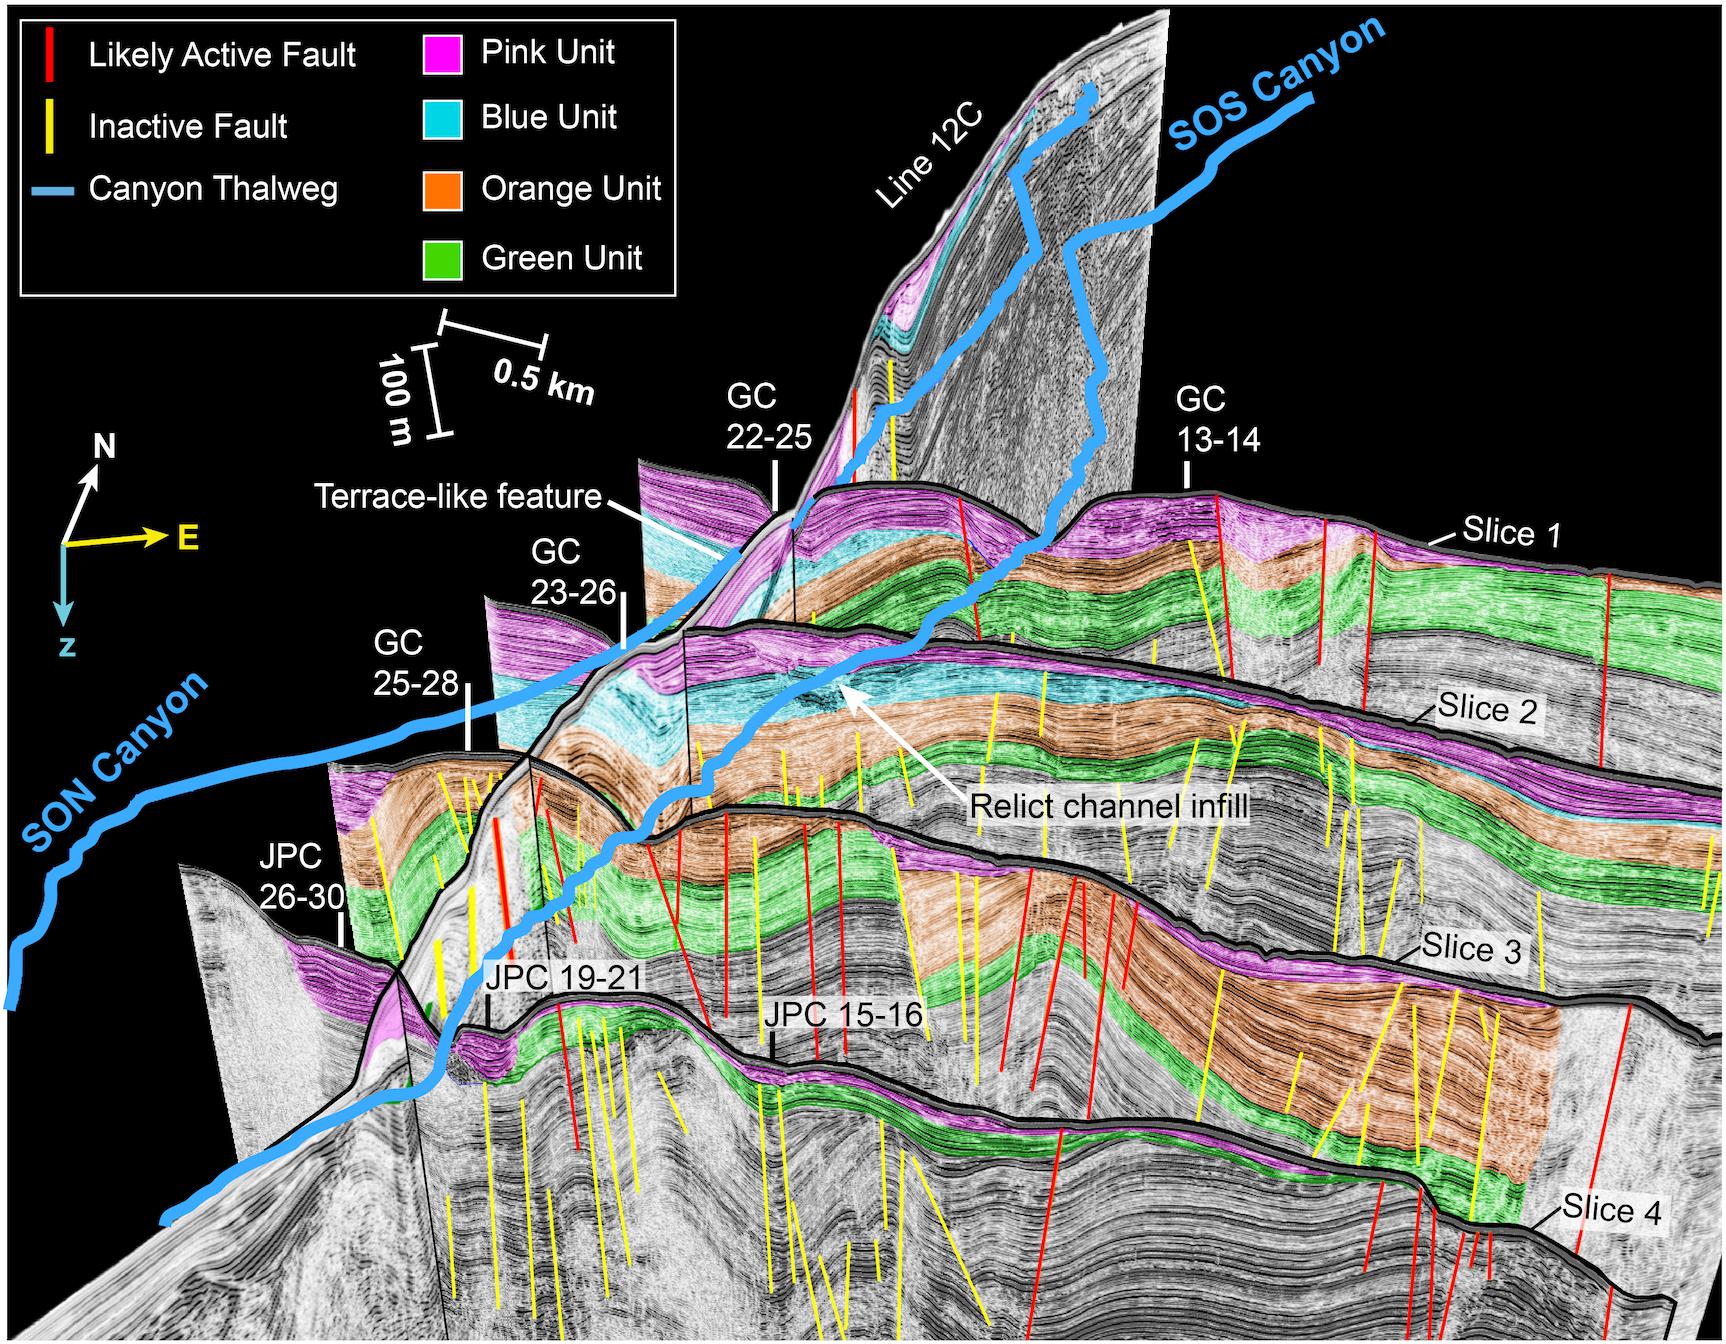
Figure 7. A 3D seismic fence diagram with Sparker 2-D seismic line 12C and Sparker 3D slices. The locations of the two canyons are traced in blue. Colors denote sediment units, with the Pink unit as the youngest and the Green unit as the oldest. Likely active faults are shown in red and inactive faults are shown in yellow. Locations of cores are plotted as white or black lines. Vertical Exaggeration = 6.
San Onofre Sediment Core Lithology and Chronology
Cores offshore of San Onofre can be grouped by their depth on the middle slope (300–600 m) or on the lower slope (600–1000 m). With the exception of JPC 15–16, the upper portions of most of the cores offshore of San Onofre are capped by tens of cm to meters of clay or silty clay (Figure 8). This clay cap is commonly homogenous and bioturbated. In JPC 26–30, the base of the upper clay section is dated to approximately 13.2 kyr, 23.3 kyr in GC 22–25, and 44.4 kyr in GC 13–14 (Figure 8). Below this cap, silty clay or silt layers are interbedded with thin (< 1 cm) to thick (10’s of cm) sand layers. Many of these sand layers fine upward. Sand layers are commonly observed to have sharp, erosive basal boundaries and gradational upper boundaries; however, basal boundaries are occasionally diffuse. Often, sand layers are characterized by color changes, as noted by the change from olive green to tan in the photo of JPC 19–21 (Figure 8 photo inset). Nevertheless, some of the sand layers, such as those shown in the photo inset of JPC 15–16, exhibit only slight color changes. Some of the sand layers also contained shell hash in GCs 22–25 and 23–26 from the middle slope (Figure 8).
Figure 8. Schematic diagrams of San Onofre cores. Labeled grain size scale is shown under GC 13–14 and unlabeled scales are shown under all other cores. Calibrated radiocarbon ages are shown to the right of the cores. At the bottom left, photo insets of select cores are plotted with their depth. The locations of the photo insets are shown relative to core diagrams by the outlined green rectangles.
GC 13–14 was recovered from the southeast end of a channel levee on the middle slope and it contains only one sand layer (Figures 6, 8). This layer has a sharp basal boundary and is composed of a mud matrix with unsorted medium sand, gravel, and shell hash (Figure 8 photo inset). The middle portion of GC 22–25 contains 5 sand layers that fine upward with grain sizes ranging from fine to coarse sand. Radiocarbon dates bracketing the five sand layers suggest that they were deposited between 23.3 and 41.9 ka (Figure 8). GC 23–26, recovered from the SOS channel thalweg (Figure 5B), is composed of an upper silt cap, two sand layers composed of fine sand that are separated by 40 cm of clay, and blocky silt with shell hash in the lower sections of the core. Shell hash is interbedded with silt in GC 23–26 and the concentration of shell hash decreases downsection beginning at 1.4 m (Figure 8 photo inset).
JPCs 15–16, 26–30, and 19–21 were recovered from the lower slope (Figures 6D, 8) and are longer cores that contain 13, 14, and 23 sand layers respectively. The upper 30 cm of JPC 15–16 contains an upward-fining sand layer with coarse sand at the base. The lower 2.5 m of JPC 15–16 is characterized by sand layers with fine to medium sand that are interbedded with silt and clay. Sand layers increase in frequency and thickness in the lower 1.5 m in the core with ages ranging between 17.7 to 18.1 ka. Constraining the exact timing of sand layer deposition is difficult in this core, as ages are inverted. As such, dating of the layers was conducted using age models calculated by the R Bacon package (Supplementary Figure S1). In the lower portion of JPC 26–30, sand layers are less frequent than those in JPCs 15–16 or 19–21 and these sand layers predate the LGM. Overall, sand layers within JPC 19–21 at 5.3 m depth have a lighter color than the surrounding silt and exhibit sharp basal and upper contacts (Figure 8 photo inset). Around 6 m, sand layers are closer together and thicken until the bottom of JPC 19–21, where sand layers are spaced farther apart and consist of fine sand (Figure 8).
Dana Point Canyon-Channel and Core Stratigraphy
The narrow shelf (∼2 km) offshore of Dana Point separates the head of Dana Point Canyon from San Juan Creek (Figure 1C). Dana Point Canyon has two branches at the head and one broad meander, resulting in a low sinuosity of 1.13 (Figures 2E, 9A). Three cores, GCs 35–40, and JPCs 32–36 and 33–38 were collected adjacent to the Dana Point Canyon (Figures 1C, 9A). Sparker seismic surveys do not extend into this area and therefore, most of our interpretations on geomorphology are based off limited CHIRP seismic coverage and multibeam bathymetry.
Figure 9. (A) Bathymetry of the Dana Point Canyon. The location of the CHIRP profile shown in panel B is highlighted in red. Cross-sections numbers correspond to their distance (in km) from the start of the bathymetric profile and are shown in panel D. Sediment cores used in this study are also labeled. (B) Channel relief is plotted relative to channel gradient. Yellow boxes indicate the location of sediment cores along the bathymetric profile. (C) CHIRP seismic profile through GCs 35–40 and 34–39. (D) Cross sections through the DP canyon-channel are plotted. Numbers at right correspond to the distance along the bathymetric profile. Horizontal and vertical scales are shown. Sediment cores were projected onto cross-sections and are indicated by yellow boxes.
The bathymetric profile of the Dana Point Canyon is generally concave-up with a steep upper slope (5–15°), and gentler gradients on the middle and lower slopes (0–3°; Figure 2C). Steep gradients in the upper slope coincide with greater channel relief and canyon-channel depth dramatically decreases between 3 and 4 km as gradient decreases (Figure 9B). This transition occurs at the intersection of the canyon head branches and at the inner bend of the canyon’s meander (Figures 9A,B). A CHIRP seismic profile through this transition and bathymetric cross-sections at 3 and 4 kilometers reveal that the canyon has higher walls to the east (Figures 9C,D). Unlike the SON and SOS canyons, the Dana Point Canyon maintains a u-shaped channel with a wide valley floor throughout the slope (Figure 9D). Depth and cross-sectional area are greatest at 1 km and lowest at 8 km (Figure 9B). Like the SON and SOS canyon-channels, maximum widths of the DP channel are at 9–10 km (Figure 9D).
JPC 32–36 and GC 35–40 are located on the middle slope at depths of 500 and 510 m, whereas JPC 33–38 is located on the lower slope at depths of 688 m. GC 35–40 was recovered from the Dana Point channel flank and is located at the transition from higher to lower channel gradient (Figures 9B,C). JPC 33–38 is located at the slope-basin transition where the canyon widens (Figure 9A). Cores in Dana Point are capped by an upper layer of clay and silt that varies from < 1 to 4 m thick (Figure 10). In GC 35–40, the age of the clay and silt cap is < 570 years BP, < 10.8 ka in JPC 33–38, and cannot be constrained by available ages in JPC 32–36 (Figure 10). Below this, silty clay and sandy silt are interbedded with fine sand. Sand layers in GC 35–40 are a few cm’s thick, whereas sand layers in JPC 32–36 are thin and most are < 1 cm (Figure 10). The 12 sand layers in GC 35–40 exhibit ages between 570 and 5760 years BP and this range of ages is limited by the short core recovery. JPC 32–36, which is farthest core from the Dana Point Canyon, has the thinnest and fewest sand layers (7) that are dated between 15.5 and 18.9 ka (Figure 10). Thick and thin sand layers in JPC 33–38 are amalgamated and can be distinguished by erosive lower boundaries (Figure 10). JPC 33–38 has the most abundant (37) and thickest sand layers that range in age from 10.7 to 15.9 ka (Figure 10). Sand color ranges from olive-gray in the photo of GC 35–40 to light tan in the photo of JPC 33–38 (Figure 10). Some sand layers in JPC 33–38 contain shell hash, which can be observed between 5.6 and 5.7 m in this core’s photo inset (Figure 10).
Figure 10. Schematic diagrams of Dana Point cores. Grain size scale is shown under GC 35–40. Unlabeled grain size scales are shown below all other cores. Calibrated radiocarbon ages are shown to the right of the cores. At right, photo insets of select cores are plotted with their depth. The location of the photo insets are shown relative to core diagrams by the outlined green rectangles.
Discussion
Turbidite Chronology and Uncertainties
Deposition on the continental slope predominantly occurs by two main modes: gravity-driven turbidity flows during intervals with high terrigenous supply or hemipelagic sedimentation when terrigenous supply is low (Stow and Piper, 1984; Walsh and Nittrouer, 2003; Maier et al., 2017). Turbidites were identified in sediment cores by fining-upward sand layers (i.e., graded beds) with erosional bases (Stow and Piper, 1984). While many of the turbidites have sharp, erosive basal contacts and gradational upper contacts, some basal boundaries are occasionally diffuse. The homogenous, upper clay section observed in most cores (Figures 8, 10) is interpreted as hemipelagic sediment drapes that accumulate more slowly. Most of the cores in the study, with the exception of GC 23–26 and JPC 15–16, recovered turbidite deposits from channel levee deposits. Thus, the channel levee cores record higher-volume turbidity currents and it is possible that additional cores from the channel thalweg could preserve younger lower-volume turbidites.
Broad patterns in the histogram reveal that turbidites from high-volume gravity flows are emplaced to the Dana Point slope throughout lowstands and highstands in sea-level (Figure 11). Conversely, turbidites from high-volume gravity flows are emplaced offshore San Onofre predominantly during MIS 2 and exhibit a marked decreased around 12–13 ka with the youngest turbidites deposited at approximately 8 ka (Figure 11).
Figure 11. (A) Histograms of sand layer depositional timing offshore San Onofre and Dana Point have bins of 2000 years. (A) The number of sand layers recovered from cores offshore San Onofre. (B) The number of sand layers recovered from cores offshore Dana Point. In orange, the Southern California sea-level curve from Muhs et al. (2012) versus time.
Offshore Dana Point, turbidites were emplaced in GC 35–40 from 1 to 6 ka, in JPC 33–38 from 13 to 18 ka, and in JPC 32–36 from 15 to 19 ka (Figures 10, 11). Recent turbidite emplacement at GC 35–40 suggests that the upper portion of Dana Point Canyon had high-volume turbidity currents during the sea-level falling stage, lowstand, transgression, and highstand. High-volume turbidity currents may not have reached the lower portion of Dana Point Canyon, the sites of JPCs 32–36 and 33–38, to emplace turbidites after 13 ka. This difference may be related to sediment supply, as recent studies question whether turbidity currents can traverse entire submarine canyon-channel systems (Fildani, 2017; Symons et al., 2017). Thus, presently active turbidity flows in Dana Point Canyon may be restricted to the upper slope.
The paucity of turbidites offshore San Onofre that are younger than 8 ka suggests that the most favorable conditions for turbidite deposition offshore of San Onofre were during the MIS 2 and 3 lowstands and the early transgression (Figure 11). Older turbidites within the San Onofre cores dating back to 40 ka may have a high potential for recovery within JPCs because sedimentation rates are lower offshore San Onofre than in Dana Point and cores offshore San Onofre are condensed. It appears that the shallowest cores offshore San Onofre, GC 13–14 and GC 22–25, have the oldest turbidite ages whereas cores on the middle and lower slopes have slightly younger turbidite ages (Figure 11). GC 23–26 from the channel levee records the youngest turbidite deposits (Figures 8, 11A); nevertheless, it is possible that turbidity currents may have reworked and eroded thalweg deposits. This process may be related to ponded basins, channel gradient, and geomorphology, as discussed in Sections “Across-Margin Deformation Controls Local Turbidite Emplacement” and “Channel Gradient Controls on Morphology and Turbidite Emplacement.”
Reservoir ages for foraminifera vary with depth; ages range from 1000 to 2000 years and have errors as large as 40‰Δ14C (∼320 years) along the Southern California margin (Roach et al., 2013; C. Charles, pers. comm.). As a result, uncertainties exist and precise age estimates for turbidites are not feasible. Such uncertainties for radiocarbon dating on the Southern California margin are associated with the effects of vertical ocean mixing and migration of benthic foraminifera species from the depth of calcification to the depth of deposition (Roach et al., 2013). Furthermore, Bayesian constructions of age-depth models have limitations, as these models do not consider hiatuses or sediment reworking (Blaauw and Christen, 2011). In some sections of JPCs 15–16 and 33–38, inverted radiocarbon ages are within 1000-year error windows found by Roach et al. (2013). When the inverted ages are outside of the 1000-year error window, we hypothesize that inverted ages may be caused by turbidity currents or mass wasting events that mobilize sediment with older foraminifera re-deposited downslope. As such, we examined broad patterns in turbidite depositional timing, such as MIS 3, MIS 2, the post-LGM transgression, and MIS 1. Histograms for turbidite ages offshore of San Onofre and Dana Point employ a 2000-year bin in order to account for large uncertainties in radiocarbon dating (Figure 11).
The hemipelagic mud cap observed in the upper section of most cores is interpreted to have been deposited after terrigenous supply to the canyon-channel declined. Such hemipelagic deposits are also observed draping inactive canyons that halted deposition ∼15–20 kyr ago (Sweet and Blum, 2016), such as the Mississippi (Normark et al., 1986), Amazon (Milliman et al., 1975; Normark et al., 1997), and Nile (Ducassou et al., 2009). While recent papers in the ICB have interpreted mud deposits interbedded with turbidites as hemipelagic background sedimentation (e.g., Maier et al., 2017), some studies in the Gulf of Mexico interpret gray-brown muds interbedded with turbidites as hemiturbidites, or thin fluid-mud flows moving continuously downslope (Damuth, 1977; Damuth and Olson, 2015). It is difficult for us to discern their exact origin, as laminations are obscured by bioturbation. As such, we treated mud interlayers in the age model as constant-rate deposition.
Shelf Width Controls Turbidite Deposition
The San Onofre and Dana Point canyons have four main differences that may affect the emplacement of turbidites, namely (i) shelf width is ∼10 km offshore San Onofre versus ∼2 km offshore of Dana Point (Figure 1C); (ii) Dana Point canyons were likely attached to San Juan Creek during falling stages in sea-level, the lowstand, and the ensuing transgression, whereas the San Onofre canyons were likely not attached to a creek source during the post-glacial transgression; (iii) the Dana Point channel profile is relatively smooth and concave-up in comparison to a more rugose SON and SOS channel profiles; and (iv) sediment discharge to Dana Point Canyon from San Juan Creek is an order of magnitude larger than sediment discharge from San Mateo Creek to the San Onofre canyons. As shelf width is known to be an important control on sediment supply to the slope and basin, widening of the shelf caused by the anticline may contribute to decreased sediment delivery to the slope in that region (Covault et al., 2007, 2010). We propose that broad tectonic and structural controls influence the timing of turbidite deposition regionally (San Onofre versus Dana Point).
Large-scale features such as shelf width and slope gradient are controlled by tectonic deformation. The broad anticline along the outer shelf imaged by Sahakian et al. (2017) is a first-order tectonic feature that has increased shelf width offshore of San Onofre. Second-order features include the anticlines and synclines imaged in dip and strike profiles along the slope (Figures 5, 6). The ponded basins and anticlines are related to transpression and transtension along faults in the SM Fault Zone (Maloney et al., 2016; Conrad et al., 2018). Third-order features such as channel levees are influenced by properties of turbidity flows, such as flow velocity and entrainment.
Comparisons of the SON and SOS canyons to the Dana Point Canyon draw similarities to studies that contrast coast-disconnected canyons versus connected canyons along the same active margin (sensu Gamberi et al., 2015). A study on the Sicilian margin observed that canyons with heads close to the coast are active during the present highstand and are sourced by hyperpycnal flows or longshore currents that rework shelf sands (Gamberi et al., 2015). In contrast, sediment supply to coast-disconnected canyons ceased during the post-glacial transgression (Gamberi et al., 2015). Our comparison suggests that Dana Point may maintain more connectivity to a larger sediment source, whereas the San Onofre Canyons may be farther from the San Mateo Creek with comparatively lower sediment supply.
Deformation on the Slope Controls Turbidite Emplacement
Deformation across the San Onofre slope exerts three main influences on turbidite emplacement: (i) anticlines and synclines form ponded basins that either trap sediment or cause bypass across the slope (Figures 5, 7), (ii) anticlines and synclines dictate the morphology of SON and SOS channel levees along the slope, and (iii) structural controls influence slope gradient, which in turn affect canyon-channel dynamics and geomorphology. Models predict that ponded basins exert controls on grain size, as these basins are predicted to fill with thick, sand-rich deposits, whereas slope deposits tend to contain less sand (Prather, 2000). This model may explain why GCs 22–25 and 23–26 recovered ∼4–5 turbidites from the mid-slope syncline/ponded basin (Figures 7, 8).
On the slope, the only mechanism of generating basins/synclines may be tectonic deformation (Covault et al., 2012) such as right jogs on the right-lateral strike-slip NIRC and SM Fault Zone that form transtensional basins (Ryan et al., 2009; Maloney et al., 2016; Conrad et al., 2018). Recent deformation of the middle slope ponded basin may be observed in Line 11 (Figure 5A); however, recent deformation of Blue and Pink unit sediment is not observed south of Line 11 (Figure 5). Thus, it appears that deformation within the ICB occurred on timescales much longer than the timescales of recent deposition; on this margin, there was no recent renewal of accommodation in local ponded basins. Thick Pink, Blue, and Orange units infilling the mid-slope ponded basin have diminished relief on the continental slope in dip profiles (Line 12C; Figure 5B) as well as SON and SOS channel relief on the intersecting Slice 2 (Slice 2; Figures 6B, 7). Nested U-shaped bodies that truncate underlying deposits and are infilled with aggrading Blue and Pink units are suggestive of relict channels (Figure 6B). As these nested U-shaped bodies are bound by gull-wing shaped levees, we interpret these U-shaped bodies as relict channels rather than localized deformation or draping infill. The older and deeper relict channel was infilled and this aggradational sediment was subsequently truncated by a younger relict channel located to the northwest with shallower channel depths (Figure 6B). After the complete infilling of the younger relict channel, the present-day SOS channel is deflected to the southeast of the relict channels and maintains a shallow depth (Figure 6B). The infilled relict channels serve as an example of how the formation of such ponded basins affect the flow dynamics of channels and channel element architecture.
When ponded basins in the upper, middle, and lower San Onofre slope became completely infilled, sediment likely bypassed these basins and deposited turbidites on the lower slope and basin floor (Figures 5–7). The radiocarbon age below the mud cap in GC 22–25 could imply that turbidite emplacement in the ponded basin ceased before 23.25 ka as the basin infilled. Shortly after, bypass of the ponded basin and pelagic sedimentation may have commenced. This hypothesis is supported by abundant turbidites on lower slope JPCs 15–16, 19–21, and 26–30 that post-date 23 ka (Figure 11).
The anticlines and synclines imaged in the dip and strike profiles (Figures 5, 6) exert controls on the levee morphology adjacent to the SON and SOS canyon-channels. On the middle slope, levees thin toward the anticline crest adjacent to the SOS canyon-channel and thicken away from the anticline crest (Figures 6A,B). Levees located closer to the anticline crest may have less frequent deposition than those located at deeper depths away from the anticline. For example, GC 13–14 has one turbidite that is ∼20 kyr older than multiple turbidites in GC 22–25. While GC 13–14 is located on a shallower levee close to the anticline crest, GC 22–25 is located in deeper water away from the anticline crest. On the lower slope, the SOS channel migrates into a syncline as the channel widens (Figures 6C,D). Thus, deformation on the San Mateo Fault Zone appears to influence turbidite emplacement and timing over lateral distances < 1 km by creating ponded basins that trap sediment, forming anticlines that cause sediment bypass in the cross-margin direction, and affecting levee architecture in the along-margin direction.
Channel Gradient Controls on Morphology and Turbidite Emplacement
Channel gradient exerts controls on turbidity flow behavior, as the velocity of turbidity flows is proportional to gradient (McHargue et al., 2011). Steep gradients along broader scales are often related to greater incision, whereas gentler gradients are related to deposition (Prather, 2000; McHargue et al., 2011; Brothers et al., 2015; Maier et al., 2017). Breaks in channel gradient can emplace turbidites and steep gradients can cause bypass of turbidity currents; as a result, gradient can influence the frequency and timing of turbidite emplacement. Without tectonic deformation, canyon-channel systems on a continental slope would trend toward an equilibrium profile just like fluvial systems (McHargue et al., 2011). A smooth concave-up profile is observed through the Dana Point Canyon, whereas tectonic deformation offshore of San Onofre has created bathymetric irregularities that disrupt the equilibrium profile for the SON and SOS canyons (Figure 2). In this manner, the SON and SOS canyons exhibit similarities to the Palos Verdes Channel, where strike-slip tectonics that create local uplift or pull-apart basins that have inhibited channels from developing an equilibrium profile (Maier et al., 2017). Such variability in turbidity current flow over the SON, SOS, and Dana Point canyons may further overprint the influence of shelf width on turbidite emplacement. While we attempt to address the overlapping influences of shelf width and current dynamics on the turbidite record, these signals cannot be unambiguously teased out, as multiple processes can form similar deposits (Talling et al., 2012).
The concave-up bathymetric profile of the Dana Point Canyon suggests less tectonic deformation in this area than the SON and SOS canyon-channels; nevertheless, depth and changes in downslope gradient may cause local variances in the timing of turbidite emplacement. The gradient changes from 5 to 15° in the upper slope to < 5° in the middle slope (Figure 2C); GC 35–40 is located at this break in gradient and here deposition may be favored over bypass. As a result, it records recent turbidites within the past 600 years (Figure 10). We hypothesize that the presence of older turbidites in JPC 32–36 could be due to its lower slope location and its location farther from the channel axis (Figure 9A).
Turbidite age and the SON and SOS channel gradient do not exhibit a one-to-one relationship. Breaks, or abrupt changes in channel gradient (sensu Maier et al., 2017) are observed at the transitions from the upper to middle and middle to lower slopes (Figure 2) and may further influence localized turbidite emplacement by decelerating flow. Where these breaks occur, thick, aggradational channel levees flank the SON and SOS channels (Figure 7). Such a break on the mid-slope and the core’s thalweg location may explain turbidite emplacement in GC 23–26 as recent as 8 ka (Figures 2A), whereas other cores on the San Onofre slope have older turbidites emplaced after 10 ka (Figure 8).
Conversely, steep gradients in the lower slope facilitate faster turbidity currents that potentially caused bypass, thinning sediment cover, and older turbidite emplacement. In Slice 3, a small NE-SW trending anticline separating the SON and SOS canyons appears to have no Pink or Blue unit sediment cover and the SOS channel appears to incise the southwest flank of the anticline (Figures 6C, 7). The only core recovered from a portion of the slope with a steep gradient is GC 22–25, and a lack of turbidites younger than 23.3 ka in this core (Figures 8, 11) may be indicative of either bypass due to steep channel gradient or sediment starvation caused by infilling of the upslope ponded basin.
On the lower slope, deformation on short length scales (< 1 km) may favor hydraulic jumps that produce the mounded bathymetry shown in Figure 3 and also observed in the slope map in Figure 2D. The northern extent of these mounds was imaged by dip Line 11 (Figure 5A) as landward-migrating mounded reflectors (Figure 5A). Note that the landward-migrating mounds are observed just landward of the basin deposits. These mounds are similar to crescentic bedforms located at the channel-lobe transition zone in the adjacent San Mateo Canyon and have been interpreted as cyclic steps (Kostic, 2011; Covault et al., 2014, 2017). Cyclic steps are large-scale, upstream-migrating, wave-like bedforms with wavelengths of 100’s to 1000’s of m (Covault et al., 2017). In the San Mateo Canyon (Covault et al., 2014) and in model simulations (Kostic, 2011), cyclic steps are located at the decrease in gradient at the channel-lobe transition zone (Covault et al., 2017). Cyclic steps that are oriented orthogonal to the canyon, such as the ones observed here, are typically initiated by large turbidity currents (Normark et al., 2002; Covault et al., 2017). Offshore San Onofre, cyclic steps are observed in the lower kilometer of the SON profile (Figure 2A), as the SON channel widens (Figure 2D) and throughout the steep lower slope in the SOS profile (Figures 2B, 3). In a manner similar to the San Mateo Canyon, subsurface folding observed in dip Line 12C (Figure 5B) caused by deformation along the San Mateo Fault Zone (Conrad et al., 2018) may create rugose bathymetry that causes turbidity currents to undergo hydraulic jumps necessary for the formation of cyclic steps (e.g., Ryan et al., 2009; Covault et al., 2017). The increased bathymetric rugosity caused by deformation and cyclic steps may play an important role in deposition along submarine channels, as has been documented in Brazil (Gamboa and Alves, 2015; Qin et al., 2016).
Implications for Paleoseismic Studies
When autogenic processes such as flow filtering are complicated by allogenic elements such as gradient, ponded basins, and wide shelves, the record of turbidite emplacement becomes increasingly difficult to disentangle. As such, paleoseismology studies that rely on turbidite emplacement records (e.g., Goldfinger et al., 2003, 2007) should be approached with caution. The most conclusive results of this study confirm findings of regional scales from Covault et al. (2007, 2010) and Normark et al. (2009) and the effects of local ponded basins sensu Prather et al. (1998) and Damuth and Olson (2015). The wide shelf offshore San Onofre likely prevents terrigenous supply to the deep sea during the post-glacial transgression and highstand, whereas the narrow shelf offshore Dana Point remains connected to sediment sources and has allowed for the recent emplacement of turbidites within the past 1000 years. On scales finer than 1 km, the dynamics of tectonic deformation and gradient can explain variances in depositional timing from individual cores.
Despite recent advances in linking modern flow processes to their deposits (e.g., Xu et al., 2010; Symons et al., 2017; Maier et al., 2019), we still do not completely understand down-canyon variability in turbidity current flow and the preservation of facies adjacent to canyons. Even though the margin offshore of Dana Point has likely experienced less deformation than offshore San Onofre, the record of turbidite emplacement is difficult to disentangle due to channel gradient and autogenic processes. As such, individual core records from the much more complex margin offshore of San Onofre are affected not only by breaks in channel gradient, but also by tectonically controlled ponded basins. Turbidites offshore this tectonically active margin could theoretically record recent deformation. Nevertheless, turbidites offshore of San Onofre are > 8 ka and fail to record historical earthquakes such as the 1933 Long Beach earthquake. This also supports the hypothesis of Sahakian et al. (2017) that the San Onofre segment has been inactive for much longer (> 10 ka) than other segments the NIRC Fault Zone.
The large uncertainties for radiocarbon dating turbidite deposits in Southern California with 14C makes using turbidites to reconstruct paleoseismicity difficult. Some studies have argued that seismically triggered turbidites can be distinguished by synchronous turbidites emplaced over a wide area (Goldfinger, 2011; Sumner et al., 2013). Many of these studies, such as Goldfinger et al. (2007), aim to use seismoturbidites to constrain earthquake recurrence intervals on the order of 100’s of years; nevertheless, constraining turbidite ages to 100’s of years has much uncertainty along the Southern California margin. Depending on deposit depth, Δ14C could exhibit wide variability and may be influenced by El Niño Southern Oscillation patterns (Roach et al., 2013). Radiocarbon dating lacks the time resolution to constrain whether a fault ruptured over days or even decades (Nelson et al., 1995; Atwater et al., 2014). In Southern California, uncertainties with radiocarbon ages preclude the required accuracy for events spaced by 100’s of years, let alone for a single earthquake event. Sumner et al. (2013) suggested that the most reliable records of seismoturbidites were recovered within a few years of a major earthquake event and could be dated using multiple methods, such as 14C and 210Pb.
A disconnect persists between the ages of the cores, the recovered length of the cores, and the resolution of the Sparker 2D and 3D profiles. Despite advances in coring technology, piston cores and gravity cores are still not able to recover cores long enough to resolve sediment packages older than the Pink Unit or sediment offset by faulting. Without deeper cores, it is difficult to constrain margin evolution on the timescales imaged in the seismic reflection data.
Conclusion
This study draws comparisons between small end-member canyons within the ICB. Dana Point Canyon can be considered a shore-proximal canyon with minimal tectonic deformation on the continental slope. As evidenced from dated turbidite deposits, this canyon has remained active during the most recent sea-level lowstand, transgression, and highstand. In contrast, the San Onofre North and South canyons are separated from the coast by a wide ∼10 km shelf that is characterized by extensive deformation. Shelf widening offshore of San Onofre is caused by a left step along the right-lateral Newport Inglewood/Rose Canyon Fault (Maloney et al., 2016; Sahakian et al., 2017). This broad feature inhibits sand supply to the SON and SOS canyons after 8 ka and these canyons are predominantly active during MIS 2. Over lateral distances < 1 km, variability in turbidite emplacement timing can be attributed to ponded basins, small anticlines that promote bypass, and increases in gradient. These basins were likely formed by cross-cutting faults in the San Mateo Fault Zone. Gradient and autogenic processes of turbidity flows may play an important role controlling the grain size of turbidites. Thus, allogenic processes acting on a range of scales muddies interpretations of the turbidite record as paleoseismic indicators.
Data Availability Statement
Multi-channel seismic data are published by Driscoll et al. (2013) and are available online at doi: 10.1594/IEDA/500041. The datasets generated for this study are available on request to the corresponding author.
Author Contributions
EW wrote the manuscript, made figures, and analyzed data. JH processed 2D and 3D seismic data and generated seismic profiles for figures. JH also was Co-Chief scientist on the cruise that acquired sediment cores and contributed scientific insight into the manuscript. ND was the PI on the seismic and coring cruises and provided guidance for the figures and manuscript.
Funding
This project was funded by the California Public Utilities Commission through Southern California Edison. Funding for six radiocarbon ages was provided by the Scripps Institution of Oceanography Department Graduate Student Excellence Research Award. The two reviewers provided helpful insight that improved this manuscript.
Conflict of Interest
The authors declare that the research was conducted in the absence of any commercial or financial relationships that could be construed as a potential conflict of interest.
Acknowledgments
Many thanks to the crew of the R/V Thompson and core technicians at Oregon State University for assisting with the collection of these cores, the crew of the R/V New Horizon and R/V Melville for assisting with the acquisition of seismic profiles and swath bathymetry, Geotrace Technologies and NCS Subsea Inc., for processing seismic data, and Alex Hangsterfer at Scripps for aiding with core curation. Leanne Hirsch, Mackenzie Roberts, and Lana Graves processed the cores and sampled benthic and planktonic foraminifera for radiocarbon age dating.
Supplementary Material
The Supplementary Material for this article can be found online at: https://www.frontiersin.org/articles/10.3389/feart.2020.00051/full#supplementary-material
FIGURE S1 | Age-depth models of all cores. Plotted are the median age, the 95% confidence interval, and the probability density function of the calibrated age. Sand layers are shown in horizontal gray bars.
FIGURE S2 | Sparker seismic dip profiles offshore of San Onofre. Profiles are organized with the northernmost profile at the top and southernmost profile at the bottom. Locations of lines are shown in Figure 1. For interpreted seismic profiles, see Figure 5.
FIGURE S3 | Strike slices along the San Onofre margin. The shallowest slice is at the top and the deepest slice is at the bottom. Locations of lines are shown in Figure 1. For interpreted seismic profiles, see Figure 6.
References
Allen, P. A. (2008). Time scales of tectonic landscapes and their sediment routing systems. Geol. Soc. Lond. Spec. Publ. 296, 7–28. doi: 10.1144/sp296.2
Atwater, B. F., Carson, B., Griggs, G. B., Johnson, H. P., and Salmi, M. S. (2014). Rethinking turbidite paleoseismology along the Cascadia subduction zone. Geology 42, 827–830. doi: 10.1130/g35902.1
Atwater, T., and Stock, J. (1998). Pacific-North America plate tectonics of the Neogene southwestern United States: an update. Int. Geol. Rev. 40, 375–402. doi: 10.1080/00206819809465216
Blaauw, M., and Christen, J. A. (2011). Flexible paleoclimate age-depth models using an autoregressive gamma process. Bayesian Anal. 6, 457–474. doi: 10.1214/11-ba618
Blum, M., Martin, J., Milliken, K., and Garvin, M. (2013). Paleovalley systems: insights from Quaternary analogs and experiments. Earth Sci. Rev. 116, 128–169. doi: 10.1016/j.earscirev.2012.09.003
Bohannon, R. G., and Geist, E. (1998). Upper crustal structure and Neogene tectonic development of the California continental borderland. Geol. Soc. Am. Bull. 110, 779–800. doi: 10.1130/0016-7606(1998)110<0779:ucsant>2.3.co;2
Brothers, D. S., Conrad, J. E., Maier, K. L., Paull, C. K., McGann, M., and Caress, D. W. (2015). The Palos Verdes fault offshore southern California: late Pleistocene to present tectonic geomorphology, seascape evolution, and slip rate estimate based on AUV and ROV surveys. J. Geophys. Res. Solid Earth 120, 4734–4758. doi: 10.1002/2015jb011938
Christie-Blick, N., and Driscoll, N. W. (1995). Sequence stratigraphy. Annu. Rev. Earth and Planet. Sci. 23, 451–478.
Conrad, J. E., Brothers, D. S., Maier, K. L., Ryan, H. F., Dartnell, P., et al. (2018). Right-Lateral Fault Motion Along the Slope-Basin Transition, Gulf of Santa Catalina, Southern California. From the Mountains to the Abyss: The California Borderland as an Archive of Southern California Geologic Evolution, Special Publication, Vol. 110. Broken Arrow, OK: Society for Sedimentary Geology, California, 110–117.
Covault, J. A., and Graham, S. A. (2010). Submarine fans at all sea-level stands: tectono-morphologic and climatic controls on terrigenous sediment delivery to the deep sea. Geology 38, 939–942. doi: 10.1130/g31081.1
Covault, J. A., Kostic, S., Paull, C. K., Ryan, H. F., and Fildani, A. (2014). Submarine channel initiation, filling and maintenance from sea−floor geomorphology and morphodynamic modelling of cyclic steps. Sedimentology 61, 1031–1054. doi: 10.1111/sed.12084
Covault, J. A., Kostic, S., Paull, C. K., Sylvester, Z., and Fildani, A. (2017). Cyclic steps and related supercritical bedforms: building blocks of deep-water depositional systems, western North America. Mar. Geol. 393, 4–20. doi: 10.1016/j.margeo.2016.12.009
Covault, J. A., Normark, W. R., Romans, B. W., and Graham, S. A. (2007). Highstand fans in the California borderland: the overlooked deep-water depositional systems. Geology 35, 783–786.
Covault, J. A., and Romans, B. W. (2009). Growth patterns of deep-sea fans revisited: turbidite-system morphology in confined basins, examples from the California Borderland. Mar. Geol. 265, 51–66. doi: 10.1016/j.margeo.2009.06.016
Covault, J. A., Romans, B. W., Fildani, A., McGann, M., and Graham, S. A. (2010). Rapid climatic signal propagation from source to sink in a southern California sediment-routing system. J. Geol. 118, 247–259. doi: 10.1086/651539
Covault, J. A., Romans, B. W., Graham, S. A., Fildani, A., and Hilley, G. E. (2011). Terrestrial source to deep-sea sink sediment budgets at high and low sea levels: insights from tectonically active Southern California. Geology 39, 619–622. doi: 10.1130/g31801.1
Covault, J. A., Shelef, E., Traer, M., Hubbard, S. M., Romans, B. W., and Fildani, A. (2012). Deep-water channel run-out length: insights from seafloor geomorphology. J. Sediment. Res. 82, 21–36. doi: 10.2110/jsr.2012.2
Crouch, J. (1979). Neogene tectonic evolution of the western Transverse Ranges and the California Continental Borderland. Geol. Soc. Am. Bull. 90, 338–345.
Crouch, J. K., and Suppe, J. (1993). Late Cenozoic tectonic evolution of the Los Angeles basin and inner California borderland: a model for core complex-like crustal extension. Geol. Soc. Am. Bull. 105, 1415–1434. doi: 10.1130/0016-7606(1993)105<1415:lcteot>2.3.co;2
Damuth, J. E. (1977). Late Quaternary sedimentation in the western Equatorial Atlantic. Geol. Soc. Am. Bull. 88, 695–710.
Damuth, J. E. (1994). Neogene gravity tectonics and depositional processes on the deep Niger Delta continental margin. Mar. Petrol. Geol. 11, 320–346. doi: 10.1016/0264-8172(94)90053-1
Damuth, J. E., and Olson, H. C. (2015). Latest Quaternary sedimentation in the northern Gulf of Mexico intraslope basin province: I. Sediment facies and depositional processes. Geosphere 11, 1689–1718. doi: 10.1130/ges01090.1
Dartnell, P., Driscoll, N. W., Brothers, D., Conrad, J. E., Kluesner, J., and Kent, G. M. (2015). Colored Shaded-Relief Bathymetry, Acoustic Backscatter, and Selected Perspective Views of the Inner Continental Borderland, Southern California, U.S. Geological Survey Scientific Investigations Map 3324, 3 sheets, Southern California, U.S. Available online at: https://dx.doi.org/10.3133/sim3324 (accessed December 01, 2016).
Driscoll, N., Kent, G., and Bormann, J. (2013). Processed Multi-Channel Seismic Data (Stacks and Migrations) Offshore California Acquired During the R/V New Horizon Expedition NH1320 (2013) Using a Sparker Source. Palisades, NY: Academic Seismic Portal at UTIG, Marine Geoscience Data System, doi: 10.1594/IEDA/500041
Ducassou, E., Migeon, S., Mulder, T., Murat, A., Capotondi, L., Bernasconi, S. M., et al. (2009). Evolution of the Nile deep−sea turbidite system during the Late Quaternary: influence of climate change on fan sedimentation. Sedimentology 56, 2061–2090. doi: 10.1111/j.1365-3091.2009.01070.x
Ehlig, P. (1977). Geologic Report on the Area Adjacent to the San Onofre Nuclear Generating Station, Northwestern San Diego County, California. Neotectonics and Coastal Instability: Orange and Northern San Diego Counties, California. Long Beach, CA: AAPG Pacific Section, 113–132.
Fildani, A. (2017). Submarine canyons: a brief review looking forward. Geology 45, 383–384. doi: 10.1130/focus042017.1
Freeman, S. T., Heath, E. G., Guptill, P. D., and Waggoner, J. T. (1992). “Seismic hazard assessment, newport-inglewood fault zone,” in Engineering Geology Practice in Southern California, Vol. 4, eds B. W. Pipkin and R. J. Proctor (Reston, VA: U.S. Geological Survey), 211–231.
Gamberi, F., Rovere, M., Marani, M. P., and Dykstra, M. (2015). Modern submarine canyon feeder-system and deep-sea fan growth in a tectonically active margin (northern Sicily). Geosphere 11, 307–319. doi: 10.1130/ges01030.1
Gamboa, D., and Alves, T. M. (2015). Spatial and dimensional relationships of submarine slope architectural elements: a seismic-scale analysis from the Espírito Santo Basin (SE Brazil). Mar. Petrol. Geol. 64, 43–57. doi: 10.1016/j.marpetgeo.2015.02.035
Goldfinger, C. (2011). Submarine paleoseismology based on turbidite records. Annu. Rev. Mar. Sci. 3, 35–66. doi: 10.1146/annurev-marine-120709-142852
Goldfinger, C., Morey, A. E., Nelson, C. H., Gutiérrez-Pastor, J., Johnson, J. E., Karabanov, E., et al. (2007). Rupture lengths and temporal history of significant earthquakes on the offshore and north coast segments of the Northern San Andreas fault based on turbidite stratigraphy. Earth Planet. Sci. Lett. 254, 9–27. doi: 10.1016/j.epsl.2006.11.017
Goldfinger, C., Nelson, C. H., Johnson, J. E., and Party, S. S. (2003). Holocene earthquake records from the Cascadia subduction zone and northern San Andreas fault based on precise dating of offshore turbidites. Annu. Rev. Earth Planet. Sci. 31, 555–577.
Gràcià, E., Vizcaino, A., Estucia, C., Asiolic, A., Ro-dés, Á, Pallàs, R., et al. (2010). Holocene earth- quake record offshore Portugal (SW Iberia): testing turbidite paleoseismology in a slow-con- vergence margin. Quat. Sci. Rev. 29, 1156–1172. doi: 10.1016/j.quascirev.2010.01.010
Kennedy, M. P., and Tan, S. S. (2007). Geologic Map of the Oceanside 30’x60’Quadrangle, California. Department of Conservation, California Geological Survey. Reston, VA: U.S. Geological Survey.
Kienast, S. S., and McKay, J. L. (2001). Sea surface temperatures in the subarctic northeast Pacific reflect millennial−scale climate oscillations during the last 16 kyrs. Geophys. Res. Lett. 28, 1563–1566. doi: 10.1029/2000gl012543
Klotsko, S., Driscoll, N., Kent, G., and Brothers, D. (2015). Continental shelf morphology and stratigraphy offshore San Onofre, California: the interplay between rates of eustatic change and sediment supply. Mar. Geol. 369, 116–126. doi: 10.1016/j.margeo.2015.08.003
Kostic, S. (2011). Modeling of submarine cyclic steps: controls on their formation, migration, and architecture. Geosphere 7, 294–304. doi: 10.1130/ges00601.1
Kovanen, D. J., and Easterbrook, D. J. (2002). Paleodeviations of radiocarbon marine reservoir values for the northeast Pacific. Geology 30, 243–246.
Le Dantec, N., Hogarth, L. J., Driscoll, N. W., Babcock, J. M., Barnhardt, W. A., and Schwab, W. C. (2010). Tectonic controls on nearshore sediment accumulation and submarine canyon morphology offshore La Jolla, Southern California. Mar. Geol. 268, 115–128. doi: 10.1016/j.margeo.2009.10.026
Legg, M. R. (1991). “Developments in understanding the tectonic evolution of the California Continental Borderland,” in Society of Economic Paleontologists and Mineralogists Special Publication, Vol. 46, ed. R. H. Osbourne (Broken Arrow, OK: Society for Sedimentary Geology), 291–312.
Lonsdale, P. (1991). Structural Patterns of the Pacific Floor Offshore of Peninsular California, Chapter 7: Part III. Regional Geophysics and Geology, AAPG Memoir 47. Tulsa, OK: American Association of Petroleum Geologists, 87–125.
Magistrale, H. (1993). Seismicity of the Rose Canyon fault zone near San Diego, California. Bull. Seismol. Soc. Am. 83, 1971–1978.
Maier, K. L., Brothers, D. S., Paull, C. K., McGann, M., Caress, D. W., and Conrada, J. E. (2017). Records of continental slope sediment flow morphodynamic responses to gradient and active faulting from integrated AUV and ROV data, offshore Palos Verdes, southern California Borderland. Mar. Geol. 393, 47–66. doi: 10.1016/j.margeo.2016.10.001
Maier, K. L., Gales, J., Paull, C. K., Rosenberger, K., Talling, P. J., Simmons, S. M., et al. (2019). Linking direct measurements of turbidity currents to submarine canyon-floor deposits. Front. Earth Sci. 7:144. doi: 10.3389/feart.2019.00144
Maloney, J. M., Driscoll, N., Kent, G., Duke, S., Freeman, T., Bormann, J., et al. (2016). Segmentation and step−overs along strike−slip fault systems in the inner California borderlands: implications for fault architecture and basin formation. Appl. Geol. Calif. Environ. Eng. Geol. 26, 655–677.
Mayall, M., Jones, E., and Casey, M. (2006). Turbidite channel reservoirs—key elements in facies prediction and effective development. Mar. Pet. Geol. 23, 821–841. doi: 10.1016/j.marpetgeo.2006.08.001
Mayall, M., and Stewart, I. (2000). “The architecture of turbidite slope channels,” in Proceedings of the 20th Annual Research Conference, Deep-Water Reservoirs of the World: SEPM, Gulf Coast Section, (McLean, VA: GeoScienceWorld), 586.
McHargue, T., Pyrcz, M. J., Sullivan, M. D., Clark, J., Fildani, A., Romans, B., et al. (2011). Architecture of turbidite channel systems on the continental slope: patterns and predictions. Mar. Pet. Geol. 28, 728–743. doi: 10.1016/j.marpetgeo.2010.07.008
Meade, B. J., and Hager, B. H. (2005). Block models of crustal motion in southern California constrained by GPS measurements. J. Geophys. Res. Solid Earth 110, 1–19.
Milliman, J. D., Summerhayes, C. P., and Barretto, H. T. (1975). Quaternary sedimentation on the Amazon continental margin: a model. Geol. Soc. Am. Bull. 86, 610–614.
Mitchum, R. Jr., Vail, P., and Thompson, S. III (1977). “Seismic stratigraphy and global changes of sea level: part 2. The depositional sequence as a basic unit for stratigraphic analysis: section 2. Application of seismic reflection configuration to stratigraphic interpretation,” in Seismic Stratigraphy: Applications to Hydrocarbon Exploration. Memoir 26, ed. C. E. Payton (Tulsa, OK: American Association of Petroleum Geologists), 53–62.
Mitchum, R. M. Jr. (1985). “Seismic stratigraphic expression of submarine fans,” in Seismic Stratigraphy II: American Association of Petroleum Geologists Memoir, Vol. 39, eds O. R. Berg and D. G. Wolverton (New York, NY: Springer), 117–138.
Mix, A. C., Lund, D. C., Pisias, N. G., Bodén, P., Bornmalm, L., Lyle, M., et al. (1999). “Rapid climate oscillations in the northeast Pacific during the last deglaciation reflect Northern and Southern Hemisphere sources,” in Mechanisms for Global Climate Change at Millennial Time Scales. Geophysical Monograph Series 112, eds P. Clark, R. S. Webb, and L. D. Keigwin (Washington, DC: American Geophysical Union), 127–148. doi: 10.1029/gm112p0127
Muhs, D. R., Simmons, K. R., Schumann, R. R., Groves, L. T., Mitrovica, J. X., and Laurel, D. (2012). Sea-level history during the last interglacial complex on San Nicolas Island, California: implications for glacial isostatic adjustment processes, paleozoogeography and tectonics. Quat. Sci. Rev. 37, 1–25. doi: 10.1016/j.quascirev.2012.01.010
Nakajima, T., and Kanai, Y. (2000). Sedimentary features of seismoturbidites triggered by the 1983 and older historical earthquakes in the eastern margin of the Japan Sea. Sediment. Geol. 135, 1–19. doi: 10.1016/s0037-0738(00)00059-2
Nelson, A. R., Atwater, B. F., Bobrowsky, P. T., Bradley, L.-A., Clague, J. J., Carver, G. A., et al. (1995). Radiocarbon evidence for extensive plate-boundary rupture about 300 years ago at the Cascadia subduction zone. Nature 378:371. doi: 10.1038/378371a0
Nicholson, C., Sorlien, C. C., Atwater, T., Crowell, J. C., and Luyendyk, B. P. (1994). Microplate capture, rotation of the western Transverse Ranges, and initiation of the San Andreas transform as a low-angle fault system. Geology 22, 491–495.
Normark, W. R., and Damuth, J. E., and Leg 155 Sedimentology Group. (1997). “Sedimentary facies and associated depositional elements of the Amazon Fan,” in Proceedings of the Ocean Drilling Program, Scientific Results, Vol. 155, eds R. D. Flood, D. J. W. Piper, A. Klaus, and L. C. Peterson (College Station, TX: Ocean Drilling Program), 611–652.
Normark, W. R., Meyer, A. W., Cremer, M., Droz, L., Pickering, K. T., Stelting, C. E., et al. (1986). “Summary of drilling results for the Mississippi Fan and considerations for application to other turbidite systems,” in Initial Reports of the Deep Sea Drilling Program 96, eds A. H. Bouma, J. M. Coleman, and A. W. Meyer (Washington DC: U.S. Government Printing Office), 425–436.
Normark, W. R., Piper, D. J., Posamentier, H., Pirmez, C., and Migeon, S. (2002). Variability in form and growth of sediment waves on turbidite channel levees. Mar. Geol. 192, 23–58. doi: 10.1016/s0025-3227(02)00548-0
Normark, W. R., Piper, D. J., Romans, B. W., Covault, J. A., Dartnell, P., Sliter, R. W., et al. (2009). Submarine canyon and fan systems of the California Continental Borderland. Earth Science in the Urban Ocean: The Southern California Continental Borderland: Geological Society of America, Special Paper 454. McLean, VA: GeoScienceWorld, 141–168.
Paull, C., Ussler, W., Greene, H., Keaten, R., Mitts, P., and Barry, J. (2002). Caught in the act: the 20 December 2001 gravity flow event in Monterey Canyon. Geo Mar. Lett. 22, 227–232. doi: 10.1007/s00367-003-0117-2
Pettingill, H. S., and Weimer, P. (2002). Worlwide deepwater exploration and production: past, present, and future. Lead. Edge 21, 371–376. doi: 10.1190/1.1471600
Piper, D. J., Kontopoulos, N., Anagnostou, C., Chronis, G., and Panagos, A. (1990). Modern fan deltas in the western Gulf of Corinth, Greece. Geo Mar. Lett. 10, 5–12. doi: 10.1007/bf02431016
Posamentier, H., Erskine, R., and Mitchum, R. (1991). “Models for submarine-fan deposition within a sequence-stratigraphic framework,” in Seismic Facies and Sedimentary Processes of Submarine Fans and Turbidite Systems, eds P. Weimer and M. H. Link (New York, NY: Springer), 127–136. doi: 10.1007/978-1-4684-8276-8_6
Prather, B. (2000). Calibration and visualization of depositional process models for above-grade slopes: a case study from the Gulf of Mexico. Mar. Pet. Geol. 17, 619–638. doi: 10.1016/s0264-8172(00)00015-5
Prather, B. E., Booth, J. R., Steffens, G. S., and Craig, P. A. (1998). Classification, lithologic calibration and stratigraphic succession of seismic facies from intraslope basins, deep water Gulf of Mexico, USA. AAPG Bull. 82, 701–728.
Prins, M. A., and Postma, G. (2000). Effects of climate, sea level, and tectonics unraveled for last deglaciation turbidite records of the Arabian Sea. Geology 28, 375–378. doi: 10.1130/0091-7613(2000)028<0375:eocsla>2.3.co;2
Qin, Y., Alves, T. M., Constantine, J., and Gamboa, D. (2016). Quantitative seismic geomorphology of a submarine channel system in SE Brazil (Espírito Santo Basin): scale comparison with other submarine channel systems. Mar. Petrol. Geol. 78, 455–473. doi: 10.1016/j.marpetgeo.2016.09.024
Qin, Y., Alves, T. M., Constantine, J. A., Gamboa, D., and Wu, S. (2019). Effect of channel tributaries on the evolution of submarine channel confluences (Espírito Santo Basin, SE Brazil). Bulletin 132, 263–272. doi: 10.1130/b35082.1
Roach, L. D., Charles, C. D., Field, D. B., and Guilderson, T. P. (2013). Foraminiferal radiocarbon record of northeast Pacific decadal subsurface variability. J. Geophys. Res. Oceans 118, 4317–4333. doi: 10.1002/jgrc.20274
Romans, B. W., Castelltort, S., Covault, J. A., Fildani, A., and Walsh, J. (2016). Environmental signal propagation in sedimentary systems across timescales. Earth Sci. Rev. 153, 7–29. doi: 10.1016/j.earscirev.2015.07.012
Ryan, H. F., Conrad, J. E., Paull, C., and McGann, M. (2012). Slip rate on the San Diego trough fault zone, inner California Borderland, and the 1986 Oceanside earthquake swarm revisited. Bull. Seismol. Soc. Am. 102, 2300–2312. doi: 10.1785/0120110317
Ryan, H. F., Legg, M. R., Conrad, J. E., Sliter, R. W., Lee, H., et al. (2009). Recent Faulting in the Gulf of Santa Catalina: San Diego to Dana Point. Earth Science in the Urban Ocean: The Southern California Continental Borderland: Geological Society of America Special Paper 454. McLean, VA: GeoScienceWorld, 291–315.
Sahakian, V., Bormann, J., Driscoll, N., Harding, A., Kent, G., and Wesnousky, S. (2017). Seismic constraints on the architecture of the Newport−Inglewood/Rose Canyon fault: Implications for the length and magnitude of future earthquake ruptures. J. Geophys. Res. Solid Earth 122, 2085–2105.
Southon, J. R., Nelson, D. E., and Vogel, J. S. (1990). A record of past ocean−atmosphere radiocarbon differences from the northeast Pacific. Paleoceanography 5, 197–206. doi: 10.1029/pa005i002p00197
Stow, D. A., and Mayall, M. (2000). Deep-water sedimentary systems: new models for the 21st century. Mar. Pet. Geol. 17, 125–135. doi: 10.1016/s0264-8172(99)00064-1
Stow, D. A. V., and Piper, D. J. W. (1984). Deep-water fine-grained sediments; history, methodology and terminology. Geol. Soc. Spec. Publ. 15, 611–646.
Stuiver, M., and Reimer, P. J. (1993). Extended 14 C data base and revised CALIB 3.0 14 C age calibration program. Radiocarbon 35, 215–230. doi: 10.1017/s0033822200013904
Sumner, E. J., Siti, M. I., McNeill, L. C., Talling, P. J., Henstock, T. J., Wynn, R. B., et al. (2013). Can turbidites be used to reconstruct a paleoearthquake record for the central Sumatran margin? Geology 41, 763–766. doi: 10.1130/g34298.1
Sweet, M. L., and Blum, M. D. (2016). Connections between fluvial to shallow marine environments and submarine canyons: implications for sediment transfer to deep water. J. Sediment. Res. 86, 1147–1162. doi: 10.2110/jsr.2016.64
Symons, W. O., Sumner, E. J., Paull, C. K., Cartigny, M. J., Xu, J., Maier, K. L., et al. (2017). A new model for turbidity current behavior based on integration of flow monitoring and precision coring in a submarine canyon. Geology 45, 367–370. doi: 10.1130/g38764.1
Talling, P. J., Allin, J., Armitage, D. A., Arnott, R. W., Cartigny, M. J., Clare, M. A., et al. (2015). Key future directions for research on turbidity currents and their deposits. J. Sediment. Res. 85, 153–169.
Talling, P. J., Masson, D. G., Sumner, E. J., and Malgesini, G. (2012). Subaqueous sediment density flows: Depositional processes and deposit types. Sedimentology 59, 1937–2003. doi: 10.1111/j.1365-3091.2012.01353.x
Talling, P. J., Paull, C. K., and Piper, D. J. (2013). How are subaqueous sediment density flows triggered, what is their internal structure and how does it evolve? Direct observations from monitoring of active flows. Earth Sci. Rev. 125, 244–287. doi: 10.1016/j.earscirev.2013.07.005
ten Brink, U. S., Zhang, J., Brocher, T. M., Okaya, D. A., Klitgord, K. D., and Fuis, G. S. (2000). Geophysical evidence for the evolution of the California Inner Continental Borderland as a metamorphic core complex. J. Geophys. Res. Solid Earth 105, 5835–5857. doi: 10.1029/1999jb900318
Vail, P. R., Mitchum, Jr, and Thompson, S. III (1977). “Seismic stratigraphy and global changes of sea level: Part 3. Relative changes of sea level from Coastal Onlap,” in Seismic Stratigraphy: Applications to Hydrocarbon Exploration: AAPG Memoir 26, ed. C. E. Payton (Tulsa, OK: American Association of Petroleum Geologists), 63–81.
Walsh, J. P., and Nittrouer, C. A. (2003). Contrasting styles of off-shelf sediment accumulation in New Guinea. Mar. Geol. 196, 105–125. doi: 10.1016/S0025-3227(03)00069-0
Warrick, J. A., and Farnsworth, K. L. (2009). Sources of sediment to the coastal waters of the Southern California Bight. Geol. Soc. Am. Special Pap. 454, 39–52.
Keywords: seismic stratigraphy, sequence stratigraphy, California (USA), submarine canyon, continental slope
Citation: Wei EA, Holmes JJ and Driscoll NW (2020) Strike-Slip Transpressional Uplift Offshore San Onofre, California Inhibits Sediment Delivery to the Deep Sea. Front. Earth Sci. 8:51. doi: 10.3389/feart.2020.00051
Received: 02 September 2019; Accepted: 13 February 2020;
Published: 03 March 2020.
Edited by:
Julie Fosdick, University of Connecticut, United StatesReviewed by:
Tiago M. Alves, Cardiff University, United KingdomÁngel Puga-Bernabéu, University of Granada, Spain
Copyright © 2020 Wei, Holmes and Driscoll. This is an open-access article distributed under the terms of the Creative Commons Attribution License (CC BY). The use, distribution or reproduction in other forums is permitted, provided the original author(s) and the copyright owner(s) are credited and that the original publication in this journal is cited, in accordance with accepted academic practice. No use, distribution or reproduction is permitted which does not comply with these terms.
*Correspondence: Emily A. Wei, ZWF3ZWlAdWNzZC5lZHU=