 Chelsi N. Lopez1*
 Marie Robert2
 Moira Galbraith2
 Sarah K. Bercovici3,4,5
 Monica V. Orellana3,4
 Dennis A. Hansell1
- 1Department of Ocean Sciences, Rosenstiel School of Marine and Atmospheric Sciences, University of Miami, Miami, FL, United States
- 2Department of Fisheries and Oceans, Institute of Ocean Sciences, Sidney, BC, Canada
- 3Applied Physics Laboratory, University of Washington, Seattle, WA, United States
- 4Institute for Systems Biology, Seattle, WA, United States
- 5Institute for Chemistry and Biology of the Marine Environment, Carl von Ossietzky University of Oldenburg, Oldenburg, Germany
The interseasonal and interannual variability of total organic carbon (TOC) was assessed in the deep northeastern Pacific Ocean, an area characterized by high primary production and organic matter export. Samples were collected from throughout the deeper water column (>250 m) seasonally in 2017 and 2018 along the Line P transect, as well as one distribution of dissolved organic carbon (DOC) in spring 2018. High heterogeneity was observed in TOC concentrations at depths greater than 1,000 m, both within seasons (concentration differences of ∼2–6 μmol kg–1) and across seasons (∼2–12 μmol kg–1), coinciding with changes in fluorescence in the overlying waters. Such observations suggest that biogenic particles sinking from the upper ocean are seasonally delivering observable TOC to depth. The presence of these particles also appeared to contribute to the DOC pool, as suggested by differences in the TOC and DOC distributions in spring 2018. Seasonal TOC net accumulation and removal rates differed between the years: 0.5 and 2.1 μmol kg–1 day–1 (accumulation) and 0.6 and 2.1 μmol kg–1 day–1 (removal) for 2017 and 2018, respectively. The rate estimates indicated that introduction of organic carbon to the bathypelagic occurred at approximately the same rate as removal post-bloom, demonstrating the efficient removal of seasonally produced organic carbon. High abundances of gelatinous zooplankton in spring 2018, supported by higher abundances of phytoplankton, enhanced the export of organic carbon to the bathypelagic zone during the seasonal bloom, resulting in localized TOC concentrations up to 148 μmol kg–1 in the bathypelagic. These results indicate high variability in bathypelagic TOC concentrations at high latitude, unlike oligotrophic systems.
Introduction
Marine organic matter, a product of ocean primary production, plays a vital role in the sequestration and export of carbon. It is produced in the euphotic layer via primary production by autotrophic organisms with most of it respired near-contemporaneously (Ducklow et al., 2001). However, a fraction of organic material is exported below the euphotic zone and remineralized by heterotrophic organisms back to inorganic forms (i.e., the biological pump). Other residue of the biological pump is sedimented onto the seafloor, or potentially added to the refractory dissolved organic carbon (DOC) pool (Druffel et al., 1992; Ducklow et al., 2001; Jiao et al., 2010). Each of these processes sequesters carbon in the deep ocean, aiding in oceanic uptake of atmospheric carbon dioxide. In today’s changing climate, consideration and understanding of such processes is increasingly important.
Since the longest-running time-series programs with measurements of total organic carbon (TOC) and DOC are located in oligotrophic regions (Hansell and Carlson, 2001), there is a gap in knowledge on the temporal variability of these parameters in waters underlying productive areas, such as the North Pacific. To remedy this, we analyzed TOC distributions in this region on a seasonal time scale. Located within a productive area, Ocean Station Papa (OSP) is a well-studied site (50.0°N and 145.0°W) in the northeastern Pacific that began as an ocean weather station in 1949, operated by the United States Weather Bureau (Tabata et al., 1986; Freeland, 2007). Located ∼1,200 km off the coast of British Columbia, OSP is on the southern edge of the subpolar gyre and within an area with weak currents (Pelland et al., 2016). The monitoring program for OSP underwent many changes over the years (Freeland, 2007), in particular the addition of several regularly occupied hydrographic sampling stations between OSP and the coast, now referred to as “Line P,” that are currently monitored by the Canadian Department of Fisheries and Oceans (DFO) tri-annually. More recently, this area has been the site for many Argo float and Seaglider deployments, as well as a NOAA-monitored mooring, providing robust data that indicate constantly changing hydrological and biologic conditions (Pelland et al., 2016; Bif and Hansell, 2019). These processes near OSP are now being considered further by the NASA-supported EXPORTS research program (Siegel et al., 2016). Our analysis includes the first organic carbon measurements collected as a time-series along Line P, providing contextual information about seasonal and local organic carbon dynamics. Analyses such as this are vital for furthering our understanding of the ocean’s ability to sequester carbon at depth.
Most particulate biogenic matter produced in the upper ocean does not reach great depths (Gardner, 2015), however, periodic fluxes of up to 43% of exported organic material have been observed at depths down to 3,400 m in the northeastern Pacific within only a few days of leaving the euphotic zone (Smith et al., 2018). Past measurements of sinking particles in sediment traps have indicated higher productivity at OSP versus stations further south, as average annual POC fluxes from traps at 1,000 m ranged from 138 to 246 mmol m–2 yr–1 (Honjo et al., 2008). At 31.7°N, 124.6°W, located within an oligotrophic zone in the North Pacific, POC flux was estimated to be 82 mmol m–2 yr–1, much lower than fluxes at OSP. Climatologies of sediment flux at OSP have shown sporadic and seasonally dependent carbon export events, measured by deep-moored sediment traps (Wong et al., 1999; Timothy et al., 2013). In addition to sediment trap data, zooplankton collections and carbon export estimates indicate that a rapid sinking rate (up to 800 m per day) can transport high levels of organic material to the bathypelagic quickly (Robison et al., 2005), a factor that is overlooked in single-season hydrographic observing programs.
Seasonal trends in the bathypelagic may be more prominent than we currently understand based on observations in oligotrophic systems alone, given the differences in particle export. The data presented in this analysis provides insight on the seasonal dynamics and physical processes by which carbon reaches the deeper water column with sinking particles, some of which leaves a signal as DOC. Comparing TOC distributions at depth to upper layer parameters, such as fluorescence, nutrients, and zooplankton abundance provides an advantage in understanding the impact of vertical input of organic carbon via sinking particles, as well as understanding the variability of local organic carbon on a seasonal time-scale.
Materials and Methods
Samples were collected along the Line P transect (Figure 1), occupied tri-annually by the Canadian Department of Fisheries and Oceans (DFO). The cruises departed from Sidney, British Columbia and continued out to Ocean Station Papa (P26/OSP: 50.0°N, 145.0°W), during winter (February), spring (June), and summer (August/September) of 2017 and 2018. Fluorescence data collected continuously during downcasts were provided by DFO while TOC and DOC were measured at the University of Miami. The fluorescence data are reported in mg m–3, though according to DFO data reports the values of fluorescence do not always compare well with bottle chlorophyll data. Distributions of chlorophyll are qualitatively comparable to fluorescence values so we use the latter as a reasonable indicator of chlorophyll distributions. Data employed here are available at https://www.waterproperties.ca/linep/cruises.php. Most stations were occupied during daylight hours.
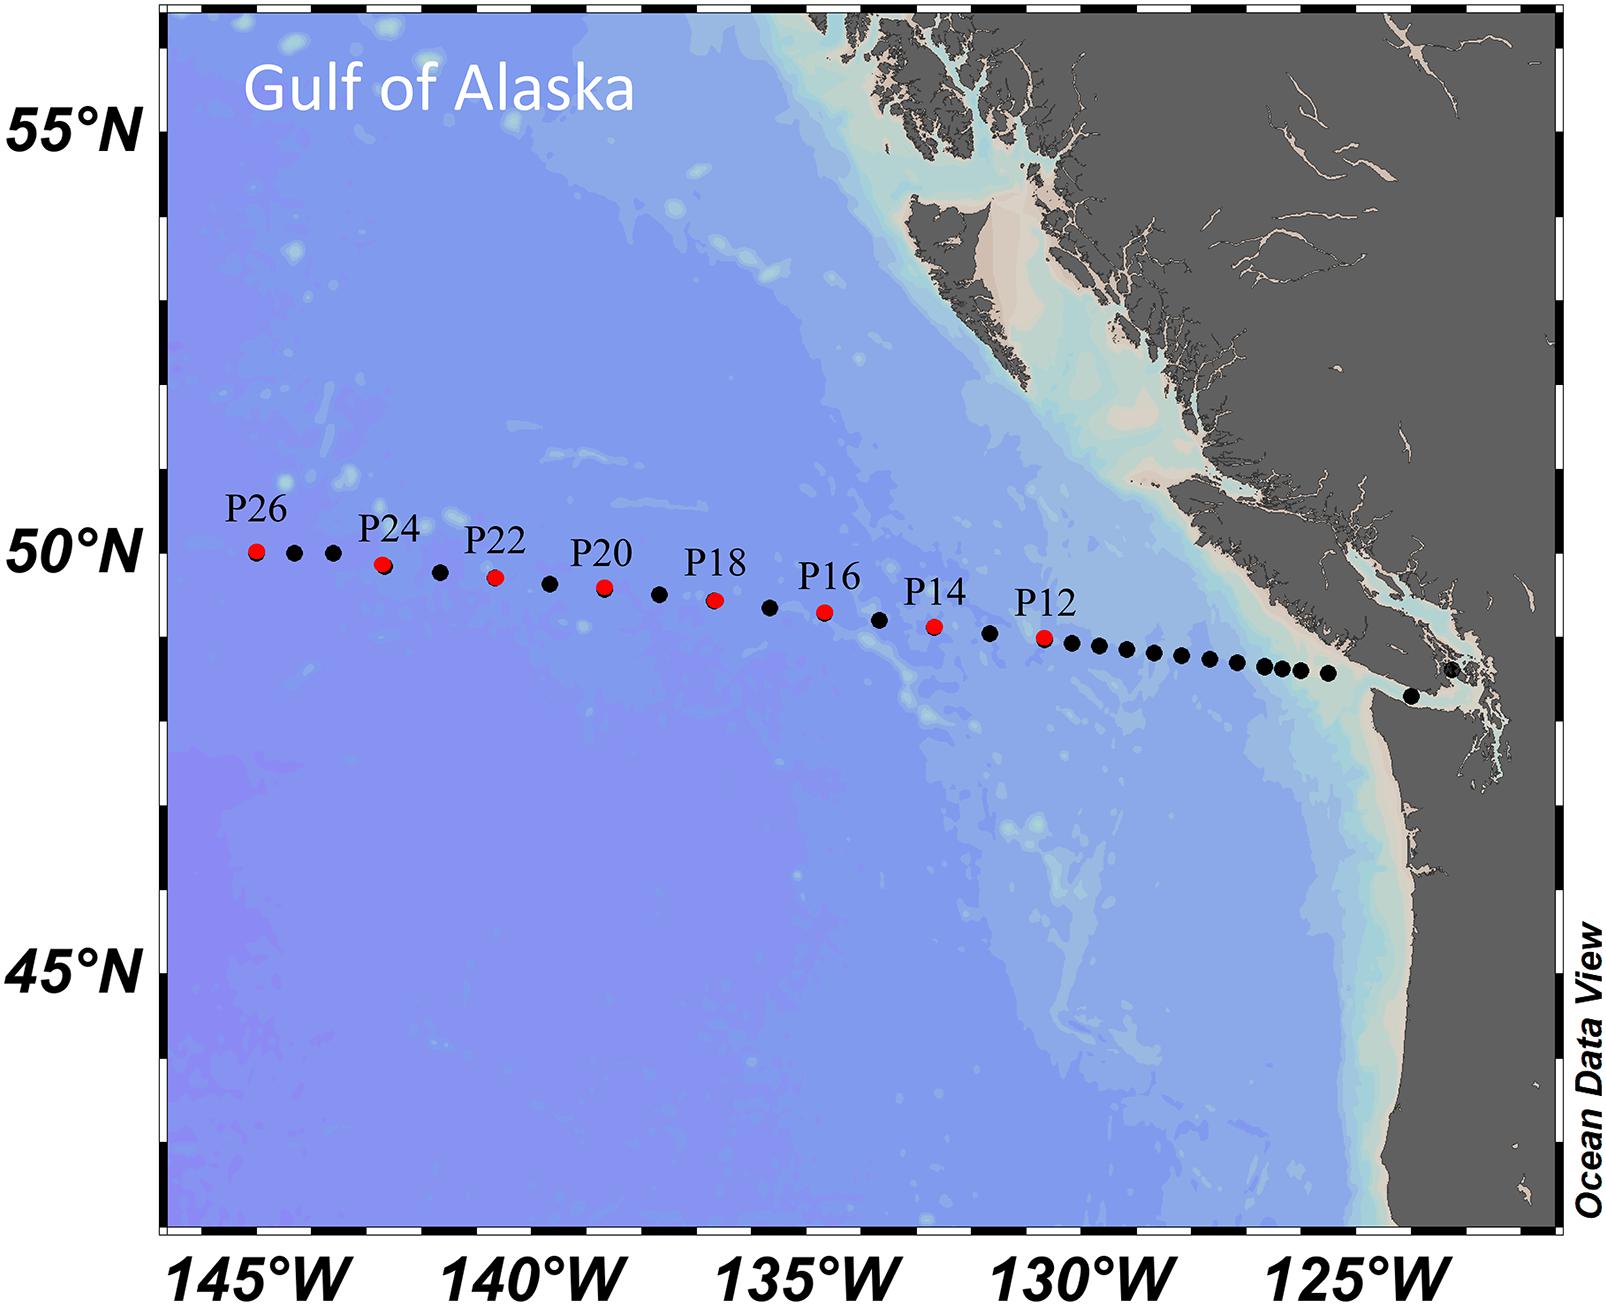
Figure 1. Locations of Line P stations; those considered in this analysis are highlighted in red. This figure was created using Ocean Data View (Schlitzer, 2019).
The section of Line P of interest in this analysis is that of the open ocean. Line P stations considered were P12 to P26 (Figure 1). Salinity at the surface was used to indicate coastal impacts versus open ocean conditions, with oceanic stations holding salinities of ∼32.5 while the coastal stations were seasonally lower. Of the stations evaluated here, Station P12 is located closest to the coast, giving it the most potential for exposure to those influences. However, as the station is ∼100 km west of low salinity surface waters, it is evaluated here as an open ocean station.
Samples for TOC analysis were collected as whole-water directly from the Niskin bottles aboard the ship, placed into 40 mL pre-combusted vials and fixed with 100 μL of 4N HCl. Given our focus on the export of organic matter to the deeper water column, we report TOC concentrations only at depths >250 m. This analysis is restricted to stations away from the continental shelf (i.e., westward of Line P Station 11) to minimize variability due to coastal influences (e.g., fluvial inputs, filaments, shelf resuspension, etc.). Samples collected as DOC were filtered in-line from the Niskin bottles using a pre-combusted GF/F filter (0.7 μm nominal pore size) and then treated similarly to TOC. All samples were analyzed with Shimadzu TOC-L systems as previously described (Dickson et al., 2007). Reference materials from the Hansell Certified Reference Material (CRM) program (Hansell, 2005) were utilized to ensure accuracy. The uncertainty of TOC and DOC measurements is ±1.5 μmol L–1. Concentrations were converted to μmol kg–1 by dividing by potential density, σθ.
Seasonal TOC profiles were modeled using the piece-wise linear least-squares statistical analysis tool in Ocean Data View (Schlitzer, 2019), with a 30-gridpoint output. Data employed were from stations P12 to P26 (Figure 1). TOC concentrations at depths ≥250 m did not exceed 80 μmol kg–1 for all stations and seasons analyzed, except for three data with very high concentrations observed during spring 2018, which were omitted in the model. The difference in TOC and DOC for these omitted stations/depths exceeded 1 standard deviation from the mean.
The calculations for TOC accumulation and removal rate estimates are shown in Equations 1 and 2, respectively.
These are net rates as they do not include variations in concentrations that may have occurred over time frequencies shorter than our occupations.
Zooplankton samples were collected using vertical hauls with 0.56 m diameter bongo nets, fitted with 0.236 mm black mesh. Samples were collected from 250 m to the surface. The bongo net consists of two black cylindrical–conical nets mounted on a central towing frame and weight. Each net has a 0.25 m2 mouth area, a filtering area/mouth area ratio of 11.5, and 0.23 mm aperture black mesh. Volume filtered is measured by a TSK flowmeter mounted in the mouth of one net. Due to time constraints, bongo tows were collected both day and night. However, for many of the taxa considered, diel migration was either weak or was confined to movement within the upper 200 m.
The catch from one net of the bongo pair was preserved immediately in 10% formalin, and returned to shore for analysis. Quantitative subsamples were counted to species level and life stage. Subsample size varies with taxa to give approximately uniform expected abundance estimation error (about 20%) for all of the dominant groups. Flowmeter, net diameter, and tow depth were used to convert abundance per sample to abundance per cubed meter.
Zooplankton were also collected using a Multi Plankton Sampler (MPS) from Hydro-Bios (0.25 m2 mouth area) at several stations along the line, towed 2,500 m to the surface with a speed of ∼1 m s–1. The MPS was equipped with five white nets (250 μm mesh size) that can be opened and closed on command from the ship via conducting cable attachment. The volume of water filtered by the net was measured with Hydro-Bios flowmeters fitted in the mouth of each net. All MPS tows were done during daytime hours to take advantage of any layering of taxa at depth. The only data reported in this analysis from an MPS net, as opposed to a bongo net, was Station P26 in 2018.
Results
We report TOC concentrations in the bathypelagic water column, with focus here on depths from 1,000 m to the seafloor, along with fluorescence within the euphotic zone providing a qualitative measure of chlorophyll (Figures 2, 3). DOC concentrations from spring 2018 are also reported.
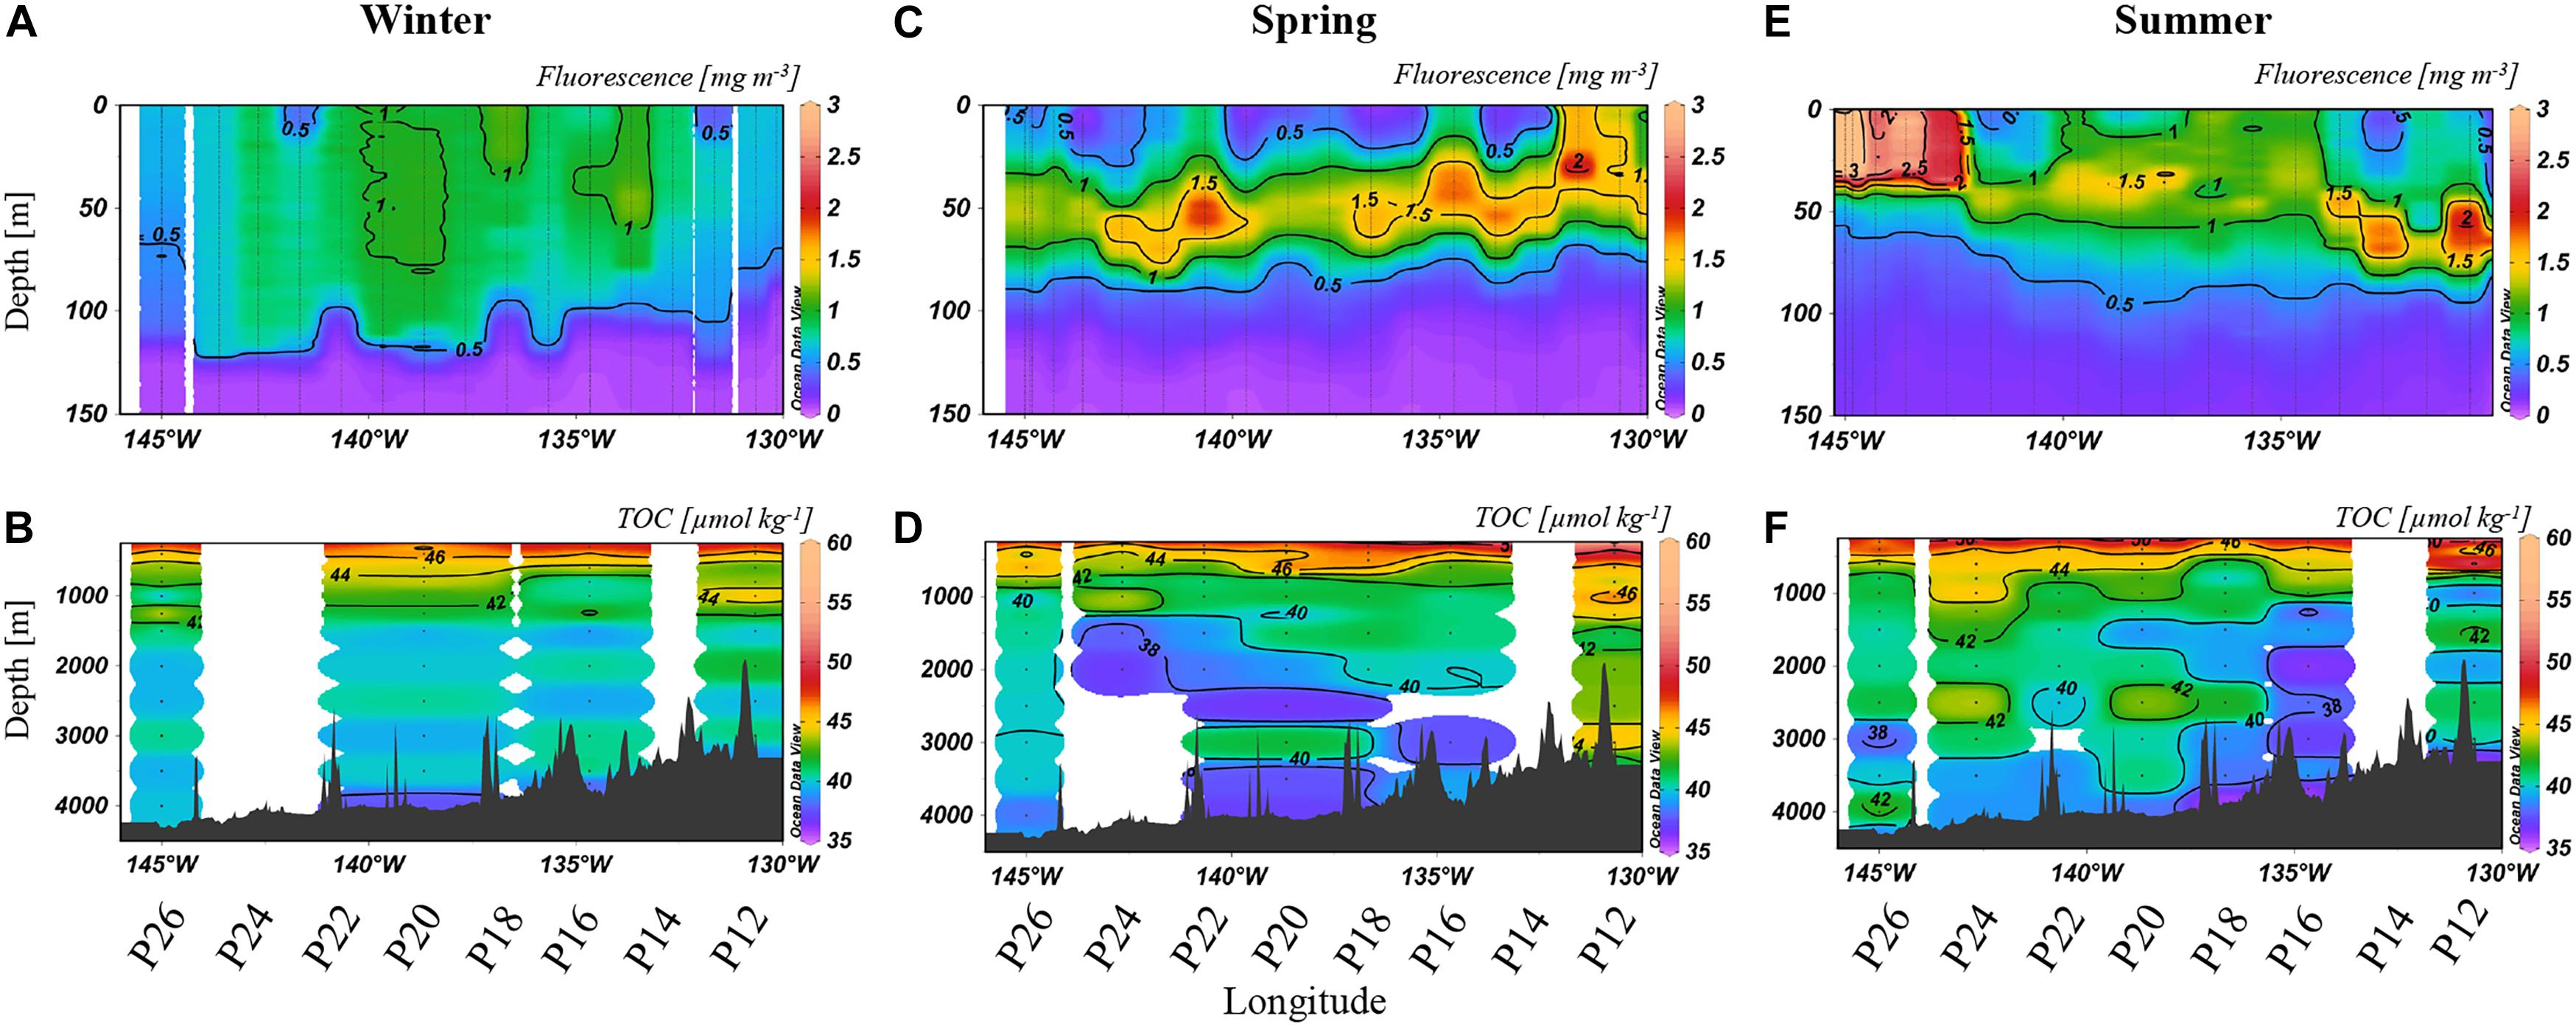
Figure 2. Fluorescence to 150 m (A,C,E) [mg m–3] and TOC [μmol kg–1] at depths >250 m (B,D,F) from 2017. The color scales are non-linear to better visualize small changes in concentrations in the deeper water column. Note that fluorescence was measured at all stations while TOC was determined at selected stations, as labeled below the x-axis.
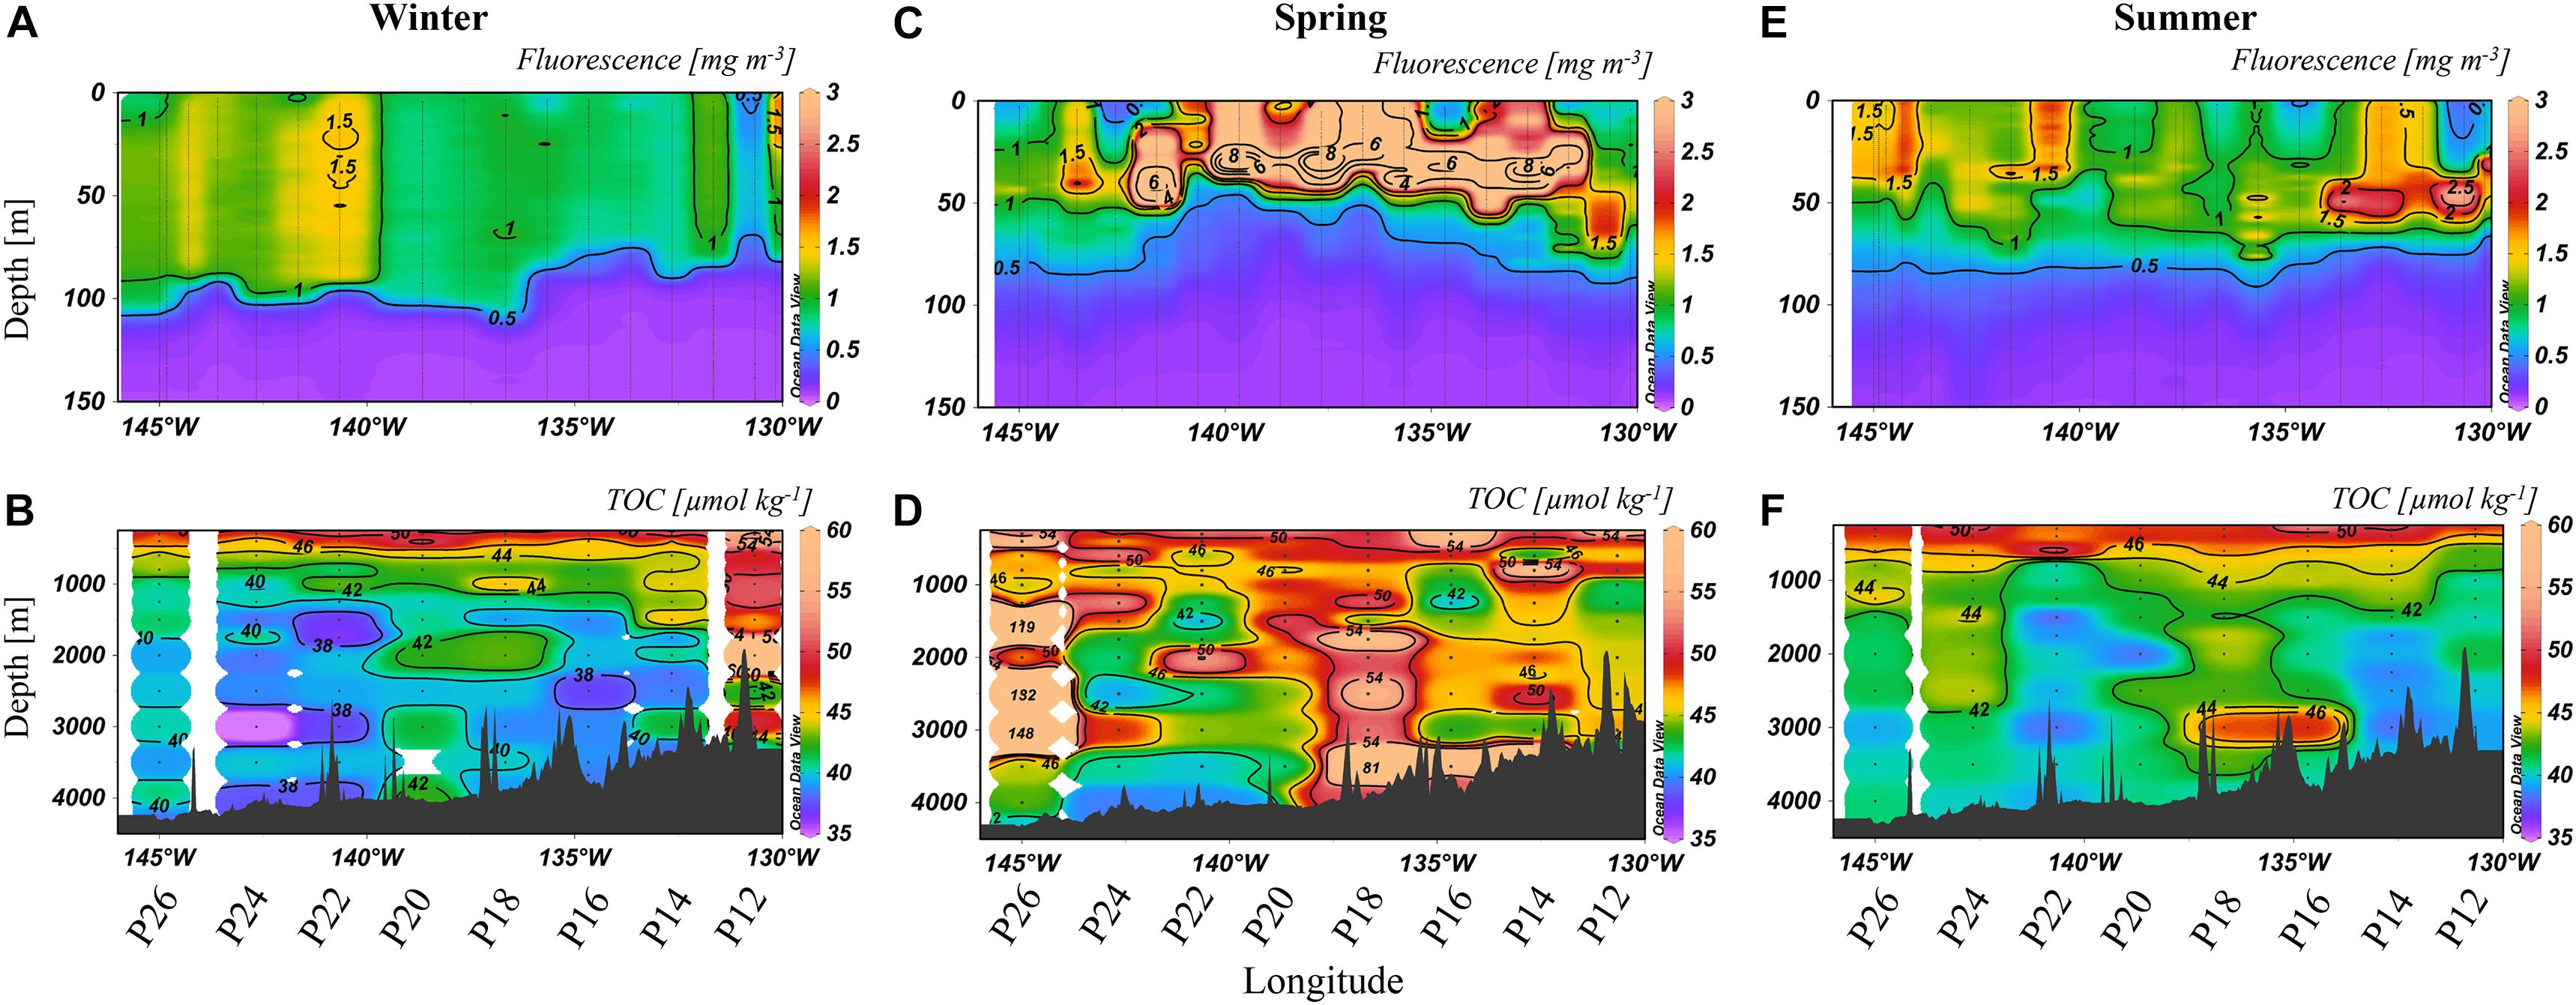
Figure 3. Fluorescence to 150 m (A,C,E) [mg m–3] and TOC [μmol kg–1] at depths >250 m (B,D,F) from 2018. The color scales are non-linear, with some values off scale (>60 μmol kg–1 for TOC, >3 mg m–3 for fluorescence). Note that fluorescence was measured at all stations while TOC was determined at selections stations, as labeled below the x-axis.
Distributions in 2017
Relative to spring and summer, winter concentrations of both fluorescence and TOC were most consistent along Line P, with upper ocean fluorescence (Figure 2A) ranging from 0.5 to 1 mg m–3 in the upper 100 m. TOC concentrations were ∼40 μmol kg–1 at >1,000 m, with several localized areas of elevated TOC (∼42 μmol kg–1; Figure 2B). By spring, the deep chlorophyll maximum (DCM) developed with fluorescence concentrations up to 1.5 mg m–3, mainly near 50 m (Figure 2C). Heterogeneity in the TOC distribution was prominent (Figure 2D), with a minimum of 38 μmol kg–1 (P20, 3,000 m) and a maximum of 46 μmol kg–1 (P12, 3,000 m). Observed in the deep bathypelagic at stations such as P24, P20, and P12, summertime TOC concentrations were elevated by ∼2–6 μmol kg–1 relative to neighboring concentrations (Figure 2F). Concentrations at P16 were particularly low throughout the water column, reaching a minimum of 37 μmol kg–1. Fluorescence decreased to 1–1.5 mg m–3, except near P26 where a localized maximum of 4 mg m–3 was observed toward the surface (Figure 2E).
Distributions in 2018
The lowest wintertime concentrations of fluorescence were again 0.5–1 mg m–3 (Figure 3A), except near P22, where the maximum concentration (∼1.5 mg m–3) was observed. The TOC distribution was heterogenous laterally and vertically (Figure 3B), with concentrations ranging from 35 to 44 μmol kg–1, except for P12 where there were high concentrations down the water column, up to 74 μmol kg–1 (2,000 m). High variability in TOC concentrations was observed throughout the transect in spring (Figure 3D), with the highest concentrations at P26 (up to 146 μmol kg–1) and P18 (up to 81 μmol kg–1). Fluorescence concentrations were also enhanced (Figure 3C), ranging from 2 to 8 mg m–3 in the upper 50 m, except at P26 where concentrations were ∼1 mg m–3. TOC concentrations in summer (Figure 3F) in the bathypelagic ranged from 39 to 49 μmol kg–1, with the highest concentrations observed at P16 to P20 and P24. Fluorescence returned to lower concentrations of 0.5–1 mg m–3 (Figure 3E) except at localized areas such as P12 and P14 (2 mg m–3).
Distributions of DOC in Spring 2018
Dissolved organic carbon concentrations were highly variable along Line P, ranging from 37 to 60 μmol kg–1 at depths >1,000 m (Figure 4). Deep waters at stations P20 and P22 held relatively low values (<40 μmol kg–1), concentrations consistent with prior reports for the northern North Pacific (Hansell and Carlson, 1998; Hansell et al., 2009). Isolated stations and depths along the transect held elevated DOC concentrations, demonstrating high heterogeneity. Maximum concentrations in the bathypelagic were observed at Station P26, where DOC reached up to 50–55 μmol kg–1, as well as at P18, which reached 58 μmol kg–1.
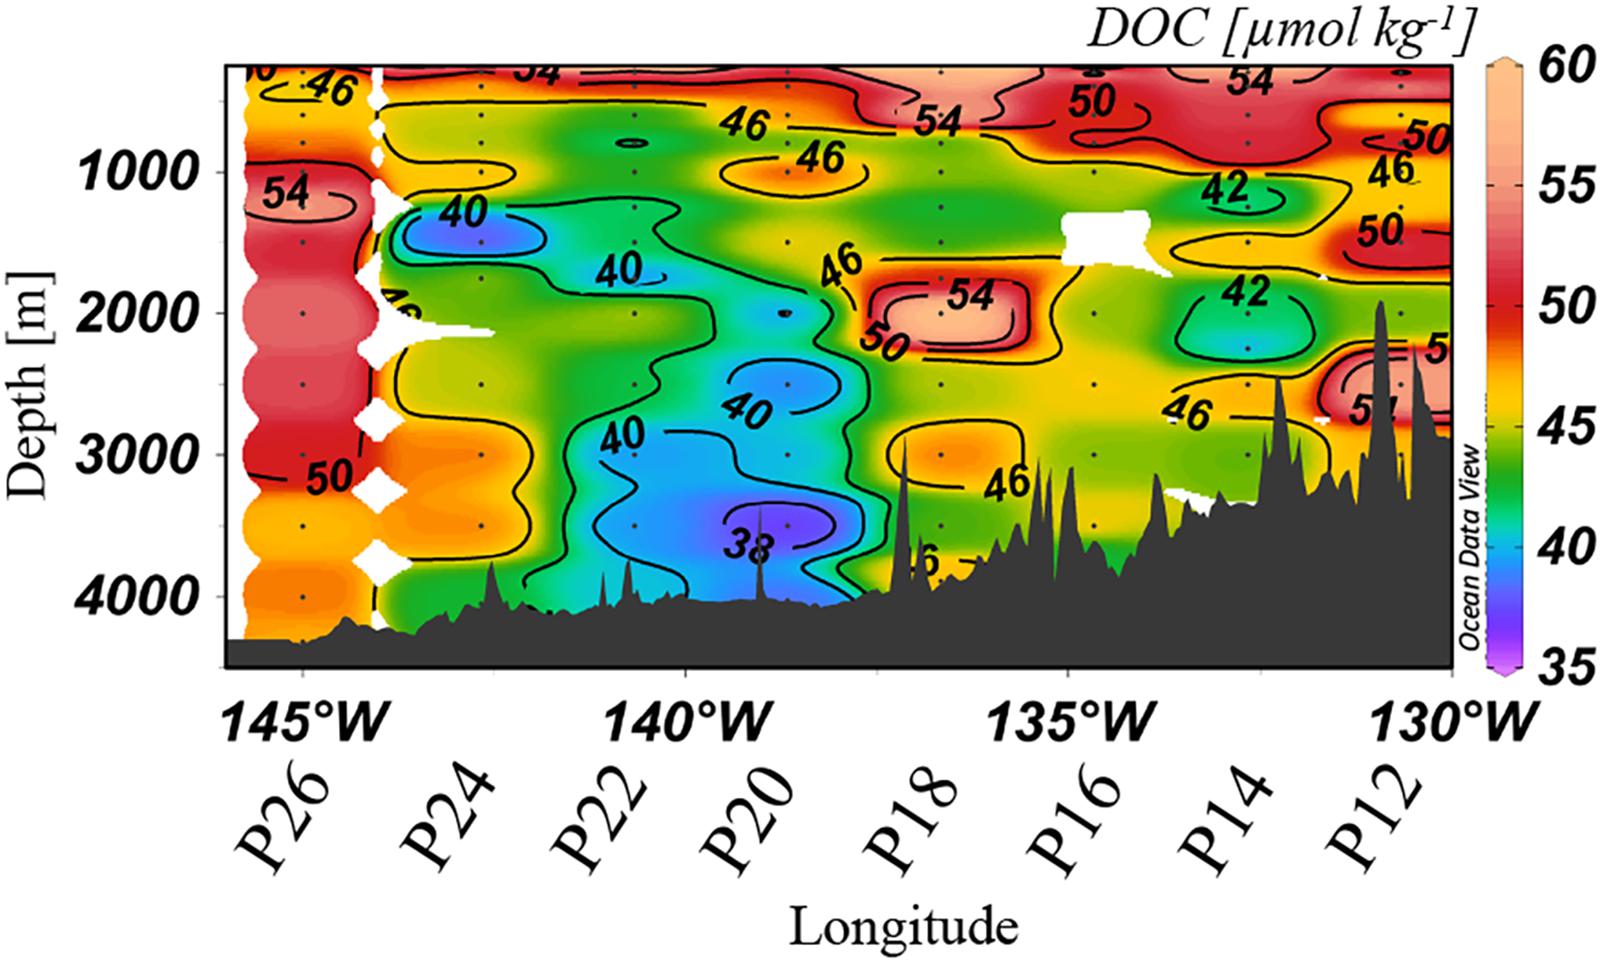
Figure 4. Dissolved organic carbon [μmol kg–1] distribution at >250 m in spring 2018 along Line P. The color scales are non-linear.
Discussion
To understand the trends observed in organic carbon and their contributing mechanisms, we discuss the data in terms of both interseasonal and interannual variability for 2017 and 2018, considering a multitude of parameters and rates that incorporate TOC, DOC, euphotic zone fluorescence and satellite-derived surface chlorophyll.
Trends in TOC and Fluorescence
Seasonality in 2017
Between winter and spring (Figures 2A,C), fluorescence increased (from 0.5 mg m–3 in winter to up to 2 mg m–3 in spring) across the transect, with a particular enhancement in the deep chlorophyll maximum (DCM; near 50 m). Organic matter export was evidenced by TOC enrichment and variability in the deep water column (Figure 2B). In spring, extensive enrichment of TOC, up to 46 μmol kg–1, was observed at P12 (Figure 2D), values higher than in winter (Figure 2B). Elevated TOC at depth in spring coincided with an increase in fluorescence, suggesting that production in the euphotic zone was contributing to vertical export. Relative to winter values, minima in deep TOC were observed in spring as well, possibly due to further TOC removal between winter and spring by heterotrophic respiration or by horizontal displacement with low TOC waters. TOC was transported deep into the water column, as concentrations observed in the mesopelagic (up to 46 μmol kg–1) reached depths of 2,000 m at several stations (P16, P18, and P20). Enhanced TOC concentrations were also apparent down to 3,000 m at some stations, indicating deep export of organic carbon via vertically sinking particles in connection with higher abundances of phytoplankton, as indicated by high fluorescence. In summer, isolated enrichments of TOC became even more noticeable (Figure 2F). These seasonal enrichments of TOC concentrations are consistent with increased fluorescence in the euphotic zone (Figure 2E), which again suggested that blooms of phytoplankton were producing organic carbon capable of reaching the bathypelagic ocean, supporting the long-term sequestration of carbon.
Seasonality in 2018
Winter 2018 (Figure 3B) had higher heterogeneity in TOC along Line P. Again, fluorescence averaged around 0.5–1 mg m–3, though slightly higher concentrations (∼1.5 mg m–3) were apparent further to the west in 2018, coinciding with heterogeneity in bathypelagic TOC in that area. The differences in wintertime TOC distributions between 2017 and 2018 suggested a more productive year in 2018. During winter, Station P12 had the highest deep TOC concentrations, averaging ∼50 μmol kg–1 (Figure 3B). These high TOC concentrations at P12 were not accompanied by elevated fluorescence in the euphotic zone at that station (Figures 3C,D), perhaps indicating a role for lateral input, such as terrestrial input from the margin. However, local surface conditions, such as fluorescence, do not have to align vertically with the associated exported organic carbon at depth given the great spatial separation possible between the site of particle export and its eventual location in the deep ocean (Siegel et al., 2008). Particularly elevated TOC concentrations at P12 were observed in spring 2017 as well, though less prominent (Figures 2B,D). We included this station for analysis because it was in deep water (>3,000 m; Figure 1), however, it is adjacent to, and possibly impacted by, adjacent shelf waters, as high coastal fluorescence was observed in spring 2017 (∼11 mg m–3) and winter 2018 (∼5 mg m–3). It was also nearest the area where the southward flow of the bifurcation of the North Pacific Current (NPC) originates which may have contributed to high TOC levels, as the remainder of the Line P stations analyzed are closer to the northward flow of the NPC (Pelland et al., 2016).
Exceptionally high fluorescence occurred in spring 2018, reaching levels above 8 mg m–3 (Figure 3C). This enhancement was evidence of a strong seasonal phytoplankton bloom, which appeared to export high levels of organic carbon to depth (Figure 3D). Chlorophyll-a concentrations obtained from satellite data (Hu et al., 2012) for spring 2018 were higher than 2017 on average as well (Figure 5). In 2017, chlorophyll concentrations on the western side of the transect were ∼0.15 mg m–3, and 0.3 mg m–3 at the eastern stations. In contrast, concentrations in 2018 ranged from 0.3 to 0.6 mg m–3, supporting our observations of higher fluorescence in 2018 and ultimately higher abundance phytoplankton. TOC levels at P26 were exceptionally high during this season, reaching 148 μmol kg–1, though it did not correspond with enhanced fluorescence at that station. However, this station had a unique feature, as it contained high numbers of heterotrophic salps (discussed further in section “Contribution of Gelatinous Zooplankton to Organic Carbon Export”), which have been correlated with lower levels of phytoplankton due to consumption (Li et al., 2016), consistent with this observation. Elevated TOC values in this season were observed in the deep water column, even down to 3,500 m, suggesting the production and downward propagation of fast-sinking particulate matter. Past studies in the northeastern Pacific have identified a correlation of upper water column processes, such as chlorophyll and net primary production, to export flux in the deep bathypelagic (50 m from seafloor) as well as seafloor deposits (Smith et al., 2008), suggesting that carbon export in this area is a largely vertical process. Fluorescence was highest in the spring season for both 2017 and 2018 (Figures 2C, 3C), spanning nearly the entire transect in both years, while elevated fluorescence was more variable across the transect in other seasons. These results indicate that spring was the most productive season in this region, and more productive than 2017.
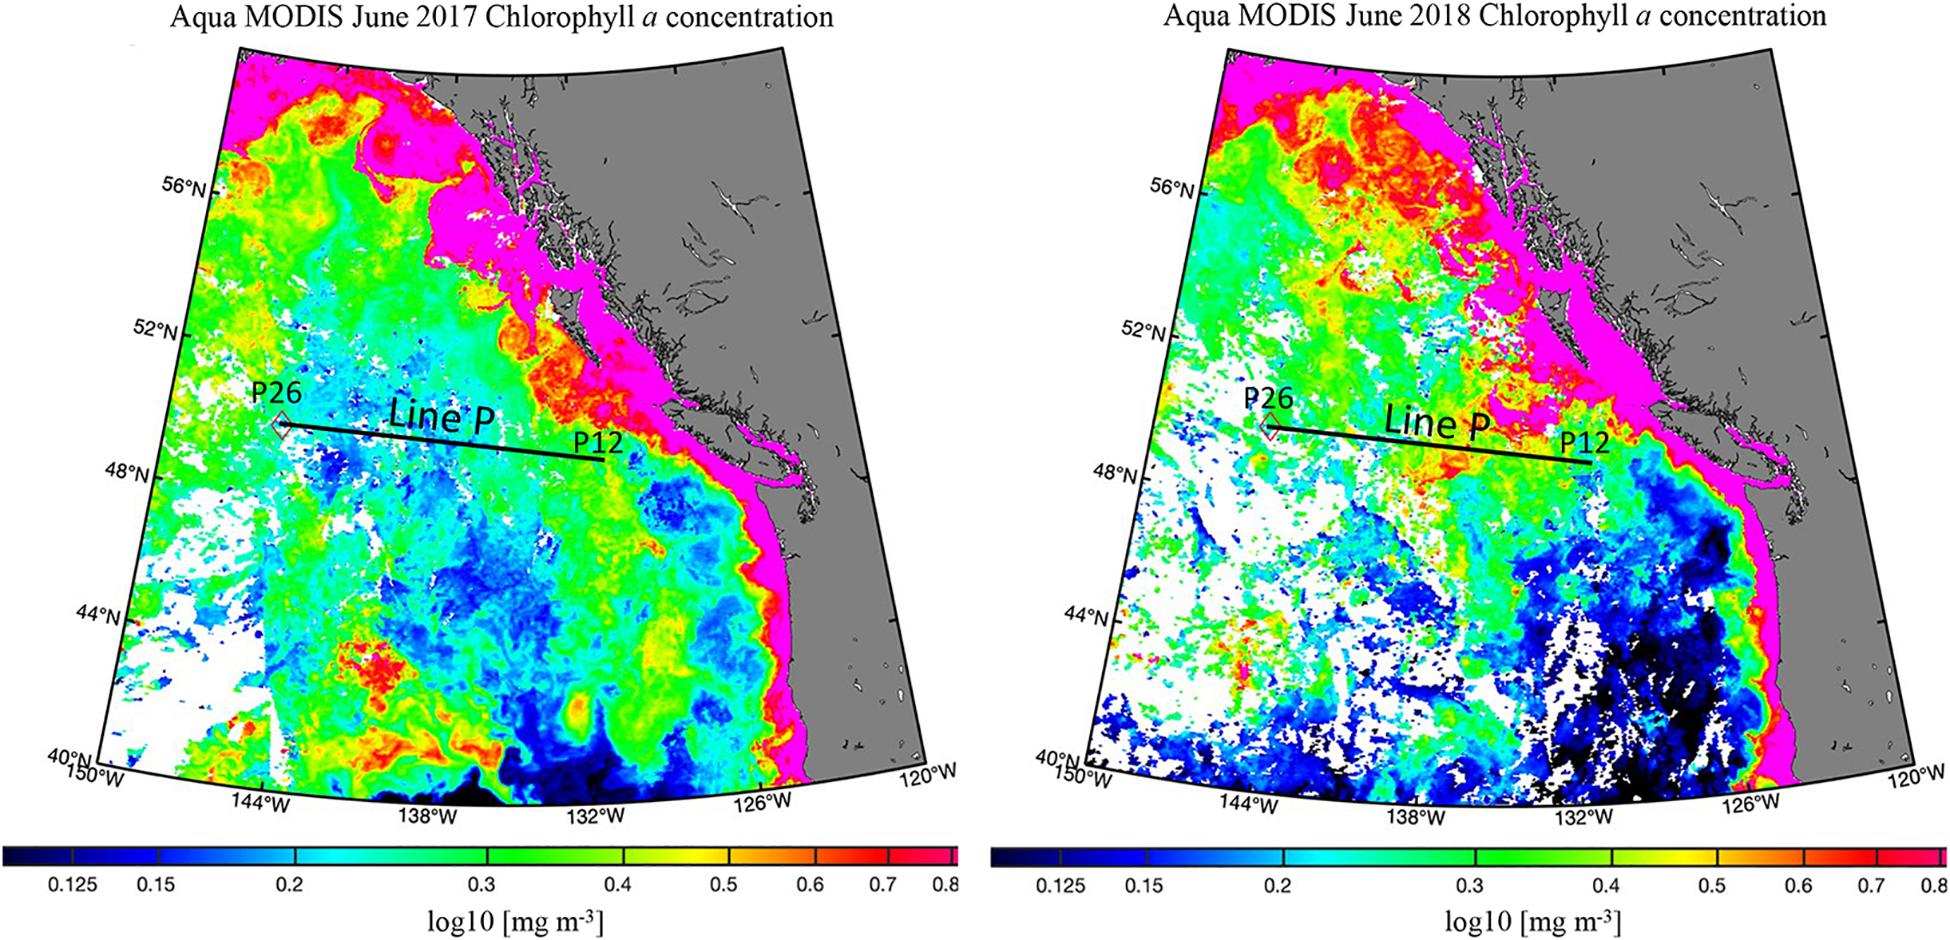
Figure 5. Satellite chlorophyll distributions [mg m–3] for June 2017 and 2018. The analyzed portion of Line P is represented by a black line. Aqua MODIS data from https://oceancolor.gsfc.nasa.gov/l3/ (Hu et al., 2012). Map made with M_Map (https://www.eoas.ubc.ca/~rich/map.html).
By summer 2018, much of the TOC enhancement from springtime had dissipated (Figure 3F), potentially through heterotrophic remineralization, sedimentation to the sea floor, or lateral export away from the study site. Evidence of enhanced fluorescence still existed, though lower in intensity (Figure 3E). Higher TOC concentrations were observed intermittently at P16, P18, and P24, near where the highest TOC concentrations from spring were present. There was a trend in fluorescence in summer of both 2017 and 2018, as both years exhibited the maximum concentrations near stations P12 and P24/26, suggesting an interannual trend. In parallel with fluorescence, TOC was heterogeneous throughout the water column, particularly at P16 and P24.
Modeled Comparison of TOC Between Years
To better characterize variability between years, vertical profiles of TOC were modeled using a piece-wise linear least squares statistical analysis (Schlitzer, 2019). Vertical profiles of modeled TOC concentrations (Figure 6) provide insight on trends in the variability of TOC with depth; the differences between years and seasons became more visually apparent.
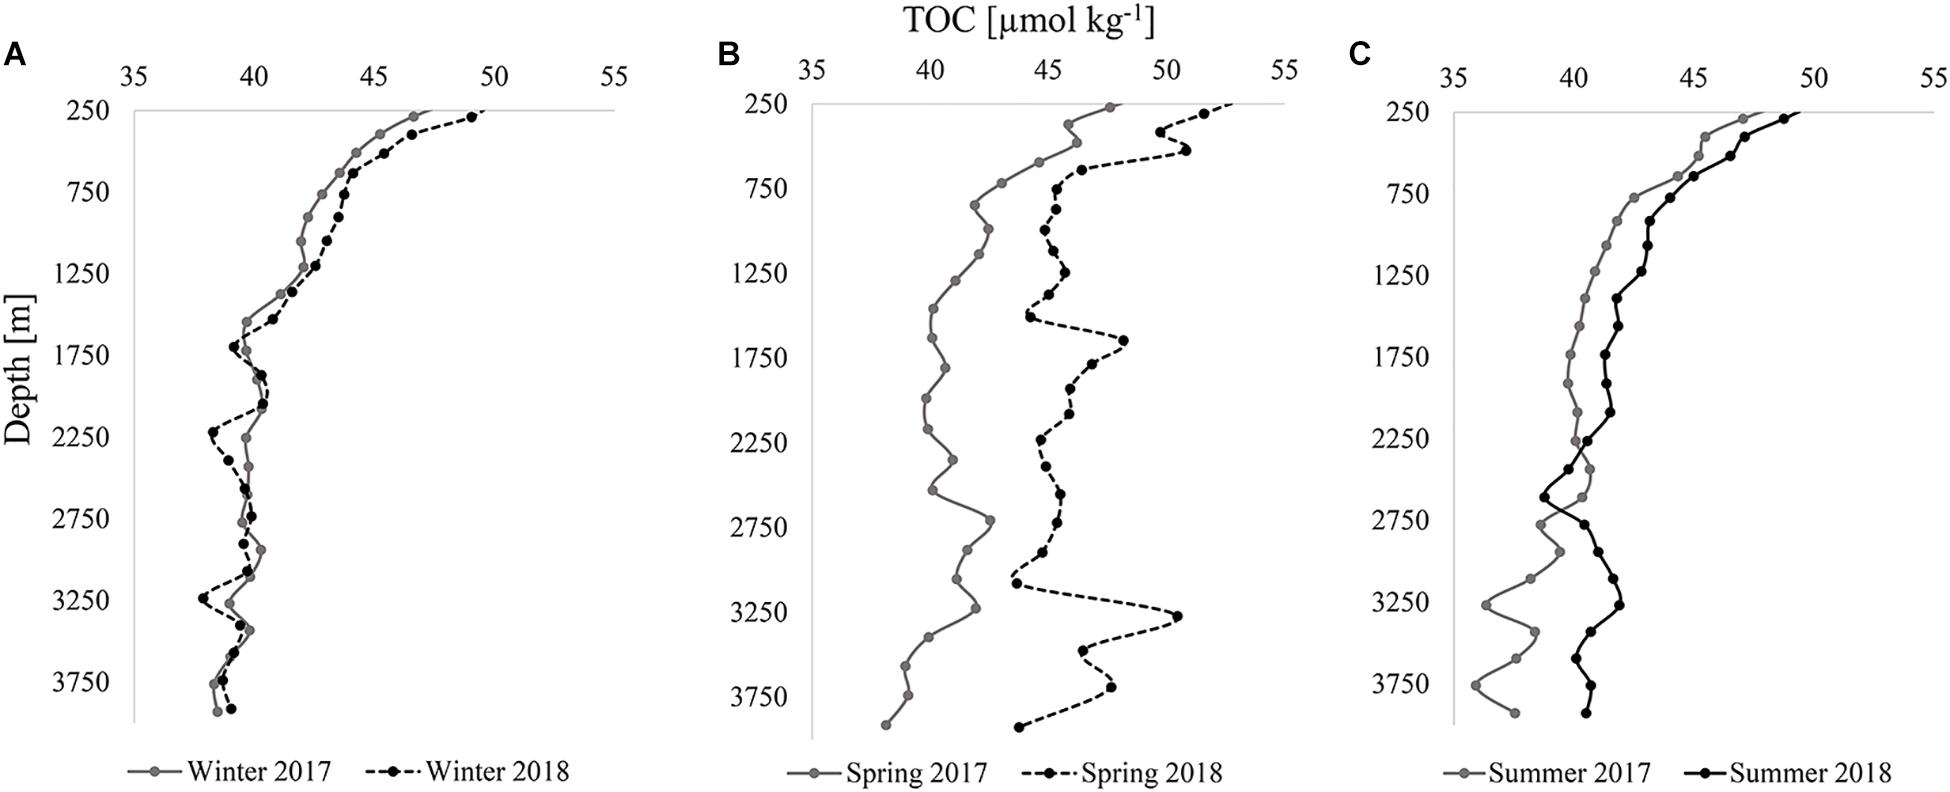
Figure 6. Internannual comparisons (2017 and 2018) of modeled TOC [μmol kg–1] vertical profiles for all stations in the analysis in winter (A), spring (B), and summer (C).
In both winters (Figure 6A), TOC profiles were comparable and variability in TOC with depth was mostly synchronous. For example, concentrations were somewhat lower at specific depths such as ∼1,700, 3,250, and 3,750 m in both years. TOC concentrations remained close in concentration at all depths, never exceeding a difference of 1.5 μmol kg–1 between years, a value approximating the uncertainty of the measurement. In contrast, there was high variability between 2017 and 2018 during the spring season (Figure 6B). Differences in TOC concentrations at similar depth ranged from 1.8 to 11.5 μmol kg–1, with an average offset of ∼5 μmol kg–1 down the profiles. As was also apparent from the observed TOC distributions (Figures 2D, 3D), higher concentrations in 2018 were estimated by the model. The sporadic changes in concentration with depth were similar for both years in the deeper bathypelagic, such as the decrease in TOC concentrations from roughly 2,750–3,000 m and the subsequent increase to 3,250 m. In summer, differences in concentration narrowed between the years, not exceeding 2 μmol kg–1, except below ∼2,300 m where differences in concentration reached up to 6 μmol kg–1 (Figure 6C). These depths were located where the highest variability was also observed in spring, which likely contributed to variability in summer due to residual organic carbon. The TOC introduced in spring of both years returned to lower concentrations (∼36–42 μmol kg–1) in the bathypelagic by summer, similar to winter observations. The disappearance of TOC between these seasons was evidence of organic carbon removal from the deeper water column, driven by heterotrophic respiration, lateral transport, or sedimentation of particles onto the seafloor, all of which sequester carbon produced in the upper water column into the bathypelagic ocean. The pattern in TOC between seasons for both years demonstrated an interannual trend.
The seasonality and variability in TOC concentrations at depth at P26 in 2017 (Figure 7B) was more prominent than changes in deep water at oligotrophic Station ALOHA of the Hawaii Ocean Time-series (HOT), located in the subtropical North Pacific (Figure 7A). Though deep TOC at Station ALOHA showed a single elevated value at ∼1,000 m in spring, seasonality in concentrations was largely not evident. In contrast, concentrations along Line P deviated considerably between seasons at all depths below 250 m (Figure 2). Such observations indicate that the deep water column of the northeastern Pacific was more impacted by seasonal variability in carbon export in comparison to less productive oceanic areas such as the subtropical Pacific. The concentrations at Line P were also considerably higher at depth, ranging from 40 to 49 μmol kg–1, while concentrations at HOTS were ∼35 μmol kg–1 in the deep water column with very low variability.
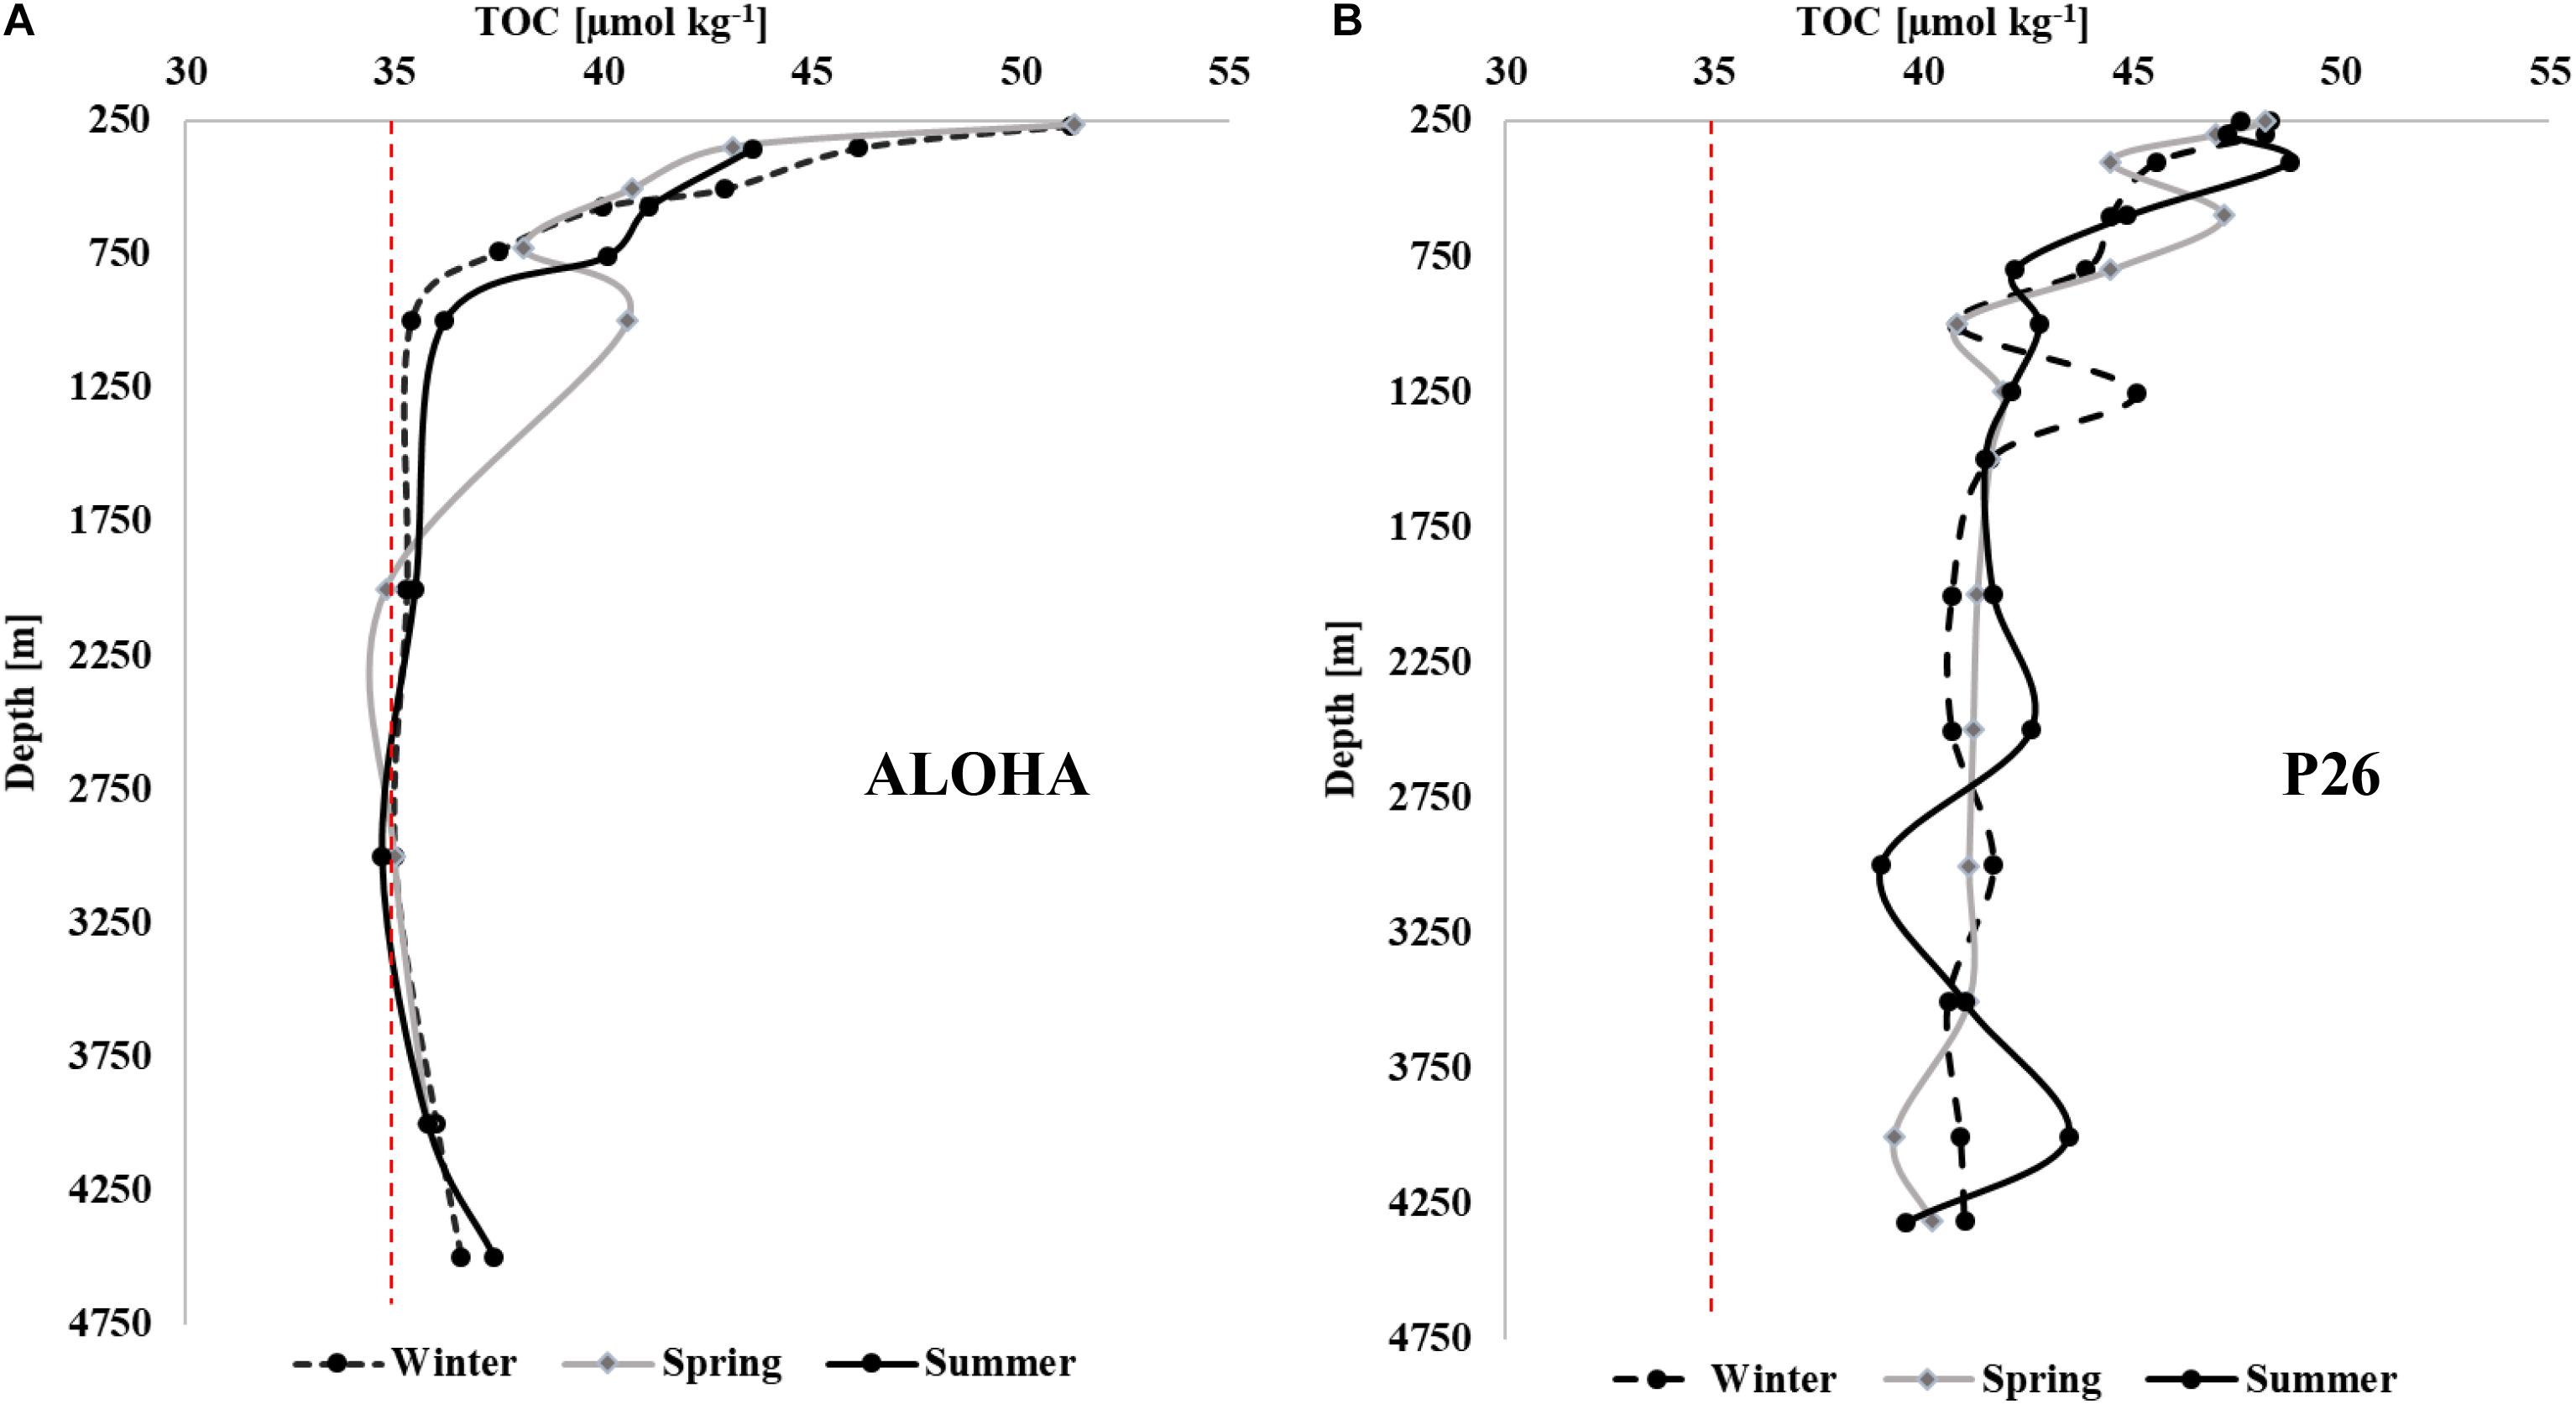
Figure 7. Seasonal TOC [μmol kg–1] profiles (winter, spring, and summer) at Station ALOHA (A) and at Station P26 along Line P (B) in 2017. The red dashed line at 35 μmol kg–1 provides a visual reference point emphasizing the differences in concentrations between subtropical and subpolar systems. HOT data are accessible at http://hahana.soest.hawaii.edu/hot/hot-dogs/bextraction.html. Concentrations at Station ALOHA are referred to here as TOC, rather than DOC as listed at the HOT data archive, since the samples were collected and analyzed as whole-water.
Contribution of Gelatinous Zooplankton to Organic Carbon Export
Sampling for abundances of zooplankton was completed at offshore stations P12, P16, P20, and P26 for three size classes of larvaceans, doliolids, and salps. The counts provided in Table 1 are those that showed large increases from 2017 to 2018 (i.e., count increased by >1 individuals m–3). The complete data are provided in Supplementary Material.
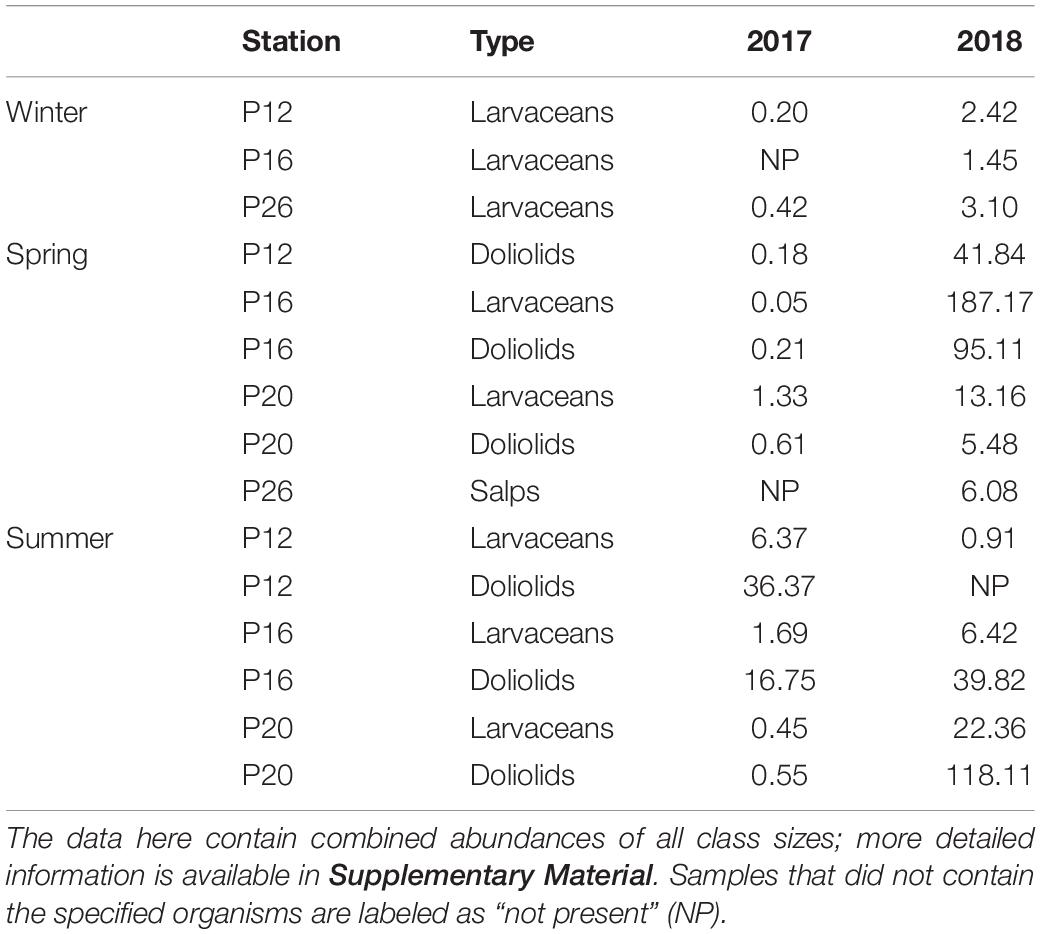
Table 1. Counts of larvaceans, doliolids, and salps (individuals m–3) in the upper 250 m that showed important increase between 2017 and 2018.
The presence of salps, larvaceans, and doliolids were correlated with high levels of TOC in the deep layers. The abundance of larvaceans during winter of 2018 was slightly higher than the low/non-observable counts during winter 2017, perhaps accounting for the minor increase in heterogeneity of TOC at depth observed in 2018 in this season. In contrast, abundances in spring were considerably higher in 2018 compared to 2017. Larvaceans were substantially more numerous at P16 and P20, where counts reached up to 187 individuals m–3 (P16, 2018), while very low numbers were observed in 2017. Doliolids were more abundant at these stations as well as at P12, also reaching a maximum at P16 (∼95 individuals m–3), providing potential for higher amounts of carbon to be exported to depth, which we observed in the TOC distribution (Figure 3D). Notably high abundances of large salps (>10 mm, some reaching ∼10 cm) were observed at P26, both from the bongo nets and visually apparent at the surface. High abundances of these gelatinous zooplankton were associated with high levels of organic carbon, higher than any other season, throughout the water column in spring 2018. Enrichment of TOC was likely due to sinking houses, fecal pellets, and carcasses of these organisms. As previously mentioned in Section “Seasonality in 2018,” exceptionally high TOC concentrations were observed at P26 (i.e., 148 μmol kg–1 at 3,000 m, 131 μmol kg–1 at 2,500 m) that did not correlate with high surface fluorescence. However, this was the only station with large salps capable of quickly transporting carbon to the bathypelagic, perhaps scavenging much of the plant biomass in the process, which resulted in low fluorescence (∼1 mg m–3 compared to 8 mg m–3 at other stations during this season). Salps were not observed in winter or summer of both years and we did not observe TOC concentrations as high as those in spring 2018 anywhere else in the distributions, a sign that salps were a major contributor to vertical carbon export within their bloom area and contributors to bathypelagic carbon.
In summer 2017, abundances of larvaceans and doliolids at P12 were higher than counts from 2018, though there was no substantial difference in TOC concentrations between years at this station. However, particularly high TOC concentrations (up to 71 μmol kg–1, 2,000 m) were observed at P12 in the subsequent season (winter 2018), possibly due to the presence and resultant export of organic matter by these organisms from the previous season, which would suggest slower sinking rates of organic matter. Larvaceans were higher in abundance during 2018 at P16 and particularly at P20, however, where numbers reached 112 individuals m–3. High TOC concentrations (∼44–47 μmol kg–1) were observed in these areas, likely correlated to the presence of these individuals during spring, but concentrations were considerably less prominent. No salps were observed in summer 2018, indicating that the large salp bloom had dissipated, likely allowing the phytoplankton community to recover, as indicated by elevated fluorescence levels (up to 4 mg m–3).
A phenomenon noted within this area in the past (Li et al., 2016), the presence of larvaceans, doliolids, and salps, was observed, particularly during spring 2018. These organisms are gelatinous zooplankton that feed by siphoning water, typically secreting DOC and contributing to the detrital TOC pool through sinking carcasses and reworking of particulate material (Hamner and Robison, 1991). High phytoplankton abundances provide ample food for these heterotrophic organisms. Additionally, higher quantities of them can indicate strong autotrophic bloom conditions (Heron, 1972). Export flux estimates for each type of organism are typically ∼20 mg C m–2 d–1 (Wiebe et al., 1979; Matsueda et al., 1986; Robison et al., 2005; Takahashi et al., 2015; Stone and Steinburg, 2016), highlighting the magnitude of their potential contribution to the deep carbon pool. However, the flux is highly dependent on factors such as species, location, year, and bloom intensity. They range widely in size, as salps can reach up to 10 cm in length, and their colony chains can be as long as a few meters (Bone, 1998; Wrobel and Mills, 1998), making them capable of producing large, dense fecal pellets. Larvaceans can contribute to the sinking particulate pool through rapid disposal of their mucopolysaccharide-comprised houses, while salps and doliolids are efficient at digesting and packaging dense fecal pellets that can propagate down the water column quickly. Sinking rates have been estimated from 450 to 1,210 m day–1 for these groups (Bruland and Silver, 1981; Silver et al., 2003; Robison et al., 2005), accounting for rapid vertical export of organic carbon to the bathypelagic. Given the fragility of gelatinous larvacean houses, past studies have indicated that they do not survive collection in sediment traps, leading to a potential underestimate of true carbon flux (Robison et al., 2005). Conservative estimates of the contribution to POC flux by larvacean houses was 7.6 g C m–2 yr–1 in Monterey Bay along the central California coast, where estimates for total export by sediment traps in that area were 14.4–24.0 g C m–2 yr–1, highlighting the potential magnitude of POC supply missing in flux estimates (Silver et al., 2003; Robison et al., 2005). The estimate was considered conservative, as the authors stated that sampling was biased toward unfragmented and smaller sinkers. High abundances of these organisms have been observed in various regions, such as the Southern Ocean and the tropical North Pacific, and have been increasing in recent years (Atkinson et al., 2004; Hereu et al., 2010). Their increase in abundance is likely due to their ability to tolerate warmer waters (Atkinson et al., 2004), and in a warming ocean, may be increasingly important to the flux of carbon to depth within various regions of the ocean. From the data in this analysis, the contribution of gelatinous zooplankton to organic carbon export to the deep ocean when high in abundance appears to be quite important.
Sinking Particles Delivering DOC to Depth
Samples for both TOC and DOC were collected and analyzed during spring 2018, when we observed the extensive seasonal bloom of phytoplankton. Comparing the distributions of TOC and DOC provided insight on the impact of particulate carbon on the DOC pool within the bathypelagic ocean. Collection for both parameters was completed only during spring 2018 due to time and funding constraints.
Concentrations of TOC in spring 2018 (Figure 3D) were highly anomalous compared to both 2017 observations (lower TOC concentrations) and those previously observed in less productive areas of the North Pacific such as 30°N (Swift et al., 2014), where concentrations are both lower (∼36–38 μmol kg–1) and more homogeneous. Elevated DOC was apparent at similar depths and stations (Figure 4) as in the distribution of TOC. For example, at Station P26 at 3,000 m, TOC was 148 μmol kg–1 and DOC was 50 μmol kg–1, both of which were considerably higher than concentrations observed in wintertime (TOC values of ∼40 μmol kg–1). These observations were evidence of the presence of sinking particulate matter, originally produced by the large phytoplankton bloom, which delivered DOC to depth either through biological modification or physical disaggregation of the particles. As discussed in Section “Contribution of Gelatinous Zooplankton to Organic Carbon Export,” high abundances of salps were measured at P26, where we observed the most elevated TOC and DOC concentrations. It appeared that the export of particulate carbon into the bathypelagic originating from salps was particularly susceptible to contributions of organic matter to the bathypelagic. The differences between TOC and DOC were often considerable, beyond the measurement uncertainty of ±1.5 μmol kg–1, indicating particulate matter enrichment at these locations. However, our methods do not provide an accurate measure of particulate organic matter (POC), as that measurement requires filtration of large volumes of water; the difference between TOC and DOC here must be considered as a qualitative representation of particulates in the water column. High levels of fluorescence (∼8 mg m–3) also supported the occurrence of a particularly strong bloom during this year (2018), with the capacity to supply the deeper water column with organic matter. This observation provides evidence for sinking particulate matter to contribute to the bulk DOC pool on a short time scale.
Annual Net TOC Accumulation and Removal Rates
If TOC added to the deeper water column during the spring bloom was removed by heterotrophic respiration, there would be a commensurate decrease in oxygen concentration between spring and summer. However, oxygen in the bathypelagic along Line P increased during both summers (based upon CTD sensor data), likely due to renewal by transport of high oxygen water. This phenomenon overshadowed any observable change in oxygen that was due to biological activity, so we cannot discern whether TOC was remineralized in the water column, transported laterally, or sedimented onto the seafloor, thus leaving the removal mechanism, or combination of mechanisms, uncertain.
Despite this limitation, we can discern the efficiency of these mechanisms, whatever they may be, to accumulate and subsequently remove seasonal TOC to the bathypelagic. In 2017, TOC accumulated from winter to spring at a rate of ∼0.5 μmol kg–1 day–1, and was removed at the nearly the same rate (∼0.6 μmol kg–1 day–1) from spring to summer (Figure 8). The accumulation and removal rates during 2018 were also approximately the same: ∼2.1 μmol kg–1 day–1. The rate estimates indicated that most, if not all, of the TOC introduced in spring is subsequently removed from the water column by summer since the accumulation and removal rates were the roughly same for each respective year. However, the rates for 2018 were four times higher than 2017, supporting the conclusion that a stronger spring phytoplankton bloom occurred during that year. This bloom introduced more organic carbon into the deeper water column, however, it was still efficiently removed by summer despite higher concentrations, demonstrating the proficiency of organic carbon removal within this area.
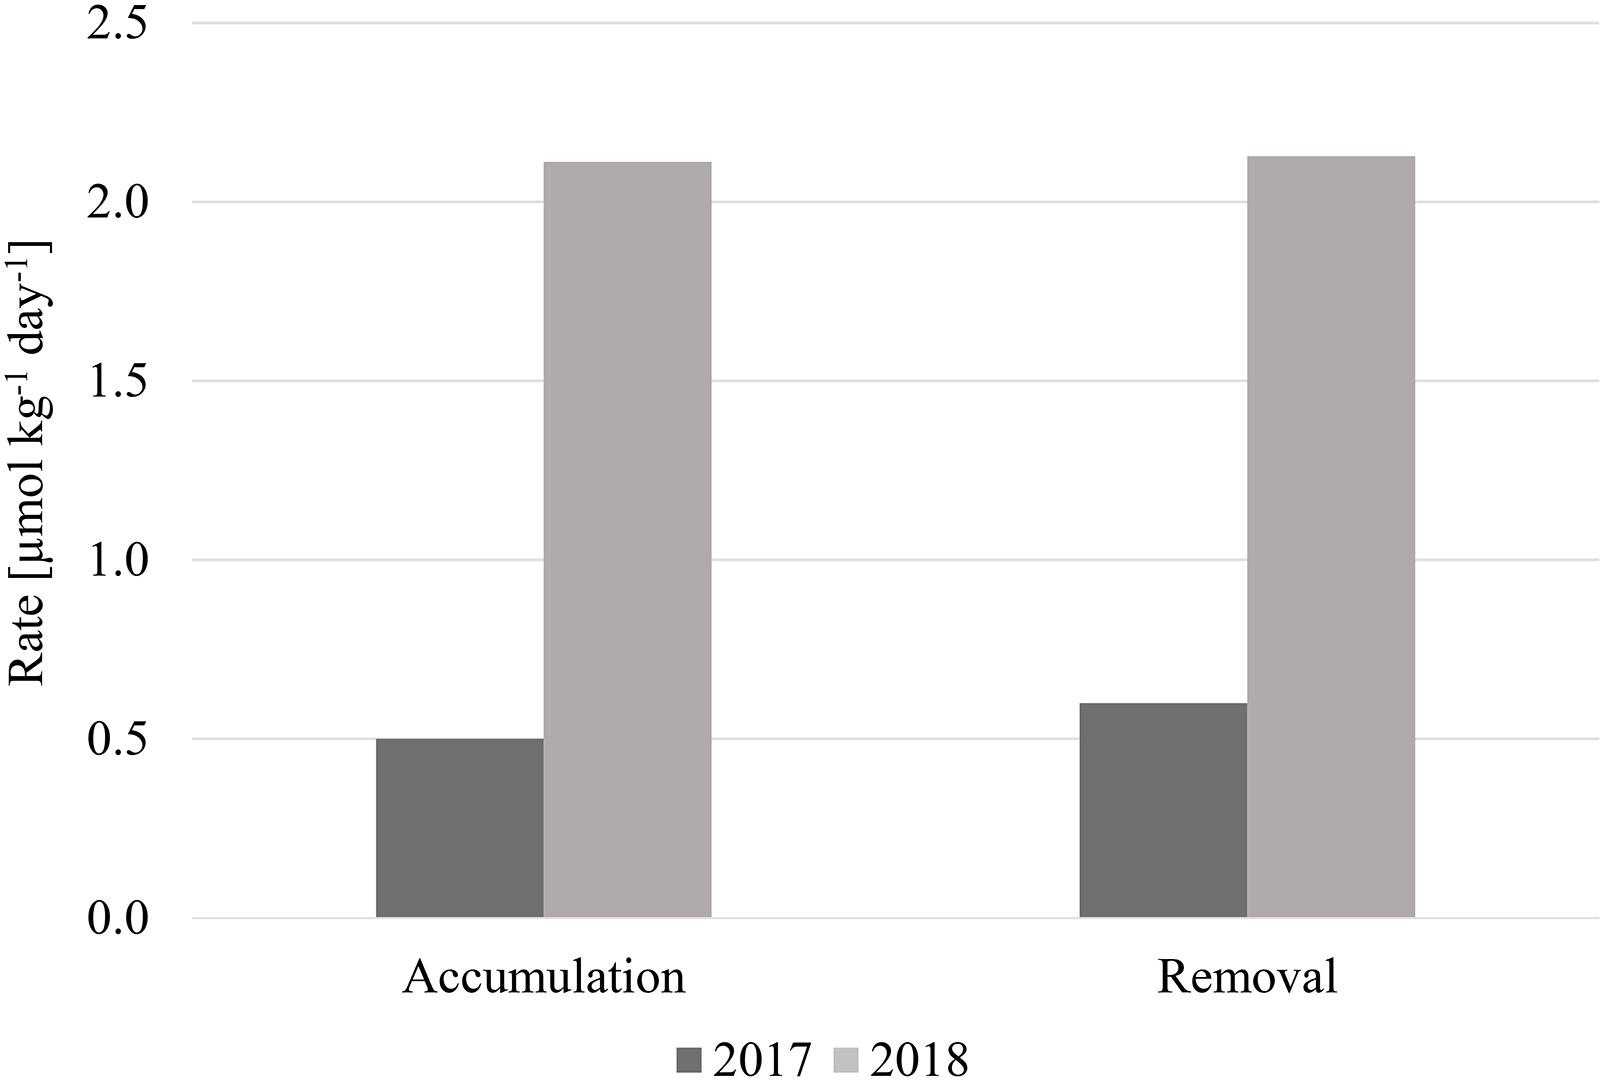
Figure 8. Rates of net seasonal TOC accumulation and removal [μmol kg–1 day–1] for 2017 and 2018.
Conclusion
Distributions of TOC in the bathypelagic water column from 2017 and 2018 in the northeastern Pacific indicated high seasonal and spatial heterogeneity, as well as higher and more variable concentrations than those observed in the oligotrophic North Pacific (Figure 7A). A correlation between increased concentrations and heterogeneity of both TOC and fluorescence concentrations indicated that organic carbon produced in the upper ocean was vertically exported into the deep ocean. Fueled by a particularly strong phytoplankton bloom in spring 2018 (supported by fluorescence and satellite chlorophyll data), high abundances of gelatinous zooplankton aided in export of quickly sinking particulate matter, which also added DOC to the water column, evidenced by differences in TOC and DOC distributions during this season. Net TOC accumulation and removal rates indicated a fast, efficient removal of recently produced organic carbon, despite higher rates observed in 2018 (0.6 μmol kg–1 day–1 in 2017, 2.1 μmol kg–1 day–1 in 2018).
These seasonal observations in organic carbon dynamics shed light on the ability for the northeastern Pacific to produce and export TOC to the bathypelagic water column, as we observed that organic carbon concentrations can change vastly on a relatively short time scale; therefore, we cannot rely solely on single-season distributions to adequately characterize eutrophic ocean systems. Measurements of TOC and DOC at bathypelagic depths across the global ocean typically find low concentrations (38–42 μmol kg–1; Hansell et al., 2009), but these observations often come from few single-season cruises dominated by oligotrophic and typically summer conditions, where the production and export of organic matter is less prominent. Given the observations in this analysis, the addition of both particulate and DOC into their respective bulk pools in the deep ocean may be larger than we are currently accounting for, or that it is more dynamic than we assume. Another critical factor to consider is the influence a warming climate has on production of organic matter, as we have a minimal understanding of its impact on TOC distributions and export, particularly in productive areas where the effect may be greater than within oligotrophic regions (Honjo et al., 2008). The high abundance of gelatinous zooplankton appeared to export high levels of organic matter to the deep ocean on a short timescale, and as these organisms outcompete others in warmer temperatures, they may play a significant role in the sequestration of marine organic matter in the future ocean (Atkinson et al., 2004). Technological advances in our analytical instruments have also improved our ability to discern smaller differences in TOC and DOC concentrations, allowing us to understand oceanic organic carbon variability better. Given such advancements and our constrained knowledge of both seasonality and the impact of climate change, we must be careful not to let limited observations of the ocean in past efforts bias our understanding of current ocean carbon dynamics, as this analysis indicates that productive areas can be quite variable.
Data Availability Statement
The datasets analyzed for this study can be found in the Line P repository (https://www.waterproperties.ca/linep/) or by request to the author.
Author Contributions
CL, DH, and MV conceived the idea and designed the project. MR, MG, CL, and SB collected data aboard cruises. CL completed the data analysis and wrote the manuscript. All authors aided in editing.
Funding
This work was supported by National Science Foundation Grant OCE 1634250 to DH and OCE 1634009 to MO, as well as NASA Grant 80NSSC18K0437 supporting CL and DH.
Conflict of Interest
The authors declare that the research was conducted in the absence of any commercial or financial relationships that could be construed as a potential conflict of interest.
Acknowledgments
We thank the Canadian Department of Fisheries and Oceans for sample collection and providing metadata and zooplankton counts, the crew and science party aboard the CCGS Tully and Laurier, and to Lillian Custals and Abigale Tinari for TOC/DOC analyses. Figures for satellite chlorophyll data were generated by Andrew Margolin.
Supplementary Material
The Supplementary Material for this article can be found online at: https://www.frontiersin.org/articles/10.3389/feart.2020.00080/full#supplementary-material
References
Atkinson, A., Siegel, V., Pakhomov, E., and Rothery, P. (2004). Long-term decline in krill stock and increase in salps within the Southern Ocean. Nature 432, 100–103. doi: 10.1038/nature02996
Bif, M. B., and Hansell, D. A. (2019). Seasonality of dissolved organic carbon in the Northeast Pacific Ocean. Glob. Biogeochem. Cycles 33, 526–539. doi: 10.1029/2018GB006152
Q. Bone (ed.) (1998). The Biology of Pelagic Tunicates. New York, NY: Oxford University Press, 1–24.
Bruland, K. W., and Silver, M. W. (1981). Sinking rates of fecal pellets from gelatinous zooplankton (Salps, Pteropods, Doliolids). Mar. Biol. 63, 295–300. doi: 10.1007/BF00395999
Dickson, A. G., Sabine, C. L., and Christian, J. R. (eds) (2007). Guide to best practices for ocean CO2 measurements. PICES Special Publ. 3, 191.
Druffel, E. R. M., Williams, P. M., Bauer, J. E., and Ertel, J. R. (1992). Cycling of dissolved and particulate organic matter in the open ocean. J. Geophys. Res. 97, 15639–15659. doi: 10.1029/92JC01511
Ducklow, H. W., Steinburg, D. K., and Buessler, K. O. (2001). Upper ocean carbon export and the biological pump. Oceanography 14, 50–58. doi: 10.5670/oceanog.2001.06
Freeland, H. (2007). A short history of Ocean station Papa and Line P. Prog. Oceanogr. 75, 120–125. doi: 10.1016/j.pocean.2007.08.005
Gardner, W. D. (2015). The flux of particles to the deep sea: methods, measurement, and mechanisms. Oceanography 10, 116–121. doi: 10.5670/oceanog.1997.03
Hamner, W. M., and Robison, B. H. (1991). In situ observations of giant appendicularians in Monterey Bay. Deep Sea Res. 39, 1299–1313. doi: 10.1016/0198-0149(92)90070-A
Hansell, D., and Carlson, C. (1998). Deep-ocean gradients in the concentration of dissolved organic carbon. Nature 395, 263–266. doi: 10.1038/26200
Hansell, D. A. (2005). Organic carbon reference material program. EOS 86, 318. doi: 10.1029/2005EO350003
Hansell, D. A., and Carlson, C. A. (2001). Biogeochemistry of total organic carbon and nitrogen in the Sargasso Sea: control by convective overturn. Deep Sea Res. Part II Top. Stud. Oceanogr. 48, 1649–1667. doi: 10.1016/s0967-0645(00)00153-3
Hansell, D. A., Carlson, C. A., Repeta, D. J., and Schlitzer, R. (2009). Dissolved organic matter in the ocean: a controversy stimulates new insights. Oceanography 22, 52–61.
Hereu, C. M., Lavaniegos, B. E., and Goericke, R. (2010). Grazing impact of salp (Tunicata, Thaliacea) assemblages in the eastern tropical North Pacific. J. Plankton Res. 32, 785–804. doi: 10.1093/plankt/fbq005
Heron, A. C. (1972). Population ecology of a colonizing species—pelagic tunicate Thalia democratica. Oecologia 10, 269–293. doi: 10.1007/BF00345733
Honjo, S., Manganini, S. J., Krishfield, R. A., and Francois, R. (2008). Particulate organic carbon fluxes to the ocean interior and factors controlling the biological pump: a synthesis of global sediment trap programs since 1983. Prog. Oceanogr. 76, 217–285. doi: 10.1016/j.pocean.2007.11.003
Hu, C., Lee, Z., and Franz, B. A. (2012). Chlorophyll-a algorithms for oligotrophic oceans: a novel approach based on three-band reflectance difference. J. Geophys. Res. 117:C01011. doi: 10.1029/2011JC007395
Jiao, N., Herndl, G. J., Hansell, D. A., Benner, R., Kattner, G., Wilhelm, S. W., et al. (2010). Microbial production of recalcitrant dissolved organic matter: long-term carbon storage in the global ocean. Nat. Rev. Microbiol. 8, 593–599. doi: 10.1038/nrmicro2386
Li, K., Doubleday, A. J., Galbraith, M. D., and Hopcroft, R. R. (2016). High abundance of salps in the coastal Gulf of Alaska during 2011: a first record of bloom occurrence for the northern Gulf. Deep Sea Res. Part II 132, 136–145. doi: 10.1016/j.dsr2.2016.04.009
Matsueda, H., Handa, N., Inoue, I., and Takano, H. (1986). Ecological significance of salp fecal pellets collected by sediment traps in the eastern North Pacific. Mar. Biol. 91, 421–431. doi: 10.1007/bf00428636
Pelland, N. A., Eriksen, C. C., and Cronin, M. F. (2016). Seaglider surveys at Ocean Station Papa: circulation and water mass properties in a meander of the North Pacific Current. J. Geophys. Res. Oceans 121, 6816–6846. doi: 10.1002/2016JC011920
Robison, B. H., Reisenbichler, K. R., and Sherlock, R. E. (2005). Giant Larvacean Houses: rapid carbon transport to the deep sea floor. Science 308, 1609–1611. doi: 10.1126/science.1109104
Schlitzer, R. (2019). Ocean Data View. Available online at: https://odv.awi.de (accessed January 30, 2020).
Siegel, D. A., Fields, E., and Buesseler, K. O. (2008). A bottom-up view of the biological pump: modeling source funnels above ocean sediment traps. Deep Sea Res. Part I Oceanogr. Res. Pap. 55, 108–127. doi: 10.1016/j.dsr.2007.10.006
Siegel, D. A., Buesseler, K. O., Behrenfeld, M. J., Benitez-Nelson, C. R., Boss, E., Brzezinski, M. A., et al. (2016). Prediction of the export and fate of global ocean net primary production: the EXPORTS science plan. Front. Mar. Sci. 3:22. doi: 10.3389/fmars.2016.00022
Silver, M. W., Coale, S. L., Pilskaln, C. H., and Steinburg, D. R. (2003). Giant aggregates: importance as microbial centers and agents of material flux in the mesopelagic zone. Limnol. Oceanogr. 44, 498–507. doi: 10.4319/lo.1998.43.3.0498
Smith, K. L. Jr., Ruhl, H. A., Huffard, C. L., Messié, M., and Kahru, M. (2018). Episodic organic carbon fluxes from surface ocean to abyssal depths during long-term monitoring in NE Pacific. PNAS 48, 12235–12240. doi: 10.1073/pnas.1814559115
Smith, K. L. Jr., Ruhl, H. A., Kaufmann, R. S., and Kahru, M. (2008). Tracing abyssal food supply back to upper-ocean processes over a 17-year time series in the northeast Pacific. Limnol. Oceanogr. 53, 2655–2667. doi: 10.4319/lo.2008.53.6.2655
Stone, J. P., and Steinburg, D. K. (2016). Salp contributions to vertical carbon flux in the Sargasso Sea. Deep Sea Res. Part 1 Oceanogr. Res. Pap. 113, 90–100. doi: 10.1016/j.dsr.2016.04.007
Swift, J., Mecking, S., Feely, R., Dickson, A., Carlson, C., Jenkins, W., et al. (2014). Carbon Dioxide, Hydrographic, and Chemical Data Obtained During the R/V Melville Cruise in the Pacific Ocean on GO-SHIP Repeat Hydrography Sections P02_2013 (21 March – 1 June, 2013). Oak Ridge, Tenn: Carbon Dioxide Information Analysis Center, Oak Ridge National Laboratory, US Department of Energy, doi: 10.3334/CDIAC/OTG.GOSHIP_P02_318M20130321
Tabata, S., Thomas, B., and Ramsden, D. (1986). Annual and interannual variability of steric sea level along Line P in the Northeast Pacific Ocean. J. Phys. Oceanogr. 16, 1378–1398. doi: 10.1175/1520-04851986016<1378:AAIVOS>2.0.CO;2
Takahashi, K., Ichikawa, T., Fukugama, C., Yamane, M., Kakehi, S., Okazaki, Y., et al. (2015). In situ observations of a doliolid bloom in a warm water filament using a video plankton recorder: bloom development, fate, and effect on biogeochemical cycles and planktonic food webs. Limnol. Oceanogr. 60, 1763–1780. doi: 10.1002/lno.10133
Timothy, D. A., Wong, C. S., Barwell-Clarke, J. E., Page, J. S., White, L. A., and Macdonald, R. W. (2013). Climatology of sediment flux and composition in the subarctic Northeast Pacific Ocean with biogeochemical implications. Prog. Oceanogr. 116, 95–129. doi: 10.1016/j.pocean.2013.06.017
Wiebe, P. H., Madin, L. P., Haury, L. R., Harbison, G. R., and Philbin, L. M. (1979). Diel vertical migration by Salpa aspersa and its potential for large-scale particulate organic matter transport to the deep sea. Mar. Biol. 53, 249–255. doi: 10.1007/BF00952433
Wong, C. S., Whitney, F. A., Crawford, D. W., Iseki, K., Matear, R. J., Johnson, W. K., et al. (1999). Seasonal and interannual variability in particle fluxes of carbon, nitrogen and silicon from time series of sediment traps at Ocean Station P, 1982–1993: relationship to changes in subarctic primary productivity. Deep Sea Res. Part II Top. Stud. Oceanogr. 46, 2735–2760. doi: 10.1016/S0967-0645(99)00082-X
Keywords: total organic carbon, dissolved organic carbon, North Pacific, export, Ocean Station Papa, carbon seasonality, deep carbon dynamics, marine biogeochemistry
Citation: Lopez CN, Robert M, Galbraith M, Bercovici SK, Orellana MV and Hansell DA (2020) High Temporal Variability of Total Organic Carbon in the Deep Northeastern Pacific. Front. Earth Sci. 8:80. doi: 10.3389/feart.2020.00080
Received: 11 November 2019; Accepted: 09 March 2020;
Published: 27 March 2020.
Edited by:
Rut Pedrosa Pàmies, Marine Biological Laboratory (MBL), United StatesReviewed by:
Antoni Calafat, University of Barcelona, SpainFelipe Sales de Freitas, University of Bristol, United Kingdom
Copyright © 2020 Lopez, Robert, Galbraith, Bercovici, Orellana and Hansell. This is an open-access article distributed under the terms of the Creative Commons Attribution License (CC BY). The use, distribution or reproduction in other forums is permitted, provided the original author(s) and the copyright owner(s) are credited and that the original publication in this journal is cited, in accordance with accepted academic practice. No use, distribution or reproduction is permitted which does not comply with these terms.
*Correspondence: Chelsi N. Lopez, Y2hlbHNpLmxvcGV6QHJzbWFzLm1pYW1pLmVkdQ==