 Xiaoxiao Min
 Ziqiang Ma
 Jintao Xu
 Kang He
 Zhige Wang
 Qingliang Huang4
- 1Institute of Remote Sensing and Geographic Information System, School of Earth and Space Sciences, Peking University, Beijing, China
- 2Institute of Agricultural Remote Sensing and Information Technology Application, College of Environmental and Resource Sciences, Zhejiang University, Hangzhou, China
- 3Civil and Environmental Engineering, University of Connecticut, Storrs, CT, United States
- 4Shaoxing Hydrological Management Center, Shaoxing, China
- 5Hangzhou TianLiang Detection Technology Co., Ltd, Hangzhou, China
Precipitation estimates with high accuracy and fine spatial resolution play an important role in the field of meteorology, hydrology, and ecology. In this study, support vector machine (SVM) and back-propagation neural network (BPNN) machine learning algorithms were used to downscale the Integrated Multi-satellite Retrievals for Global Precipitation Measurement (GPM) (IMERG) data at daily scale through four events selected from 2017 and 2018 by establishing the relationships between precipitation and six environmental variables over Zhejiang, Southeastern China. The downscaled results were validated by ground observations, and we found that (1) generally, the SVM-based products had better performance and finer spatial textures than the BPNN-based products, the multiple linear regression (MLR)-based products, and the original IMERG; (2) all downscaled products decreased the degree of overestimation of the original IMERG at heavy-precipitation regions to a certain extent; (3) for heavy-precipitation events in the plum rain season, the downscaled products based on SVM and BPNN both improved prediction accuracy compared to the MLR-based products and the original IMERG considering the validations against ground observations. R2 maximally increased from 0.344 to 0.615 for the SVM-based products and from 0.344 to 0.435 for the BPNN-based products compared to the original IMERG; and (4) for typhoon precipitation events, the SVM-based products still showed better accuracy with R2 maximally increased from 0.492 to 0.615 compared to the original IMERG. In contrast, the performance of BPNN-based products was not satisfying and showed no significant differences with the performance of MLR-based products. This study provided a potential solution for generating downscaled satellite-based precipitation products at meteorological scales with finer accuracy and spatial resolutions.
Introduction
Precipitation participates in the key process of global water exchange and energy cycle. It affects global climate formation and regional weather change and is the driving force behind hydrological processes such as floods and storms (Guo et al., 2004; Teng et al., 2014; Ma et al., 2019). High-precision precipitation data are crucial for weather forecast, disaster monitoring, water resource management, and vegetation growth. Although rain gauge is the most straightforward and simplest way to obtain precipitation information and can accurately monitor the precipitation within a limited radius (∼5 km) around the station, it is unenforceable to provide the spatial precipitation distribution continuously and precisely at a large scale due to the scarce and uneven distribution of stations limited by the topography, climate, and economy factors in some areas.
Satellite-based precipitation products published by the Global Precipitation Climatology Project (GPCP) (Huffman et al., 1997, 2001, 2009), the Global Satellite Mapping of Precipitation (GsMaP) project (Kubota et al., 2007), the Tropical Precipitation Measuring Mission (TRMM) project (Kummerow et al., 1998, 2000; Huffman et al., 2007), the Global Precipitation Measurement (GPM) Core Observatory project, and so on can continuously provide reasonable spatiotemporal resolution precipitation information with wide space coverage and high-frequency revisit rate. They gradually become important ways of precipitation data acquisition. As the successor of TRMM, GPM carries two key components: the dual-frequency precipitation radar operating at the Ku band (13.6 GHz) and Ka band (35.5 GHz) and the conical-scanning multichannel microwave imager operating between the frequencies of 10 and 183 GHz, which makes it have more sensor packages compared to TRMM instruments and thus provides more precise and larger coverage data (Hou et al., 2014). IMERG is the level 3 product of GPM at a spatial resolution of 0.1 and temporal resolution of 30 min. There are three kinds of IMERG products including a near-real-time product (Early Run), a 6-h-latency product (Late Run), and a post-real-time product with 18-h delays (Final Run). In some localized regions and basins, IMERG products are still too coarse for application and parameterization of hydrological and meteorological models although they can provide abundant precipitation estimates (Tao and Barros, 2010). Therefore, it is essential to acquire precipitation data at finer spatial scales (1 km).
In recent years, multitudinous researches have adopted different models based on the relationships between satellite-based products and environmental factors to obtain downscaled precipitation estimates (Guan et al., 2009; Immerzeel et al., 2009; Jia et al., 2009; Xu et al., 2015; Ma et al., 2017a, 2018; Chen et al., 2019). Immerzeel et al. (2009) established exponential correlation between precipitation and the normalized difference vegetation index (NDVI). To consider the terrain effect, Guan et al. (2009) applied a cluster-optimizing regression approach to downscale precipitation data in the mountainous terrain. Jia et al. (2009) downscaled the TMPA product by a multiple linear regression (MLR) function to consider the impacts of NDVI and the digital elevation model (DEM) synthetically, while Schultz and Halpert (1994) suggested to use both NDVI and land surface temperature (LST) to improve the accuracy of downscaled results. To consider the non-stationary relationships between precipitation and NDVI/DEM spatially, Xu et al. (2015) introduced the geographically weighted regression (GWR) model with moving-window regression to downscale TRMM products. Based on the works of Xu et al. (2015), Ma et al. (2017a) applied the Cubist model to combine various environment variables and remove systematic anomalies of TRMM data. As traditional statistical downscaling approaches, quantile mapping (Boé et al., 2007; Themeßl et al., 2012; Maraun, 2013) and copula-based methods (van den Berg et al., 2011; Vogl et al., 2012; Haese et al., 2017) were also widely used to get downscaled precipitation estimates. Lorenz et al. (2018) used spatial correlation (correlograms) to derive the transfer function of the Gaussian copula to simulate ensembles of daily precipitation fields based on daily regional climate model (RCM) precipitation simulations from 1971 to 2000. Yang et al. (2019) made an intercomparison of three quantile mapping-based downscaling techniques including bias correction and spatial downscaling (BCSD), bias correction and climate imprint (BCCI), and bias correction constructed analogues with quantile mapping reordering (BCCAQ) for daily precipitation over China. For IMERG products, there are numerous studies that evaluated the quality and precision of the data. However, a few focused on the downscaling performance. In order to get accurate daily precipitation data, Chen et al. (2019) used an integrated downscaling-fusion framework to derive downscaled IMERG products. Ma et al. (2018) proposed a new algorithm called geographically moving window weight disaggregation analysis (GMWWDA) to obtain ∼1-km and hourly IMERG products using DEM or multiple cloud properties as auxiliary data. Based on the relationships between precipitation and cloud optical and microphysical properties, Sharifi et al. (2019) adopted three (MLR, artificial neural networks, and spline interpolation) approaches to downscale IMERG V05B final-run products.
As mentioned above, there are few downscaling researches on IMERG data (Ma et al., 2018; Chen et al., 2019) that have explored at meteorological scales (e.g., daily scale). And the downscaling methods of these researches are mostly based on statistical or geographic models with few machine learning algorithms applied. In order to explore the feasibility of machine learning algorithms in downscaling IMERG data at daily scale and obtain high-accuracy and spatial resolution precipitation estimates, two machine learning methods, support vector machine (SVM) and backpack neural network (BPNN), and the traditional method of MLR were introduced as the downscaling models. DEM, air pressure (PRS), air temperature (TEM), maximum wind speed (WIN), vapor pressure (VAP), and relative humidity (RHU) were used as auxiliary data to obtain downscaled precipitation results (1 km and daily) for the IMERG V06 final-run products in heavy-precipitation events in the plum rain season and extreme-precipitation events during the passage of typhoons over Zhejiang Province.
The objectives of this study were as follows: (1) to obtain downscaled results based on BPNN and SVM and compare the accuracy with MLR-based results and the original IMERG; (2) to explore the feasibility and capability of the two machine learning models on spatially downscaling IMERG at daily scale by validations against rain gauges; and (3) to generate precipitation estimates with high precision and fine spatial resolution based on downscaled results.
Study Area and Datasets
Study Area
This study focuses on Zhejiang Province (Figure 1) between 118°01°08°01°10°C, with the highest temperature in July and the lowest in January. Due to its unique geographical location and climatic conditions, Zhejiang Province has always been prone to being attacked by various kinds of meteorological disasters and is one of the most seriously affected areas by typhoons, rainstorms, floods, and droughts in China (Jin et al., 2017). Therefore, it is necessary and important to study the spatial pattern and characteristic of precipitation in this region by utilizing high-precision precipitation data.
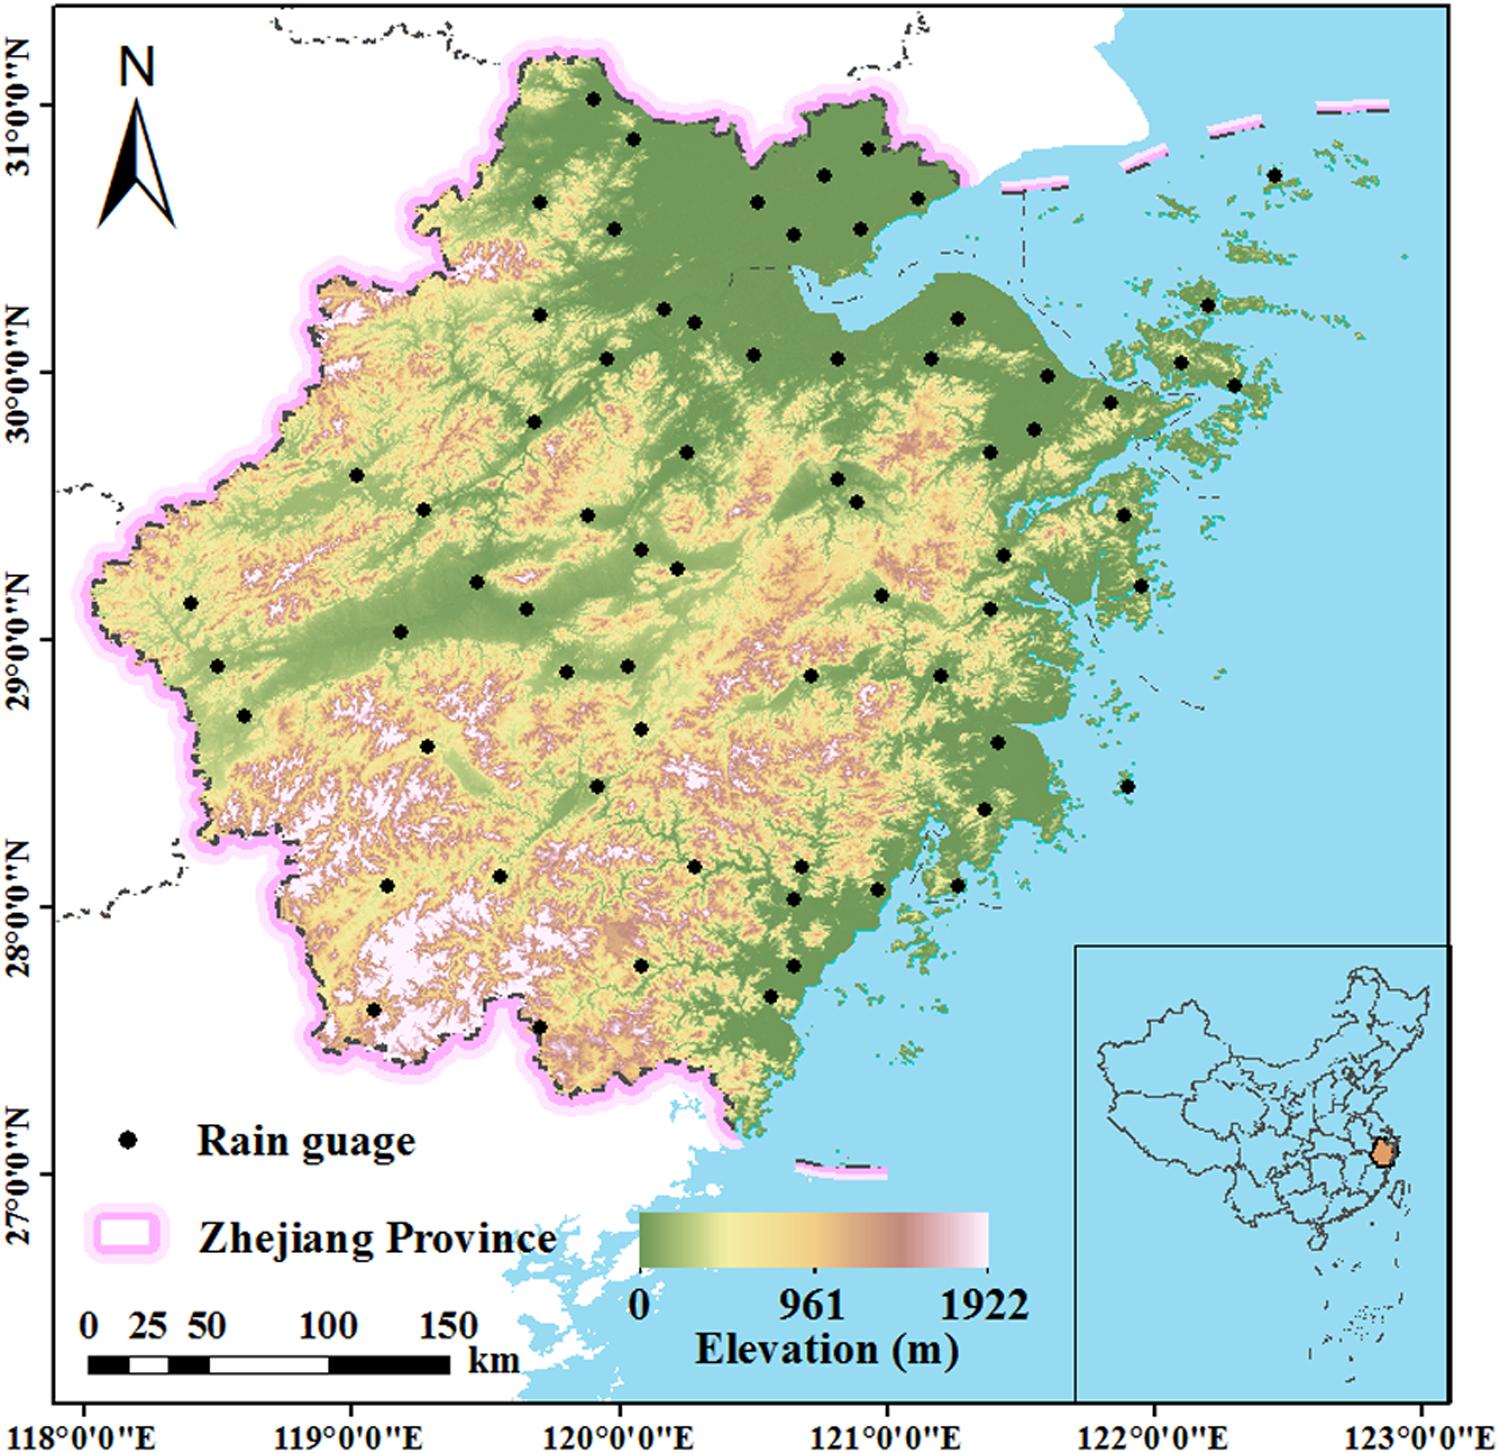
Figure 1. Spatial distribution of 68 ground observation stations and DEM over Zhejiang, Southeastern China.
IMERG
As research-level products, the IMERG V06 final-run datasets have the best quality and accuracy and are released by the GPM mission, which is an international satellite network, to provide a new generation of precipitation observations globally as the successor of TRMM. These datasets intercalibrated, merged, and interpolated all constellation microwave and infrared-based sensors, together with other potential precipitation estimators at fine resolutions for the TRMM and GPM eras over the entire globe and then are calibrated by monthly gauge precipitation data (Hou et al., 2014). The 0.1° and half-hourly products used in this study have a coverage range from 90°N to 90°S and provide precipitation information from June 2000 to present. We downloaded the datasets between 2017 and 2018 from http://pmm.nasa.gov/data-access/downloads/gpm directly and then summed up 30-min data to obtain the daily precipitation.
Ground Observations
The daily ground observations of 2017 and 2018 were downloaded from the China Meteorological Data Sharing Network1. This dataset provides hourly precipitation values (Preci, mm) measured by rain gauges for validations of the downscaled products, as well as the hourly atmospheric variables data including air pressure (PRS, hPa), maximum wind velocity (WIN, m/s), air temperature (TEM, °C), relative humidity (RHU, %), and vapor pressure (VAP, hPa) for establishing relationships with precipitation. All ground observations came from 68 stations (Figure 1) in the study area, and the hourly dataset was aggregated to daily scale.
Topographic Data
We employed DEM as the land surface factor to downscale IMERG V06 final-run products. The DEM data of Zhejiang Province were download from the Shuttle Radar Topography Mission (STRM)2 with the original resolution of 90 m. SRTM is launched by NASA and the National Geospatial-Intelligence Agency (NGA) in February 2000 and provides high-spatial-resolution data with a wide coverage between 56°S and 60°N globally (Rodriguez et al., 2006). The downloaded DEMs were seamlessly mosaicked and resampled to 10 and 1 km by using the bilinear method.
Materials and Methods
Support Vector Machine
Support vector machine put forward by Vapnik, 1998 is based on the principle of structural risk minimization, which attempts to obtain the minimized upper bound on the expected risk (Tripathi et al., 2006). SVM has been widely used in solving classification and regression problems, and it has a good ability and performance to capture nonlinear regression relationships between predictors and predictands, which makes it a suitable choice for downscaling precipitation. SVM has been used to downscale precipitation data at different scales and areas (Anandhi et al., 2008; Chen et al., 2010; Raje and Mujumdar, 2011; Sachindra et al., 2018). The principle of SVM is to map the data into a high-dimensional feature space so as to convert the nonlinear solution in the low-dimensional input space into a linear solution. The detailed introduction of SVM can be found in Vapnik (2000).
Given n data pairs {(x1, y1), (x2, y2),…, (xn, yn)} as the training samples where n is the dimension of input space, xi ∈ x are the input vectors representing point values of six factors here, and yi are output vectors denoting the IMERG data at the corresponding points. The SVM regression equation can be given as
where w is the corresponding weight vector, b is the constant bias, and empty set is the transformation function to map the train samples into a high-dimensional space; w and b are estimated by minimizing the cost function ∂ε shown in Eq. 2, where ϑi and ϑi∗ are slack variables and C is a positive real constant.
Equation 2 is constrained by the following two conditions:
By introducing Lagrange multipliers ai and ai∗ and exploiting the optimality restrictions, the generic equation of Eq. 1 can be rewritten as Eq. 3.
where K(xi, xj) is the inner product kernel function to simplify the computation. The kernel function chosen here was radial basis function (RBF) expressed in Eq. 4. RBF is the most frequently used kernel function in past downscaling researches. It has more parameters and thus less numerical difficulties compared to the polynomial kernel and can map the samples to a higher-dimensional space to solve the nonlinear problems.
where σ is the width parameter of the RBF kernel and controls the radial range of the function. An appropriate σ value can avoid overfitting problems.
Back-Propagation Neutral Network
Backpack neural network designed by Rumelhart and McCelland, 1986 is a multilayer feedforward neural network based on the error back-propagation theory. This network has been widely used in various fields (Ghose et al., 2010; Yang and Luo, 2014; Kong et al., 2016; Wu et al., 2019). BPNN contains three layers: input, hidden, and output layers. And each layer includes several neurons, and the hidden layer connects the input and output layers through weights and thresholds, respectively. In this study, there were seven neurons in the input layer, ten neurons in the hidden layer, and one neutron in the output layer. DEM, PRS, WIN, RHU, VAP, TEM, and the original IMERG were the receiving information for the seven neurons in the input layer. And the output layer’s neuron exported the fitting values of precipitation. Figure 2 shows the architecture of the BPNN model used in this study.
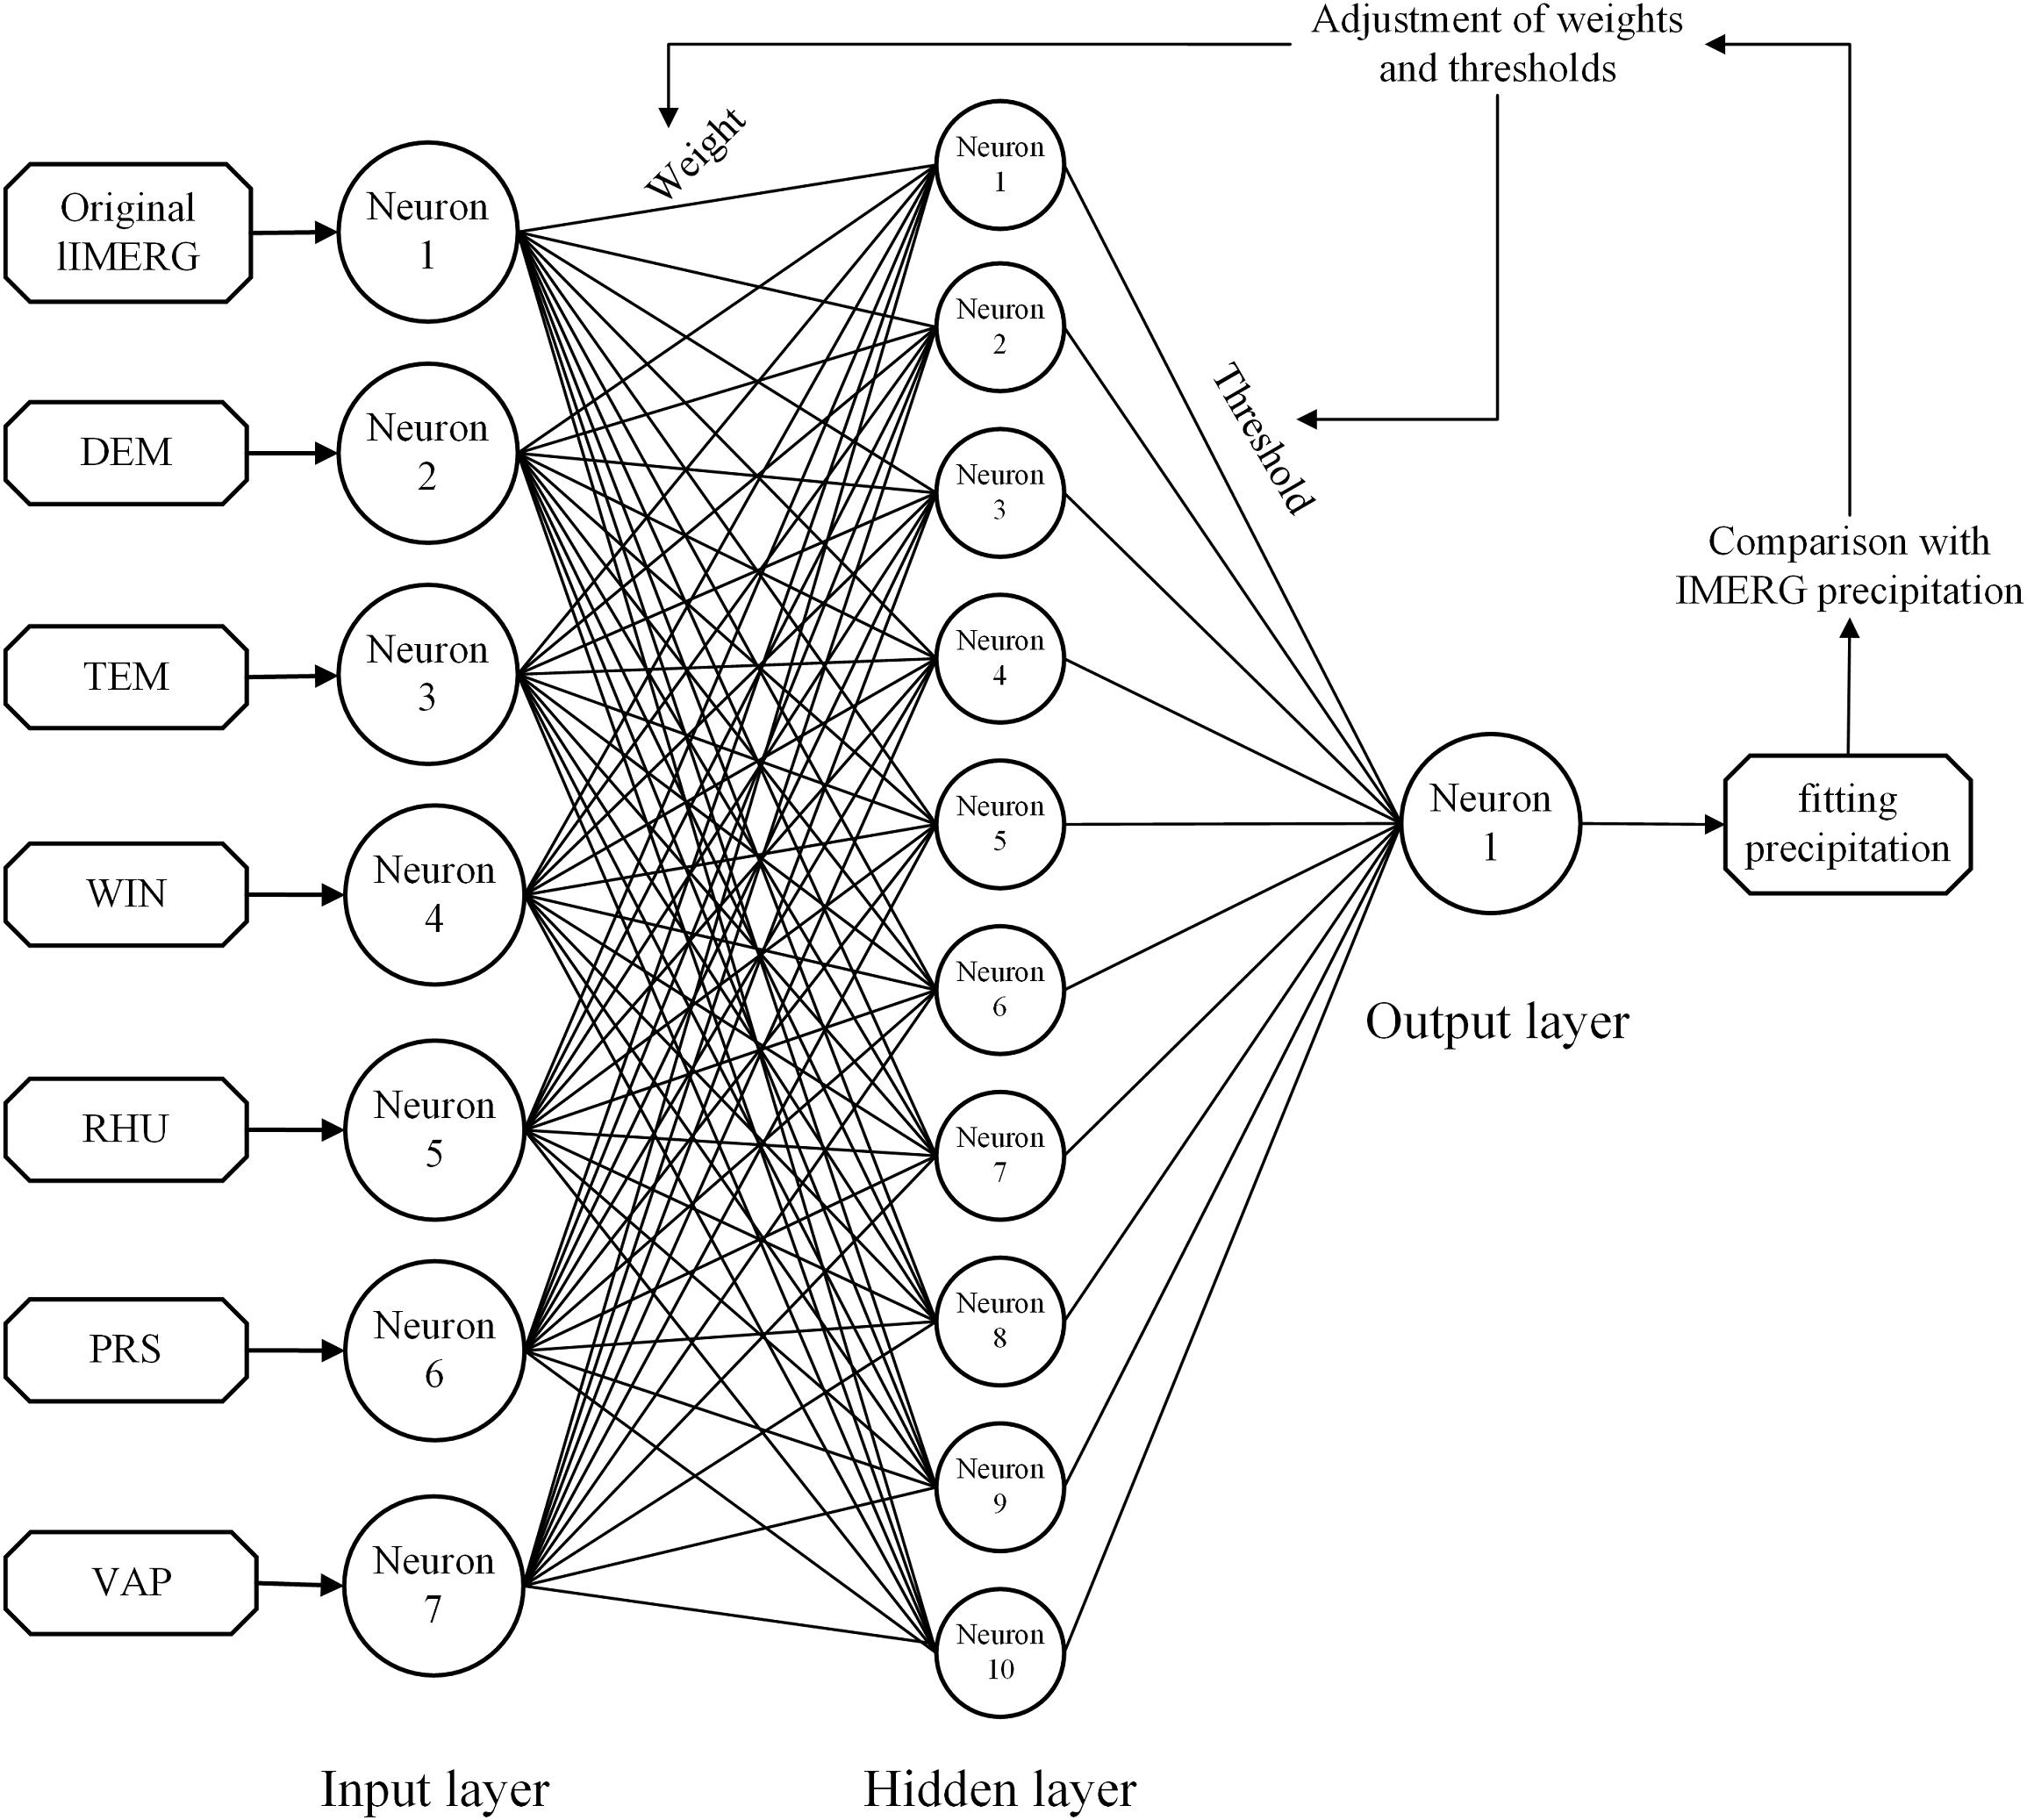
Figure 2. The architecture of the BPNN model.
This BPNN model has two main procedures, feedforward of input signals and back-propagation of errors. In the first step, information in the input layer is processed by the hidden layer and then transformed to the output layer, and values at every neuron are weighted and summed by the purelin transfer function. If the outputs after processing fail to reach the required accuracy, the second step is carried out to continuously correct the weights and thresholds of the network to minimize the error and obtain the optimal fitting results.
Support vector machine and BPNN were used to downscale IMERG data over Zhejiang Province at daily scale. The ground observation datasets used here contain only 68 stations of 2017 and 2018 in Zhejiang Province. Two days were selected, respectively, from 2017 and 2018 as precipitation events for the research. For each precipitation event, an SVM model, BPNN model, and MLR model were built. For detailed information of MLR used here, interested readers are referred to Jia et al. (2009). The four main procedures in the downscaling processes are shown in Figure 3 and as follows.
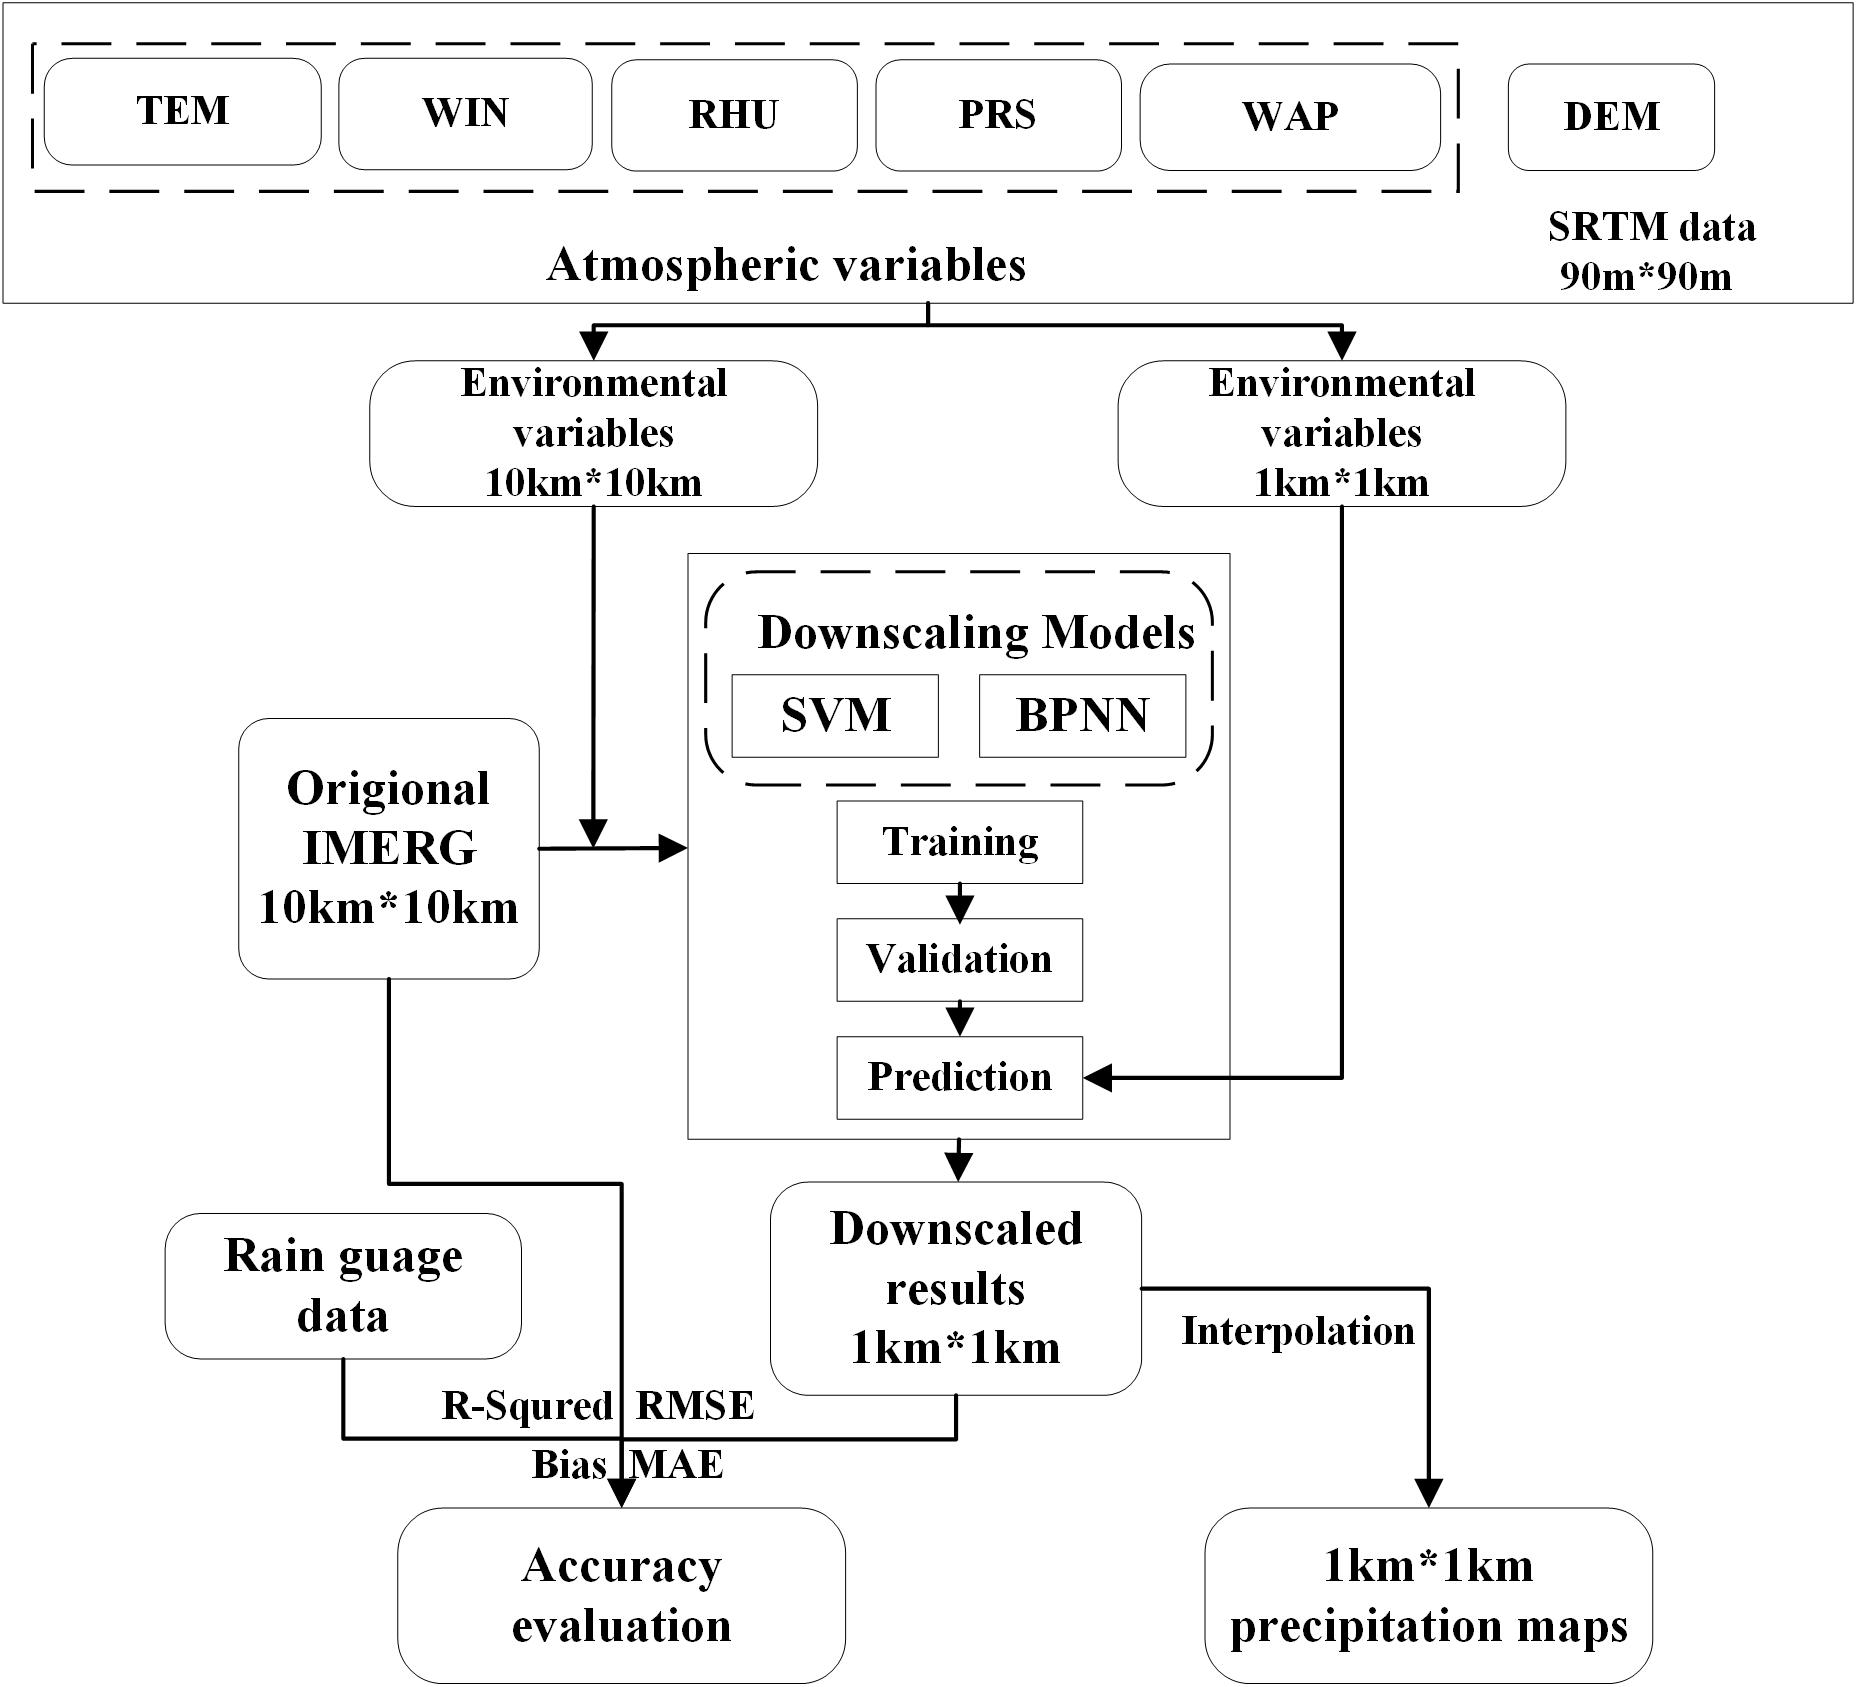
Figure 3. Flowchart of downscaling the original IMERG at daily scale.
(1) Firstly, at each station, we accumulated the hourly rain gauge data into daily values and averaged the values of five atmospheric factors of each day.
(2) Secondly, the above five atmospheric factors were interpolated into 1- and 10-km grids by using the ordinary kriging method based on ArcGIS 10.3. The DEMs were also resampled to 1 and 10 km by using the bilinear method to maintain spatial consistency with the original IMERG. Then, all 10- and 1-km grids were converted into point-based datasets. There are 978 points converted from the 10-km grids over the whole study area.
(3) Thirdly, models were trained by using the 10-km dot-values to build regression relationships between the original IMERG data and six environmental variables for each precipitation event. The 978 points were divided into five equal parts randomly, and the ratio of the number of points for the training dataset and validation dataset was 4:1. The 10-km modelling results of the two models for the selected four events can be seen in the Supplementary Material.
(4) Finally, the fitting models were applied to 1-km dot-values of six environmental variables to predict 1-km precipitation for each precipitation event.
Results
Comparisons of the Downscaled Results Based on SVM and BPNN With the Original IMERG and MLR-Based Downscaled Results
In this study, we separately selected 2 days based on the daily precipitation observed by rain gauges as the downscaling research objects in 2017 and 2018. Those 2 days in 1 year represented a heavy-precipitation event in the plum rain season (event 1 and event 3 in Figure 4) and an extreme-precipitation event during the passage of a typhoon (event 2 and event 4 in Figure 4).
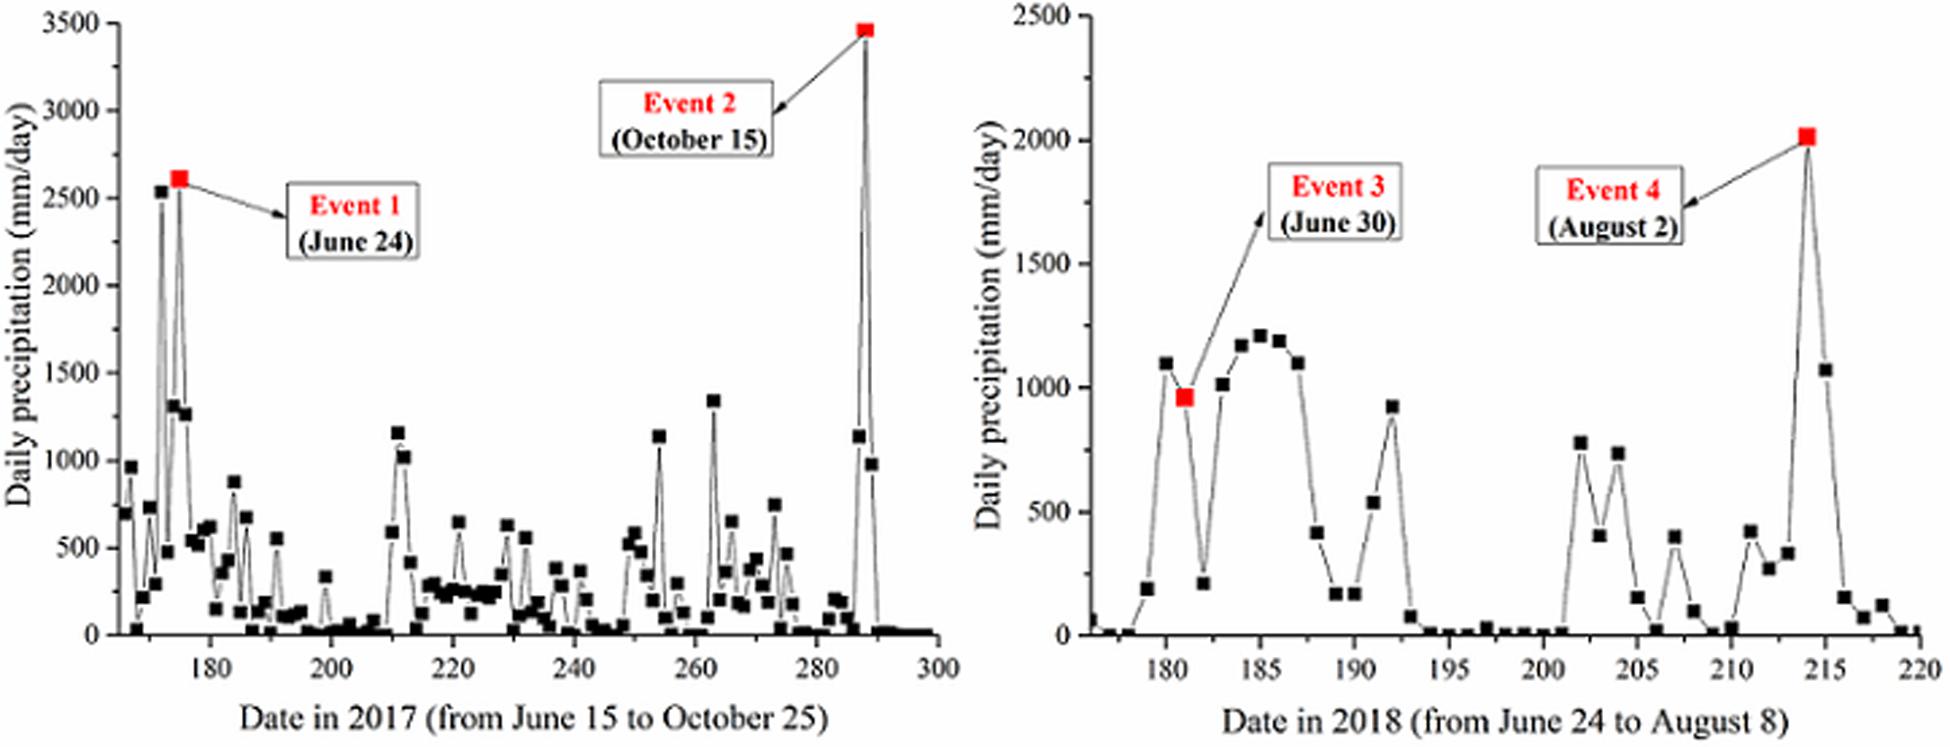
Figure 4. The precipitation of selected events based on ground observations at daily scale (red square marks represent the selected events).
Heavy-Precipitation Events in Plum Rain Season
The plum rain season spanned from June 9 to July 5 in 2017 and June 13 to July 14 in 2018 at Zhejiang Province. June 24 with a daily precipitation of 2,607.2 mm was selected as the heavy-precipitation event for 2017 in this study. To compare the performance of downscaled products and the original IMERG, we validated them against ground observations over the whole study area by coefficients of determination (R2), mean absolute error (MAE), bias, and root mean square error (RSME) (Immerzeel et al., 2009; Duan and Bastiaanssen, 2013; Xu et al., 2015; Ma et al., 2017b). Figures 5A,C,E,G show the validations of the original IMERG, the BPNN-based downscaled product, the SVM-based downscaled product, and the MLR-based downscaled product in event 1, respectively. The original IMERG had a good correlation with ground-based observations (R2∼0.649). Compared to the original IMERG, the precipitation prediction accuracy was slightly improved by the BPNN-based product and significantly improved by the SVM-based product. And they both had increased R2 (0.014 for the former and 0.052 for the latter) and decreased bias (7.550% for the former and 7.461% for the latter) and RMSE (0.131 for the former and 1.605 for the latter). The MLR-based product did not improve the accuracy considering the R2. Figure 5I shows the numerical distribution characteristics of five precipitation datasets. Compared to the original IMERG, the deviations in the interquartile range were smaller for all downscaled datasets considering the box widths. The median and third quantiles of the SVM-based dataset were closer to those of rain gauges than other precipitation datasets, indicating that the SVM-based dataset was more accurate in predicting high precipitation values. There was no significant differences in the numerical distribution between the BPNN-based dataset and MLR-based dataset.
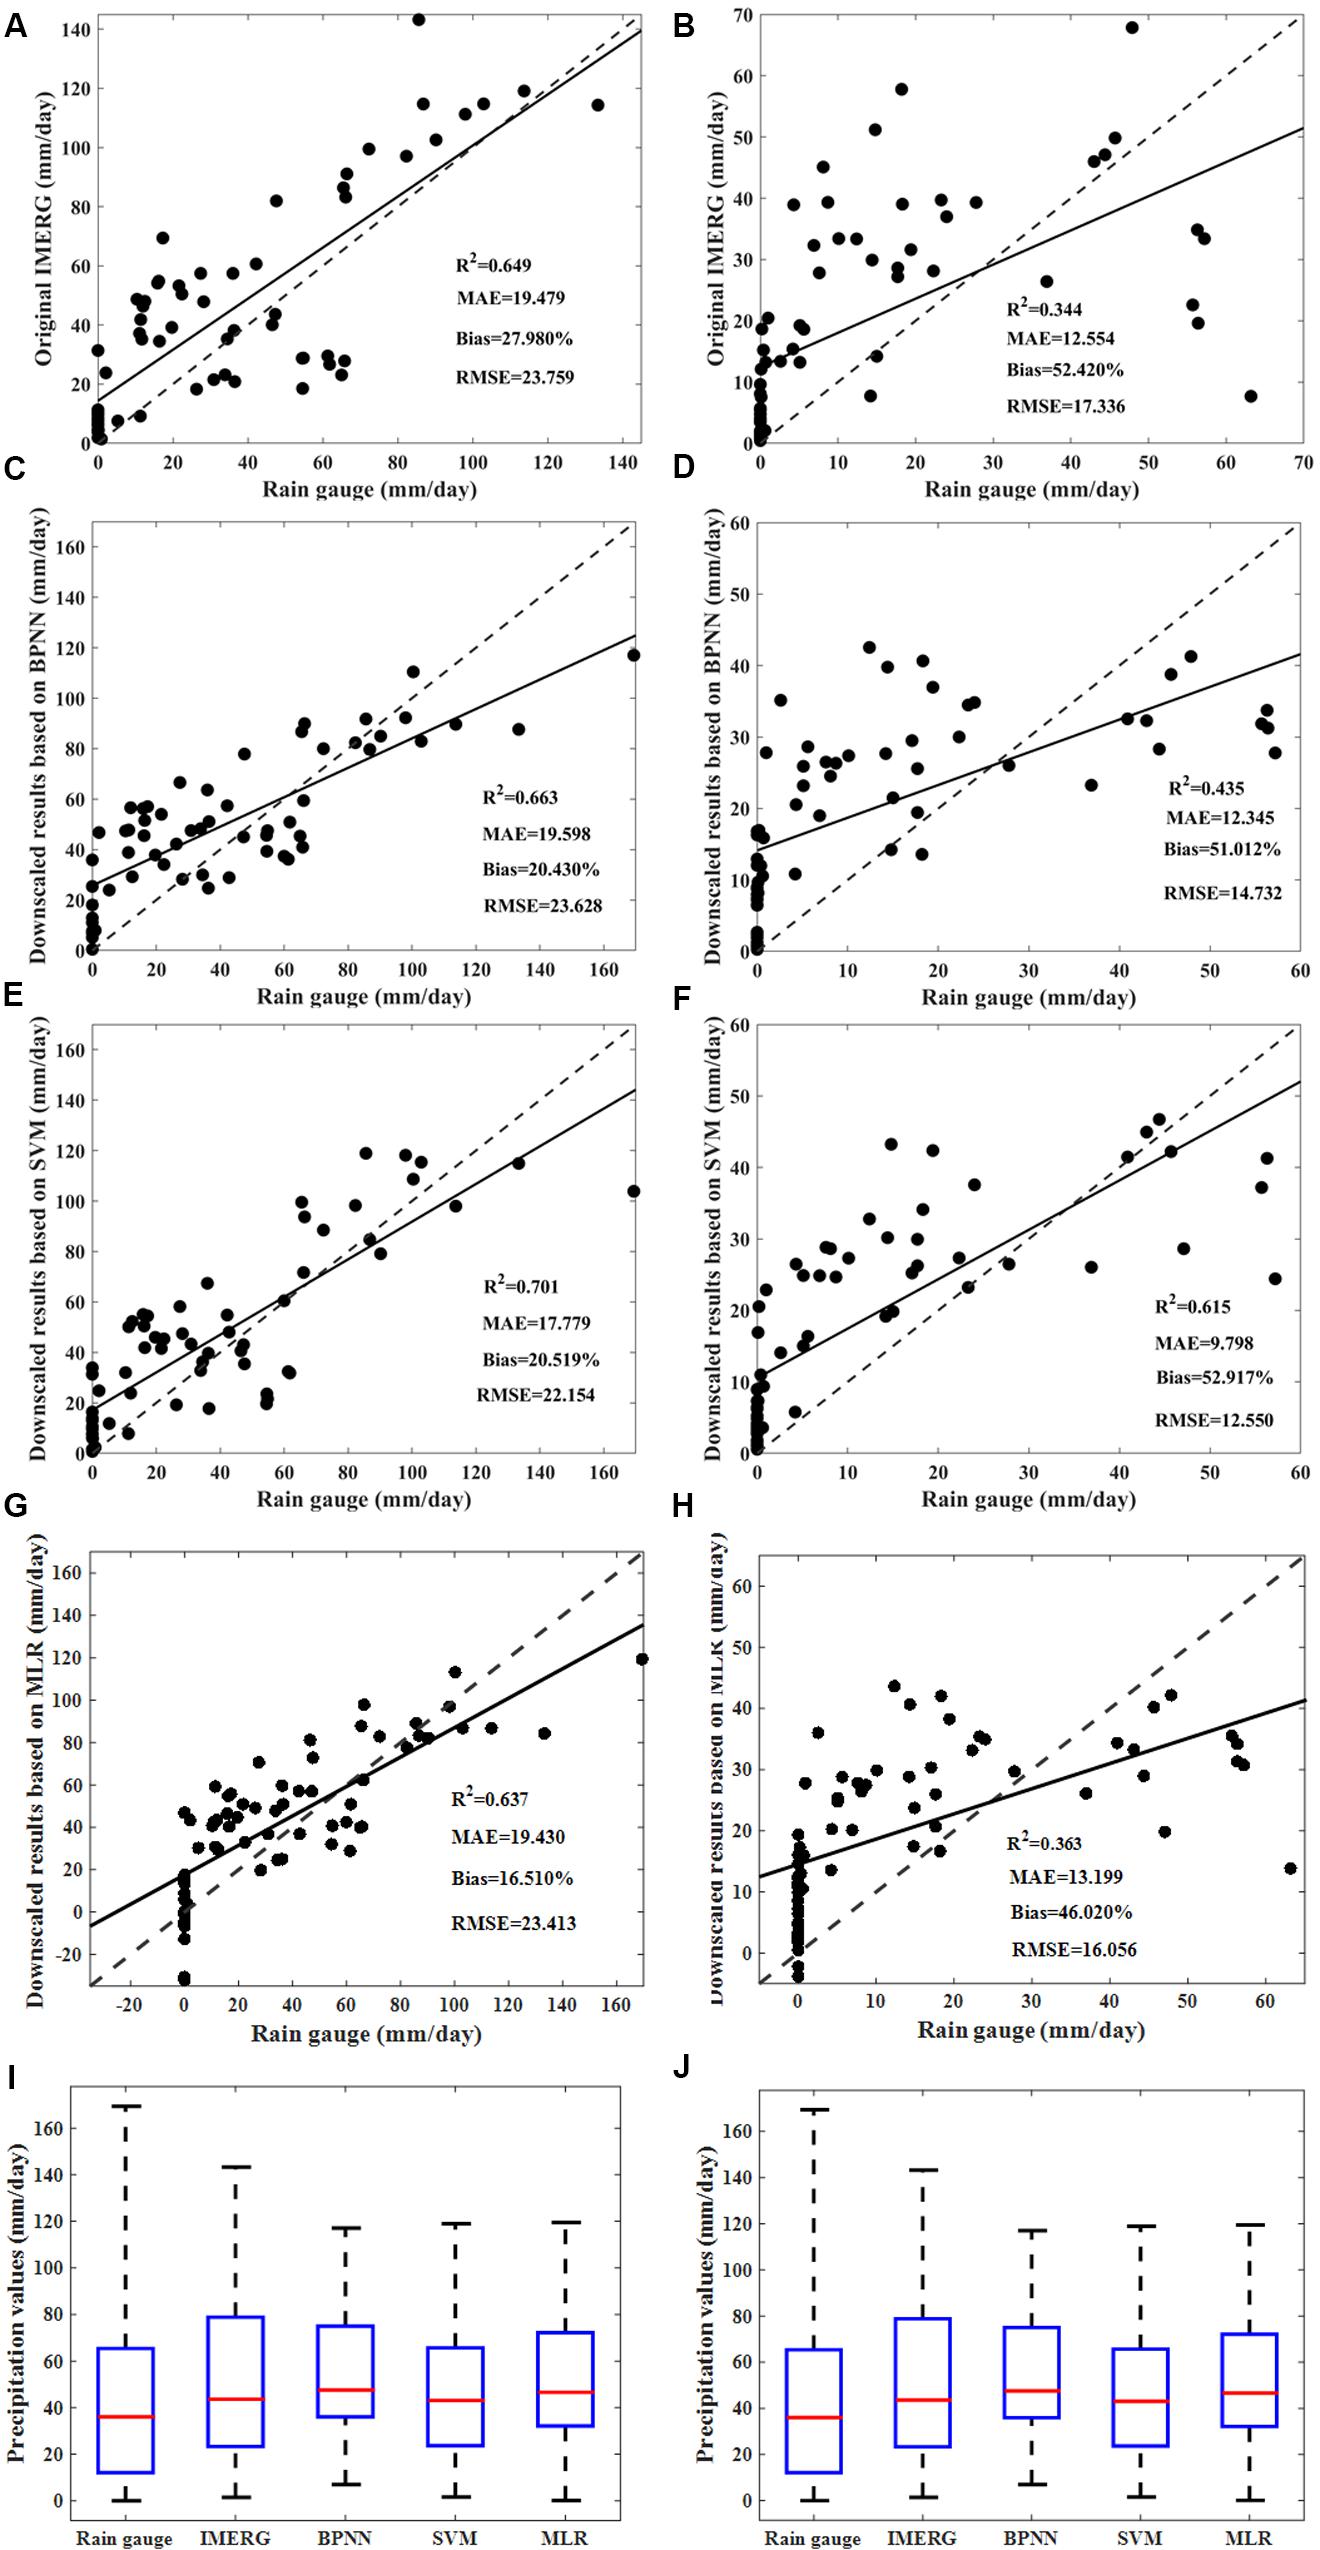
Figure 5. Validations and comparisons of (A,B) the original IMERG in event 1 and event 3, (C,D) downscaled results by BPNN in event 1 and event 3, (E,F) downscaled results by SVM in event 1 and event 3, (G,H) downscaled results by MLR in event 1 and event 3 against ground observations, and (I,J) boxplots of the five precipitation datasets in event 1 and event 3 over Zhejiang Province.
June 30 with a daily precipitation of 960.6 mm was selected as the heavy-precipitation event for 2018 in this study. Though the four satellite-based products all slightly overestimated the low precipitation values with relatively high biases (52.420% for the original IMERG, 51.012% for the BPNN-based product, 52.917% for the SVM-based product, and 46.020% for the MLR-based product, shown in Figures 5B,D,F,H, respectively). The downscaled products based on machine learning methods outperformed the original IMERG significantly, especially the SVM-based product with R2 increased by 0.271, MAE decreased by 2.756, bias decreased by 0.497%, and RMSE decreased by 4.786, shown in Figure 5F. While the MLR-based product slightly outperformed the original IMERG considering the R2, bias, and RMSE. Figure 5J portrays the statistical characteristics of the five datasets; all satellite-based datasets had higher quartiles than rain gauges, indicating that they might overestimate the precipitation values. The BPNN-based dataset and MLR-based dataset had the larger first quantiles than other datasets. These two datasets had poorer performance in predicting the low precipitation values. All downscaled datasets had smaller third quantiles than the original IMERG, and they reduced the degree of the overestimation of the original IMERG at high precipitation values.
Extreme-Precipitation Events During the Passage of Typhoons
As a coastal province, Zhejiang is vulnerable to typhoons which bring a surge in precipitation. A typhoon named Kanu hit Zhejiang from October 14 to 16 in 2017, and we chose the 15th with a 3,472.8-mm daily precipitation to study the abilities of the three satellite-based products in predicting extreme precipitation. Figures 6A,C,E,G show the fittings of original IMERG, BPNN-based product, SVM-based product, and MLR-based product with rain gauges in event 2, respectively. The original IMERG, BPNN-based product, and MLR-based product all had large deviations from ground observations with relatively high bias (more than 30%). However, the BPNN-based product and MLR-based product both had slightly outperformed the original IMERG with higher R2 and smaller bias shown in Figures 6C,G, respectively. The SVM-based product greatly outperformed other products considering all four indices (R2∼0.615, MAE∼15.131, bias∼17.062%, and RMSE∼25.898) shown in Figure 6E. The boxplot in Figure 6I portrays the numerical distribution characteristics of the five precipitation datasets. The SVM-based dataset and the original IMERG had similar numerical distribution characteristics with the rain gauges. While the BPNN-based dataset and MLR-based dataset had smaller box widths and smaller third quartiles, they had limited abilities to estimate high precipitation values than other products.
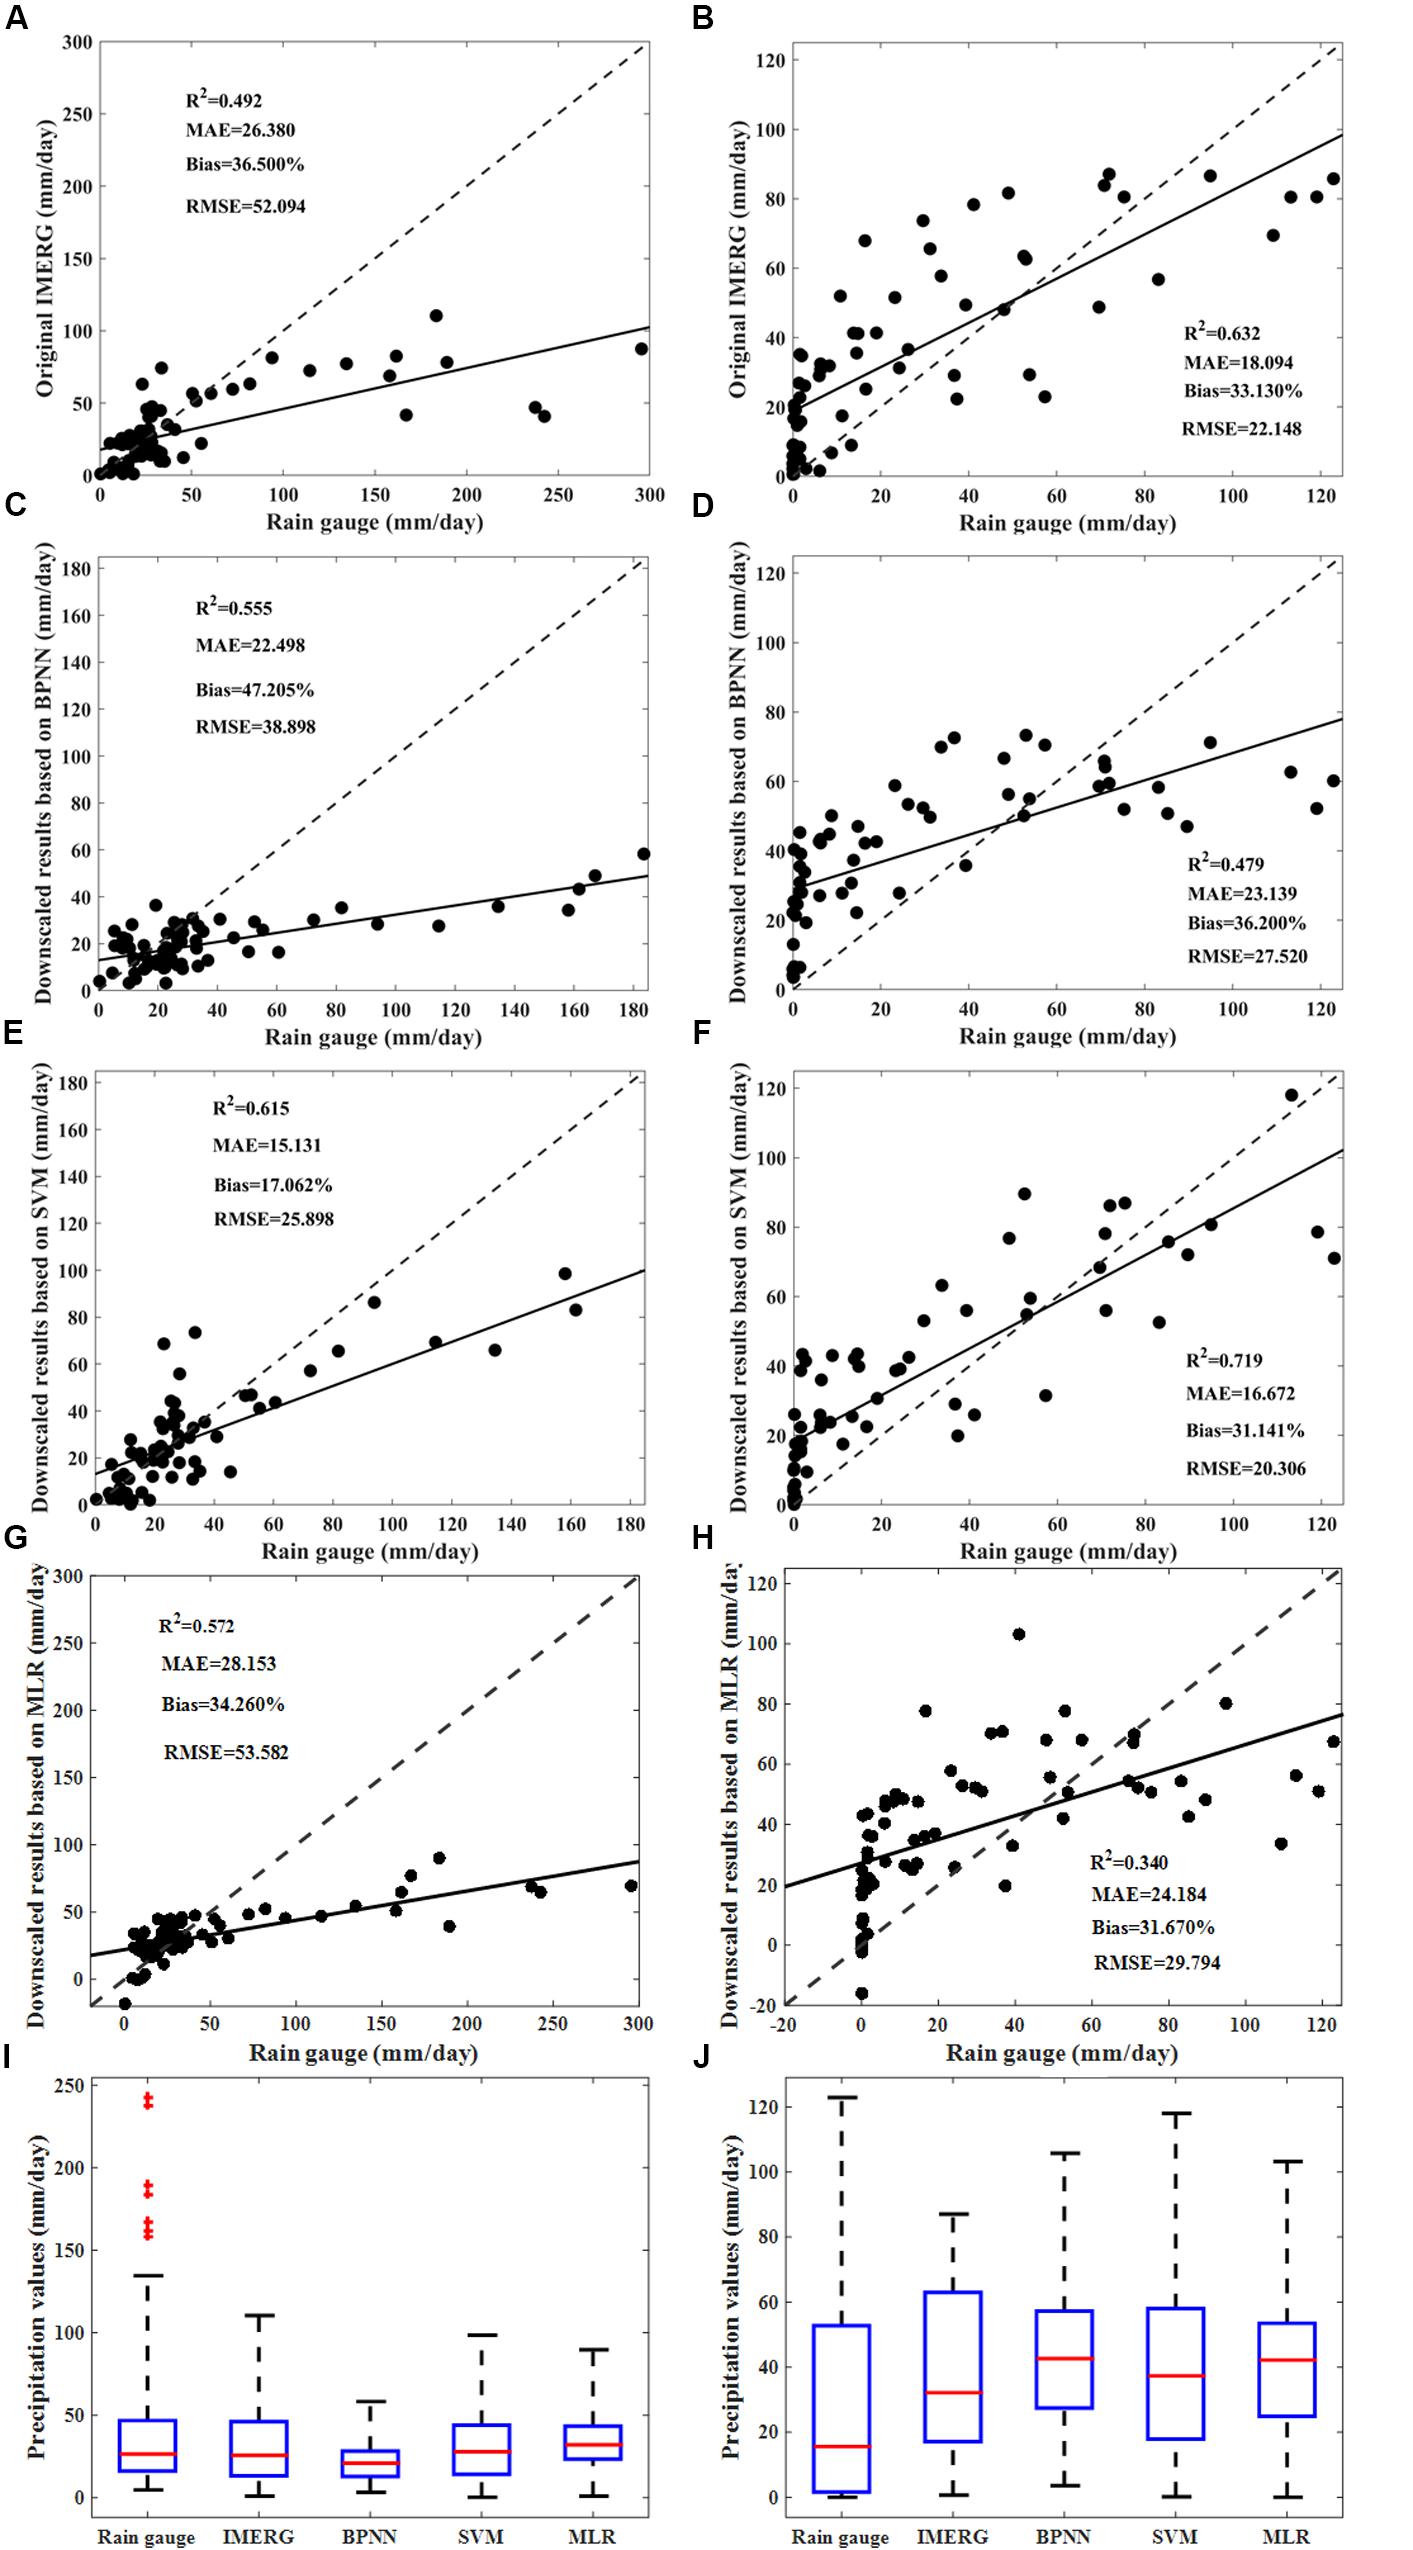
Figure 6. Validations and comparisons of (A,B) the original IMERG in event 2 and event 4, (C,D) downscaled results by BPNN in event 2 and event 4, (E,F) downscaled results by SVM in event 2 and event 4, (G,H) downscaled results by MLR in event 2 and event 4 against ground observations, and (I,J) boxplots of the five precipitation datasets in event 2 and event 4 over Zhejiang Province.
The typhoon Lark hit the study area from August 1 to 4 in 2018, and August 2 with a 2,012.2-mm daily precipitation was selected as the extreme event in this study. Figures 6B,D,F,H portray the validations of four satellite-based products against ground observations. The SVM-based downscaled product had the best performance with the highest R2 (0.719) and lowest MAE (16.672), bias (31.141%), and RMSE (20.306), then followed by the original IMERG. The MLR-based product had the poorest performance with the smallest R2 (0.340) and highest RMSE (29.794) shown in Figure 6H. The BPNN-based product and MLR-based product both had poorer performance compared to the original IMERG considering the R2, MAE, and RMSE. The boxplot in Figure 6J shows that rain gauges had plenty low precipitation values than that being overestimated by all satellite-based products considering the lower first and middle quartiles. Besides, the MLR-based dataset and BPNN-based dataset both had the higher first and middle quartiles than other datasets. They had poorer performance in predicting low precipitation values.
The Spatial Patterns of the Original IMERG and Three Downscaled Products
The Spatial Patterns of Four Products in the Heavy-Precipitation Events in Plum Rain Season
The ordinary kriging method was applied to interpolate the downscaled point values into precipitation maps at 1-km spatial resolution. Figures 7A,C,E,G show the precipitation spatial maps of the original IMERG and three downscaled products in event 1. All satellite-based products had similar spatial patterns and well captured the heavy precipitation in the midwestern area. However, they all had overestimations against the rain gauges shown in Figure 7, especially for the low-intensity precipitation below 36 mm in the eastern regions. All downscaled products had finer spatial resolution than the original IMERG; the BPNN-based product and MLR-based product had highly similar spatial distribution characteristics of precipitation. And they had less precipitation spatial characteristics in the local details compared to the SVM-based product and overestimated the precipitation in the surrounding areas of the heavy-precipitation regions compared to the original IMERG.
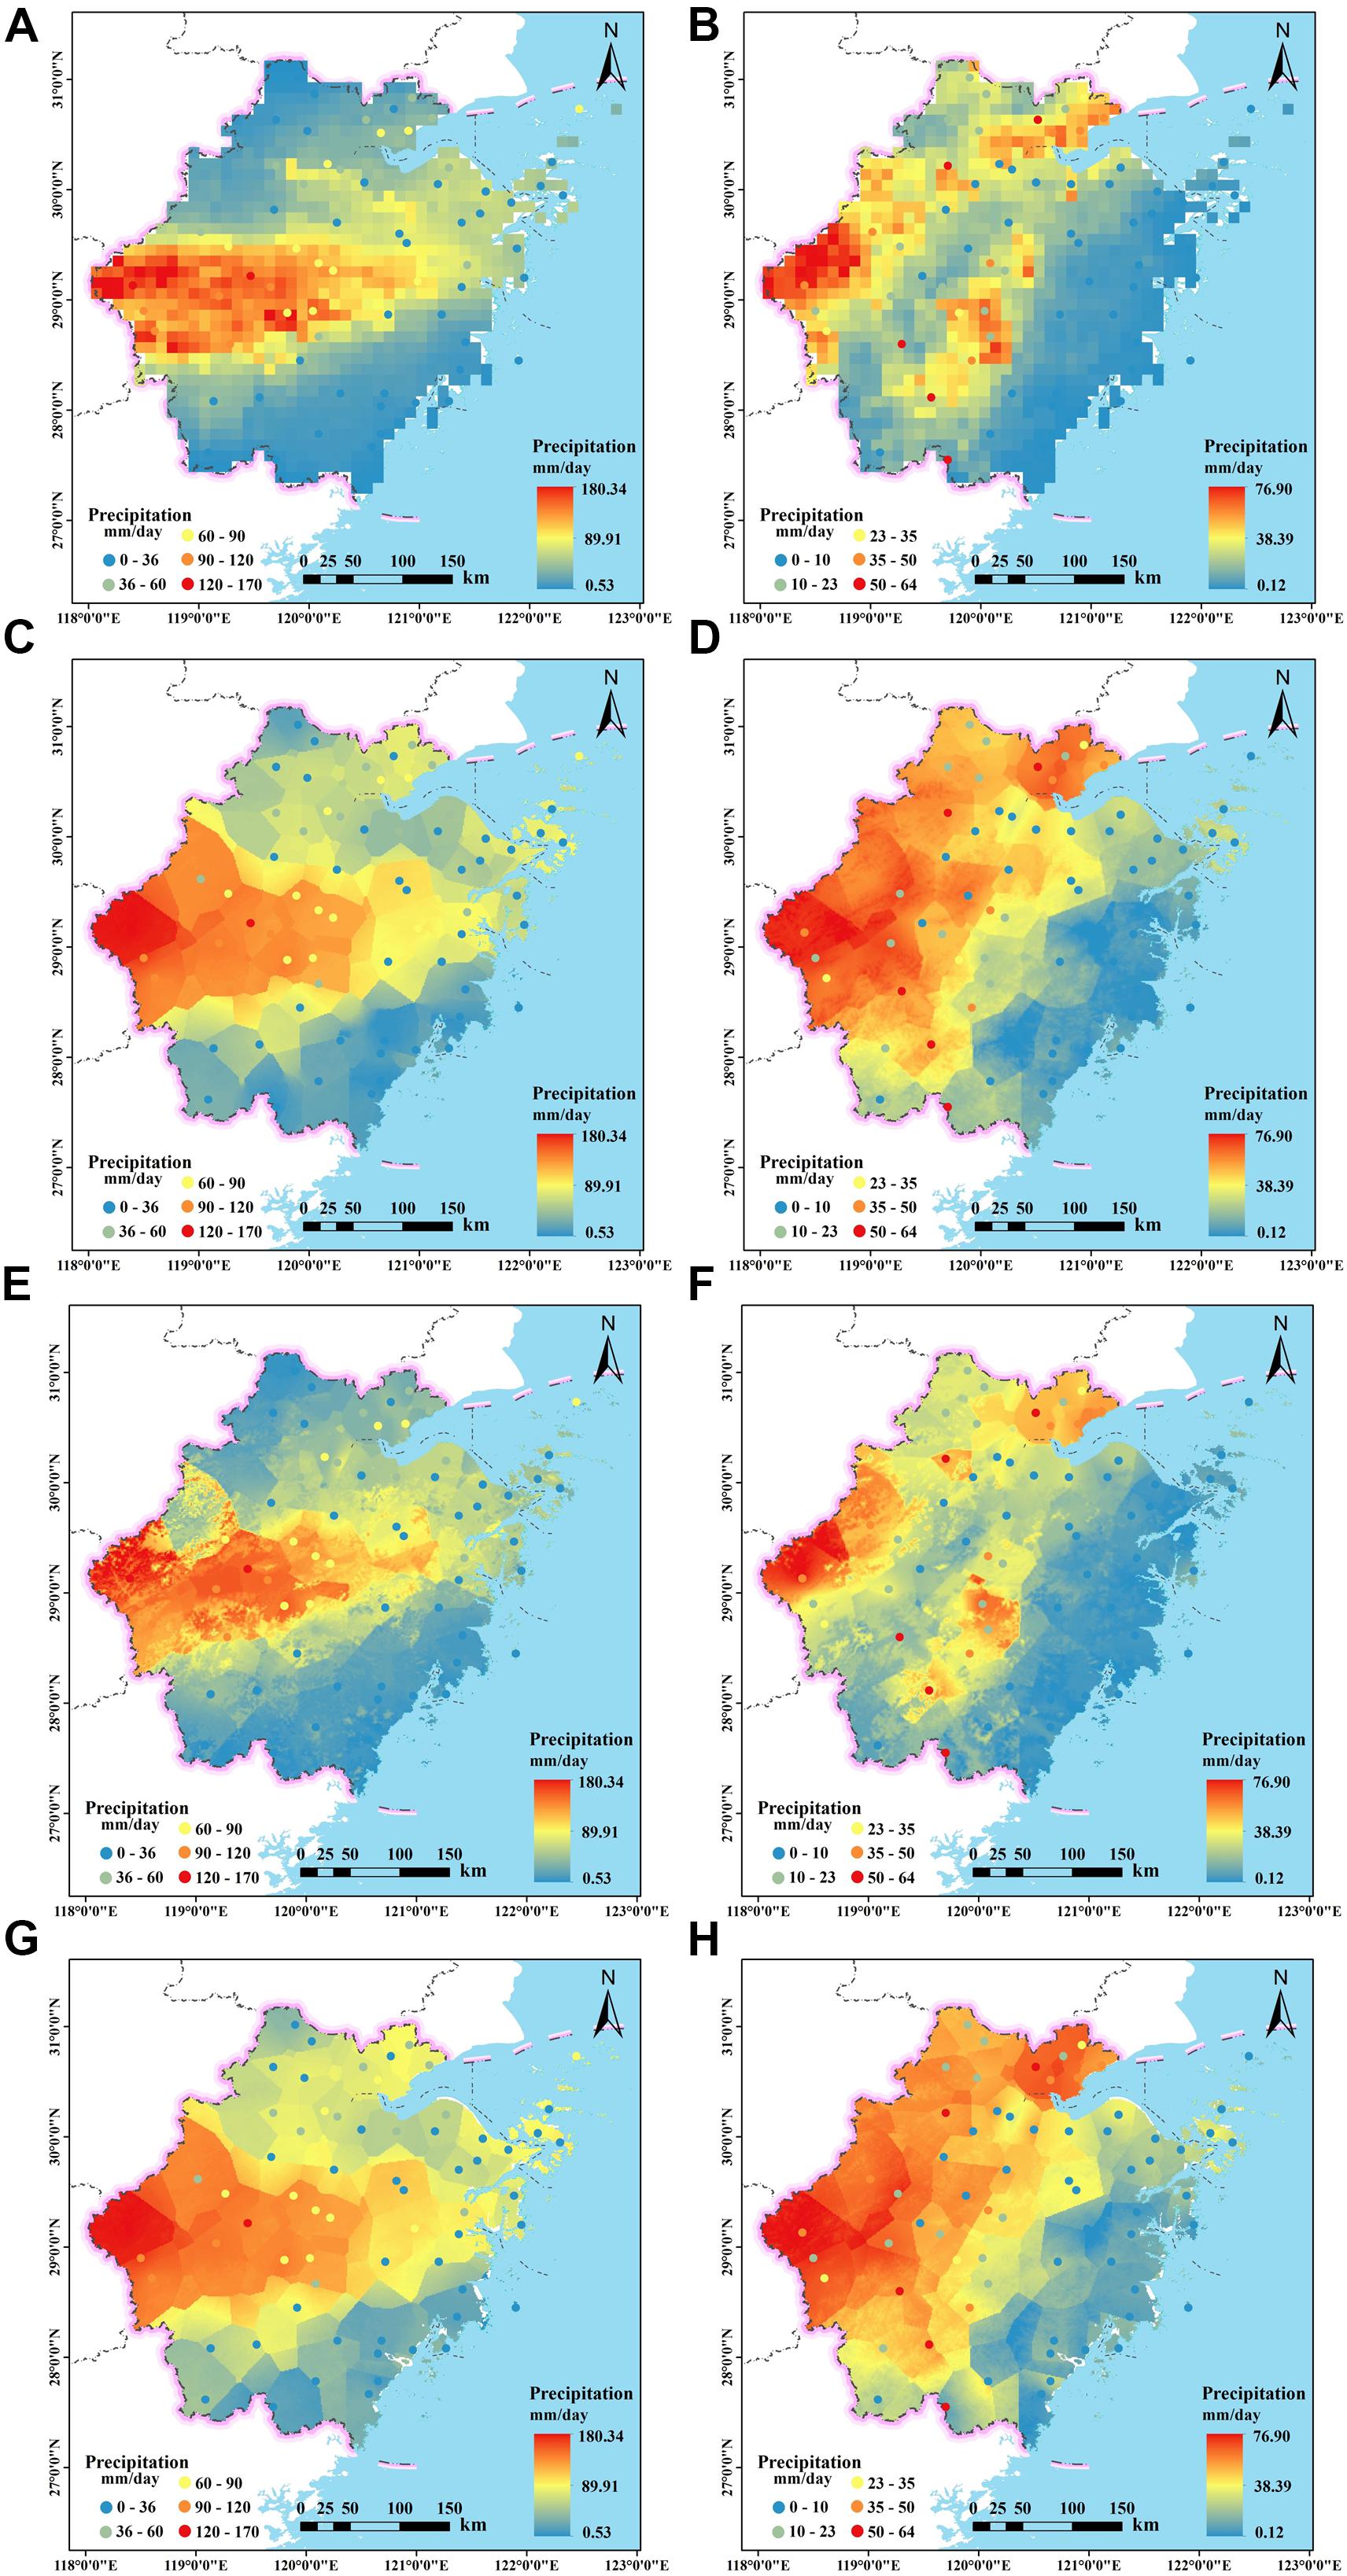
Figure 7. The spatial patterns of (A,B) the original IMERG in event 1 and event 3, (C,D) BPNN-based downscaled results in event 1 and event 3, (E,F) SVM-based downscaled results in event 1 and event 3, and (G,H) MLR-based downscaled results in event 1 and event 3 over Zhejiang Province.
Figures 7B,F show that the original IMERG and SVM-based downscaled product had similar patterns with two heavy-precipitation regions distributed obliquely from the northeast to southwest and in the central-southern area, respectively. The BPNN-based product and MLR-based product had highly similar spatial patterns. The amount of precipitation of the two products decreased from northwest to southeast with the heaviest precipitation concentrated in the midwestern corner. And they both overestimated the low precipitation values below 10 mm compared to the original IMERG. There were overestimations in the original IMERG when the actual precipitation was above 35 mm, and all the downscaled products slightly rectified the overestimation of the original IMERG at high precipitation values.
The Spatial Patterns of Four Satellite-Based Products in the Extreme Events During the Passage of Typhoons
Figure 8 shows the spatial precipitation maps of the four IMERG products in event 2 and event 4. In event 2, all satellite-based products (Figures 8A,C,E,G) well captured the heavy precipitation in the northeastern regions though they overestimated the daily precipitation values below 20 mm. The similar spatial patterns with high precipitation values concentrated in the northeast coast regions for the original IMERG and SVM-based products were quite inconsistent with the other two products. The BPNN-based product and the MLR-based product had highly similar spatial patterns. They both had higher estimates than the original IMERG in the southeastern coastal areas, and the precipitation estimates diminished from the east to west.
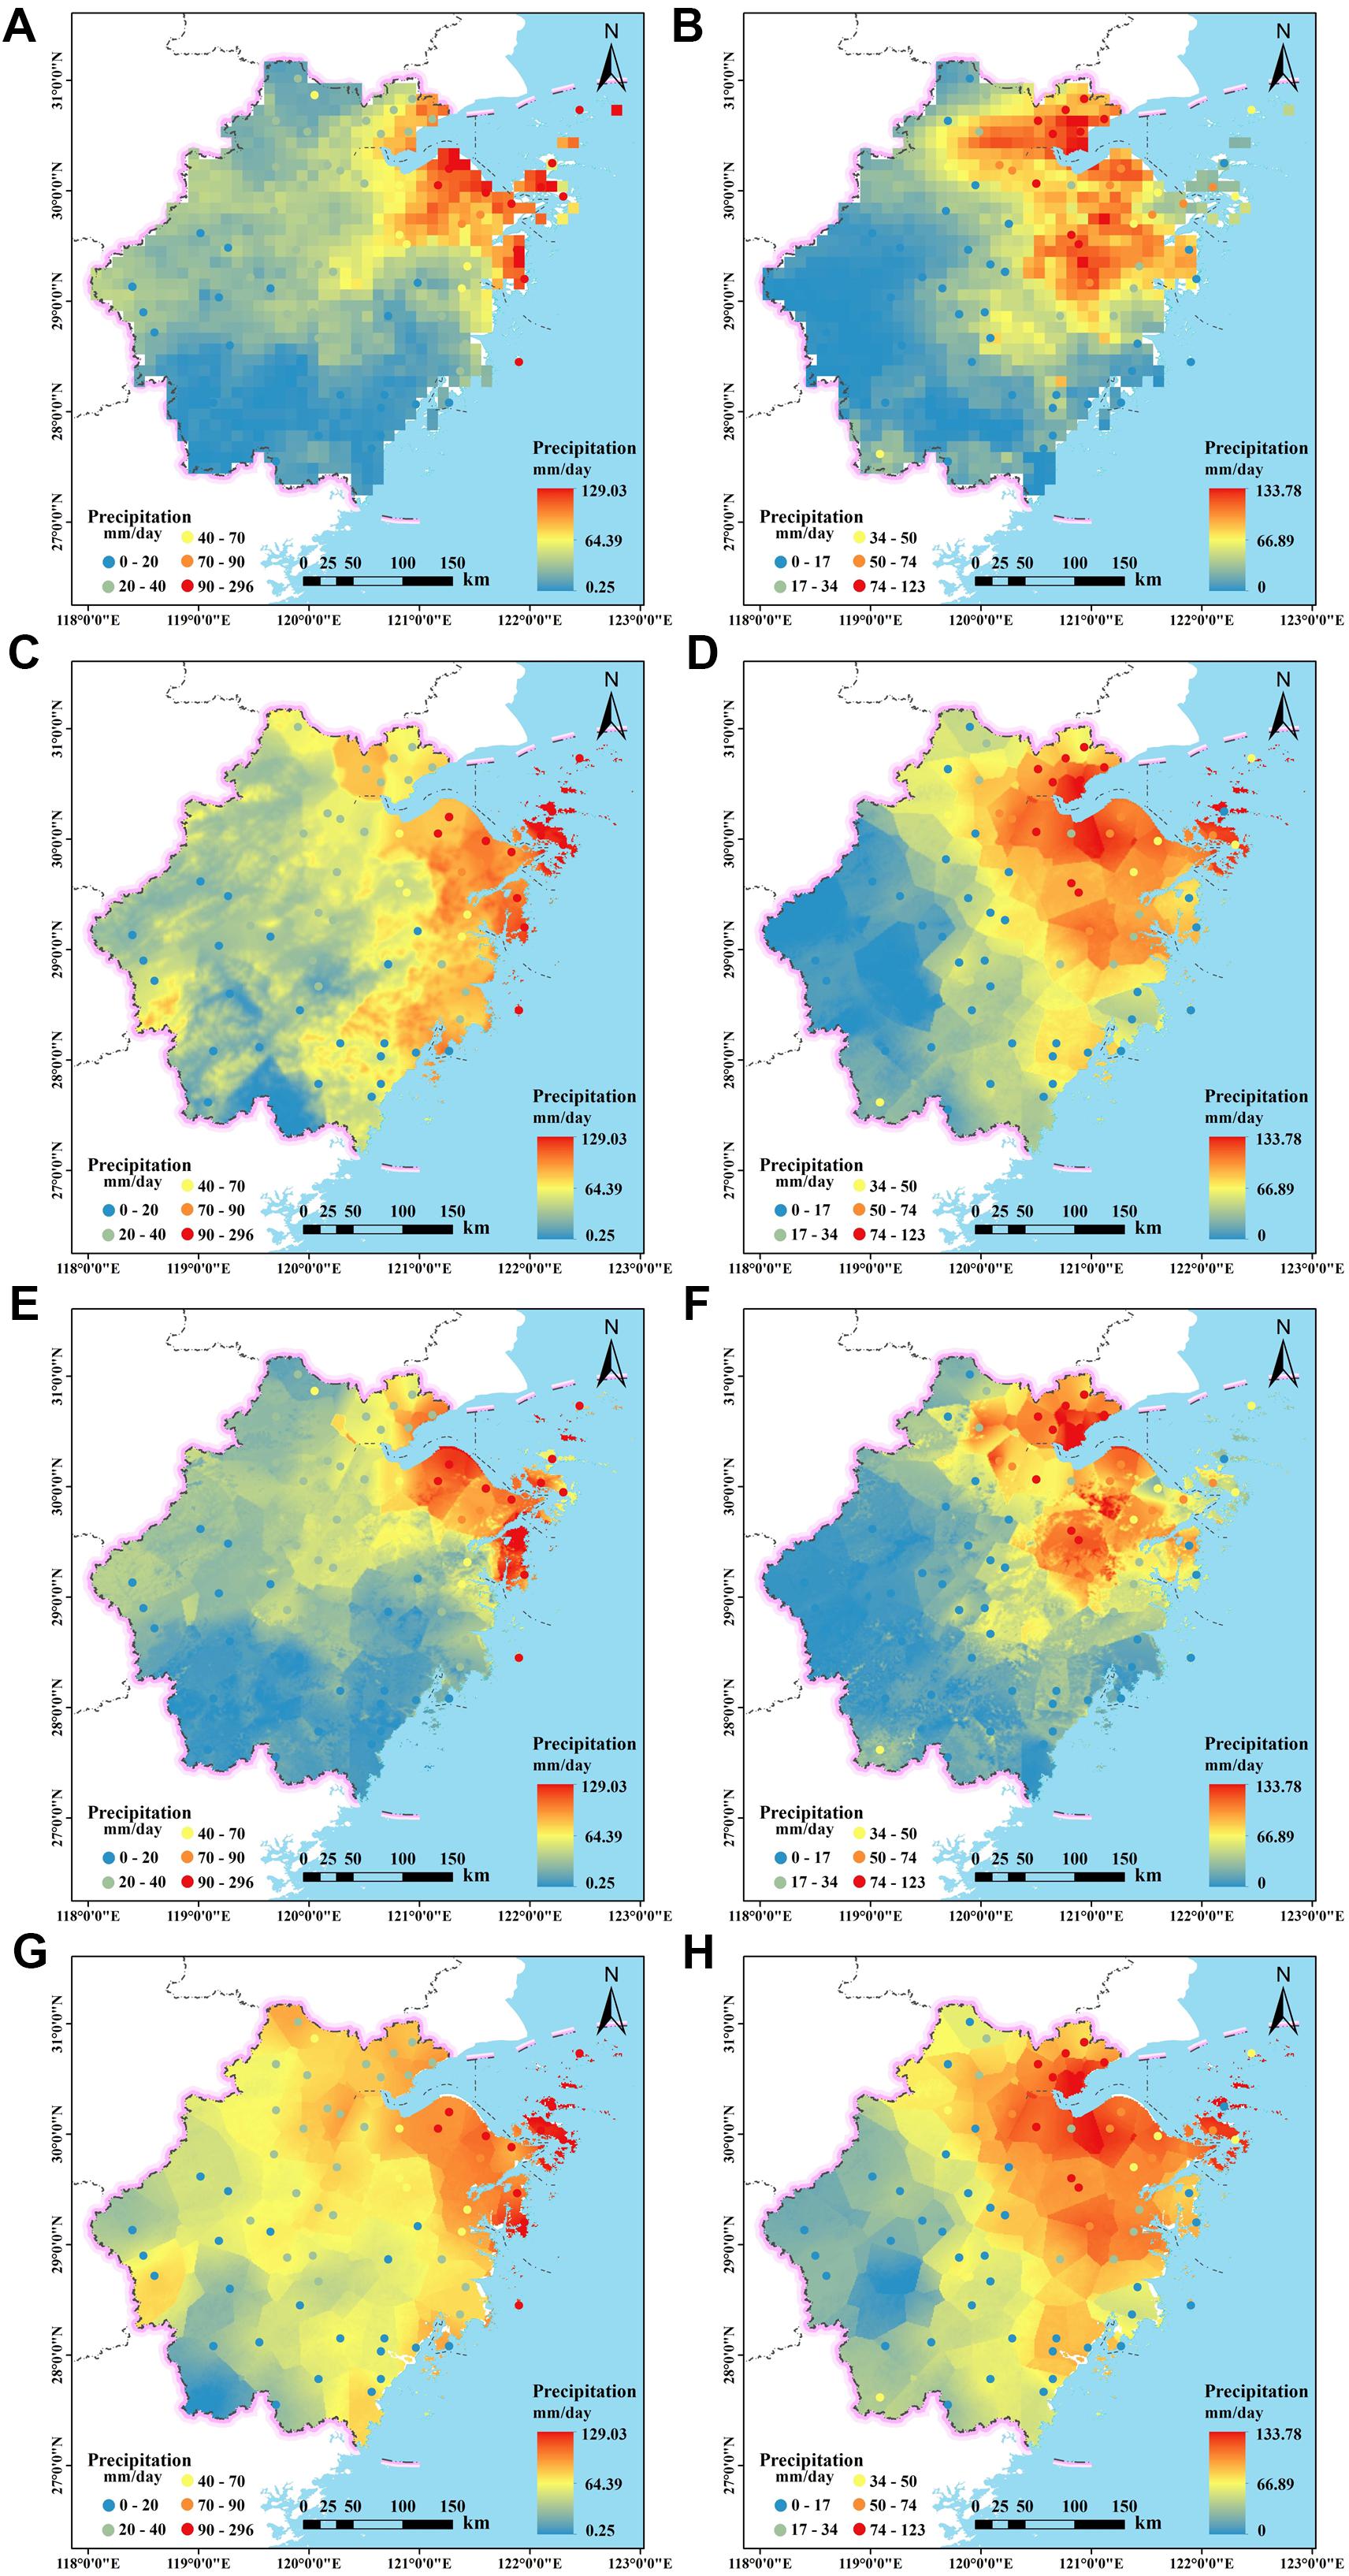
Figure 8. The spatial patterns of (A,B) the original IMERG in event 2 and event 4, (C,D) BPNN-based downscaled results in event 2 and event 4, (E,F) SVM-based downscaled results in event 2 and event 4, and (G,H) MLR-based downscaled results in event 2 and event 4 over Zhejiang Province.
In event 4, all products (Figures 8B,D,F) had similar spatial patterns with precipitation decreased from the northeast to southwest. And they all well captured the heavy daily precipitation in the northeast coast regions. However, they still overestimated the low precipitation values below 17 mm. Besides, the BPNN-based product and MLR-based product overestimated the precipitation more significantly in the surroundings of the northeast coast regions with heavy precipitation.
Discussion
The Contributions of Environment Variables to Downscaled Results
We used six environmental variables to downscale the original IMERG at daily scale. The contribution of each variable to the downscaled results in four precipitation events are shown in Table 1 in the form of Pearson correlation coefficients (CC). For event 1 and event 3, TEM and RHU had greater contributions considering the absolute value of CC, which was irrelevant with the downscaling models. The plum rain season for Zhejiang Province usually occurs from June to July in the hot summer with typical characteristics of high air humidity and air temperature. So there were strong correlations between precipitation events and TEM as well as RHU in this stage. Therefore, TEM and RHU were crucial for downscaling IMERG data in the plum rain season. For event 2 and event 4, PRS, RHU, and VAP contributed more than other variables. Moreover, VAP tended to have more contribution in the BPNN model and RHU in the SVM model. The contribution of DEM was larger in event 2 and event 4 than in event 1 and event 3 for all models. Typhoons were tropical cyclones with huge amounts of heat and water vapor and brought sudden heavy precipitation whose distribution was susceptible to the effect of terrain friction. Therefore, DEM, PRS, and VAP were critical variables for downscaling IMERG during the passage of typhoons. The contribution of DEM was probably underestimated by the values of CC in Table 1.
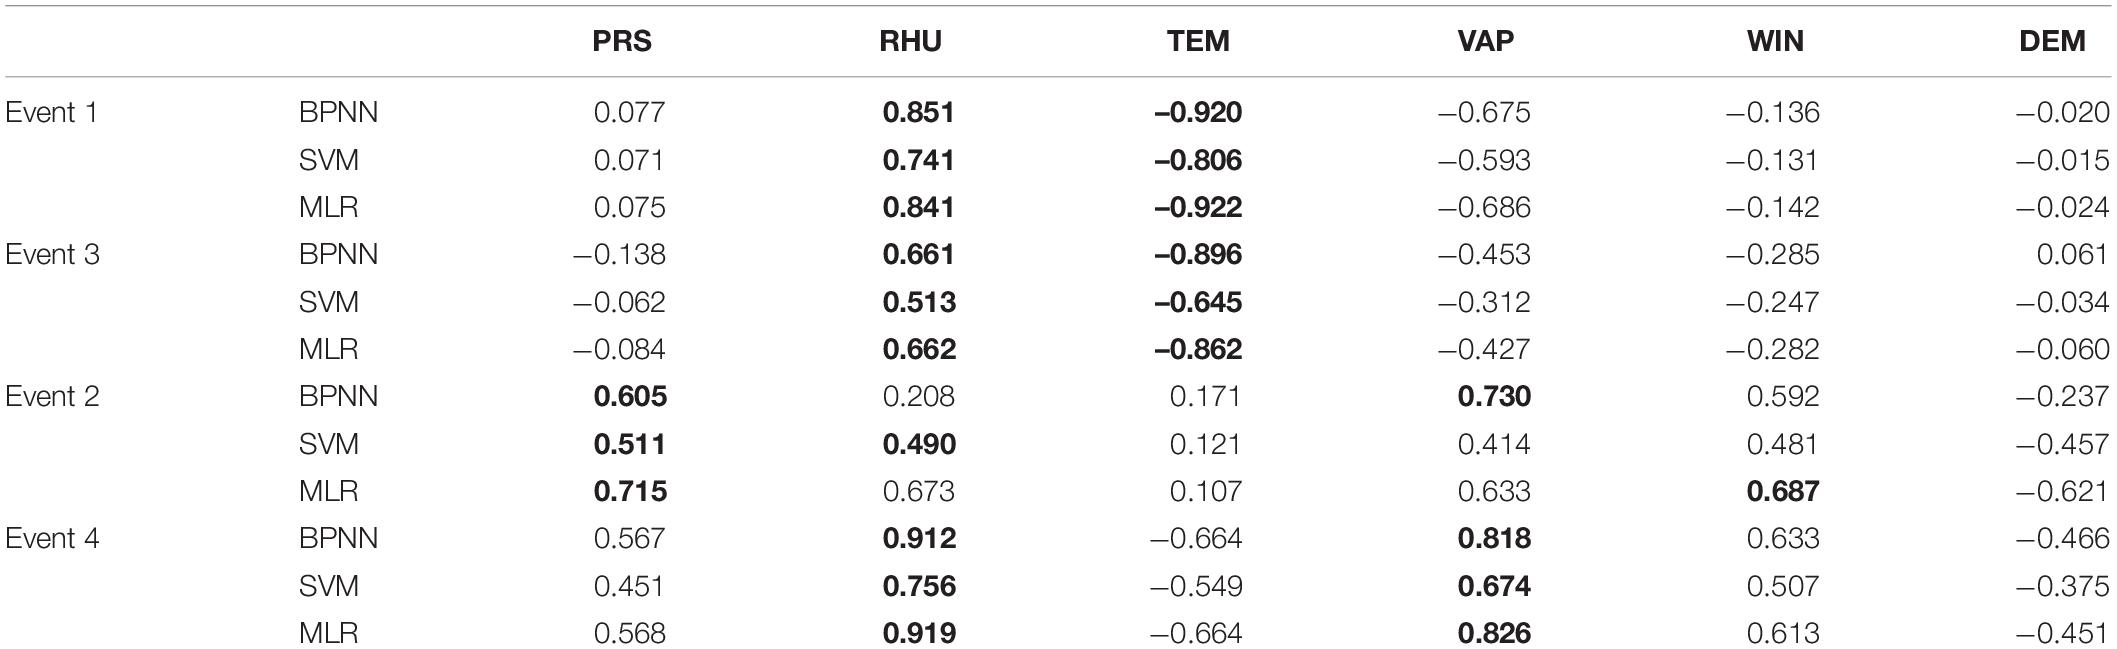
Table 1. The Pearson correlation coefficients (CC) between the six factors and the two downscaled datasets in four precipitation events (the two largest absolute CC values were in bold for each event).
Environmental variables used in this study affected not only the numerical characteristics of downscaled results but also the spatial characteristics of the downscaled precipitation map. Take event 1 for example, the texture and spatial patterns of the three downscaled maps in Figures 9A–C were highly consistent with those of maps of two highest contribution factors (TEM and RHU) in Figures 9D,E). Compared to the BPNN-based map and MLR-based map, the SVM-based map had finer local textures and more complicated local spatial patterns, which were significantly similar with the DEM map in Figure 9F. The reason might be that DEMs had high original resolution (90 m) and the topography of the study area is complicated. The CC values might not well reflect the contribution of DEM to some extent. The five atmospheric indicator datasets for model training and prediction were generated by interpolation of ground observations of 68 stations. It was too sparse for the whole study area. Therefore, the 1-km maps of those indicators, the BPNN-based downscaled products and the MLR-based products had relatively simple local textures and spatial patterns. More datasets of the environmental variables are needed for finer precipitation estimates in future studies.
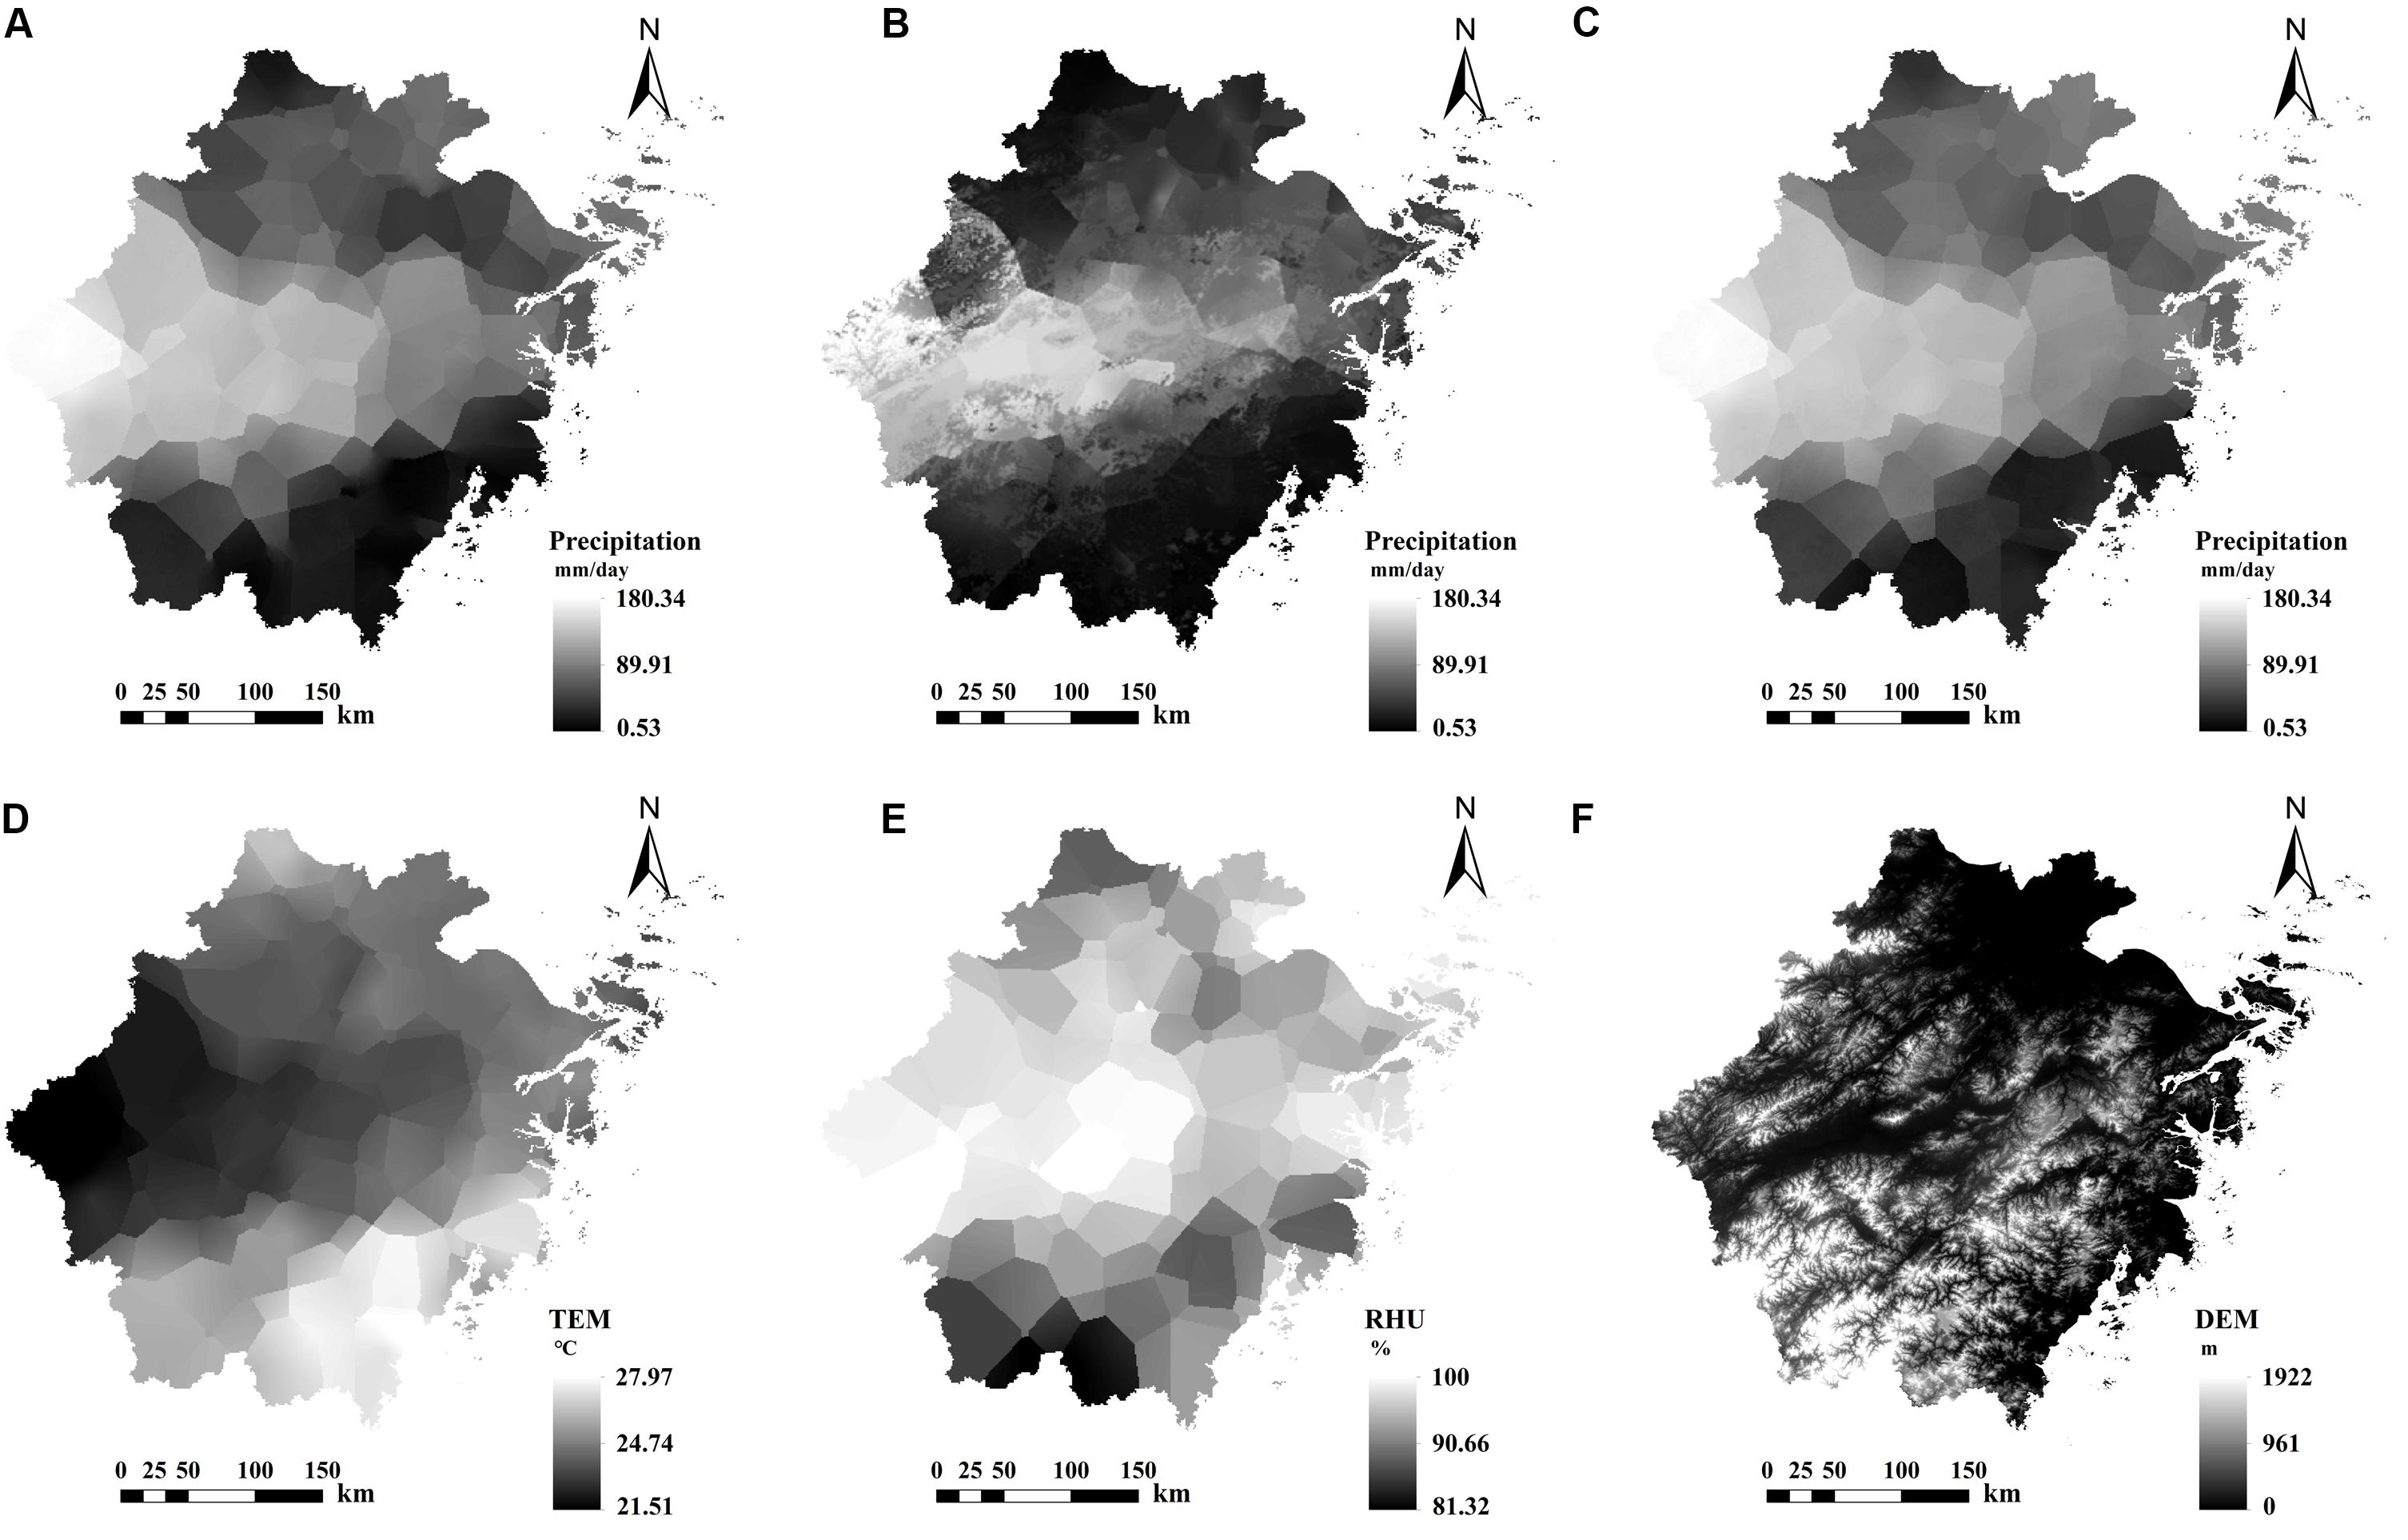
Figure 9. The spatial patterns of the BPNN-based product (A), SVM-based product (B), MLR-based product (C), TEM (D), RHU (E), and DEM (F) in event 1.
It is vital to select the optimal environmental variables according to the characteristics of precipitation events and downscaling models to improve the precision and quality of the downscaled products in future studies. In this research, TEM and RHU were prime variables for the two models in heavy-precipitation events in the plum rain season. While PRS, RHU, and VAP were preferred in typhoon precipitation events. Moreover, RHU was more important in the BPNN model and VAP in the SVM model.
Limitations and Advantages of Downscaled Products
The downscaled products based on the two machine learning methods had finer spatial resolution and higher accuracy (except for the BPNN-based product in event 2) in predicting precipitation at daily scale compared to the original IMERG. Figure 10 shows that the SVM-based precipitation estimates were closer to the original IMERG than other precipitation estimates. Besides, all downscaled products had smaller estimates than the original IMERG at high precipitation values, indicating that they might rectify the inherent defect of overestimation of the original IMERG at high precipitation values to a certain extent. However, the overestimation of the original IMERG was probably overcorrected in the BPNN-based products and MLR-based products, which had poorer performance compared to the SVM-based products. For low precipitation values, the overestimation of the original IMERG was not reduced by the downscaled products and even was exacerbated slightly by the BPNN-based products and MLR-based products, which indicated that both models had limited performances in rectifying the overestimations of the original IMERG. In future studies, improved SVM or BPNN algorithms or other models are needed to solve this overestimation problem.
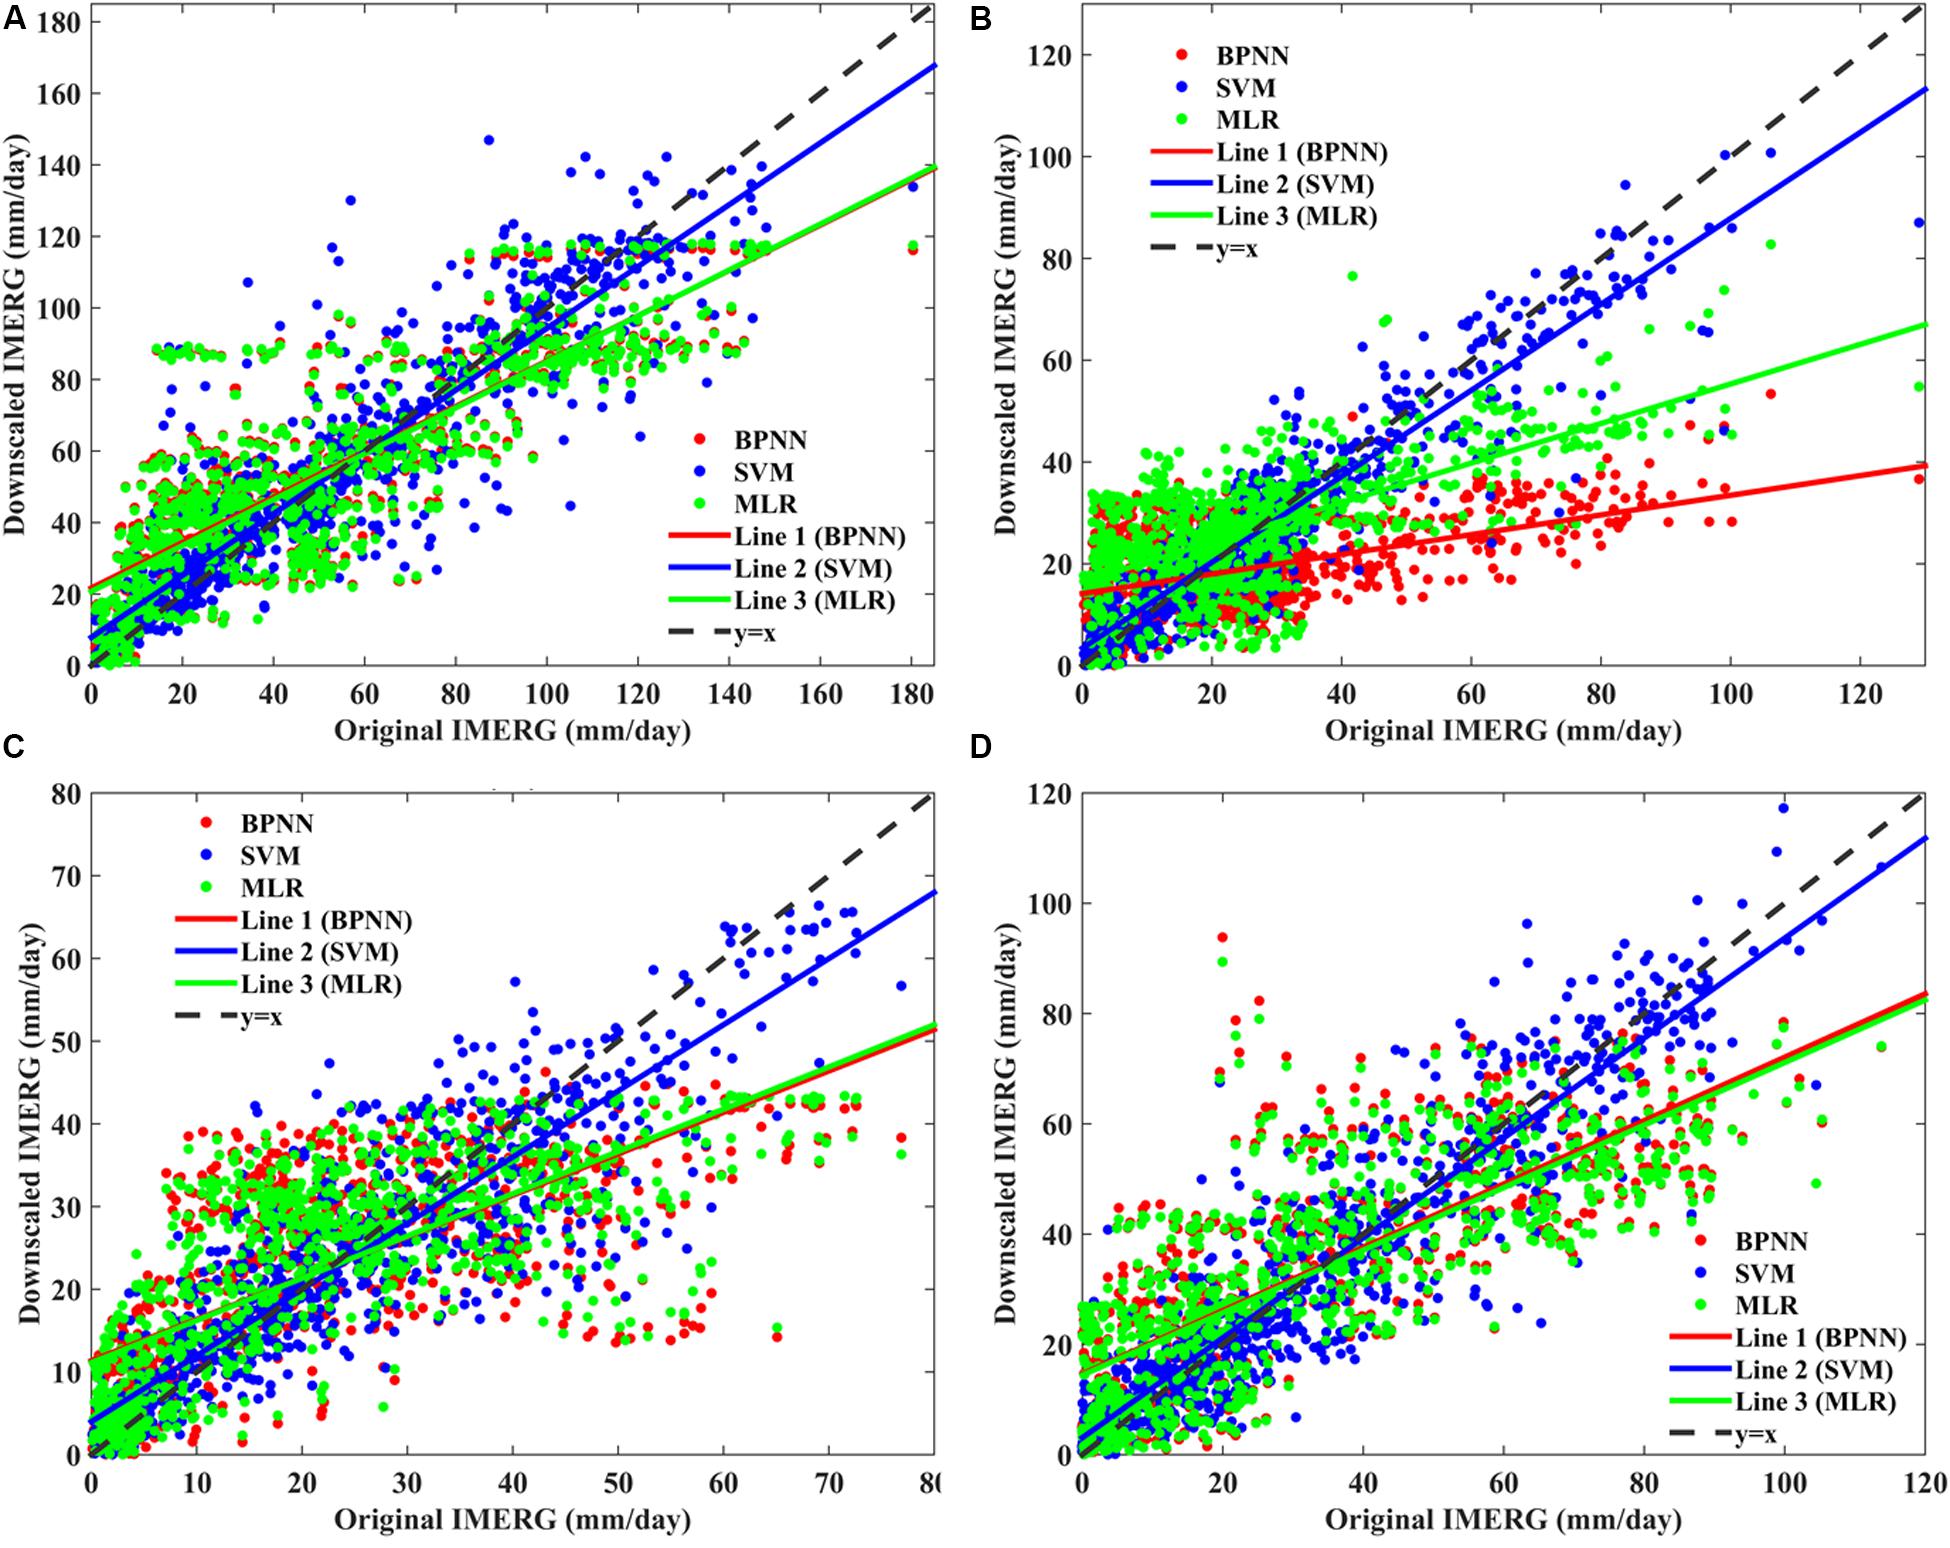
Figure 10. The scatterplots of downscaled results by BPNN, SVM, and MLR against the original IMERG data in four precipitation events [(A) for event 1, (B) for event 2, (C) for event 3, and (D) for event 4].
This study has potential contribution for downscaling precipitation products at daily scale by using machine learning methods. However, some improvements are still needed in future studies. First, heavy precipitation brought by typhoon and plum rain season is mainly concentrated in a few days, and the duration of typhoon or plum rain season within a year is very short. Therefore, the number of samples available will be limited. Only 2 days were selected as the precipitation events for a year, making the conclusions poorly representative, and the models based on selected events may also be less generalizable, and parameter instability may occur when applied to other events. Second, DEM might have great contribution to the spatial distributions of downscaled products as shown in see sections “The Contributions of Environment Variables to Downscaled Results” and “Limitations and Advantages of Downscaled Products.” Therefore, more representing rain gauges are needed for verification in the areas where precipitation is highly affected by the terrain. We hope that future researchers will use richer ground observation datasets to further verify the conclusions of this study.
Conclusion
In this study, we applied BPNN and SVM approaches to downscale IMERG data at daily scale based on the relationships between precipitation and six environmental variables. The downscaled results were validated by ground observations and compared with the MLR-based results and the original IMERG. We found the following:
(1) For heavy-precipitation events in the plum rain season, downscaled products based on SVM and BPNN both improved prediction accuracy compared to the original IMERG and MLR-based products. And SVM-based results had better performance than BPNN-based results considering the four indices.
(2) For extreme-precipitation events caused by typhoon, the SVM-based products still had the best prediction accuracy considering the four indices. The performances of BPNN-based products and MLR-based products showed no significant difference, and they both performed slightly less satisfactorily, even worse than the original IMERG.
(3) The spatial precipitation distribution maps show that SVM-based products had more similar spatial patterns with the original IMERG than other products, and all downscaled products reduce the degree of overestimation of the original IMERG at high precipitation values. Besides, they all had finer spatial resolution and more spatial precipitation details in the local scale compared to the original IMERG, and that was better reflected by SVM-based products. BPNN-based products and MLR-based products had highly similar spatial patterns, and they both had larger overestimations at low precipitation values compared to the original IMERG.
These findings can provide preliminary references for downscaling IMERG at meteorological scales using machine learning approaches. And we hope that more ground observation datasets can be added into such downscaling models in the future related studies to further enrich the findings proposed in this study.
Data Availability Statement
Publicly available datasets were analyzed in this study. This data can be found here: https://pmm.nasa.gov/data-access/downloads/gpm.
Author Contributions
XM wrote the whole manuscript and performed the analysis. ZM designed the research routes and methods. JX wrote the implementation codes and built the fitting models. KH drew the tables and figures and collated the research results. ZW reprocessed the original IMERG data and the ground observations. QH collected the references and downloaded the datasets used in this study. JL helped compose and revised the manuscript.
Funding
This study was financially supported by the National Natural Science Foundation of China (grant no. 41901343); the Key R&D Program of Ministry of Science and Technology, China (grant no. 2018YFC1506500); the China Postdoctoral Science Foundation (nos. 2018M630037 and 2019T120021); the Open Fund of the State Key Laboratory of Remote Sensing Science, China (grant no. OFSLRSS201909); the State Key Laboratory of Resources and Environmental Information System, China, Research and development of real-time monitoring of water quality of large areas based on remote sensing technology (20190365); and Guizhou Provincial Science and Technology Plan Project ([2020]1Y155).
Disclaimer
Frontiers Media SA remains neutral with regard to jurisdictional claims in published maps and institutional affiliations.
Conflict of Interest
The authors declare that the research was conducted in the absence of any commercial or financial relationships that could be construed as a potential conflict of interest.
Acknowledgments
The authors would like to appreciate the NASA/Goddard Space Flight Center’s Mesoscale Atmospheric Processes Laboratory and PPS, which developed and computed IMERG as a contribution to GPM, archived at the NASA PPS, and the National Meteorological Science Data Center, which released the hourly ground observation of the national surface weather stations on the China Meteorological Data Sharing Network.
Supplementary Material
The Supplementary Material for this article can be found online at: https://www.frontiersin.org/articles/10.3389/feart.2020.00146/full#supplementary-material
Footnotes
References
Anandhi, A., Srinivas, V. V., Nanjundiah, R. S., and Nagesh, K. D. (2008). Downscaling precipitation to river basin in India for IPCC SRES scenarios using support vector machine. Int. J. Climatol. 28, 401–420. doi: 10.1002/joc.1529
Boé, J., Terray, L., Habets, F., and Martin, E. (2007). Statistical and dynamical downscaling of the seine basin climate for hydro-meteorological studies. Int. J. Climatol. 27, 1643–1655. doi: 10.1002/joc.1602
Chen, F. Y., Gao, Y. Q., Wang, Y. G., Qin, F., and Li, X. (2019). Downscaling satellite-derived daily precipitation products with an integrated framework. Int. J. Climatol. 39, 1287–1304. doi: 10.1002/joc.5879
Chen, S., Yu, P., and Tang, Y. (2010). Statistical downscaling of daily precipitation using support vector machines and multivariate analysis. J. Hydrol. 385, 13–22. doi: 10.1016/j.jhydrol.2010.01.021
Duan, Z., and Bastiaanssen, W. G. M. (2013). First results from version 7 TRMM 3B43 precipitation product in combination with a new downscaling-calibration procedure. Remote Sens. Environ. 131, 1–13. doi: 10.1016/j.rse.2012.12.002
Ghose, D. K., Panda, S. S., and Swain, P. C. (2010). Prediction of water table depth in western region, Orissa using BPNN and RBFN neural networks. J. Hydrol. 394, 296–304. doi: 10.1016/j.jhydrol.2010.09.003
Guan, H., Wilson, J. L., and Xie, H. (2009). A cluster-optimizing regression-based approach for precipitation spatial downscaling in mountainous terrain. J. Hydrol. 375, 578–588. doi: 10.1016/j.jhydrol.2009.07.007
Guo, J., Liang, X., and Leung, L. R. (2004). Impacts of different precipitation data sources on water budgets. J. Hydrol. 228, 113–129. doi: 10.1016/j.jhydrol.2003.08.020
Haese, B., Hörning, S., Chwala, C., Bárdossy, A., Schalge, B., and Kunstmann, H. (2017). Stochastic reconstruction and interpolation of precipitation fields using combined information of commercial microwave links and rain gauges. Water Resour. Res. 53, 559–570. doi: 10.1002/2017wr021015
Hou, A. Y., Kakar, R. K., Neeck, S., Azarbarzin, A. A., Kummerow, C. D., Kojima, M., et al. (2014). The global precipitation measurement mission. Bull. Am. Meteorol. Soc. 95, 701–722.
Huffman, G. J., Adler, R. F., Arkin, P., Chang, A., Ferraro, R., Gruber, A., et al. (1997). The global precipitation climatology project (GPCP) combined precipitation dataset. Bull. Am. Meteorol. Soc. 78, 5–20. doi: 10.1175/1520-0477(1997)078<0005:tgpcpg>2.0.co;2
Huffman, G. J., Adler, R. F., Bolvin, D. T., and Gu, G. (2009). Improving the global precipitation record: GPCP version 2.1. Geophys. Res. Lett. 36, 153–159.
Huffman, G. J., Adler, R. F., Morrissey, M. M., Bolvin, D. T., Curtis, S., Joyce, R., et al. (2001). Global precipitation at one-degree daily resolution from multisatellite observations. J. Hydrometeorol. 2, 36–50. doi: 10.1175/1525-7541(2001)002<0036:gpaodd>2.0.co;2
Huffman, G. J., Bolvin, D. T., Nelkin, E. J., Wolff, D. B., Adler, R. F., Gu, G., et al. (2007). The TRMM multisatellite precipitation analysis (TMPA): quasi-global, multiyear, combined-sensor precipitation estimates at fine scales. J. Hydrometeorol. 8, 38–55. doi: 10.1175/JHM560.1
Immerzeel, W. W., Rutten, M. M., and Droogers, P. (2009). Spatial downscaling of TRMM precipitation using vegetative response on the Iberian Peninsula. Remote Sens. Environ. 113, 362–370. doi: 10.1016/j.rse.2008.10.004
Jia, S., Zhu, W., Lu, A., and Droogers, P. (2009). Spatial downscaling of algorithm of TRMM precipitation based on NDVI and DEM in the Qaidam Basin of China. Remote Sens. Environ. 115, 3069–3079. doi: 10.1016/j.rse.2011.06.009
Jin, H. M., Xu, P., He, K., Xu, J. T., and Ma, Z. Q. (2017). Downscaling provincial TRMM precipitation data based on geographical weighted regression model. J. Zhejiang Univer. Water Resour. Electr. Power 29, 29–36.
Kong, C., Lan, H., Yang, G., and Xu, K. (2016). Geo-environmental suitability assessment for agricultural land in the rural–urban fringe using BPNN and GIS: a case study of Hangzhou. Environ. Earth Sci. 75:5956. doi: 10.1007/s12665-016-5956-z
Kubota, T., Shige, S., Hashizume, H., Aonashi, K., Takahashi, N., Seto, S., et al. (2007). Global precipitation map using satellite-borne microwave radiometers by the gsmap project: production and validation. IEEE Trans. Geosci. Remote Sens. 45, 2259–2275. doi: 10.1109/TGRS.2007.895337
Kummerow, C., Barnes, W., Kozu, T., Shiue, J., and Simpson, J. (1998). The tropical rainfall measuring mission (TRMM) sensor package. J. Atmos. Ocean Technol. 15, 809–817. doi: 10.1175/1520-0426(1998)015<0809:ttrmmt>2.0.co;2
Kummerow, C., Simpson, J., Thiele, O., Barnes, W., Chang, A. T. C., Stocker, E., et al. (2000). The status of the tropical rainfall measuring mission (TRMM) after two years in Orbit. J. Appl. Meteorol. 39, 1965–1982.
Lorenz, M., Bliefernicht, J., Haese, B., and Kunstmann, H. (2018). Copula-based downscaling of daily precipitation fields. Hydrol. Process. 32, 3479–3494. doi: 10.1002/hyp.13271
Ma, Z. Q., He, K., Tan, X., Liu, Y., Lu, H. Y., and Shi, Z. (2019). A new approach for obtaining precipitation estimates with a finer spatial resolution on a daily scale based on TMPA V7 data over the Tibetan Plateau. Int. J. Remote Sens. 40, 8465–8483. doi: 10.1080/01431161.2019.1624870
Ma, Z. Q., Shi, Z., Zhou, Y., Xu, J. F., Yu, W., and Yang, Y. Y. (2017a). A spatial data mining algorithm for downscaling TMPA 3B43 V7 data over the Qinghai–Tibet Plateau with the effects of systematic anomalies removed. Remote Sens. Environ. 200, 378–395. doi: 10.1016/j.rse.2017.08.023
Ma, Z. Q., Zhou, Y., Hu, B. F., Liang, Z. Z., and Shi, Z. (2017b). Downscaling annual precipitation with TMPA and land surface characteristics in China. Int. J. Climatol. 37, 5017–5019. doi: 10.1002/joc.2017.37.issue-15
Ma, Z. Q., Tan, X., Yang, Y., Chen, Xi, Kan, G. Y., Ji, X., et al. (2018). The first comparisons of IMERG and the downscaled results based on IMERG in hydrological utility over the Ganjiang river Basin. Water 10:1392. doi: 10.3390/w10101392
Maraun, D. (2013). Bias correction, quantile mapping, and downscaling: revisiting the influation issue. J. Clim. 26, 2137–2143. doi: 10.1175/JCLI-D-12-00821.1
Raje, D., and Mujumdar, P. P. (2011). A comparison of three methods for downscaling daily precipitation in the Punjab region. Hydrol. Process. 25, 3575–3589. doi: 10.1002/hyp.8083
Rodriguez, E., Morris, C. S., and Belz, J. E. (2006). A global assessment of the SRTM performance. Photogramm. Eng. Remote Sens. 72, 249–260. doi: 10.14358/PERS.72.3.249
Rumelhart, D. E., and McCelland, J. L. (1986). Parallel Distributed Processing. Cambridge, MA: MIT Press.
Sachindra, D. A., Ahmed, K., Mamunur, R. M., Shahid, S., and Perera, B. J. C. (2018). Statistical downscaling of precipitation using machine learning techniques. Atmos. Res. 212, 240–258. doi: 10.1016/j.atmosres.2018.05.022
Schultz, P. A., and Halpert, M. S. (1994). Global analysis of the relationship among a vegetation index, precipitation and land surface temperature. Int. J. Remote Sens. 16, 2755–2777. doi: 10.1080/01431169508954590
Sharifi, E., Saghafian, B., and Steinacker, R. (2019). Downscaling satellite precipitation estimates with multiple linear regression, artificial neural networks, and spline interpolation techniques. J. Geophys. Res. 124:89. doi: 10.1029/2018JD028795
Tao, K., and Barros, A. P. (2010). Using fractal downscaling of satellite precipitation products for hydrometeorological applications. J. Atmos. Ocean Technol. 27, 409–427. doi: 10.1175/2009jtecha1219.1
Teng, H. F., Shi, Z., Ma, Z. Q., and Li, Y. (2014). Estimating spatially downscaled rainfall by regression kriging using TRMM precipitation and elevation in Zhejiang Province, southeast China. Int. J. Remote Sens. 35, 7775–7794. doi: 10.1080/01431161.2014.976888
Themeßl, M. J., Gobiet, A., and Heinrich, G. (2012). Empirical-statistical downscaling and error correction of regional climate models and its impact on the climate change signal. Clim. Chang. 112, 449–468. doi: 10.1007/s10584-011-0224-4
Tripathi, S., Srinivas, V. V., and Nanjundiah, R. S. (2006). Downscaling of precipitation for climate change scenarios: a support vector machine approach. J. Hydrol. 330, 621–640. doi: 10.1016/j.jhydrol.2006.04.030
van den Berg, M. J., Vandenberghe, S., De Baets, B., and Verhoest, N. E. C. (2011). Copula-based downscaling of spatial rainfall: a proof of concept. Hydrol. Earth Syst. Sci. 15, 1445–1457. doi: 10.5194/hess-15-1445-2011
Vogl, S., Laux, P., Qiu, W., Mao, G., and Kunstmann, H. (2012). Copula-based assimilation of radar and gauge information to derive bias-corrected precipitation fields. Hydrol. Earth Syst. Sci. 16, 2311–2328. doi: 10.5194/hess-16-2311-2012
Wu, T., Fu, H. P., Feng, F. B., and Hong, M. (2019). A new approach to predict normalized difference vegetation index using time-delay neural network in the arid and semi-arid grassland. Int. J. Remote Sens. 40, 9050–9063. doi: 10.1080/01431161.2019.1624870
Xu, S. G., Wu, C. Y., Wang, L., Gonsamo, A., Shen, Y., and Niu, Z. (2015). A new satellite-based monthly precipitation downscaling algorithm with non-stationary relationship between precipitation and land surface characteristics. Remote Sens. Environ. 162, 119–140. doi: 10.1016/j.rse.2015.02.024
Yang, Y., and Luo, Y. (2014). Using the back propagation neural network approach to bias correct TMPA data in the arid region of Northwest China. J. Hydrol. 15, 459–473. doi: 10.1175/JHM-D-13-041.1
Keywords: precipitation, IMERG, downscaling, SVM, BPNN
Citation: Min X, Ma Z, Xu J, He K, Wang Z, Huang Q and Li J (2020) Spatially Downscaling IMERG at Daily Scale Using Machine Learning Approaches Over Zhejiang, Southeastern China. Front. Earth Sci. 8:146. doi: 10.3389/feart.2020.00146
Received: 18 January 2020; Accepted: 20 April 2020;
Published: 10 June 2020.
Edited by:
Hongkai Gao, East China Normal University, ChinaReviewed by:
Yun Li, AnJi Meteorological Bureau, ChinaGanquan Mao, Southern University of Science and Technology, China
Copyright © 2020 Min, Ma, Xu, He, Wang, Huang and Li. This is an open-access article distributed under the terms of the Creative Commons Attribution License (CC BY). The use, distribution or reproduction in other forums is permitted, provided the original author(s) and the copyright owner(s) are credited and that the original publication in this journal is cited, in accordance with accepted academic practice. No use, distribution or reproduction is permitted which does not comply with these terms.
*Correspondence: Ziqiang Ma, emlxbWFAcGt1LmVkdS5jbg==