 Julia Ricci
 Julie Carlut
 Fernando Ornelas Marques
 Anthony Hildenbrand
 Jean-Pierre Valet
- 1Institut de Physique du Globe de Paris, Université de Paris, Paris, France
- 2Géosciences Montpellier, UMR 5243, Université de Montpellier – CNRS, Montpellier, France
- 3Faculdade de Ciências, Universidade de Lisboa, Lisbon, Portugal
- 4Géosciences Paris Sud, Université Paris-Saclay, Orsay, France
We present paleomagnetic and geochronological data of twenty-five stacked lava flows from São Miguel Island (Azores) that were emplaced during the last geomagnetic reversal (Matuyama-Brunhes, M-B). The characteristic direction of natural remanent magnetization was isolated through alternating field and/or thermal demagnetization. From bottom to top, the directional changes display a first phase with reverse, transitional and normal directions which is followed by a second phase with transitional and normal directions. Dating by Potassium-Argon (K-Ar) of fresh separated groundmass provide ages of 768 ± 5 ka and 765 ± 5 ka (1σ) for the first and second transitional episodes, respectively. We infer that this sequence recorded the last reversal and reveal the presence of a rebound that occurred soon after the transition. The age of the transition is 5–15 kyr younger than at other volcanic localities, but in agreement with astronomical ages that were recently proposed for the transitional interval. The reversal is characterized by weak field intensity during the transition, a recovery phase and a subsequent decrease during the rebound. The two transitional virtual geomagnetic poles (VGPs) that characterize the transition are found above the South Atlantic and the North Pacific. When compared to other M-B records, no VGP is found above preferred locations.
Introduction
After about 50 years of paleomagnetic studies, it is clear that the processes governing the geomagnetic reversals can only be constrained from sedimentary records with very high deposition rates and sequences of stacked volcanic lava flows. Although dating techniques used for lava flows provide a direct and precise radiometric measurement, uncertainties often hinder the reconstruction of the exact temporal succession during fast directional changes in the case of sparse volcanic flows. Therefore, only sequences of superimposed lava flows can be used with confidence to reveal pertinent characteristics of the transitional field. In fact, the major difficulty is to find appropriate successions that were erupted during a reversal period. The last geomagnetic reversal (Matuyama-Brunhes, M-B) has been studied in marine sedimentary cores (e.g., Bassinot et al., 1994; Tauxe et al., 1996; Oda et al., 2000; Channell et al., 2010) and in lava sequences from the Canary Islands, Chile, Tahiti, Maui, and Guadeloupe (e.g., Chauvin et al., 1990; Carlut et al., 2000; Quidelleur et al., 2003; Brown et al., 2004; Coe et al., 2004; Balbas et al., 2018) but detailed records could only be obtained from Tahiti and Maui volcanic sequences.
The mean age of the M-B transition was recently estimated at ca. 773 ka (with a duration of 4.4 ka) from a set of high-resolution paleomagnetic and oxygen isotope data from marine sites in the northern Atlantic Ocean (Channell et al., 2010), and at ca. 772 ka from a combination of 10Be, paleomagnetic and oxygen isotope analyses (Valet et al., 2019). The volcanic records are characterized by more scattered ages. Potassium-argon ages of 786 ± 3 ka were obtained from a set of seven independent lava flows at La Palma, Canary Islands (Quidelleur et al., 2003), while a mean age of 777 ± 4 ka relied on five independent lava flows from the Caribbean (Ricci et al., 2018). The most recent 40Ar/39Ar age estimates of 783.4 ± 0.6 ka were published from tephra layers within marine sections from the Indian Ocean (Mark et al., 2017) while ages of 786.0 and 786.1 ka were derived from exposed lacustrine sediments in central Italy (Sulmona section, Sagnotti et al., 2016, 2019). In this last study, the duration of the polarity switch was estimated to have lasted only a few decades, but this result has been questioned by Evans and Muxworthy (2018) due to significant remagnetization of the sequence. Finally, recalculated 40Ar/39Ar ages spanning ∼795 to ∼773 ka from Tahiti, La Palma, Chile, Guadeloupe and Maui lava flows were proposed by Singer et al. (2019) and interpreted as evidence of a complex reversal process and attributed to successive geomagnetic events.
The apparent discrepancies between the ages derived from marine records and from terrestrial lava sequences could be caused by multiple factors: (1) non-dipole structures recorded by lava flows but smoothed out in sediments; (2) potential offset between the two signals due to delayed magnetization resulting from locking depth in some sediments; and (3) uncertainties inherent to radiometric dating (Channell et al., 2010; Singer, 2014) and orbital tuning techniques (Valet et al., 2019). It has been proposed (Valet et al., 2012) that geomagnetic reversals could be described by three successive phases: a precursory event, a 180° polarity switch and a rebound. A precursor has been reported in a few sedimentary records (Channell et al., 2010; Valet et al., 2014). The age spreading from transitional lavas may also indicate that some sequences actually provided a record of the precursor rather than the transition itself (Balbas et al., 2018; Singer et al., 2019).
During the last two decades, numerous studies on the Azores archipelago brought new information on the timing of volcanism at both local and regional scales (e.g., Calvert et al., 2006; Costa et al., 2014; Sibrant et al., 2015; Hildenbrand et al., 2018; Marques et al., 2018). Johnson et al. (1998) and Sibrant et al. (2015) identified lava flow sequences in São Miguel island with ages close to the M-B reversal. These results offered a promising potential for a detailed paleomagnetic study with the hope of finding a record of the last reversal.
Regional Setting
The Azores Archipelago was built on a relatively shallow seafloor that is usually interpreted as resulting from the interaction between a hot or volatile-rich mantle anomaly and the Mid Atlantic Ridge (MAR, e.g., Métrich et al., 2014). On the eastern side of the MAR, recent volcanism (<2 Ma) has developed along the present diffuse Eurasia-Nubia plate boundary, which comprises an ultra-slow oceanic rift (the Terceira Rift) and a series of horsts and grabens constituting the diffuse Azores Triple Junction (Marques et al., 2013). São Miguel is the largest island of the Azores Archipelago and is located on the easternmost part of the Terceira Rift (Figure 1). The island consists of six volcanic complexes (from east to west, Nordeste, Furnas, Eastern Waist Zone, Fogo, Western Waist Zone, and Sete Cidades) that result from westward migration of the volcanic construction during the last 900 kyr (Figure 1). A 100 m thick succession of 28 lava flows was sampled in the northeastern part of the Nordeste volcanic complex in NE São Miguel (Figure 1). A deep creek has incised the volcanic sequence; 21 lava flows were sampled on the northern slope and 7 on the southern slope (for further details see the Methods section).
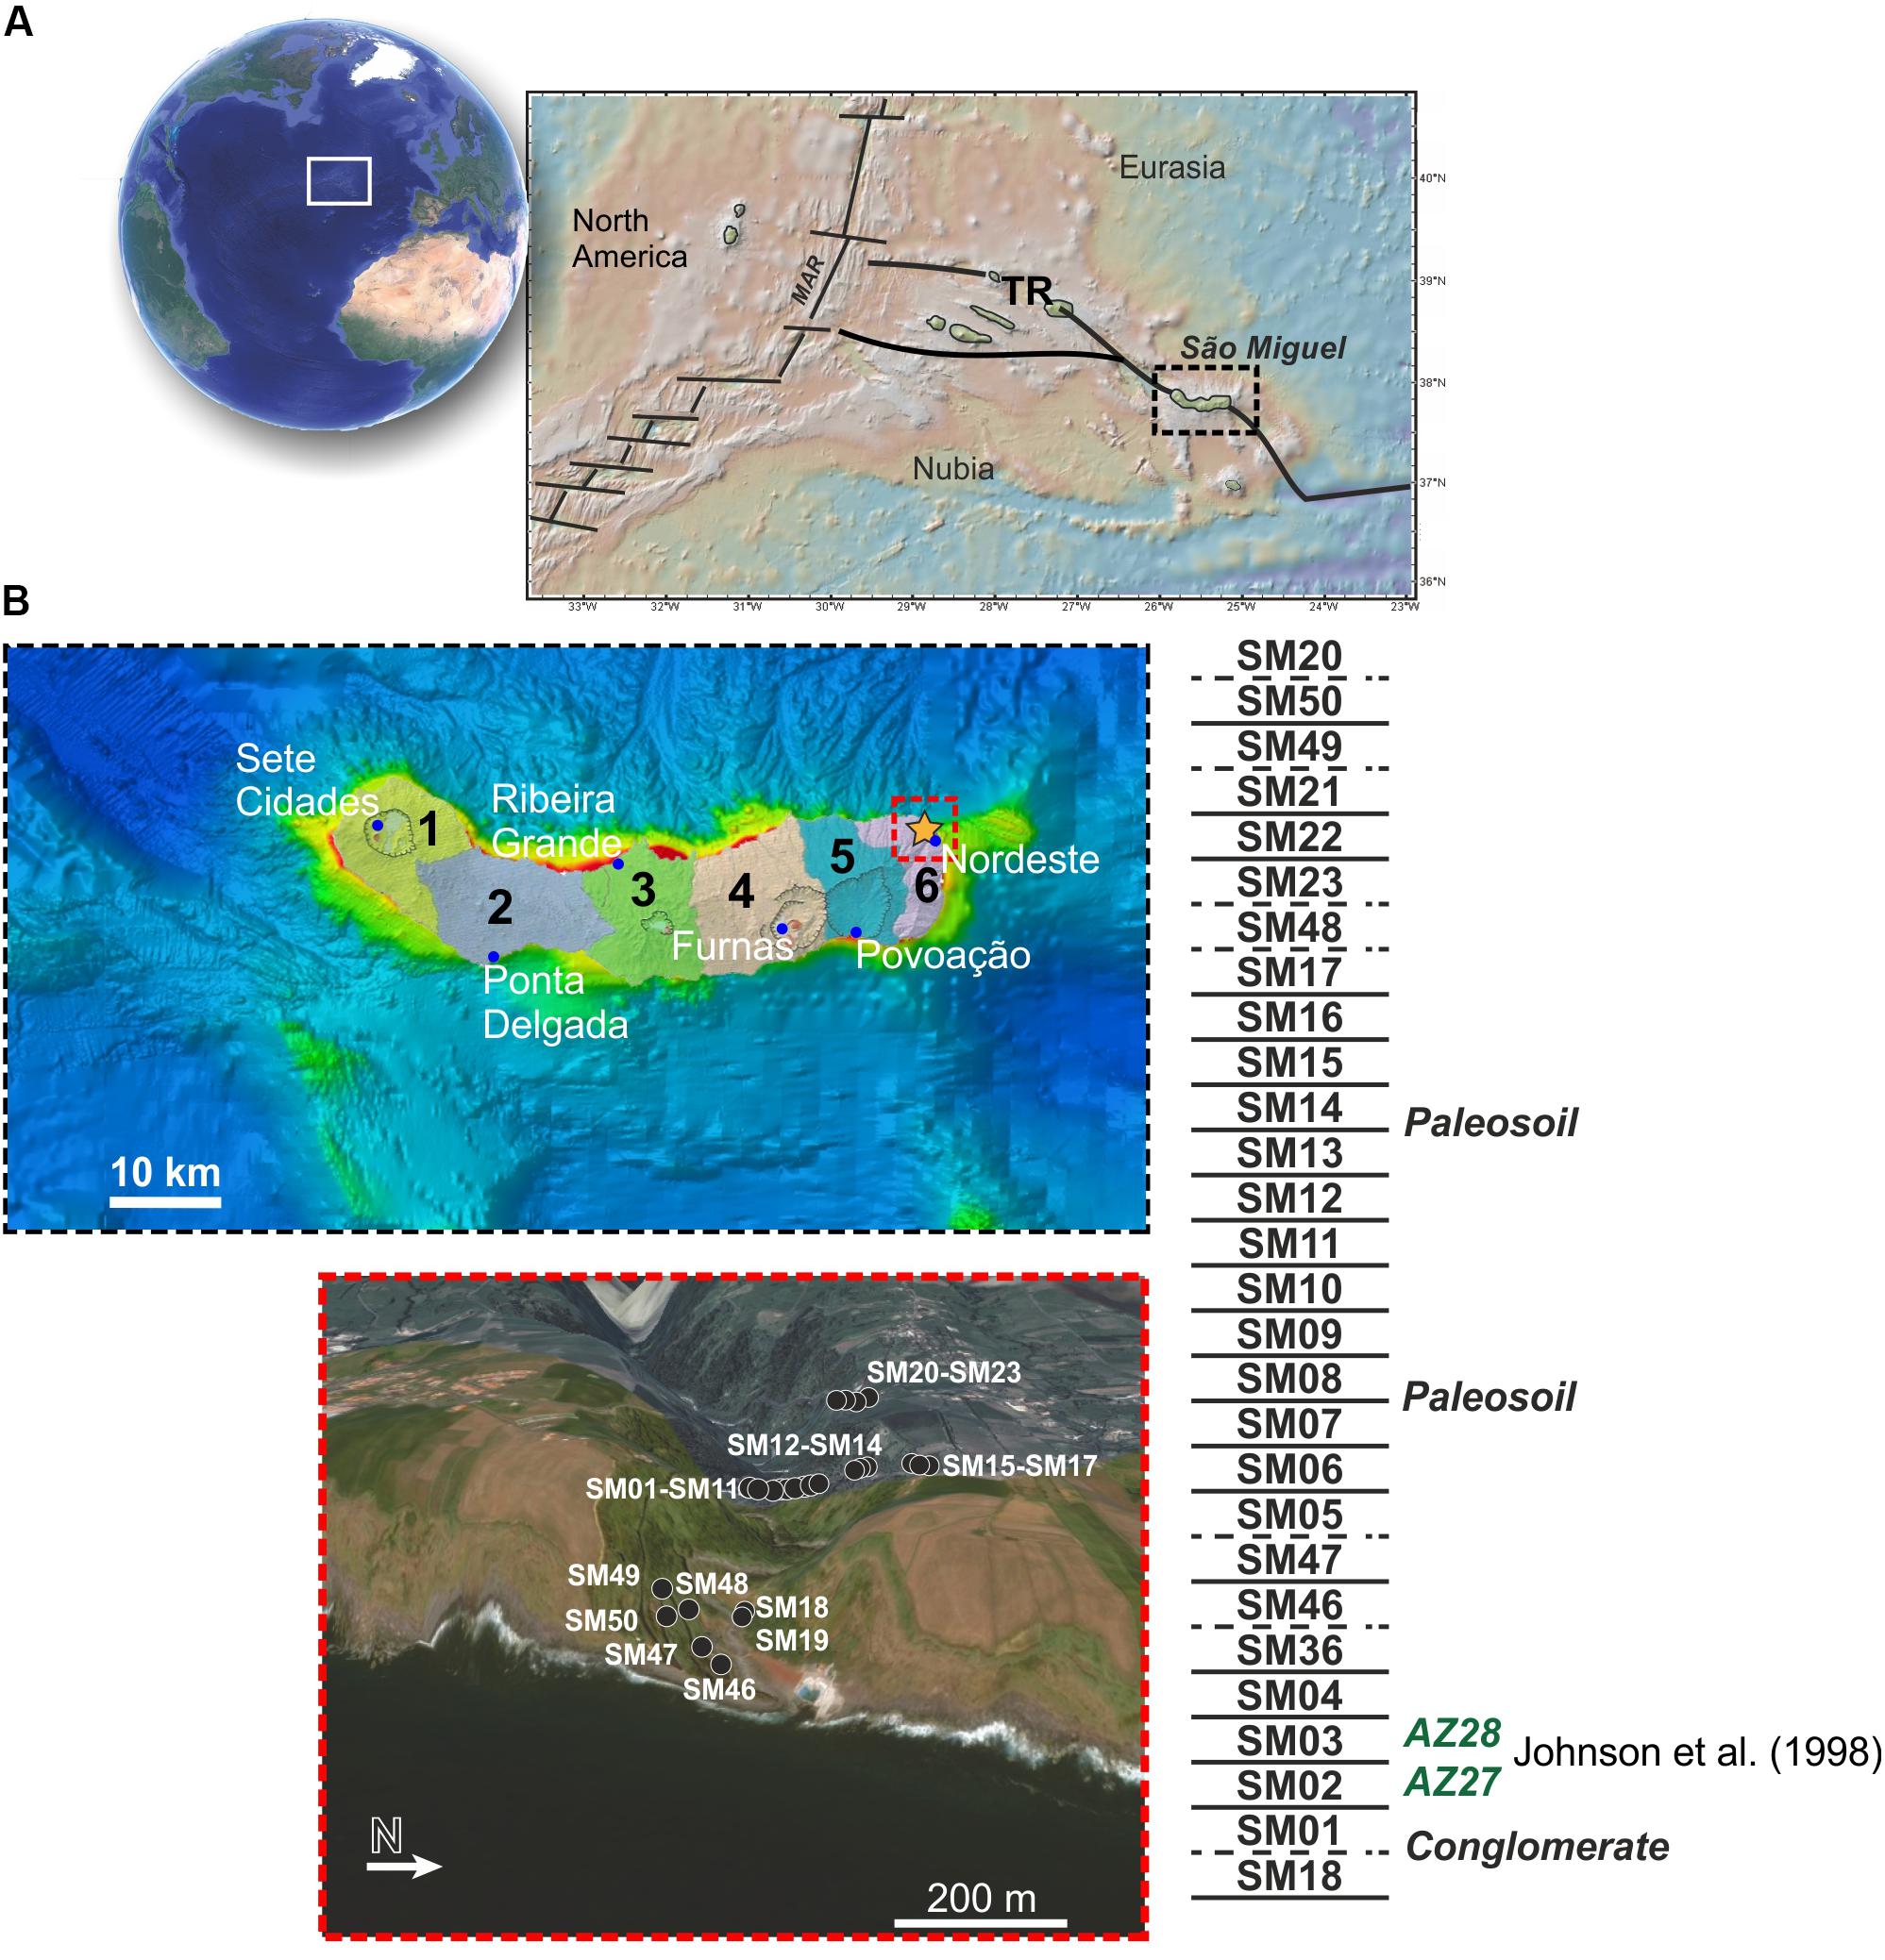
Figure 1. Regional setting of the study area. (A) location of the Nordeste section (yellow star) within São Miguel Island and position of the samples studied throughout the valley; (B) stratigraphic succession of the samples.
Materials and Methods
Sampling
The northeastern section of Nordeste comprises three sequences, including a suite of 17 flows in direct stratigraphic relationship (SM01 to SM17), and two smaller sub-sections located down the creek near the shore (SM18 and SM19) and upper to the northwest (flows SM20 to SM23; cf. Figure 1). The southern section is characterized by 5 well-exposed lava flows (SM46 to SM50) accessible through the main road going down to the lowermost part of the creek near sea level. The stratigraphic succession of the lava flows from these two parts of the valley was constrained by field observation combined with paleomagnetic and geochronological data (Figure 1).
A total of 325 cores (typically 1 inch in diameter) were collected with an average of twelve cores per site (Table 1). All samples were magnetically and sun oriented. The mean magnetic declination of −9° (calculated from 261 oriented cores) is indistinguishable from the expected International Geomagnetic Reference Field (−8°). In addition, four fresh lava flows, from bottom to top, were sampled for K-Ar dating. The freshest portion of the lava flows was systematically collected by means of chisels, sledge hammer and rock pick hammer. Samples with obvious traces of weathering were discarded.
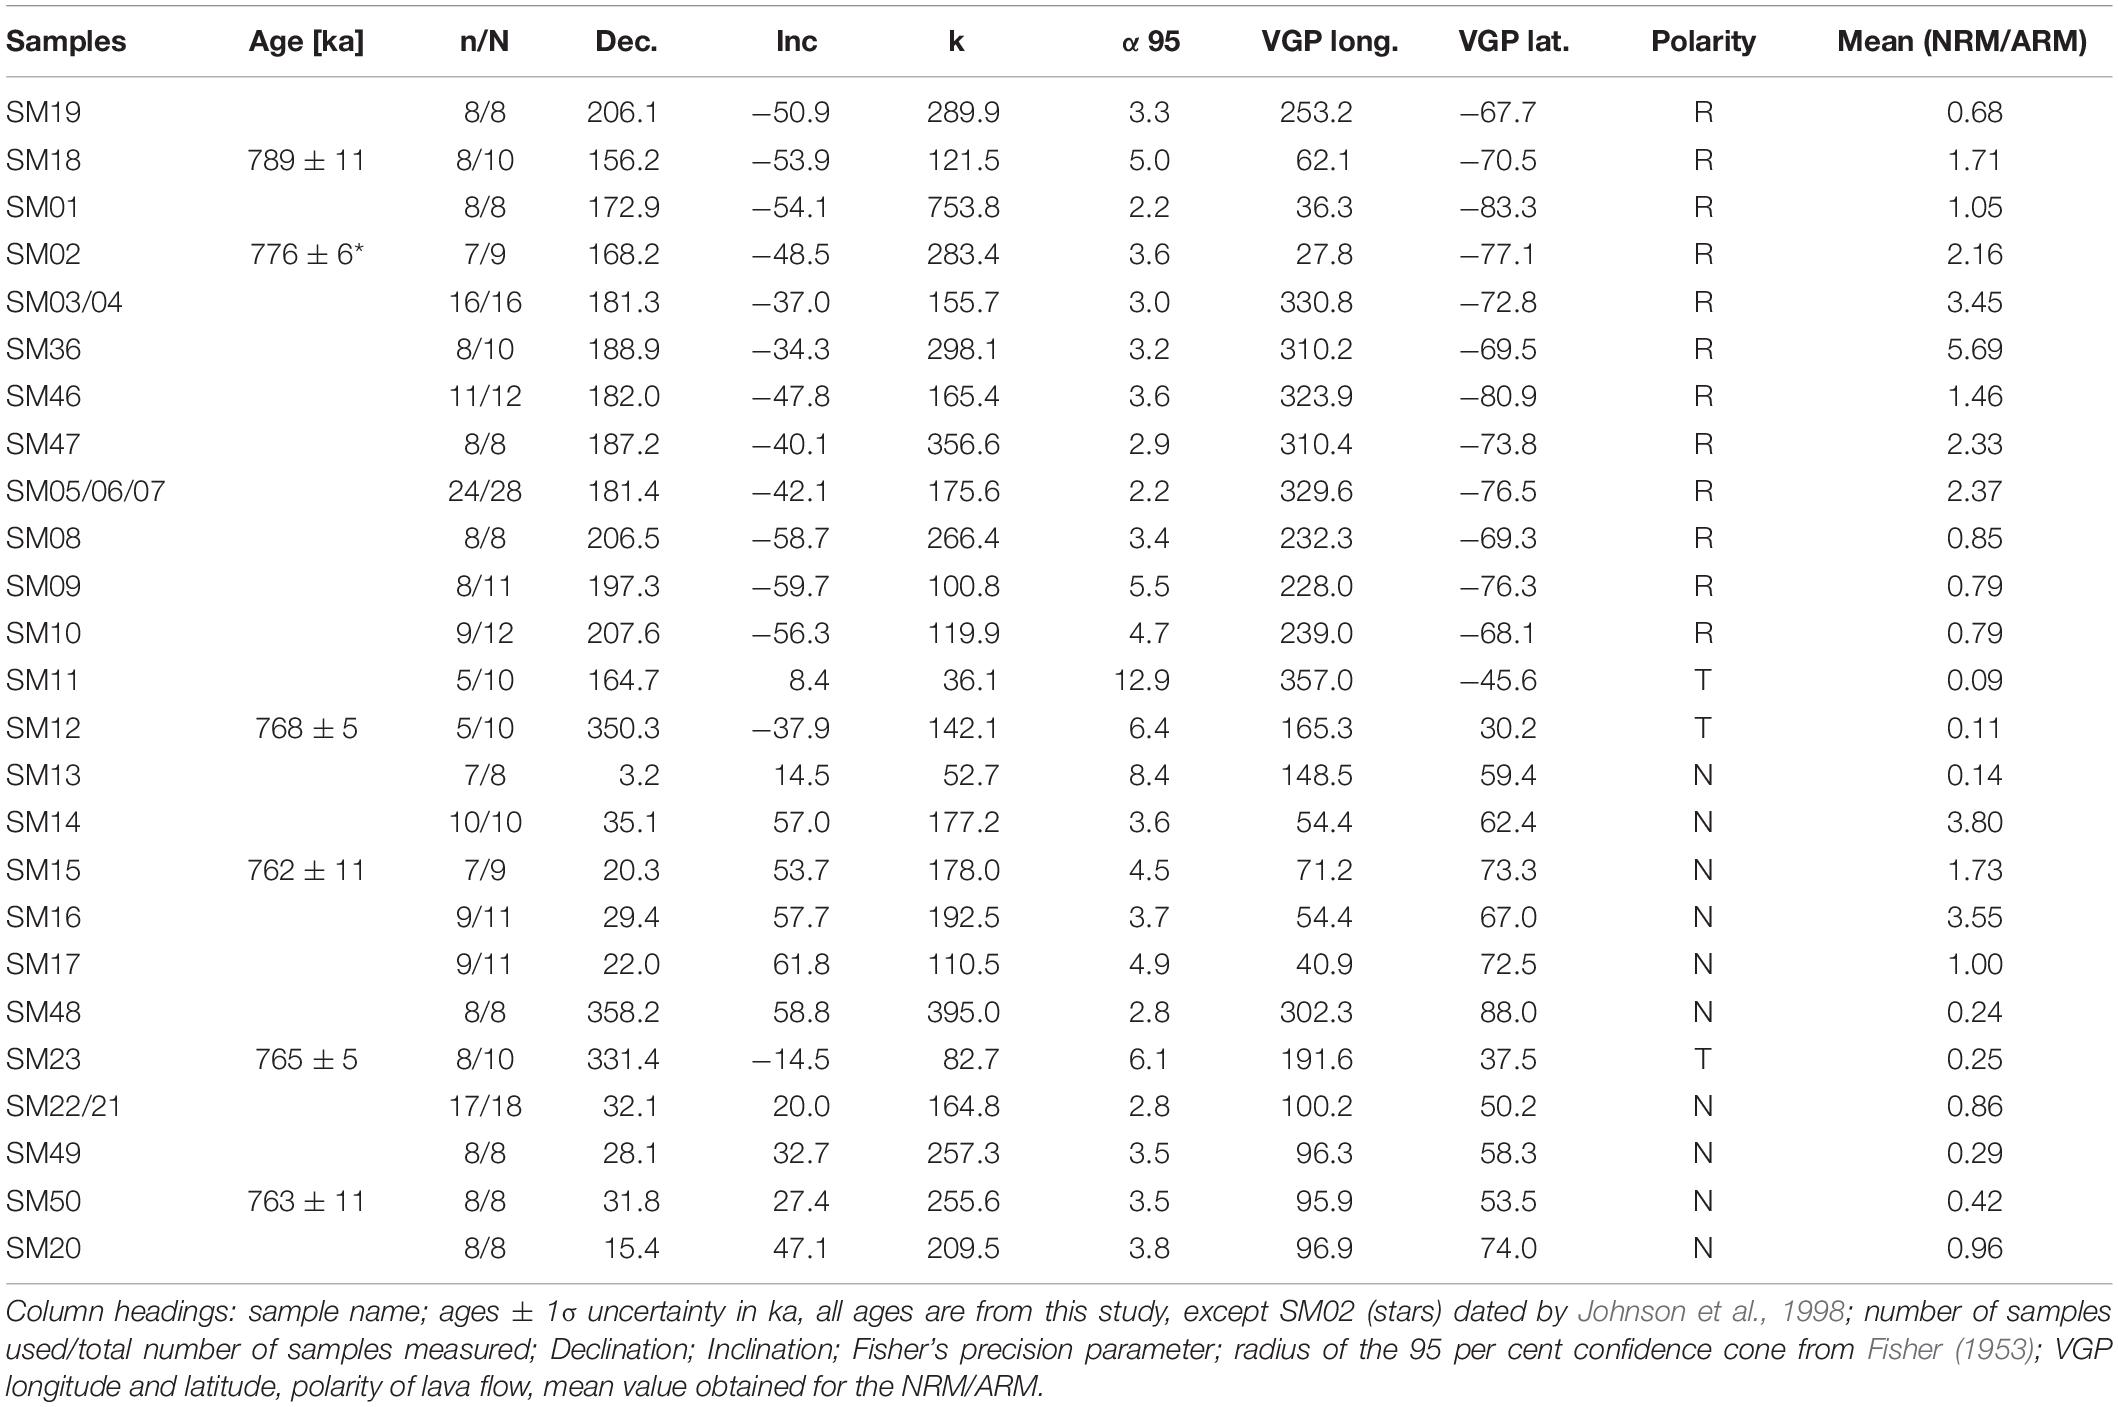
Table 1. Paleomagnetic results.
Paleomagnetic Treatment
Alternating fields (af) and thermal stepwise demagnetization techniques were carried out in the magnetic shielded room of the Institut de Physique du Globe de Paris (IPGP-Paris). Natural Remanent Magnetization (NRM) was measured using Agico JR-6 spinner magnetometers. Twelve af demagnetization steps were systematically performed at 05, 10, 15, 20, 25, 30, 35, 40, 50, 70, and 90 mT. Thermal demagnetization was carried out at 14 temperature steps up to 580–595°C. The demagnetization diagrams were interpreted using the Paleomac software (Cogne, 2003).
Measurements of low field thermomagnetic susceptibility (κ) were conducted on 1 cm3 sample powders from each flow using an Agico KLY-3 instrument equipped with a CS-3 furnace. Heating-cooling runs were performed from 20 to 650°C to detect mineralogical changes. A first batch of samples was heated in air and a second batch under Argon atmosphere. Hysteresis loops were conducted on one representative sample of each flow using an Alternating Gradient Force Magnetometer (AGFM, Princeton Measurements Corporation) in a 1 T maximum field.
After af demagnetization until 120 mT, two to four samples from each flow were remagnetized by an ARM (Anhysteretic Remanent Magnetization) using an applied magnetic field at 50 μT. The samples were then af stepwise demagnetized at six steps 10, 20, 30, 40, 50, and 70 mT, the same steps were previously used for NRM demagnetization. Then the demagnetization of the ARM was compared to that of the NRM for the same AF steps. The steps were chosen so it corresponds to interval representative of the primary magnetization. The NRM/ARM values were calculated using the average from the representative demagnetization steps (examples are given in Supplementary Figure S1).
Geochronology
Careful microscopic examination of thin-sections allowed checking the structure, texture and quality of the samples. As most of them are porphyritic basalts, the fresh groundmass was systematically selected. After crushing and sieving at an appropriate size (typically 125 – 250 μm), extraction of the fresh groundmass in a narrow density interval (typically 2.95 – 3.0) was achieved with heavy liquids and magnetic separation. This procedure is essential to eliminate all phenocrysts (which have mostly formed in a magma chamber and may carry significant unsuitable excess-argon), and so get a meaningful eruption age.
Potassium-Argon analyses were performed at the Geosciences Paris-Sud (GEOPS) Geochronology laboratory using the unspiked Cassignol-Gillot experimental procedure, described in detail in Ricci et al. (2017) and summarized below. The K content was measured by flame absorption spectrometry, and was compared with reference values for the MDO-G (Gillot et al., 1992) and BCR-2 (Rackzec et al., 2001) standards. For each sample, at least two independent measurements of Argon from distinct aliquots of the same preparation have been carried out with a multi-collector 180° sector mass spectrometer following the approach described in Gillot and Cornette (1986). Standard HD-B1, with a recommended age of 24.21 Ma (Hess and Lippolt, 1994), was used for calibration of our mass spectrometer. We note that an age value of 24.18 Ma was proposed more recently for this standard (Schwarz and Trieloff, 2007), which has no significant incidence on age determination in our case, as the relative difference between the two values is of about one per mill, i.e., below 1000 years for the ages obtained in this study. Atmospheric contamination was determined by the comparison of the 40Ar/36Ar ratios of the sample with an atmospheric dose. We used the decay constants and isotopic ratios of Steiger and Jäger (1977). The uncertainty on each age determination was obtained from the quadratic sum of all three independent sources of uncertainty involved in the calculation: (1) relative uncertainty on K-content determination, (2) relative uncertainty on calibration of the 40Ar signal, and (3) relative uncertainty on the correction of the atmospheric contamination (full description in Hildenbrand et al., 2018).
Results
Rock Magnetic Properties
Thermomagnetic experiments were conducted on two samples from each flow, one under air and one under Ar atmosphere. Most samples show a spectrum of Curie temperatures (Tc) in the range 550–580°C as determined using the inflection point on the decreasing branch of the susceptibility curve (e.g., Petrovský and Kapička, 2006), and a broadly reversible behavior in terms of shape, with little difference between the Ar batch compared to air. This is indicative of Ti-poor titanomagnetite phases and/or of pure magnetite (typical examples are shown in Figure 2, Type I samples). A more complex mineralogy occurs for SM11 and SM13 (Type II in Figure 2) where a decrease in susceptibility around 250°C (SM11) and 410°C (SM13) is followed by a peak around 450°C (SM11) or 500°C (SM13) indicating that unstable cation deficient titanomagnetite exsolved into Ti-poor and Ti-rich phases upon heating in air (Readman and O’Reilly, 1972). The reaction also occurs under Ar atmosphere but is less pronounced (Figure 2E compared to Figure 2F). SM09, SM10, SM12, SM48, SM02, and SM46 are characterized by a decrease in susceptibility in the 350–550°C range (Figure 2, Type III) followed by a second decrease around 570–580°C. For these samples mixtures of titanomagnetite with varying amount of Ti is believed to be responsible for this behavior. Finally SM47 (Figure 2, Type IV) show marked irreversibility, both in Air and under Ar atmosphere, with the destruction of low Ti titanomagnetite and creation of phases with lower Tc.
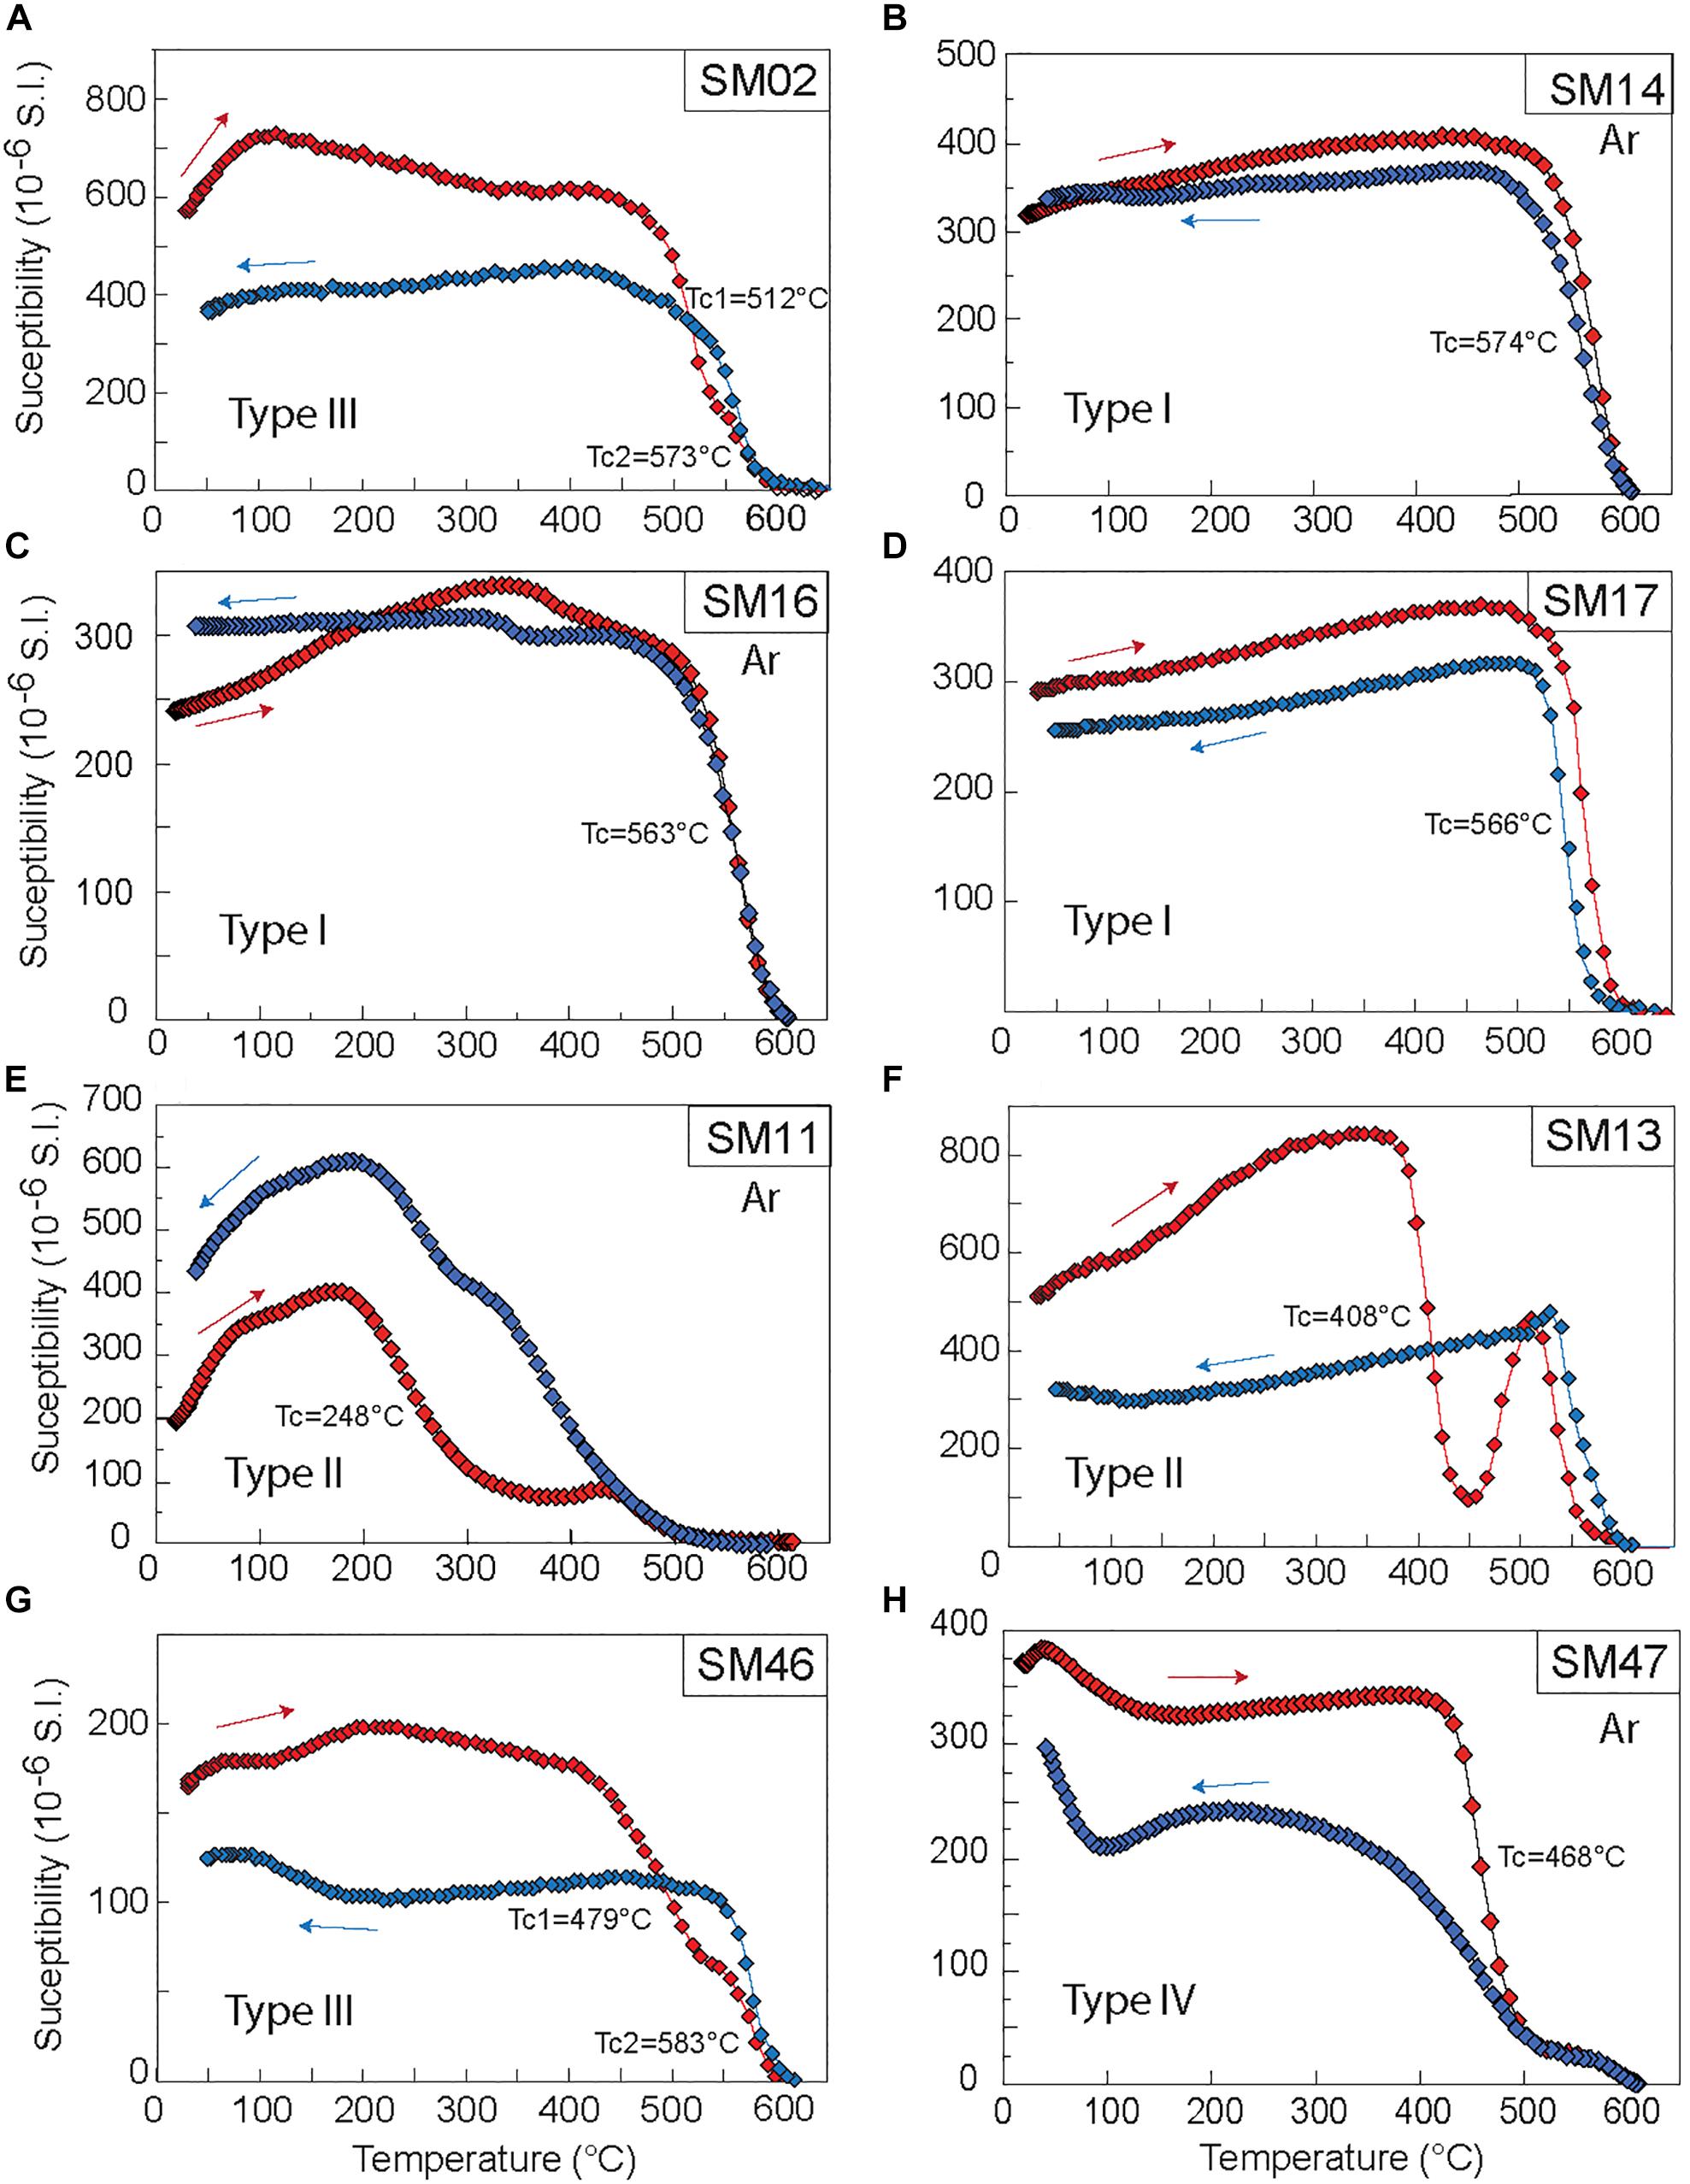
Figure 2. (A–H) Magnetic susceptibility versus temperature (red and blue curves for heating and cooling, respectively) of 8 representative samples. The Curie temperatures corresponding to the inflection point during the decrease in susceptibility is given for each sample. Ar is for experiments under Argon atmosphere. Type I is for samples showing Tc around 550–580°C with broadly reversible behavior indicating low-Ti titanomagnetite and magnetite, Type II is for samples with titanomagnetite and titanomaghemite with irreversible behavior. Type III is for samples with a mixing of titanomagnetite with various amount of Ti causing Tc below 550°C, Type IV is for SM47 showing marked irreversibility with lower Tc during the cooling leg compared to heating leg.
Hysteresis loops are rather narrow and rapid saturation of isothermal remanent magnetization below 0.2 T reveal low coercivity ferrimagnetic minerals. Magnetic hysteresis parameters are calculated after paramagnetic slope corrections. The ratio of saturation remanence to saturation magnetization (Mrs/Ms) is plot against the ratio of remanent coercive force to coercive force (Hcr/Hc) (as proposed by Day et al., 1977 and further in Dunlop, 2002a, b). Results are indicative of a variable mixture of single-domain (SD) and multi-domains (MD) magnetite particles (Figure 3A).
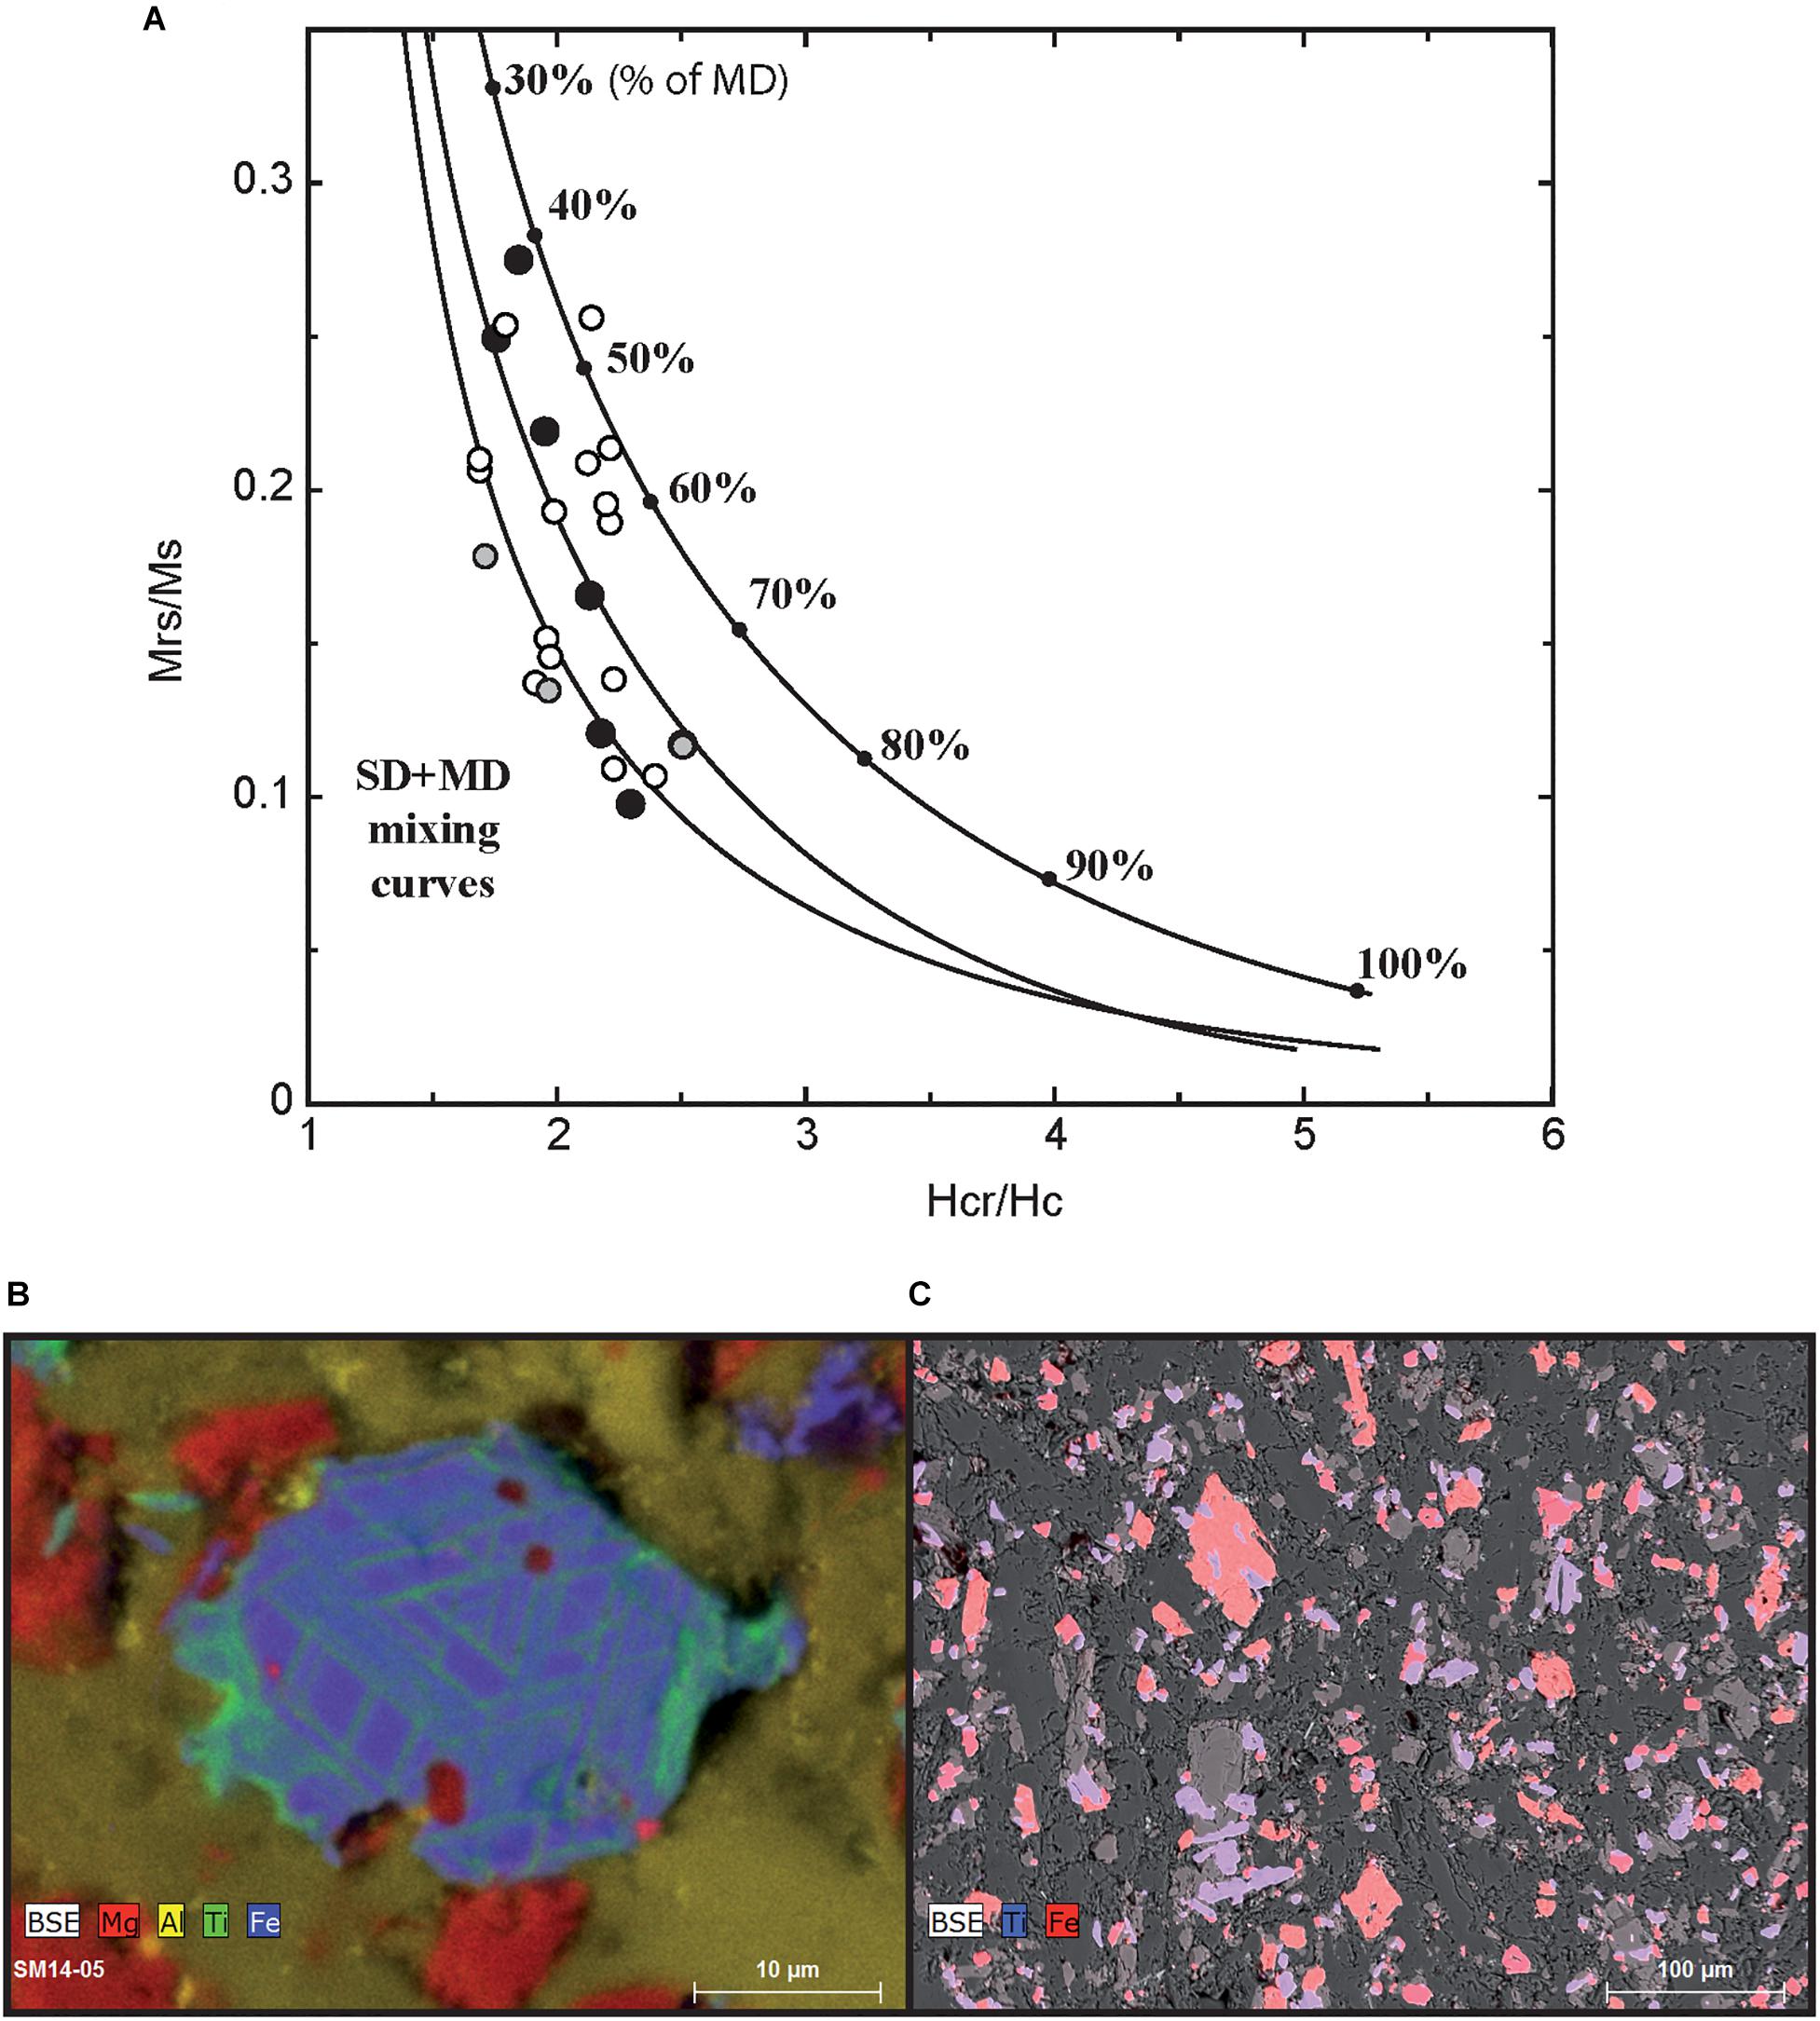
Figure 3. (A) Mrs/Ms versus Hcr/Hc ratios for each flow. Theoretical mixing curves of single-domain and multi-domains grains are shown in black lines (see Dunlop, 2002a, b). Most samples lie in the 40 to 80% MD area. (B,C) SEM images of iron oxide minerals. SEM and EDS-X element mapping images of thin section for samples SM14 (B) and SM11 (C).
Scanning electron microscopy (SEM) observations and EDS-X analyses were performed on SM05, SM10, SM11, SM12, SM13, SM14, SM33, and SM34. Images revealed a mixture of dendritic and euhedral (sometimes elongated) Ti-Fe oxide grains of small to moderate size (typically less than 20 μm) in a silicate matrix. Oxy-exsolution features forming alternating lamellae of magnetite and ilmenite are observed (as in SM14, Figure 3B), but in most cases theTi-Fe phases are well separated between homogeneous iron oxide phases with low to moderate Ti (Ti/Fe ratio in the range 0.05–0.3 depending on samples) and ilmenite (Figures 3B,C).
Paleomagnetic Directions and Relative Paleointensity
The characteristic component of remanent magnetization (ChRM) of 275 samples was determined after both alternating field (af) and thermal (Th) stepwise demagnetization. Examples of demagnetization diagrams in Figure 4 show that the ChRM was successfully isolated between 240 and 580°C (or 15–80 mT). In some cases, a secondary component was removed after applying a 15 mT af peak or after heating at 240°C. Most samples lost their magnetization between 540 and 580°C, suggesting low-Ti titanomagnetite and/or magnetite as the main carrier of the ChRM. A median destructive field of about 35 mT is consistent with the presence of pseudo-single domain magnetic grains (Özdemir and Dunlop, 1997).
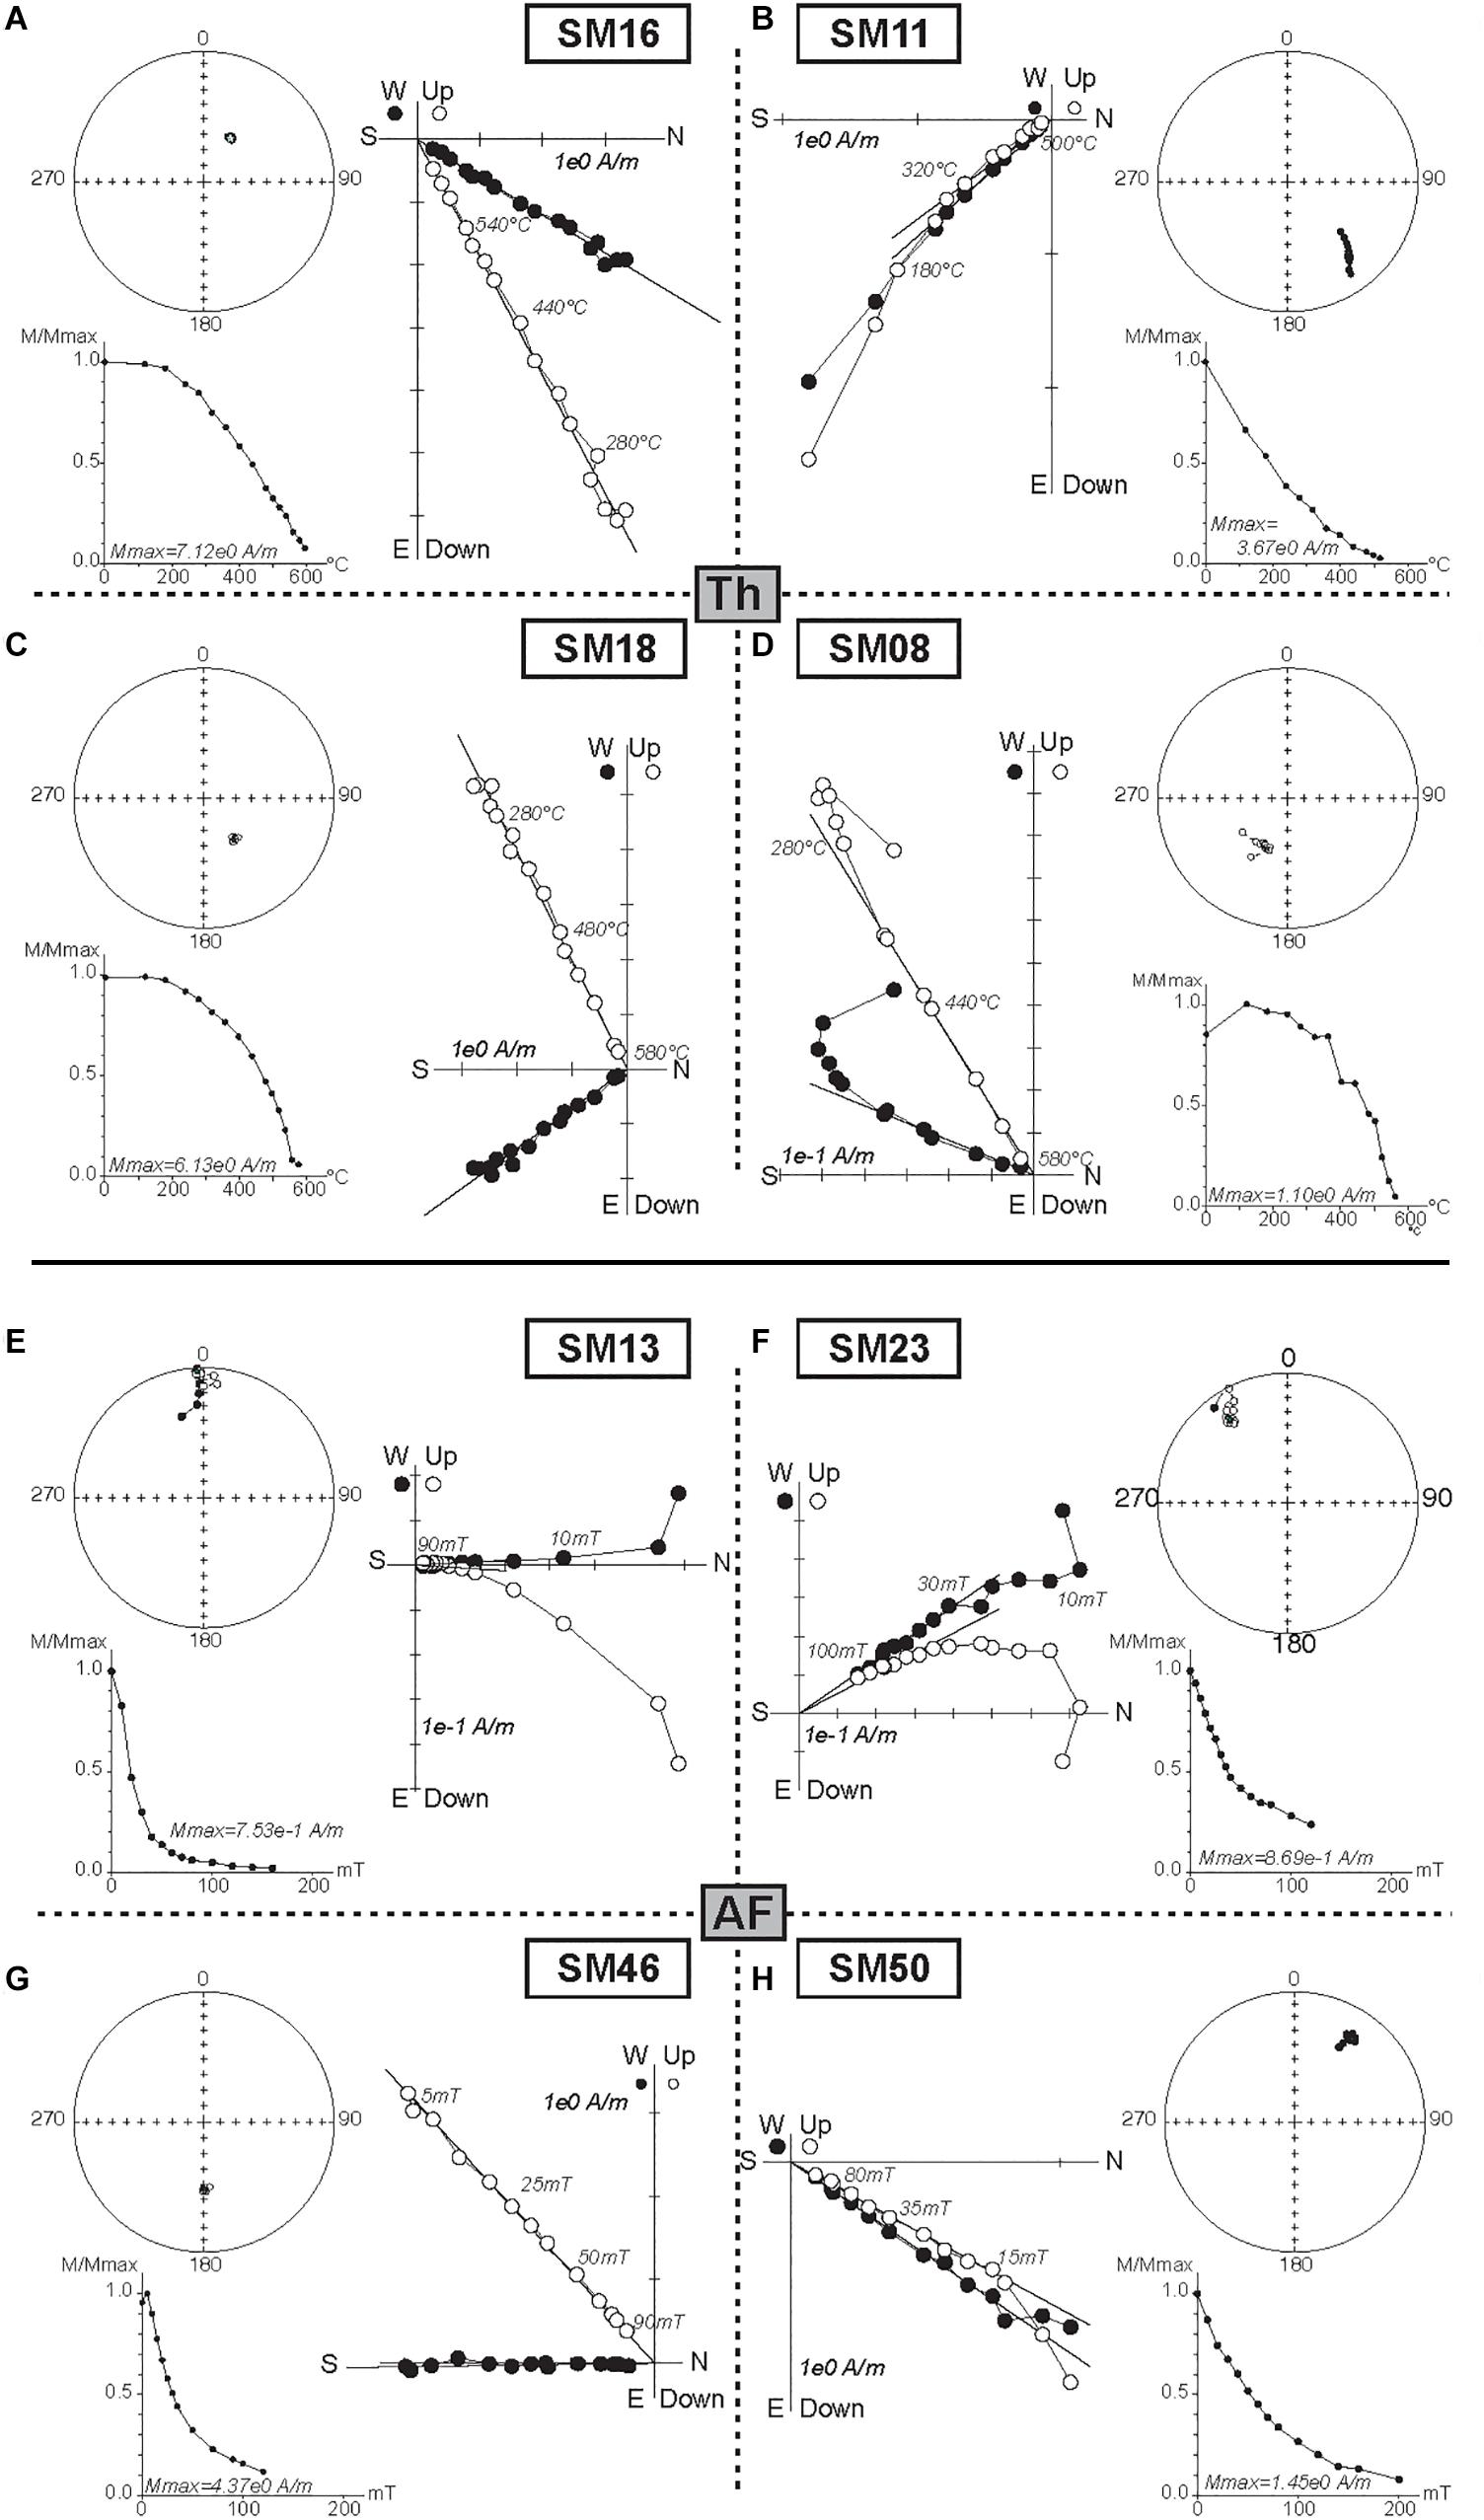
Figure 4. Typical demagnetization diagrams obtained by (A–D) thermal (Th) and (E–H) alternating field (af) treatments for 8 representative samples. Solid symbols correspond to projections onto the horizontal plane, while open symbols are projections onto the vertical plane. Insets show changes in magnetization intensity (M) after each demagnetization step.
The mean flow directions were obtained using Fisher statistics (Fisher, 1953) and are summarized in Table 1. Data quality (Cromwell et al., 2018) can be assessed from the Fisher precision parameter, which is above 50 for all flows (Table 1), except flow SM11 with a value of 36.1. Two lava flows from the bottom of the section (SM02 and SM03) have previously been analyzed by Johnson et al. (1998). Our results are in close agreement with these previous measurements (Table 1). The declinations and inclinations of SM03 and SM04, SM05 and SM06, and those from SM21 and SM22 differ by less than 2.5°, and can thus be considered as one single unit that was emplaced over a very short time period (e.g., Carlut et al., 2000). This approach yields twenty-five independent directional units (Table 1). Twelve flows display a reverse polarity and ten a normal polarity (Table 1 and Figure 5). The directions of the three lava flows SM11, SM12 and SM23 (with a reversal angle that deviates by more than 30° from full polarity and VGP latitudes lower than 50°) are referred as transitional directions (Table 1).
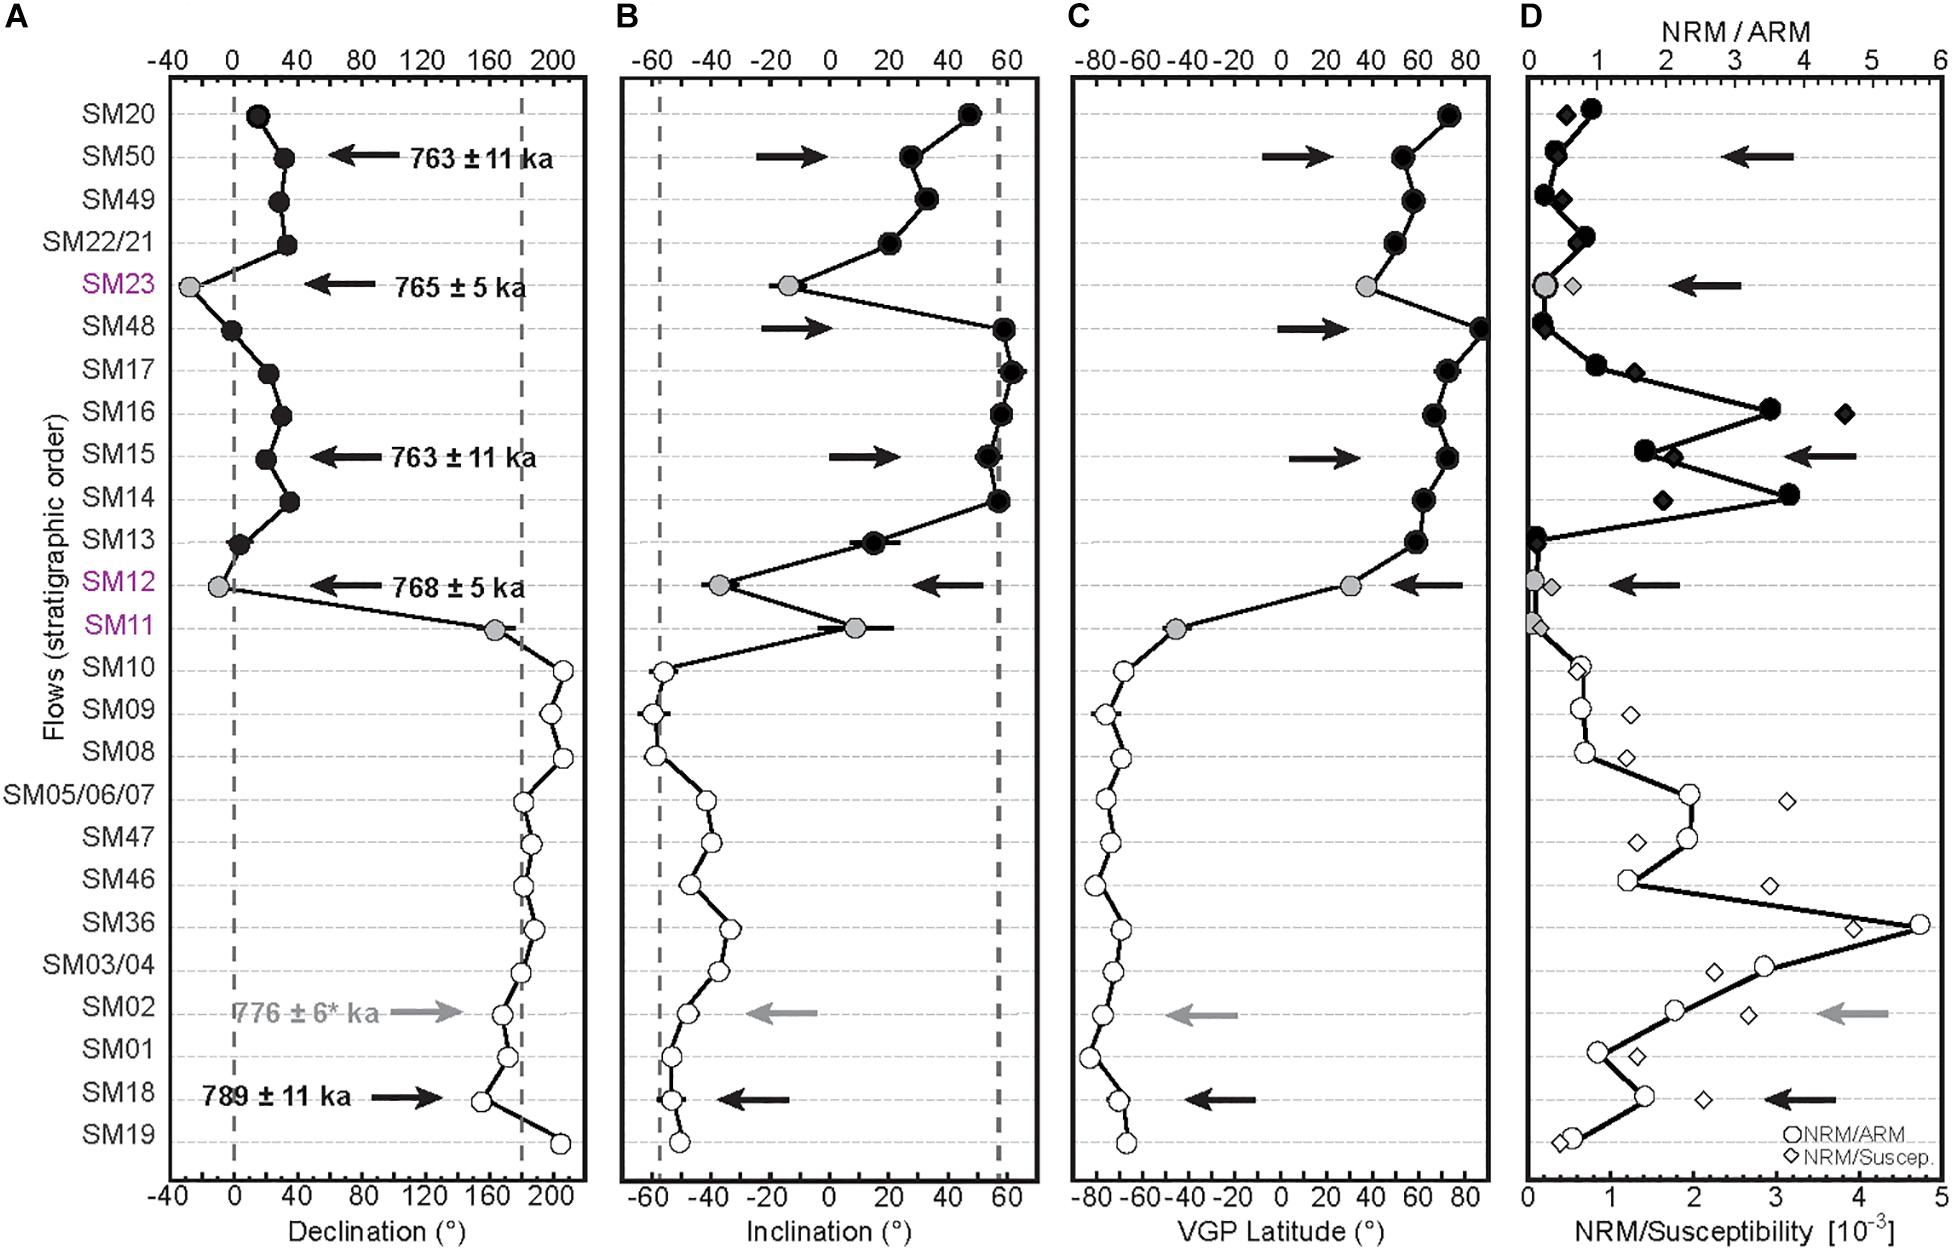
Figure 5. Mean Declination (A), inclination (B), paleolatitude of virtual geomagnetic poles (C) and relative paleointensity (D) of each flow plotted by order of appearance in the sequence. Arrow heads indicate flows with an age obtained in this study and/or from Johnson et al. (1998) (SM02).
Due to the large number of samples required for the magnetic measurements as well as for dating the remaining collection of samples was not large enough to carry out detailed experiments of absolute paleointensity. Instead, we attempted relative paleointensity experiments (see e.g., Levi and Banerjee, 1976; Tauxe et al., 1995) assuming that the very large drop of field intensity that prevails during a reversal has a much larger consequence on the evolution of magnetization intensity between flows than possible changes induced by mineralogical changes. In order to compensate for changes in magnetic concentration, we used the NRM versus ARM values average over several demagnetization step (see the Paleomagnetic treatment section) our best approximation for relative paleointensity (examples are shown in Supplementary Figure S1). The lack of correlation between NRM/ARM and the hysteresis parameters as well as with the coercive field H1/2 further indicates the absence of direct control of the slopes by rock magnetic changes (see Supplementary Figure S2). Note also that the amplitude of the ARM changes is low compared to the NRM variations. For all these reasons, we are thus confident that NRM/ARM can be interpreted as a first-order in terms of evolution of the field intensity changes that prevailed during this period.
The results of relative paleointensity (Figure 5D) show the dominance of very low field during the emplacement of flows SM11, SM12, and SM13 and again at the end of the section for flows SM48, SM23, SM49, and SM50. In between these two periods, a recovery is indicated by several flows (SM14, SM15, and SM16) with higher NRM/ARM values.
K-Ar Dating
For each sample, potassium (K) and argon (Ar) were measured at least twice, and the mean age was obtained when independent measurements were consistent at the 1σ level. Six independent measurements on the HDB-1 standard were performed during the present study. Their mean age of 24.19 Ma ± 0.12 Ma (Standard Deviation 1σ) is in full agreement with the recommended value of 24.21 Ma (Hess and Lippolt, 1994). These results rule out the possibility of significant bias linked to the calibration of the mass spectrometer.
The geochronological results are summarized in Table 2. Five new K-Ar ages were obtained between the bottom and top of the section. For samples SM12 and SM23, four and seven independent measurements of K and Ar, respectively, were performed to improve the statistical error on the mean age. Sample SM18 located at the bottom of the section yielded a K-Ar age of 789 ± 11 ka, which is in full agreement with the overlying flow 40Ar/39Ar age of 776 ± 6 ka (sample AZ28, Johnson et al., 1998) recalculated at 789 ± 6 ka (relative to HD-B1 at 24.21 Ma, using the intercalibration of Kuiper et al. (2008) for Taylor Creek sanidine compared to MMhb-1, and that of Schwarz and Trieloff (2007) for the intercalibration between MMhb-1 and HD-B1 standards). The transitional lava flow SM12 has an age of 768 ± 5 ka. An age of 762 ± 11 ka was obtained for SM15, a normal polarity lava flow that lies four flows above SM12. The transitional flow SM23 has a similar age of 765 ± 5 ka while the normal polarity sample SM50 at the top of the section has an age of 763 ± 11 ka.
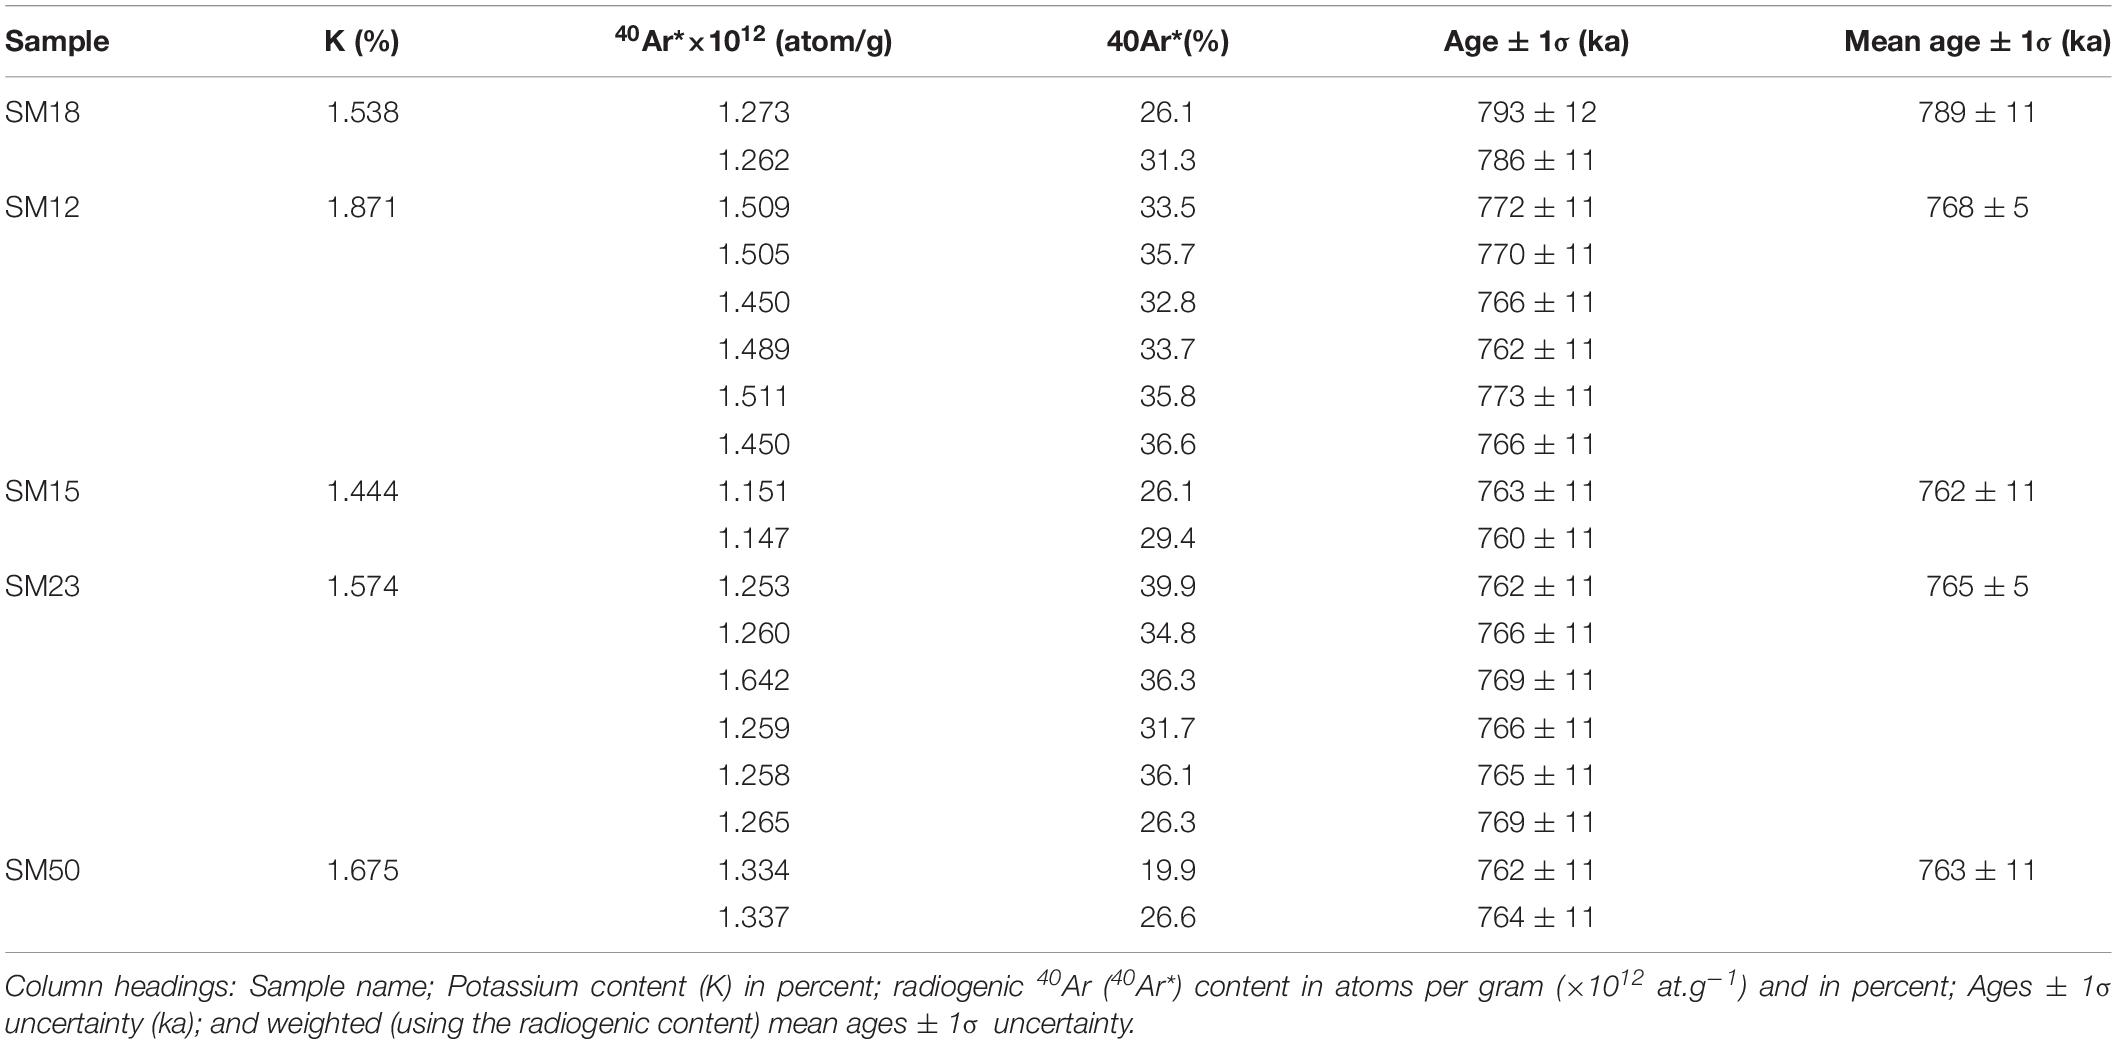
Table 2. Dating results.
Based on recent compilations of sedimentary records, the Matuyama-Brunhes reversal has been dated around 773 ka (e.g., Valet et al., 2019). It is characterized by rather complex field behavior (Channell, 2017) and a period of low intensity for about 12 kyr (e.g., Channell et al., 2004). The most detailed sedimentary records show the occurrence of a precursor event about 15 kyr before the actual reversal at around 790 ka (Channell et al., 2008). This precursor was likely also recorded in lavas from: – Chile, with mean 40Ar/39Ar ages for transitional flows at 792 ± 3 ka (Brown et al., 2004); - Tahiti, Punaruu North with a collection of 40Ar/39Ar ages from transitional and normal flows older than 785 ka (Singer et al., 2005, 2019; Balbas et al., 2018) – La Palma, with mean K-Ar ages bracketing the reverse to normal transition at 786 ± 3 ka (Quidelleur et al., 2003), and between 780.3 ± 10.3 and 803.3 ± 9.3 ka for a group of 3 transitional flows at Baranco de Los Tilos (40Ar/39Ar ages, Singer et al. (2002), see also younger estimation at around 773 ± 3 ka in Singer et al., 2019) - Guadeloupe, with mean K-Ar ages at 781 ± 18 ka from a section of 3 lavas that record a succession of transitional-reverse-normal directions (Carlut et al., 2000), and 40Ar/39Ar ages varying from 779 ± 6 ka (Singer, 2014) to 784.4 ± 4.3 ka (Brown et al., 2013).
In fact, the actual transition would have only been recorded by transitional flows from Punaruu South and Maui as suggested by 40Ar/39Ar ages at, respectively, 776 ± 3 ka and 773 ± 2 ka; Singer et al., 2019). A single transitional flow from Martinique (Caribbean islands) with a K-Ar age of 770 ± 11 ka (Tanty et al., 2015) may be added to this set of M-B transitional lavas. These ages are for the actual transition are also consistent with the results obtained from the North Atlantic Ocean sediments (Channell, 2017) and agree with the U-Pb and astrochronological age of 770.2 ± 7.0 ka (2σ) obtained for the Chiba section (Suganuma et al., 2015).
A rebound following the reversal has been predicted on statistical hypothesis (Valet et al., 2012). It has been observed in sediments from the Chiba composite section (Okada et al., 2017). Assuming that the precursor and rebound would both be included in the reversal process, the whole M-B event could have lasted some 30 kyr or more (e.g., Valet et al., 2014; Balbas et al., 2018).
The 25 independent flows from the São Miguel Nordeste section with ages varying from 789 ± 11 to 763 ± 11 ka (1σ) bracket the M-B boundary and provide an opportunity to constrain further the instabilities associated with the reversal. The agreement between the age of the transitionally magnetized flow SM12 (768 ± 5 ka, 1σ) and the recently proposed astrochronological age at 772.4 ± 6.6 ka (1σ, Valet et al., 2019) indicates that these lavas recorded the M-B transition itself.
Discussion
Characteristics of the Transitional Field
The transitional VGPs from the Nordeste section switch from reverse to normal polarity across the South Atlantic Ocean, the North Pacific Ocean, and eastern Russia. It has been suggested that VGPs clusters over Australia, South America, northeast Asia and northeastern Canada (Hoffman, 2000) during the M-B transition would indicate a control of the field by the lower mantle. The expression of non-dipole field components and the fragmentary temporal succession of the lavas hamper a direct comparison between sites (e.g., Mochizuki et al., 2011). Keeping this in mind, we compile below the available transitional VGPs with ages compatible with the transition (i.e., clustering around 770 ka).
The small set that emerges from this work is shown in Figure 6 and incorporates VGPs from SM11, SM12, and SM23 (this study), MT06 from Martinique (Tanty et al., 2015), flows 42 to 59 from Maui (Coe et al., 2004) and R1T to TT from Tahiti (Chauvin et al., 1990). We compared the volcanic VGPs with those derived from the high-resolution record of the last reversal in the North Atlantic Ocean (Channell, 2017). However, we restrained the analysis to those VGPs that were derived from measurements of discrete samples at site U1306. Indeed, the U-channel measurements that were systematically performed at the other sites may have artificially generated erroneous transitional directions (Philippe et al., 2018). This selection is evidently far from being exhaustive, but is a conservative first step for comparison with the best resolution sedimentary records. The four groups that can be discerned from the sediment directions are shown in gray in Figure 6. They are located over the south and central Atlantic Ocean, eastern Asia and the central Pacific Ocean. The VGPs from SM12, SM23, and MT06 are located in the northern Pacific Ocean, which may indicate that a “stationary feature” was recorded in the lava flows from North Atlantic Ocean sites. The occurrence of such “stationary features” of the geomagnetic field has been suggested by Hoffman and Singer (2004) who observed geographically “preferred” VGP behavior apparent from regionally partitioned paleomagnetic data. Also, Channell et al. (2004) proposed that North Atlantic IODP sites show clusters of VGPs and that polarity transition fields have characteristics similar to the modern non-axial-dipole (NAD) field. In this view large regions could be dominated by mantle-controlled flux and show cluster of VGPs. However, in our North Atlantic set VGPs from SM12, SM23, and MT06 are not mirrored in the sedimentary record from site U1306. At the onset of the reversal, the SM11 (Azores) and 42 (Maui) flows both have a VGP in the South Atlantic Ocean falling within a large VGP cluster in the site U1306 record, but on the other hand the VGP cluster over New Zealand and north America in the Maui data does not correlate with other sites (Figure 6).
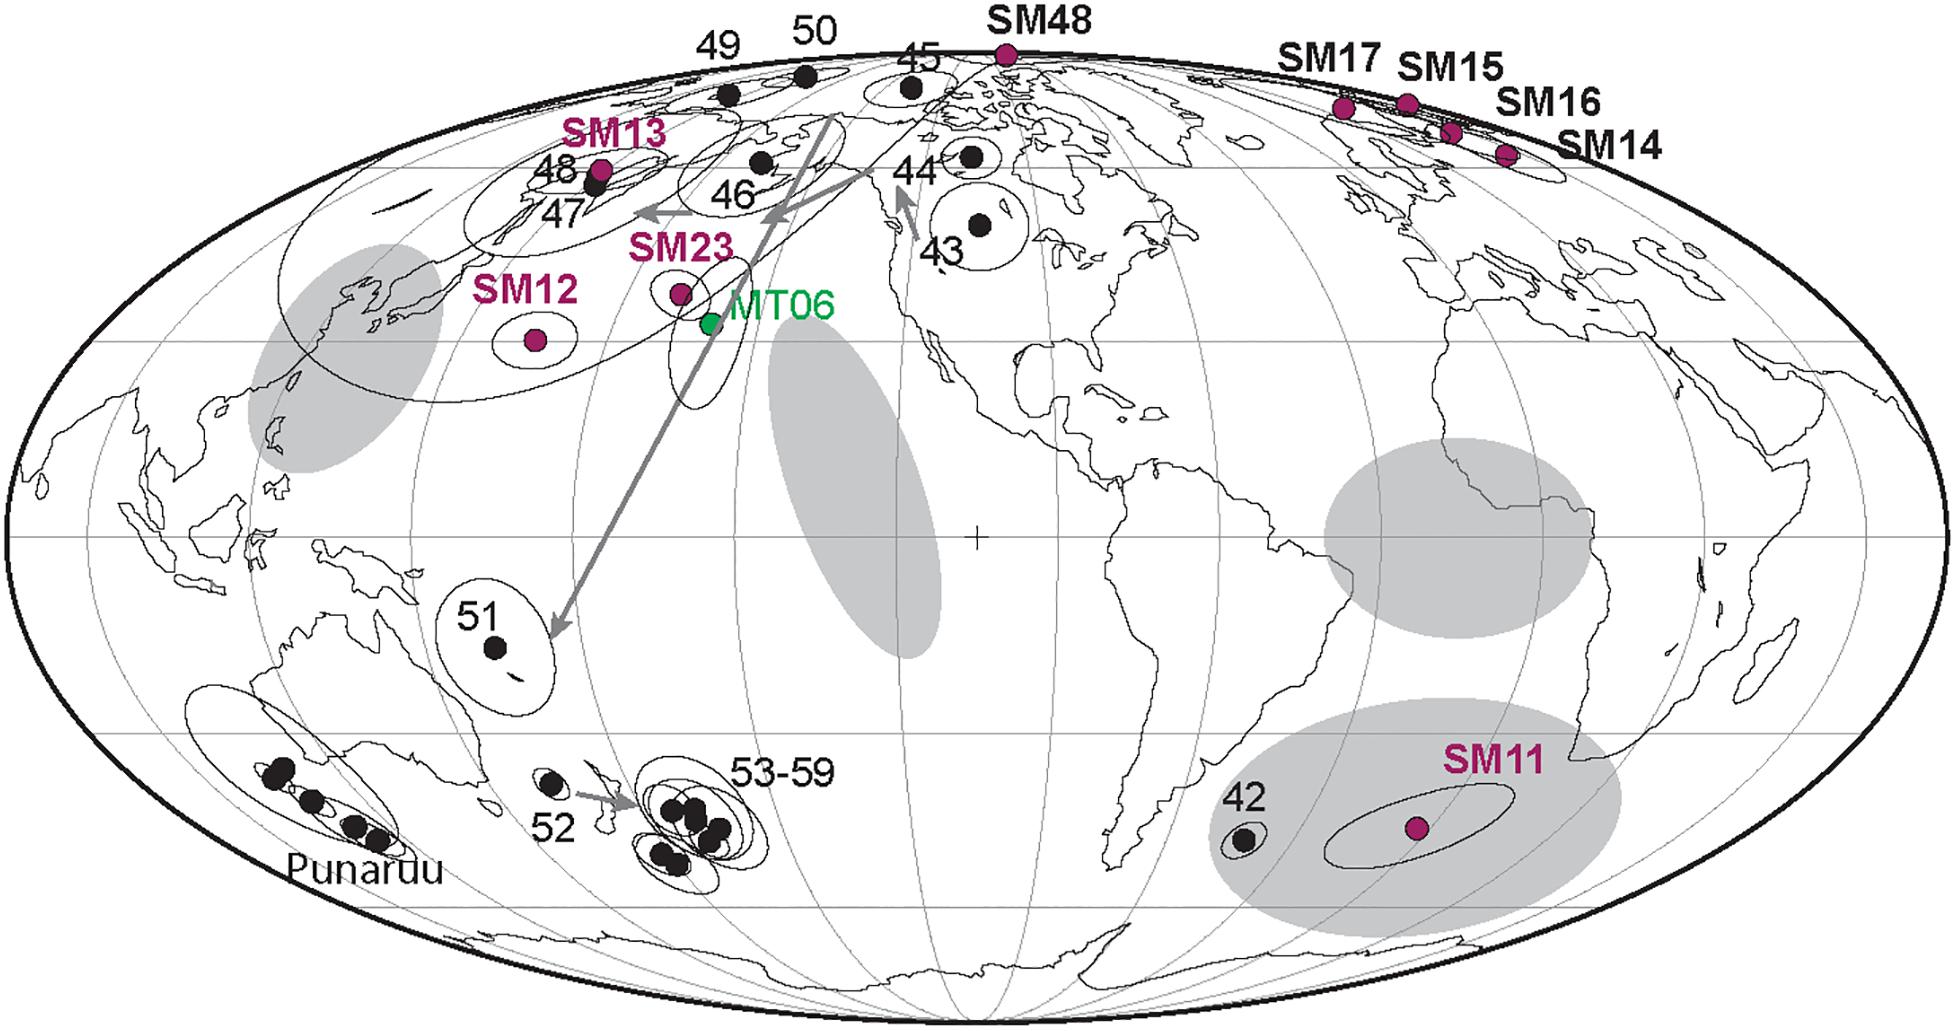
Figure 6. Virtual Geomagnetic Poles of samples dated circa 770 ka from the Maui (Coe et al., 2004), Martinique (Tanty et al., 2015), Tahiti (Chauvin et al., 1990), and Azores volcanic sequences that recorded the last reversal. Gray areas indicate the locations of the VGP groups from site U1306 sediments in North Atlantic Ocean (Channell, 2017).
Summarizing, this small dataset provides at least 7 groups of VGPs without any real statistical significance, which are therefore simply representative of a complex transitional field geometry.
Is the M-B Reversal a Three Phases Process?
The reversal process has been depicted in three phases that incorporate a precursor, the reversal itself, and a rebound (e.g., Valet et al., 2012). To our knowledge, no volcanic record of the rebound has been firmly reported so far. However, a rebound may be present in the Maui record where the VGPs from flows 51–59 depict a loop over the South Pacific Ocean after the reverse-normal polarity transition documented by the VGPs from flows 42 to 44 (Figure 5 and data from Coe et al., 2004). The transitional flows SM11 and SM12 from this study are followed by six normal polarity lava flows with four northern-latitude VGPs and strong relative paleointensity which testify the restoration of a dipolar field after completion of the transition. Overlying these flows, the transitional VGP in the Northern Pacific Ocean and the low field intensity of flow SM23 may be a signature of the rebound that followed the reversal.
The twelve reverse polarity flows in the lower part of the São Miguel section are characterized by a mean inclination of −49.5° (α95 = 7.1°) that is ∼8° lower than the Geocentric Axial Dipole (GAD) inclination at the site (57.2°) while low relative paleointensities are recorded by the lowermost three flows (SM19, SM18 and SM01). The ten normal polarity flows following the transition display a mean inclination of 46.8° (α95 = 11.8°), which is also different from the GAD expected inclination. We thus may have sampled a period of geomagnetic instability that would extend to flows preceding and following the transition, and therefore associated with lower dipolar field and enhanced contribution of non-dipolar components. However, only confirmation by absolute paleointensities will allow to determine if these flows have recorded a peculiar pre- and post- reversal field.
After integrating the São Miguel record with other volcanic and high-resolution sediment records of the last reversal, we thus favor a scenario in which three successive phases would have punctuated the period of the reversing field during the M-B transition. Owing to their age the São Miguel and Maui records could be the only two volcanic sequences that document the actual reverse-normal transition. The ages of the transitional directions from the other volcanic records of the last reversal are in fact more consistent with the precursor that occurred around 780–790 ka. In these two sections the occurrence of transitional VGPs after the actual reversal might represent a partial signature of a rebound that occurred soon after the transition. These results highlight the complex character of the M-B reversal, and bring additional insights to our understanding of the magnetic field during a reversal.
Data Availability Statement
The original contributions presented in the study are included in the article/Supplementary Material, further inquiries can be directed to the corresponding author/s.
Author Contributions
JR, JC, FM, and AH designed the project and contributed to the sampling. J-PV managed the ERC project. JR performed the magnetic experiments. JR, JC, and J-PV analyzed the results. JR and AH performed the geochronological analyses. All authors contributed to writing and editing of the manuscript.
Funding
This research was funded by the European Research Council (ERC) under the European Union’s Seventh Framework Program (FP7/2007–2013)/ERC advanced grant agreement GA 339899. This is IPGP contribution 4135.
Conflict of Interest
The authors declare that the research was conducted in the absence of any commercial or financial relationships that could be construed as a potential conflict of interest.
Acknowledgments
We are grateful to Vittorio Zanon for his kind contribution in field work logistic. We thank Louise Dauchy Tric and Coline Dejean for their help during laboratory treatment and Mark Dekkers for his comment on an earlier version of the manuscript.
Supplementary Material
The Supplementary Material for this article can be found online at: https://www.frontiersin.org/articles/10.3389/feart.2020.00165/full#supplementary-material
FIGURE S1 | NRM/ARM determined at different demagnetization steps for 8 samples.
FIGURE S2 | H1/2 and Mrs/Ms versus NRM/ARM.
References
Balbas, A. M., Koppers, A. A., Clark, P. U., Coe, R. S., Reilly, B. T., Stoner, J. S., et al. (2018). Millennial-scale instability in the geomagnetic field prior to the matuyama-brunhes reversal. Geochem. Geophys. Geosyst. 19, 952–967. doi: 10.1002/2017gc007404
Bassinot, F. C., Labeyrie, L. D., Vincent, E., Quidelleur, X., Shackleton, N. J., and Lancelot, Y. (1994). The astronomical theory of climate and the age of the Brunhes-Matuyama magnetic reversal. Earth Planet. Sci. Lett. 126, 91–108. doi: 10.1016/0012-821x(94)90244-5
Brown, L. L., Singer, B. S., Pickens, J. C., and Jicha, B. R. (2004). Paleomagnetic directions and 40Ar/39Ar ages from the Tatara-San pedro volcanic complex, Chilean Andes: lava record of a Matuyama-Brunhes precursor? J. Geophys. Res. Solid Earth 109. doi: 10.1029/2004JB003007
Brown, M. C., Jicha, B. R., Singer, B. S., and Shaw, J. (2013). Snapshot of the Matuyama-Brunhes reversal process recorded in 40Ar/39Ar-dated lavas from Guadeloupe, West Indies. Geochem. Geophys. Geosyst. 14, 4341–4350. doi: 10.1002/ggge.20263
Calvert, A. T., Moore, R. B., McGeehin, J. P., and da Silva, A. M. R. (2006). Volcanic history and 40Ar/39Ar and 14C geochronology of Terceira Island, Azores, Portugal. J. Volcanol. Geotherm. Res. 156, 103–115. doi: 10.1016/j.jvolgeores.2006.03.016
Carlut, J., Quidelleur, X., Courtillot, V., and Boudon, G. (2000). Paleomagnetic directions and K/Ar dating of 0-1 Ma lava flows from La Guadeloupe Island (French West Indies): implications for time average field models. J. Geophys. Res. 105, 835–849. doi: 10.1029/1999jb900238
Channell, J. E. T. (2017). Complexity in Matuyama–Brunhes polarity transitions from North Atlantic IODP/ODP deep-sea sites. Earth Planet. Sci. Lett. 467, 43–56. doi: 10.1016/j.epsl.2017.03.019
Channell, J. E. T., Curtis, J. H., and Flower, B. P. (2004). The Matuyama-Brunhes boundary interval (500-900 ka) in North Atlantic drift sediments. Geophys. J. Int. 158, 489–505. doi: 10.1111/j.1365-246x.2004.02329.x
Channell, J. E. T., Hodell, D. A., Singer, B. S., and Xuan, C. (2010). Reconciling astrochronological and 40Ar/39Ar ages for the Matuyama-Brunhes boundary and late Matuyama chron. Geochem. Geophys. Geosyst. 11, 1525–1527.
Channell, J. E. T., Hodell, D. A., Xuan, C., Mazaud, A., and Stoner, J. S. (2008). Age calibrated relative paleointensity for the last 1.5 Myr at IODP Site U1308 (North Atlantic). Earth Planet. Sci. Lett. 274, 59–71. doi: 10.1016/j.epsl.2008.07.005
Chauvin, A., Roperch, P., and Duncan, R. A. (1990). Records of geomagnetic reversals from volcanic islands of French Polynesia: 2. Paleomagnetic study of a flow sequence (1.2–0.6 Ma) from the island of Tahiti and discussion of reversal models. J. Geophys. Res. Solid Earth 95, 2727–2752.
Coe, R. S., Singer, B. S., Pringle, M. S., and Zhao, X. (2004). Matuyama–Brunhes reversal and Kamikatsura event on Maui: paleomagnetic directions, 40Ar/39Ar ages and implications. Earth Planet. Sci. Lett. 222, 667–684. doi: 10.1016/j.epsl.2004.03.003
Cogne, J. P. (2003). PaleoMac: a MacintoshTM application for treating paleomagnetic data and making plate reconstructions. Geochem. Geophys. Geosyst. 4:1007.
Costa, A. C. G., Marques, F. O., Hildenbrand, A., Sibrant, A. L. R., and Catita, M. S. (2014). Large-scale catastrophic flank collapses in a steep volcanic ridge: the pico–faial ridge, azores triple junction. J. Volc. Geoth. Res. 272, 111–125. doi: 10.1016/j.jvolgeores.2014.01.002
Cromwell, G., Johnson, C. L., Tauxe, L., Constable, C. G., and Jarboe, N. A. (2018). PSV10: a global data set for 0–10 Ma time-averaged field and paleosecular variation studies. Geochem. Geophys. Geosyst. 19, 1533–1558. doi: 10.1002/2017gc007318
Day, R., Fuller, M., and Schmidt, V. A. (1977). Hysteresis properties of titanomagnetites: grain-size and compositional dependence. Phys. Earth Planet. Interiors 13, 260–267. doi: 10.1016/0031-9201(77)90108-x
Dunlop, D. J. (2002a). Theory and application of the Day plot (Mrs/Ms versus Hcr/Hc) 1. Theoretical curves and tests using titanomagnetite data. J. Geophys. Res. Solid Earth 107, 4–22.
Dunlop, D. J. (2002b). Theory and application of the Day plot (Mrs/Ms versus Hcr/Hc) 2. Application to data for rocks, sediments, and soils. J. Geophys. Res. Solid Earth 107, 260–267.
Evans, M. E., and Muxworthy, A. R. (2018). A re-appraisal of the proposed rapid Matuyama–Brunhes geomagnetic reversal in the Sulmona Basin, Italy. Geophys. J. Int. 213, 1744–1750. doi: 10.1093/gji/ggy111
Gillot, P.-Y., and Cornette, Y. (1986). The Cassignol technique for Potassium—Argon dating, precision and accuracy: examples from the Late Pleistocene to Recent volcanism from southern Italy. Chem. Geol. 59, 205–222. doi: 10.1016/0168-9622(86)90072-2
Gillot, P.-Y., Cornette, Y., and Guille, G. (1992). Age (K-Ar) et conditions d’édification du soubassement volcanique de l’atoll de Mururoa (Pacifique Sud). CRAS 314, 393–399.
Hess, J. C., and Lippolt, H. J. (1994). Compilation of K-Ar measurements on HD-B1 standard biotite. Phanerozoic time scale,.bull. liais. inform. iugs subcomm. on geochrono. Int. Geol. Correl. Program. Paris 12, 19–23.
Hildenbrand, A., Marques, F. O., and Catalão, J. (2018). Large-scale mass wasting on small volcanic islands revealed by the study of Flores Island (Azores). Nat. Sci. Rep. 8:13898.
Hoffman, K. A. (2000). Temporal aspects of the last reversal of Earth’s magnetic field. Philos. Trans. R. Soc. Lond. Ser. A Math. Phys. Eng. Sci. 358, 1181–1190. doi: 10.1098/rsta.2000.0580
Hoffman, K. A., and Singer, B. S. (2004). Regionally recurrent paleomagnetic transitional fields and mantle processes. Timescales Paleomagn. Field 145, 233–243. doi: 10.1029/145gm17
Johnson, C. L., Wijbrans, J. R., Constable, C. G., Gee, J., Staudigel, H., Tauxe, L., et al. (1998). 40Ar/39Ar ages and paleomagnetism of São Miguel lavas, Azores. Earth Planet. Sci. Lett. 160, 637–649. doi: 10.1016/s0012-821x(98)00117-4
Kuiper, K. F., Deino, A., Hilgen, F. J., Krijgsman, W., Renne, P. R., and Wijbrans, A. J. (2008). Synchronizing rock clocks of Earth history. Science 320, 500–504. doi: 10.1126/science.1154339
Levi, S., and Banerjee, S. K. (1976). On the possibility of obtaining relative paleointensities from lake sediments. Earth Planet. Sci. Lett. 29, 219–226. doi: 10.1016/0012-821x(76)90042-x
Mark, D. F., Rennu, P. R., Dymock, R. C., Smith, V. C., Simon, J. I., Morgan, L. E., et al. (2017). High-precision 40Ar/39Ar dating of Pleistocene tuffs and temporal anchoring of the Matuyama-Brunhes boundary. Quat. Geochro. 39, 1–23.
Marques, F. O., Catalão, J. C., DeMets, C., Costa, A. C. G., and Hildenbrand, A. (2013). GPS and tectonic evidence for a diffuse plate boundary at the Azores triple junction. Earth Planet. Sci. Lett. 381, 177–187. doi: 10.1016/j.epsl.2013.08.051
Marques, F. O., Hildenbrand, A., and Hübscher, C. (2018). Evolution of a volcanic island on the shoulder of an oceanic rift and geodynamic implications: S. Jorge Island on the Terceira Rift, Azores triple junction. Tectonophysics 738, 41–50. doi: 10.1016/j.tecto.2018.05.012
Métrich, N., Zanon, V., Créon, L., Hildenbrand, A., Moreira, M., and Marques, F. O. (2014). Is the “Azores hotspot” a wetspot? Insights from the geochemistry of fluid and melt inclusions in olivine of Pico basalts. J. Petrol. 55, 377–393. doi: 10.1093/petrology/egt071
Mochizuki, N., Oda, H., Ishizuka, O., Yamazaki, T., and Tsunakawa, H. (2011). Paleointensity variation across the Matuyama-Brunhes polarity transition: observations from lavas at Punaruu Valley, Tahiti. J. Geophys. Res. Solid Earth 116. doi: 10.1029/2010JB008093
Oda, H., Shibuya, H., and Hsu, V. (2000). Palaeomagnetic records of the Brunhes/Matuyama polarity transition from ODP Leg 124 (Celebes and Sulu seas). Geophys. J. Int. 142, 319–338. doi: 10.1046/j.1365-246x.2000.00130.x
Okada, M., Suganuma, Y., Haneda, Y., and Kazaoka, O. (2017). Paleomagnetic direction and paleointensity variations during the Matuyama–Brunhes polarity transition from a marine succession in the Chiba composite section of the Boso Peninsula, central Japan. Earth Planet. Spac. 69:45.
Özdemir, Ö, and Dunlop, D. J. (1997). Effect of crystal defects and internal stress on the domain structure and magnetic properties of magnetite. J. Geophys. Res. Solid Earth 102, 20211–20224. doi: 10.1029/97jb01779
Petrovský, E., and Kapička, A. (2006). On determination of the Curie point from thermomagnetic curves. J. Geophys. Res.: Solid Earth 111. doi: 10.1029/2006JB004507
Philippe, ÉG., Valet, J. P., St-Onge, G., and Thevarasan, A. (2018). Are paleomagnetic records from U-channels appropriate for studies of reversals and excursions? Geochem. Geophys. Geosyst. 19, 4130–4142. doi: 10.1029/2018gc007803
Quidelleur, X., Carlut, J., Soler, V., Valet, J. P., and Gillot, P. Y. (2003). The age and duration of the Matuyama–Brunhes transition from new K–Ar data from La Palma (Canary Islands) and revisited 40Ar/39Ar ages. Earth Planet. Sci. Lett. 208, 149–163. doi: 10.1016/s0012-821x(03)00053-0
Rackzec, I., Stoll, B., Hofmann, A. W., and Jochum, K. P. (2001). High-precision trace element data for the USGS reference materials BCR-1, BCR-2, BHVO-1, BHVO-2, AGV-1, AGV-2, DTS-1, DTS-2, GSP-1 and GSP-2 by ID-TIMS and MIC-SSMS. Geostand. Newslett. 25, 77–86. doi: 10.1111/j.1751-908x.2001.tb00789.x
Readman, P. W., and O’Reilly, W. (1972). Magnetic properties of oxidized (cation-deficient) titanomagnetites (Fe, Ti, Z) 3O4. J. Geomag. Geoelec. 24, 69–90. doi: 10.5636/jgg.24.69
Ricci, J., Carlut, J., and Valet, J. P. (2018). Paleosecular variation recorded by Quaternary lava flows from Guadeloupe Island. Nat. Sci. Rep. 8:10147.
Ricci, J., Quidelleur, X., Pallares, C., and Lahite, P. (2017). High-resolution K-Ar dating of a complex magmatic system: the example of Basse-Terre Island (French West Indies). J. Volcanol. Geotherm. Res. 345, 142–160. doi: 10.1016/j.jvolgeores.2017.07.013
Sagnotti, L., Giaccio, B., Liddicoat, J. C., Caricchi, C., Nomade, S., and Renne, P. R. (2019). On the reliability of the Matuyama–Brunhes record in the Sulmona Basin—Comment to “A reappraisal of the proposed rapid Matuyama–Brunhes geomagnetic reversal in the Sulmona Basin, Italy” by Evans and Muxworthy. Geophys. J. Int. 216, 296–301. doi: 10.1093/gji/ggy427
Sagnotti, L., Giaccio, B., Liddicoat, J. C., Nomade, S., Renne, P. R., Scardia, G., et al. (2016). How fast was the Matuyama–Brunhes geomagnetic reversal? A new subcentennial record from the Sulmona Basin, central Italy. Geophys. J. Int. 204, 798–812. doi: 10.1093/gji/ggv486
Schwarz, W. H., and Trieloff, M. (2007). Intercalibration of 40Ar–39Ar age standards NL-25, HB3gr hornblende, GA1550, SB-3, HD-B1 biotite and BMus/2 muscovite. Chem. Geol. 242, 218–231. doi: 10.1016/j.chemgeo.2007.03.016
Sibrant, A. L. R., Hildenbrand, A., Marques, F. O., Weiss, B., Boulesteix, T., Hübscher, C., et al. (2015). Morpho-structural evolution of a volcanic island developed inside an active oceanic rift: S. Miguel Island (Terceira Rift, Azores). J. Volcanol. Geotherm. Res. 301, 90–106. doi: 10.1016/j.jvolgeores.2015.04.011
Singer, B. S. (2014). A Quaternary geomagnetic instability time scale. Quat. Geochro. 21, 29–52. doi: 10.1016/j.quageo.2013.10.003
Singer, B. S., Hoffman, K. A., Coe, R. S., Brown, L. L., Jicha, B. R., Pringle, M. S., et al. (2005). Structural and temporal requirements for geomagnetic field reversal deduced from lava flows. Nature 434, 633–636. doi: 10.1038/nature03431
Singer, B. S., Jicha, B. R., Mochizuki, N., and Coe, R. S. (2019). Synchronizing volcanic, sedimentary, and ice core records of Earth’s last magnetic polarity reversal. Sci. Adv. 5:eaaw4621. doi: 10.1126/sciadv.aaw4621
Singer, B. S., Relle, M. K., Hoffman, K. A., Battle, A., Laj, C., Guillou, H., et al. (2002). Ar/Ar ages from transitionally magnetized lavas on La Palma, Canary Islands, and the geomagnetic instability timescale. J. Geophys. Res. 107:2307.
Steiger, R., and Jäger, E. (1977). Subcommission on geochronology: convention on the use of decay constants in geo-and cosmochronology. Earth Planet. Sci. Lett. 36, 359–362. doi: 10.1016/0012-821x(77)90060-7
Suganuma, Y., Okada, M., Horie, K., Kaiden, H., Takehara, M., Senda, R., et al. (2015). Age of Matuyama-Brunhes boundary constrained by U-Pb zircon dating of a widespread tephra. Geology 43, 491–494. doi: 10.1130/g36625.1
Tanty, C., Carlut, J., Valet, J. P., and Germa, A. (2015). Palaeosecular variation recorded by 9 ka to 2.5-Ma-old lavas from Martinique Island: new evidence for the La Palma aborted reversal 617 ka ago. Geophys. J. Int. 200, 917–934.
Tauxe, L., Herbert, T., Shackleton, N. J., and Kok, Y. S. (1996). Astronomical calibration of the Matuyama-Brunhes boundary: consequences for magnetic remanence acquisition in marine carbonates and the Asian loess sequences. Earth Planet. Sci. Lett. 140, 133–146. doi: 10.1016/0012-821x(96)00030-1
Tauxe, L., Pick, T., and Kok, Y. S. (1995). Relative paleointensity in sediments: a pseudo-Thellier approach. Geophys. Res. Lett. 22, 2885–2888. doi: 10.1029/95gl03166
Valet, J.-P., Bassinot, F., Bouilloux, A., Bourlés, D., Nomade, S., Guillou, V., et al. (2014). Geomagnetic, cosmogenic and climatic changes across the last geomagnetic reversal from Equatorial Indian Ocean sediments. Earth Planet. Sci. Lett. 397, 67–79. doi: 10.1016/j.epsl.2014.03.053
Valet, J.-P., Bassinot, F., Simon, Q., Savranskaia, T., Thouveny, N., Bourlés, D. L., et al. (2019). Constraining the age of the last geomagnetic reversal from geochemical and magnetic analyses of Atlantic, Indian, and Pacific Ocean sediments. Earth Planet. Sci. Lett. 506, 323–331. doi: 10.1016/j.epsl.2018.11.012
Keywords: reversal, paleomagnetism, Matuyama Brunhes reversal, Azores Archipelago, magnetite, precursor, paleosecular variation
Citation: Ricci J, Carlut J, Marques FO, Hildenbrand A and Valet J-P (2020) Volcanic Record of the Last Geomagnetic Reversal in a Lava Flow Sequence From the Azores. Front. Earth Sci. 8:165. doi: 10.3389/feart.2020.00165
Received: 07 February 2020; Accepted: 29 April 2020;
Published: 05 June 2020.
Edited by:
Edgardo Cañón-Tapia, Center for Scientific Research and Higher Education in Ensenada (CICESE), MexicoReviewed by:
Marcia Ernesto, University of São Paulo, BrazilLuis Manuel Alva Valdivia, National Autonomous University of Mexico, Mexico
Copyright © 2020 Ricci, Carlut, Marques, Hildenbrand and Valet. This is an open-access article distributed under the terms of the Creative Commons Attribution License (CC BY). The use, distribution or reproduction in other forums is permitted, provided the original author(s) and the copyright owner(s) are credited and that the original publication in this journal is cited, in accordance with accepted academic practice. No use, distribution or reproduction is permitted which does not comply with these terms.
*Correspondence: Julie Carlut, Y2FybHV0QGlwZ3AuZnI=; amNhcmx1dEB5YWhvby5mcg==