 Mattia Pistone1,2*
 Lukas P. Baumgartner1
 Florence Bégué1
 Paul A. Jarvis3
 Elias Bloch1Martin Robyr1
 Othmar Müntener1
 Thomas W. Sisson4Jon D. Blundy5
- 1Institute of Earth Sciences, University of Lausanne, Lausanne, Switzerland
- 2Department of Geology, University of Georgia, Athens, GA, United States
- 3Section of Earth and Environmental Sciences, University of Geneva, Geneva, Switzerland
- 4US Geological Survey, Menlo Park, CA, United States
- 5School of Earth Sciences, University of Bristol, Bristol, United Kingdom
Melt and gas transfer processes are essential to the formation and growth of the Earth’s crust and for sustaining volcanic activity. These processes also play a major role in magma fractionation at shallow depths (<10 km) where magmas stall rheologically and solidify. In this scenario, the conditions of melt and gas mobilization during progressive cooling of crystal mushes down to their solidus remain poorly understood. We present experimental data (at 1.1 kbar) showing how a combination of temperature and crystal content control the ability of melt and gas to escape from cooling and solidifying hydrous silicic magmas with initial crystal volume fractions (Φ) of 0.6, 0.7, and 0.8, and for temperature snapshots of 850, 800, and 750°. Microstructural observations and chemical data show that the amount of extracted melt increases by 70% from 850 to 750° and by 40% from Φ = 0.6 to 0.8 at 750°, due to the formation of interconnected crystal frameworks, gas expansion in constricted pore space, and filter pressing during cooling. As a result, our experiments suggest that melt and gas extraction from cooling mushes increases in proximity to their solidus and can operate efficiently at 0.6 < Φ <0.93. These observations shed light on maximum estimates of the segregation of gas-rich, crystal-poor magmas (0.02 m/year at 850° to 9 m/year at 750°) to form felsic dykes or eruptible systems feeding volcanoes.
Introduction
Crystal fractionation does not depend solely upon gravitational separation of crystals from melt due to density differences (Wager et al., 1960; McKenzie, 1984; Spiegelman et al., 2001; Connolly et al., 2009; Schmidt et al., 2012); in crystal-rich magmas, other processes may operate. Bowen (1928), for example, avers that “the squeezing out of silicate melt residues by forces external or internal to crystal mushes may be the most important of all.” In the Earth’s shallow crust (<10 km; <2.5 kbar) where most of the erupting silicic magma reservoirs are located (Huber et al., 2019; Zhang et al., 2020), cooling magmas tend to be volatile-saturated (6–8 wt% H2O; Hui et al., 2009) and become crystal-rich (crystal fraction Φ > 0.4; Marsh, 1981; Dufek and Bachmann, 2010; Huber et al., 2010a), becoming extremely viscous over a very small temperature (T) range as they approach their solidus (Holtz and Johannes, 1994; Holtz et al., 2001; Pistone et al., 2013). These factors impede any gravitational segregetation of crystals from melt, yet there is clear field evidence for such segregation in natural rocks (Holness, 2018). Instead, these near-solidus systems are capable of releasing high-silica melt (formed during crystallization at low-pressure; Gualda and Ghiorso, 2013) through porous flow (Olsen et al., 2004) to form crystal-poor, evolved magmas of rhyolitic composition that are capable of eruption at the surface (Hildreth, 1981,2004; Marsh, 1981; Bachmann and Bergantz, 2004; Hildreth and Wilson, 2007; Dufek and Bachmann, 2010; Waters and Lange, 2017).
Using phase equilibria constraints in P–T–H2O space, most felsic magmas have initial H2O contents ranging from 5–7 wt% at 4 kbar to 4–5 wt% at 3 kbar and 2–4 wt% at 1 kbar at T = 750–900° (Clemens and Wall, 1981; Clemens et al., 1986; Webster et al., 1987; Whitney, 1988; Johnson and Rutherford, 1989; Dall’Agnol et al., 1994; Scaillet and Pichavant, 1994; Scaillet et al., 1995a,b). During magma cooling, extraction of hydrous silicic magmas is most likely at crystal fractions ranging between 0.5 and 0.7 (Dufek and Bachmann, 2010). This physical condition is then enhanced by the time spent by crystallizing magmas at conditions optimized for melt extraction: the longer magma spends at such conditions, the greater the amount of extracted residual melt (Huber et al., 2009; Dufek and Bachmann, 2010; Hartung et al., 2019). The competition between the rate of heat loss and the rate of latent heat release due to crystallization during progressive cooling and solidification of magmas exerts an important control on the extraction of interstitial melts (Huber et al., 2009; Caricchi and Blundy, 2015; Lee et al., 2015).
The process of melt transfer from large-volume melt domains to nearly solidified ones is similar to models of filter pressing (Robin, 1979; Sawyer and Robin, 1986; Brown et al., 1995). However, in a rheologically locked magma undergoing solidification, the diminished volume fraction of residual melt concentrates dissolved volatiles and favors exsolution of gaseous bubbles (Bacon, 1986; Sisson and Bacon, 1999; Masotta et al., 2010) and supercritical fluids or brines (Driesner, 2007; Driesner and Heinrich, 2007; Blundy et al., 2015; Afanasyev et al., 2018), a process known as (isobaric) second or resurgent boiling (e.g., Candela and Blevin, 1995; Candela, 1997; Su et al., 2016). Bubble growth is a function of many factors (Gonnermann and Manga, 2007, and references therein). At constant pressure, bubble growth is controlled by the balance between the rate of diffusion of H2O molecules toward the bubble-melt interface and the rate of viscous deformation of the surrounding melt (Proussevitch et al., 1993; Proussevitch and Sahagian, 1998; Liu and Zhang, 2000). Where the rate of deformation exceeds the rate of diffusion, growth is described as diffusion-limited, whereas the inverse is viscosity-limited (Navon et al., 1998; Colucci et al., 2015). Gas exsolution at low pressures (P < 4 kbar) causes the mush to expand, whereas its high viscosity (105 to 1018 Pa s; Sparks et al., 2019) resists inflation, along with the contribution of rigid reservoir/conduit walls that play in the background. In this scenario, gradients in Φ and vesiculation drive the melt toward regions of lower Φ, T, and P (Huber et al., 2010b; Parmigiani et al., 2016; Huber and Parmigiani, 2018). Under these conditions, felsic magmas become H2O-saturated and, thus, the presence of exsolved gas within the interstitial melt is likely. Indeed, field examples of plutonic felsic rocks with vuggy porosity, such as spherical vesicles, angular diktytaxitic voids, and miarolitic cavities, indicate the migration of intergranular melt and gas between interlocking crystals that act as a filter in solidifying mushes (Figure 1; Candela and Piccoli, 1995; Candela, 1997). Melt and supercritical fluid percolation generates out-of-equilibrium textures (e.g., Grosse et al., 2010; Vigneresse, 2015; Lissenberg and MacLeod, 2016; McCarthy and Müntener, 2016; Pistone et al., 2020). In cooling magmas emplaced in the shallow crust, melt and gas segregation can produce internal geochemical heterogeneities with macrorhythmic sequences of inter- and cross-connected melanocratic, mesocratic, and leucocratic units with vuggy porosity (Figures 1A–C), “foamy” rocks produced as a result of magma decompression following dyking and brecciation of pluton peripheries in contact with brittle country rocks (Figures 1D,E), and coarse-grained comb-layered pegmatite pods (Figure 1F) produced by “swinging eutectic point” (Balashov et al., 2000), adiabatic drop in pressure (Shannon et al., 1982), and chemical undercooling (Pistone et al., 2016) occurring rapidly with no achievement of chemical and textural equilibrium (e.g., Fenn, 1977; Webber et al., 1997; Nabelek et al., 2010).
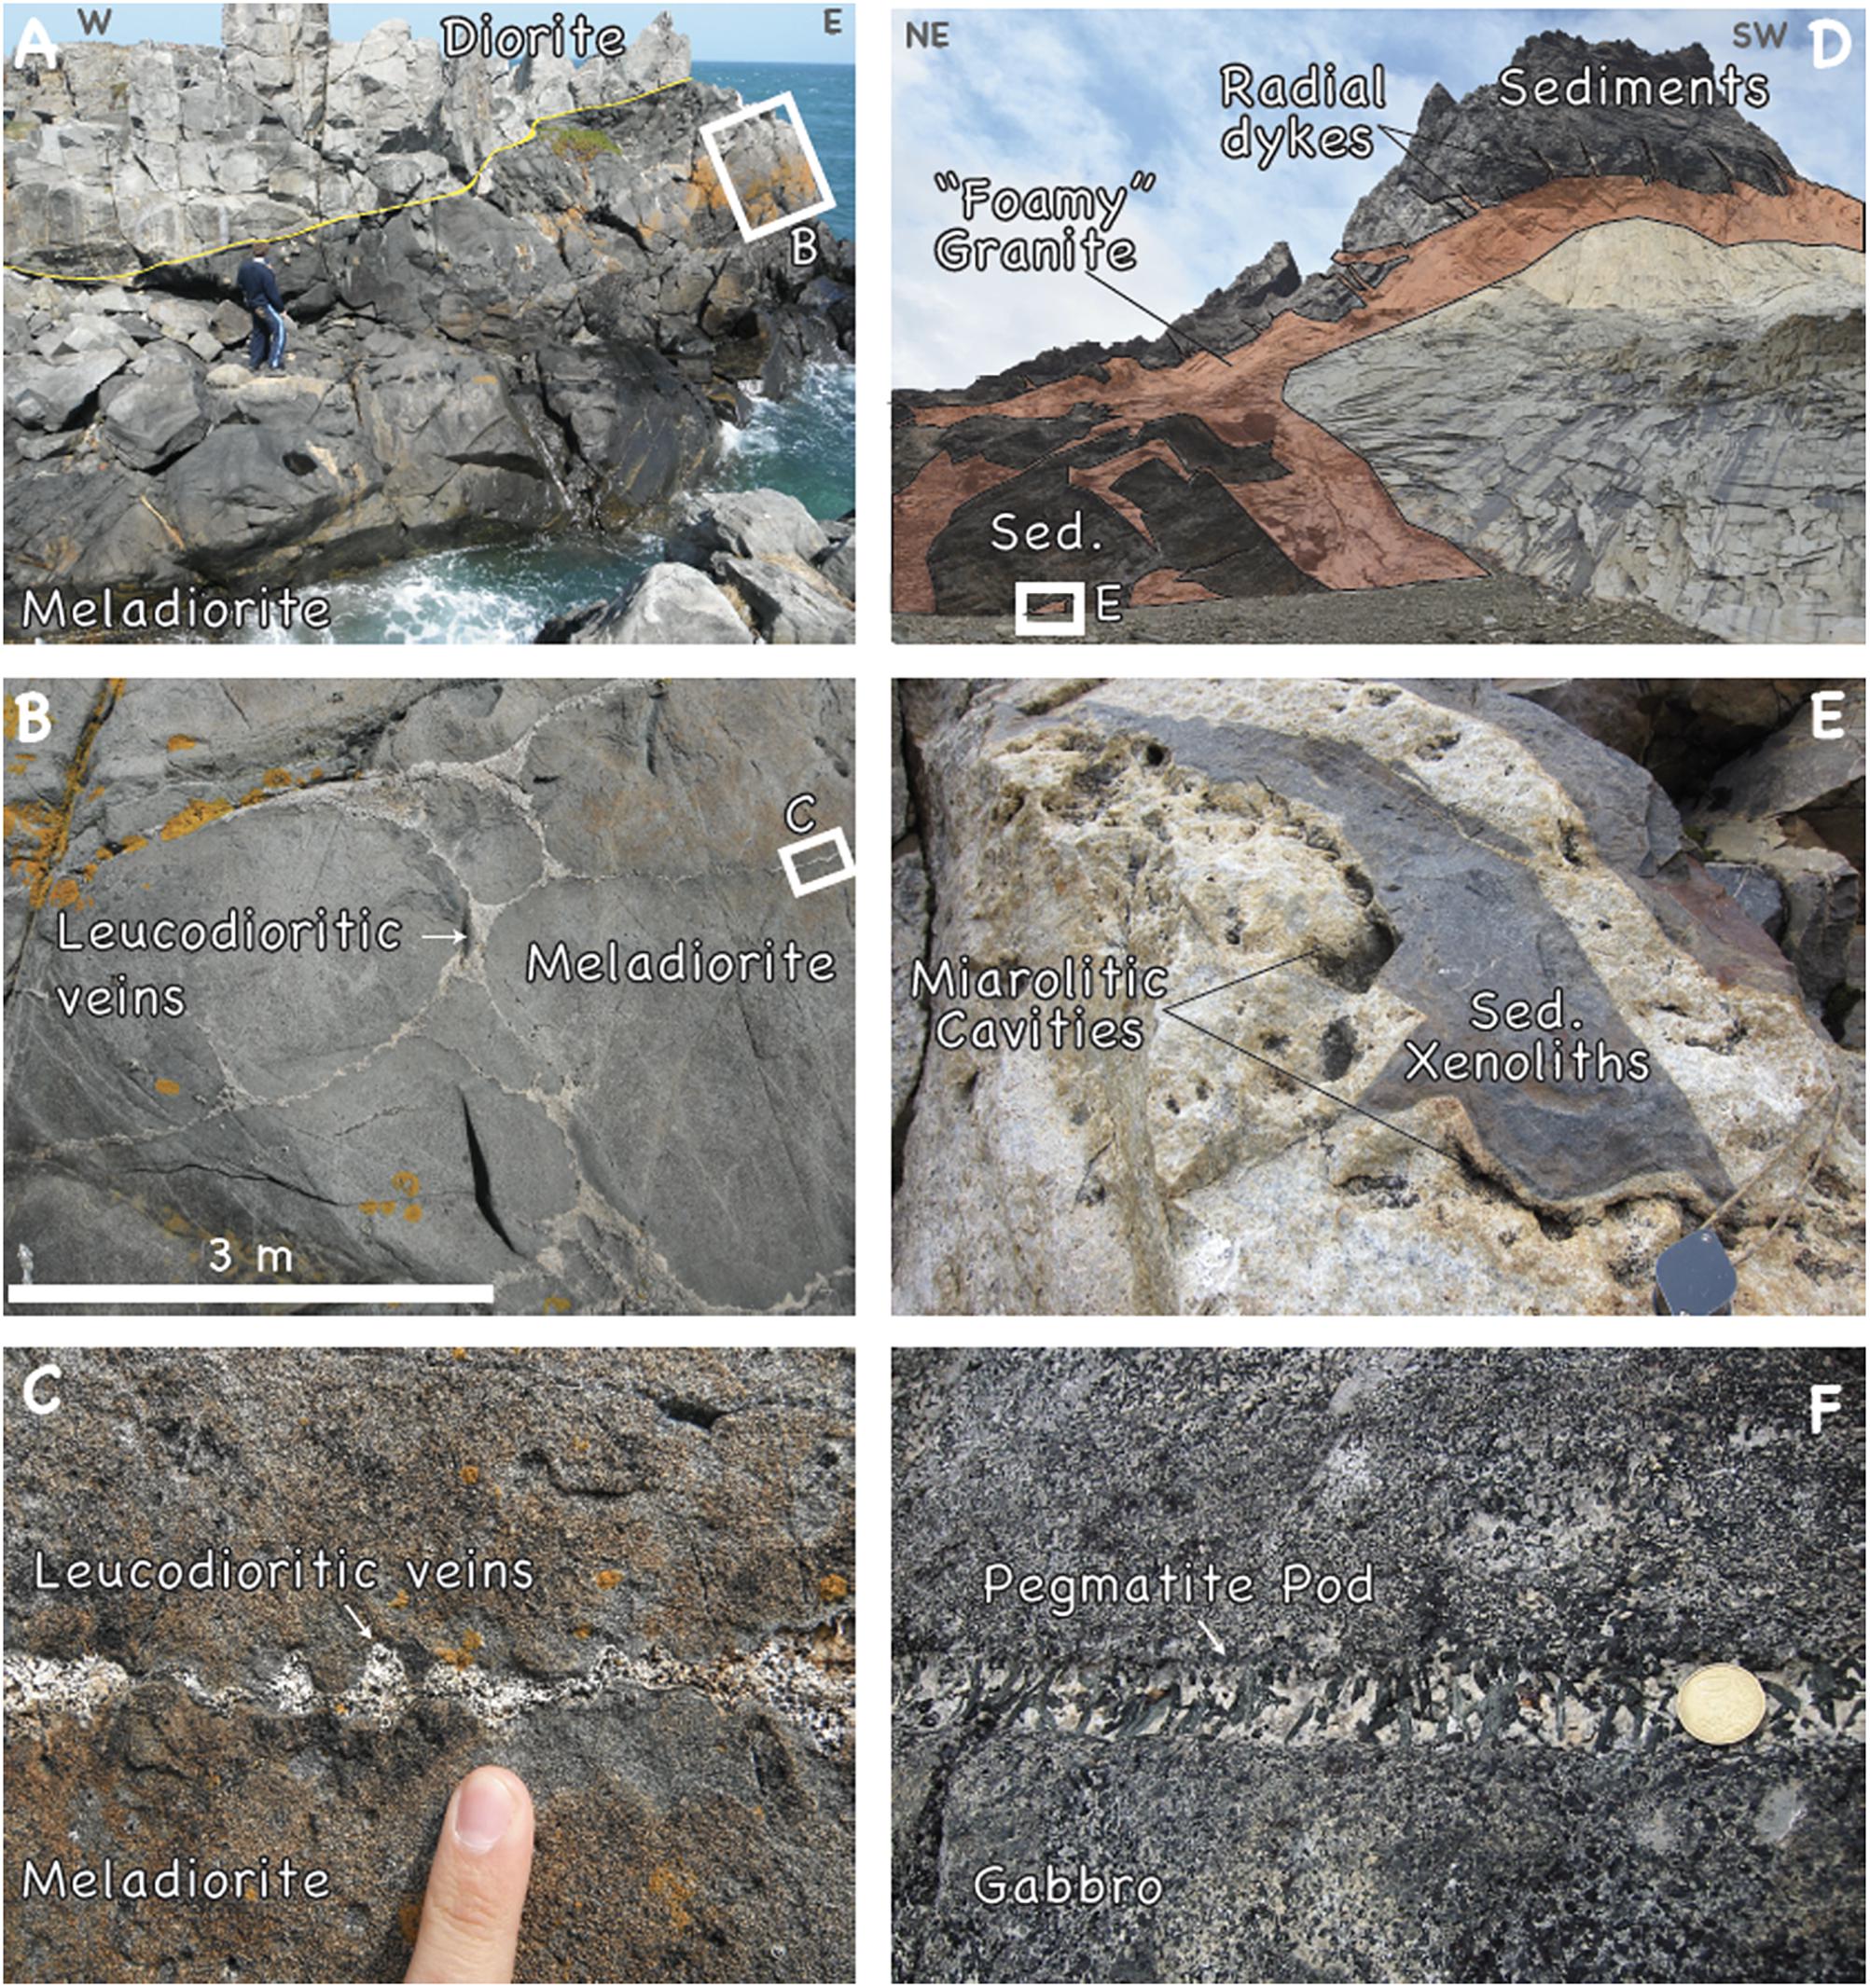
Figure 1. Examples of melt and gas segregation within cooling magmas. (A–C) Outcrops of the Beaucette Marina battery of the gabbro-dioritic Bordeaux Group (North-Guernsey Intrusive Complex, Armorican Massif; Caroff et al., 2011) show a cumulative macrorhythmic sequence of meladiorite and diorite rocks. The meladiorite unit consists of alternating dark and few cm-thick mesocratic layers and is veined by leucocratic diorite with vuggy porosity, forming an inter- and cross-connected network of cm-thick sheets. (D) Image of the ca. 900 m high N-W cliff of the Cerro Nido el Condor (Patagonia, Chile) showing outcrop of the frontal part of the Torres del Paine igneous complex. The “foamy” granite from Unit I (Michel et al., 2008) is accumulated at the front and is enriched in miarolitic cavities. Note ubiquitous radial diking, and brecciation at the bottom of the laccolith. (E) Close-up on one of the dikes from the bottom of the Unit I, where both sedimentary xenoliths and magma solidification act as a barrier to gas and melt movements following dike emplacement. (F) Coarse pegmatite pods with hornblende and feldspar minerals arranged in a comb layer (a variant of unidirectional solidification texture or UST) with respect to the equigranular host gabbro from the Val Fredda Complex (Blundy and Sparks, 1992) of the Tertiary Adamello Batholith (Alps, Italy).
One relatively rapid melt extraction mechanism in the upper crust that has been proposed over the last decades is gas filter pressing (Anderson et al., 1984; Bacon, 1986; Sanders, 1986; Sisson and Bacon, 1999; Pistone et al., 2015), which can produce overlying pegmatites and aplites from extracted gas-rich melts (Sisson and Bacon, 1999; Hartung et al., 2017). Gas filter pressing is probably the dominant process by which highly evolved melts segregate from crystal mush to form aplitic dikes in granitic plutons and accounts for the production of voluminous, crystal-poor rhyolites (Sisson and Bacon, 1999). Gas filter pressing operates in crystal-rich systems (Φ ≥ 0.6) below the maximum packing fraction of bubbles and crystals (∼0.74; Pistone et al., 2015), in agreement with experimental observations of melt percolation down a pressure gradient along grain boundaries at maximum crystal volume fractions of 0.85–0.9 (Dell’Angelo and Tullis, 1988). Above the maximum packing fraction of solid minerals and expanding bubbles, the mush tends to fracture; gas escapes through open cracks (Parmigiani et al., 2014; Oppenheimer et al., 2015; Pistone et al., 2015). The residual melt remains trapped within the crystal framework and is forced to crystallize and solidify.
To date, field observations offer only the terminal snapshot of the sequence of the dynamic processes that lead to melt extraction. Conversely, the most recent models (Degruyter et al., 2019, and references therein) shed light on the change of the local pore pressure during gas exsolution in cooling magmas, without simulating the actual transport of melt and exsolved fluids during second boiling. What remains unclear is how melt and gas are extracted at the microscale during cooling of hydrous magmas. To address this, our study aims to quantify how Φ and T control the mobilization of volatile-rich melts during mush solidification. We achieve this through high-temperature and -pressure experiments, observing how microstructural textures of crystal-rich magmas control melt segregation, supported by petrological modeling based on Rhyolite-MELTS (Gualda et al., 2012).
Materials and Methods
Material Preparation and Synthesis
The preparation of the materials followed the approach of Pistone et al. (2016). We use samples of F dacite, which is the equivalent to the natural sample JM101 (dacite/tonalite from Adamello batholith, Italy; Blundy and Sparks, 1992). Samples were prepared by mixing dried, fine-grained (∼1 μm) oxides and hydroxides in appropriate proportions before the addition of a known volume of quartz crystals that had been fired for 5 h in a one-atmosphere muffle furnace at 1,000°. Quartz crystals (DORSILIT 2500: SiO2 = 98.90 wt%; Al2O3 = 0.41 wt%; Fe2O3 = 0.02 wt%; TiO2 = 0.04 wt%; minor trace elements; Alberto Luisoni AG, Switzerland) had aspect ratios between 1.0 and 3.5, and three-dimensional grain size distributions with a mean diameter of 68 μm and positive skewness of 0.37, checked using the Malvern Laser Diffraction Grain Sizer at the Limno-Geology Laboratory, ETH-Zurich. Quartz particles were selected to ensure no reaction with the melt in which they resided (Pistone et al., 2012). Aliquots of F dacite glass were mixed with quartz particles to create additional starting materials of different crystallinity: F50 = 0.5 crystal fraction (Φ), F60 = 0.6, F70 = 0.7, and F80 = 0.8. The crystal-glass mixtures were pressed into cylindrical stainless steel canisters (110 mm long, 35 mm inner diameter, 3 mm wall thickness) lined with a thin (25 μm) molybdenum foil to avoid chemical contamination, using a uniaxial cold press. The canisters were stored at 110° for 24 h, then arc-welded shut. The tightness of the seal was checked by weight after immersion in a water bath under vacuum. The canisters were then hot isostatically pressed (HIP) for 24 h in a large capacity (170 mm in diameter; 500 mm high), internally heated pressure vessel at 1.8 kbar and 1,200° (Sinter-HIP-Kompaktanlage, ABRA Fluid AG: Rock Deformation Laboratory of ETH-Zurich). The chosen P and T conditions ensured the generation of chemically homogeneous glass and complete dissolution of H2O in the melt phase (i.e., water-undersaturated melt). The maximum temperature difference across the sample was 18° as monitored by three C-type thermocouples placed at the bottom and top and in the middle of the pressure vessel. Samples were then cooled at 60°/min to a temperature of 100° above the glass transition temperature (i.e., viscosity equivalent to 1012 Pa s) to prevent crystallization; followed by slower cooling (0.6°/min) to room temperature to obtain thermally relaxed glasses. The confining pressure was decreased by 37.6 bar/min during rapid cooling, and by 1.3 bar/min during slow cooling. Comparison of canister weights showed less than 0.5% change in mass, suggesting H2O loss during synthesis is negligible. Cores of 2-mm diameter and 2- to 4-mm length were then drilled from each synthesized sample, and the top and bottom faces were ground flat and parallel. The compositions of the starting materials are reported in Pistone et al. (2016) and are presented in the Supplementary Material.
High-Pressure and High-Temperature Experiments
To simulate melt and gas mobilization upon magma cooling, three high-temperature (T = 750, 800, and 850°), 1.1-kbar pressure experiments were conducted on a suite of pre-synthesized, H2O- and crystal-rich glasses (dacite with 4.2 wt% H2O in the glass, and Φ = 0.6, 0.7, 0.8). The experimental pressure was chosen within the range of emplacement depth of the plutonic systems reported in Figure 1 (0.75 ± 0.25 kbar for the laccolith of Torres del Paine; Putlitz et al., 2001; Baumgartner et al., 2007,2014; Leuthold et al., 2014; 3–4 kbar for the Plutonic Complex of Guernsey; D’Lemos, 1987; de Bremond, d’Ars et al., 1992) and consistent with some natural cases of erupting systems with very shallow pre-eruptive residence (∼1 kbar in Taupo Volcanic Zone; Bégué et al., 2014; Gualda et al., 2018). Also, to generate the initial gas phase within the cooling system, the chosen pressure (0.7 kbar lower than the pressure for material synthesis) allowed the achievement of water-saturation conditions during experiments (0.1–0.2 wt% H2O in excess in the starting melt composition prior to crystallization, calculated using the model of Papale et al., 2006). The different Φ values bracketed the initial crystallinities of natural plutonic gas-saturated mushes; each experiment at specific T represents a snapshot of the state of the mush along its cooling path. Three sandwiched samples were inserted into 4-mm diameter Au capsule, crimpled and welded before experiments. Using vertical, hydrothermal cold-seal pressure vessels (University of Lausanne), samples were first pressurized to 1.1 kbar at room temperature, with pressure monitored using both an IMS digital pressure sensor and a Heise 3-kbar bourdon-tube gauge (±5 bar). Then, T was increased at a rate of 30°/min up to the target temperature. Experiments were run for 8 days at constant P–T and H2O-saturated conditions (∼4.1 wt% H2O in the starting melt prior to crystallization at all studied temperatures; Papale et al., 2006) above the wet granite solidus (∼710° at 1.1 kbar; Tuttle and Bowen, 1958; Holtz et al., 2001). Experiments run between 750 and 850° at 1.1 kbar allowed equivalent conditions of initial melt viscosity (Δlogηmelt < 0.5 and, thus, allowed comparison of processes simulated in the experimental runs at different T (Holtz et al., 2001; see also Supplementary Material). We did not simulate magma cooling by changing T with a specific cooling rate; rather the different temperatures used span those occurring in natural gas-saturated mushes approaching their solidus. Temperature was monitored with an N-type thermocouple (±2°) connected to a Eurotherm 815/831 controller. Based on temperature calibration at room pressure prior to the high-pressure and high-temperature experiments, no T gradients were found in the sample placed in the center of an isothermal 30-mm hot zone. Experiments were terminated by turning off the furnace power and using conventional compressed air quenches (quench rate of ∼4°/s). Quenching to the solidus (at which the sample microstructure freezes) was thus completed in 15, 30, and 50 s from 750, 800, and 850°, respectively. Cooling to room T was then followed by slow depressurisation and sample recovery.
Microstructural Analysis
Both starting materials and recovered samples were explored using X-ray computed tomography (CT) using a spatial resolution of 6 μm/pixel at 40 kV, 200 A, and 800 ms exposure time with a SkyScan 1173 (University of Lausanne). Under these acquisition conditions, quartz and glass were easily resolvable phases. The higher X-ray attenuation of the glass was largely due to its Fe content. Tomographic 3D renderings were inspected using the IDL-based Blob3D software (Ketcham, 2005a,b) to quantify the spatial distribution and first-order volume fraction of each phase, with an uncertainty of 0.005 in volume fraction. Three-dimensional tomographic analysis is used to capture the bulk microstructural features of the samples, including glass, pre-existing quartz, and vesicle spatial distribution.
In order to image microstructural details at higher spatial resolution (<6 μm/pixel), samples were also inspected using a FEG-EPMA. Samples were cut in half to form a peripheral and a central portion (Figures 2, 3); both portions were impregnated in epoxy, polished, and carbon-coated for analytical inspection. Backscatter electron (BSE) images were acquired at 15-kV accelerating voltage and 1.5-nA beam current. BSE images with a spatial resolution of 1-μm were used to estimate the volume fractions of glass, vesicles, and minerals in the different portions of run products using the image processing software JMicro-Vision® v1.2.7 (Roduit, 2011), with an uncertainty of 0.002 in volume fraction based on inspections of three representative 200 × 200 μm areas for each sample. The vesicle size distribution (VSD), based on Feret’s radius, was carried out using the Java 8 Fiji software (Schindelin et al., 2012). The Feret’s radius is the half of the maximum distance or caliper between two parallel lines tangential to the particle outline and is used to particles of low aspect ratio (<3) and as long as particle morphology is not largely irregular (Liu et al., 2015). Study of the VSD allowed exploration of the different processes that lead to bubble growth: Ostwald ripening (Stoffregen, 1996; Lautze et al., 2011), H2O diffusion (Zhang et al., 2000) or physical gas coalescence (Castro et al., 2012). The BSE analysis was used to capture the differences in glass volume fraction between peripheral and central sections of the run products and, thus, to evaluate the movement of residual melt in the synthetic crystal mush at high P–T conditions.
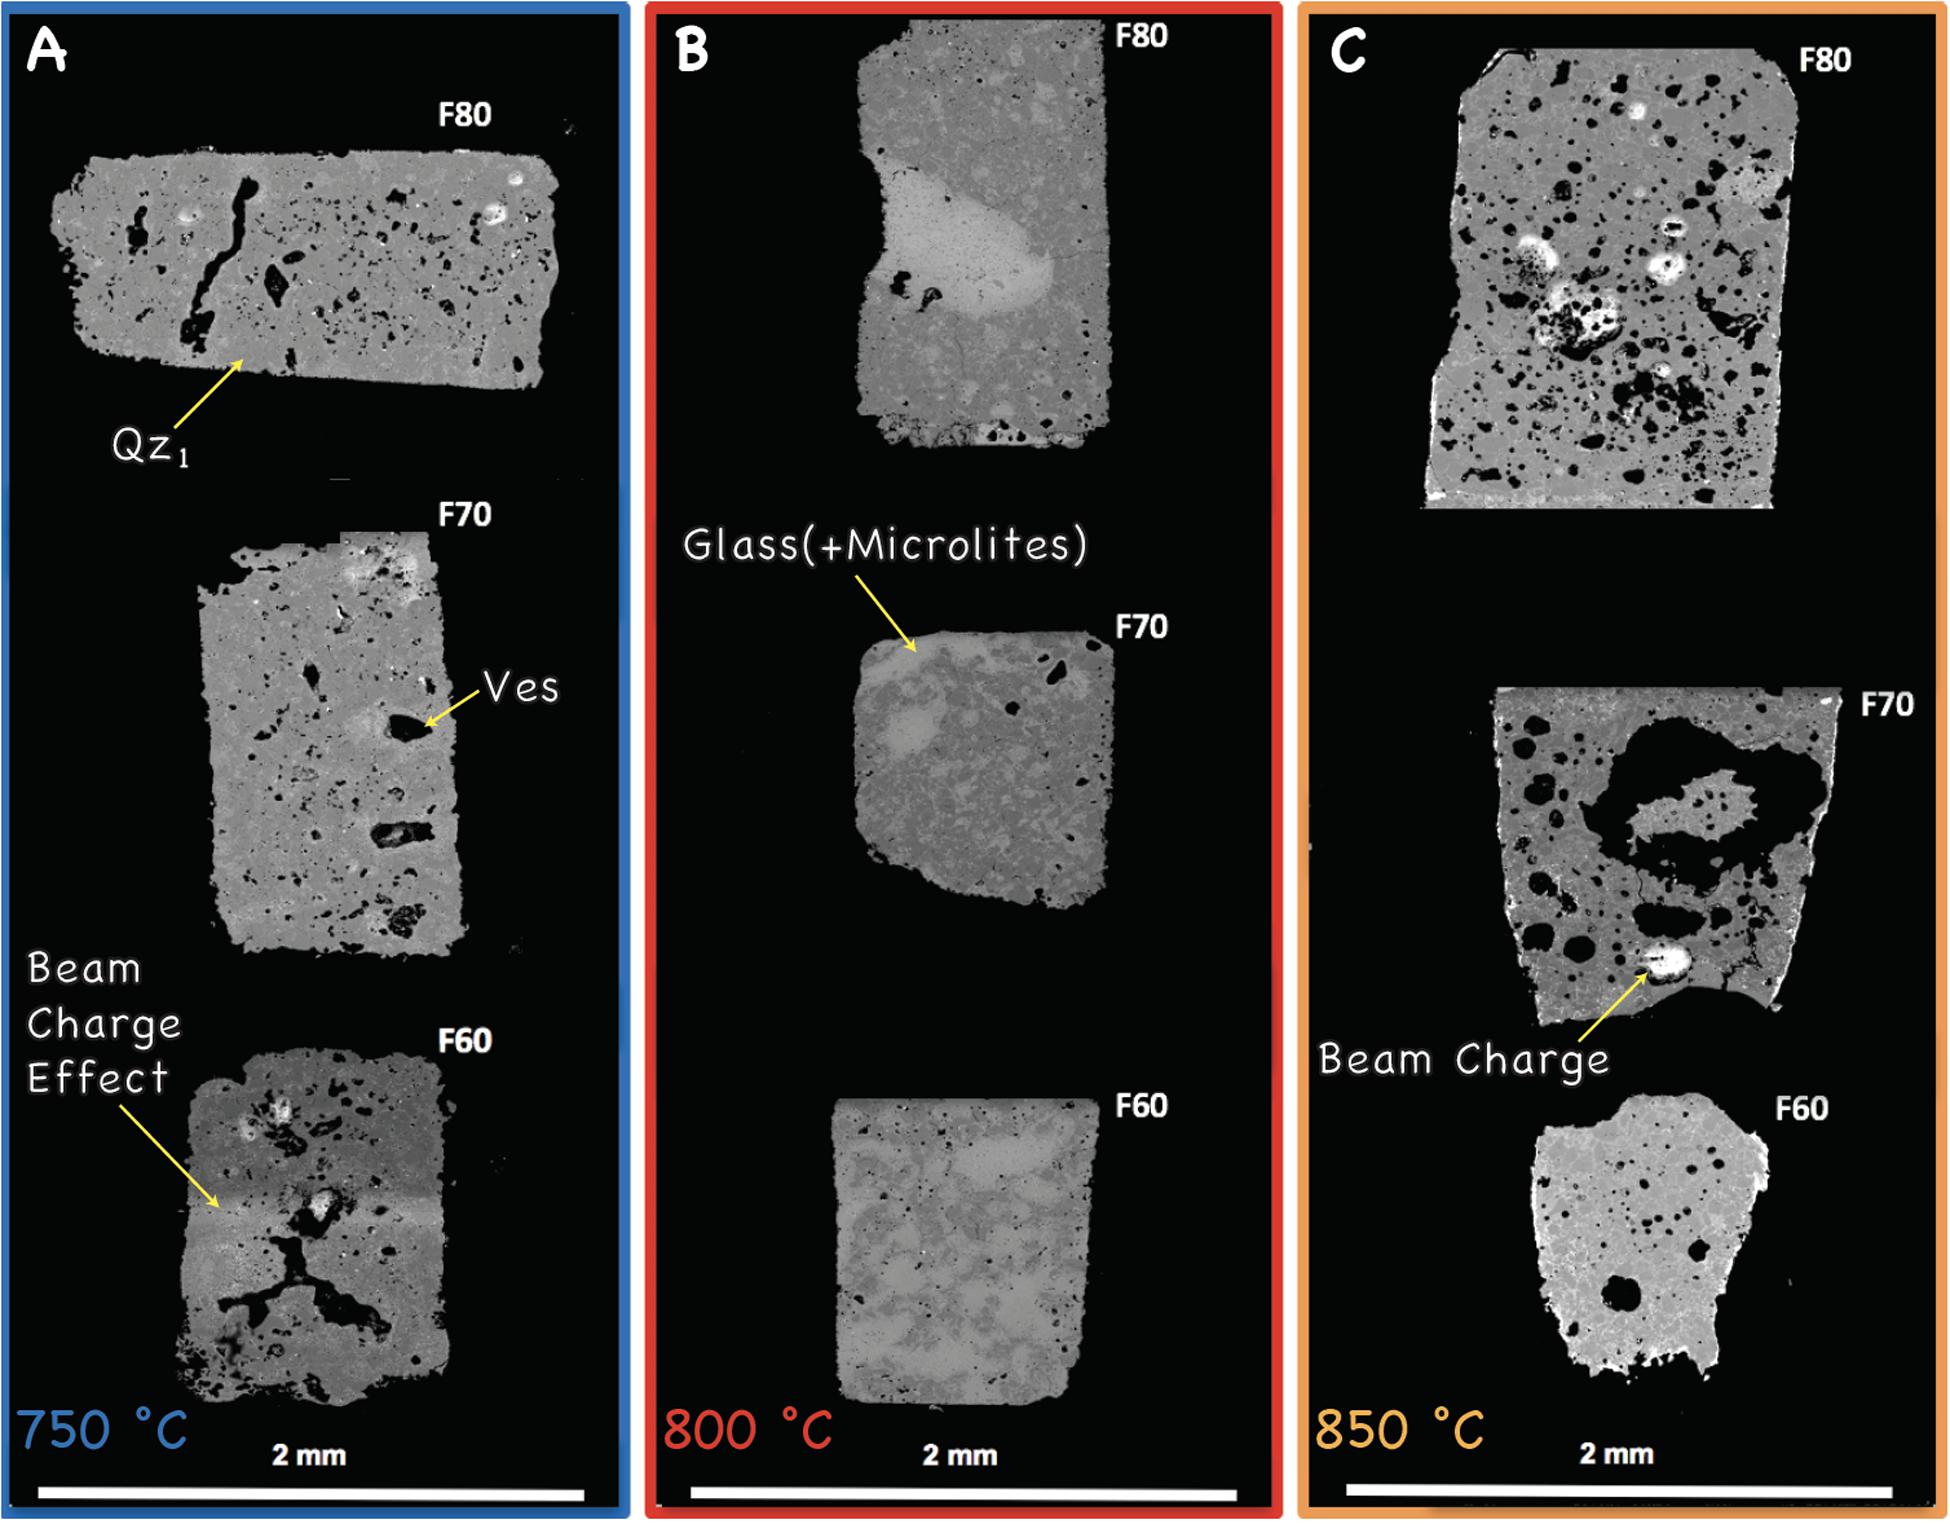
Figure 2. FEG-probe-based BSE images of peripheral sections of all crystal-bearing samples from experiments at: (A) 750, (B) 800, and (C) 850°. Acronyms are: Qz1 = pre-existing quartz (dark gray); Ves = vesicle (black objects, sometimes filled with whitish material that produces electron charging); Glass = residual glass (least dark gray phase) that can be populated with microlites.
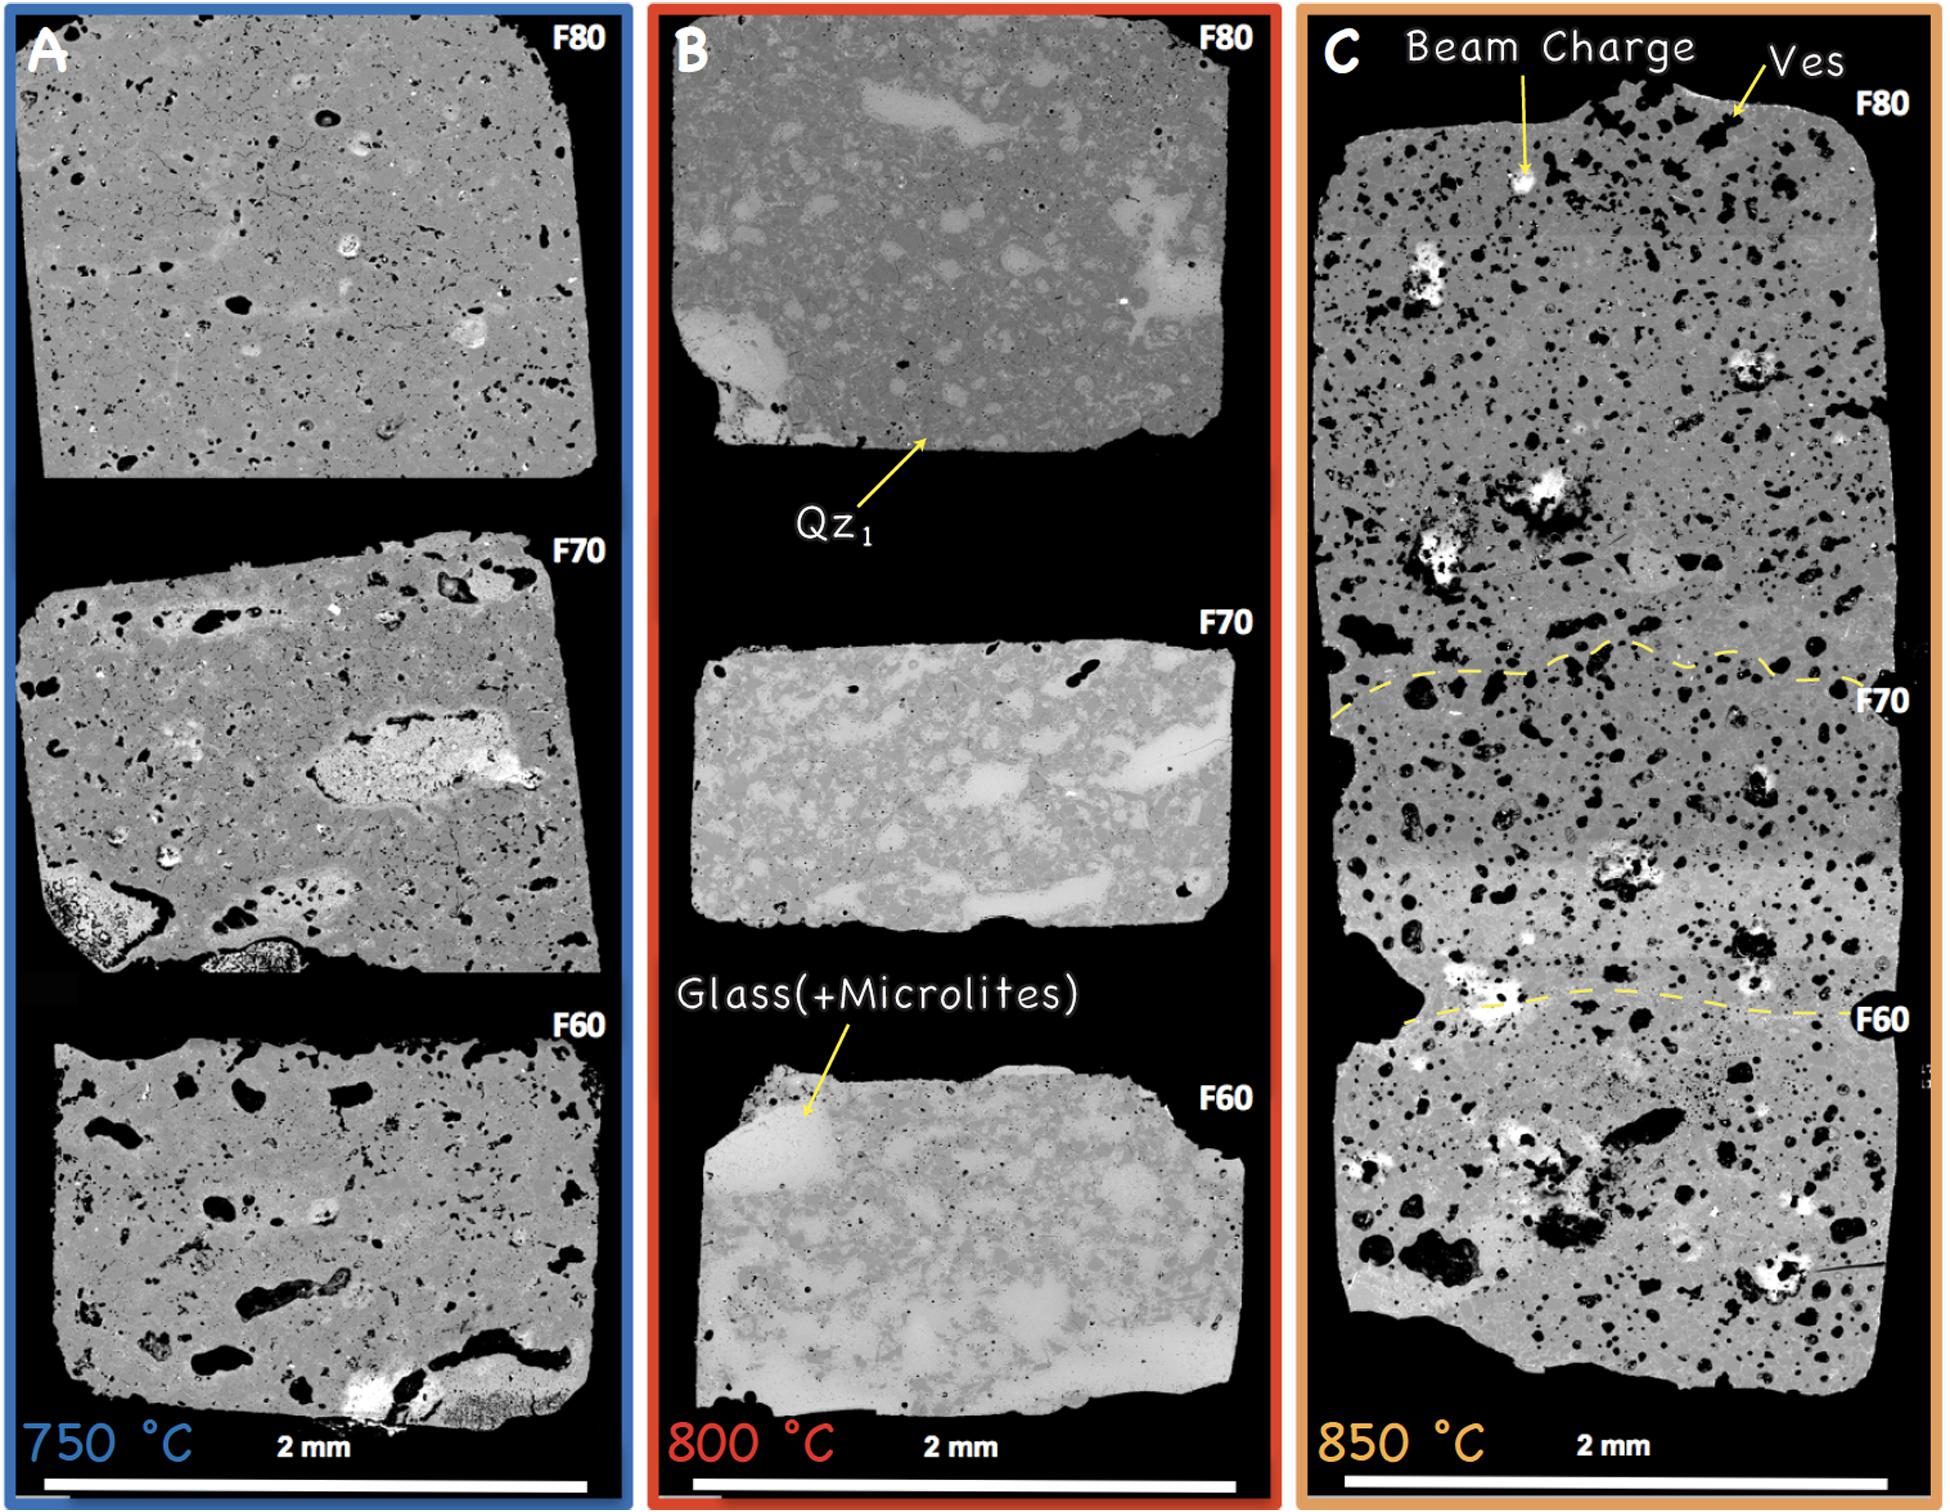
Figure 3. FEG-probe-based BSE images of central sections of all crystal-bearing samples from experiments at: (A) 750, (B) 800, and (C) 850°. Yellow dashed lines divide the domains of run products F60, F70, and F80 after the experiment run at 850°. See acronyms from Figure 2.
Chemical Analysis of Glass
A major challenge with glass analyses is alkali loss (Morgan and London, 1996), a very common problem that can be minimized by using a large beam diameter and low beam current on the electron probe micro-analyser (EPMA). However, the available surface of inclusion- and bubble-free glass precluded the use of a defocused beam almost everywhere throughout the experimental run products. Hence, we had to adjust our analytical conditions using a low accelerating voltage and 3–5-μm beam size for the chemical analyses of the experimental glasses. We used two EPMA instruments: a JEOL JXA-8350F HyperProbe (FEG-EPMA; University of Lausanne) and a CAMECA SX Five EPMA (University of Massachusetts in Amherst, MA, United States). The chemical analysis revealed that the experimental glasses are highly heterogeneous as a consequence of the different processes simulated experimentally: vesiculation, crystallization, and melt segregation.
The JEOL JXA-8350F HyperProbe (FEG-EPMA; University of Lausanne) is capable of in-situ quantitative microanalyses at high spatial resolution (<1 μm). Glasses were analyzed at 15 kV, 1.5 nA and 10-μm beam diameter and 7 kV, 1.5 nA, and 5- to 3-μm beam diameter due to the restricted amount of available glass. The counting time on the peak and background positions was 30 and 15 s for Al, Ti, Ca, Mg, and Mn and 10 and 5 s for Si, Fe, Na, K, and P, respectively. Natural and synthetic standards were used and data were ZAF-corrected (Armstrong, 1988). The FEG-EPMA standardization using a small beam diameter (<5-μm) at 7 kV included the analysis of hydrous glasses with known water content (H2O = 5.7 wt%; Müntener et al., 2001) to monitor any alkali loss. Using these secondary standard glasses let us assume that no alkali loss occurred during FEG-EPMA analysis with a 5-μm beam. At 7 kV, neither Mn or P were analyzed (<0.05 wt% total). Analyses at 15 kV targeted only large glass pools located in the vesicle- and glass-rich regions away from the solidification fronts. The analyses in the run product at 750° were almost exclusively located in the “glass coronae” around the vesicles and using 10-μm beam size did not yield reliable data, which were discarded (Supplementary Material). The analyses at 7 kV targeted the “glass channels” where melt percolation occurred within the areas affected by crystallization fronts during experiments. The two sets of analyses display a major difference in alkali content (especially Na), which is high in the glass-rich areas devoid of plagioclase and remote (>10-μm) from vesicles (Supplementary Material). Glass major element compositions and related uncertainties are in the Supplementary Material. Newly formed minerals (quartz, plagioclase, hornblende, and oxide) were qualitatively analyzed using an SDD EDS detector (spectral resolution of 129 eV on Mn) at 15 kV, 1.5 nA, and ∼1-μm beam diameter.
Further glass analyses in representative “glass channels” in samples with Φ = 0.6 and Φ = 0.7 at 750° were carried out using the CAMECA SX Five EPMA (University of Massachusetts in Amherst, MA) at 15 kV, 2 nA, and ∼5- to 10-μm beam diameter. The counting time on the peak and background positions was 30 and 15 s for Al, Ti, Ca, Mg, and Mn, and 10 and 5 s for Si, Fe, Na, K, and P, respectively. We used two glass standards of rhyolitic (USNM 72854 VG-568 from the Smithsonian Institution), haplogranitic (HGGB-3 glasses from Pistone et al., 2012), and dacitic composition (F0 from Pistone et al., 2016) and data were ZAF-corrected. This EPMA analysis helped to show that the FEG-EPMA analysis of the experimental glasses in F60, F70, and F80 at 7 kV were affected by alkali migration due to electron charge with an overall alkali loss of up to 50%. This alkali loss at low voltage and reduced beam size modified the number of counts for Si during analysis.
Estimation of H2O Content and Calculation of Melt Viscosity
H2O content in the glass phase was estimated using the volatile-by-difference method (Devine et al., 1995) for both the 7- and 15-kV sets of analyses, with limited uncertainty (<1 wt%) for H2O contents between 4.5 and 7.2 wt%. This method was applied by calibrating the analytical reproducibility at the chosen FEG-EPMA (7 and 15 kV, respectively) and EPMA analytical conditions (15 kV) with hydrous felsic glasses of similar H2O content (samples B659 and B736 from Müntener et al., 2001; F0 from Pistone et al., 2017; samples HGGB-3 from Pistone et al., 2012). Most of the results agree with H2O-saturation concentrations calculated using Papale et al. (2006) for the run pressure and temperatures. However, apparent H2O contents appreciably exceeding H2O-saturation values were determined for most analyses of 750° glasses, even for analyses at 15 kV (summation deficits to as great as 9.7 wt%). These high apparent concentrations were determined in 10-μm thick glass halos around vesicles and in widespread glass domains populated by potential cavitation nuclei or “nanobubbles”; the latter were not observable at the analytical spatial resolution of the BSE images, but inferred from the “foggy” aspect of the residual glass using optical microscopy. Glass adjacent to bubbles can hydrate during quench-cooling to room temperature, and the electron beam’s X-ray excitation volume may intersect nanobubbles in “foggy” glass domains. Analyses near bubble walls and in “foggy” glass domains of 750° runs were therefore excluded. Hydration during quenching, alkali-loss during analysis, and overlap with sub-surface bubbles cannot be ruled out entirely for the accepted analyses of glasses synthesized at 750°, so the values calculated for their viscosities and saturation overpressures are minima and maxima, respectively.
Melt viscosities at P–T conditions were estimated using the model of Hui et al. (2009) with logηmelt variations of maximum 0.2 with H2O contents ranging between 4.5 and 7.2 wt%, as estimated with the volatile-by-difference method applied to 15-kV data (marked in yellow in the analytical data summary table of the Supplementary Material), in line with calculations from solubility modeling (Papale et al., 2006).
Rhyolite-MELTS Crystallization Simulations
Crystallization paths of hydrous dacite from 850 to 750°C at 1.1 kbar were simulated using Rhyolite-MELTS (Gualda et al., 2012) to reconstruct the sequence of crystallization of the major phases (hornblende, plagioclase, and quartz) and volume percentage of excess H2O-rich bubbles at the different temperatures in the experimental samples. Rhyolite-MELTS software currently lacks a thermodynamic model for simulating amphibole crystallization in silicate melts, and phases such as pyroxenes are calculated. However, this did not affect the purpose of our simulations here, as melt compositions calculated by Rhyolite-MELTS were not directly considered. Calculations of melt crystallization were run using starting compositions in a near-fractional crystallization style; i.e., the chemical composition of the starting material for the simulation is the measured composition of the glass from the previous crystallization stage at the specified temperature. Starting conditions and results of each simulation are reported in the Supplementary Material.
H2O Diffusion and Bubble Growth
The characteristic timescales for diffusion (τd) and viscous deformation or relaxation (τv) are:
where r is the bubble radius, DH_2 O the H2O diffusion coefficient or diffusivity (Zhang et al., 2000), ηmelt the melt viscosity, and ΔPg the gas overpressure. DH_2 O in rhyolitic melts with H2O content <7.7 wt% in the T range 403–1629°C and at P < 19 kbar is estimated using the model of Ni and Zhang (2008):
where X is the mole fraction of H2O on a single oxygen basis, T temperature in K, and P pressure in GPa. ΔPg is estimated using the equation of state for H2O reported in Pitzer and Sterner (1994) in the JavaScript-based Fugacity Calculator: https://www.esci.umn.edu/people/researchers/withe012/fugacity.htm.
To determine whether diffusion- or viscosity-limited, the non-dimensional Péclet number (Pe), combining Eqs 1 and 2, must be determined (Navon and Lyakhovsky, 1998; Navon et al., 1998):
In our experiments gas exsolution occurs under conditions of Pe < 1, therefore the rate of expansion is unimportant relative to that of diffusive mass transfer. The H2O diffusion length scale (l) from melt to gas bubble was determined using , with t as the experiment timescale.
Results
Collectively, the experiments display a sequential record of microstructural changes toward the solidus in a T–Φ space (Figures 2, 3). Visual inspection of the central sections of the samples shows that, as also observed in nature (Figure 1), none of the samples achieved textural equilibrium due to rapid crystallization and vesiculation (Anderson et al., 1984; Sanders, 1986; Sisson and Bacon, 1999). Degassing occurred in all experiments with many vesicles found trapped between mineral clusters and in direct contact with surfaces of newly formed minerals. Using three-dimensional image analysis and two-dimensional analysis of vesicle modal abundance, we observe how the distribution of both glass (including hornblende and oxides, which are not resolvable at the spatial resolution of the microtomography) and vesicles changes as the experimental system approaches the solidus (Figure 4).
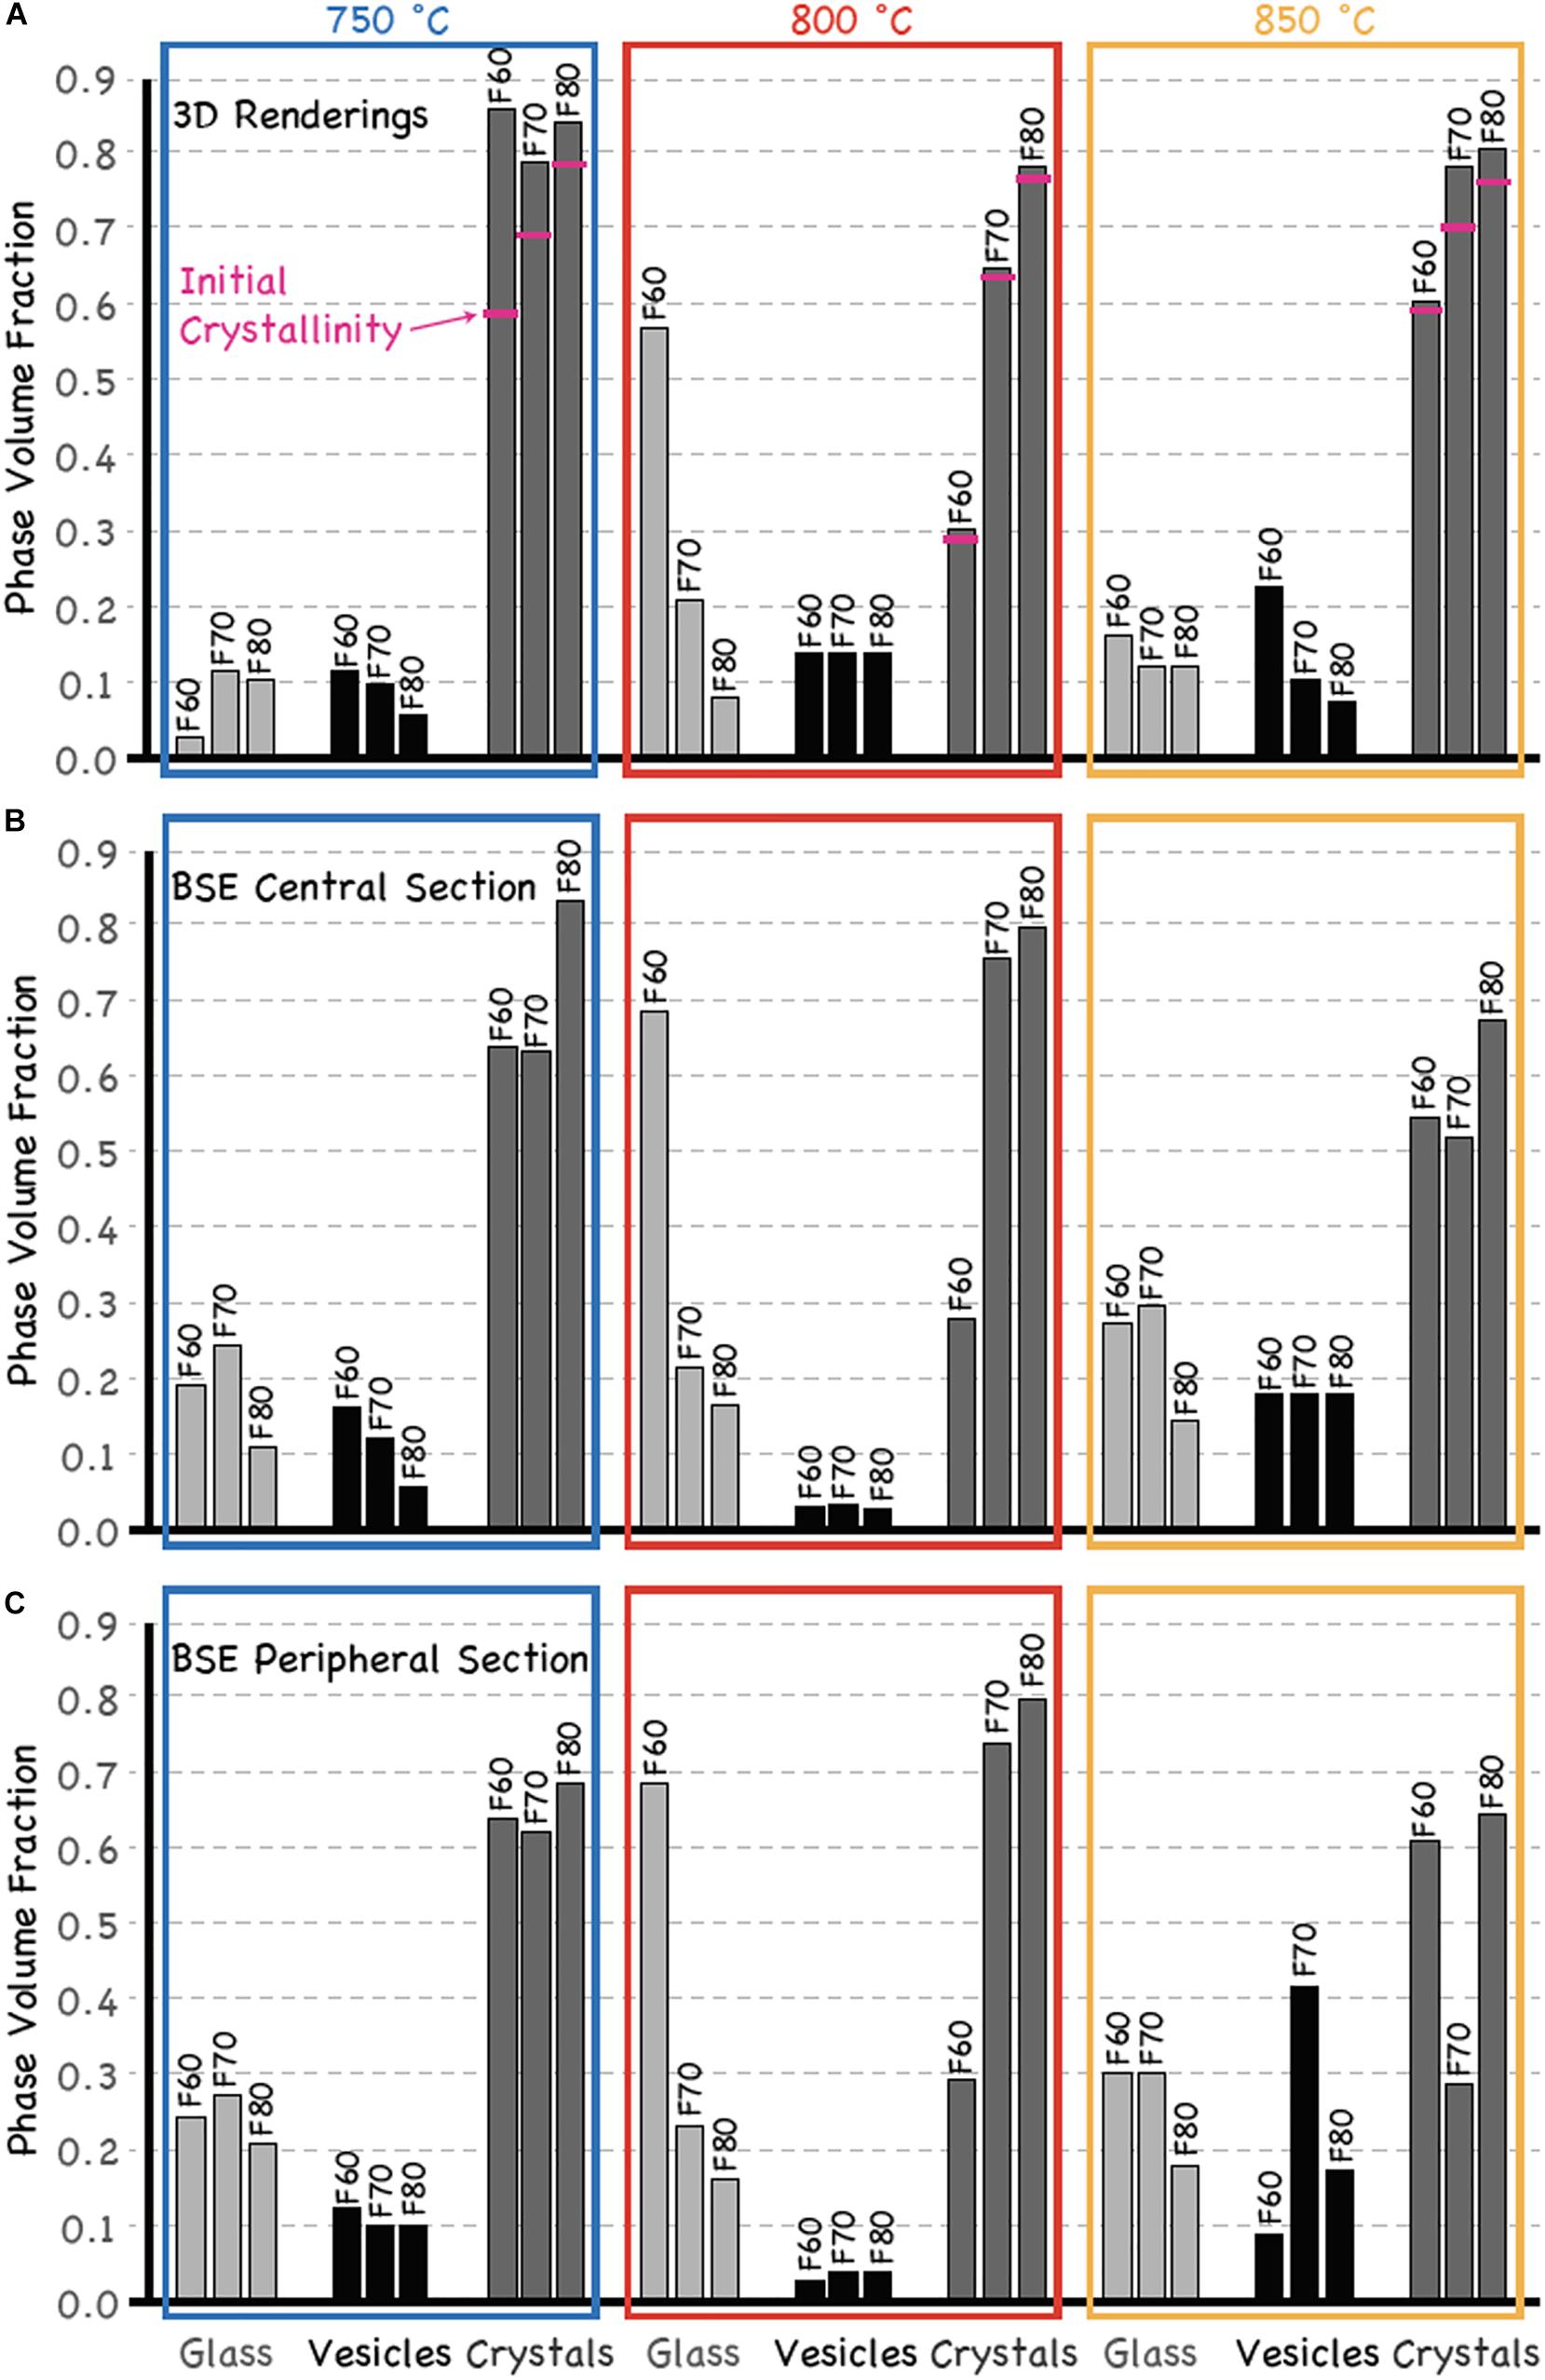
Figure 4. Total volume fractions of phases: (A) in each tomographic 3D rendering, (B) in each BSE central section, and (C) in each BSE peripheral section of the experimental specimens. Volume fraction uncertainties (2σ) are 0.005, 0.002, and 0.002, respectively. Horizontal pink bars indicate initial level of crystallinity in the run products analyzed using X-ray tomographic microscopy.
Here we report the observations of the different phase (glass, minerals, and vesicles) proportions and changes as a function of initial crystallinity, sample portion (central versus peripheral section), and temperature (Figure 4). The vesicle volume fraction in sample F80 slightly increases from central to peripheral sections in the T range from 800 and 750°CC. At 850°CC the vesicle content from central to peripheral sections of the cylindrical materials is more variable, with F70 displaying the largest increase in vesicle abundance in the peripheral section (Figures 4B,C) where large (up to 500-μm wide) tubular and connected vesicles are found (Figure 2C). In both central and peripheral sections of the cylindrical materials we observe the vesicle content decrease from 850 to 800°CC and then its increase from 800 to 750°CC, except for the case of sample F70 whose vesicle content decreases at 850°CC (Figures 4B,C). This non-linear change of the vesicle content is a function of both SiO2 increase in the residual melt during moderate crystallization from 850 to 800°CC and during extensive crystallization from 800 to 750°CC, and non-equilibrium processes, which include relatively rapid crystallization at the chosen temperatures and melt and vesicle movement during the experiments. At constant P, both SiO2 increase in melt composition and T decrease concomitantly increase H2O solubility in the residual melt due to retrograde or inverse volatile solubility with lowering T (Fogel and Rutherford, 1990; Paillat et al., 1992; Blank et al., 1993; Lowenstern, 2001).
At 850 and 800°CC, the vesicle content tends to remain unchanged in both central and peripheral sections of each sample, whereas, at 750°CC, vesicle abundance increases by up to 50% at largest crystallinity (Φ = 0.8; Figures 4B,C). Initial crystallinity increases from 2 to 20% in run products at T = 850°CC, whereas it increases by 45% in F60, by 11% in F70, and by 5% in F80 at 750°CC, based on the comparison between the 3D renderings of the run products at 850 and 750°CC, respectively (Figure 4A). At 800°CC the initial crystallinity does not vary (<2%) by either partial mineral resorption as observed at 850°CC or the formation of new minerals as observed at 750°CC (Figure 4). The total glass abundance decreases by 10% (in F70 and F80) to 70% (in F60) from 850 to 750°CC (Figure 4A). Glass modal proportion increases from 20% (in F60 and F70) to 50% (in F80) from central and peripheral section of samples at 750°CC (Figures 4B,C). Limited glass volume fraction increase is observed between central and peripheral section of samples at 850°CC (<5%) or no increase at all at 800°CC (Figures 4B,C). Analysis of the VSD shows a narrow distribution of Feret’s radius centered around 5- to 10-μm (Supplementary Material) unlike that expected for Ostwald ripening, which would exhibit a smaller, broader peak (Stoffregen, 1996).
Detailed microstructural inspection of representative sample regions at microscopic scale reveals key features at specific T and initial Φ conditions (Figures 5–7). Fractures seen in all samples are produced at the end of the experiment during either sample cooling, recovery, or preparation prior to analysis.
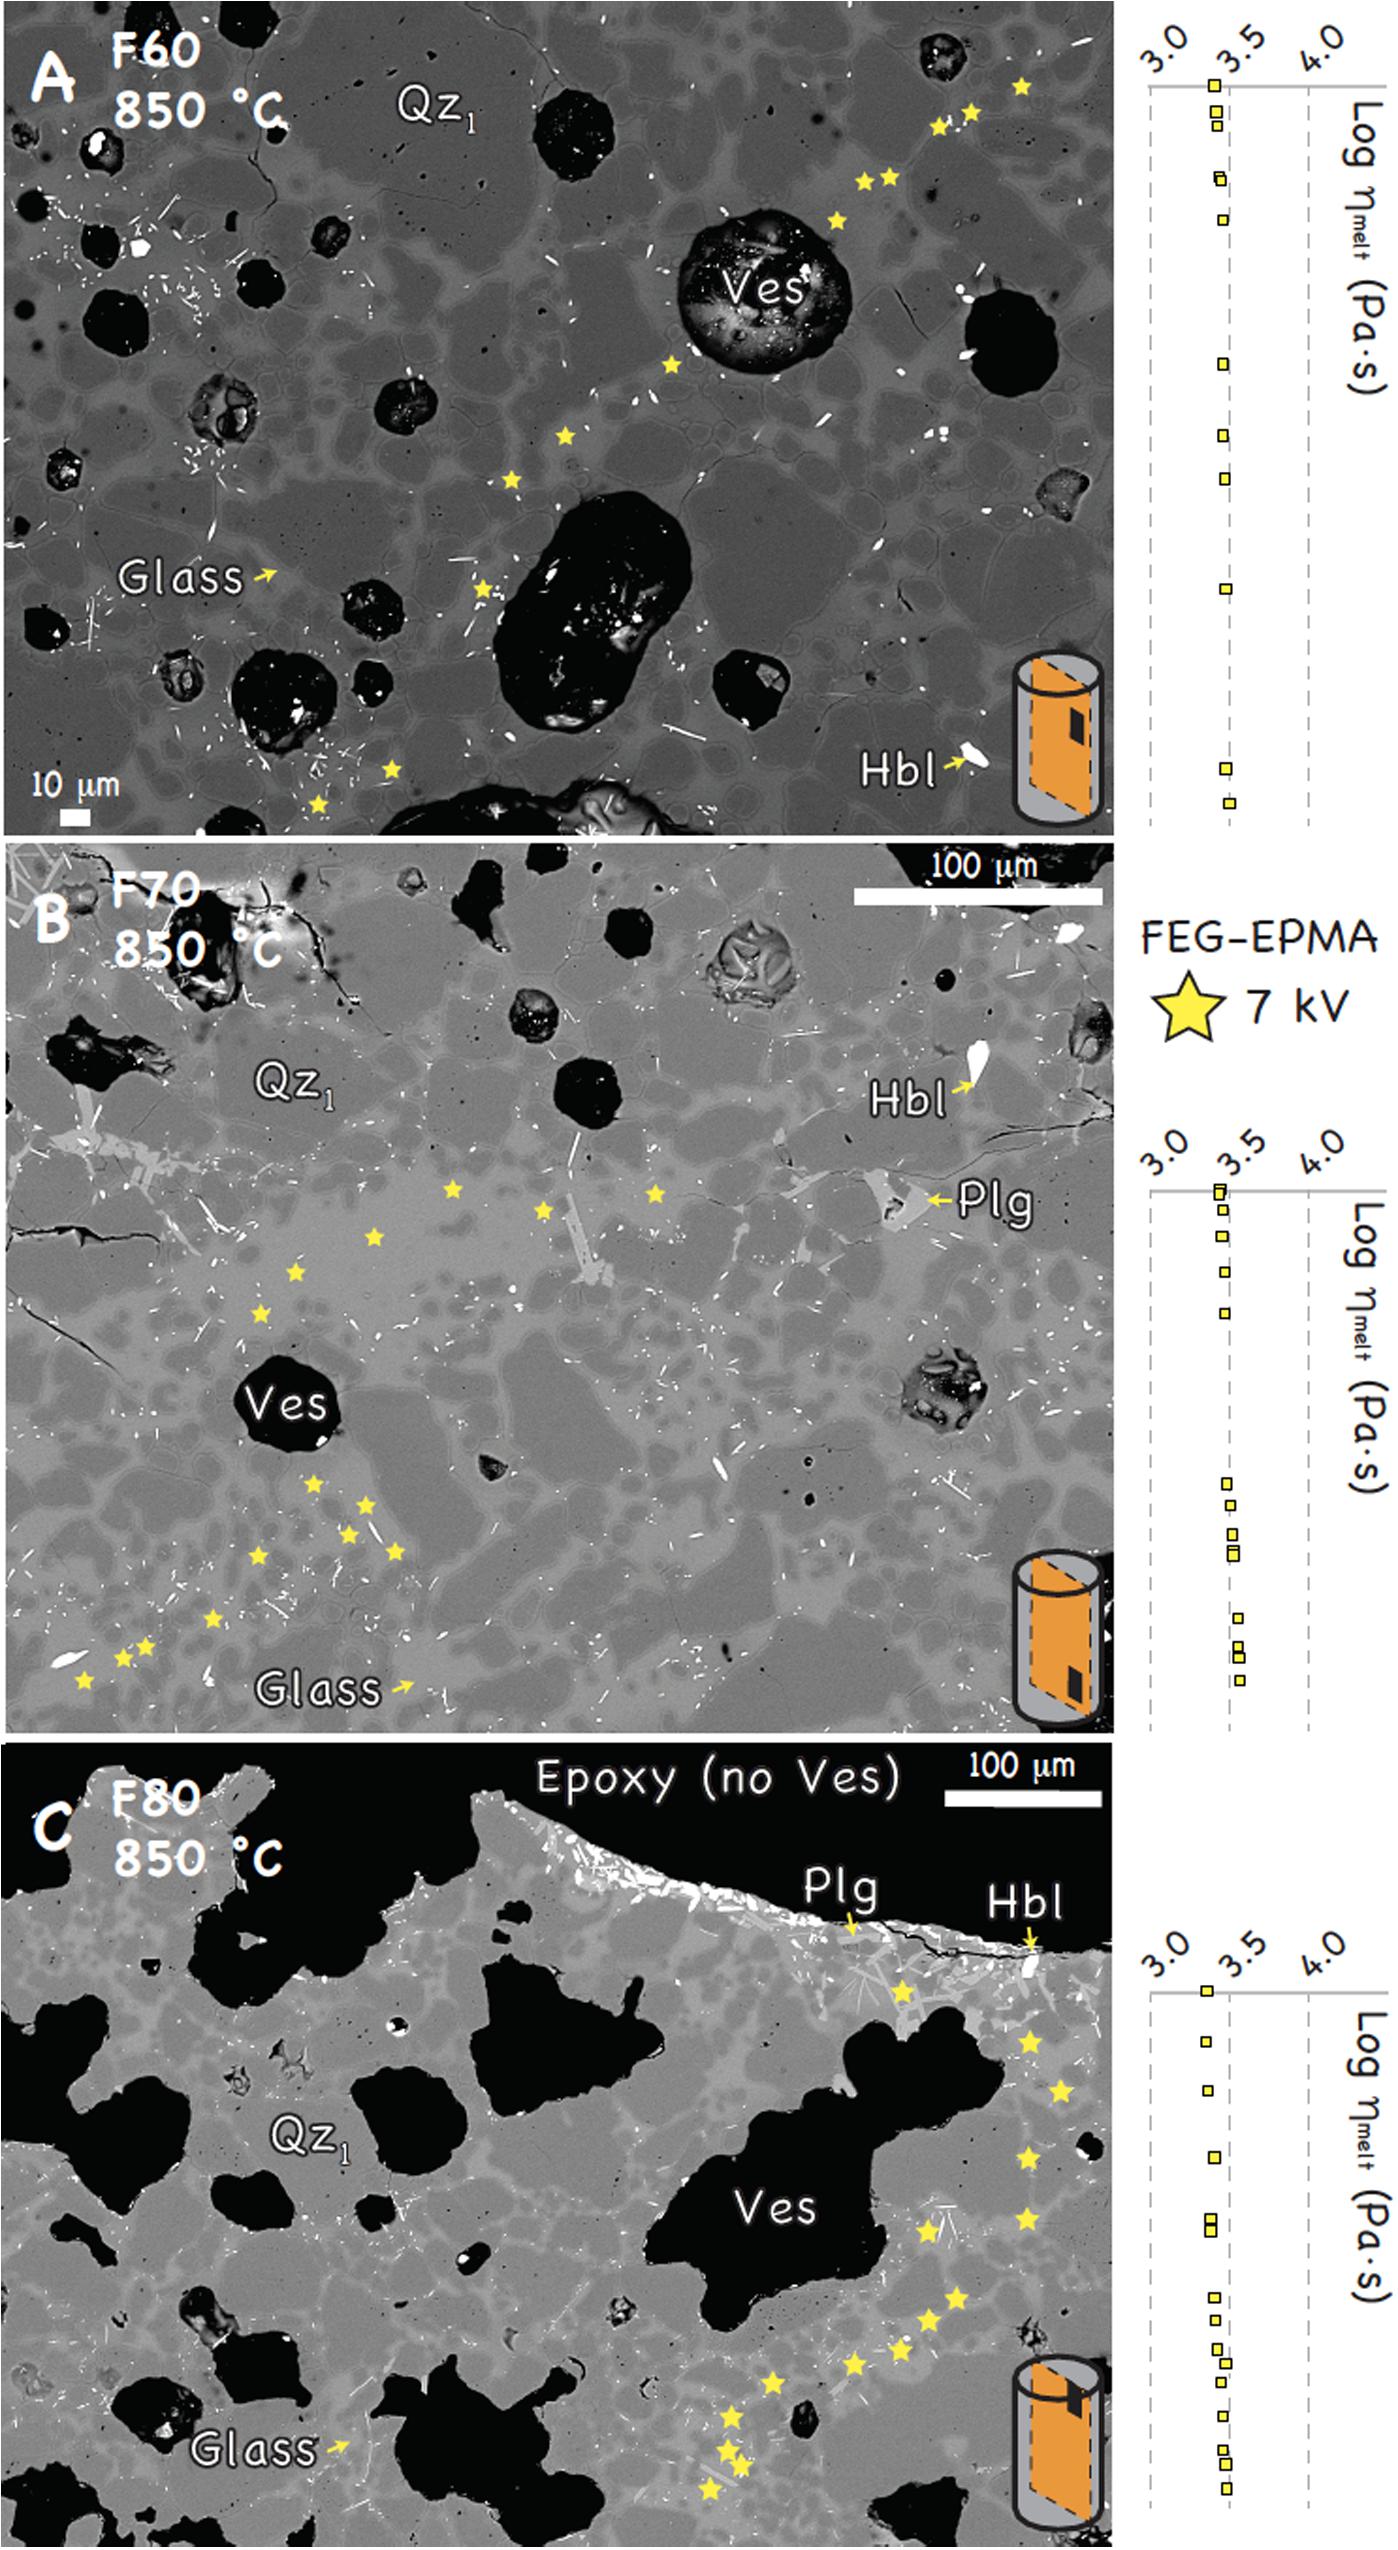
Figure 5. FEG-probe-based BSE images of selected portions within the central polished sections of: (A) F60, (B) F70, and (C) F80 at 850°CC. Error bars corresponding to 2σ are smaller than symbols. Acronyms are for: Qz1 = pre-existing quartz (dark gray); Plg = plagioclase (light gray); Hbl = hornblende (white elongated phase); Ves = vesicle (black objects, sometimes filled with whitish material that produces electron charging); Glass = residual glass (least dark gray phase). Sketches of cylindrical samples (light gray) show the location of the sample portion (black rectangles) inspected in the sample central section (orange plane).
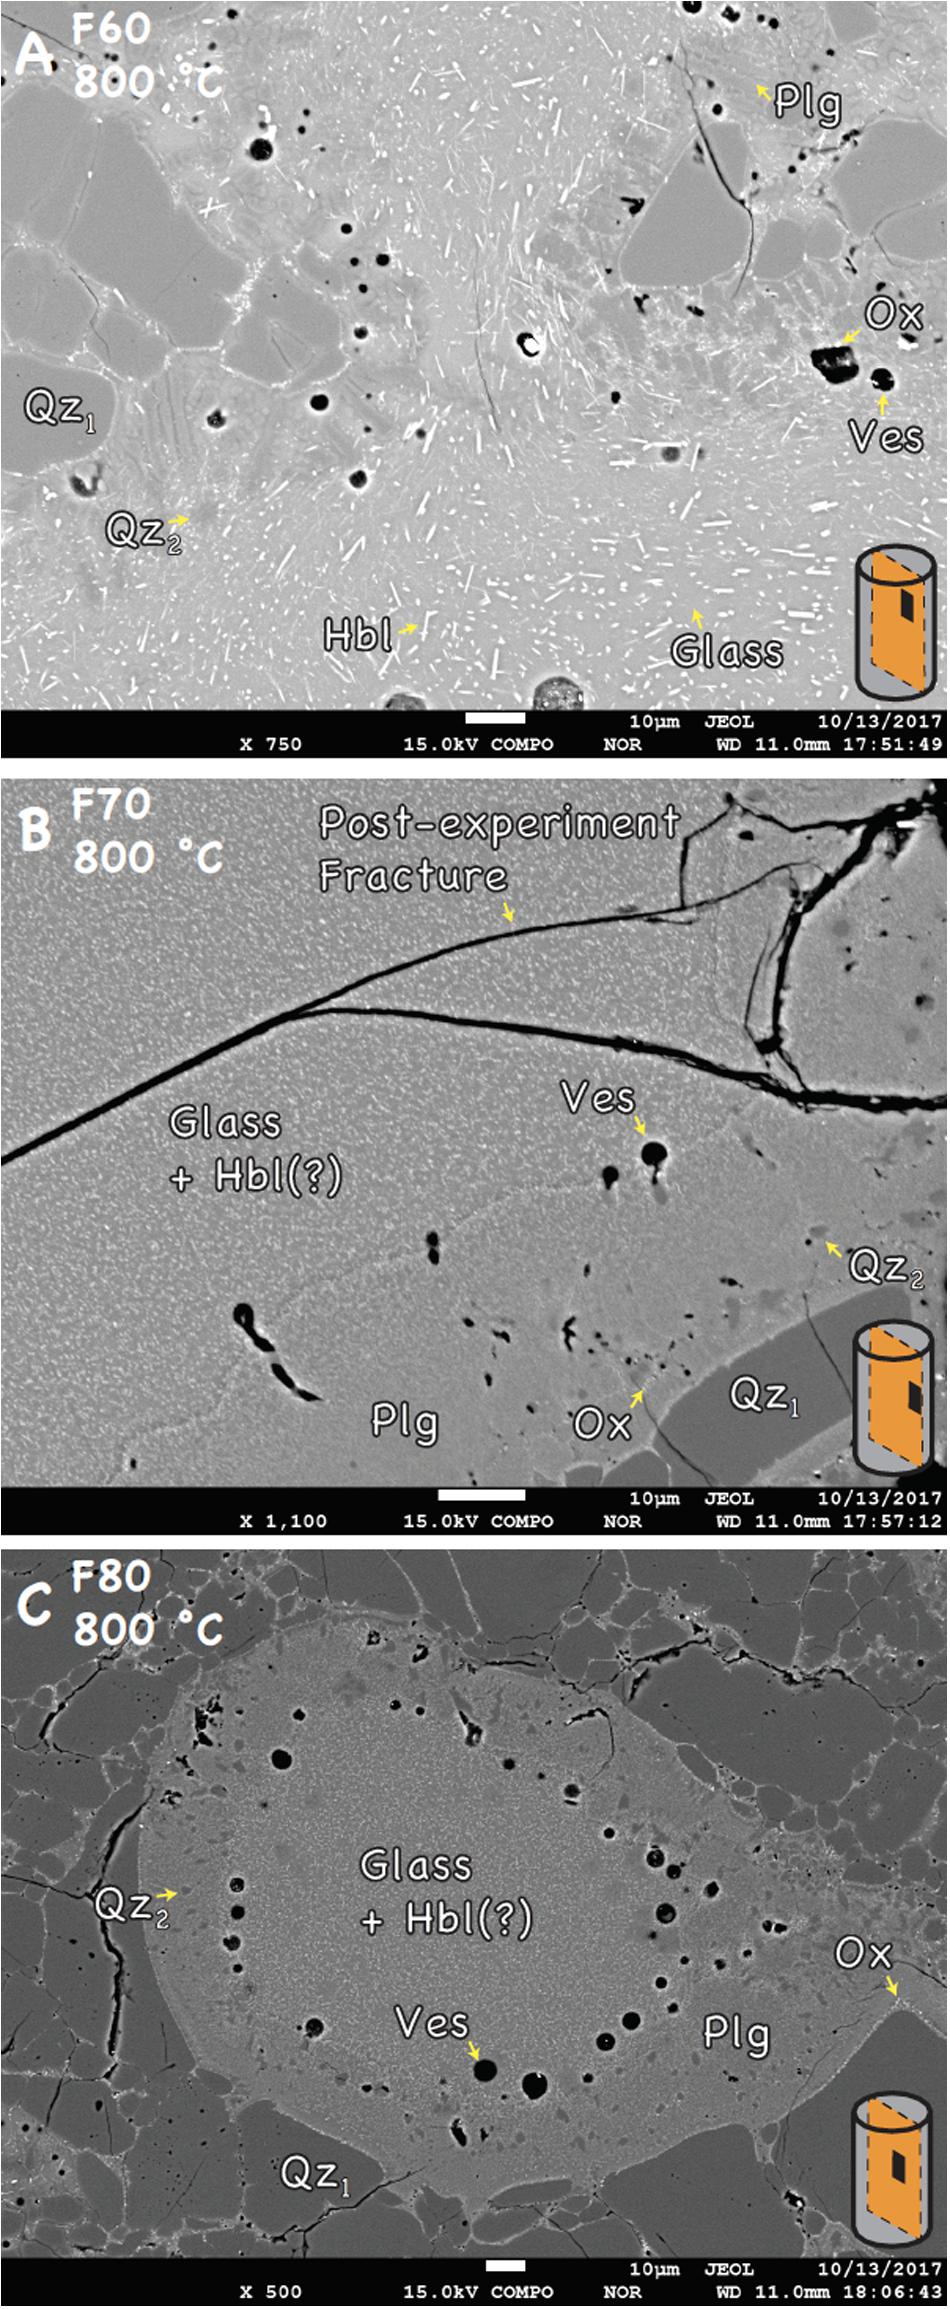
Figure 6. FEG-probe-based BSE images of selected portions within the central polished sections of: (A) F60, (B) F70, and (C) F80 at 800°CC. See acronyms from Figure 5, plus Ox = oxide (white round phase). Sketches of cylindrical samples (light gray) show the location of the sample portion (black rectangles) inspected in the sample central section (orange plane).
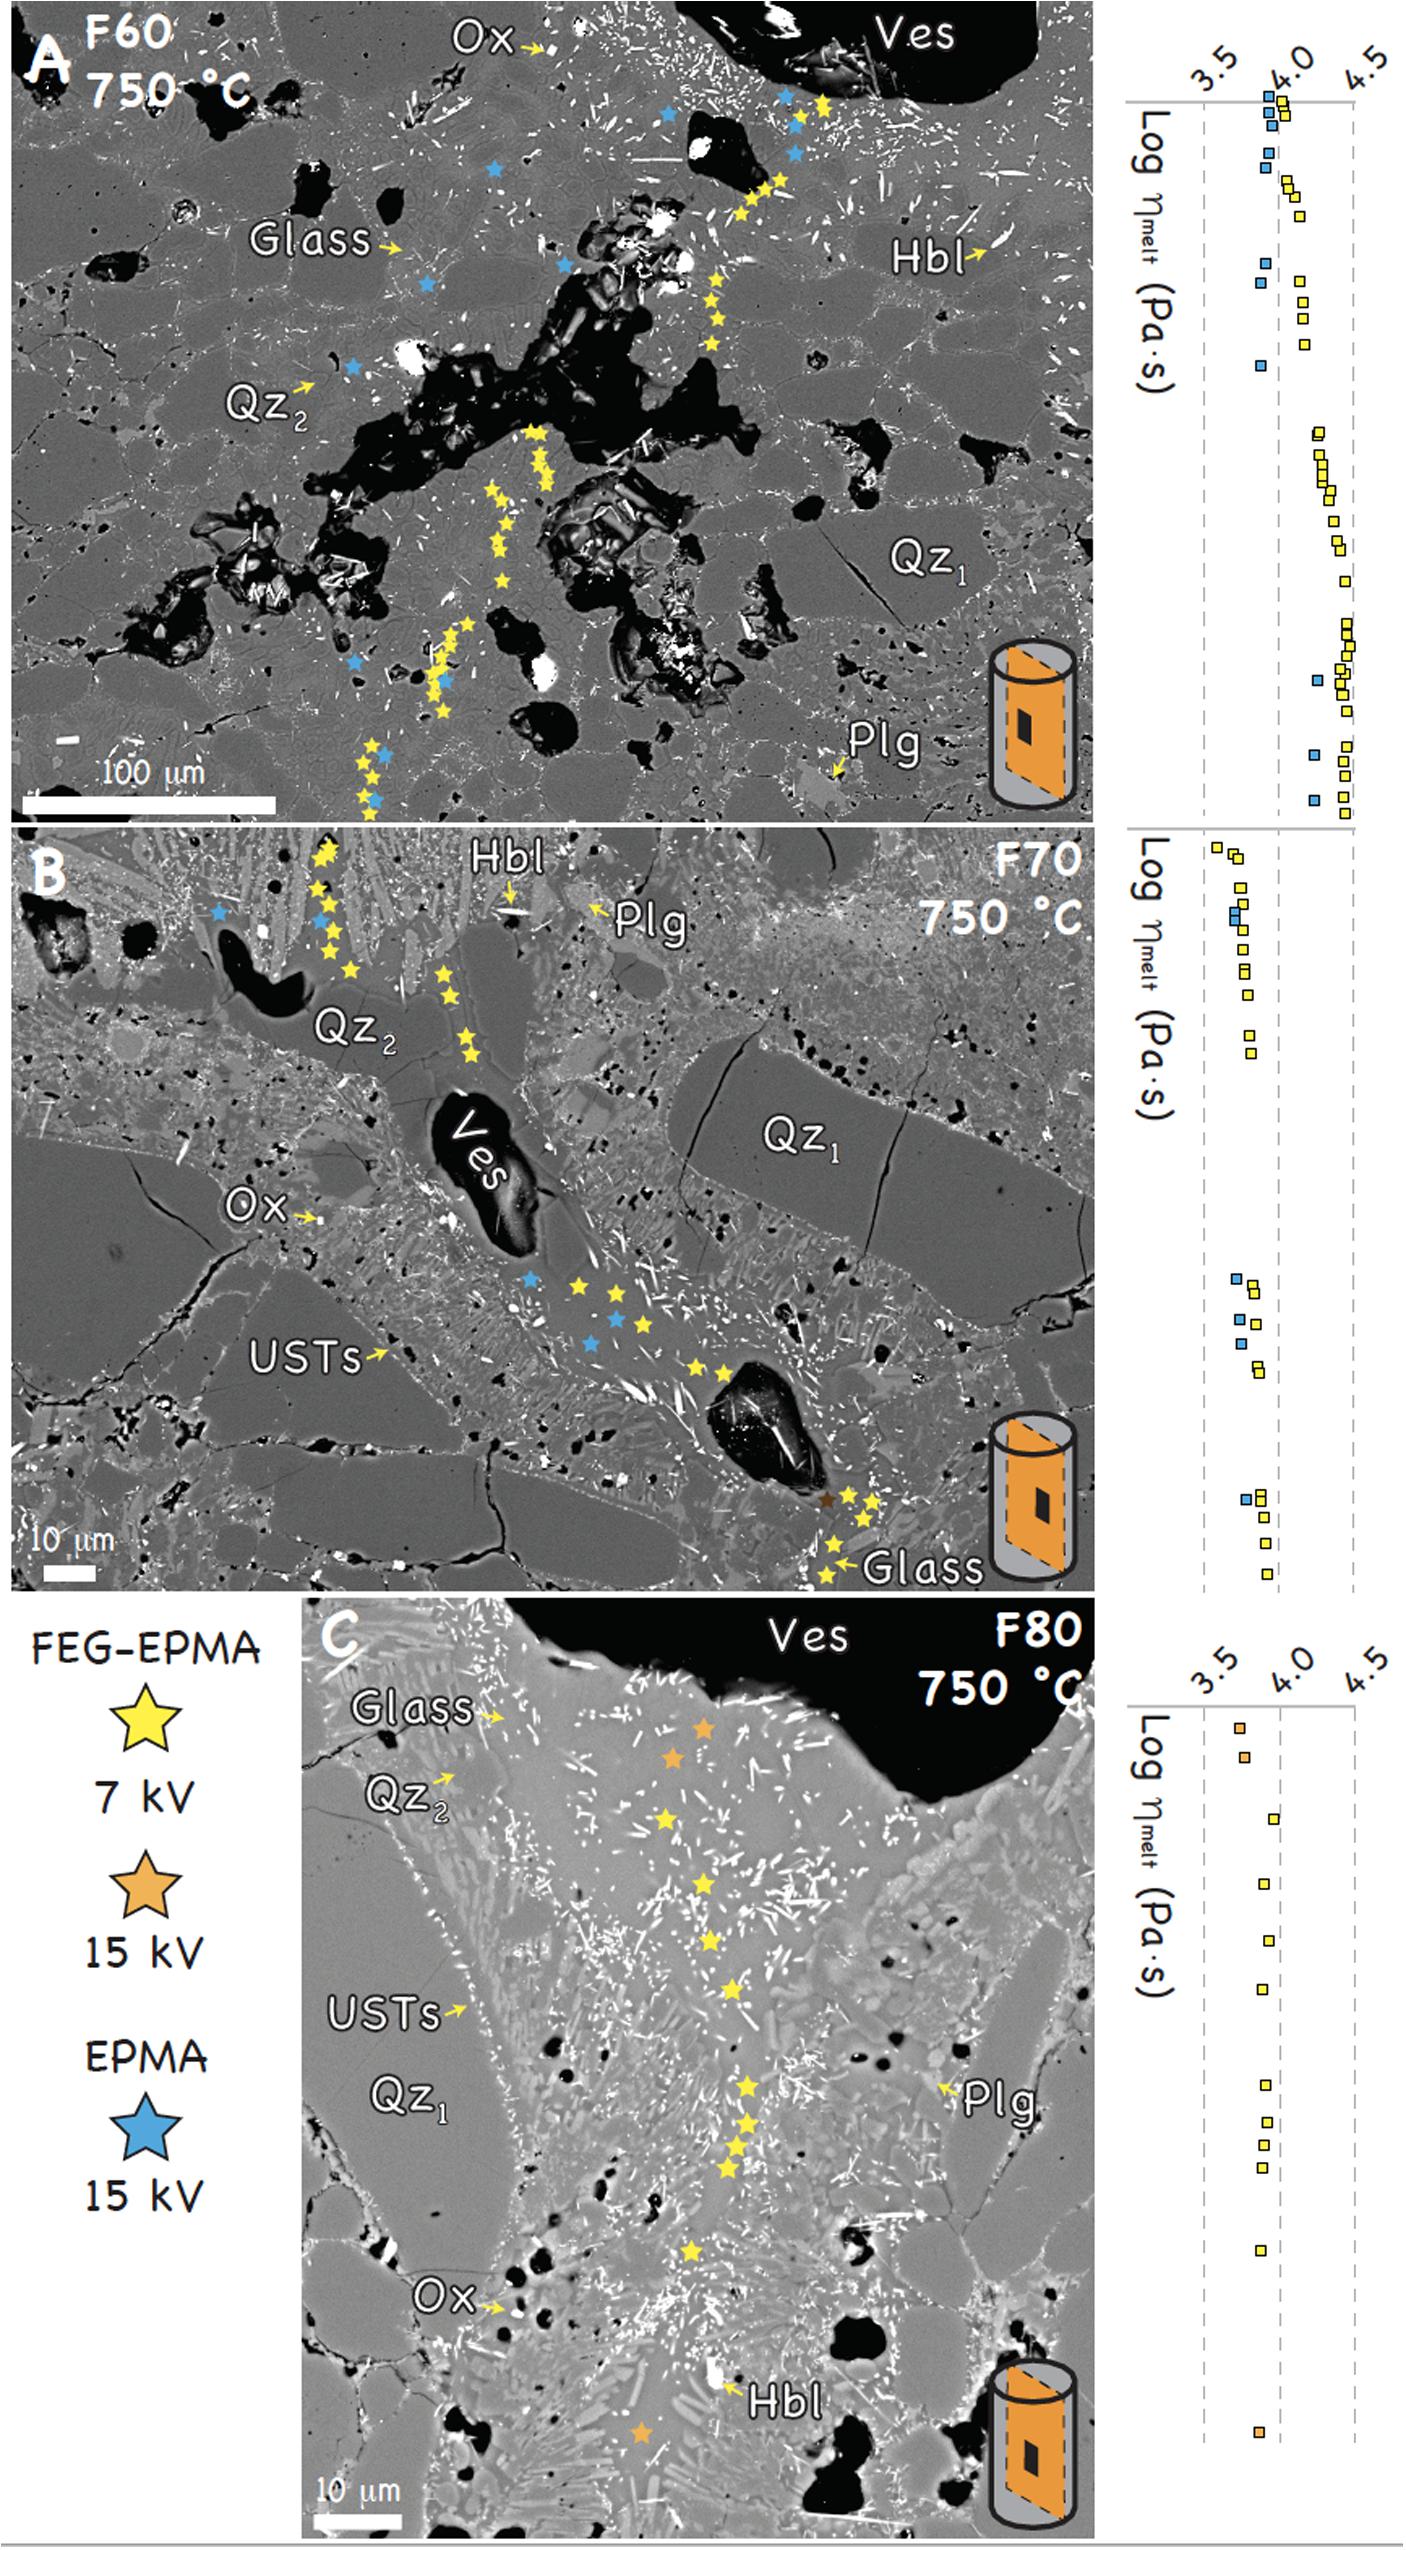
Figure 7. FEG-probe-based BSE images of selected portions within the central polished sections of: (A) F60, (B) F70, and (C) F80 at 750°CC. Error bars corresponding to 2σ are smaller than symbols. See acronyms from Figures 5,6, plus USTs = unidirectional solidification textures, consisting of plagioclase and quartz (Qz2) aligned perpendicular to the surface of the pre-existing quartz minerals (Qz1). Sketches of cylindrical samples (light gray) show the location of the sample portion (black rectangles) inspected in the sample central section (orange plane).
At 850°CC (Figure 5), vesicles are sub-rounded and surrounded by newly-formed quartz grains (Qz2) that are 20-μm across and roundish and, thus, devoid of asperities such as those of the pre-existing quartz (70-μm across, Qz1). Quartz of round shape is typically formed in H2O-saturated felsic melts (Cabane et al., 2001). Hornblende needles (10-μm long) and tabular plagioclase (40-μm long) are primarily found in vesicle-free regions. Glass-rich regions are free of vesicles and newly-formed minerals (Figure 5). Melt viscosity is homogeneously distributed in the sample, with logηmelt = 3.5 ± 0.2 (Figure 5).
At 800°CC (Figure 6), new quartz (Qz2), plagioclase, and microscopic oxides form on pre-existing quartz (Qz1). The presence of oxides “coating” quartz and plagioclase favors round vesicles (10-μm diameter) to adhere to the mineral surface, in agreement with previous experimental observations (Hurwitz and Navon, 1994; Laporte, 1994; Navon and Lyakhovsky, 1998; Navon et al., 1998). Glass is populated by oxides (1-μm) and hornblende needles that, at Φ = 0.6, form an alignment texture within glass regions of 10- to 30-μm size (Figure 6A). At Φ = 0.8, plagioclase is abundant (Figure 6C). Both vesicles and glass are found within the glass-rich portions of the starting materials, which were sealed by the progression of crystallization and gas exsolution (Figure 6C). Glass could not be analyzed due to a lack of crystal-free spots; thus, no logηmelt estimations are presented.
At 750°CC (Figure 7), new quartz (Qz2), plagioclase, oxide, and hornblende adhering to pre-existing quartz (Qz1) are widespread. Quartz and plagioclase are arranged in unidirectional solidification textures (USTs; Shannon et al., 1982) that also entrap 3-μm diameter vesicles (Figure 7C). In places, these textures end with new 50-μm quartz grown from the USTs (Figure 7B). The glass region is constricted by large vesicles (20 μm) and hornblende needles, aligned perpendicularly to the USTs (Figure 7B). Pre-existing quartz is surrounded by a micrographic texture of ∼1-μm oxides and hornblende (Figures 7B,C). Logηmelt decreases by ∼0.5 from crystal-rich and bubble-poor regions to low crystallinity bubble-rich regions within the same sample, especially in specimen F60 (Figure 7A). Moreover, samples with high crystallinity (F70 and F80) display calculated logηmelt of 3.5–4.0, which is 0.5 orders of magnitude (Figure 7) lower than the value obtained for the low crystallinity samples (F60).
At each T, bubble growth was driven by H2O diffusion, with an initially high DH_2 O (4⋅10–11 m2/s at 4.2 wt% H2O) that increased with increasing H2O in the residual melt (10–10 m2/s at 5–7 wt% H2O) during crystallization. In agreement with previous studies (Lyakhovsky et al., 1996), high DH_2 O leads to large H2O diffusion distances (∼8 mm > sample length and diameter) in the range of T and run duration of our experiments. There is no evidence of physical interconnectivity of vesicles (Figures 5–7), which suggests that bubbles formed by H2O diffusion only. Locally, H2O in the glass exceeds H2O-saturation conditions (>5–7 wt% H2O at experimental P-T; Papale et al., 2006; Supplementary Material), either in the 10-μm thick glass halos around vesicles due to H2O resorption from bubbles during cooling (McIntosh et al., 2014) or in glass portions suggested to be populated by “nanobubbles” (Davydov et al., 2005). The volume fraction of new minerals increases with decreasing initial Φ at all T. This is due to the fact that samples with low crystallinity (F60) display larger amount of residual melt that degas and crystallize with respect to the high-crystallinity systems (F70 and F80).
Rhyolite-MELTS calculations predict that the starting melt would crystallize plagioclase at 850°CC, followed by quartz at 800°CC (Figure 8A). Solidification fronts from 850 to 750°CC would thus be driven by: (i) initial homogenous nucleation of hornblende, plagioclase, and limited quartz, (ii) heterogeneous growth of hornblende, quartz, and plagioclase upon pre-existing quartz, and (iii) increase of vesicle content (Figure 8A). These calculations provide minimum mineral fractions in the absence of amphibole, which increases H2O in the melt and, thus, leads to less extensive crystallization, as observed in our experiments. Overall, the volume fraction of vesicles tends to decrease from the sample center toward its periphery at highest crystallinity (Figures 4B,C).
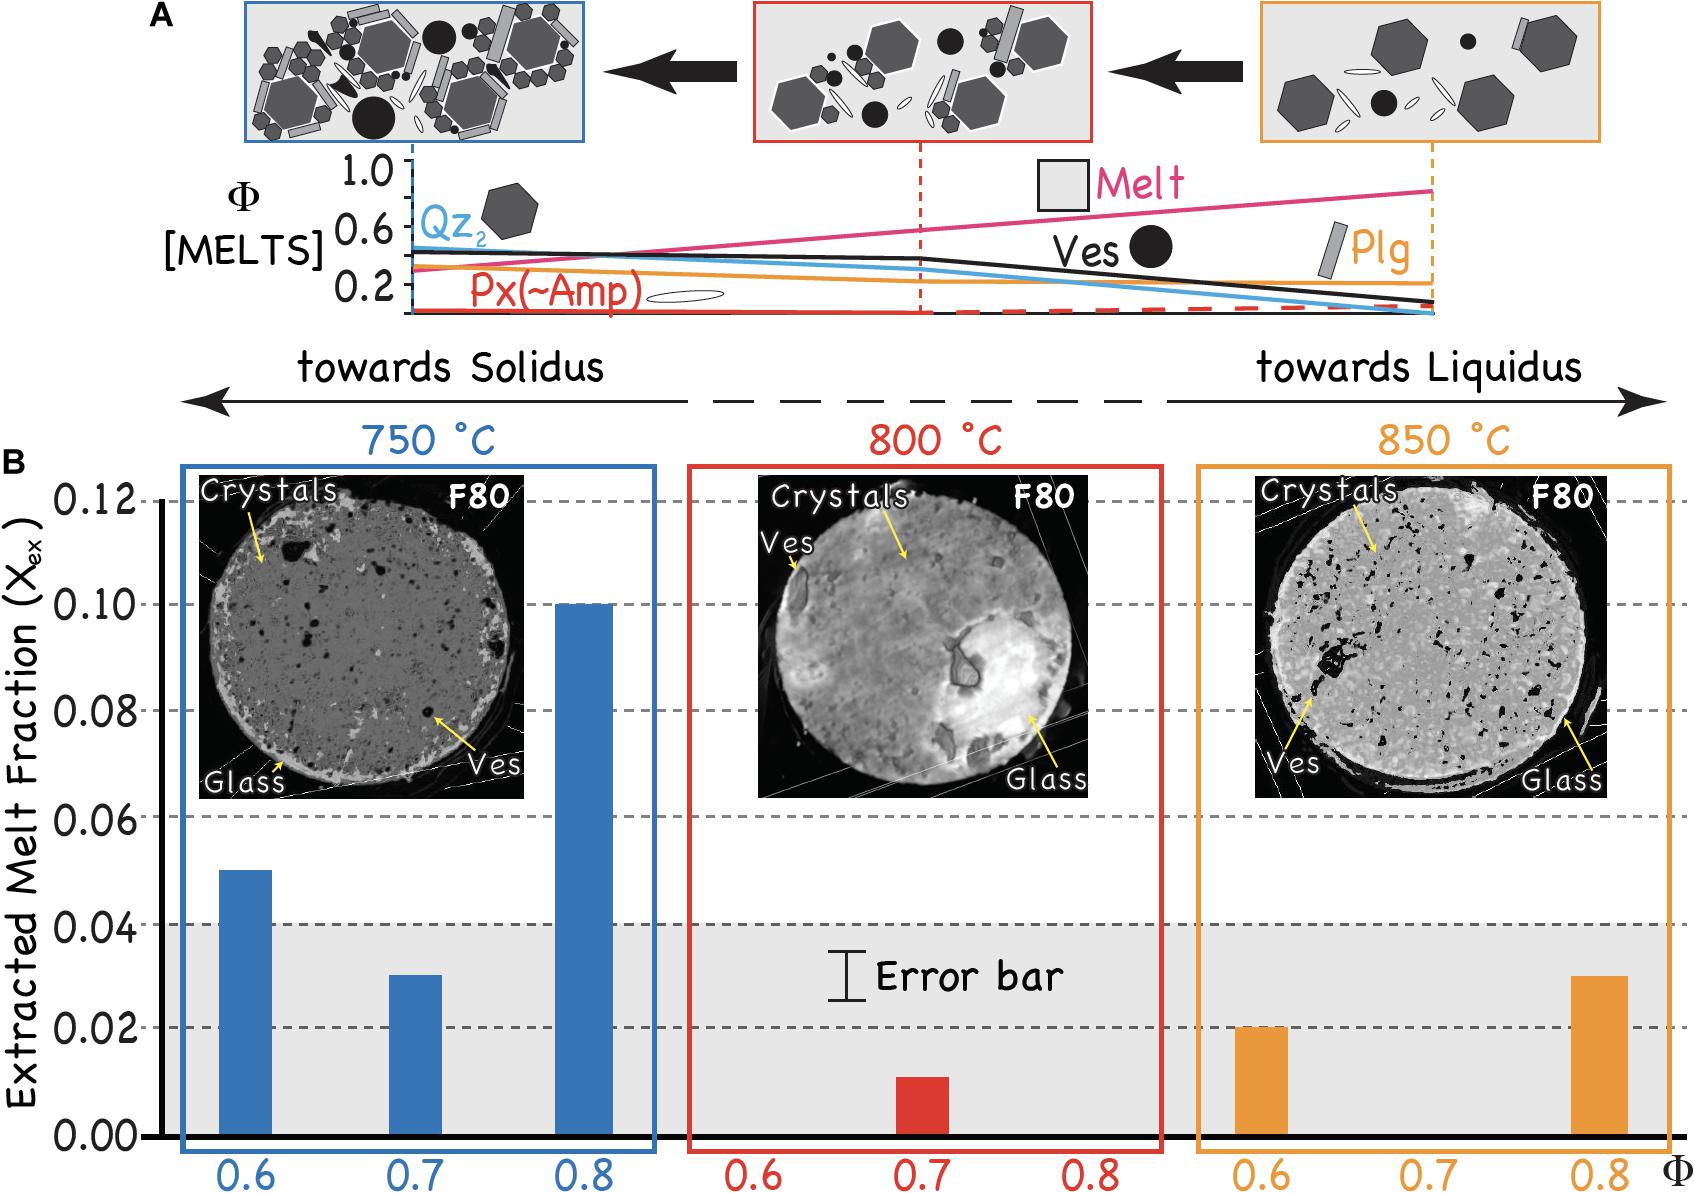
Figure 8. (A) Volume fraction variation of the major phases at different T, based on crystallization simulations using Rhyolite-MELTS. (B) Extracted melt fraction (Xex) as a function of T and Φ, with representative X-ray tomographic projections (6 μm/pixel spatial resolution; top-viewed) taken in the middle portion of each sample that show the distribution of glass (light gray), vesicles (black), and crystals (dark gray). The gray area indicates the volume fractions of residual rhyolitic melt observed in natural enclaves in volcanic rocks (after Bacon, 1986).
Discussion
The microstructures produced experimentally are the consequence of undercooled partial crystallization of magma that lead to enhanced differentiation of the interstitial melt (from dacite to rhyolite) and disequilibrium rock textures. Both microstructural and chemical analyses demonstrate that in situ melt differentiation is driven by vapor-saturated magma crystallization and physical migration of the residual melt, as a result of pressure gradient caused by gas exsolution.
Φ and T govern melt and gas expulsion from the magma during solidification. The reduction of pore space by “crystal zipping” (Figures 7B,C), driven by the advancement of solidification fronts (Marsh, 1995), forces both melt and bubbles to migrate toward the crystal-poor regions and to be segregated toward the sample periphery (Figure 8B). We quantify the outward movement of melt by measuring the final volume fraction of glass/melt in both the central and peripheral sections of the sample, Xf(central) and Xf(peripheral), respectively, where the peripheral section is located at 1 mm radial distance. We then define the quantity Xex to be
and note that the larger the value of Xex, the greater the volume of outward melt transport. We observe that Xex ≤ 0.03 ± 0.01 at 850 and 800°CC, and Xex ≤ 0.10 ± 0.01 at 750°CC. At 750°CC, crystallization produces a continuous network of minerals upon the pre-existing quartz grains and enhances the P increase during gas expansion in the constricted channels (Figure 7B). Concurrent pore restriction by crystallization and volume expansion upon H2O exsolution by diffusion into bubbles leads to highly efficient extraction of large melt fraction by gas filter pressing. Conversely, in the runs at 800 and 850°CC, appreciable melt volume extraction occurs at Φ ≥ 0.8 due to: gas expansion in absence of melt pore restriction caused by crystallization at 850°CC (Figure 5C), and limited crystallization without extensive gas exsolution at 800°CC (Figure 6C). Both cases make evident the limited effectiveness of melt extraction driven by exsolved gas (Figure 8B).
The volumetric estimates of extracted melt in our experiments are in line with similar estimates determined using mass balance calculations and textural observations of rinds and cores of glass-bearing andesitic enclaves in volcanic rocks (Bacon, 1986). Specifically, Bacon (1986) showed that the extraction of 0.02–0.04 volume fraction of rhyolitic melt is required to produce the chemical discrepancies between cores and rinds of andesitic inclusions. A few millimeters thick glass linings in vesicles and the rhyolitic glass-filled vesicles found in rinds testify to the migration of interstitial melt from core to margin of the enclaves by gas filter pressing (Anderson et al., 1984), similar to what observed in this study (Figure 8B).
In previous experiments simulating gas filter pressing in the absence of concurrent crystallization (Pistone et al., 2015), melt extraction was efficient for 0.6 ≤ Φ ≤0.74. Our new study shows how melt and gas extraction proceeds in more complex systems undergoing crystallization. Very evolved, H2O-rich (5–7 wt% H2O) melts with ηmelt ≤ 104 Pa s (Figures 5, 7) are highly mobile and their migration is efficient even at Φ > 0.8, below the maximum crystallinity preserving melt connectivity in volatile-rich systems (Φ = 0.89–0.93; Faul, 2001; Cheadle et al., 2004; Rosenberg and Handy, 2005). The presence of continuous chains of minerals formed at the solidification fronts (Philpotts et al., 1998,1999; Philpotts and Dickson, 2000) builds a strong network that is key to promoting melt extraction by gas filter pressing.
Implications
Microstructural and chemical results can be extrapolated to melt and gas movements during magma cooling, for example of a granitic pluton in the upper crust. We can constrain the operating timescale for gas and melt extraction prior to complete solidification of the host mush. Below the melt connectivity transition (Rosenberg and Handy, 2005), we first estimate melt permeability in our quartz-rich magmas (κ) with melt fraction (Xf; Figure 8) and average mineral size (R) at the specific T (Richter and McKenzie, 1984):
where the permeability coefficient A = 50 (McKenzie, 1984; Jackson et al., 2003; Bachmann and Bergantz, 2004; Pistone et al., 2015) for 0.07 < Xf < 0.1 (in the presence of gas bubbles) and R ranging from 70 μm (initial quartz size) at 850°CC to 150 μm (due to overgrowth of new quartz and plagioclase) at 750°CC. κ ranges from 3⋅10–13 m2 at 850°CC to 8⋅10–12 m2 at 750°CC. Here we assume magmatic suspensions containing a monodisperse distribution of crystal size. As magmas contain crystals of different size and shape (i.e., polydisperse suspensions), which both tend to reduce the permeability with respect to monodisperse systems (Bachmann and Bergantz, 2004; Rust and Cashman, 2011), the volumetric rates of melt extraction calculated here for each mineral size (70–150 μm) are maxima.
The velocity (v) of melt and gas migration out of the crystal network can be estimated using Darcy’s law:
is the gas pressure gradient to move melt from the sample center to its periphery (x = 1-mm radius distance) and is calculated based on the difference between experimental P and gas saturation P. From 850 to 750°CC, changes from 0.001 to 0.12 kbar/m. Hence, at 1.1 kbar, the extraction of the same amount of H2O-rich (4–7 wt%) melt (Xf = 0.1) occurs at ∼1 to ∼3 μm/day at 850°CC (with ηmelt = 104 to 105 Pa⋅s) and ∼80 to ∼800 μm/day at 750°CC (with ηmelt = 105 to 106 Pa⋅s), respectively.
Assuming natural magmas have a phenocryst size of ∼3 to 10 mm (Figure 1), Eqs 6 and 7 predict expulsion velocities of melt and gas to increase from ∼1 to ∼8 m/year. These are, however, likely to be maximum estimates, as real magmas could attain, for equivalent Φ timescales that are several orders of magnitude slower at slower cooling rates, and bulk expansion of melt and crystals could minimize melt migration (Sisson and Bacon, 1999). The timescales of extraction of viscous felsic melt from highly crystallized magmas are broadly constrained from months to thousands of years (Huber et al., 2012; Wilson and Charlier, 2016; Gualda et al., 2018). Viable processes that can speed up melt extraction are: (i) volume contraction of magma of up to 20% upon cooling and solidification, which leads to constrictional volume that drives expulsion of residual melts (John and Blundy, 1993; John and Stünitz, 1997), (ii) diking into brittle country rocks or pre-existing magmas (Mahood and Cornejo, 1992) that triggers pluton decompression at its margins leading to magma brecciation and removal or “unzipping” of the melt (Figures 1D,E), and (iii) eruptions that rapidly evacuate magma reservoirs, similar to that observed during drilling into magma, where the melt (from a high-P region) invades the drill hole (low-P) within few minutes (Hardee et al., 1981; Helz, 1984). The cooling of gas-saturated magmas in proximity to their solidus has the potential to account for the extraction of interstitial melts by gas filter pressing that form pegmatitic caps or become eruptible magmas feeding volcanoes.
Conclusion
We present the first experimental study to show melt segregation driven by gas filter pressing from crystal mushes at conditions relevant to the Earth’s shallow crust. Through the use of conventional high-temperature and high-pressure experiments combined with high-spatial resolution techniques and Rhyolite-MELTS simulations, we have illustrated the physical conditions that allow gas-driven filter pressing to be an efficient process for melt extraction from near-solidus systems. Specifically, we have determined the effectiveness of gas-driven filter pressing to expel the silicic melt out of the crystal framework as a function of crystallinity and temperature conditions that bracket solidification of natural mushes. The results from our study are of prime importance for understanding the modality of the generation and extraction of volatile-rich crystal-poor magmas. At a more fundamental level, we document and explain how second boiling at the microscopic level affects the macroscopic dynamics of melt and gas mobilization. The cooling of volatile-saturated magmas in proximity to their solidus could represent a critical stage for silica-rich interstitial melts driven by gas filter pressing to be extracted and form pegmatitic caps or become eruptible magmas feeding volcanoes.
Large-scale magmatic reservoirs should be characterised by slow kinetics of crystallization and rate of gas exsolution (Sisson and Bacon, 1999), which were not simulated in our experiments. There is still need to investigate which short timescale process (years to decades) would speed up extraction and accumulation of large melt lenses (10–1000 km3; Bachmann and Bergantz, 2004; Bachmann and Huber, 2019) of the size required for large volcanic eruptions (Volcanic Explosivity Index >4; Newhall and Self, 1982). Using the present-day high-resolution local seismic tomography (cell volume of 125 km3; e.g., Miller and Smith, 1999), there is little geophysical evidence for the presence of crystal-poor bodies of large volume. Their “absence” could be related to long-term storage of melt-rich lenses within large long-lived mush zones with massive thermal inertia that favor slow cooling (Huber et al., 2009; Morse, 2011), as well as to sufficiently fast extraction and eruption of these melt lenses before complete solidification. Further effort is therefore required for scaling up the experimental results to magmatic reservoirs in the Earth’s crust.
Data Availability Statement
All datasets presented in this study are included in the article/Supplementary Material.
Author Contributions
MP and EB conceived and carried out the high-temperature and high-pressure experiments (with technical guidance and assistance from LB and TS). MP performed all the chemical and microstructural analyses (with technical guidance and assistance from MR) and computational calculations and prepared the manuscript. The quantitative information was finalized by MP and PJ. MP and FB explored the link between experiments and natural scenarios. LB, OM, TS, and JB provided critical guidance during the preparation of the manuscript, and all authors were instrumental in the resulting manuscript.
Funding
The SNSF PZ00P2_168166 (Ambizione Fellowship) grant and the UGA Presidential Funds to MP supported this research. ERC Advanced Grant CRITMAG to JB and NERC grant NE/K500823/1 to PJ supported fieldwork in Guernsey Island. LB and FB aknowledge support by SNF grants 200020_172513 and 200021_153094. TS was supported by a fellowship from the Herbette foundation.
Conflict of Interest
The authors declare that the research was conducted in the absence of any commercial or financial relationships that could be construed as a potential conflict of interest.
Acknowledgments
We ackowledge the support of M. Jercinovic (University of Massachussets in Amherst, MA) and A. van Lankvelt (CAMECA) during FEG-EPMA analyses. We also thank C. R. Bacon, M. A. Clynne (USGS), and Dante Canil (University of Victoria) for their insightful analysis and feedback on an earlier version of the manuscript. In memoriam to A. T. Anderson Jr. who first proposed gas filter pressing as a viable mechanism of melt egress from cooling magmas.
Supplementary Material
The Supplementary Material for this article can be found online at: https://www.frontiersin.org/articles/10.3389/feart.2020.00175/full#supplementary-material
References
Afanasyev, A., Blundy, J., Melnik, O., and Sparks, R. S. J. (2018). Formation of magmatic brine lenses via focussed fluid-flow beneath volcanoes. Earth Planet. Sci. Lett. 486, 119–128. doi: 10.1016/j.epsl.2018.01.013
Anderson, A. T. Jr., Swihart, G. H., Artioli, G., and Geiger, C. A. (1984). Segregation vesicles, gas filter-pressing, and igneous differentiation. J. Geol. 92, 55–72. doi: 10.1086/628834
Armstrong, J. T. (1988). “Quantitative analysis of silicate and oxide materials: comparison of Monte Carlo, ZAF, and (-(-z procedures,” in Microbeam Analysis, ed. D. E. Newbury (San Francisco, CA: San Francisco Press, Inc), 239–246.
Bachmann, O., and Bergantz, G. (2004). On the origin of crystal-poor rhyolites: extracted from batholithic crystal mushes. J. Petrol. 45, 1565–1582. doi: 10.1093/petrology/egh019
Bachmann, O., and Huber, C. (2019). The Inner Workings of Crustal Distillation Columns; the Physical Mechanisms and Rates Controlling Phase Separation in Silicic Magma Reservoirs. J. Petrol. 60, 3–18. doi: 10.1093/petrology/egy103
Bacon, C. R. (1986). Magmatic inclusions in silicic and intermediate volcanic rocks. J. Geophys. Res. 91, 6091–6112.
Balashov, N., Zaraisky, G. P., and Seltmann, R. (2000). Fluid-magmatic interaction and oscillation phenomena during granite melt crystallization with water-fluoride fluid gain-loss. Petrologiya 8, 563–585.
Baumgartner, L. P., Bodner, R., Leuthold, J., Müntener, O., and Putlitz, B. (2014). “The torres del paine intrusion as a model for a shallow magma chamber,” in Proceedings of the EGU General Assembly Conference, Vienna.
Baumgartner, L. P., Michel, J., Putlitz, B., Leuthold, J., Müntener, O., Robyr, M., et al. (2007). “Field guide to the Torres del Paine Igneous Complex and its contact aureole: field guide book GEOSUR 2007, Bolletino de Geofisica, GEOSUR 2007,” in Proceedings of the International Congress on the Southern Hemisphere, Santiago, 185.
Bégué, F., Gualda, G. A. R., Ghiorso, M. S., Pamukcu, A. S., Kennedy, B. M., Gravley, D. M., et al. (2014). Phase-equilibrium geobarometers for silicic rocks based on rhyolite-MELTS. Part 2: application to Taupo Volcanic Zone rhyolites. Contrib. Mineral. Petrol. 168:1082.
Blank, J. G., Stolper, E. M., and Carroll, M. R. (1993). Solubilities of carbon dioxide and water in rhyolitic melt at 850 °C and 750 bars. Earth Planet. Sci. Lett. 119, 27–36. doi: 10.1016/0012-821x(93)90004-s
Blundy, J. D., Mavrogenes, J., Tattitch, B., Sparks, R. S. J., and Gilmer, A. (2015). Generation of porphyry copper deposits by gas-brine reaction in volcanic arcs. Nat. Geosci. 8, 235–240. doi: 10.1038/ngeo2351
Blundy, J. D., and Sparks, R. S. J. (1992). Petrogenesis of mafic inclusions in granitoids of the Adamello Massif, Italy. J. Petrol. 33, 1039–1104. doi: 10.1093/petrology/33.5.1039
Brown, M., Averkin, Y. A., and McLellan, E. L. (1995). Melt segregation in migmatites. J. Geophys. Res. 100, 15655–15679. doi: 10.1029/95jb00517
Cabane, H., Laporte, D., and Provost, A. (2001). Experimental investigation of the kinetics of Ostwald ripening of quartz in silicic melts. Contrib. Mineral. Petrol. 150, 361–373. doi: 10.1007/s004100100296
Candela, A. (1997). A review of shallow, ore-related granites: textures, volatiles, and ore metals. J. Petrol. 38, 1619–1633. doi: 10.1093/petroj/38.12.1619
Candela, A., and Blevin, L. (1995). Do some miarolitic granites preserve evidence of magmatic volatile phase permeability? Econ. Geol. 90, 2310–2316. doi: 10.2113/gsecongeo.90.8.2310
Candela, P. A., and Piccoli, P. M. (1995). “Model ore-metal partitioning from melts into vapor and vapor/brine mixtures,” in Magmas, Fluids, and Ore Deposits, ed J. F. H. Thompson Min. Ass. Can., 23, 101–127.
Caricchi, L., and Blundy, J. D. (eds) (2015). “Experimental petrology of monotonous intermediate magmas,” in Chemical, Physical and Temporal Evolution of Magmatic Systems (London: Geological Society of London Publications), 105–130. doi: 10.1144/sp422.9
Caroff, M., Coint, N., Hallot, E., Hamelin, C., Peucat, J.-J., and Charreteur, G. (2011). The mafic-silicic layered intrusions of Saint-Jean-du-Doigt (France) and North-Guernsey (Channel Islands), Armorican Massif: gabbro–diorite layering and mafic cumulate–pegmatoid association. Lithos 125, 675–692. doi: 10.1016/j.lithos.2011.03.019
Castro, J. M., Burgisser, A., Schipper, C. I., and Mancini, S. (2012). Mechanisms of bubble coalescence in silicic magmas. Bull. Volcanol. 74, 2339–2352. doi: 10.1007/s00445-012-0666-1
Cheadle, M. J., Elliott, M. T., and McKenzie, D. (2004). Percolation threshold and permeability of crystallizing igneous rocks: the importance of textural equilibrium. Geology 32, 757–760.
Clemens, J. D., Holloway, J. R., and White, A. J. R. (1986). Origin of an A-type granite: experimental constraints. Am. Mineral. 71, 317–324.
Clemens, J. D., and Wall, J. (1981). Origin and crystallization of some peraluminous (S-type) granitic magmas. Can. Mineral. 19, 111–131.
Colucci, S., Battaglia, M., and Trigila, R. (2015). A thermodynamical model for the surface tension of silicate melts in contact with H2O gas. Geochim. Cosmochim. Acta 175, 113–127. doi: 10.1016/j.gca.2015.10.037
Connolly, J., Schmidt, M., Solferino, G., and Bagdassarov, N. (2009). Permeability of asthenospheric mantle and melt extraction rates at mid-ocean ridges. Nature 462, 209–212. doi: 10.1038/nature08517
Dall’Agnol, R., Scaillet, B., and Pichavant, M. (1994). Phase relations of amphibole-biotite bearing granites. I. Effects of a(H2O) under oxidizing conditions. Terra Abstr. 6:13.
Davydov, M. N., Kendrinskii, K., Chernov, A. A., and Takayama, K. (2005). Generation and evolution of cavitation in magma under dynamic unloading. J. Appl. Mech. Tech. Phys. 46, 208–215. doi: 10.1007/s10808-005-0036-2
de Bremond, d’Ars, J., Martin, H., Auvray, B., and Lecuyer, C. (1992). Petrology of a magma chamber: the Plutonic Complex of Guernsey (Channel Islands, UK). J. Geol. Soc. 149, 701–708. doi: 10.1144/gsjgs.149.5.0701
Degruyter, W., Parmigiani, A., Huber, C., and Bachmann, O. (2019). How do volatiles escape their shallow magmatic hearth? Philos. Trans. R. Soc. A 377:20180017. doi: 10.1098/rsta.2018.0017
Dell’Angelo, L. N., and Tullis, J. (1988). Experimental deformation of partially melted granitic aggregates. J. Metamorph. Geol. 6, 495–515. doi: 10.1111/j.1525-1314.1988.tb00436.x
Devine, J. D., Gardner, J. E., Brack, H. P., Layne, G. D., and Rutherford, M. J. (1995). Comparison of microanalytical methods for estimating H2O contents of silicic volcanic glasses. Am. Mineral. 80, 319–328. doi: 10.2138/am-1995-3-413
D’Lemos, R. S. (1987). Relationships between the Cobo Granite and the Bordeaux Diorite Complex, Guernsey. Ph.D. dissertation, University of Bristol, Bristol.
Driesner, T. (2007). The system H2O-NaCl. Part II: correlations for molar volume, enthalpy, and isobaric heat capacity from 0 to 1000 (C, 1 to 5000 bar, and 0 to 1 XNaCl. Geochim. Cosmochim. Acta 71, 4902–4919. doi: 10.1016/j.gca.2007.05.026
Driesner, T., and Heinrich, C. A. (2007). The system H2O_NaCl. Part I. Correlation formulae for phase relations in temperature–pressure–composition space from 0 to 1000 (C, 0 to 5000 bar, and 0 to 1 XNaCl. Geochim. Cosmochimica Acta 71, 4880–4901. doi: 10.1016/j.gca.2006.01.033
Dufek, J., and Bachmann, O. (2010). Quantum magmatism: magmatic compositional gaps generated by melt-crystal dynamics. Geology 38, 687–690. doi: 10.1130/g30831.1
Faul, U. H. (2001). Melt retention and segregation beneath mid-ocean ridges. Nature 410, 920–923. doi: 10.1038/35073556
Fenn, M. (1977). The nucleation and growth of alkali feldspars from hydrous melts. Can. Mineral. 15, 135–161.
Fogel, R. A., and Rutherford, M. J. (1990). The solubility of carbon dioxide in rhyolitic melts: a quantitative FTIR study. Am. Mineral. 75, 1311–1326.
Gonnermann, H. M., and Manga, M. (2007). The fluid mechanics inside a volcano. Annu. Rev. Fluid Mech. 39, 321–356. doi: 10.1146/annurev.fluid.39.050905.110207
Grosse, P., Toselli, A. J., and Rossi, J. N. (2010). Petrology and geochemistry of the orbicular granitoid of Sierra de Velasco (NW Argentina) and implications for the origin of orbicular rocks. Geol. Mag. 147, 451–468. doi: 10.1017/s0016756809990707
Gualda, G. A. R., and Ghiorso, M. S. (2013). Low-pressure origin of high-silica rhyolites and granites. J. Geol. 121, 537–545. doi: 10.1086/671395
Gualda, G. A. R., Ghiorso, M. S., Lemons, R. V., and Carley, T. L. (2012). Rhyolite-MELTS: a modified calibration of MELTS optimized for silica-rich, fluid-bearing magmatic systems. J. Petrol. 53, 875–890. doi: 10.1093/petrology/egr080
Gualda, G. A. R., Gravley, D. M., Conner, M., Hollmann, B., Pamukcu, A. S., Bégué, F., et al. (2018). Climbing the crustal ladder: magma storage-depth evolution during a volcanic flare-up. Sci. Adv. 4:eaap7567. doi: 10.1126/sciadv.aap7567
Hardee, H. C., Dunn, J. C., Hills, R. G., and Ward, R. W. (1981). Probing the melt zone of Kilauea Iki Lava Lake, Kilauea Volcano, Hawaii. Geophys. Res. Lett. 8, 1211–1214. doi: 10.1029/gl008i012p01211
Hartung, E., Caricchi, L., Floess, D., Wallis, S., Harayama, S., Kouzmanov, K., et al. (2017). Evidence for residual melt extraction in the Takidani Pluton, Central Japan. J. Petrol. 58, 763–788. doi: 10.1093/petrology/egx033
Hartung, E., Weber, G., and Caricchi, L. (2019). The role of H2O on the extraction of melt from crystallising magmas. Earth Planet. Sci. Lett. 508, 85–96. doi: 10.1016/j.epsl.2018.12.010
Helz, R. T. (1984). In situ fractionation of olivine tholeiite: Kilauea Iki lava lake, Hawaii. Geol. Soci. Am. Abstr. Programs 16, 536–537.
Hildreth, W. (1981). Gradients in silicic magma chambers: implications for lithospheric magmatism. J. Geophys. Res. 86, 10153–10192. doi: 10.1002/9781118782057.ch3
Hildreth, W. (2004). Volcanological perspectives on Long Valley, Mammoth Mountain, and Mono Craters: several contiguous but discrete systems. J. Volcanol. Geotherm. Res. 136, 169–198. doi: 10.1016/j.jvolgeores.2004.05.019
Hildreth, W., and Wilson, C. J. N. (2007). Compositional zoning of the Bishop Tuff. J. Petrol. 48, 951–999. doi: 10.1093/petrology/egm007
Holness, M. B. (2018). Melt segregation from silicic crystal mushes: a critical appraisal of possible mechanisms and their microstructural record. Contrib. Mineral. Petrol. 173:48. doi: 10.1007/s00410-018-1465-2
Holtz, F., and Johannes, W. (1994). Maximum and minimum water contents of granitic melts: implications for chemical and physical properties of ascending magmas. Lithos 32, 149–159. doi: 10.1016/0024-4937(94)90027-2
Holtz, F., Johannes, W., Tamic, N., and Behrens, H. (2001). Maximum and minimum water contents of granitic melts generated in the crust: a reevaluation and implications. Lithos 56, 1–14. doi: 10.1016/s0024-4937(00)00056-6
Huber, C., Bachmann, O., and Dufek, J. (2010a). The limitations of melting on the reactivation of silicic mushes. J. Volcanol. Geotherm. Res. 195, 97–105. doi: 10.1016/j.jvolgeores.2010.06.006
Huber, C., Bachmann, O., and Dufek, J. (2012). Crystal-poor versus crystal-rich ignimbrites: a competition between stirring and reactivation. Geology 40, 115–118.
Huber, C., Bachmann, O., and Manga, M. (2009). Homogenization processes in silicic magma chambers by stirring and mushification (latent heat buffering). Earth Planet. Sci. Lett. 283, 38–47. doi: 10.1016/j.epsl.2009.03.029
Huber, C., Bachmann, O., and Manga, M. (2010b). Two competing effects of volatiles on heat transfer in crystal-rich magmas: thermal insulation versus defrosting. J. Petrol. 51, 847–867. doi: 10.1093/petrology/egq003
Huber, C., and Parmigiani, A. (2018). A physical model for three-phase compaction in silicic magma reservoirs. J. Geophys. Res. Solid Earth 123, 2685–2705. doi: 10.1002/2017JB015224
Huber, C., Townsend, M., Degruyter, W., and Bachmann, O. (2019). Optimal depth of subvolcanic magma chamber growth controlled by volatiles and crust rheology. Nat. Geosci. 12, 762–768. doi: 10.1038/s41561-019-0415-6
Hui, H. J., Zhang, Y. X., Xu, Z. J., Del Gaudio, P., and Behrens, H. (2009). Pressure dependence of viscosity of rhyolitic melts. Geochim. Cosmochim. Acta 73, 3680–3693. doi: 10.1016/j.gca.2009.03.035
Hurwitz, S., and Navon, O. (1994). Bubble nucleation in rhyolitic melts: experiments at high pressure, temperature, and water content. Earth Planet. Sci. Lett. 122, 267–280. doi: 10.1016/0012-821x(94)90001-9
Jackson, M. D., Cheadle, M. J., and Atherton, M. P. (2003). Quantitative modeling of granitic melt generation and segregation in the continental crust. J. Geophys. Res. 108:2332. doi: 10.1029/2001JB001050
John, B. E., and Blundy, J. D. (1993). Emplacement-related deformation of granitoid magmas, southern Adamello Massif, Italy. Geol. Soc. Am. Bull. 105, 1517–1541. doi: 10.1130/0016-7606(1993)105<1517:erdogm>2.3.co;2
John, B. E., and Stünitz, H. (1997). “Magmtic fracturing and small-scale melt segregation during pluton emplacement: evidence from the Adamello Massif (Italy),” in Granite: From Segregation of Melt to Emplacement Fabrics, eds J. L. Bouchez, D. H. W. Hutton, and W. E. Stephens (Berlin: Kluwer Academic Publishers), 55–74. doi: 10.1007/978-94-017-1717-5_4
Johnson, M. C., and Rutherford, M. R. (1989). Experimentally determined conditions in the Fish Canyon Tuff, Colorado, magma chamber. J. Petrol. 30, 711–737. doi: 10.1093/petrology/30.3.711
Ketcham, R. A. (2005a). Computational methods for quantitative analysis of three-dimensional features in geological specimens. Geosphere 1, 32–41.
Ketcham, R. A. (2005b). Three-dimensional textural measurements using high-resolution X-ray computed tomography. J. Struct. Geol. 27, 1217–1228. doi: 10.1016/j.jsg.2005.02.006
Laporte, D. (1994). Wetting behavior of partial melts during crustal anatexis: the distribution of hydrous silicic melts in polycrystalline aggregates of quartz. Contrib. Mineral. Petrol. 116, 486–499. doi: 10.1007/bf00310914
Lautze, N. C., Sisson, T. W., Mangan, M. T., and Grove, T. L. (2011). Segregating gas from melt: an experimental study of the Ostwald ripening of vapor bubbles in magmas. Contrib. Mineral. Petrol. 161, 331–347. doi: 10.1007/s00410-010-0535-x
Lee, C.-T. A., Morton, D. M., and Farner, M. J., Moitra. (2015). Field and model constraints on silicic melt segregation by compaction/hindered settling: the role of water and its effect on latent heat release. Am. Mineral. 100, 1762–1777. doi: 10.2138/am-2015-5121
Leuthold, J., Müntener, O., Baumgartner, L. P., and Putlitz, B. (2014). Petrological constraints on the recycling of mafic crystal mushes and intrusion of braided sills in the Torres del Paine Mafic Complex (Patagonia). J. Petrol. 55, 917–949. doi: 10.1093/petrology/egu011
Lissenberg, J. C., and MacLeod, C. J. (2016). A reactive porous flow control on mid-ocean ridge magmatic evolution. J. Petrol. 57, 2195–2220. doi: 10.1093/petrology/egw074
Liu, E. J., Cashman, K. V., and Rust, A. C. (2015). Optimising shape analysis to quantify volcanic ash morphology. GeoResJ 8, 14–30. doi: 10.1016/j.grj.2015.09.001
Liu, Y., and Zhang, Y. (2000). Bubble growth in rhyolitic melt. Earth Planet. Sci. Lett. 181, 251–264. doi: 10.1016/s0012-821x(00)00197-7
Lowenstern, J. B. (2001). Carbon dioxide in magmas and implications for hydrothermal systems. Mineralium Depos. 36, 490–502. doi: 10.1007/s001260100185
Lyakhovsky, V., Hurwitz, S., and Navon, O. (1996). Bubble growth in rhyolitic melts: experimental and numerical investigation. Bull. Volcanol. 58, 19–32. doi: 10.1007/s004450050122
Mahood, G. A., and Cornejo, C. (1992). Evidence for ascent of differentiated liquids in a silicic magma chamber found in a granitic pluton. Tran. R. Soc. Edinburgh Earth Sci. 83, 63–69. doi: 10.1017/s0263593300007756
Marsh, B. D. (1981). On the crystallinity, probability of occurrence, and rheology of lava and magma. Contrib. Mineral. Petrol. 78, 85–98. doi: 10.1007/bf00371146
Marsh, B. D. (1995). Solidification fronts and magmatic evolution. Mineral. Mag. 60, 5–40. doi: 10.1180/minmag.1996.060.398.03
Masotta, M., Gaeta, M., Gozzi, F., Marra, F., Palladino, D., and Sottili, G. (2010). The Tufo Giallo della Via Tiberina eruptions (Sabatini Volcanic District, Roman Province): insights on H2O- and temperature-zoning in magma chambers. Lithos 118, 119–130. doi: 10.1016/j.lithos.2010.04.004
McCarthy, A., and Müntener, O. (2016). Comb layering monitors decompressing and fractionating hydrous mafic magmas in subvolcanic plumbing systems (Fisher Lake, Sierra Nevada, USA). J. Geophys. Res. 121, 8595–8621. doi: 10.1002/2016jb013489
McIntosh, I. M., Llewellin, E. W., Humphreys, M. C. S., Nichols, A. R. L., Burgisser, A., Schipper, C. I., et al. (2014). Distribution of dissolved water in magmatic glass records growth and resorption of bubbles. Earth Planet. Sci. Lett. 401, 1–11. doi: 10.1016/j.epsl.2014.05.037
McKenzie, D. (1984). The generation and compaction of partially molten rock. J. Petrol. 25, 713–765. doi: 10.1093/petrology/25.3.713
Michel, J., Baumgartner, L., Putlitz, B., Schaltegger, U., and Ovtcharova, M. (2008). Incremental growth of the Patagonian Torres del Paine laccolith over 90 k.y. Geology 36, 459–462.
Miller, D. S., and Smith, R. B. (1999). P and S velocity structure of the Yellowstone volcanic field from local earthquake and controlled source tomography. J. Geophys. Res. 104, 15105–15121. doi: 10.1029/1998jb900095
Morgan, G. B., and London, D. (1996). Optimizing the electron microprobe analysis of hydrous alkali aluminosilicate glasses. Am. Mineral. 81, 1176–1185. doi: 10.2138/am-1996-9-1016
Morse, S. A. (2011). The fractional latent heat of crystallizing magmas. Am. Mineral. 96, 682–689. doi: 10.2138/am.2011.3613
Müntener, O., Kelemen, B., and Grove, T. L. (2001). The role of H2O during crystallization of primitive arc magmas under uppermost mantle conditions and genesis of igneous pyroxenites: an experimental study. Contrib. Mineral. Petrol. 141, 643–658. doi: 10.1007/s004100100266
Nabelek, I., Whittington, A. G., and Sirbescu, M. L. C. (2010). The role of H2O in rapid emplacement and crystallization of granite pegmatites: resolving the paradox of large crystals in highly undercooled melts. Contrib. Mineral. Petrol. 160, 313–325. doi: 10.1007/s00410-009-0479-1
Navon, O., Chekhmir, A., and Lyakhovsky, V. (1998). Bubble growth in highly viscous melts: theory, experiments, and autoexplosivity of dome lavas. Earth Planet. Sci. Lett. 160, 763–776.
Navon, O., and Lyakhovsky, V. (1998). “Vesiculation processes in silicic magmas,” in The Physics of Explosive Volcanic Eruptions, Geological Society of London, Vol. 145, eds J. S. Gilbert and R. S. J. Sparks (London: Geological Society of London Publications), 27–50. doi: 10.1144/gsl.sp.1996.145.01.03
Newhall, C. G., and Self, S. (1982). The volcanic explosivity index (VEI) an estimate of explosive magnitude for historical volcanism. J. Geophys. Res. 87, 1231–1238.
Ni, H., and Zhang, Y. (2008). H2O diffusion models in rhyolitic melt with new high pressure data. Chem. Geol. 250, 68–78. doi: 10.1016/j.chemgeo.2008.02.011
Olsen, S. N., Marsh, B. D., and Baumgartner, L. P. (2004). Modelling mid-crustal migmatite terrains as feeder zones for granite plutons: the competing dynamics of melt transfer by bulk versus porous flow. Trans. R. Soc. Edinburgh Earth Sci. 95, 49–58. doi: 10.1017/s0263593300000912
Oppenheimer, J., Rust, A. C., Cashman, K. V., and Sandnes, B. (2015). Gas migration regimes and outgassing in particle-rich suspensions. Front. Phys. 3:60. doi: 10.3389/fphy.2015.00060
Paillat, O., Elphick, S. C., and Brown, W. L. (1992). The solubility of water in NaAlSi3O8 melts: a re-examination of Ab-H2O phase relationships and critical behaviour at high pressures. Contrib. Mineral. Petrol. 112, 490–500. doi: 10.1007/bf00310780
Papale, P., Moretti, R., and Barbato, D. (2006). The compositional dependence of the saturation surface of H2O + CO2 fluids in silicate melts. Chem. Geol. 229, 78–95. doi: 10.1016/j.chemgeo.2006.01.013
Parmigiani, A., Faroughi, S., Huber, C., Bachmann, O., and Su, Y. (2016). Bubble accumulation and its role in the evolution of magma reservoirs in the upper crust. Nature 532, 492–495. doi: 10.1038/nature17401
Parmigiani, A., Huber, C., and Bachmann, O. (2014). Mush microphysics and the reactivation of crystal-rich magma reservoirs. J. Geophys. Res. Solid Earth 119, 6308–6322. doi: 10.1002/2014JB011124
Philpotts, A. R., Brustman, C., Shi, J., Carlson, W. D., and Denison, C. (1999). Plagioclase-chain networks in slowly cooled basaltic magma. Am. Mineral. 84, 1819–1829. doi: 10.2138/am-1999-11-1209
Philpotts, A. R., and Dickson, L. D. (2000). The formation of plagioclase chains during convective transfer in basaltic magma. Nature 406, 59–61. doi: 10.1038/35017542
Philpotts, A. R., Shi, J., and Brustman, C. (1998). Role of plagioclase crystal chains in the differentiation of partly crystallized basaltic magma. Nature 395, 343–346. doi: 10.1038/26404
Pistone, M., Arzilli, F., Dobson, K. J., Cordonnier, B., Reusser, E., Ulmer, P., et al. (2015). Gas-driven filter pressing in magmas: insights into in-situ melt segregation from crystal mushes. Geology 43, 699–702. doi: 10.1130/g36766.1
Pistone, M., Blundy, J. D., and Brooker, R. A., Eimf. (2016). Textural and chemical consequences of interaction between hydrous mafic and felsic magmas: an experimental study. Contrib. Mineral. Petrol. 171:8. doi: 10.1007/s00410-015-1218-4
Pistone, M., Caricchi, L., Ulmer, P., Burlini, L., Ardia, P., Reusser, E., et al. (2012). Deformation experiments of bubble- and crystal-bearing magmas: rheological and microstructural analysis. J. Geophys. Res. 117:B05208. doi: 10.1029/2011JB008986
Pistone, M., Caricchi, L., Ulmer, P., and Reusser, E., Ardia. (2013). Rheology of volatile-bearing crystal mushes: mobilization vs. viscous death. Chem. Geol. 345, 16–39. doi: 10.1016/j.chemgeo.2013.02.007
Pistone, M., Racek, M., and Štípska. (2020). Effects of diffusion of water and migration of melts in crustal rocks: an experimental study. Chem. Geol. 540:119548. doi: 10.1016/j.chemgeo.2020.119548
Pistone, M., Whittington, A. G., Andrews, B., and Cottrell, E. (2017). Crystal-rich lava dome extrusion during vesiculation: an experimental study. J. Volcanol. Geotherm. Res. 347, 1–14. doi: 10.1016/j.jvolgeores.2017.06.018
Pitzer, K. S., and Sterner, S. M. (1994). Equations of state valid continuously from zero to extreme pressures for H2O and CO2. J. Chem. Phys. 101, 3111–3116. doi: 10.1063/1.467624
Proussevitch, A., Sahagian, D. L., and Anderson, A. T. (1993). Dynamics of diffusive bubble growth in magmas: isothermal case. J. Geophys. Res. 98, 22283–22307. doi: 10.1029/93jb02027
Proussevitch, A. A., and Sahagian, D. L. (1998). Dynamics and energetics of bubble growth in magmas: analytical formulation and numerical modeling. J. Geophys. Res. 103, 18223–18251. doi: 10.1029/98jb00906
Putlitz, B., Baumgartner, L. P., Oberhaensli, R., Diamond, L., and Altenberger, U. (2001). “The Torres del Paine Laccolith (Chile); intrusion and metamorphism,” in Proceedings of the XI Annual V. M. Goldschmidt, Virginia, NV.
Richter, F. M., and McKenzie, D. P. (1984). Dynamical models for melt segregation from a deformable matrix. J. Geol. 92, 729–740. doi: 10.1086/628908
Robin, Y. F. (1979). Theory of metamorphic segregation and related processes. Geochim. Cosmochim. Acta 43, 1587–1600. doi: 10.1016/0016-7037(79)90179-0
Roduit, N. (2011). JMicroVision: Image Analysis Toolbox for Measuring and Quantifying Components of High-Definition Images. Version 1.2.7. Available online at: http://www.jmicrovision.com (accessed May 2011).
Rosenberg, C., and Handy, M. (2005). Experimental deformation of partially melted granite revisited: implications for the continental crust. J. Metamorph. Geol. 23, 19–28. doi: 10.1111/j.1525-1314.2005.00555.x
Rust, A. C., and Cashman, K. V. (2011). Permeability controls on expansion and size distributions of pyroclasts. J. Geophys. Res. 116, 1–17.
Sanders, I. S. (1986). Gas filter-pressing origin for segregation vesicles in dykes. Geol. Mag. 123, 67–72. doi: 10.1017/s0016756800026546
Sawyer, E. W., and Robin, Y. (1986). The sub-solidus segregation of layer-parallel quartz-feldspar veins in greenschist to upper amphibolite facies metasediments. J. Metamorph. Geol. 4, 237–260. doi: 10.1111/j.1525-1314.1986.tb00350.x
Scaillet, B., and Pichavant, M. (1994). Phase relations of amphibole-biotite bearing granites. II: effects of fO2. Terra Nova 6:42.
Scaillet, B., Pecher, A., Rochette, P., and Champenois, M. (1995a). The Gangotri granite (Garhwal Himalaya): laccolithic emplacement in an extending collisional belt. J. Geophys. Res. 100, 585–607. doi: 10.1029/94jb01664
Scaillet, B., Pichavant, M., and Roux, J. (1995b). Experimental crystallization of leucogranite magmas. J. Petrol. 36, 664–706.
Schindelin, J., Arganda-Carreras, I., Frise, E., Kaynig, V., Longair, M., Pietzsch, T., et al. (2012). Fiji: an open-source platform for biological-image analysis. Nat. Methods 9, 676–682.
Schmidt, M. W., Forien, M., Solferino, G., and Bagdassarov, N. (2012). Settling and compaction of olivine in basaltic magmas: an experimental study on the time scales of cumulate formation. Contrib. Mineral. Petrol. 164, 959–976. doi: 10.1007/s00410-012-0782-0
Shannon, J. R., Walker, B. M., Carten, R. B., and Geraghty, E. P. (1982). Unidirectional solidification textures and their significance in determining relative ages of intrusions at the Henderson Mine, Colorado. Geology 10, 293–297.
Sparks, R. S. J., Annen, C., Blundy, J. D., Cashman, K. V., Rust, A. C., and Jackson, M. D. (2019). Formation and dynamics of magma reservoirs. Philos. Trans. R. Soc. A 377:20180019. doi: 10.1098/rsta.2018.0019
Spiegelman, M., Kelemen, B., and Aharonov, E. (2001). Causes and consequences of flow organization during melt transport: the reaction infiltration instability in compactible media. J. Geophys. Res. 106, 2061–2077. doi: 10.1029/2000jb900240
Stoffregen, R. (1996). Numerical simulation of mineral-water isotope exchange via Ostwald ripening. Am. J. Sci. 296, 908–931. doi: 10.2475/ajs.296.8.908
Su, Y., Huber, C., Bachmann, O., Zajacz, Z., Wright, H., and Vazquez, J. (2016). The role of crystallization-driven exsolution on the sulfur mass balance in volcanic arc magmas. J. Geophys. Res. 121, 5624–5640. doi: 10.1002/2016jb013184
Tuttle, O. F., and Bowen, N. L. (1958). Origin of granite in the light of experimental studies in the system NaAlSi3O8-KAlSi3O8–SiO2–H2O. Geol. Soc. Am. Mem 74, 1–153. doi: 10.1130/MEM74
Vigneresse, J.-L. (2015). Textures and melt-crystal-gas interactions in granites. Geosci. Front. 6, 635–663. doi: 10.1016/j.gsf.2014.12.004
Wager, L. R., Brown, G. M., and Wadsworth, W. J. (1960). Types of igneous cumulates. J. Petrol. 1, 73–85. doi: 10.1093/petrology/1.1.73
Waters, L. E., and Lange, R. A. (2017). Why aplites freeze and rhyolites erupt: controls on the accumulation and eruption of high-SiO2 (eutectic) melts. Geology 45, 1019–1022. doi: 10.1130/g39373.1
Webber, K. L., Falster, A. U., Simmons, W., and Foord, E. E. (1997). The role of diffusion-controlled oscillatory nucleation in the formation of line rock in pegmatite-aplite dikes. J. Petrol. 38, 1777–1791. doi: 10.1093/petroj/38.12.1777
Webster, J. D., Holloway, J. R., and Hervig, R. L. (1987). Phase equilibria of a Be, U and F-enriched vitrophyre from Spor Mountain, Utah. Geochim. Cosmochim. Acta 51, 389–402. doi: 10.1016/0016-7037(87)90057-3
Whitney, J. (1988). The origin of granite: the role and source of water in the evolution of granitic magmas. Geol. Soc. Am. Bull. 100, 1886–1897. doi: 10.1130/0016-7606(1988)100<1886:toogtr>2.3.co;2
Wilson, C. J. N., and Charlier, B. L. A. (2016). The life and times of silicic volcanic systems. Elements 12, 103–108. doi: 10.2113/gselements.12.2.103
Zhang, C., Li, X., Almeev, R. R., Horn, I., Behrens, H., and Holtz, F. (2020). Ti-in-quartz thermobarometry and TiO2 solubility in rhyolitic melts: new experiments and parametrization. Earth Planet. Sci. Lett. 538:116213. doi: 10.1016/j.epsl.2020.116213
Keywords: melt, gas, magma, cooling, filter pressing
Citation: Pistone M, Baumgartner LP, Bégué F, Jarvis PA, Bloch E, Robyr M, Müntener O, Sisson TW and Blundy JD (2020) Felsic Melt and Gas Mobilization During Magma Solidification: An Experimental Study at 1.1 kbar. Front. Earth Sci. 8:175. doi: 10.3389/feart.2020.00175
Received: 25 March 2020; Accepted: 06 May 2020;
Published: 10 June 2020.
Edited by:
Chiara Maria Petrone, Natural History Museum, United KingdomReviewed by:
Silvio Mollo, Sapienza University of Rome, ItalyOlivier Bachmann, ETH Zürich, Switzerland
Copyright © 2020 Pistone, Baumgartner, Bégué, Jarvis, Bloch, Robyr, Müntener, Sisson and Blundy. This is an open-access article distributed under the terms of the Creative Commons Attribution License (CC BY). The use, distribution or reproduction in other forums is permitted, provided the original author(s) and the copyright owner(s) are credited and that the original publication in this journal is cited, in accordance with accepted academic practice. No use, distribution or reproduction is permitted which does not comply with these terms.
*Correspondence: Mattia Pistone, TWF0dGlhLlBpc3RvbmVAdWdhLmVkdQ==