 Romy Arnold
 Jan-Karl Haug
 Maximilian Lange2
 Jan Friesen
- 1Department of Catchment Hydrology, Helmholtz Centre for Environmental Research – UFZ, Leipzig, Germany
- 2Computational Landscape Ecology, Helmholtz Centre for Environmental Research – UFZ, Leipzig, Germany
Forest cover dynamics are an important indicator for climate change as well as for land conversion studies. Based on an analysis of 30 years of Landsat data a forest cover time series was generated and analyzed for the Dhofar mountains in Oman. The Dhofar mountains in Southern Oman with its semi-arid cloud forest is an important asset for livestock, water resources, and tourism. In this study we investigated whether forest cover trends are distinguishable and what impact forest cover changes have on water availability. To cope with gaps in the Landsat dataset the Dhofar mountains were divided into regions of interest (ROIs) that were based on hydrologic catchment boundaries. The results show, that, despite increasing pressure from tourism and increasing livestock numbers, the forest cover shows slight but not significant increases in most ROIs and significant forest cover increases in three ROIs. Overall, forest cover during the past 30 years is at least stable and most probably slightly increasing. With regard to water resources results show that, the impact of cloud forest interception amounts to an additional subcanopy water input of about 15–150% of annual rainfall. This additional water is only available below tree cover. Part of that water is, of course used by plant transpiration, however, the stemflow portion which is exceptionally high in this region infiltrates directly into deeper soil layers and eventually leads to groundwater recharge.
Introduction
Forest cover dynamics are an important indicator for climate change (Lenoir et al., 2008; Füssel et al., 2017) and can have a substantial impact on local water resources (Sahin and Hall, 1996). In addition, forest cover can be used to estimate the CO2 storage effect provided by forests (Foley et al., 2005; Hansen et al., 2013; Martone et al., 2018). With regard to hydrology, in most regions of the world forest increase is associated with less available water resources downstream (Schmeller et al., 2018), as forest canopies intercept precipitation leading to a reduction of water that reaches the ground. Cloud forests, however, harvest water from mist and fog (Bruijnzeel et al., 2011) thereby gaining additional precipitation which in some cases can even exceed rainfall (Giambelluca and Gerold, 2011).
The Dhofar cloud forest is an almost unique forest area, as, together with the Jabal Bura valley forest in western Yemen, it is one of only two closed forests in Arabia (Hall et al., 2008) and is thus extremely rare. Given its rarity there is global importance of the Dhofar cloud forest in terms of biodiversity. Locally, the forested area plays a major role in water resources (Hildebrandt and Eltahir, 2006; Friesen et al., 2018), agriculture (mostly animal husbandry), and to a large extent in terms of tourism. Besides the traditional benefits for livestock, tourism is an increasing economic benefit from both the monsoon climate and the resulting vegetation. The annual monsoon season (Khareef), attracts more than half a million tourists annually – compared to about 250,000 inhabitants of the region – that visit the Salalah coastal plain and the Dhofar mountains. Especially tourism as well as agriculture have an impact on the natural forest vegetation as infrastructure in terms of roads or recreational areas are constantly being built up in the mountains and as increasing livestock numbers forage on the vegetation. Although these threats to the natural forest vegetation are reported, only few studies exist (e.g., Schlecht et al., 2014; Galletti et al., 2016) and no consistent, long-term analysis of forest cover, that would allow for a multi-annual trend analysis throughout the Dhofar mountains is available.
The Landsat satellites provide long-term remote sensing data that allow for the derivation of vegetation indices, such as the Normalized Difference Vegetation Index (NDVI). The NDVI is one of the most applied indices in phenological studies, mainly due to data availability and robustness against noise and varying illumination geometries (Lange et al., 2017). Other indices, such as EVI or PPI, exist (Jin and Eklundh, 2014) that show improvements in terms of signal saturation, however, in terms of forest cover mapping and subsequent trend analyses, saturation issues do not play a major role. Using 30 years of Landsat data during the post-monsoon period, a classification into forest and non-forest pixels was accomplished. The classification was done through a threshold-based classification during the post-monsoon period. In the semi-arid setting, the pre-monsoon period is dry, so that no clear distinction can be made. The 3-month monsoon is characterized by heavy and continuous fog, during which cloud-free satellite data is almost non-existent. For the post-monsoon period, a distinction between forest and grassland can be detected, as grassland die-off is considerably faster than tree canopy senescence. Based on the generated dataset a time-series analysis including long term forest cover percentages as well as a trend analysis could be conducted.
The specific monsoon climate (Abdul-Wahab, 2003) yields additional fog water input under forest canopies in addition to rainfall (Hildebrandt and Eltahir, 2006; Bawain, 2012; Friesen et al., 2018). This interaction between forest and clouds has been extensively studied for tropical montane cloud forests (Hildebrandt and Eltahir, 2006; Holwerda et al., 2006; Bruijnzeel et al., 2011) and concise overviews on the underlying processes are provided by several studies (Bruijnzeel et al., 2011; Giambelluca and Gerold, 2011). In general, in cloud forests, trees act as fog catchers that intercept cloud water in addition to rainfall. The water arriving below the canopy is known as net precipitation and is composed of throughfall, water dripping off the canopy, and stemflow, water flowing down the tree branches and trunk. For the Dhofar cloud forest studies have shown consistent relationships between rainfall, net precipitation, stemflow, and throughfall (Hildebrandt et al., 2007; Bawain, 2012). The dense fog in combination with the cloud forest results in fog harvesting by trees that generates more than twice the amount of water collected below the canopy in comparison to rainfall. This additional water is of great importance to the Salalah coastal plain to the South of the Dhofar mountains. In combination with a multi-annual gridded rainfall dataset (Friesen et al., 2018) the effect of changing forest cover on available water resources was estimated for the Dhofar cloud forest.
The results of this study show that, using regional aggregation, long and consistent satellite-based land cover analyses are possible. For the study region we show, that, although land cover threats are eminent through the development of touristic infrastructure and livestock pressure, forest cover is stable and even slightly increasing in some parts of the Dhofar mountains. For water resources we further quantified the effect of forest cover dynamics on available water resources. The additional water, collected through trees, is only available under forest cover. Partially, this additional water is, of course, used by plant transpiration, however, the stemflow portion which is exceptionally high in this region (about 30% of net precipitation, Hildebrandt et al., 2007; Levia and Germer, 2015) infiltrates directly into deeper soil layers and eventually leads to groundwater recharge. The importance of stemflow is further supported by recent work regarding the specific influence area of stemflow, which is limited to a small area around the stem and therefore results in high infiltration rates (Carlyle-Moses et al., 2018; van Stan and Gordon, 2018).
The main objectives of this paper focus on (i) the trend analysis of a 30-year forest cover time-series throughout the Dhofar mountains, and (ii) the estimation of water input dependent on forest cover.
Materials and Methods
Study Region
The Dhofar mountain range is located in Southern Oman, extending into Yemen. The mountain range separates the desert region to the North, Nejd, from the Salalah coastal plain to the South (Figure 1). The mountain range is the recharge zone for the upper groundwater aquifers in the coastal plain, that provide Salalah, Oman’s second largest city, with water for agriculture, industry, and municipal water use. The precipitation can be divided into two main types, the monsoon season, called Khareef, and irregular cyclone events. The monsoon season occurs from mid-June to mid-September and is characterized by low intensity rainfall and drizzle as well as by dense fog with visibilities down to 5 m. During the monsoon season an inversion layer develops that results in dense fog engulfing the southward slopes of the mountains and that extends into the coastal plain (Abdul-Wahab, 2003; Hildebrandt and Eltahir, 2006). In contrast, cyclonic events occur infrequently every 2–6 years (Friesen et al., 2018) that result in torrential rainstorms with up to 400 mm in a couple of days (Kwarteng et al., 2009). Similar to the clear precipitation seasonality, the vegetation changes from a desert-like dry stage prior to the monsoon season (Figure 1b) to a lush forest and grassland vegetation (Figure 1c) during and about 2–3 months after the monsoon season.
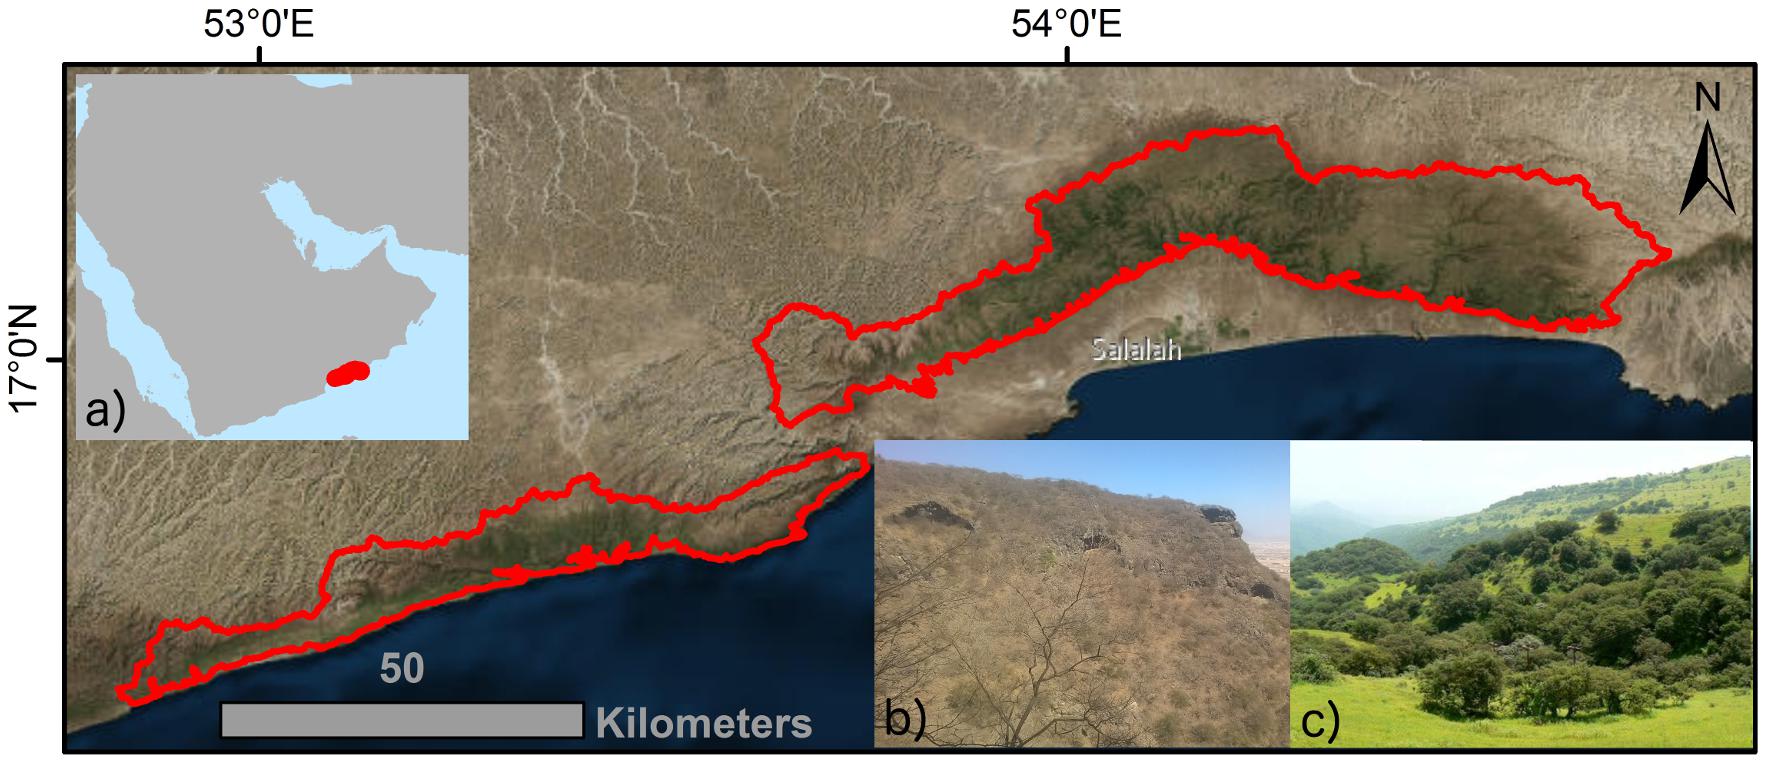
Figure 1. Study region. The red outline depicts the extent of the Dhofar mountain study region, inset (a) shows its location on the Arabian Peninsula, inset (b) depicts a dry season, and inset (c) depicts post-monsoon vegetation.
Data
For the analysis high-resolution Google Earth satellite images (DigitalGlobe) were used for the identification of ground control points in the Dhofar cloud forest. The time-series analysis was conducted using satellite data from Landsat 5, 7, and 8 with a spatial resolution of 30 m. In total, 102 satellite images were processed. The Landsat data were obtained from the Google Earth Engine data repository (using products LANDSAT/LT05/C01/T1_SR, LANDSAT/LE07/C01/T1_SR, and LANDSAT/LC08/C01/T1_SR). Specifically, the Landsat surface reflectance products included atmospheric correction using LEDAPS, and cloud masking using CFMASK (“USGS Landsat 5 Surface Reflectance Tier 1,” n.d.). The data availability for the different years and periods is shown in Figure 2.
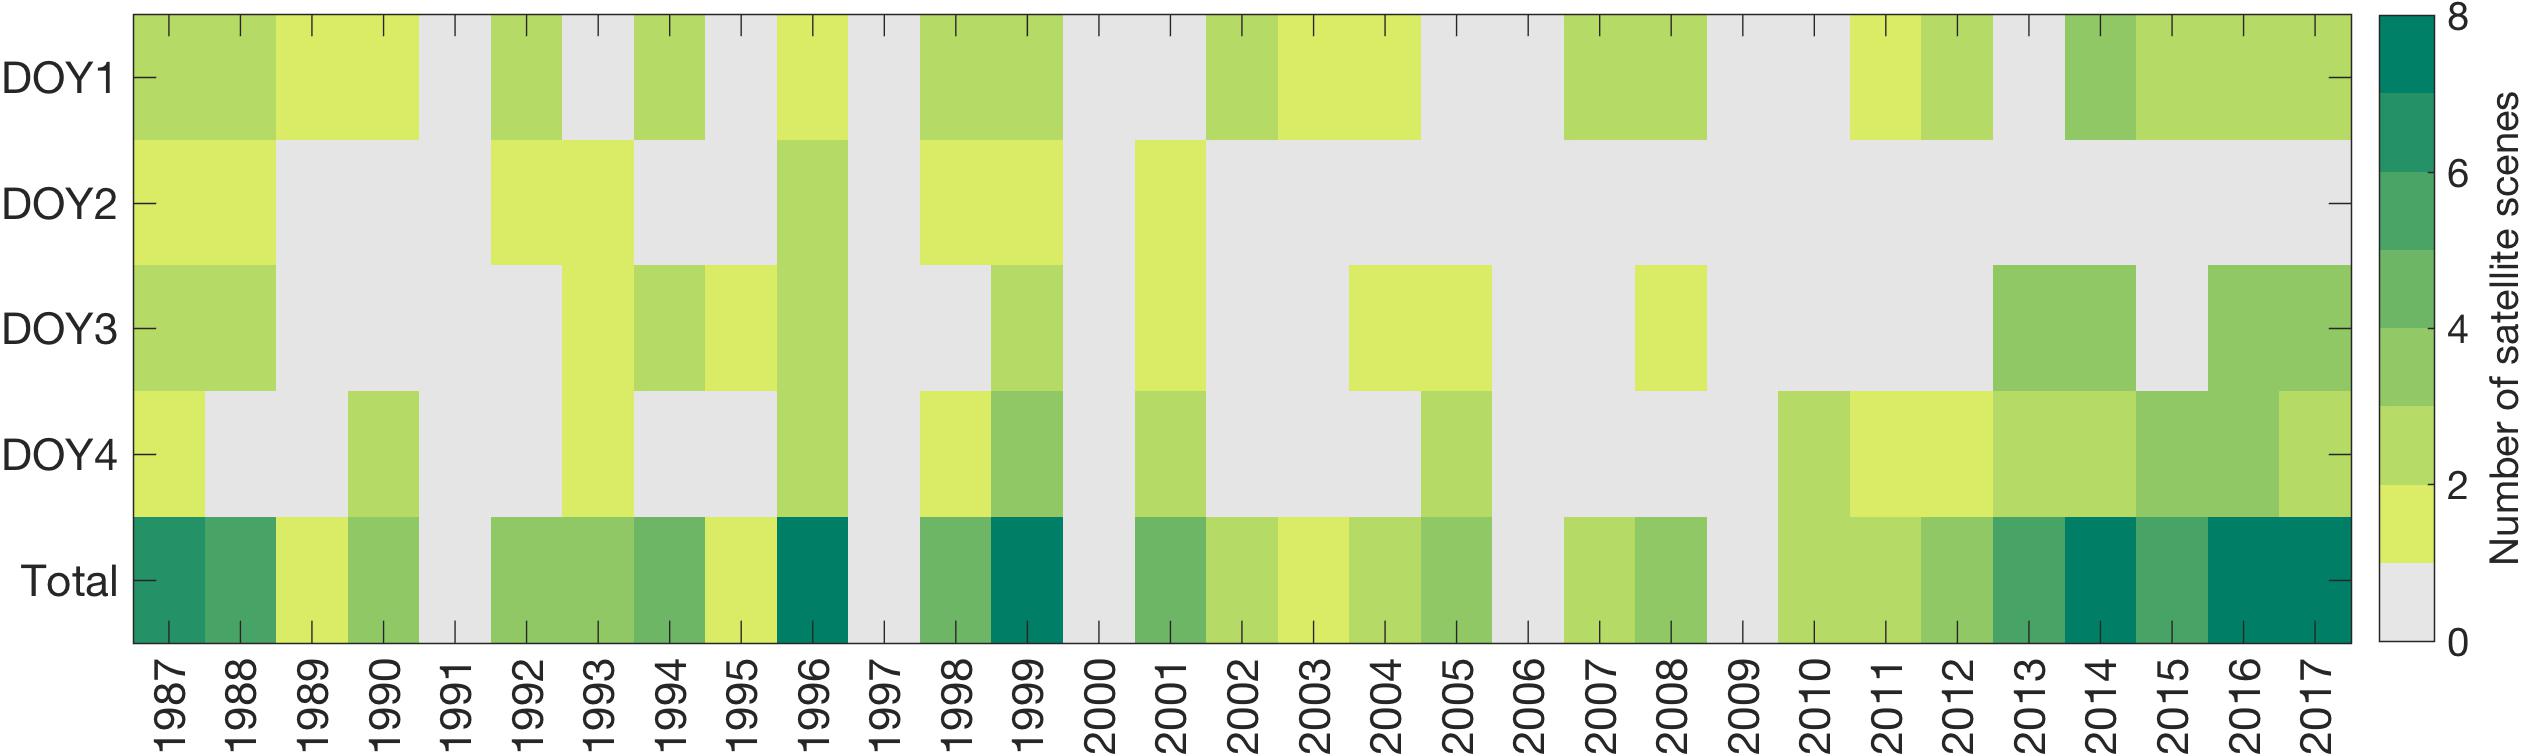
Figure 2. Landsat 5, 7, and 8 data availability for the Dhofar mountain range from 1987 to 2017 for the selected NDVI threshold periods DOY1–DOY4 (cf “Forest classification”).
Digital elevation data to delineate watershed boundaries were taken from the SRTM dataset (SRTM, 2018). Gridded rainfall data with a 1 ×1 km resolution, based on interpolated station data were taken from Friesen et al. (2018).
Forest Classification
Common forest cover mapping approaches, such as supervised and unsupervised classifications, mainly use spectral (Hansen et al., 2003) and temporal (Jia et al., 2014) signatures to distinguish forest from non-forest land cover types. Here, particular characteristics of the observation region allowed for the application of a simplified approach using an index threshold. The Dhofar mountains have a well-defined monsoon period during which trees and grasses grow abundantly. The monsoon period ranges, on average, from DOY 174 to 256 (Friesen et al., 2018). Following the monsoon period senescence starts, however, grassland has a much faster die-off than the forest canopy senescence, which is clearly detectable in NDVI values. Toward the end of the year both tree canopy and grassland NDVI values converge again. To determine the most suitable NDVI threshold, post-monsoon NDVI values of selected cloud forest and grassland pixels were compared and two periods with high differences between forest and grassland could be identified. For the threshold determination 99 forest and 91 grassland reference pixels were selected using Google Earth. Google Earth Engine was then used to extract all available Landsat 5, 7, and 8 data (1987–2017) for the selected reference pixels from DOY 270 to DOY 366. For the reference pixels only cloud free pixels were used.
Different threshold periods were taken to maximize the amount of available satellite data. Four DOY periods with the highest difference between forest and grassland were determined using 75% of the reference pixels. To determine the threshold periods first a 10-day centered moving average, based on the average of the 10th percentile of forest NDVI and the 90th percentile of grassland NDVI. Using the moving average periods with a minimum length of 3 days where selected for which the centered moving average lies between the 10th percentile of forest NDVI and the 90th percentile of grassland NDVI. For each of the four DOY periods the NDVI threshold was calculated according to Equation (1).
Where NDVIp10,forest are the 10th percentile NDVI values for forested ground control points per DOY for the selected threshold period, NDVIp90,grassland are the 90th percentile NDVI values for grassland ground control points per DOY for the selected threshold period.
Following the determination of threshold periods and values, annual forest cover maps of the Dhofar mountains were generated using the Google Earth Engine. All Landsat 5, 7, and 8 scenes available during the threshold periods were used. Clouds, shadows, and snow (based on CFMASK values, cf. 2.1. Data) were defined as missing values. Landsat 7 scenes are striped due to a sensor failure; stripes were also defined as missing values. In case of multiple and overlapping Landsat scenes during 1 year the NDVI maxima were taken.
For validation 25 percent of the reference pixels were taken. The reference pixels were determined using Google Earth, which means that not all reference pixels have the same image acquisition time. For the classification accuracy (Equation 2) calculation therefore the average of the recent years (2014–2017) were taken.
Where n is the number of correctly classified validation pixels and N is the number is the number of validation pixels.
For validation 25 percent of the reference pixels were taken. The reference pixels were determined using Google Earth, which means that not all reference pixels have the same image acquisition time. For the classification accuracy (Equation 2) calculation therefore the average of the recent years (2014–2017) were taken.
Region of Interest (ROI) Aggregation
Landsat data for the Dhofar mountains were not continuously available throughout the post-monsoon period and throughout the region. Reasons for this were satellite overpass availability during the NDVI threshold periods as well as missing values (cf. “Forest Classification”). To overcome this and utilize all available data for a consistent time-series analysis, the forest cover data were aggregated for regions of interest (ROI). The basis for the ROI delineation were catchments that were calculated from digital elevation data covering the whole mountain range from crest to foothills. Due to the small size of many catchments, smaller catchments were joint to larger units, resulting in a total of 14 ROIs. All catchments were cut off at the foothills at 150 m a.m.s.l. to avoid confusion with irrigated agriculture in the coastal plain. As they are not fully corresponding to individual catchment boundaries following the modifications, the areas are called ROIs in the following (Figure 3). For each ROI the percentage of forest cover using the ROI area excluding missing pixels was calculated. This aggregation allows for a consistent time-series analysis for all ROIs. ROIs 1 and 5 (not shown in Figure 3) correspond to the western (ROIs 2–4) and eastern (ROIs 6–14) mountain ranges, respectively.
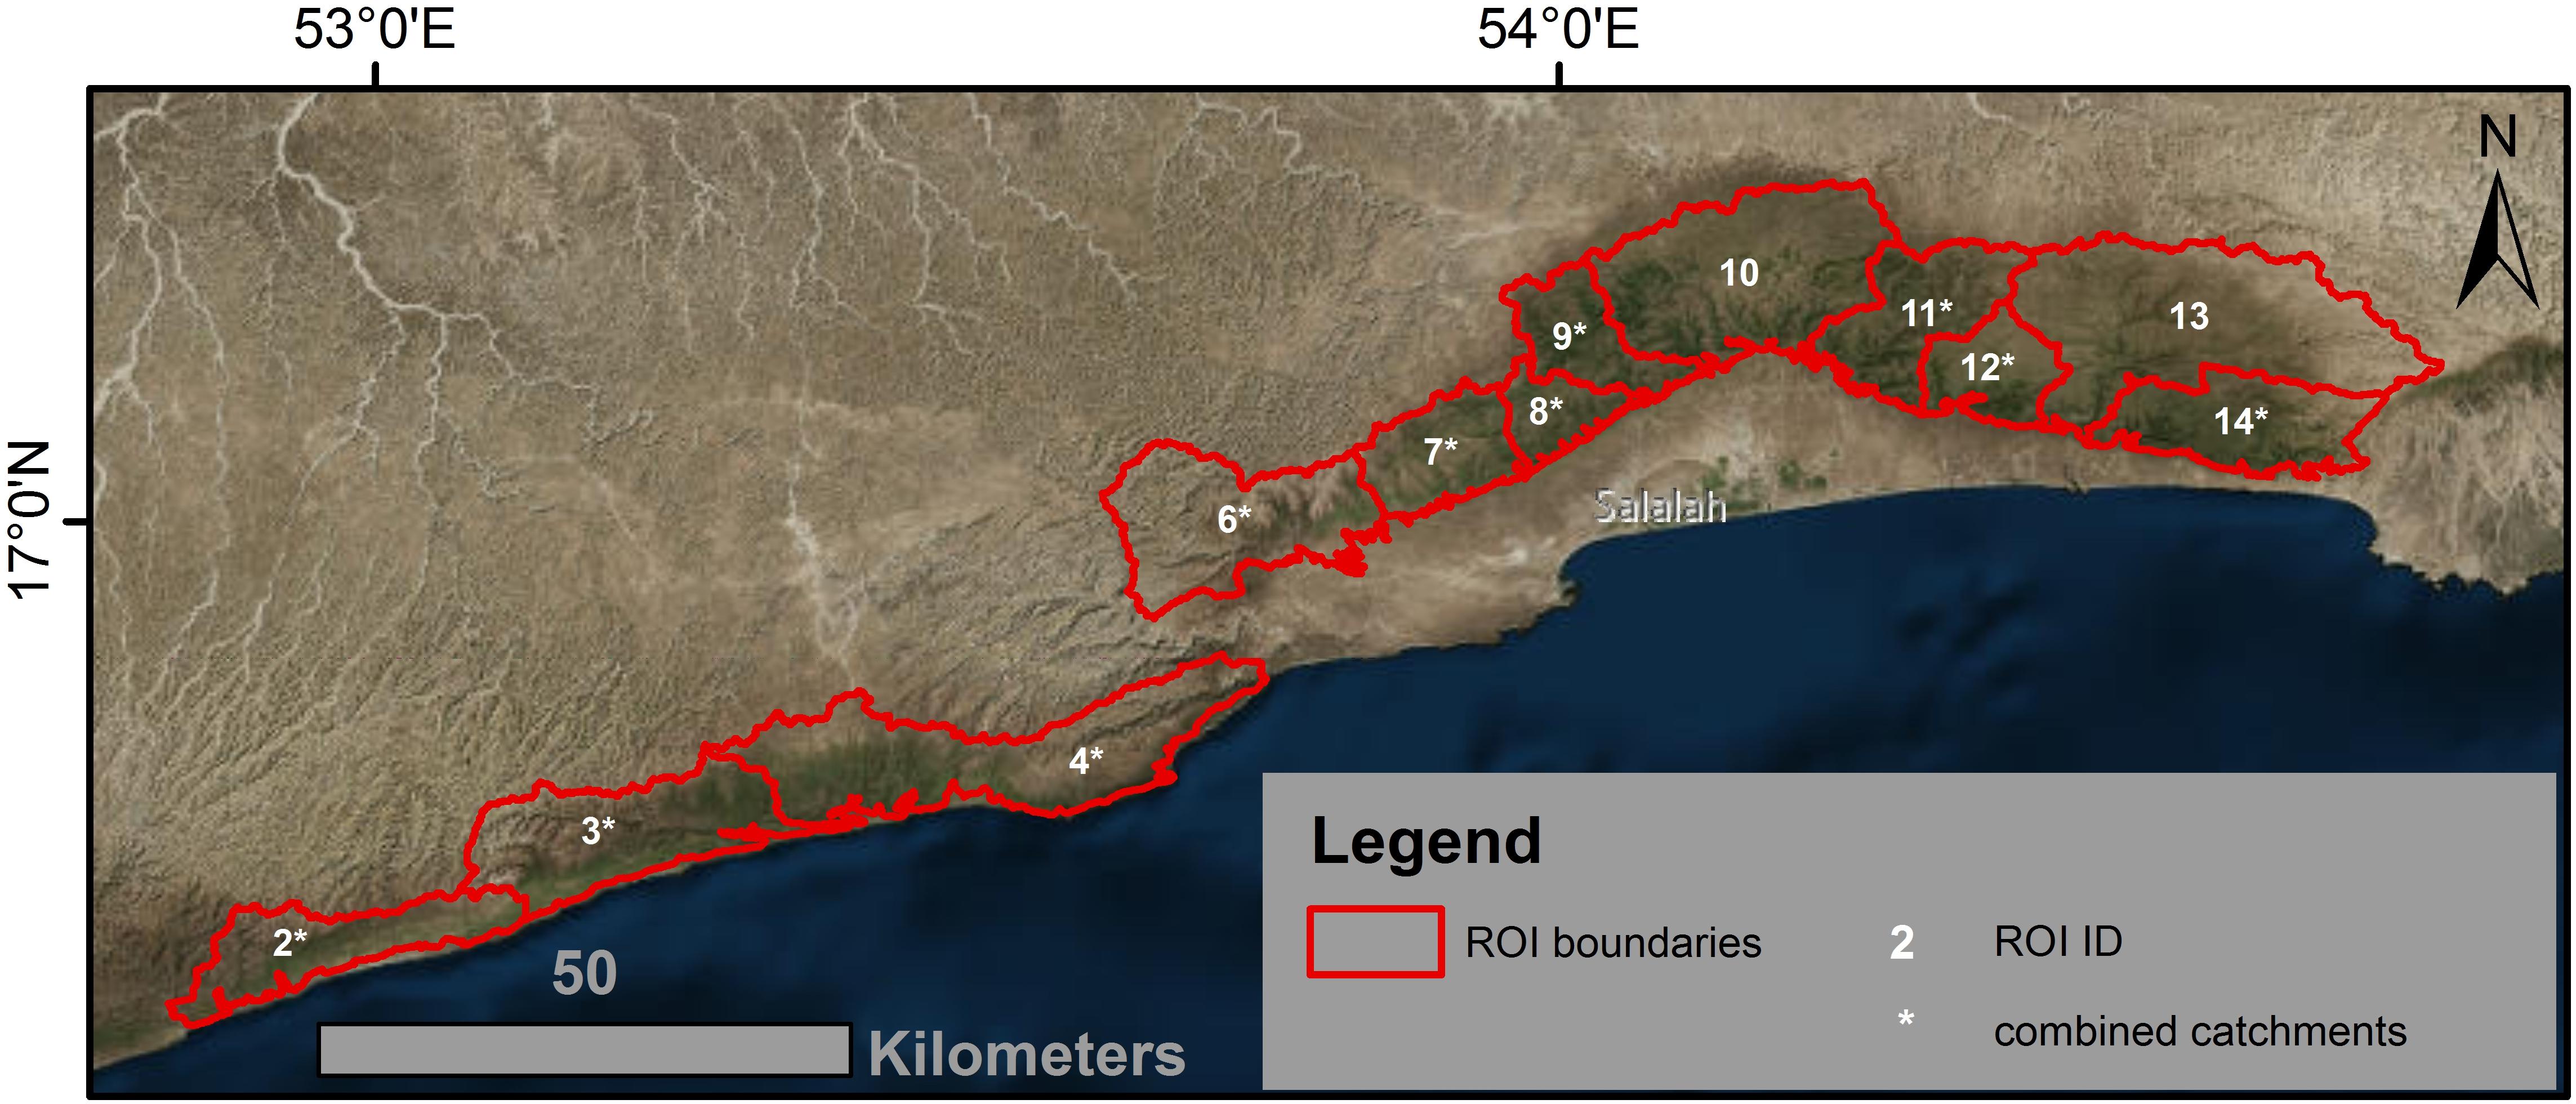
Figure 3. ROI boundaries for the Dhofar cloud forest. The numbers depict the ROI ID and numbers marked with an asterisk depict ROIs based on several small catchment boundaries.
Statistical Analysis
Following the ROI aggregation statistical metrics, such as averaged forest cover and standard deviation were calculated for each ROI. An outlier analysis was done in 5-year steps using the extreme studentized deviate test. Trends were calculated based on the Mann-Kendall test and the slope was calculated based on Sen’s slope.
Net Precipitation Calculation
The Dhofar cloud forest has the ability to harvest fog water in addition to rainfall. Fog harvesting for the Dhofar cloud forest has been shown in previous studies to have a substantial effect on net precipitation (Hildebrandt et al., 2007; Friesen et al., 2018). The predominant tree species Anogeissus dhofarica was estimated to produce a net precipitation 2.5 times higher than rainfall (Friesen et al., 2018).
To calculate annual net precipitation for each ROI, annual rainfall was extracted from the gridded rainfall dataset (1992–2014) using Equation (3).
Where Ppixel is rainfall, converted from mm year–1 to m3, within one pixel of the gridded rainfall dataset, and w is the weighting of the pixel within the ROI as several pixels were located on the ROI boundary.
Using forest cover percentage per ROI and year was taken to calculate net precipitation per ROI and year. After adding rainfall (non-forested ROI percentage) and net precipitation, the proportion of net precipitation to rainfall was calculated for each ROI and year. This percentage then allowed to estimate the fraction of precipitation due to forest cover (Equations 4 and 5).
Where c is the forest cover per ROI in percent.
The effect of changing forest cover on water availability (fraction of net precipitation) was calculated annually for ROIs that corresponded with the gridded rainfall dataset, namely ROIs 7–14, for all years where both rainfall data and forest cover data were available. A detailed overview of the methodology and the ecohydrology regarding the incorporation of cloud water interception can be found in Friesen et al. (2018).
Results
Forest Cover Classification
Using reference pixels defined in Google Earth for forest and for grassland pixels, NDVI values from Landsat 5, 7, and 8 from 1987 to 2016 were extracted. Boxplots for the two land cover classes per DOY are shown in Figure 4. The highest differences between the two land cover classes could be detected from DOY 282 to 315 after which the two land cover classes gradually converge with NDVI.
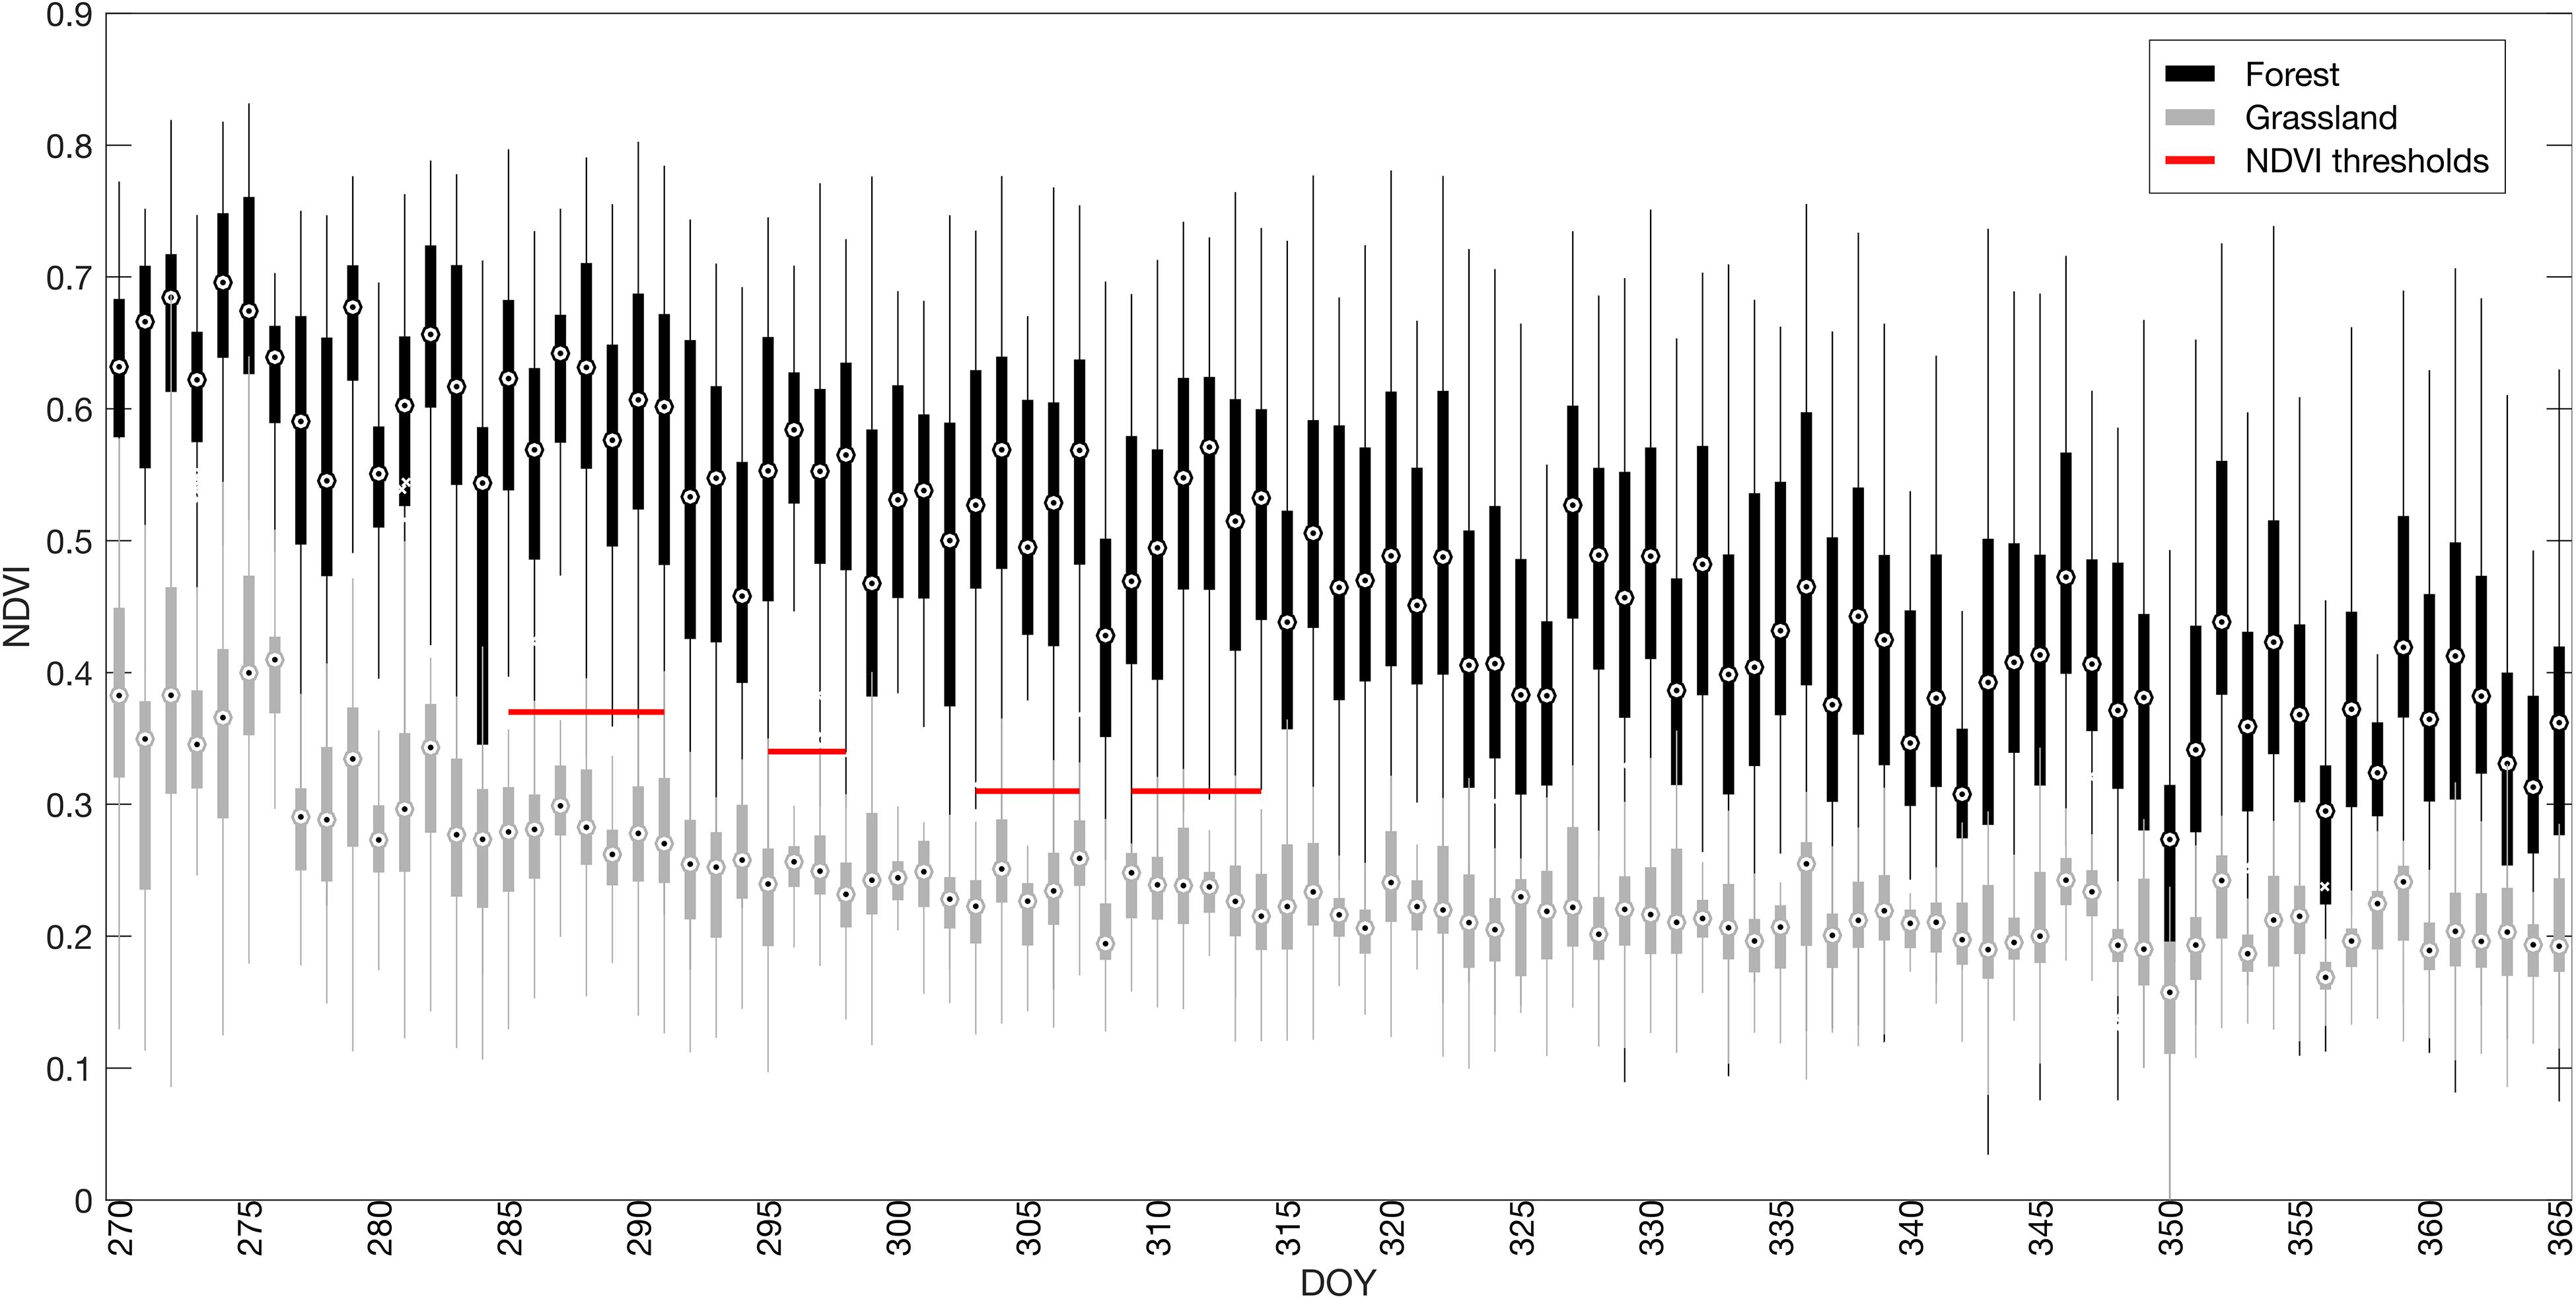
Figure 4. Boxplots of NDVI values for calibration pixels for forest (black) and grassland (gray). The boxplots are based on NDVI data from Landsat 5, 7, and 8 for years 1987–2017. The red lines depict the NDVI threshold values for four periods.
It can clearly be seen that grassland quickly drops to NDVI values below 0.3, whereas forest canopy is still active due to water availability in greater soil depths not accessible to grassland. After DOY 320, however, some forest reference pixels decline to NDVI values around 0.3 which makes it difficult to clearly distinguish between the two land cover types. Based on the reference pixel analysis results NDVI thresholds between forest and grassland were set that are shown in Table 1.
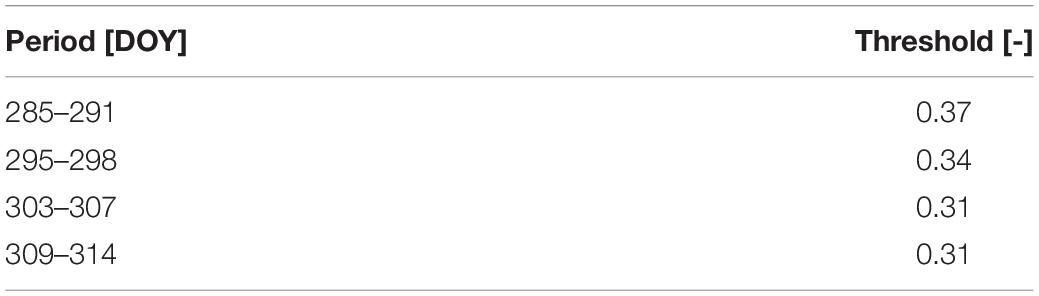
Table 1. NDVI thresholds for the four periods based on a reference pixel analysis of Landsat 5, 7, and 8.
The classification accuracy was derived using 25% of the ground control point data, not used in calibration. For forested ground control points the accuracy is 96% and for grassland ground control points the accuracy is 92%.
Forest Cover
Using the NDVI thresholds forest maps were made for each year. Figure 5 shows the maximum forest cover for the whole study period. Due to lack of overpass data and sensor failure full satellite data coverage was not available for all years. The maximum forest cover extent from 1987 to 2017 for the study area (cf. Figure 1, red outline) corresponds to 43% or about 1,000 km2.
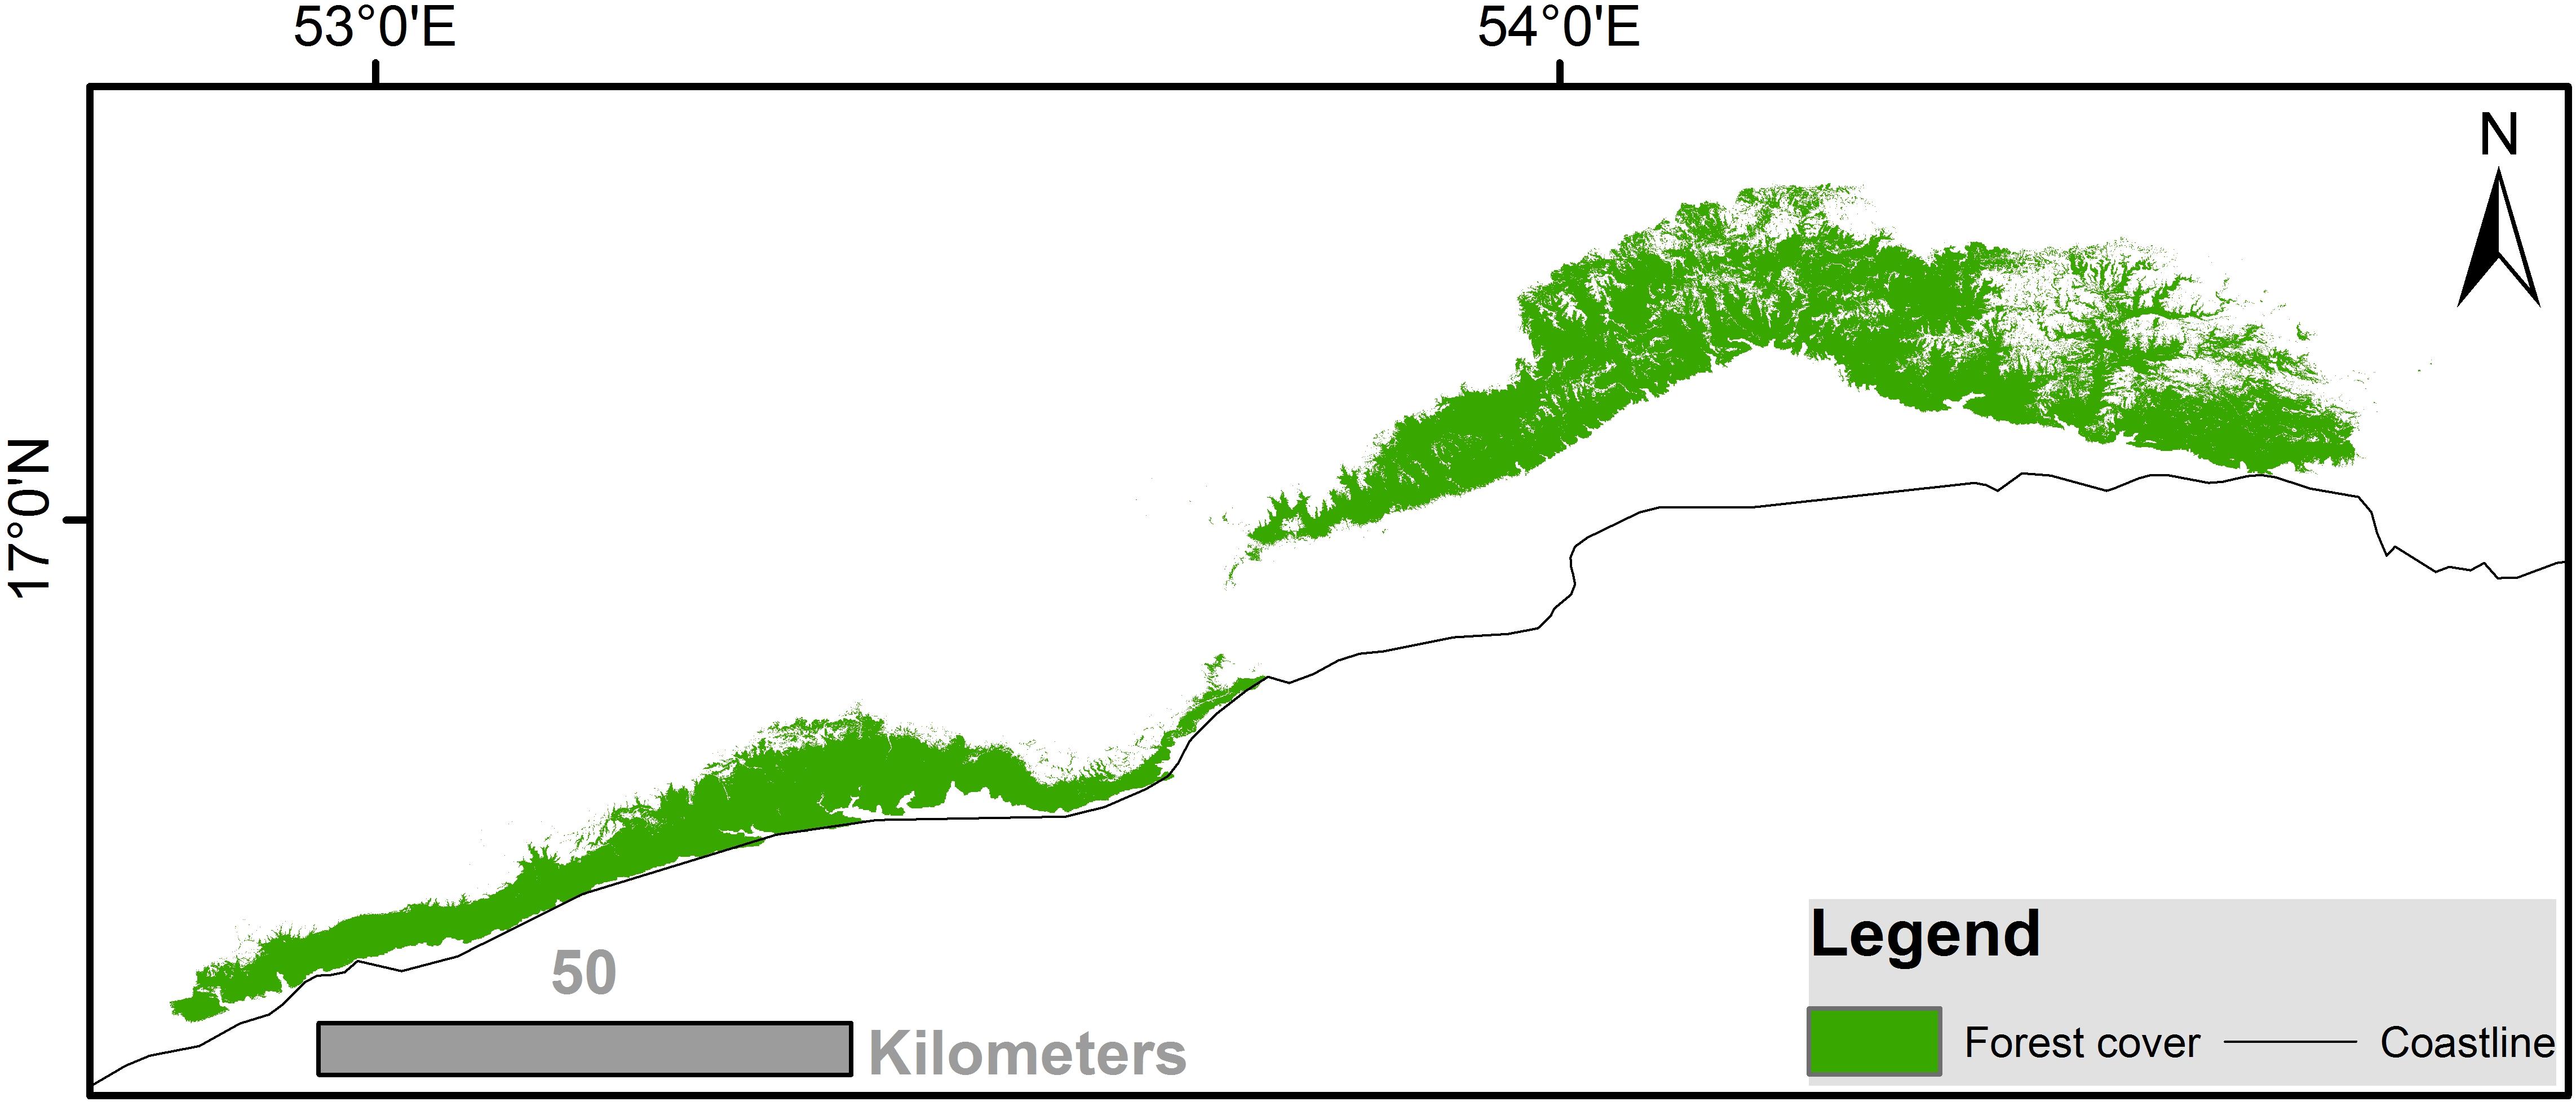
Figure 5. Maximum forest cover from 1987 to 2017 based on Landsat 5, 7, and 8 data.
The averaged 30-year forest cover per ROI ranges from 5 to 56% (see Figure 6). The large range of forest cover per ROI is partially caused by choosing ROIs on the basis of catchments. ROIs 6 and 13, for example, are ROIs with relatively large unforested regions (cf. Figure 3).
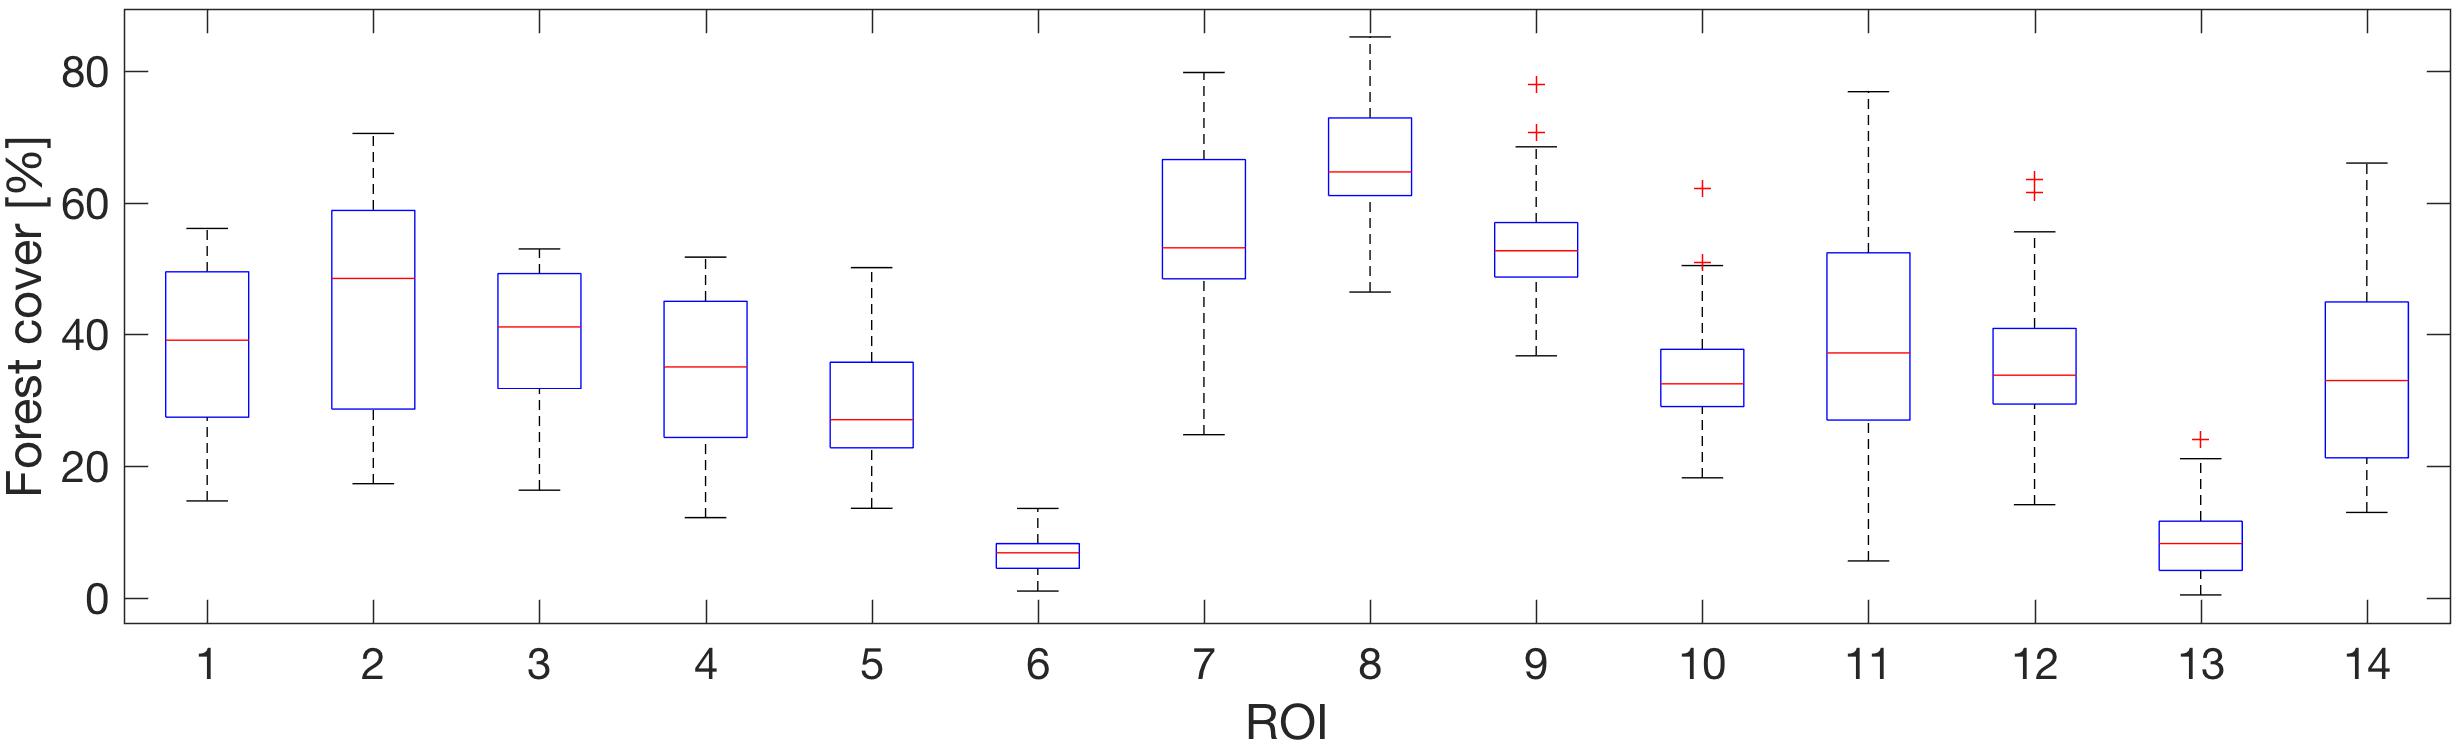
Figure 6. Boxplots of forest cover in all ROIs 1987–2017. ROIs 1 & 5 are the western and eastern forest regions (cf. Figure 1).
Trend Analysis
The results of the trend and slope analyses indicate that all ROIs show increasing forest cover during the 30-year study period (Figure 7). However, only two ROIs: 5 (complete eastern forest region, ROIs 6–14) and 10, show a significant trend (< 0.05) according to the Mann-Kendall test. The two ROIs have an average forest cover of about 30% but show a low variance in forest cover (cf. Figure 6). The two significantly increasing ROIs, 5 and 10, have slope values of 0.55 and 0.62, respectively. Supplementary Figure S1 showing forest cover time series for each ROIs and a Supplementary Table S1 of the Sen’s slope values and additional statistics is available as Supplementary Material.
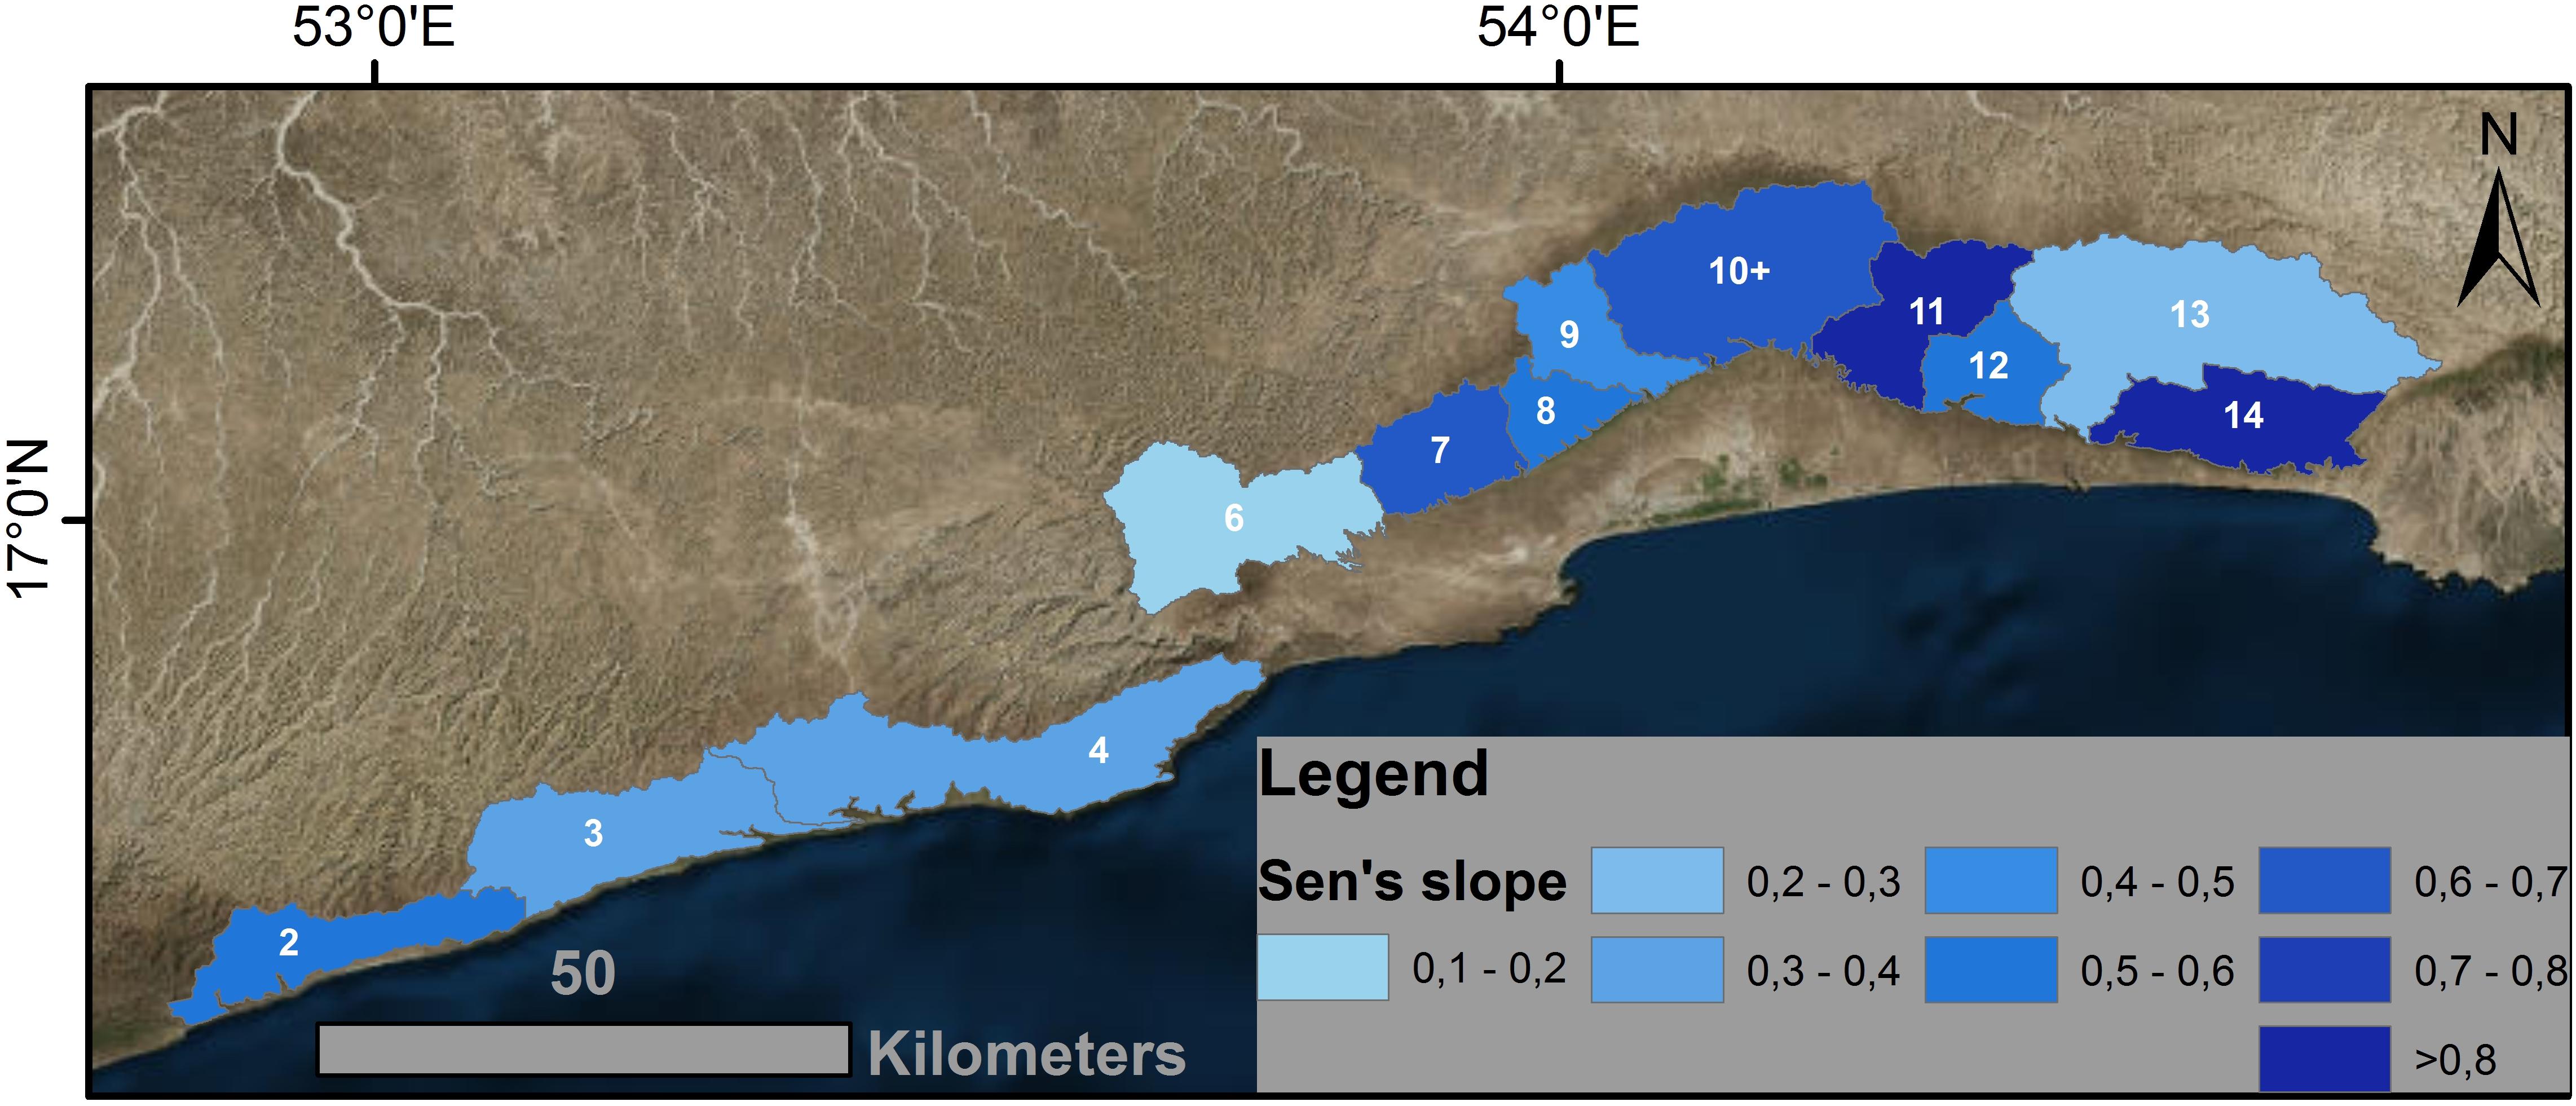
Figure 7. Trends of forest cover dynamics per ROI based on 30 years of Landsat NDVI data. The numbers depict the ROI ID; IDs marked with a plus show ROIs with a significant forest cover trend.
Impact on Water Resources
In the Dhofar cloud forest the trees have a very strong interaction with precipitation. The trees ability to harvest fog water adds substantial water arriving below the canopy, net precipitation. The effect of changing forest cover on available water resources is shown in Figure 8. In order to de-couple interannual rainfall variability, the boxplot shows the net precipitation proportion of rainfall, so the additional precipitation through fog harvesting that is directly linked to forest availability. Highest net precipitation fractions are, of course, associated to the ROIs with the highest forest cover, 7, 8, and 9 (cf. Figure 6).
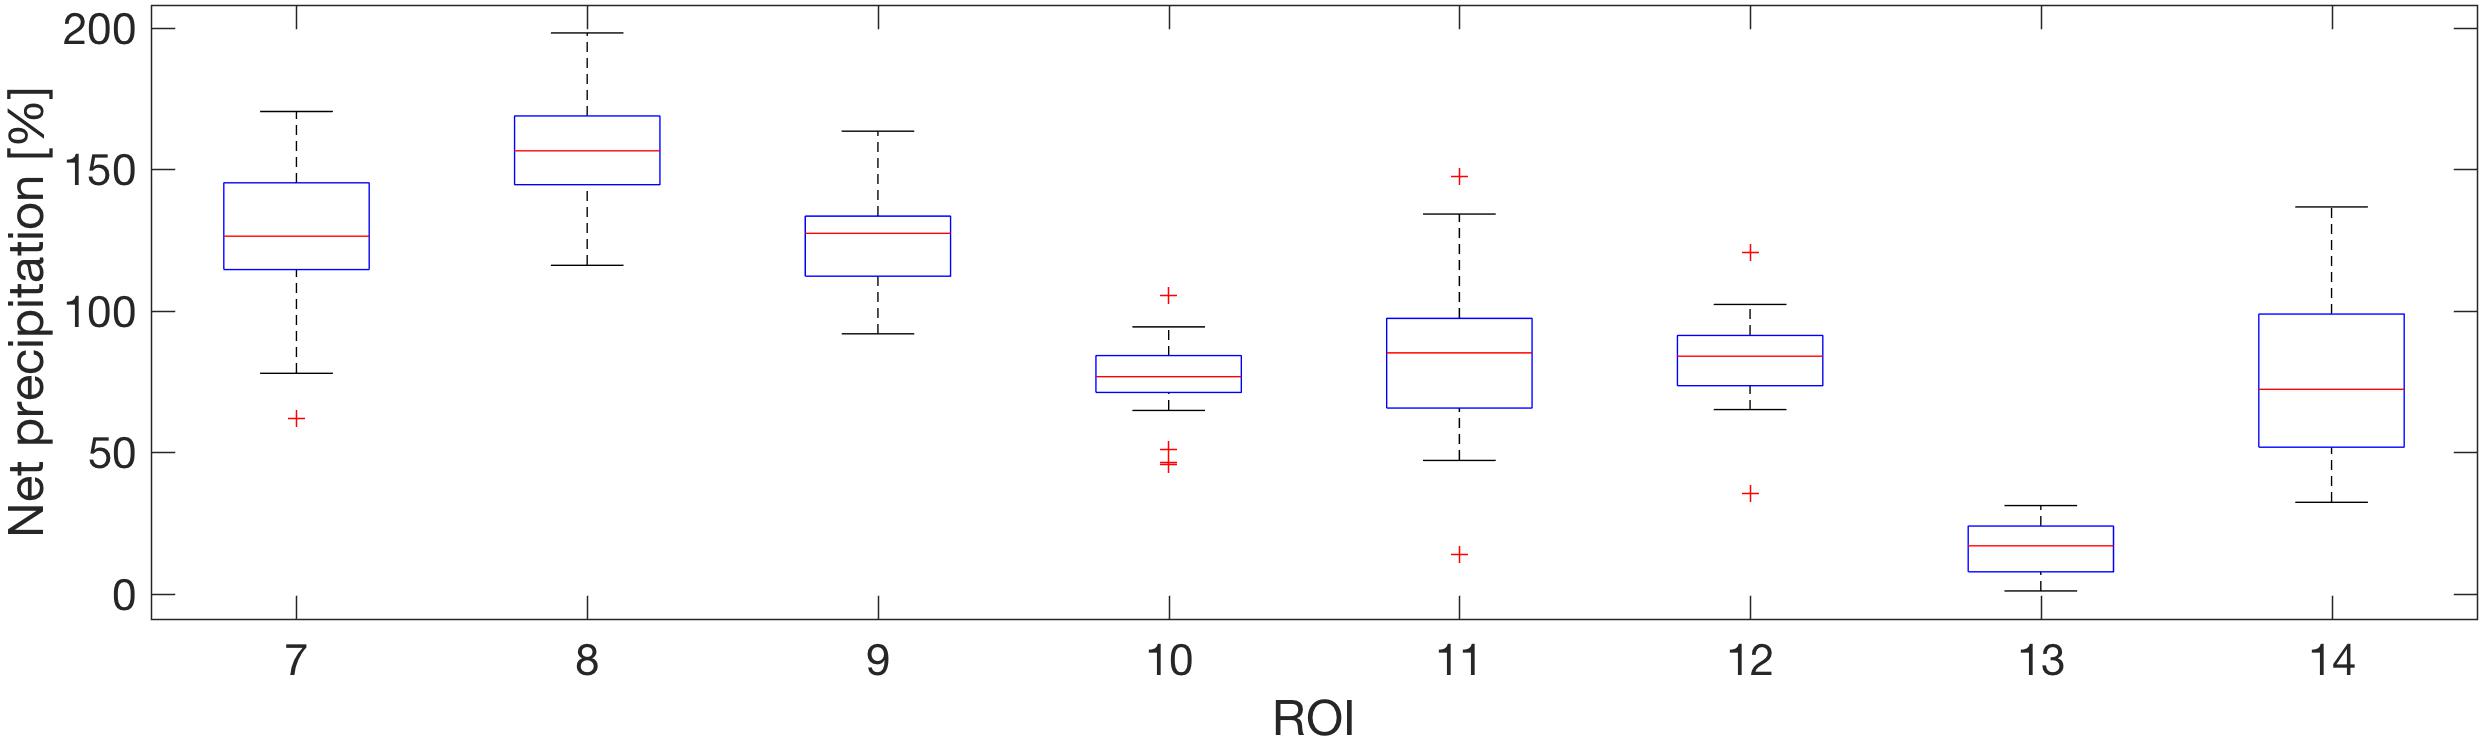
Figure 8. Boxplot of the proportion of net precipitation from rainfall in percent. The boxplots show the variability over time (1992–2014). Only ROIs (7–14) for which gridded rainfall was available are displayed.
Based on the precipitation scenario including cloud forest fog harvesting (PCF) high, medium, and low annual rainfall has been calculated. Figure 9 shows an overview of the results for ROIs 7–14. Next to the monsoon precipitation in m3 and mm, the long-term average forest cover is shown for each ROI.
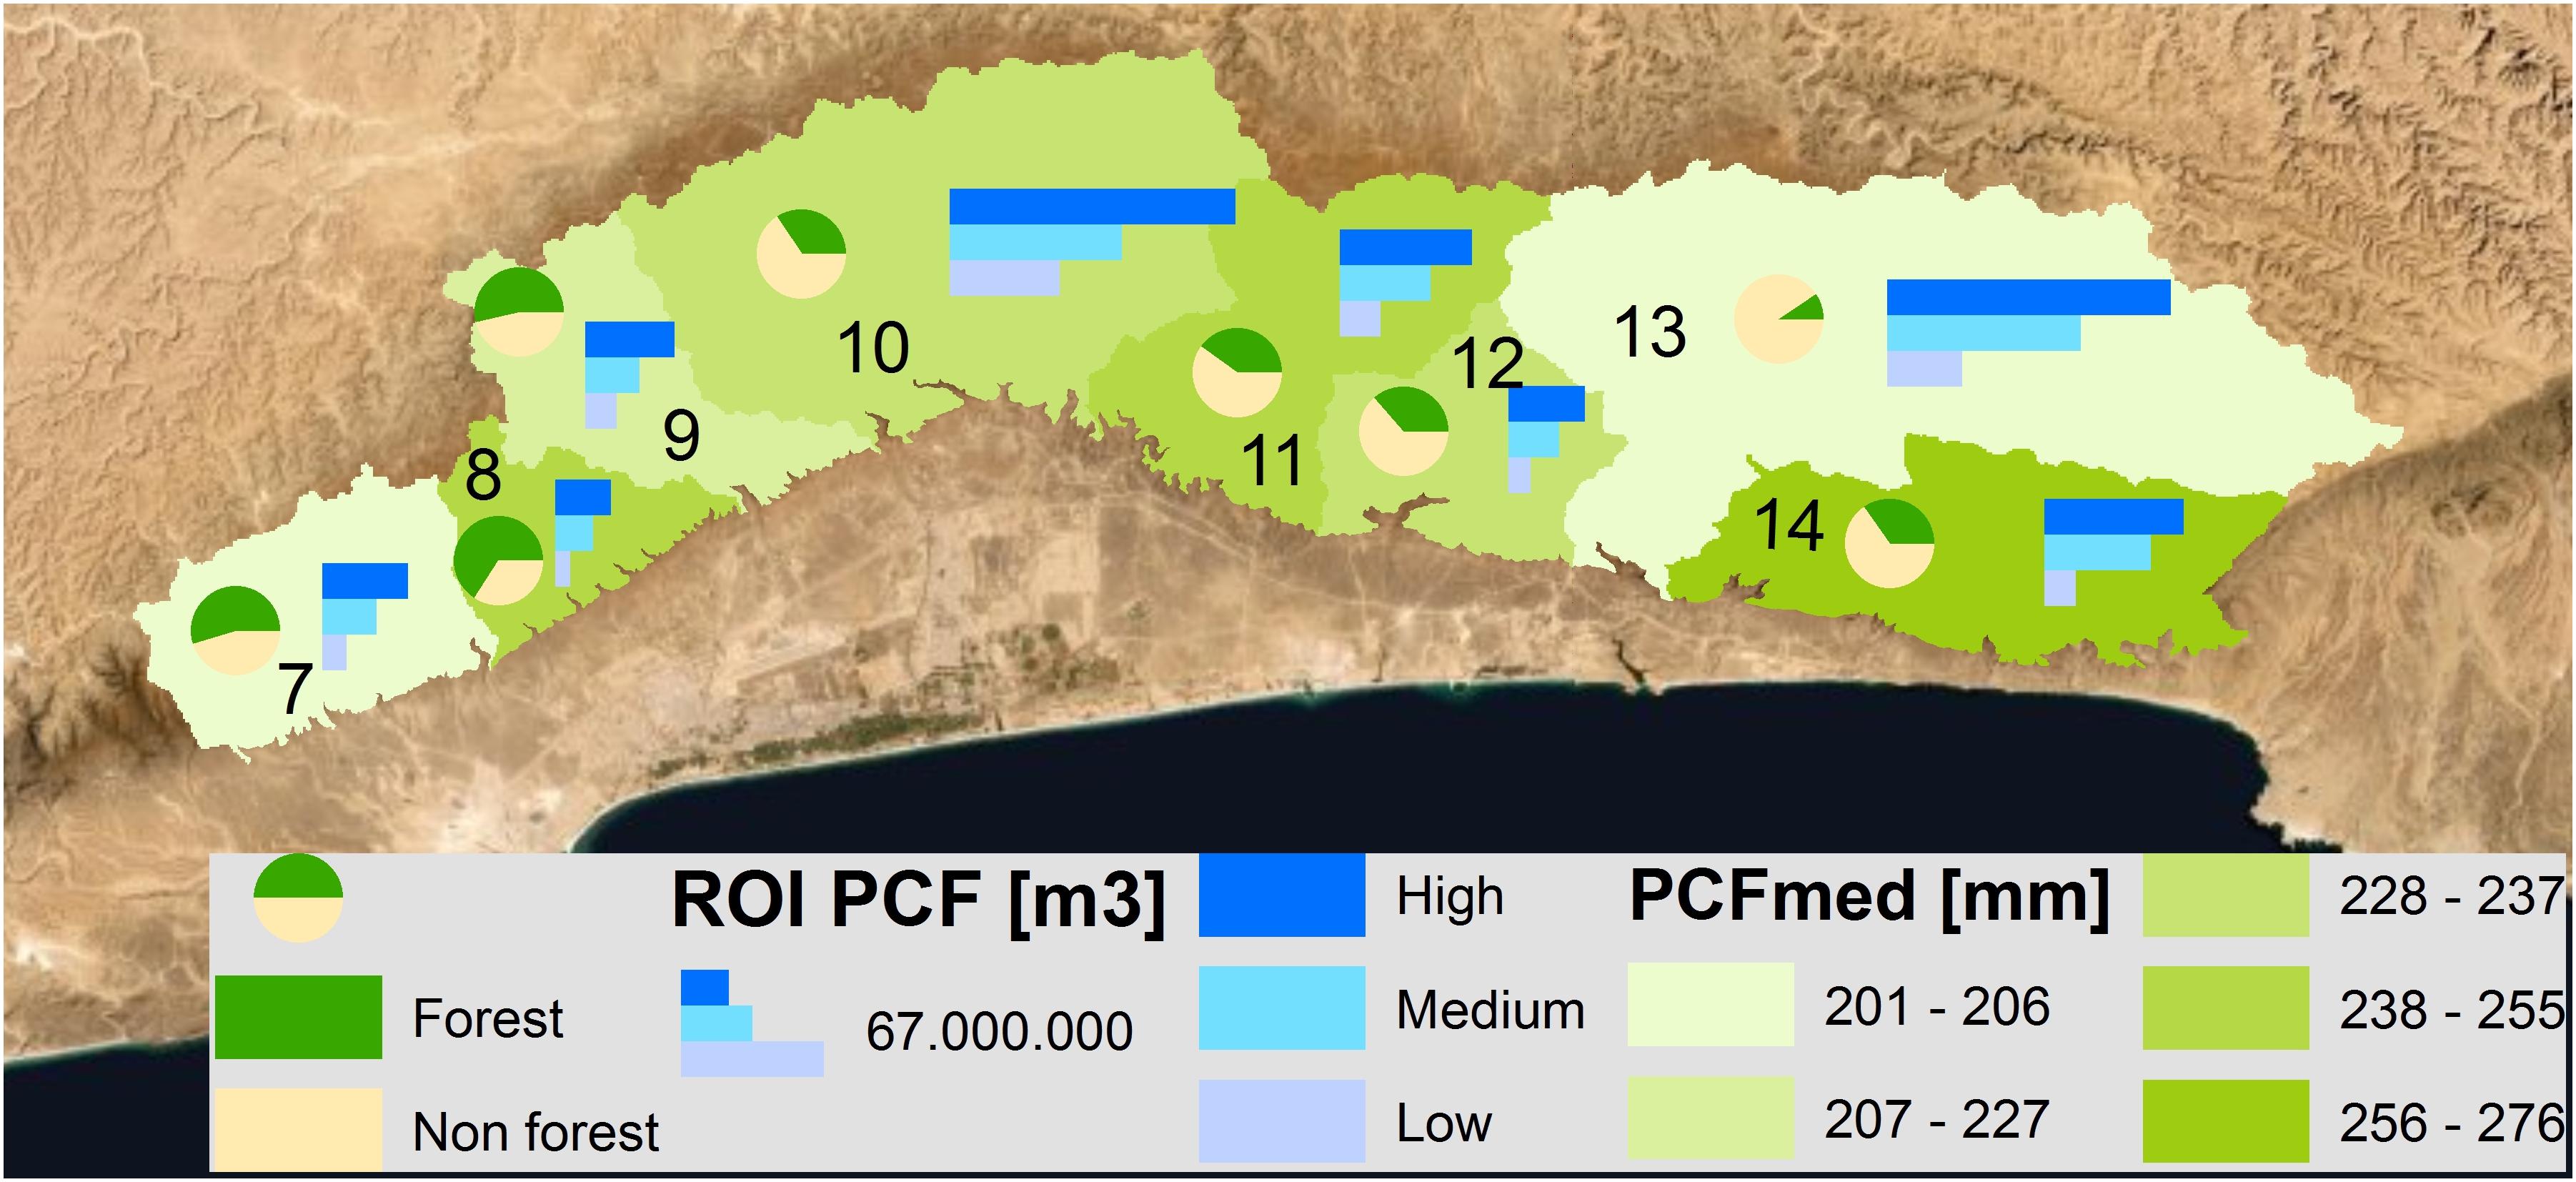
Figure 9. Precipitation scenario including cloud forest fog harvesting for representative years (low, medium, and high). The background color depicts annual monsoon precipitation (PCF) for a medium year in [mm] and the bar graphs show annual monsoon precipitation (PCF) in [m3] for low, medium and high monsoon years. The pie charts show forest and non-forest land cover per ROI. All data are based on the period from 1992 to 2017.
Discussion
The study provides a forest classification based on threshold values and the distinct regional seasonality of forest and grassland. The threshold values were determined from a 30-year time-series of reference pixels from forest and grassland. The threshold approach is widely applied (Hayes and Sader, 2001; Pravalie et al., 2014) and further allowed for a consistent time-series analysis. Landsat satellites provide a long data availability at high resolution (30 m), however, are not continuously available and at relatively low temporal resolution. Data gaps are associated with cloud cover, missing satellite scenes, and sensor failures (SLC-Off Products: Background, 2018). Yet, due to the high spatial resolution, Landsat satellites were still preferred to NOAA AVHRR at 1 km and MODIS at 250 m resolutions, although both provide much higher temporal resolutions. In order to cope with the data gaps several steps were taken. Based on reference pixels, four threshold periods during the post-monsoon period were chosen to use as many Landsat data as possible. Further, to deal with data gaps, the annual forest cover maps were then aggregated into ROIs based on modified watershed boundaries. This allowed for an almost continuous 30-year forest cover dataset per ROI as due to missing values, pixel-based analyses could not be realized.
For future studies, the Sentinel satellites pose a valuable addition, as Sentinel-2 combines a high spatial resolution, 10 m, with a high temporal resolution of at least 5 days (ESA, 2018). However, Sentinel-2 data are only available since 2016, and therefore cannot yet be utilized for multi annual time-series analyses. As an outlook we provided a comparison of Landsat 7 to Sentinel-2a and to the Global Forest Change data (Hansen et al., 2013; Global Forest Change, 2018; Figure 10). The Global Forest Change data is a widely applied dataset that shows considerably less forest cover. Reasons for this are probably the strong seasonality that is not taken into account in the global dataset as well as the low tree height, as Hansen et al. (“Global Forest Change” n.d.) only define vegetation above 5 m as trees.
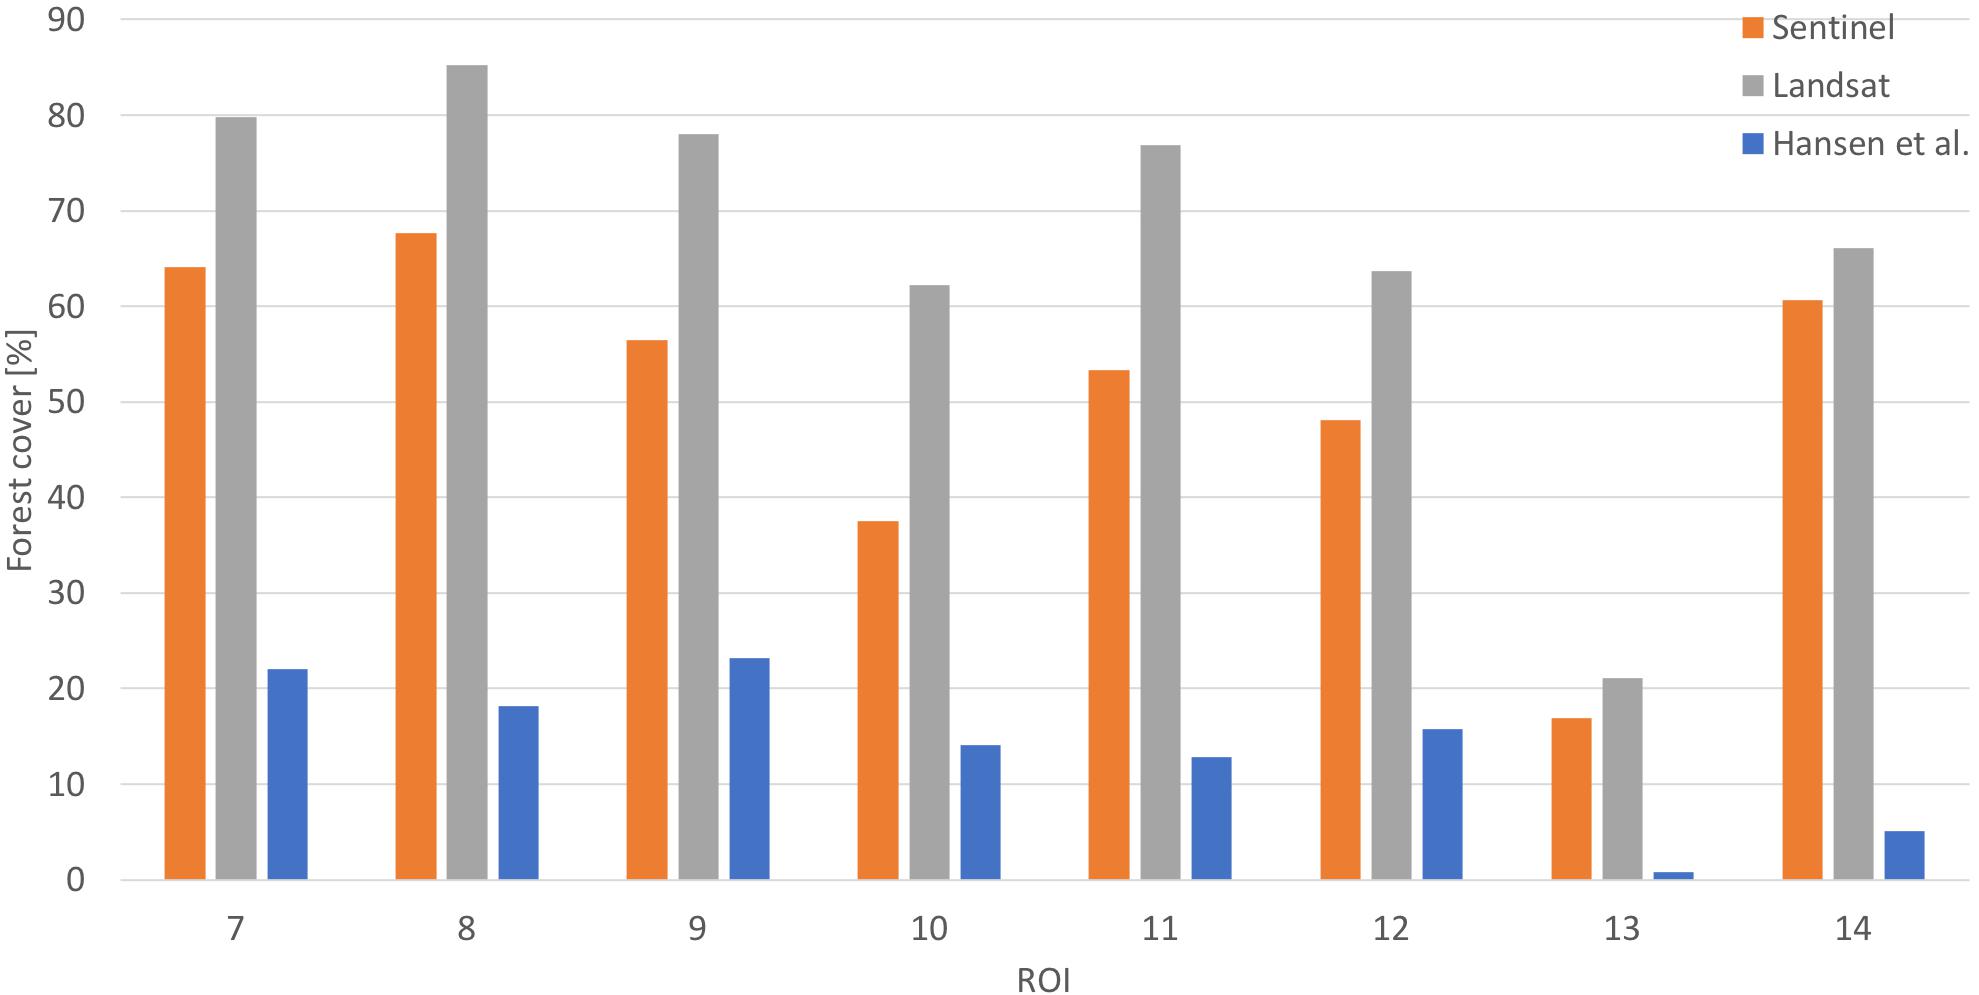
Figure 10. Comparison of forest cover for Sentinel-2a, Landsat 7, and Global Forest Change data [(“Global Forest Change” n.d.; Hansen et al., 2013) for 2016.
Using the generated forest cover dataset for ROI regions covering the whole Dhofar mountain range, a trend analysis was conducted. Results show that forest cover is, in general, stable and in some regions even significant forest cover increase could be detected. Galletti et al. (2016) provided a change analysis based on 2 years only and also reported single forest increase in some regions. However, in our study a much more robust trend analysis was conducted to the generated forest cover dataset. Reasons for the forest cover stability and slight increase are still unknown, as two of the major forest threats, increasing tourism and the connected infrastructure build-up, as well as increasing livestock numbers are reported (personal communication, Ministry of Regional Municipalities and Water Resources, Oman). Spatially explicit data for infrastructure build up and livestock numbers, however, were not available to us but may be considered as future research directions. In the Mediterranean, forest increase due to land abandonment has been extensively studied (Poyatos et al., 2003) which could cause this increase. Galletti et al. (2016) further provides an overview of national policy decisions that the study links to deforestation, however, these policy decisions are difficult to assess spatially, especially since the analysis does not show overall forest cover.
The Dhofar cloud forest also has a substantial effect on water resources. In addition to rainfall, the trees act as fog catchers and can thereby collect cloud water in addition to the rainfall. For the predominant tree species Anogeissus Dhofarica this results in net precipitation (water arriving below the canopy) that is about 250% of rainfall (Hildebrandt and Eltahir, 2006; Bawain, 2012; Friesen et al., 2018). This, in turn, shows that forest cover has a substantial effect on local water resources and combined with a gridded rainfall dataset, the effect of forest cover on water resources could be estimated. Hydrologically, a forest increase in the Dhofar mountains, therefore has a positive effect on water resources.
Conclusion
This study provides an unprecedented 30-year dataset of forest cover for the Dhofar mountains, aggregated to ROIs based on modified catchment boundaries. This aggregation approach made it possible to deal with missing values due to sensory failures, cloud cover, or missing satellite scenes, yet providing a dataset that can be used for spatio-temporal analyses.
A trend analysis, based on the different ROIs was applied that, in general, shows a slight increase in forest cover. As the interannual variability was relatively high, however, only two regions showed a significant trend on increasing forest cover. Despite the high variability, all regions show increasing forest cover. In conclusion it can therefore be said that forest cover during the past 30 years is at least stable and most probably slightly increasing.
To estimate the effect of forest cover change on water availability, reported cloud water interception estimates in combination with a multi-annual gridded rainfall dataset have been used. Results show that the proportion of net precipitation, which is related to the fog harvesting ability of trees, toward rainfall ranges from around 15 to 150% per ROI.
Data Availability Statement
The datasets generated for this study are available on request to the corresponding author.
Author Contributions
JF and RA contributed conception and design of the study, performed the statistical analysis, and wrote the first draft of the manuscript. RA, J-KH, and ML organized the database. J-KH and ML wrote individual sections of the manuscript. All authors contributed to manuscript revision, read and approved the submitted version.
Funding
The research leading to these results has received funding from the Institute for Advanced Technology Integration (IATI) under The Research Council (TRC) of the Sultanate of Oman. TRC Research Contract No. TRC/RCP/15/001. JF has also received support from the Belmont-Forum project “People, Pollution, and Pathogens” funded through DFG (DFG-SCHM 3059/6-1).
Conflict of Interest
The authors declare that the research was conducted in the absence of any commercial or financial relationships that could be construed as a potential conflict of interest.
Supplementary Material
The Supplementary Material for this article can be found online at: https://www.frontiersin.org/articles/10.3389/feart.2020.00299/full#supplementary-material
References
Abdul-Wahab, S. A. (2003). Analysis of thermal inversions in the khareef salalah region in the Sultanate of Oman. J. Geophys. Res. 108:4274. doi: 10.1029/2002JD003083
Bawain, A. (2012). Influence of Vegetation on Water Fluxes at the Ground Level in a Semi-Arid Cloud Forest in Oman. Doctoral Dissertation, Friedrich Schiller University Jena, Jena.
Bruijnzeel, L. A., Mulligan, M., and Scatena, F. N. (2011). Hydrometeorology of tropical montane cloud forests: emerging patterns. Hydrol. Process. 25, 465–498. doi: 10.1002/hyp.7974
Carlyle-Moses, D. E., Iida, S., Germer, S., Llorens, P., Michalzik, B., Nanko, K., et al. (2018). Expressing stemflow commensurate with its ecohydrological importance. Adv. Water Resour. 121, 472–479. doi: 10.1016/j.advwatres.2018.08.015
ESA (2018). ESA – Sentinel 2. Available online at: https://www.esa.int/Our_Activities/Observing_the_Earth/Copernicus/Sentinel-2 (accessed March 23, 2018).
Foley, J. A., DeFries, R., Asner, G. P., Barford, C., Bonan, G., Carpenter, S. R., et al. (2005). Global consequences of land use. Science 309, 570–574. doi: 10.1126/science.1111772
Friesen, J., Zink, M., Bawain, A., and Müller, T. (2018). Hydrometeorology of the Dhofar cloud forest and its implications for groundwater recharge. J. Hydrol. 16, 54–66. doi: 10.1016/j.ejrh.2018.03.002
Füssel, H.-M., Jol, A., and Marx, A (eds.) Marx (2017). Climate Change, Impacts and Vulnerability in Europe 2016 – An Indicator-Based Report. Copenhagen: European Environment Agency.
Galletti, C. S., Turner, B. L., and Myint, S. W. (2016). Land changes and their drivers in the cloud forest and coastal zone of Dhofar, Oman, between 1988 and 2013. Reg. Environ. Change 16, 2141–2153. doi: 10.1007/s10113-016-0942-2
Giambelluca, T. W., and Gerold, G. (2011). “Hydrology and biogeochemistry of tropical montane cloud forests,” in Hydrology and Biogeochemistry of Forest Ecosystems, eds D. F. Levia, D. E. Carlyle-Moses, and T. Tanaka (New York: Springer Verlag).
Global Forest Change (2018). http://earthenginepartners.appspot.com/science-2013-global-forest (accessed March 23, 2018).
Hall, M., Al-Khulaidi, A. W., Miller, A. G., Scholte, P., and Al-Qadasi, A. H. (2008). Arabia’s last forests under threat: plant biodiversity and conservation in the valley forest of Jabal Bura (Yemen). Edinb. J. Bot. 65, 113–135. doi: 10.1017/S0960428608004976
Hansen, M. C., DeFries, R. S., Townshend, J. R. G., Carroll, M., Dimiceli, C., and Sohlberg, R. A. (2003). Global percent tree cover at a spatial resolution of 500 meters: first results of the MODIS vegetation continuous fields algorithm. Earth Interact. 7, 1–15. doi: 10.1175/1087-35622003007<0001:GPTCAA<2.0.CO;2
Hansen, M. C., Potapov, P. V., Moore, R., Hancher, M., Turubanova, S. A., Tyukavina, A., et al. (2013). High-resolution global maps of 21st-century forest cover change. Science 342, 850–853. doi: 10.1126/science.1244693
Hayes, D. J., and Sader, S. A. (2001). Comparison of change-detection techniques for monitoring tropical forest clearing and vegetation regrowth in a time series. Photogram. Eng. Rem. Sens. 67, 1067–1075.
Hildebrandt, A., Al Aufi, M., Amerjeed, M., Shammas, M., and Eltahir, E. A. B. (2007). Ecohydrology of a seasonal cloud forest in Dhofar: 1. field experiment. Water Resour. Res. 43, 1–13. doi: 10.1029/2006WR005261
Hildebrandt, A., and Eltahir, E. A. B. (2006). Forest on the edge: seasonal cloud forest in oman creates its own ecological niche. Geophys. Res. Lett. 33, 2–5. doi: 10.1029/2006GL026022
Holwerda, F., Burkard, R., Eugster, W., Scatena, F. N., Meesters, A. G. C. A., and Bruijnzeel, L. A. (2006). Estimating fog deposition at a puerto rican elfin cloud forest site: comparison of the water budget and Eddy covariance methods. Hydrol. Process. 20, 2669–2692. doi: 10.1002/hyp.6065
Jia, K., Liang, S., Zhang, L., Wei, X., Yao, Y., and Xie, X. (2014). Forest cover classification using landsat ETM+ data and time series MODIS NDVI data. Int. J. Appl. Earth Observ. Geoinform. 33, 32–38. doi: 10.1016/j.jag.2014.04.015
Jin, H., and Eklundh, L. (2014). A physically based vegetation index for improved monitoring of plant phenology. Rem. Sens. Environ. 152, 512–525. doi: 10.1016/j.rse.2014.07.010
Kwarteng, A. Y., Dorvlo, A. S., and Kumar, G. T. V. (2009). Analysis of a 27−year Rainfall Data (1977–2003) in the Sultanate of Oman. Int. J. Climatol. 617, 605–617. doi: 10.1002/joc.1727
Lange, M., Dechant, B., Rebmann, C., Vohland, M., Cuntz, M., and Doktor, D. (2017). Validating MODIS and sentinel-2 NDVI products at a temperate deciduous forest site using two independent ground-based sensors. Sensors (Basel) 17:1855. doi: 10.3390/s17081855
Lenoir, J., Marquet, P. A., De Ruffray, P., and Brisse, H. (2008). A significant upward shift in plant species optimum elevation during the 20th century. Science 320, 1768–1771. doi: 10.1126/science.1156831
Levia, D. F., and Germer, S. (2015). A review of stemflow generation dynamics and stemflow-environment interactions in forests and shrublands. Rev. Geophys. 53, 673–714. doi: 10.1002/2015RG000479
Martone, M., Rizzoli, P., Wecklich, C., González, C., Bueso-Bello, J. L., Valdo, P., et al. (2018). The global forest/non-forest map from TanDEM-X interferometric SAR Data. Rem. Sens. Environ. 205, 352–373. doi: 10.1016/j.rse.2017.12.002
Poyatos, R., Latron, J., and Llorens, P. (2003). Land use and land cover change after agricultural abandonment. Mount. Res. Dev. 23, 362–368.
Pravalie, R., Sîrodoev, I., and Peptenatu, D. (2014). Detecting climate change effects on forest ecosystems in southwestern romania using landsat TM NDVI data. J. Geogr. Sci. 24, 815–832. doi: 10.1007/s11442-014-1122-2
Sahin, V., and Hall, M. J. (1996). The effects of afforestation and deforestation on water yields. J. Hydrol. 178, 293–309. doi: 10.1016/0022-1694(95)02825-0
Schlecht, E., Zaballos, L. G. H., Quiroz, D., Scholte, P., and Buerkert, A. (2014). Traditional land use and reconsideration of environmental zoning in the hawf protected area, South-Eastern Yemen. J. Arid Environ. 109, 92–102. doi: 10.1016/j.jaridenv.2014.05.016
Schmeller, D. S., Loyau, A., Bao, K., Brack, W., Chatzinotas, A., De Vleeschouwer, F., et al. (2018). People, pollution and pathogens – global change impacts in mountain freshwater ecosystems. Sci. Total Environ. 622–623, 756–763. doi: 10.1016/j.scitotenv.2017.12.006
SLC-Off Products: Background (2018). https://landsat.usgs.gov/slc-products-background (accessed April 15, 2018).
SRTM (2018). Shuttle Radar Topography Mission (SRTM). Available online at: https://www2.jpl.nasa.gov/srtm/ (accessed March 23, 2018).
Keywords: ecohydrology, forest cover dynamics, water resources, cloud water interception, remote sensing
Citation: Arnold R, Haug J-K, Lange M and Friesen J (2020) Impact of Forest Cover Change on Available Water Resources: Long-Term Forest Cover Dynamics of the Semi-Arid Dhofar Cloud Forest, Oman. Front. Earth Sci. 8:299. doi: 10.3389/feart.2020.00299
Received: 18 September 2019; Accepted: 26 June 2020;
Published: 17 July 2020.
Edited by:
Frédéric Frappart, UMR 5566 Laboratoire D’études en Géophysique et Océanographie Spatiales (LEGOS), FranceReviewed by:
Eric Mougin, UMR5563 Géosciences Environnement Toulouse (GET), FranceNick Van De Giesen, Delft University of Technology, Netherlands
Copyright © 2020 Arnold, Haug, Lange and Friesen. This is an open-access article distributed under the terms of the Creative Commons Attribution License (CC BY). The use, distribution or reproduction in other forums is permitted, provided the original author(s) and the copyright owner(s) are credited and that the original publication in this journal is cited, in accordance with accepted academic practice. No use, distribution or reproduction is permitted which does not comply with these terms.
*Correspondence: Jan Friesen, amFuLmZyaWVzZW5AdWZ6LmRl