 Jonas Wicky
 Christian Hauck
- Department of Geosciences, University of Fribourg, Fribourg, Switzerland
Coarse blocks are an abundant surface cover in mountainous permafrost landscapes. In this coarse blocky layer, air convection occurs and has a significant influence on the ground thermal regime of the underlying permafrost. Besides heat transfer through conduction, free convection of air takes place seasonally and leads to a pronounced ground cooling. Air convection has been observed and described in many field studies but is often neglected or parametrized in permafrost modeling. In the present study, air convection in the active layer of rock glaciers is explicitly modeled through a heat conduction equation coupled with Darcy’s law over a two-dimensional geometry. With a series of numerical experiments, we show its effects on the thermal regime of the underlying permafrost. The ground permeability and the thermal gradient in the active layer are the most important parameters for air convection in the ground. On field sites with a high ground permeability (order of magnitude 10–6 m2), convection plays a crucial role and is required to correctly model measured borehole temperatures. The onset of natural convection occurs at critical Rayleigh numbers and is characterized by an increase of the standard deviation of the direction and the vorticity of the airflow field in the active layer. In the numerical solutions, the internal air circulation in the coarse blocky surface layer leads to an efficient ground cooling.
Introduction
Permafrost, lithospheric material with a temperature below 0°C for at least two consecutive years, is found in mountainous regions all over the world. Permafrost as a thermal phenomenon is affected by the recent climate change at a global scale (Biskaborn et al., 2019). Changes in the thermal state of permafrost influence natural hazards, such as rock fall and slope instabilities (Gruber and Haeberli, 2007; Draebing et al., 2017; Myhra et al., 2019). Furthermore, the future contribution of permafrost water resources to the hydrological cycle is debated and may play an important role in some regions (Jones et al., 2018). A thorough understanding of the thermal processes governing the ground thermal regime is thus of great interest. Considerable effort has been undertaken to represent mountain permafrost in numerical models. These model approaches range from (i) statistical approaches to map permafrost (Keller, 1992; Boeckli et al., 2012; Deluigi et al., 2017), (ii) physically based permafrost distribution models (Hoelzle et al., 2001; Stocker-Mittaz et al., 2002; Noetzli and Gruber, 2009; Westermann et al., 2013; Haberkorn et al., 2017) to (iii) process oriented permafrost soil modeling studies (Gruber and Hoelzle, 2008; Scherler et al., 2013, 2014; Marmy et al., 2016; Luethi et al., 2017; Pruessner et al., 2018; Cicoira et al., 2019).
Whereas the energy balance at the surface as well as heat conduction and phase changes in the subsurface are explicitly included in many of the two last (ii & iii) model groups, current approaches of modeling ground temperatures in a permafrost context usually neglect or parametrize air convection processes within the ground. They become especially important in coarse blocky surface and subsurface material, which is abundant in mountainous regions. The role of air convection in the ground is also discussed in unfrozen soils (Weisbrod et al., 2009; Moore et al., 2011; Levintal et al., 2017), but ample field investigations have been done in a permafrost context in different regions (Harris and Pedersen, 1998; Kneisel et al., 2000; Delaloye et al., 2003; Sawada et al., 2003; Hanson and Hoelzle, 2004; Delaloye and Lambiel, 2005; Gubler et al., 2011; Morard et al., 2012; Schneider et al., 2012; Popescu et al., 2017). These studies clearly show that especially in coarse blocky material with a high permeability, convection has a significant influence on the ground thermal regime. Convection in this context generally results in colder ground temperatures and thus a higher favorability for the occurrence of permafrost. Rock glaciers are a characteristic landform in the coarse-grained substrates in mountain permafrost terrain and often used as an indicator of permafrost (Barsch, 1996). They are composed of blocks up to 10 m diameter, block size may vary depending on the site and lithology, and voids filled or supersaturated with ice (Arenson et al., 2002). The active layer, the seasonal thaw layer at the surface, can be several meters thick. On many rock glaciers, the active layer is composed of coarse blocks, where the voids are not sealed by ice and allow for air convection. Different authors discussed this mechanism, either regarding vertical convection (Balch, 1900; Guodong et al., 2007) or two-dimensional advection, also referred to as the “chimney effect” (Wakonigg, 1996). Previous studies modeling ground temperatures in rock glaciers propose a parametrization to represent ground convection, Scherler et al. (2014) use a calibrated seasonal heat source-sink term and Pruessner et al. (2018) use calibrated ventilation parameters, fitted to a specific site. Both studies highlight the importance of convection in the active layer, and encourage more in-depth investigations to characterize ground convection. An explicit physically based modeling of convection is therefore crucial to better understand the ground thermal regime and to improve future estimates of permafrost evolution. With the development and the application of such a model, the uncertainty of a convection parametrization can be reduced and the process itself can be better understood and quantified.
In this study, we show the effect of convection on the ground thermal regime of a rock glacier in a two-dimensional numerical modeling approach. We explicitly model air convection, which allows quantifying the influence of convection. We thereby refer to well approved modeling approaches in engineering sciences, where the passive cooling capacities of crushed rocks were extensively studied (Goering and Kumar, 1996; Arenson and Sego, 2006; Guodong et al., 2007; Pham et al., 2008; Lebeau and Konrad, 2009, 2016; Sun et al., 2010; Darrow and Jensen, 2016) and to an attempt of explicit convection modeling in a coarse blocky talus slope presented by Wicky and Hauck (2017) with a focus on the simulation of heat advection along a slope. Compared to Wicky and Hauck (2017), the model approach evolved. Pointwise validation and thus a good estimate of the model performance, as well as the quantification of the contribution of ground convection to the ground temperatures, are possible. Switching to the modeling environment COMSOL Multiphysics leads to a purely equation-based modeling approach, which allows the proper formulation of natural convection in a porous media context and thus a meaningful comparison to published studies. Further, the formulation of pressure boundaries is possible; the model represents also ground ice and is, thanks to more sophisticated solvers, more robust and able to handle relatively complicated boundary conditions and geometries. Our study aims to (i) present an explicit two-dimensional model framework within COMSOL for air convection in the porous active layer of rock glaciers, (ii) assess its dependency on driving variables and site properties and (iii) compare its performance for two rock glaciers in the Eastern Swiss Alps with a different thermal behavior.
Model Description
We model over a simplified two-dimensional geometry and use forcing data from two different rock glaciers in the Swiss Alps. Of both rock glaciers exist long-time and continuous ground temperature data sets and they have different characteristics that allow a comparison and thus a more in-depth comprehension of the main driving variables in the convection process. We focus on improving the understanding of convection processes on an idealized set up and not to exactly model a specific site. In contrast to most model approaches cited above, no calibration has been done on the model as this may hinder a proper interpretation of the processes afterward. We solve the heat conduction equation coupled with a Darcy equation, including the Boussinesq-Oberbeck approximation to account for density driven buoyancy effects in the airflow within the porous media (cf section “Governing Equations”). The aforementioned equations are numerically solved using the finite element method (FEM) with the commercially available software environment COMSOL Multiphysics 5.4.
Governing Equations
The governing equations are described in Nield and Bejan (2017) and COMSOL (2018a). The nomenclature with units can be found in Appendix A. Eqs 1 and 2 govern the heat transfer by conduction and convection, where q is the heat flux, Q is a heat source (sink) term (which we do not apply), q0 the boundary flux, k the (effective) thermal conductivity, Cp the (effective) volumetric heat capacity, ρ the density, V the velocity, T the temperature and t the time.
Airflow in the porous medium is described in Eqs 3 and 4, where Φ is the porosity, Qm the boundary flux, κ the permeability, μ the dynamic viscosity, g the gravitational acceleration and p the pressure.
In two dimensions, the velocity V is a two-component vector V = (u, v). To characterize the air flow vector field the vorticity ζ, described in Eq. 5 (Wallace and Hobbs, 2006), which is equal to the curl of the two dimensional vector field, and the angle of the flow direction d (Eq. 6) are used in the results section.
Rayleigh Number
Eq. 7 describes the Rayleigh number as used in this study with Ca the specific heat capacity of air, β the coefficient of thermal expansion, H the vertical dimension of the active layer and ΔT the temperature difference within the active layer.
The dimensionless Rayleigh (or Rayleigh-Darcy) number Ra describes the potential and the strength of natural convection in a porous media, using the ratio of buoyancy to viscous forces (Kane et al., 2001; Nield and Bejan, 2017). We use this dimensionless number in the results and discussion sections to characterize the convection in the active layer. It has widely been used to analyze natural convection in a permafrost context (Kane et al., 2001; Herz, 2006; Guodong et al., 2007; Wagner et al., 2019).
Ra describes the onset of natural convection when a critical threshold value is reached and thus the buoyancy forces exceed the viscous forces. This threshold is referred as the critical Rayleigh number Racrit (Kane et al., 2001; Nield and Bejan, 2017). Nield and Bejan (2017) derive theoretical values for Racrit for an infinitely extended horizontal porous layer heated from below (Horton-Rodgers-Lapwood problem) to be between 3 to 4π2 depending on the pressure and temperature boundary conditions. In numerical studies on passive cooling in an engineering context the value of Racrit = 4π2 has become established (Goering and Kumar, 1996; Guodong et al., 2007; Pham et al., 2008; Lebeau and Konrad, 2009). Further, studies analyzing temperature data in a permafrost context adopted a critical threshold of ∼40 (Juliussen and Humlum, 2008; Wagner et al., 2019). Hence, in the following Racrit = 4π2 (39.42) is used.
Field Sites and Forcing Data
Temperature data measured at the uppermost thermistor in a borehole on Murtèl-Corvatsch (abbr. COR) and Schafberg (abbr. SBE) rock glacier, both located in the Upper Engadin valley, Eastern Swiss Alps (Figure 1), serve as forcing data at the upper boundary of the model. Temperature at lower depths is used for model validation and discussion. The Swiss permafrost monitoring network PERMOS provides the data (Permos, 2019). Both data series have several gaps due to technical failures. To obtain continuous data, a gap filling method using the approach described by Staub et al. (2017) was performed. Gaps up to 5 days were filled with a linear regression, whereas longer gaps were filled with a quantile mapping approach, using data from 61 different ground surface temperature loggers from the Swiss Alps (Permos, 2019). The gap filled temperature data can be found in the Supplementary Material section.
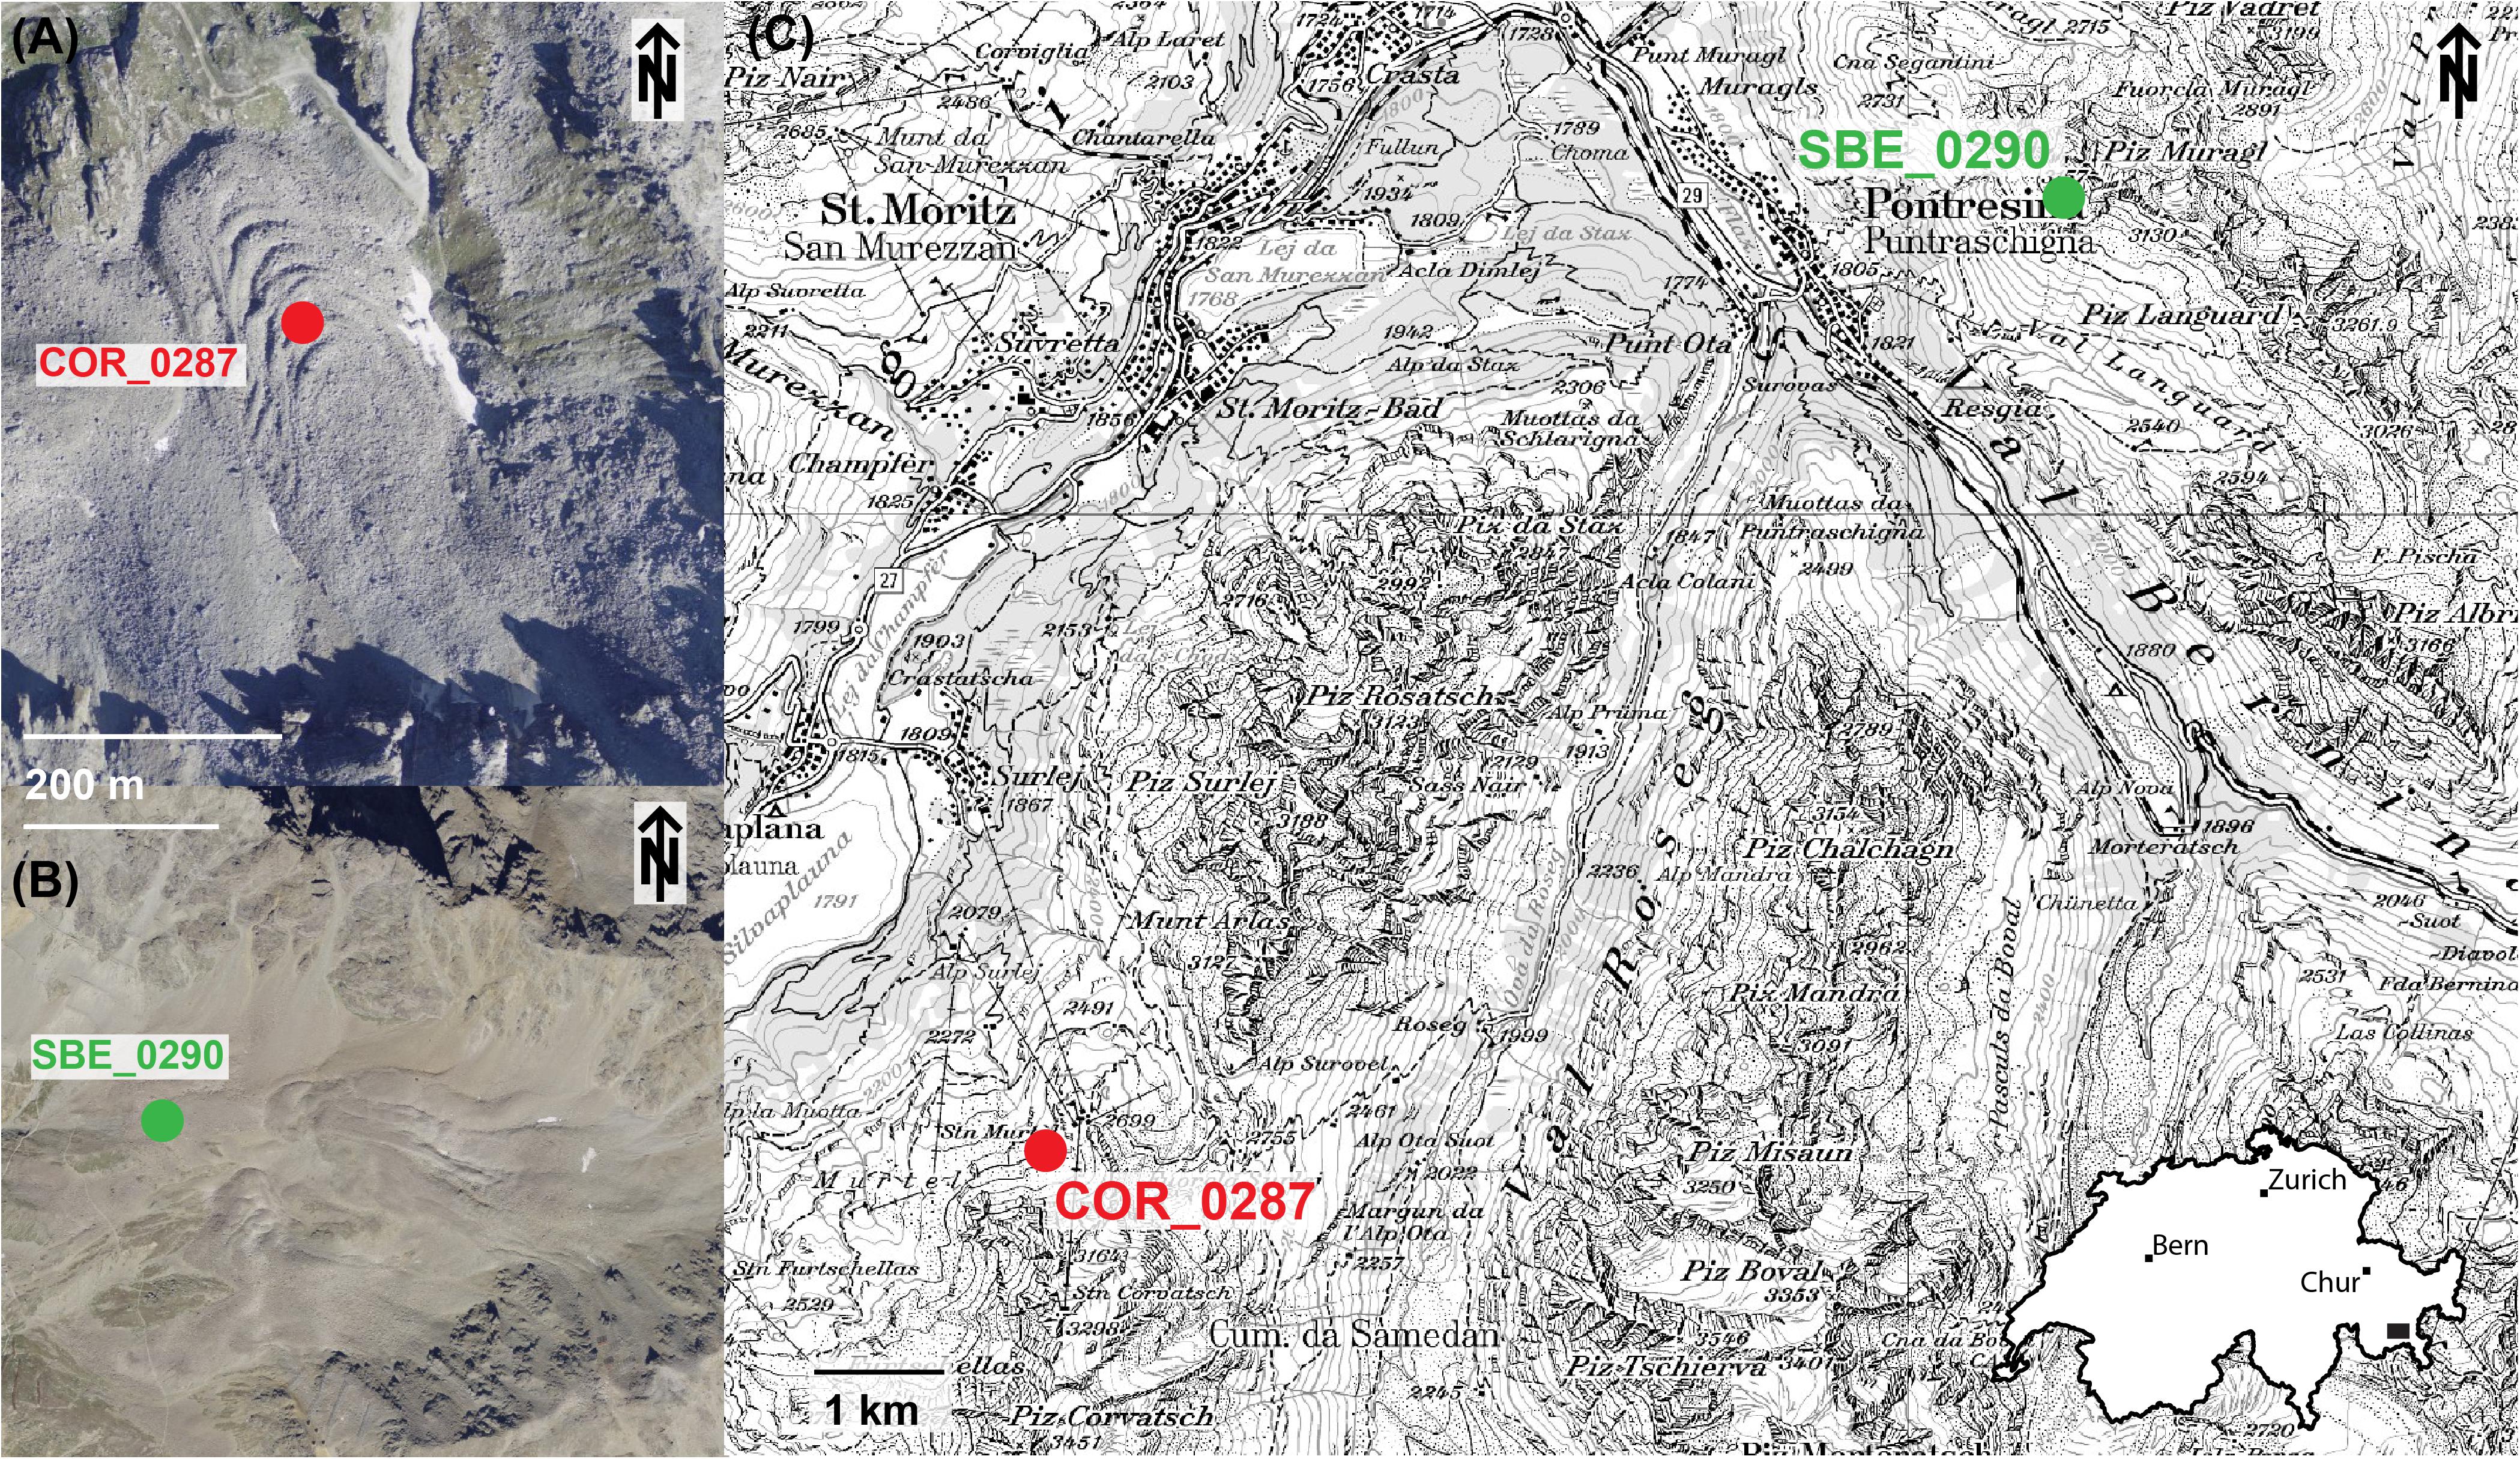
Figure 1. Aerial images of the Corvatsch – Murtel (A) and the Schafberg (B) rock glacier with the location of the PERMOS boreholes, situated in the Upper Engadin valley, Eastern Swiss Alps (C). Source: Swiss Federal Office of Topography swisstopo.
Murtèl-Corvatsch rock glacier (coordinates WGS 84 lat/lon 46.42880, 9.82182; front elevation 2,640 m a.s.l.; Figure 1) located above Surlej is probably one of the best-studied rock glaciers in the world. A first borehole, which is still operational, was drilled in 1987 (COR0287, Haeberli et al., 1988). Two other boreholes were drilled in 2000 (Vonder Mühll et al., 2003; Arenson et al., 2010), one of which is still operational, but shows signals of possible water infiltration in the casing (Permos, 2019). In 2015 a new borehole COR0315 was drilled close to the 1987 borehole to ensure the continuity of the data series in case of failure of the old borehole COR0287 (Permos, 2019). Geophysical investigations (Vonder Mühll and Haeberli, 1990; Vonder Mühll et al., 2000; Arenson et al., 2002; Maurer and Hauck, 2007; Hilbich et al., 2009) provide a detailed description of the internal structure.
The simulation period at COR extends over the hydrological years 2001–2018. Data from borehole COR0287 is used until January 2016 and from then onward, the thermistor at the same depth from the COR0315 borehole serves as upper boundary. The temperature data from the new borehole matches the old measurements well (Permos, 2019), but shows smoother data close to the surface.
Schafberg rock glacier (coordinates WGS 84 lat/lon 46.49881, 9.92521; front elevation 2,730 m a.s.l., Figure 1) is located above Pontresina and has a long research history (Vonder Mühll and Holub, 1992). Two boreholes are operational within the PERMOS network (Permos, 2019). Schafberg rock glacier is a more complex landform with several lobes. The boreholes are not within the same lobes; we use data from the lower borehole 0290, mainly because data is of higher quality and shows less gaps.
The simulation period extends over the hydrological years 2001–2016. The model runs only until 2016 because the SBE site has a data gap of more than a year from mid-July 2017 onward.
Model Setup
Geometry
The geometry is a simplified schematic representation of a rock glacier (Figure 2). Three domains are represented by different polygons: the active layer, the rock glacier body and the underlying bedrock. Slope angle and thickness of each domain are chosen according to site characteristics (Table 1). The vertical extent is fixed to 150 m to avoid boundary effects. Temperature profiles for comparison to the borehole data are taken in the middle of the geometry. The mesh is composed of triangular elements. In the active layer, the maximum mesh size is of 0.5 m increasing to 11 m at the lower boundary. Mesh dependency tests showed that this setting yields a good representation of the convective process in the active layer, yet numerically stable results and it is a good compromise between accuracy and computational cost.
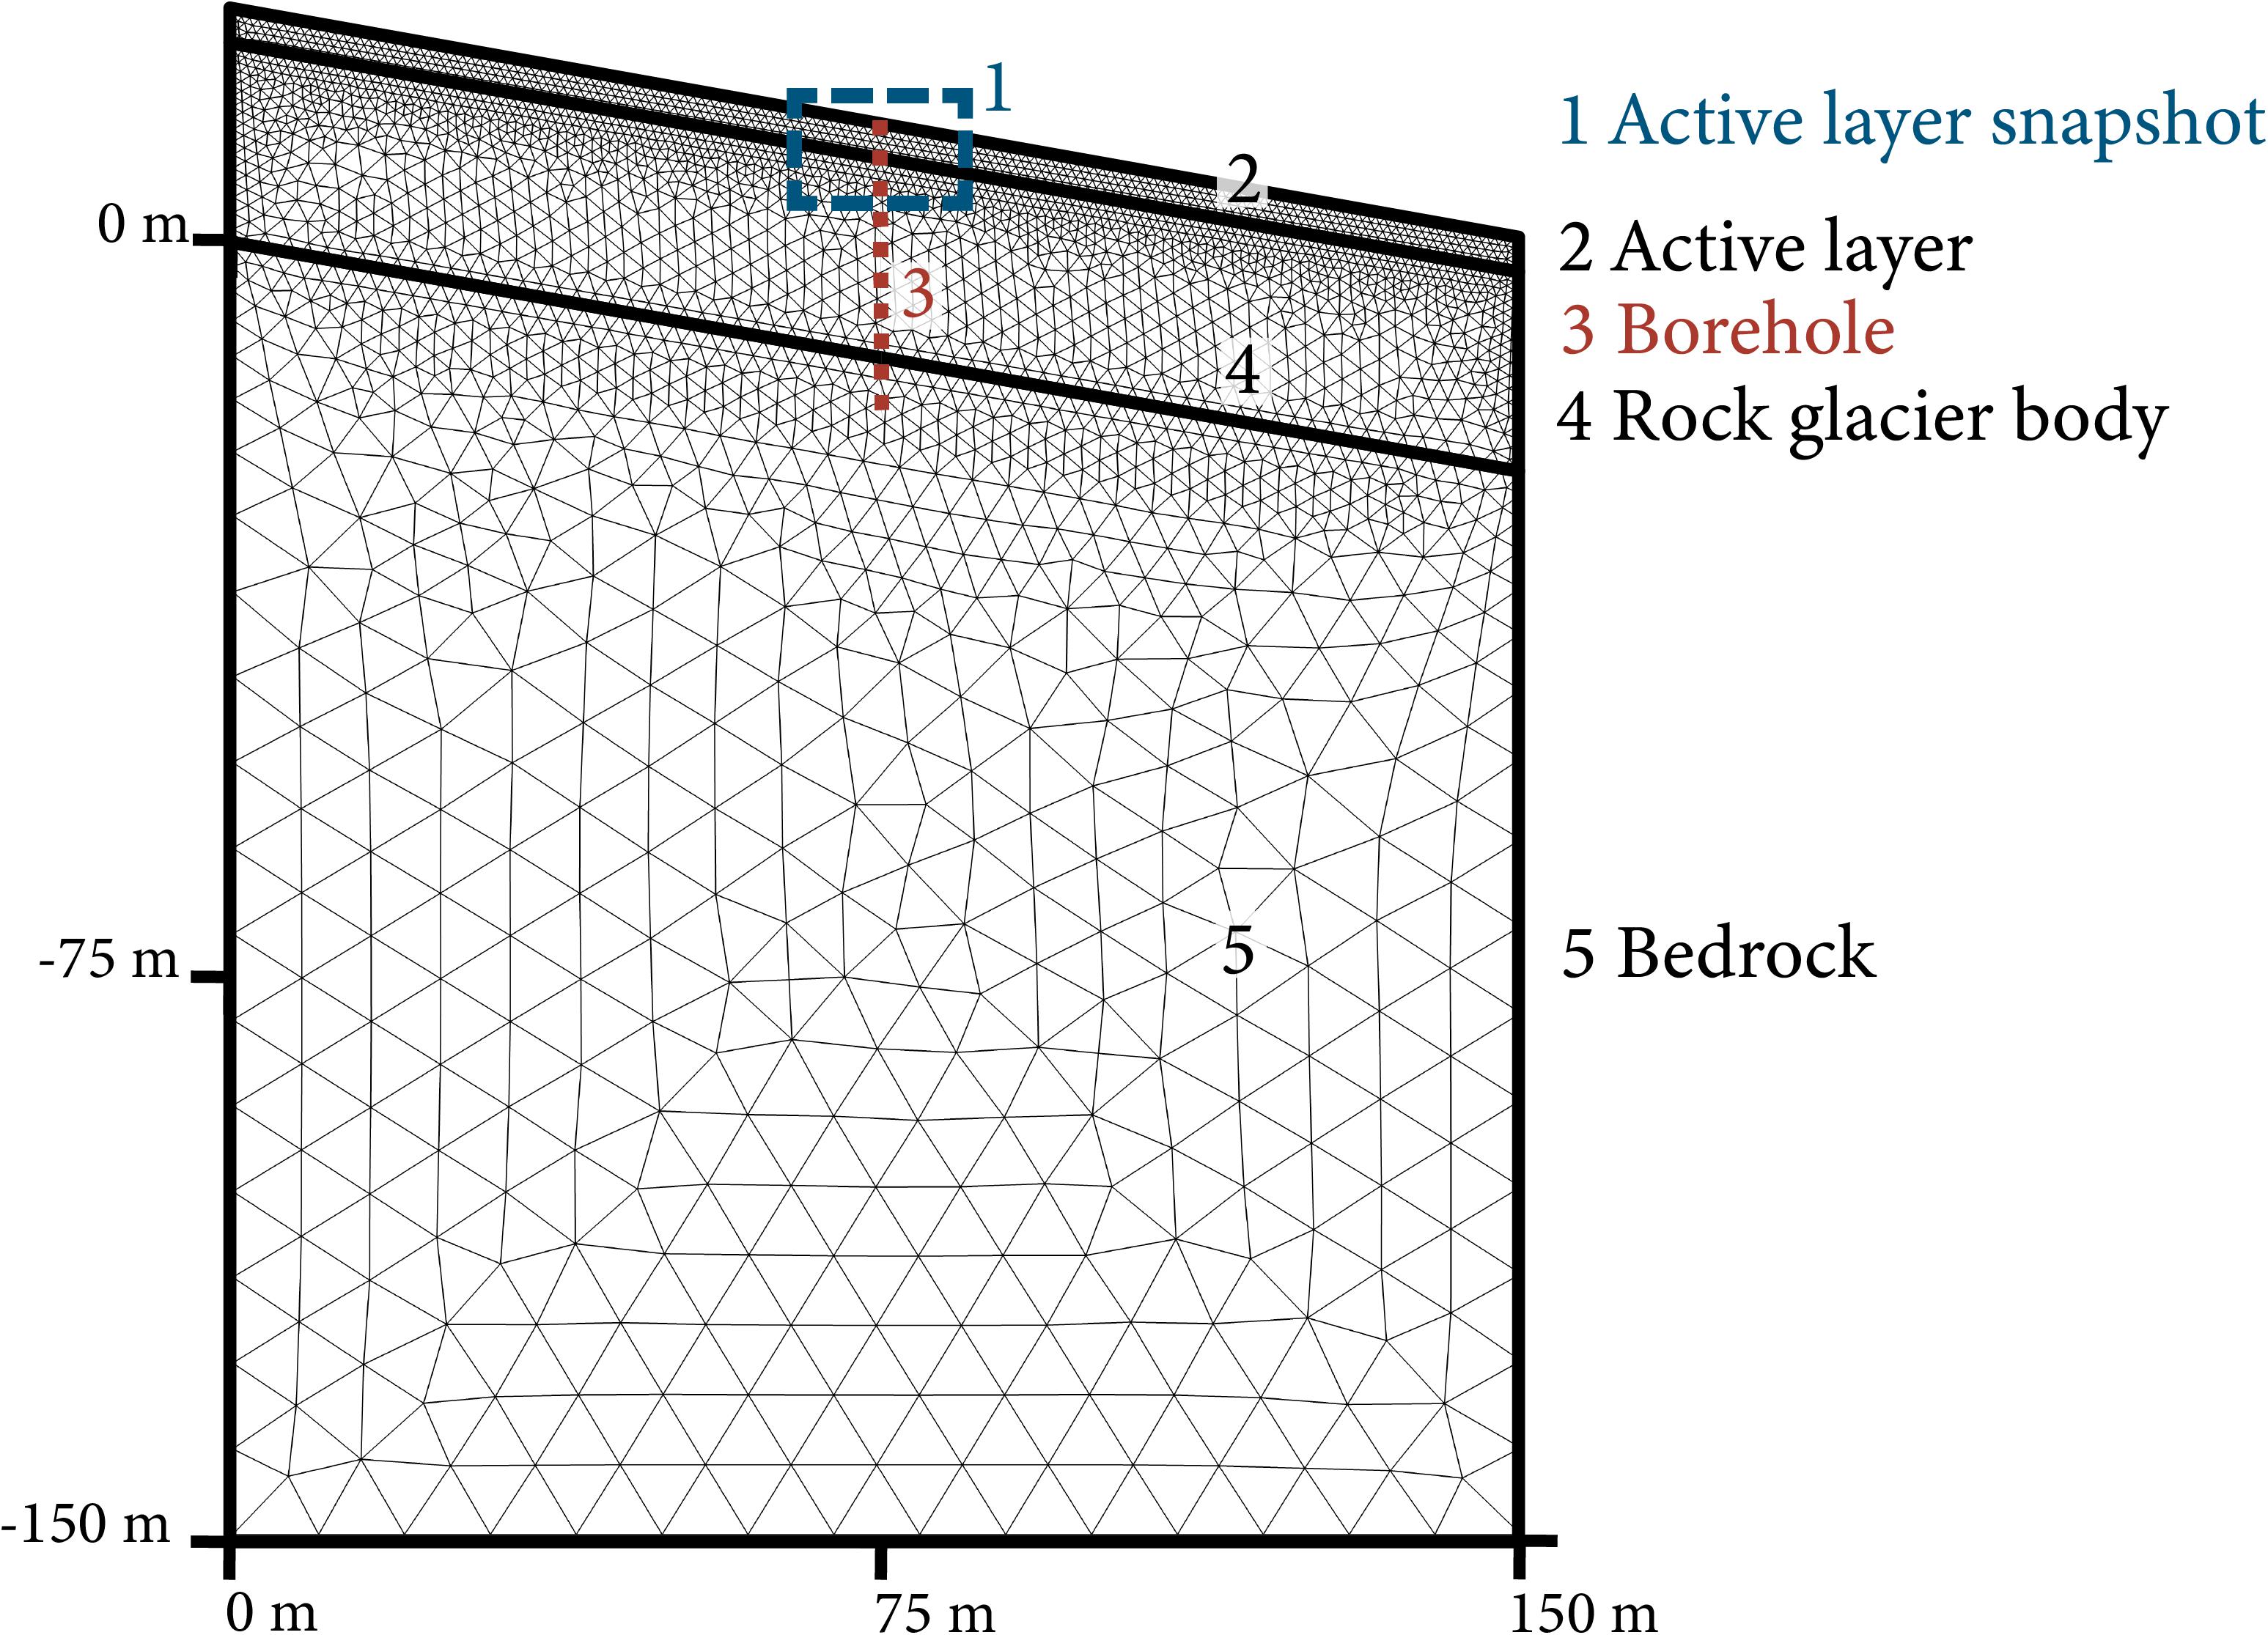
Figure 2. Geometry with the different domains (black) and the meshing. The site respective parameters are given in Table 1. The red dotted line (3) indicates the position of the virtual borehole and the blue dashed rectangle (1) the location of the active layer snapshots in the results section (Figures 6, 7).
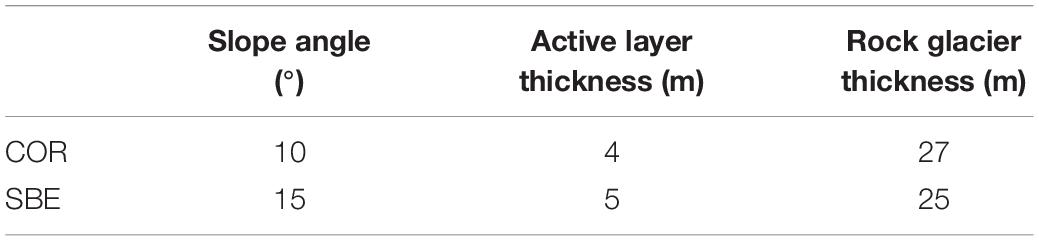
Table 1. Properties of the geometry for COR and SBE.
Material Properties
The physical material properties are shown in Table 2. Thermal conductivity, heat capacity and density values are chosen from the COMSOL material library (COMSOL, 2018b) for granite, air and ice respectively water. The physical properties chosen for granite are in the range of previous publications (Noetzli and Gruber, 2009; Pruessner et al., 2018) and correspond also to values published for granite and gneiss by Cermak and Rybach (1982) and Vonder Mühll and Haeberli (1990). No difference is made in the rock material properties for COR and SBE, even though the lithology is different at each of the sites. Because the ranges of thermal properties for COR (mainly granodiorite) and SBE (gneiss) overlap (Cermak and Rybach, 1982; Vonder Mühll and Haeberli, 1990) we prefer to keep model parameters similar when no direct evidence for exact values (laboratory values) are available. Moreover, sensitivity studies (cf section “Site Dependence”) confirm the findings of Arenson and Sego (2006) that small changes in heat capacity and heat conductivity play a subordinate role in comparison to convective heat transfer. The material properties are thus neither calibrated, nor do we use apparent or measured thermal properties as suggested by other authors (Gruber and Hoelzle, 2008; Schneider et al., 2012).
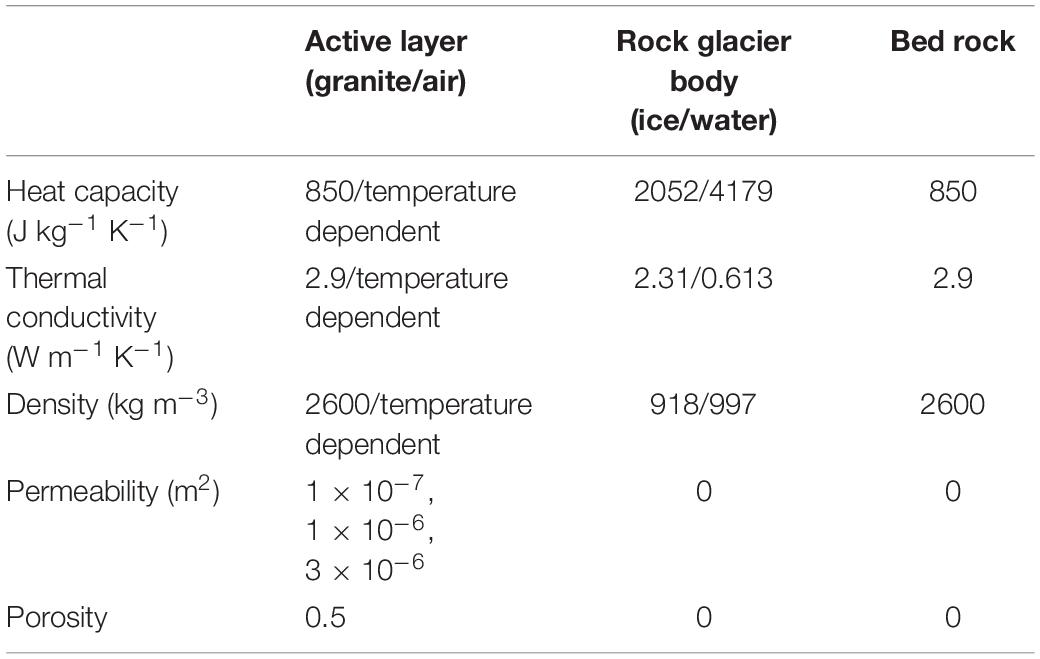
Table 2. Material properties.
The active layer is composed of a porous material. The porosity defines the volume ratio of air to granite. Heat conduction is calculated with an effective heat capacity and conductivity obtained through volume averaging. The permeability refers to an intrinsic permeability (Nield and Bejan, 2017), the relevant parameter for convective airflow in the porous media. In a permafrost context, it is not feasible to measure permeability directly on site. The chosen permeability values are in the range of the experimental values of 0.7 × 10⁻⁶ m2 to 3.9 × 10⁻⁶ m2 obtained by Côté et al. (2011) for crushed rock in a permafrost context and can as well be approximated with the Kozeny-Carman equation (Johansen, 1975, cf section “Permeability”). Regarding the high sensitivity and uncertainty of permeability, the model solves for three different values: a permeability of 1 × 10⁻⁷ m2, where conduction dominates the heat transfer process, as well as values of 1 × 10⁻⁶ m2 and 3 × 10⁻⁶ m2, which are in the range given by Côté et al. (2011) to represent the convective effects. Heat capacity and thermal conductivity for air are temperature dependent and updated at each time step (COMSOL, 2018b). The air density is pressure and temperature dependent, described by the ideal gas law, which is a prerequisite to represent natural convection effects.
The rock glacier body is composed of ice and considers phase change. Borehole geophysics at COR report a very high ice content of up to 100% (Haeberli et al., 1988), whereas at SBE lower values are reported reaching 80% in the main part (Vonder Mühll and Holub, 1992). Heat transfer in the rock glacier body is governed only by conduction and the porosity is assumed to be zero. The representation of phase change in a numerical model potentially leads to very high temperature gradients on a small spatial scale and is therefore prone to numerical instabilities. To mitigate these numerical instabilities and allow for coherent results, two measures are taken: (i) we apply a freezing function with a freezing interval dT around the phase change temperature of 0°C, where the material properties linearly change and the latent heat is added to the heat capacity (COMSOL, 2018b) and (ii) the latent heat is linearly ramped up over the whole rock glacier domain to reach the latent heat of fusion of ice of 333.5 kJ at the base of the rock glacier. The freezing interval dT has a high influence on the numerical stability and the computational cost and was therefore optimized through numerical tests. At COR a uniform dT of 1 K is applied in all model runs. At SBE, the boundary data is less smooth and thus dT is adapted accordingly and set to 0.3, 0.8, and 2 K for the respective permeability of 1 × 10⁻⁷ m2, 1 × 10⁻⁶ m2 and 3 × 10⁻⁶ m2.
In the model set up for both sites, the underlying bedrock is composed of granite, where conduction is assumed the dominant heat transfer process. Hence, the model solves in the bedrock only for heat conduction (Eqs 1 and 2) for a non-porous medium.
Boundary Conditions
The upper thermal boundary is of Dirichlet type with a temperature series measured at the uppermost thermistor of the respective borehole (cf section “Field Sites and Forcing Data”; Permos, 2019). The uppermost thermistor is located at a depth of 0.55 m at COR for the borehole COR0287 and at 0.5 m for the new borehole COR0315. For SBE, the uppermost thermistor is at a depth of 0 m. The simulation period extends over the hydrological years 2000–2018 for COR and 2000–2016 for SBE. The lower thermal boundary is of Neumann type with a constant geothermal heat flux of 0.03 W m–2 (Scherler et al., 2013) for both sites. The sidewalls are insulated. Pressure conditions at the upper model boundary are set to atmospheric, which is represented by an altitude dependent zero pressure head. Sidewalls and bottom boundaries do not allow for any airflow.
The boundary data is available as daily values. Therefore, time steps are constrained to the maximum length of one day. The solver internally defines the optimal time step size through an adaptive time stepping scheme to favor numerical convergence (COMSOL, 2018a).
Initial Conditions
To obtain proper initial conditions we applied a two-step procedure. First, we perform a steady-state spin up. The lower thermal boundary is prescribed by the geothermal heat flux of 0.03 W m–2, whereas the upper boundary is the mean of the site-respective complete temperature data measurements. In a second step, the results of the steady-state run serve as initial conditions for a 30-years transient spin up run. The lower boundary in the transient spin up is yet again a constant geothermal heat flux, whereas the upper boundary consists of the daily median temperature from the site-respective temperature data series, repeated over the years. Numerical tests showed that with this setting a quasi-equilibrium state is reached after 30 years. This temperature field then serves as initial condition for the transient model runs. Previous modeling studies show vast ranges of spin-up times from decades (Scherler et al., 2013; Marmy et al., 2016) to several hundred years (Darrow and Jensen, 2016). Whereby this spin up period is also often used for calibration, it serves in our case only to obtain stable initial conditions. Other authors (e.g., Pruessner et al., 2018) also use measured temperatures as initial conditions. In the context of this study, we prefer using the borehole data at depth only for validation and not to precondition the model.
Results
For COR, the simulation period extends over 18 hydrological years from 2001 to 2018; whereas at SBE the simulation period extends over 16 hydrological years, from 2001 to 2016. For both sites, a spin up (section “Initial Conditions”) was performed. Then, based on these initial conditions, three model runs per site with three different permeability values were conducted. The permeability values range from 1 × 10⁻⁷ m2, where conduction dominates the heat transfer regime, to 3 × 10⁻⁶ m2, where convection is shown to have a high influence on the ground thermal regime.
Temperature
Figures 3, 4 show the temperature evolution in a virtual borehole in the middle of the model domain (Figure 2) in comparison with measured borehole data at COR and SBE respectively for four typical depths: (A) in the active layer (COR 2.55 m, SBE 3.2 m), (B) just below the active layer (4.55 m, 7.2 m), (C) at roughly 10 m depth (9.55 m, 9.2 m) and (D) at roughly 20 m depth (21.56 m, 21.2 m), where the zero annual amplitude is reached. Simulation results with all three modeled permeability values are represented in Figures 3, 4. The differences in temperature at depth respective to the permeability are well visible. The higher the permeability, the higher also the influence of convection in the active layer on the ground temperatures. With increasing permeability, the temperature amplitude increases at all depths and ground temperatures are lower. Regardless of the fit to the measured data, the strong ground cooling induced by convection is evident in both modeled temperature series.
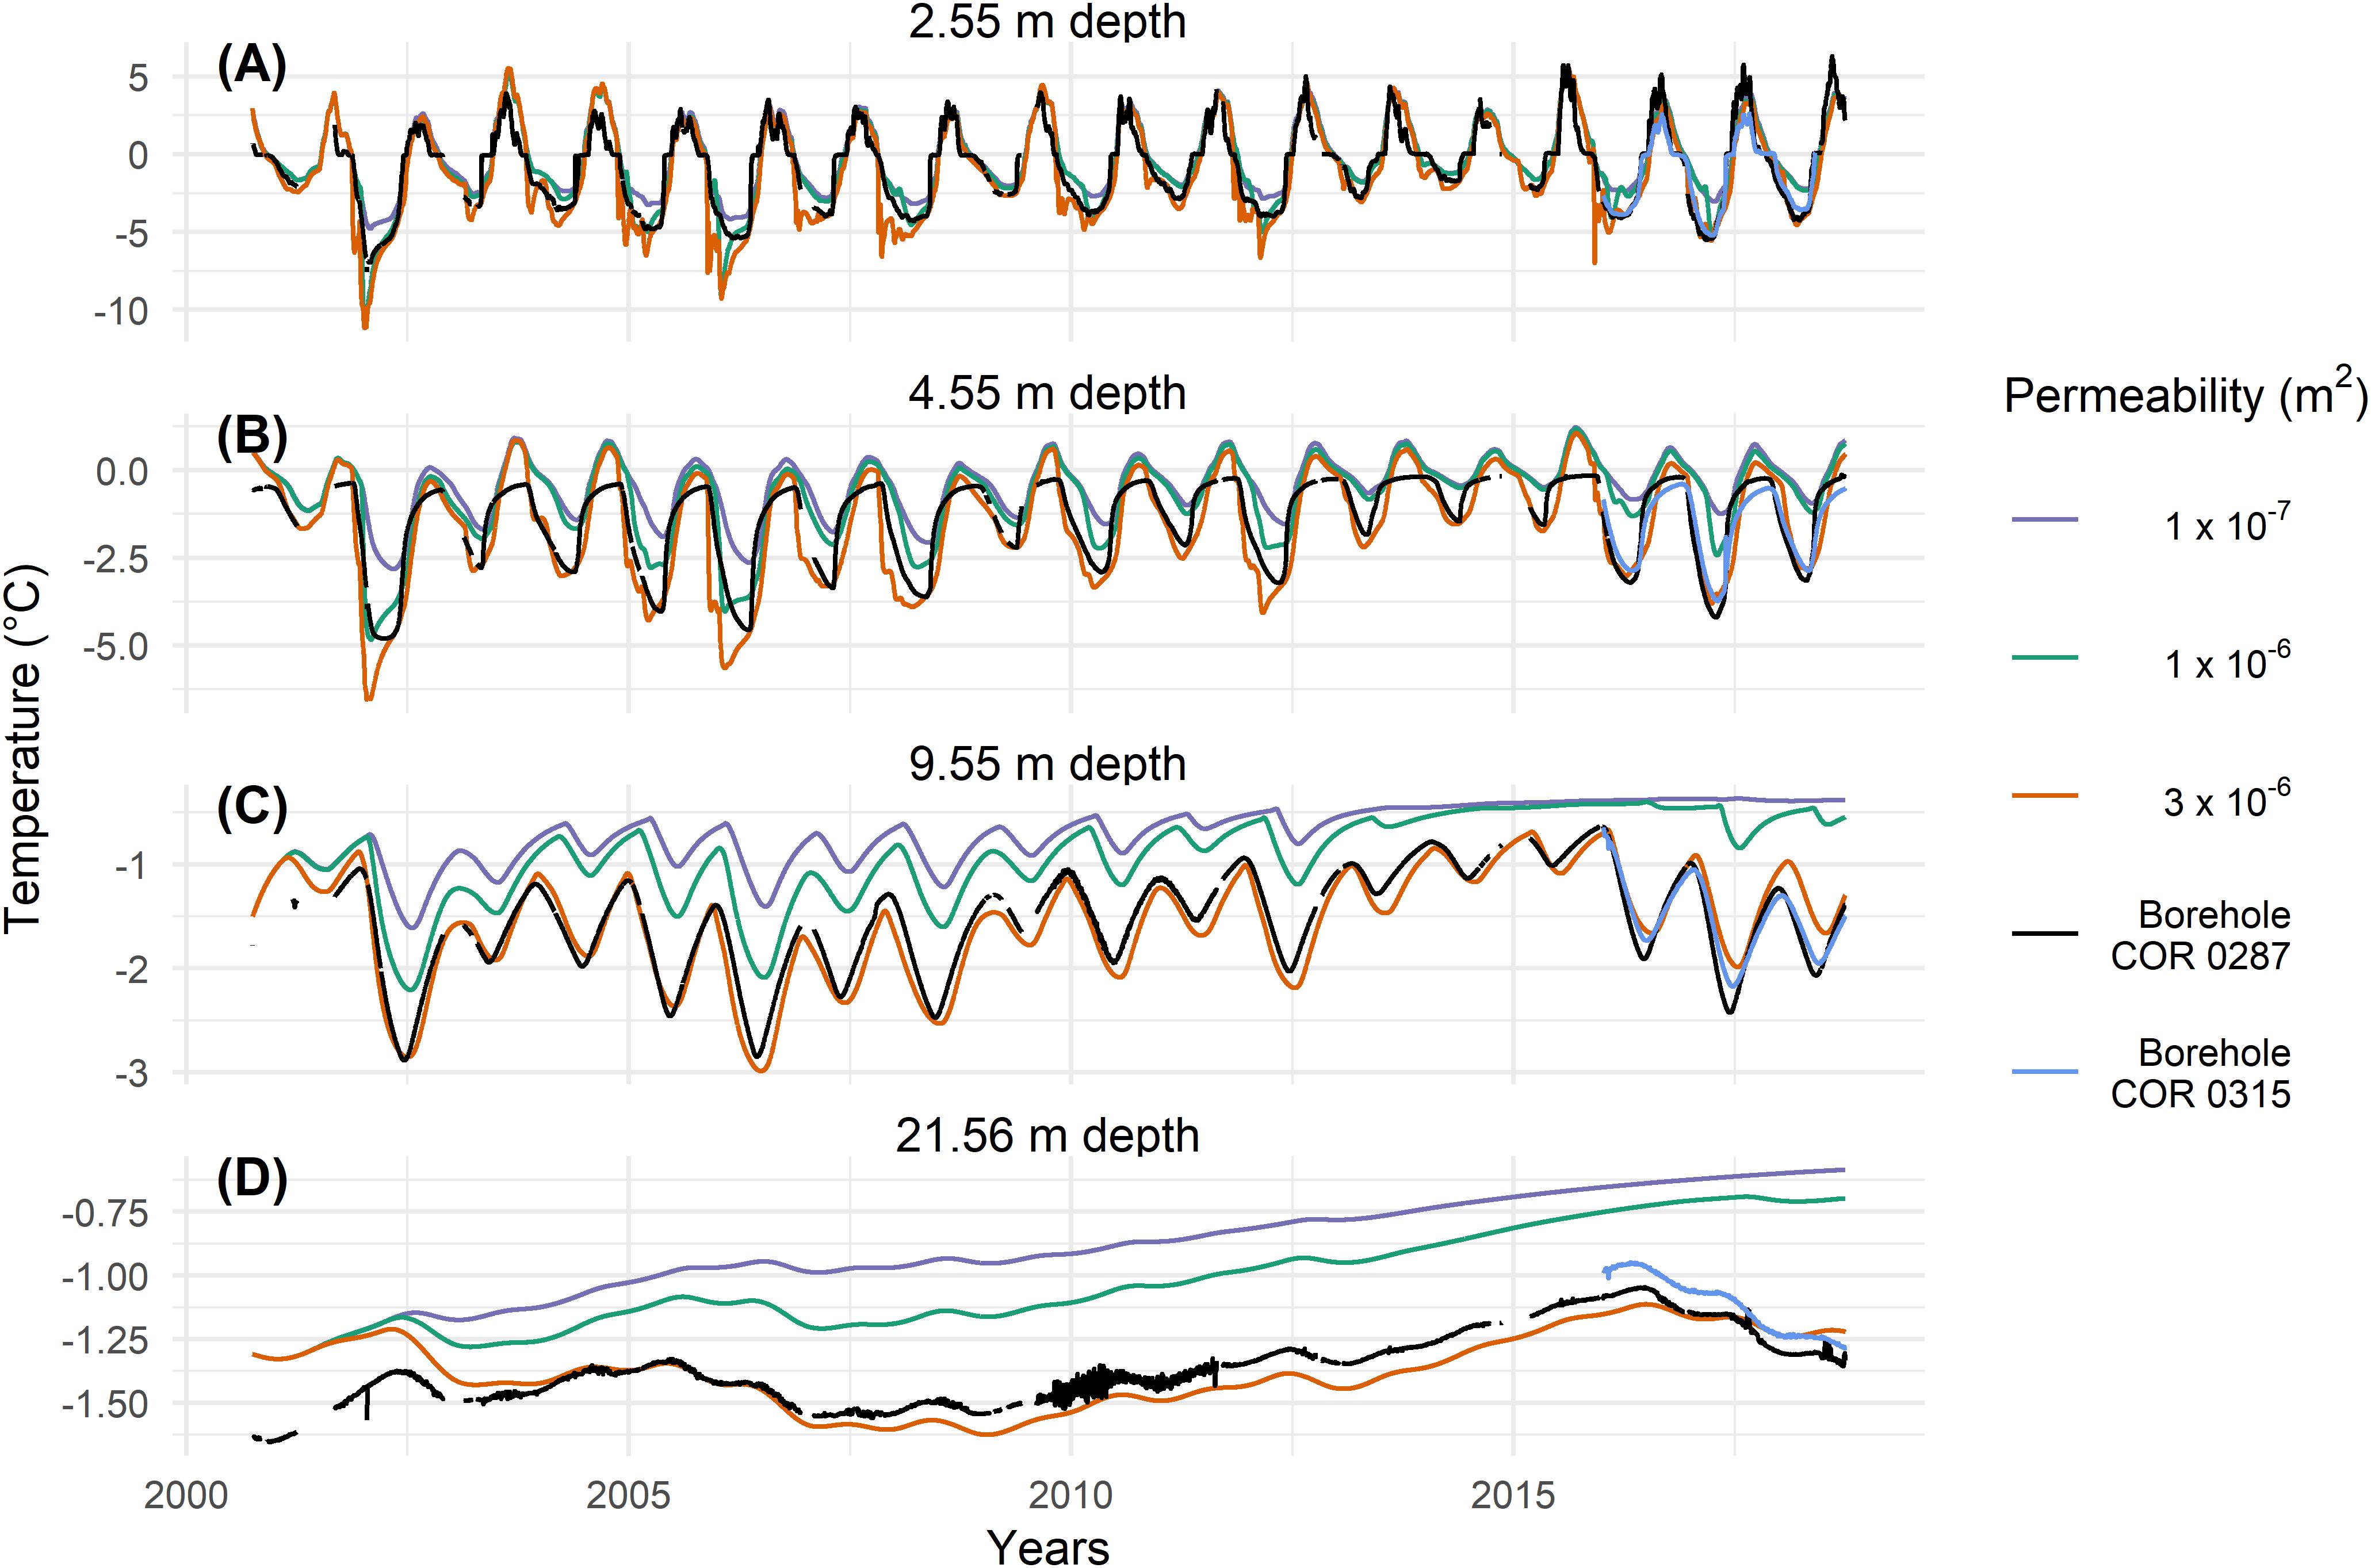
Figure 3. Modeled temperatures at COR for different permeability at different depths of 2.55 m (A), 4.55 m (B), 9.55 m (C), and 21.56 m (D) in a virtual borehole in the middle of the model domain (see Figure 1). Measured temperatures in the borehole are shown in black for the COR0287 borehole and blue for the COR0315 borehole (only from 2015 onward).
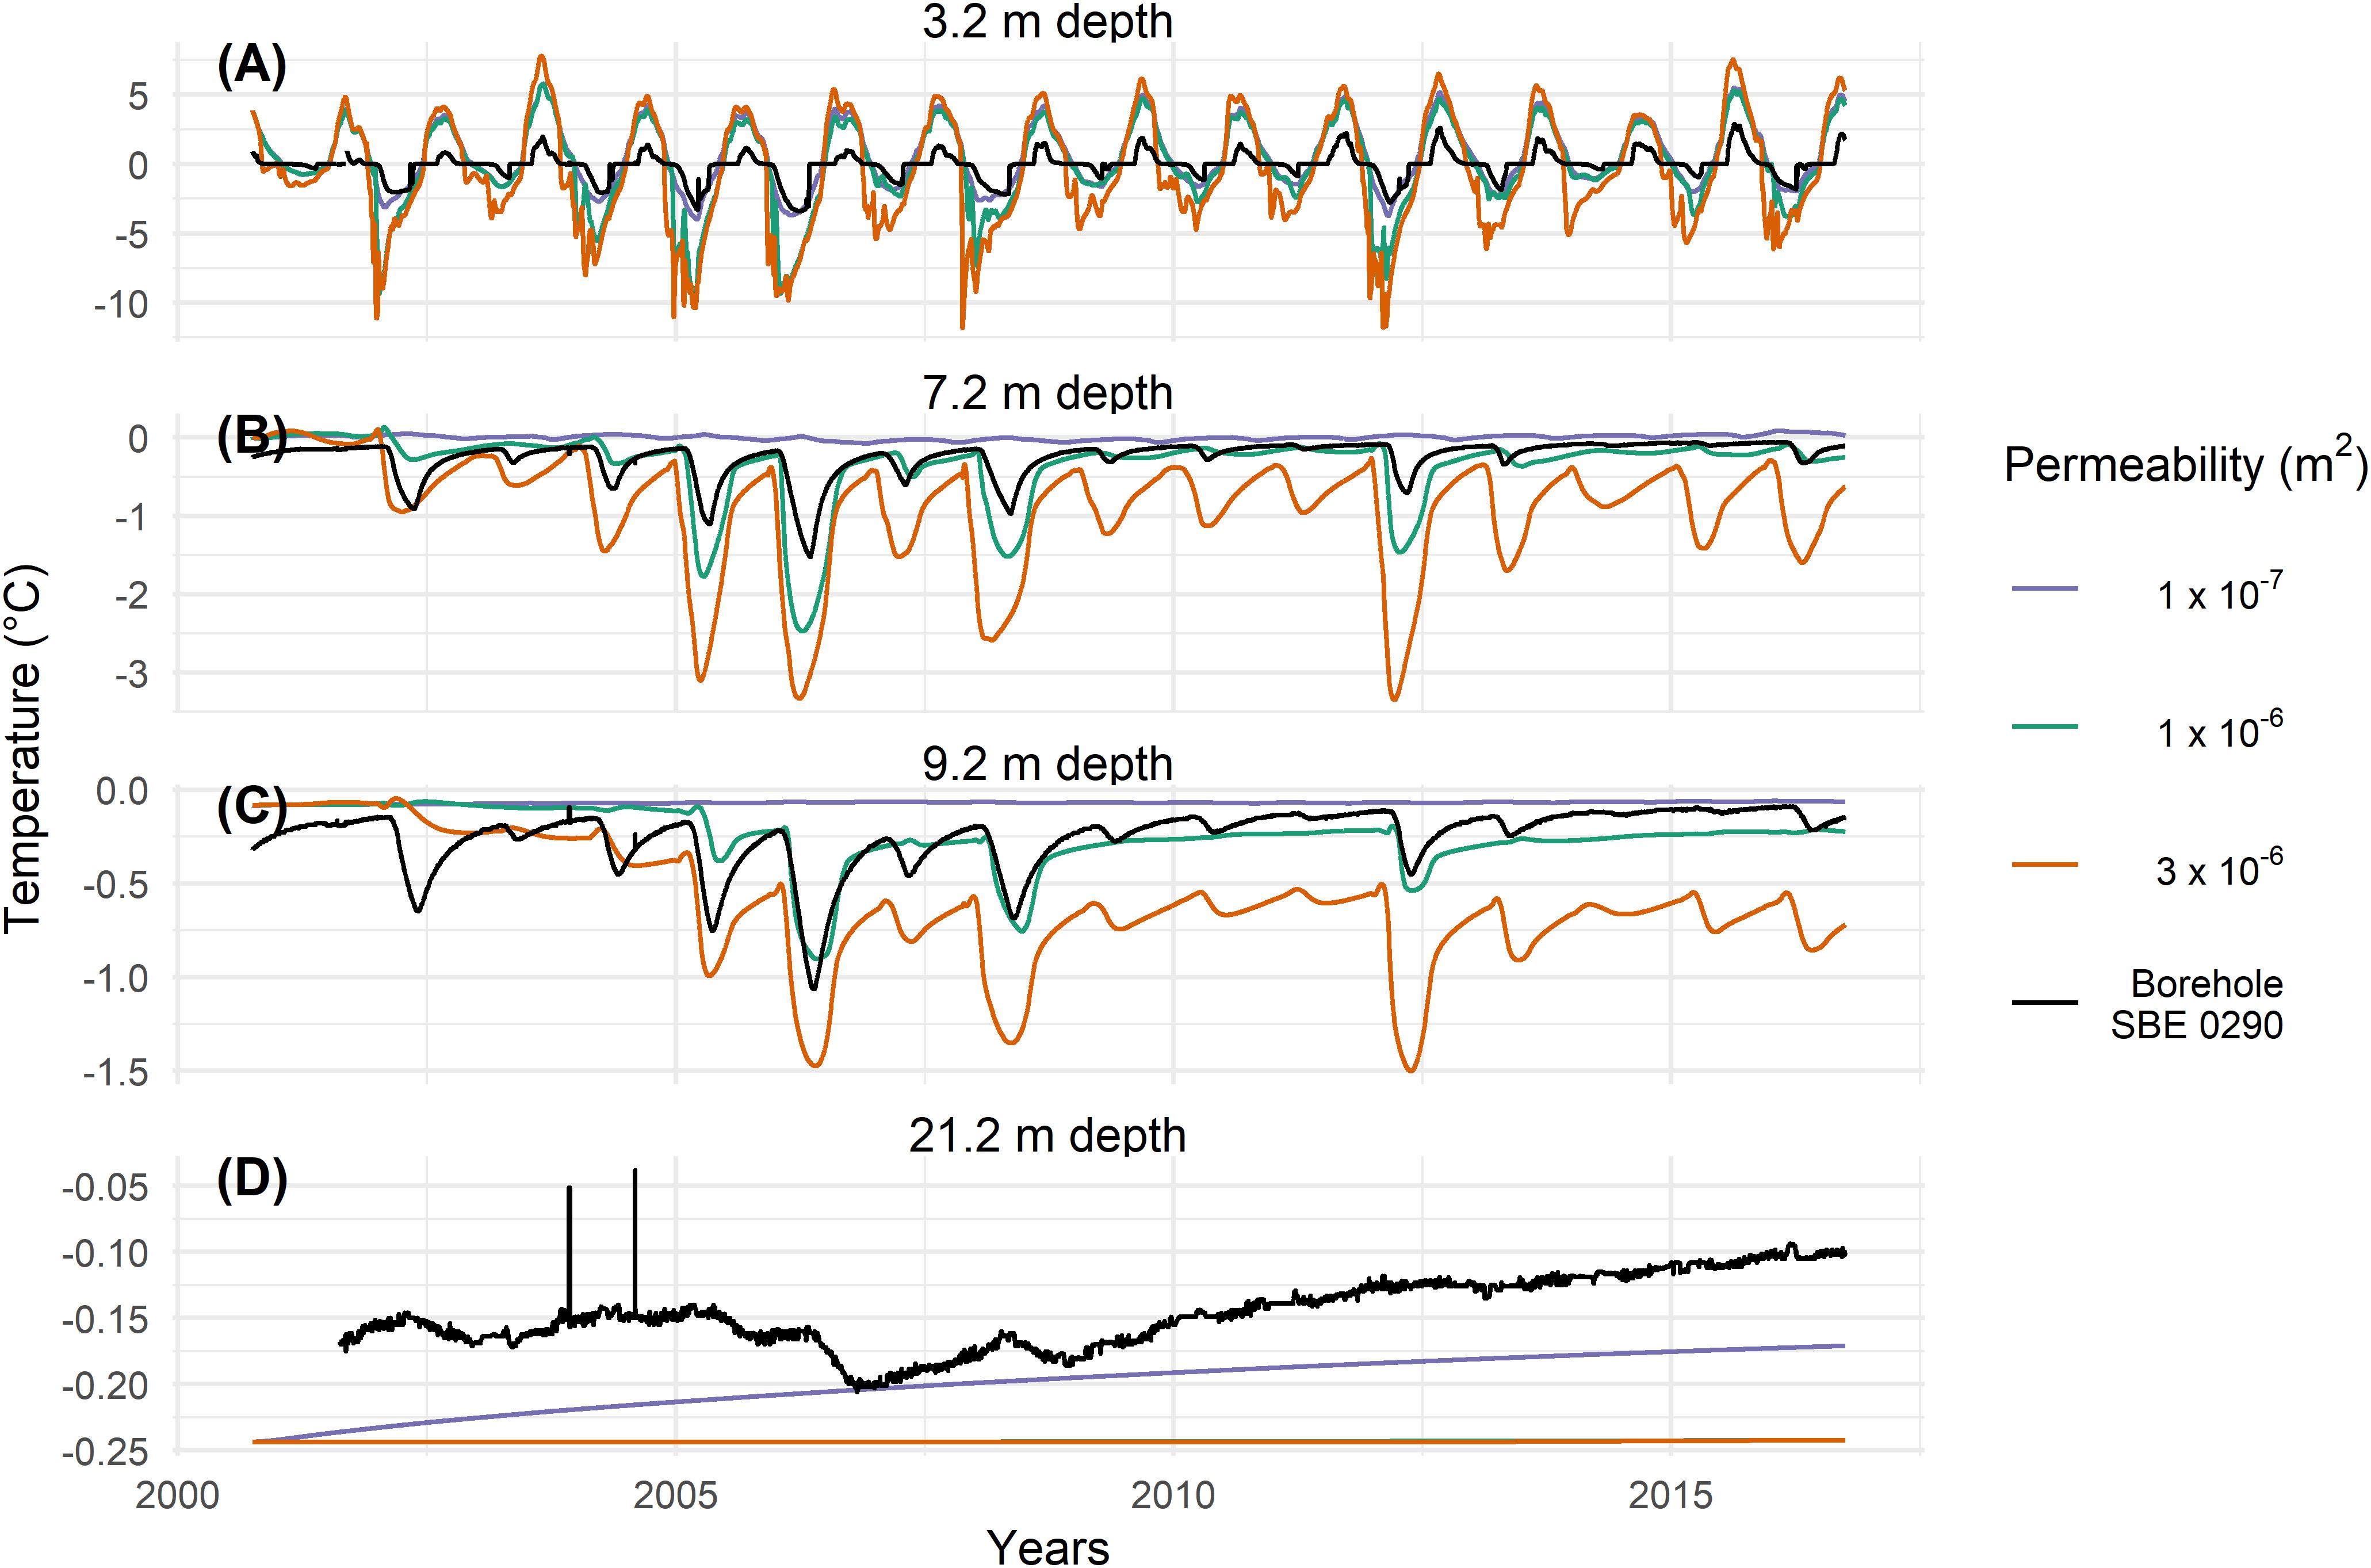
Figure 4. Modeled temperatures at SBE for different permeability at different depths of 3.2 m (A), 7.2 m (B), 9.2 m (C), and 21.2 m (D) in a virtual borehole in the middle of the model domain (see Figure 1). Measured temperatures in the borehole are shown in black for the SBE0290 borehole. In panel (D) the orange line covers the green line.
For COR, the highest permeability of 3 × 10⁻⁶ m2 value yields the best agreement with observations, whereas at SBE a lower permeability of 1 × 10⁻⁶ m2 shows the best agreement with the measured data. This is shown in Figure 5, where the differences between modeled and measured temperatures are plotted. Note that the two peaks in the years 2003/04 at SBE in Figure 5D (as also Figure 4D) are probably due to technical problems in the measurements, as well as the noisy data in the years 2009–2012 at a depth of 21.56 m at COR (Figures 3D, 5B). Both sites show discrepancies within the active layer. As dry conditions are assumed in the active layer in the model, no phase change takes place and the zero curtain, the period where temperature stays at 0°C due to latent heat exchange, cannot be represented. This effect is more pronounced at SBE. It is also important to note that the temperatures at SBE are in general closer to the melting point and thus much more affected by latent heat effects. As the freezing function has an interval dT of at least 0.3 K, modeled temperatures within this range differ from measured data. This is most visible at a depth of 21.2 m at SBE, where the temperatures for higher permeability values are dampened by the latent heat due to a higher dT and show therefore no increase.
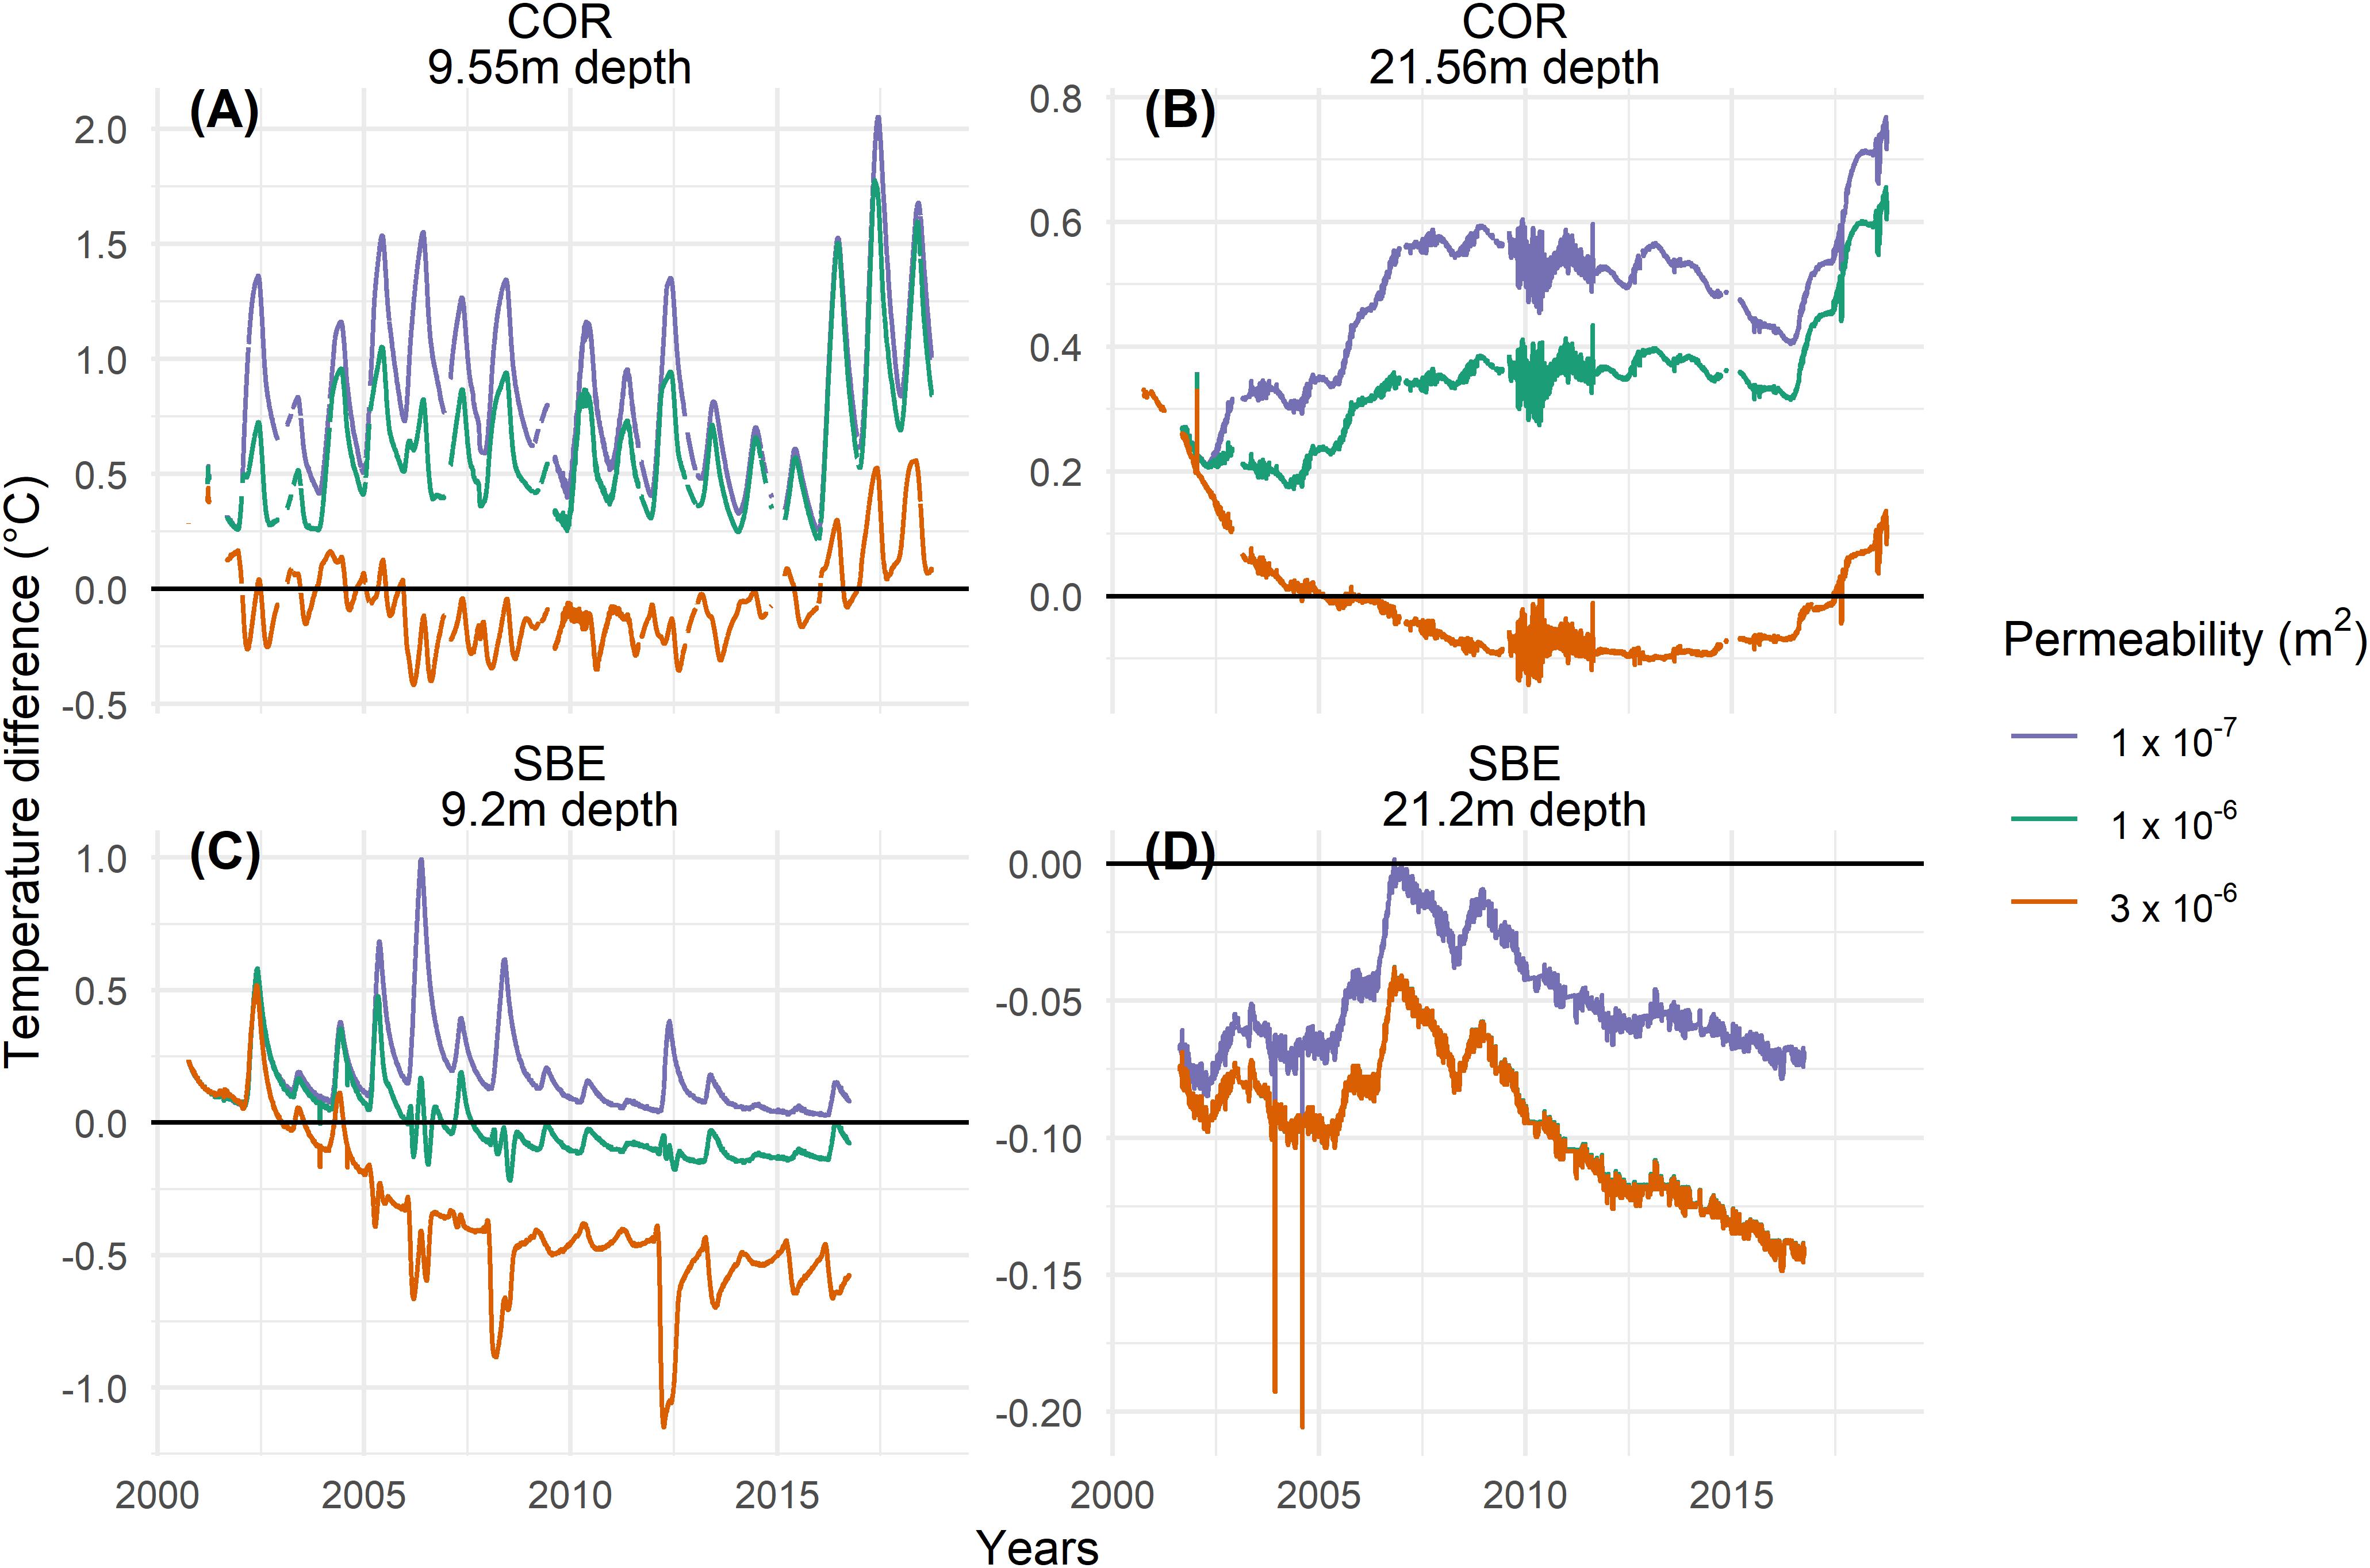
Figure 5. Temperature difference (observed minus modeled) at two different depths of approximately 10 m (A,C) and 20 m (B,D) for COR (A,B) and SBE (C,D). The black zero-line indicates a perfect match with the measured temperature at the borehole COR0287 and SBE0290 respectively. The color lines represent the difference from the modeled to the measured temperatures for different permeability values. In panel (D) the orange line covers the green line.
Convection Regime
Distinct circulation patterns can be observed in the active layer depending on the permeability and the forcing temperature (Figure 6). The circulation shows a clear seasonality. Summertime is characterized by a gentle gravitational down flow with low vorticity. Conduction dominates the thermal regime. Temperature propagates right-angled to the surface through the active layer. Wintertime convection is more complex and highly depending on the material properties and the thermal gradient (respective the Rayleigh number – cf section “Air Flow Field and Rayleigh Number”). Two different situations can occur – for a low permeability and small thermal gradients in the active layer, a gentle density driven up-flow of air takes place within the active layer (Figure 6A). Its influence on the thermal regime is comparably small and conduction is the dominant heat transfer process. However, if thermal gradient and permeability are high enough (and thus the critical Rayleigh number is reached, Eq. 7; Table 3) the onset of free convection can be observed. Multicellular vertical convection, sometimes also referred to as Rayleigh-Bénard convection (Guodong et al., 2007; Nield and Bejan, 2017), takes place in the active layer. The multicellular convection leads to an efficient propagation of cold temperatures into the ground (Figure 6B). As this buoyancy driven multicellular convection occurs only in winter when low air temperatures are present, a highly permeable active layer acts as a thermal filter. When the thermal gradient in the active layer is negative, the cooling is enhanced due to convective heat transfer. With a positive temperature gradient in the active layer, conduction is the dominant process, yet not very effective due to the high air content in the active layer and the corresponding low thermal conductivity. Ground temperatures can be substantially lower due to this ground cooling than without convection effects.
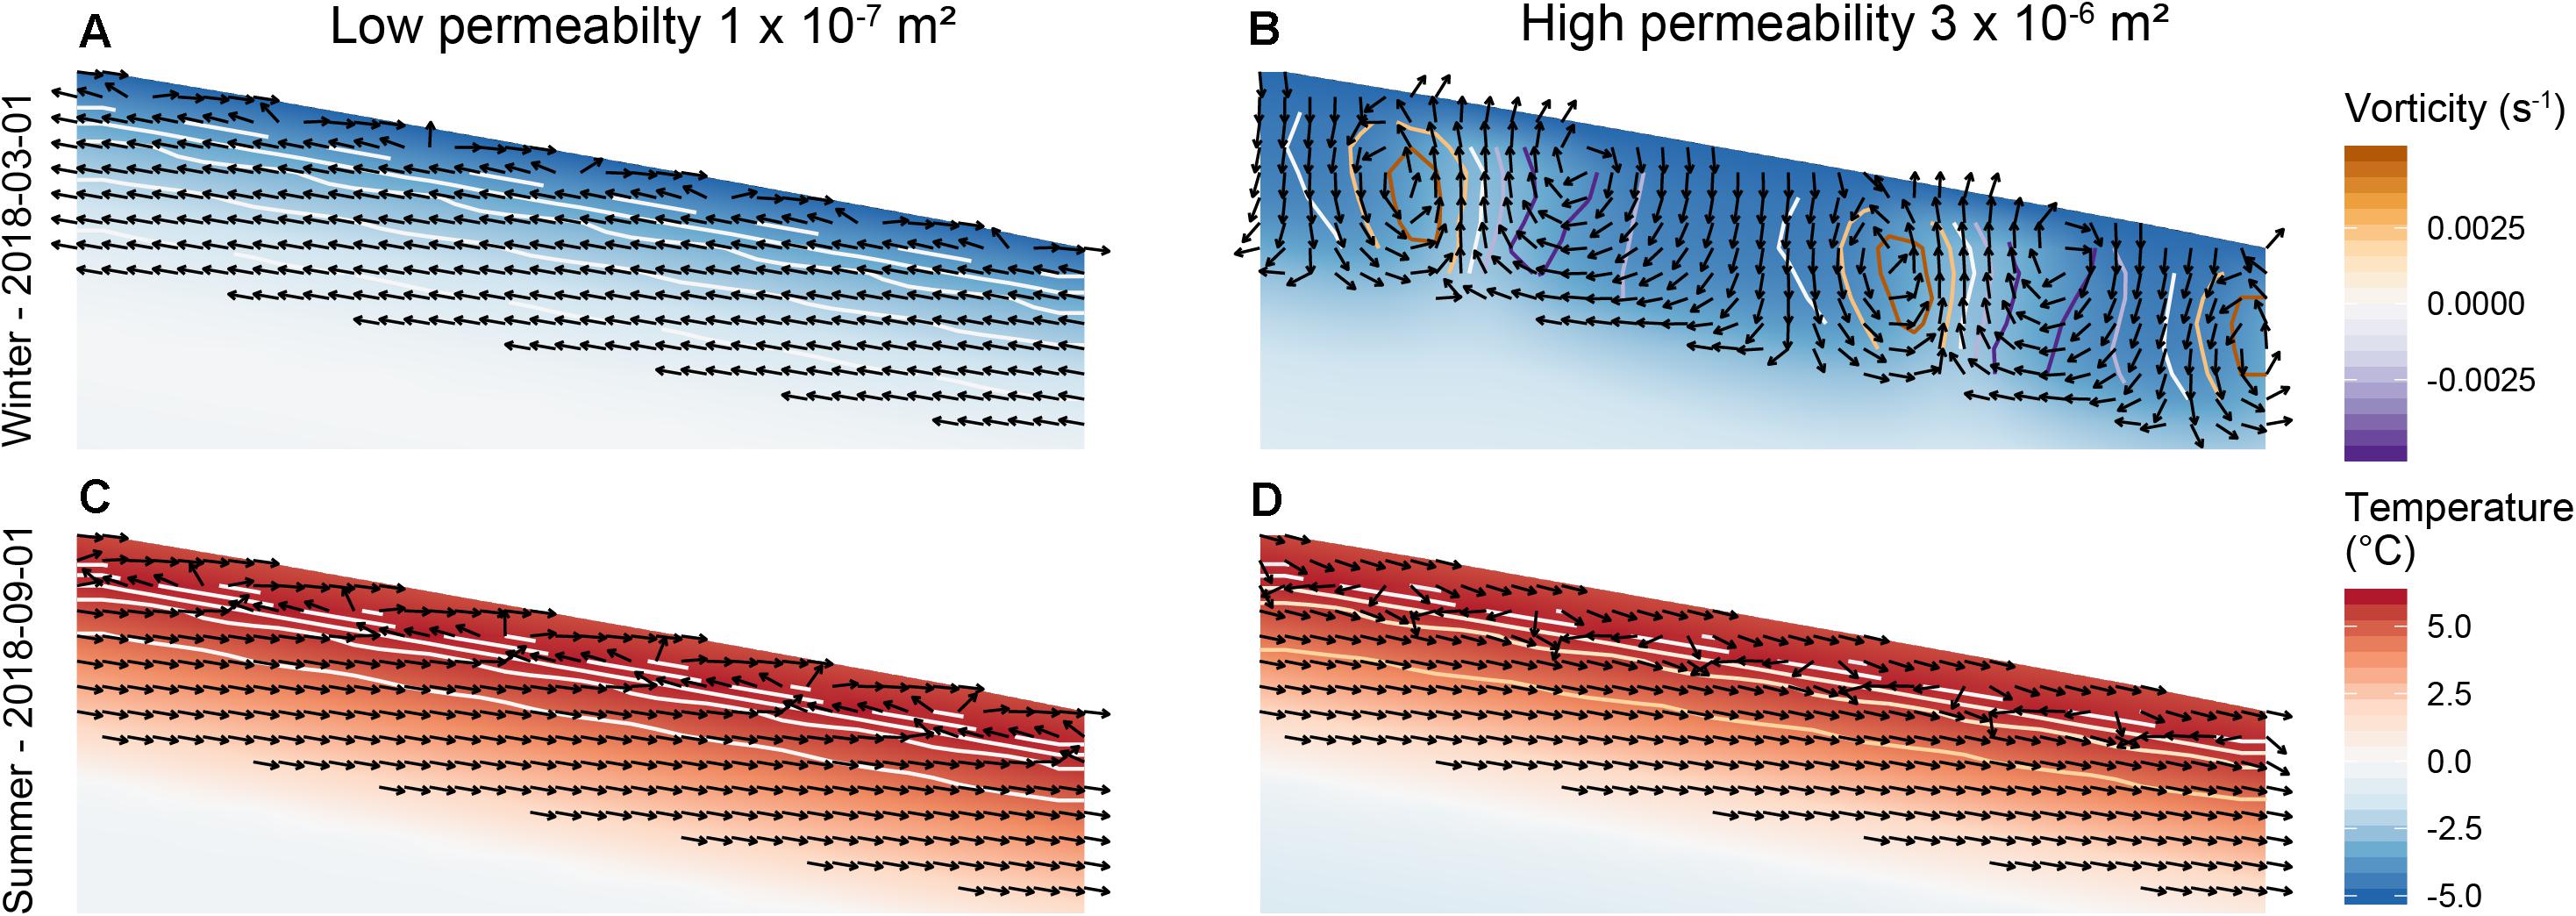
Figure 6. Typical winter (A,B) and summer (C,D) circulation in the active layer of the Murtel-Corvatsch rock glacier for a low permeability of 1 × 10⁻⁷ m2 (A,C) and a high permeability of 3 × 10⁻⁶ m2 (B,D). The color scheme indicates the temperatures, the colored contours the vorticity and the black arrows indicate the direction of airflow field. Note the multicellular convection pattern in panel (B), where the vorticity is positive (negative) for counter-clockwise (clockwise) circulating cells.
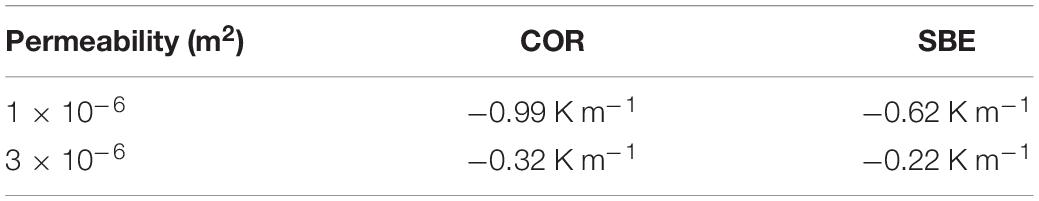
Table 3. Critical temperature gradients in the active layer corresponding to Racrit.
Air Flow Field and Rayleigh Number
Figure 7 shows the evolution of the Rayleigh number Ra (Eq. 7) with time and a sum up of the days per hydrological year, where the critical Rayleigh number Racrit of 4π2 is reached (Figures 7A,B,G,H respectively). In Table 3, the smallest modeled temperature gradients are listed for which Ra > Racrit for each site and permeability. These temperature gradients are thus the respective minimum thresholds for the onset of convection for each site and permeability observed in the active layer. Furthermore, two additional characteristics of the airflow vector field in the porous active layer are determined. To avoid boundary effects, data for the central 20 m of the domain (Figure 2) is used. The standard deviation of the direction of the airflow d (Eq. 6, Figures 7C,D) is used to characterize the type of circulation regime. A high standard deviation of d stands for a multicellular convection, whereas a low standard deviation indicates a down flow parallel to the surface (Figures 7C,D). This measure is independent of the strength of the airflow and can be interpreted as an on/off value for multicellular convection. In addition, the magnitude of the vorticity ζ (Eq. 5, Figure 7E,F) of the airflow vector field is shown. In contrast to the standard deviation of d, this measure depends on the strength of the circulation. Figure 7 shows monthly rolling means of standard deviation of d and of the magnitude of the vorticity ζ to facilitate the interpretation.
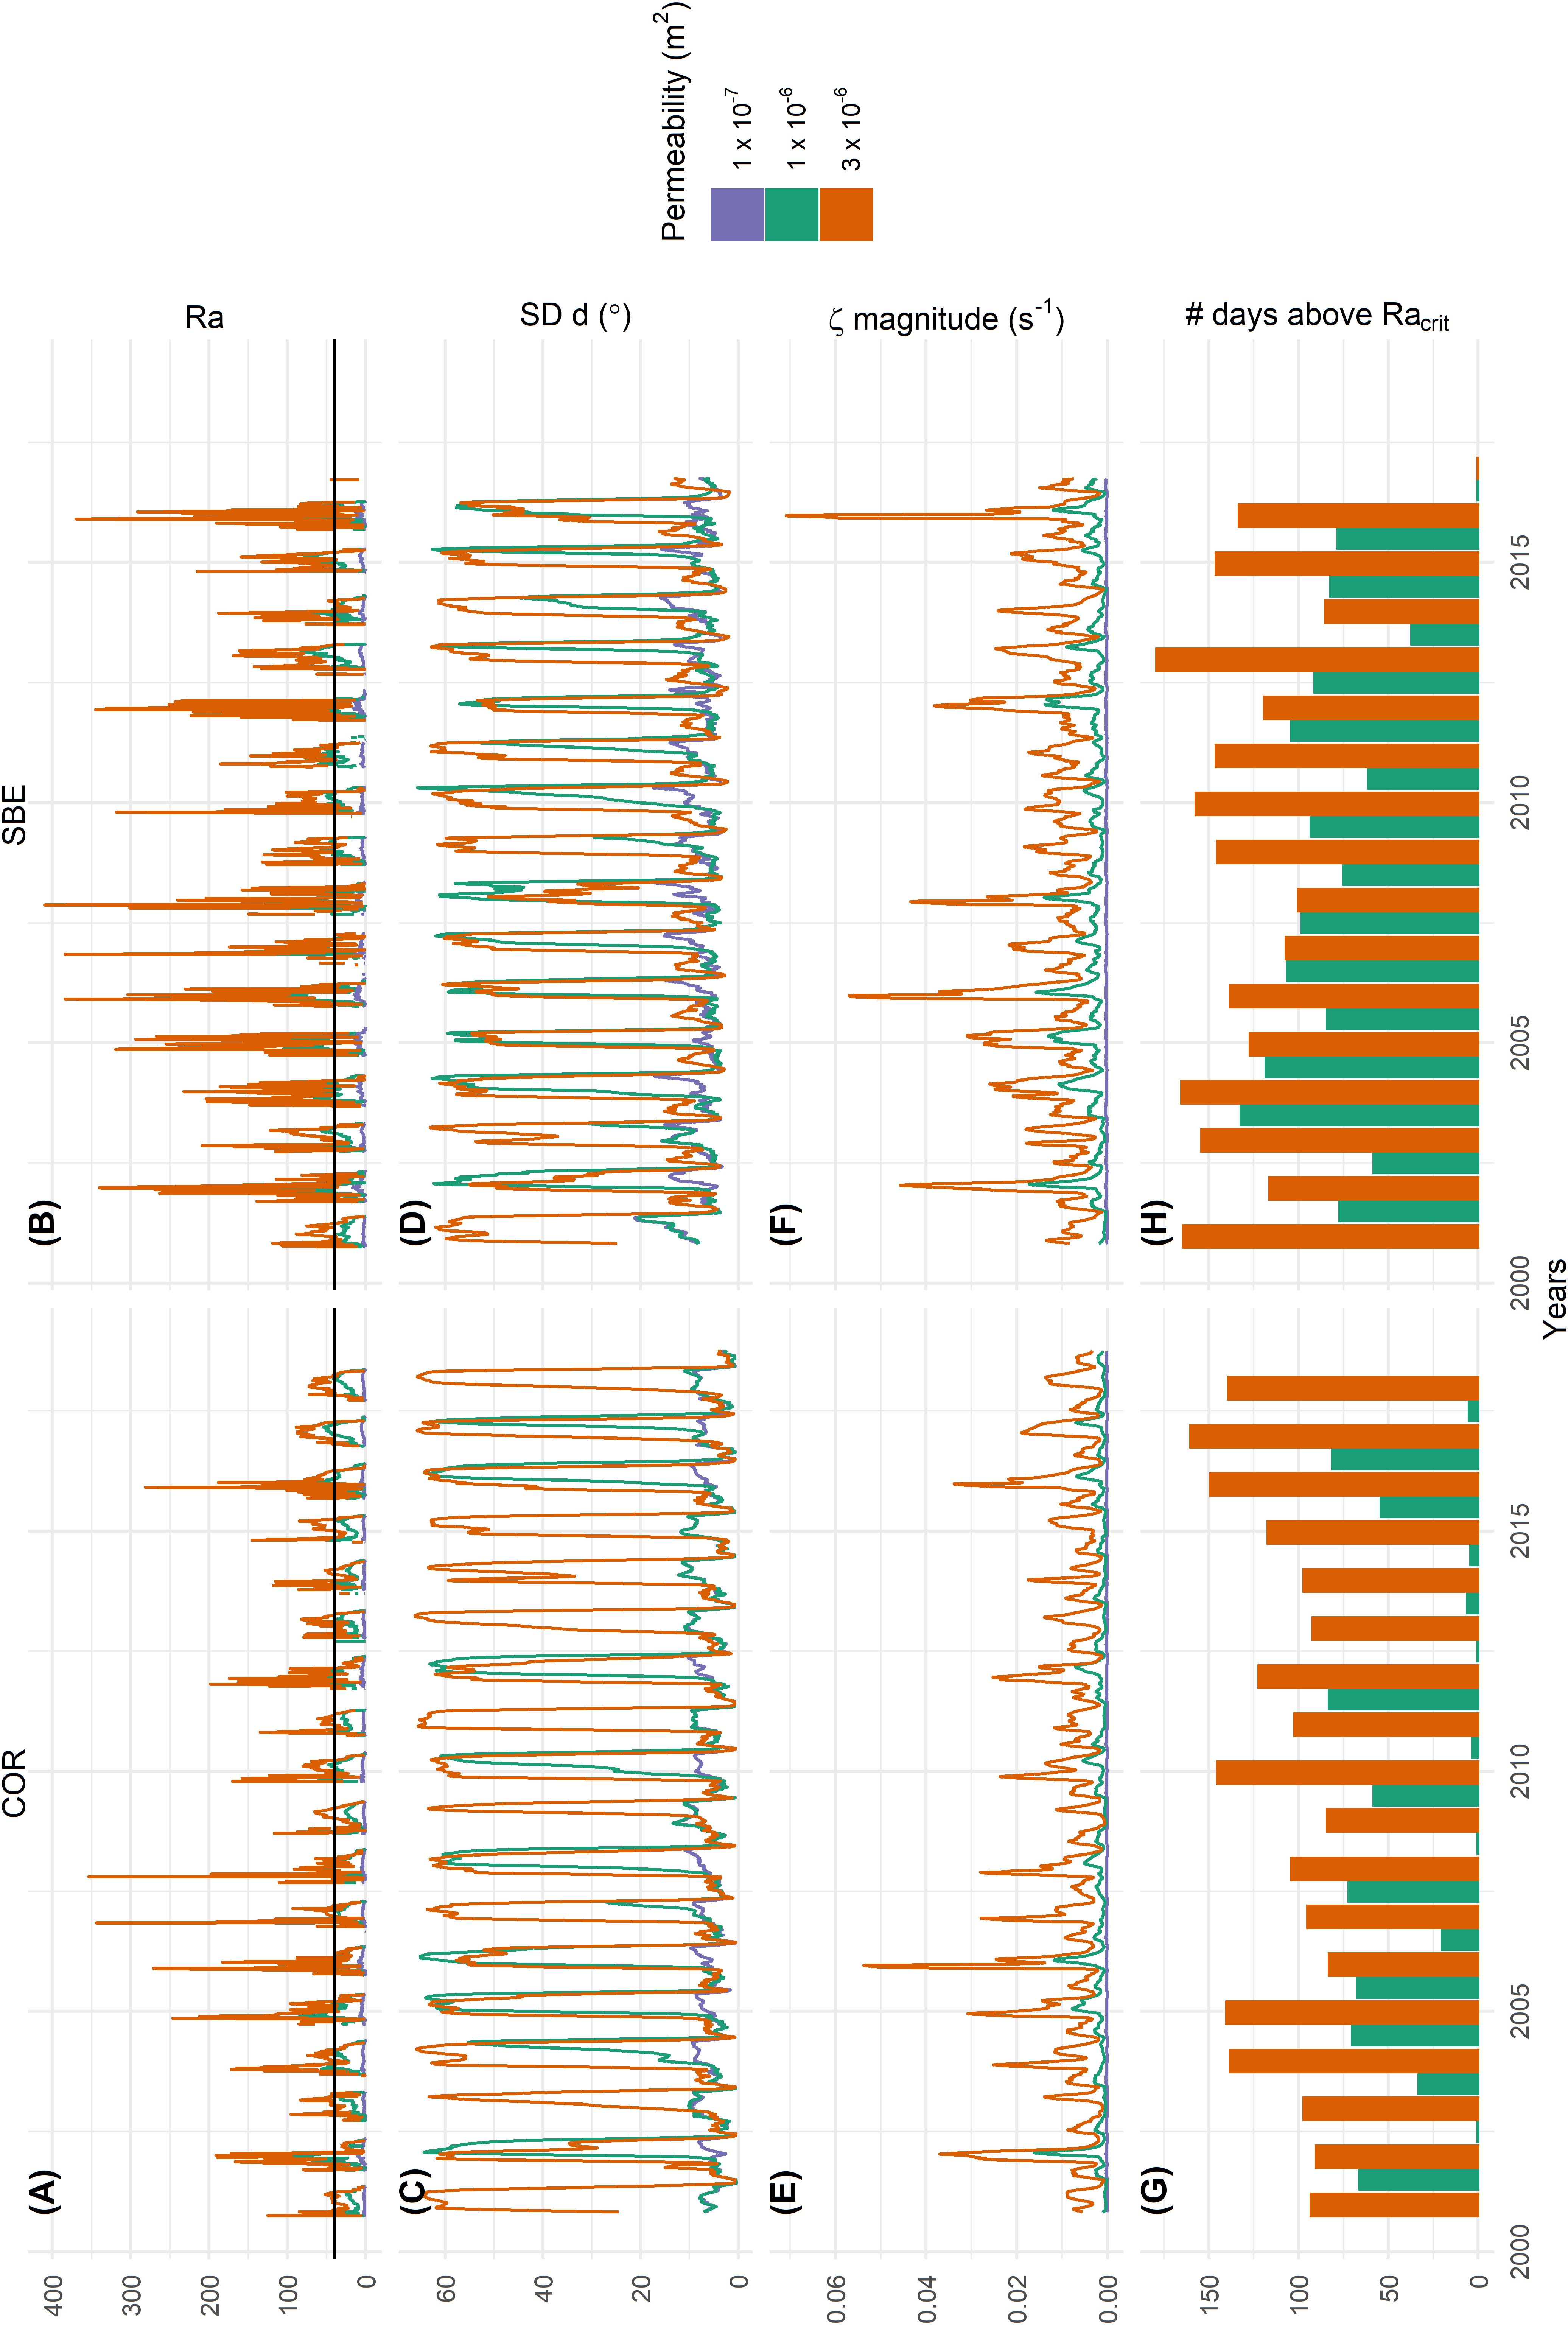
Figure 7. (A,B) Rayleigh number Ra with Racrit in black, (C,D) monthly rolling mean of the standard deviation of the airflow direction d, (E,F) monthly rolling mean of the magnitude of the vorticity ζ and (G,E) the number of days above a critical Rayleigh number within the hydrological year for COR (A,C,E,G) and SBE (B,D,F,H) for three different permeability values, represented by different colors. The magnitude of ζ and the standard deviation of d are calculated over the airflow vector field shown in Figure 6, respectively Figure 1.
The governing parameters of Ra are independent from the modeled airflow vector field (Eq. 7). At Ra values well below Racrit no convection cells form, the vorticity ζ is relatively low and the standard deviation of d is always low. This is the case for a low permeability of 1 × 10⁻⁷ m2. With higher permeability values also an increase of Ra can be observed, either reaching Racrit in some years (for 1 × 10⁻⁶ m2) or in every year (for 3 × 10⁻⁶ m2). The results suggest that approximately a weeklong period above Racrit is needed to pass to a convection dominated heat transfer regime. This is reflected in a high standard deviation of d and in an increase in the magnitude of vorticity ζ. The higher Ra, the higher is also the vorticity magnitude und thus the stronger the air convection in the active layer. A general pattern can be observed in the onset and the duration of convection in Figure 7 for all years. Figure 8 shows an excerpt for the hydrological years 2015/2016 of Figure 7 for COR to describe the observed convection pattern. The onset of convection is characterized by an increase in the standard deviation of d (Figure 8B). Multicellular convection (Figure 6B) then takes place during the winter season, until Ra drops to zero and the convection regime switches to a summer situation of uniform gravitational down flow (Figures 6C,D), characterized by a low standard deviation of d. An approximately weeklong period of Ra > Racrit leads to the onset of convection. In years without multicellular convection, the sum of days with Ra > Racrit is always less than six, regardless of permeability values and site. For a permeability of 3 × 10⁻⁶ m2, multicellular convection occurs in 2015 and 2016, whereas in 2016 the autumn cooling is especially prominent and characterized by high Ra and multiple shorter periods of multicellular convection (Figure 8). For a permeability of 1 × 10⁻⁶ m2, no multicellular convection takes place in 2015 because Ra < Racrit. Multicellular convection occurs in 2016 but the onset is delayed compared to a situation with a higher permeability and does not occur in autumn. At a low permeability of 1 × 10⁻⁷ m2, multicellular convection never takes place because Ra << Racrit and conduction dominates the heat transfer.
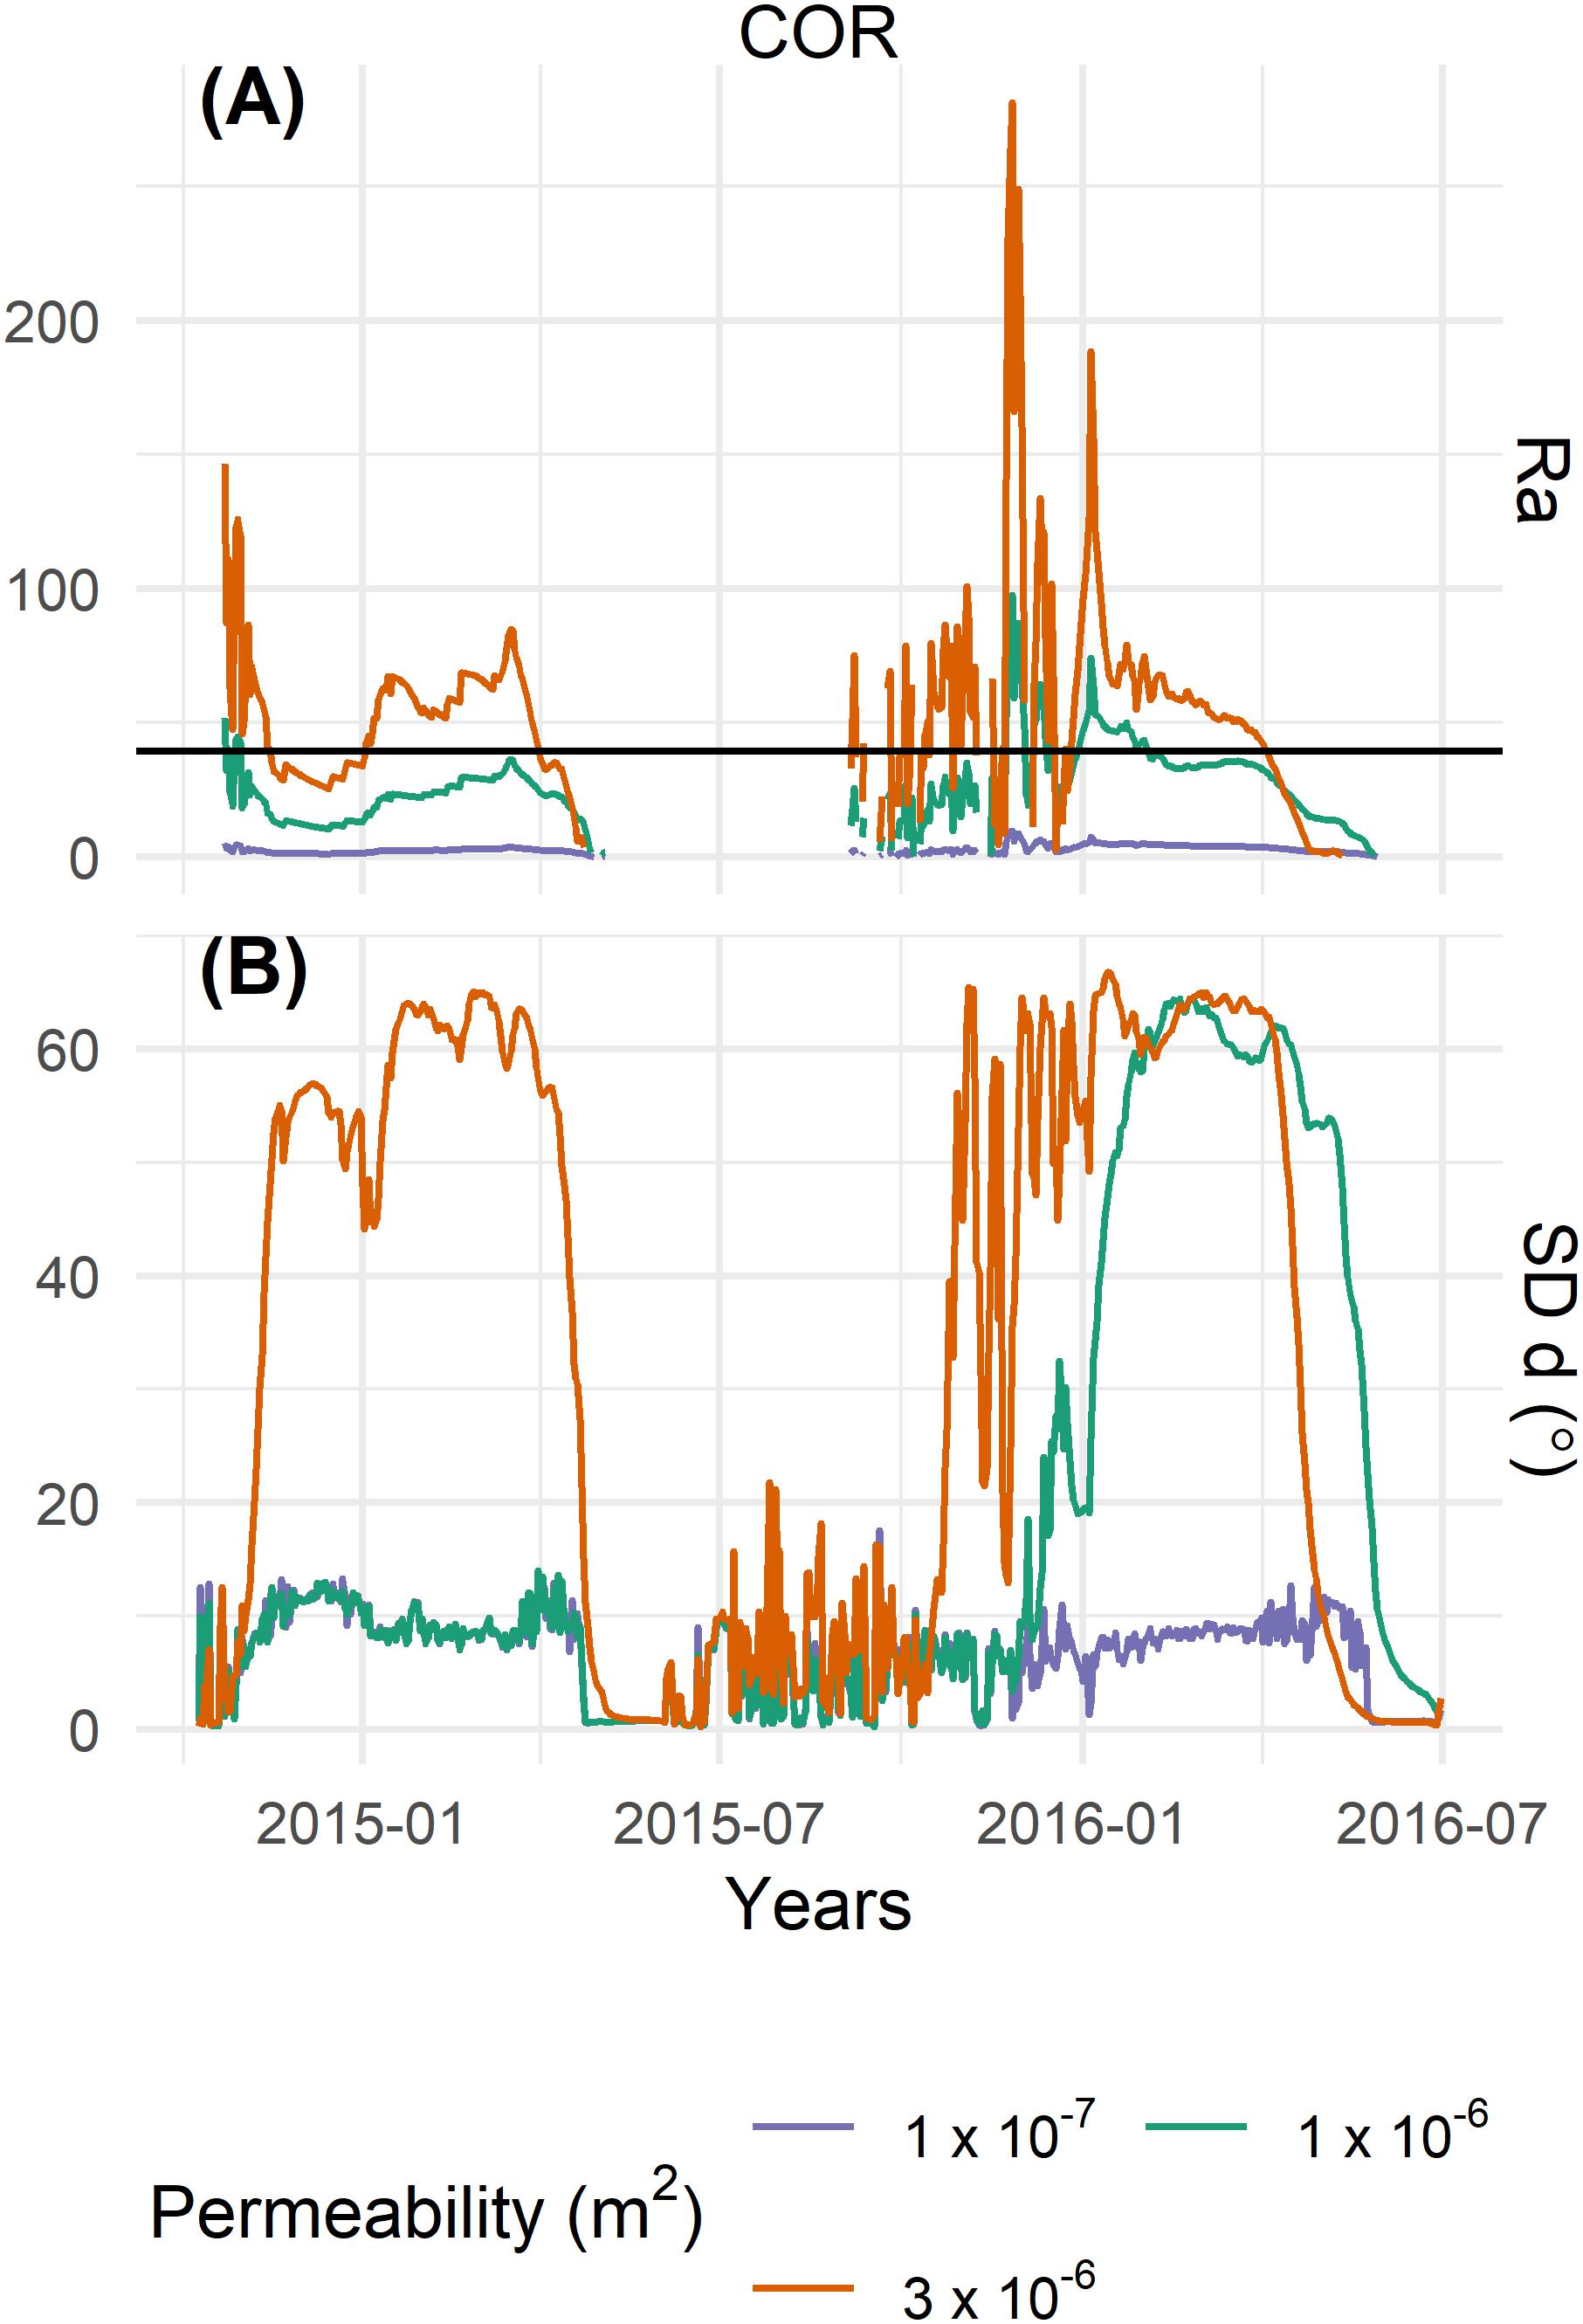
Figure 8. Excerpt of Figure 7 from beginning of October 2014 until end of June 2016 to show the interaction of Ra (A) and the onset, respectively the duration of convection, characterized by the standard deviation of d (B), plotted on daily values, over a shorter time period. Different permeability values are represented by different colors, data is from COR rock glacier.
Discussion
Convection
An indicator for the importance of convection is the resulting cooling. Comparing yearly mean temperatures at a depth of approximately 10 m for the simulations with low (1 × 10⁻⁷ m2) and high permeability (3 × 10⁻⁶ m2) at both sites, we find that the mean temperatures of the last modeled year at COR (SBE) are 0.93°C (0.64°C) colder at a depth of 9.55 m (9.2 m) for the high permeability case than for the low permeability case, where no convection is present. Albeit these values seem relatively low compared to reported values from specifically designed engineering structures, where the underlying temperatures decreased up to several degrees Celsius (Arenson and Sego, 2006), and to low elevation talus slopes, where permafrost occurrences with surrounding mean annual air temperature of up to 5°C were reported (Kneisel et al., 2000; Delaloye et al., 2003), the simulations show that active layer convection has a significant influence on the thermal regime of permafrost. Especially in the European Alps, where permafrost temperatures are often close to 0°C (Permos, 2019), the cooling trough convection is essential to maintain permafrost conditions. Furthermore, active layer convection has also an influence on the assumed distribution of permafrost. Discontinuous permafrost is known to have heterogeneous distribution patterns, highly influenced by the ground cover (Harris and Pedersen, 1998; Gubler et al., 2011; Schneider et al., 2012; Harrington and Hayashi, 2019) and the results from this study underline the importance of this influence. Care has therefore to be taken in generalizing measured temperatures in the context of permafrost mapping, as ground temperatures are highly dependent on the ground cover and the corresponding active layer permeability.
The temperature gradients shown in Table 3 are taken from the modeling results. Solving Eq. 7 for ΔT with Ra = Racrit, assuming 0°C as reference temperature for the material properties, yields similar values. The difference between the two sites is due to the difference in active layer thickness as Ra is linearly depending on it. When assuming all other material properties constant, the temperature gradient is the main driver of Ra and can easily be estimated through borehole data. This allows thus for a simple estimation of the probability of free convection effects in the active layer, which occurs when the critical temperature gradient is surpassed. Herz (2006) discussed the temperature gradients required for the onset of free convection in the active layer of an Alpine rock glacier. Field measurements yield values of -0.64 K m–1 at the base of the active layer, which is in agreement with the findings of this study.
The time scale of the study allows investigating the yearly behavior and the, relative to the available data, long-term effects of convection in the active layer on the ground thermal regime. The boundary data are daily values. Hence, our model does not represent intra-daily temperature or convection cycles. Convective air flow has already been measured in field-based studies on shorter time-scales (Morard and Delaloye, 2008; Panz, 2008), where intra-daily cycles are described as well. The airflow and temperature measurements of Panz (2008) took place in the uppermost meter of the active layer at COR and are thus much more influenced by the intra-daily temperature cycle, leading to higher temperature gradients. For this reason, and because of relatively high permeability values (cf section “Permeability”), the Ra values in the present study are about one order of magnitude smaller compared to Panz (2008). Nevertheless, the seasonal cycles observed by Panz (2008) agree well with the modeled convection patterns described in section “Air Flow Field and Rayleigh Number.”
Site Dependence
The comparison between modeled and measured temperatures (Figure 5) shows that the importance of convection is site dependent. At COR only the highest permeability shows a good agreement with the measured data. The active layer convection is therefore an important process, which is a necessary condition for accurate modeling of the measured temperatures. The influence of this convection at depths below the active layer is, as already shown by Scherler et al. (2014), still high. The active layer at COR is composed of big blocks without fine material which supports the assumption of a high permeability. At SBE, the permeability of 3 × 10⁻⁶ m2 is overestimating the convective cooling effect at this site. Nevertheless, the results show that permeability still has an influence on the ground thermal regime and a permeability of 1 × 10⁻⁶ m2 reproduces the measured wintertime cooling. The active layer at SBE is composed of smaller blocks and fine material is visible at the surface. Furthermore, water seems to play a more important role in the active layer of SBE than in COR, as the measured active layer temperatures show a distinct zero curtain. The occurrence of water in the active layer of SBE was also reported by other studies (e.g., Kenner et al., 2019). Water in the active layer can, at least seasonally, reduce the circulation of air and lower the influence of air convection in the active layer. Furthermore, Figure 7 shows that convection occurs more often at 1 × 10⁻⁶ m2 at SBE compared to COR. The temperature at the boundary at SBE is measured closer to the surface than at COR and shows thus a higher amplitude which leads to an increased temperature gradient within the active layer. Further, a smaller temperature gradient within the active layer (Table 3) leads to Racrit, as SBE has a thicker active layer, also favoring the onset of free convection.
To generalize our findings to other sites and landforms, it is important to consider the site dependence beyond the differences of the two studied sites, which are shortly discussed in the following. We focus on variations in (i) the material properties, i.e., mainly the thermal properties and the permeability, (ii) the geometry, characterized by a slope angle and eventual spatial heterogeneities and (iii) the potential importance of neglected processes, like energy exchange related to moist air or ponding meltwater.
The influence of changing thermal material properties (i) on the final simulation results due to a different lithology is rather small. A sensitivity study at COR with a permeability of 1 × 10⁻⁶ m2 showed for example that with a change in thermal conductivity of +7% (−7%), the mean temperature of the last modeled year at COR shows a temperature difference of +0.04°C (−0.05°C) at a depth of 10 m. This is negligible compared to the convective cooling effect of 0.93°C (section “Convection”). Further, the permeability is shown to have a big influence and is site specific, but as discussed in section “Permeability” hard to determine. A direct and reliable link between permeability and the material found at/within the surface cover is still not possible and needs further empirical work.
Regarding the geometry (ii), the slope angle has an influence on the convection patterns. With an increasing slope, advection, meaning the lateral component of the convective heat flux, becomes more important within the landform (Guodong et al., 2007; Wicky and Hauck, 2017). The gravitational gradient leads to an advective cooling in the lower part of the rock glacier. Geoelectrical measurements on COR, but also on other rock glaciers and talus slopes, also suggest such a pattern, with the highest resistivity values and therefore higher ice contents toward the front (Hilbich et al., 2009). Further, the heterogeneity of the active layer is at some sites also characterized by unevenly distributed liquid water (e.g., Halla et al., unpublished).
At sites with a high water content in the active layer, processes related to latent heat exchange and heat advection through percolating water gain in importance (iii). Nevertheless, Scherler et al. (2014) showed that the latent heat exchange due to seasonal melting and refreezing of the active layer can be equal and result in a net-zero balance over a year. Moore et al. (2011) showed that in ventilated fractures in an Alpine context, the heat input of melt water is negligible compared to cooling effects of free air convection. Furthermore, water plays also a role in gaseous state, i.e., within the air-filled voids. Changes in temperature lead to changes in relative humidity and thus lead to condensation, evaporation or sublimation of water in the active layer. Field evidence (Harris and Pedersen, 1998; Hanson and Hoelzle, 2004; Herz, 2006) and modeling studies (Scherler et al., 2014; Pruessner et al., 2018) state that these processes play a secondary role in the energy balance of a coarse blocky active layer and that the cooling effect induced by free convection prevails. Nevertheless, more in situ measurements in active layers of rock glaciers would be beneficial to quantify this effect in more detail.
Permeability
One of the key parameters is the intrinsic permeability of the porous active layer. Table 4 provides a brief literature overview of relevant permeability values in the context of this study without any claim to be exhaustive. The range of reported values differs by more than one order of magnitude. The Rayleigh number is especially sensitive to the chosen permeability as it is linearly depending on it – changes in order of magnitude in other material properties would not be physically justifiable. In Table 4, it is important to note that for values below 3 × 10⁻⁷ m2 natural convection does not occur in models in the context of coarse permafrost substrate, which agrees well with our study. Further, many authors rely upon the Kozeny-Carman equation (Eq. 8) with diameter of particles dp (Johansen, 1975; Nield and Bejan, 2017):
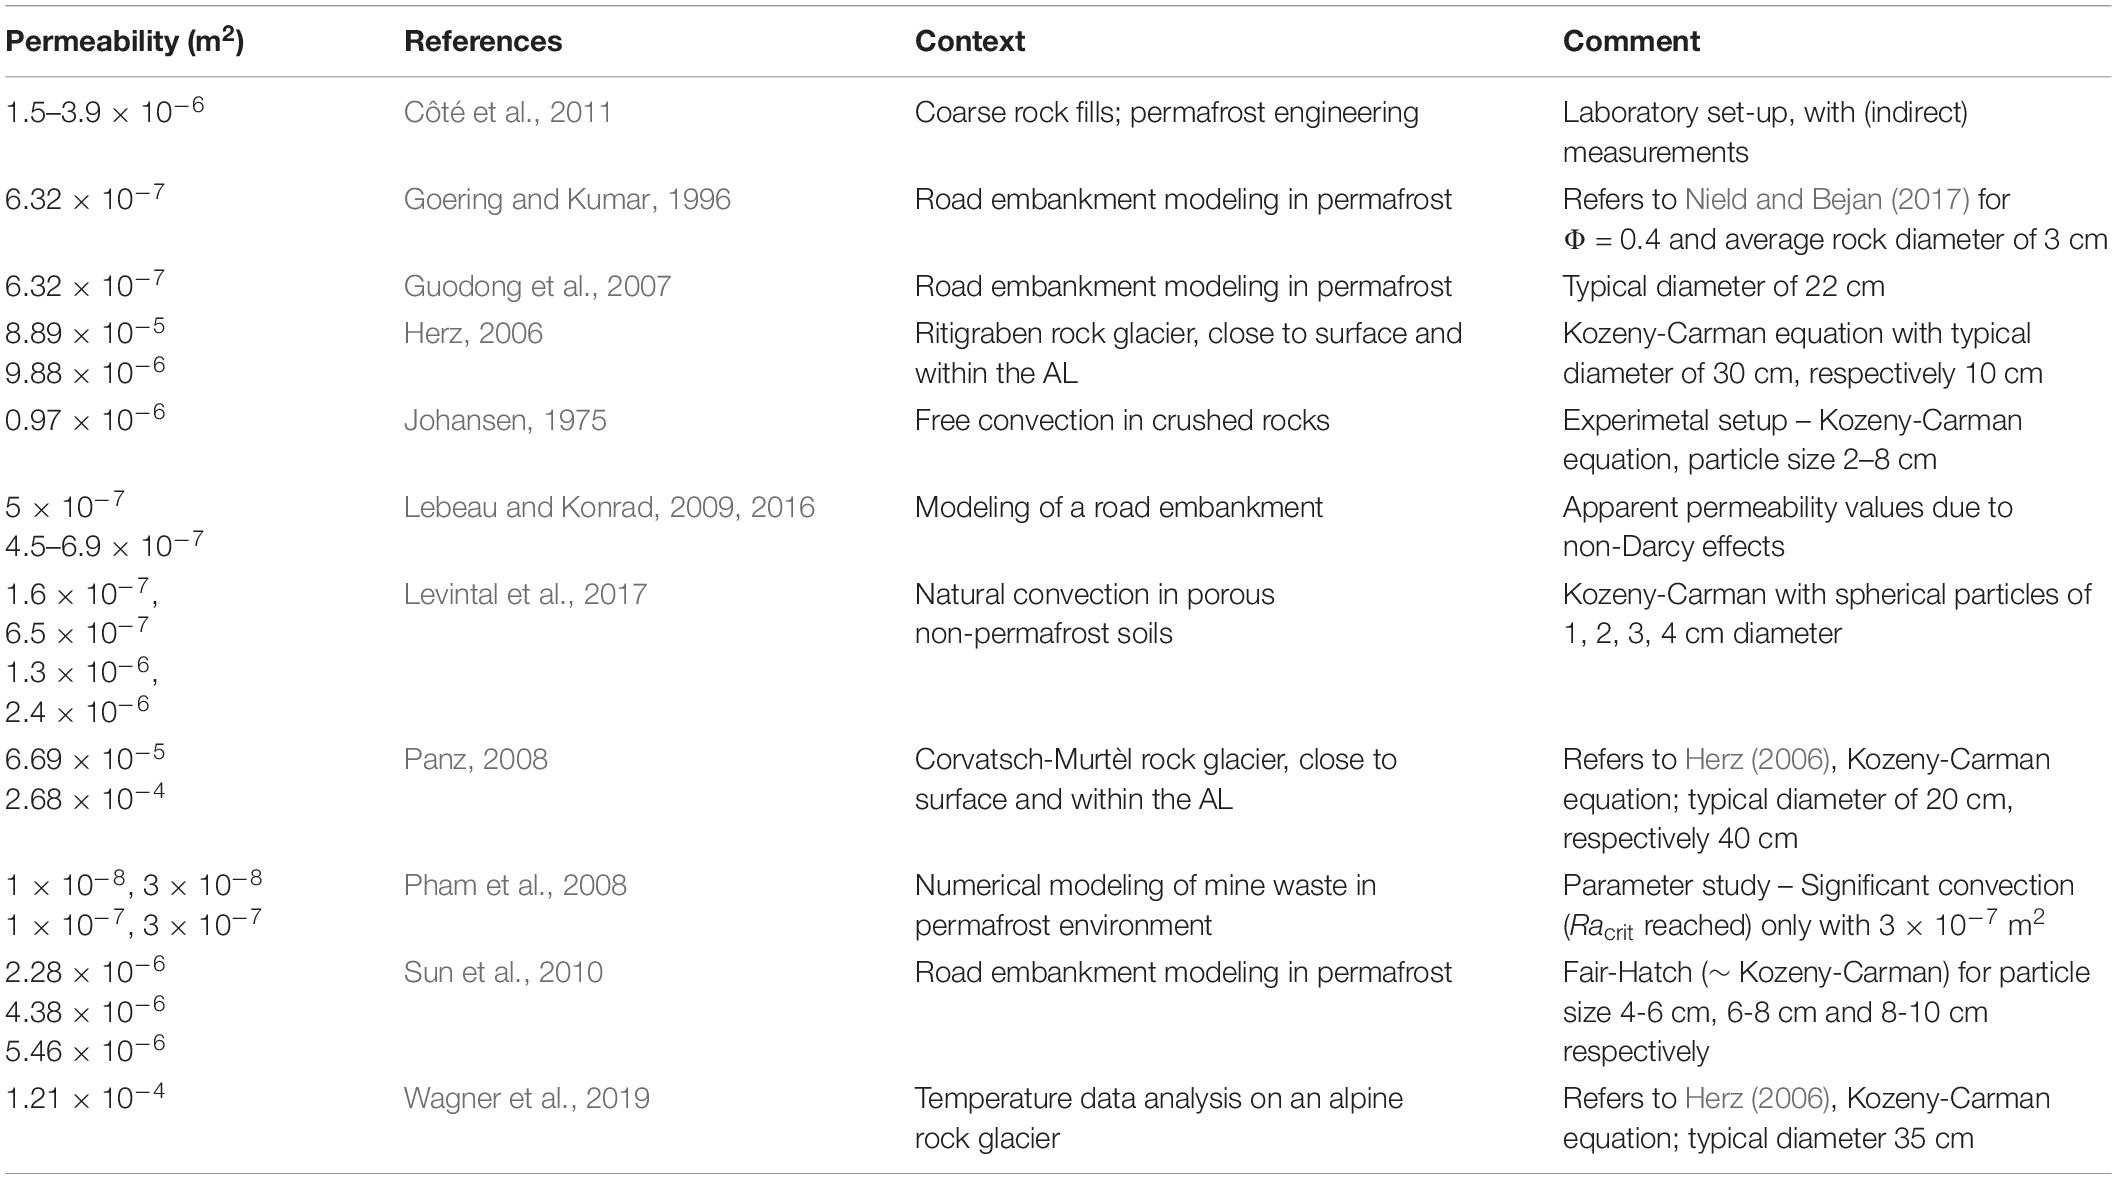
Table 4. Literature values for intrinsic permeability.
The aforementioned relation was developed and validated for comparatively small particle sizes (e.g., sand) in a packing of perfect spheres (Johansen, 1975; Côté et al., 2011). It is often not valid for non-spherical particles, broad range of particle diameters and consolidated media, nevertheless because of the simple applicability it is widely used (Nield and Bejan, 2017). Côté et al. (2011) showed with experimental data that the Kozeny – Carman equation overestimates the permeability for bigger particle sizes (e.g., crushed rocks) by a factor of about 4.25. Published values for permeability in the context of active layer convection for rock glaciers (Table 4; Herz, 2006; Panz, 2008; Wagner et al., 2019) are based on the Kozeny-Carman equation with no further validation and seem thus to be overestimating the permeability. It is also important to note that modeling studies normally use values in the order of 10–7-10–6 m2, whereas higher permeability values order of 10–5-10–4 m2 are only used in the analysis of field data (Table 4). This is in agreement with our study, where the best results were obtained for permeability values in the order of magnitude of 10–6 m2, confirming the experimental values of Côté et al. (2011).
In summary, we recommend that in future attempts of analyzing the convection regime of the active layer of rock glaciers, the Kozeny-Carman equation should be used with caution. Because of a lack of experimental and field data, reliable estimations of the permeability in the active layer of rock glaciers are so far not possible. However, analogies to crushed rock from an engineering context serve as a good indicator and allow a consistent modeling of the process.
Independent of the permeability values, this porous media modeling approach inherently homogenizes the active layer. Borehole geophysics generally only provide limited information about the composition of the active layer of rock glaciers (Haeberli et al., 1988; Vonder Mühll and Holub, 1992; Arenson et al., 2002), geophysics draw a relatively homogenous pattern in terms of the electrical resistivity (Hilbich et al., 2009) and more recent findings suggest that the air content and thus the permeability decreases toward the bottom of the active layer (Mollaret et al., 2020). However, at different sites there is also geophysical evidence for heterogeneous active layers, often depending on 3D topography and differential water infiltration patterns (Scapozza et al., 2015; Halla et al., unpublished). For COR the assumption of a homogenous active layer is less of a simplification than for SBE. The blocks at COR are relatively big (0.4 m up to several meters), the water percolates quickly, the surface is almost always dry (Hanson and Hoelzle, 2004) and geophysical measurements do not show signs of water in the active layer (Hilbich et al., 2009; Mollaret et al., 2020). At SBE less information is available. A previous study reports the presence of water in the active layer (Kenner et al., 2019) and the freezing process is visible in the temperature data of the active layer (Figure 4A, cf section “Site Dependence”). The presence of water fills the pores and prevents convective circulation of air. The model performs thus also less well at SBE. Deeper knowledge of the active layer composition, especially at its base, would be of benefit and could then be included in the model set up. Still, it is also important to avoid modeling artefacts originating from a very complex active layer set up without means for validation.
Boundary Conditions
The temperature boundary condition at the upper model boundary is prescribed by the uppermost thermistor of the borehole. By this, the thermal effect of a temporally variable snow cover is represented in the boundary data. The disadvantage of this approach is that it depends on the measured temperature data below the snow cover, and would need an additional snow model/energy balance approach to use meteorological data as a boundary condition. Further, a casing protects the thermistor chain measuring temperature in the borehole. Convection occurs therefore not directly at the thermistors, but additional temperature measurements showed that the disturbances caused by the casing are negligible (Vonder Mühll and Haeberli, 1990).
The temperature boundary condition is constant in space per time step. Spatially distributed temperature dataset on rock glaciers are rare and not available for the modeled sites over many years. This does not pose a problem, when comparing modeled data to measured data on a point scale, but it could influence the interpretation of spatial temperature patterns.
Compared to other modeling approaches of convection in permafrost (see Goering and Kumar, 1996; Guodong et al., 2007) we use real measured temperature data as upper thermal boundary condition. This is essential to compare the modeled data to the measured borehole data for a better understanding of the behavior of the ground thermal regime. Still, this has also some drawbacks. The naturally occurring extensive temperature changes on short timescales inherently cause numerical instabilities in the model. To cope with these instabilities, in an addition to an adaptive time stepping scheme and extensive mesh tests, we dampened the effects of latent heat (cf section “Boundary Conditions”) and chose the computationally effective and stable Darcy approach with an Oberbeck-Boussinesq approximation and thus incompressible flow.
Modeling porous media air convection in a permafrost context with a Darcy approach including the Oberbeck-Boussinesq approximation can be seen as the state of the art in this domain and is by far the most used approach (e.g., Goering and Kumar, 1996; Pham et al., 2008; Lebeau and Konrad, 2009; Sun et al., 2010; Darrow and Jensen, 2016). However, recent studies on thermal modeling of road embankments show that accounting for compressible flow (Lebeau and Konrad, 2009), radiation and non-Darcy effects (Lebeau and Konrad, 2016) influences the results. The modeling approaches of Lebeau and Konrad (2009, 2016) are applied to a smaller setting with harmonic boundary conditions and relatively low permeability in the order of ∼5 × 10⁻⁷ m2 (Table 4). The increase of non-linearity accounting for compressible flow, radiation and non-Darcy effects, in our setting with real boundary data, relatively high permeability and phase change, is numerically more challenging and computationally more expensive. Nevertheless, their studies also show that the difference to a Darcy model adopting the Oberbeck-Boussinesq approximation is negligible on the scales we are addressing in our study. Lebeau and Konrad (2016) show that non-Darcy effects, such as the inertial drag described by the Forchheimer term, have the potential to reduce the intrinsic permeability by 6%. Radiative effects lead to a slight increase in summer temperatures (Lebeau and Konrad, 2016), which in our case, with the possibility of validation, means that the convective cooling is rather underestimated. Accounting for compressibility has also subordinate influence on the results. The absolute error of Oberbeck-Boussinesq approximation compared to an approach with compressibility does not exceed 6% in the tests of Lebeau and Konrad (2009). Further, the assumption of a local thermal equilibrium in the porous media is made, meaning that the solid and the liquid phase have the same temperature. This is common to all so far cited studies of thermal modeling in crushed rocks. Concerning local thermal non-equilibrium (LTNE) models in a general permafrost context, only very little work has been carried out so far (e.g., Heinze, 2020). The uncertainty of the additional parameters and the additional computational cost needed outweigh the benefit to the presented modeling approach. Regarding the relatively small influence of the above effects, we prefer to run a simpler but stable model, which allows for using real measured boundary conditions and a higher permeability while accepting the potentially small resulting error.
Conclusion and Outlook
We developed and applied a model approach, which, in addition to conduction, also explicitly models convection on a two-dimensional domain of a schematic rock glacier. Convection is modeled in a porous media with a Darcy approach, adopting the Oberbeck-Boussinesq approximation to account for natural convection. Datasets from two different rock glaciers in the Swiss Alps were used to exemplary characterize the different convection regimes and the effects of active layer convection on ground temperatures. Our findings show that:
1. Natural convection in a coarse blocky active layer has a major influence on the thermal regime of the active layer and the underlying permafrost body, even at depth of the zero annual amplitude.
2. Borehole temperatures are in good agreement with the modeling results – convection is needed to represent the measured temperatures at both sites, albeit not to the same degree.
3. The cooling potential mainly depends on the permeability and the thermal gradient within the active layer, which is also described by the Rayleigh number.
In future research, the permeability in coarse blocky alpine permafrost should be further addressed, either with attempts of in situ or indirect measurements or with laboratory experiments. Furthermore, in a modeling perspective, our findings should be integrated in long-term permafrost models to enhance parametrizations of convective heat transfer and improve future temperature and ground ice content projections.
Data Availability Statement
The boundary datasets generated for this study are included in the article/Supplementary Material. The model files can be obtained through the corresponding author.
Author Contributions
JW designed and performed the model calculations and analyzed the data, produced all the figures, and wrote the manuscript with substantial inputs from CH. Both authors contributed to the article and approved the submitted version.
Funding
This study was funded within the Swiss National Science Foundation SNSF Project MODAIRCAP (no. 169499).
Conflict of Interest
The authors declare that the research was conducted in the absence of any commercial or financial relationships that could be construed as a potential conflict of interest.
Acknowledgments
We thank the editor and the reviewers for the precious time they invested to provide comments, which improved the manuscript. We also sincerely thank D. Amschwand, M. Hoelzle, and M. Scherler for their comments on an early version of the manuscript. Further, we are thankful for the borehole data provided by Andreas Vieli (PI, UZH) for COR and Marcia Phillips (PI, SLF) for SBE, as part of PERMOS, supported by MeteoSwiss (in the framework of GCOS Switzerland)/BAFU/SCNAT.
Supplementary Material
The Supplementary Material for this article can be found online at: https://www.frontiersin.org/articles/10.3389/feart.2020.00335/full#supplementary-material
References
Arenson, L., Hoelzle, M., and Springman, S. (2002). Borehole deformation measurements and internal structure of some rock glaciers in Switzerland. Permafr. Periglac. Process. 13, 117–135. doi: 10.1002/ppp.414
Arenson, L. U., Hauck, C., Hilbich, C., Seward, L., Yamamoto, Y., and Springman, S. M. (2010). “Sub-surface heterogeneities in the Murtèl-Corvatsch rock glacier, Switzerland,” in Proceedings of the Sixth Canadian Permafrost Conference, Vol. 12–16, Calgary, AL, 1494–1500.
Arenson, L. U., and Sego, D. C. (2006). “Considering convective air fluxes in the design of engineered structures in cold regions”, in Proceedings of the Fifty Nineteenth Conference, Vancouver, BC.
Barsch, D. (1996). Rockglaciers?: Indicators for the Present and Former Geoecology in High Mountain Environments. Berlin: Springer.
Biskaborn, B. K., Smith, S. L., Noetzli, J., Matthes, H., Vieira, G., Streletskiy, D. A., et al. (2019). Permafrost is warming at a global scale. Nat. Commun. 10, 1–11. doi: 10.1038/s41467-018-08240-8244
Boeckli, L., Brenning, A., Gruber, S., and Noetzli, J. (2012). A statistical approach to modelling permafrost distribution in the European Alps or similar mountain ranges. Cryosph 6, 125–140. doi: 10.5194/tc-6-125-2012
Cermak, V., and Rybach, L. (1982). “Thermal properties: thermal conductivity and specific heat of minerals and rocks,” in Landolt-Bornstein Zahlenwerte und Funktionen aus Naturwissenschaften und Technik, Neue Serie, ed. G. Angensteiner (Berlin: Springer Verlag), 305–343.
Cicoira, A., Beutel, J., Faillettaz, J., Gärtner-Roer, I., and Vieli, A. (2019). Resolving the influence of temperature forcing through heat conduction on rock glacier dynamics: a numerical modelling approach. Cryosph 13, 927–942. doi: 10.5194/tc-13-927-2019
Côté, J., Fillion, M. H., and Konrad, J. M. (2011). Intrinsic permeability of materials ranging from sand to rock-fill using natural air convection tests. Can. Geotech. J. 48, 679–690. doi: 10.1139/t10-097
Darrow, M. M., and Jensen, D. D. (2016). Modeling the performance of an air convection embankment (ACE) with thermal berm over ice-rich permafrost, Lost Chicken Creek, Alaska. Cold Reg. Sci. Technol. 130, 43–58. doi: 10.1016/j.coldregions.2016.07.012
Delaloye, R., and Lambiel, C. (2005). Evidence of winter ascending air circulation throughout talus slopes and rock glaciers situated in the lower belt of alpine discontinuous permafrost (Swiss Alps). Nor. Geogr. Tidsskr. 59, 194–203. doi: 10.1080/00291950510020673
Delaloye, R., Reynard, E., Lambiel, C., Marescot, L., and Monnet, R. (2003). Thermal anomaly in a cold scree slope (Creux du Van. Switzerland). Proc. Eighth Int. Conf. Permafr. 2003, 175–180.
Deluigi, N., Lambiel, C., and Kanevski, M. (2017). Data-driven mapping of the potential mountain permafrost distribution. Sci. Total Environ. 590–591, 370–380. doi: 10.1016/j.scitotenv.2017.02.041
Draebing, D., Krautblatter, M., and Hoffmann, T. (2017). Thermo-cryogenic controls of fracture kinematics in permafrost rockwalls. Geophys. Res. Lett. 44, 3535–3544. doi: 10.1002/2016GL072050
Goering, D. J., and Kumar, P. (1996). Winter-time convection in open-graded embankments. Cold Reg. Sci. Technol. 24, 57–74. doi: 10.1016/0165-232X(95)00011-Y
Gruber, S., and Haeberli, W. (2007). Permafrost in steep bedrock slopes and its temperatures-related destabilization following climate change. J. Geophys. Res. Earth Surf. 112, 1–10. doi: 10.1029/2006JF000547
Gruber, S., and Hoelzle, M. (2008). “The cooling effect of coarse blocks revisited,” in 9th International Conference on Permafrost, Institute of Norther Engineering, Vol. 1, eds D. L. Kane and K. M. Hinkel Fairbanks, AK: University of Alaska Fairbanks, 557–561.
Gubler, S., Fiddes, J., Keller, M., and Gruber, S. (2011). Scale-dependent measurement and analysis of ground surface temperature variability in alpine terrain. Cryosph 5, 431–443. doi: 10.5194/tc-5-431-2011
Guodong, C., Yuanming, L., Zhizhong, S., and Fan, J. (2007). The ‘thermal semi-conductor’ effect of crushed rocks. Permafr. Periglac. Process. 18, 151–160. doi: 10.1002/ppp.575
Haberkorn, A., Wever, N., Hoelzle, M., Phillips, M., Kenner, R., Bavay, M., et al. (2017). Distributed snow and rock temperature modelling in steep rock walls using Alpine3D. Cryosph 11, 585–607. doi: 10.5194/tc-11-585-2017
Haeberli, W., Hunder, J., Keusen, H.-R., Pika, J., and Röthlisberger, H. (1988). Core drilling through rock-glacier permafrost. Proc. Fifth Int. Conf. Permafr. 2, 937–942.
Hanson, S., and Hoelzle, M. (2004). The thermal regime of the active layer at the Murtèl rock glacier based on data from 2002. Permafr. Periglac. Process. 15, 273–282. doi: 10.1002/ppp.499
Harrington, J. S., and Hayashi, M. (2019). Application of distributed temperature sensing for mountain permafrost mapping. Permafr. Periglac. Process. 30, 113–120. doi: 10.1002/ppp.1997
Harris, S. A., and Pedersen, D. E. (1998). Thermal regimes beneath coarse blocky materials. Permafr. Periglac. Process. 9, 107–120. doi: 10.1002/(SICI)1099-1530(199804/06)9:2<107::AID-PPP277<3.0.CO;2-G
Heinze, T. (2020). Possible effect of flow velocity on thawing rock-water-ice systems under local thermal non-equilibrium conditions. Cold Reg. Sci. Technol. 170:102940. doi: 10.1016/j.coldregions.2019.102940
Herz, T. (2006). Das Mikroklima Grobblockiger Schutthalden der Alpinen Periglazialstufe und seine Auswirkungen auf Energieaustauschprozesse zwischen Atmosphäre und Lithosphäre. PhD Thesis, Justus-Liebig-Universität Gießen, Giessen.
Hilbich, C., Marescot, L., Hauck, C., Loke, M. H., and Mäusbacher, R. (2009). Applicability of electrical resistivity tomography monitoring to coarse blocky and ice-rich permafrost landforms. Permafr. Periglac. Process. 20, 269–284. doi: 10.1002/ppp.652
Hoelzle, M., Mittaz, C., Etzelmüller, B., and Haeberli, W. (2001). Surface energy fluxes and distribution models of permafrost in European mountain areas: an overview of current developments. Permafr. Periglac. Process. 12, 53–68. doi: 10.1002/ppp.385
Jones, D. B., Harrison, S., Anderson, K., and Betts, R. A. (2018). Mountain rock glaciers contain globally significant water stores. Sci. Rep. 8, 1–10. doi: 10.1038/s41598-018-21244-w
Juliussen, H., and Humlum, O. (2008). Thermal regime of openwork block fields on the mountains Elgåhogna and Sølen, central-eastern Norway. Permafr. Periglac. Process. 19, 1–18. doi: 10.1002/ppp.607
Kane, D. L., Hinkel, K. M., Goering, D. J., Hinzman, L. D., and Outcalt, S. I. (2001). Non-conductive heat transfer associated with frozen soils. Glob. Planet. Change 29, 275–292. doi: 10.1016/S0921-8181(01)00095-99
Keller, F. (1992). Automated mapping of mountain permafrost using the program PERMAKART within the geographical information system ARC/INFO. Permafr. Periglac. Process. 3, 133–138. doi: 10.1002/ppp.3430030210
Kenner, R., Pruessner, L., Beutel, J., Limpach, P., and Phillips, M. (2019). How rock glacier hydrology, deformation velocities and ground temperatures interact: examples from the Swiss Alps. Permafr. Periglac. Process. 31, 12–14. doi: 10.1002/ppp.2023
Kneisel, C., Hauck, C., and Mühll, D. V. (2000). Permafrost below the Timberline confirmed and characterized by geoelectrical resistivity measurements, Bever Valley, eastern Swiss Alps. Permafr. Periglac. Process. 11, 295–304. doi: 10.1002/1099-1530(200012)11:4<295::AID-PPP353<3.0.CO;2-L
Lebeau, M., and Konrad, J. M. (2009). Natural convection of compressible and incompressible gases in undeformable porous media under cold climate conditions. Comput. Geotech. 36, 435–445. doi: 10.1016/j.compgeo.2008.04.005
Lebeau, M., and Konrad, J. M. (2016). Non-Darcy flow and thermal radiation in convective embankment modeling. Comput. Geotech. 73, 91–99. doi: 10.1016/j.compgeo.2015.11.016
Levintal, E., Dragila, M. I., Kamai, T., and Weisbrod, N. (2017). Free and forced gas convection in highly permeable, dry porous media. Agric. For. Meteorol. 232, 469–478. doi: 10.1016/j.agrformet.2016.10.001
Luethi, R., Phillips, M., and Lehning, M. (2017). Estimating Non-conductive heat flow leading to intra-permafrost talik formation at the ritigraben rock glacier (Western Swiss Alps). Permafr. Periglac. Process. 28, 183–194. doi: 10.1002/ppp.1911
Marmy, A., Rajczak, J., Delaloye, R., Hilbich, C., Hoelzle, M., Kotlarski, S., et al. (2016). Semi-automated calibration method for modelling of mountain permafrost evolution in Switzerland. Cryosph 10, 2693–2719. doi: 10.5194/tc-10-2693-2016
Maurer, H., and Hauck, C. (2007). Geophysical imaging of alpine rock glaciers. J. Glaciol. 53, 110–120. doi: 10.3189/172756507781833893
Mollaret, C., Wagner, F. M., Hilbich, C., Scapozza, C., and Hauck, C. (2020). Petrophysical joint inversion applied to alpine permafrost field sites to image subsurface Ice, Water, Air, and Rock Contents. Front. Earth Sci. 8:85. doi: 10.3389/feart.2020.00085
Moore, J. R., Gischig, V., Katterbach, M., and Loew, S. (2011). Air circulation in deep fractures and the temperature field of an alpine rock slope. Earth Surf. Process. Landforms 36, 1985–1996. doi: 10.1002/esp.2217
Morard, S., Delaloye, R., and Lambiel, C. (2012). Pluriannual thermal behavior of low elevation cold talus slopes in western Switzerland. Geogr. Helv. 65, 124–134. doi: 10.5194/gh-65-124-2010
Morard, S., and Delaloye, R. (2008). Airflow velocity measurements in ventilated porous debris accumulations. Swiss Geosci. Meet. 192–193.
Myhra, K. S., Westermann, S., and Etzelmüller, B. (2019). Modeling conductive heat flow between steep rock walls and talus slopes – thermal processes and geomorphological implications. Front. Earth Sci. 7:192. doi: 10.3389/feart.2019.00192
Noetzli, J., and Gruber, S. (2009). Transient thermal effects in Alpine permafrost. Cryosph 3, 85–99. doi: 10.5194/tc-3-85-2009
Panz, M. (2008). Analyse von Austauschprozessen in der Auftauschicht des Blockgletschers Murtèl-Corvatsch, Oberengadin. Master Thesis, Ruhr Universität, Germany.
Pham, H., Arenson, L. U., and Sego, D. C. (2008). Numerical analysis of forced and natural convection in waste-rock piles in permafrost environments. Proc. Ninth Int. Conf. Permafr. 28, 1411–1416.
Popescu, R., Vespremeanu-Stroe, A., Onaca, A., Vasile, M., Cruceru, N., and Pop, O. (2017). Low-altitude permafrost research in an overcooled talus slope–rock glacier system in the Romanian Carpathians (Detunata Goalã Apuseni Mountains). Geomorphology 295, 840–854. doi: 10.1016/j.geomorph.2017.07.029
Pruessner, L., Phillips, M., Farinotti, D., Hoelzle, M., and Lehning, M. (2018). Near-surface ventilation as a key for modeling the thermal regime of coarse blocky rock glaciers. Permafr. Periglac. Process. 29, 152–163. doi: 10.1002/ppp.1978
Sawada, Y., Ishikawa, M., and Ono, Y. (2003). Thermal regime of sporadic permafrost in a block slope on Mt. Nishi-Nupukaushinupuri, Hokkaido Island, Northern Japan. Geomorphology 52, 121–130.
Scapozza, C., Baron, L., and Lambiel, C. (2015). Borehole logging in Alpine periglacial talus slopes (Valais, Swiss Alps). Permafr. Periglac. Process. 26, 67–83. doi: 10.1002/ppp.1832
Scherler, M., Hauck, C., Hoelzle, M., and Salzmann, N. (2013). Modeled sensitivity of two alpine permafrost sites to RCM-based climate scenarios. J. Geophys. Res. Earth Surf. 118, 780–794. doi: 10.1002/jgrf.20069
Scherler, M., Schneider, S., Hoelzle, M., and Hauck, C. (2014). A two-sided approach to estimate heat transfer processes within the active layer of the Murtèl-Corvatsch rock glacier. Earth Surf. Dyn. 2, 141–154. doi: 10.5194/esurf-2-141-2014
Schneider, S., Hoelzle, M., and Hauck, C. (2012). Influence of surface and subsurface heterogeneity on observed borehole temperatures at a mountain permafrost site in the Upper Engadine. Swiss Alps. Cryosph. 6, 517–531. doi: 10.5194/tc-6-517-2012
Staub, B., Hasler, A., Noetzli, J., and Delaloye, R. (2017). Gap-Filling algorithm for ground surface temperature data measured in permafrost and periglacial environments. Permafr. Periglac. Process. 28, 275–285. doi: 10.1002/ppp.1913
Stocker-Mittaz, C., Hoelzle, M., and Haeberli, W. (2002). Modelling alpine permafrost distribution based on energy-balance data: a first step. Permafr. Periglac. Process. 13, 271–282. doi: 10.1002/ppp.426
Sun, B., Yang, L., Liu, Q., and Xu, X. (2010). Numerical modelling for crushed rock layer thickness of highway embankments in permafrost regions of the Qinghai-Tibet Plateau. Eng. Geol. 114, 181–190. doi: 10.1016/j.enggeo.2010.04.014
Vonder Mühll, D., and Haeberli, W. (1990). Thermal characteristics of the permafrost within an active rock glacier (Murtel/Corvatsch, Grisons, Swiss Alps). J. Glaciol. 36, 151–158.
Vonder Mühll, D. S., Arenson, L. U., and Springman, S. M. (2003). “Temperature conditions in two Alpine rock glaciers,” in Proceedings of the Eighth International Conference on Permafrost, Zürich, 1195–1200.
Vonder Mühll, D. S., Hauck, C., and Lehmann, F. (2000). Verification of geophysical models in Alpine permafrost using borehole information. Ann. Glaciol. 31, 300–306. doi: 10.3189/172756400781820057
Vonder Mühll, D. S., and Holub, P. (1992). Borehole logging in alpine permafrost, upper Engadin, Swiss Alps. Permafr. Periglac. Process. 3, 125–132. doi: 10.1002/ppp.3430030209
Wagner, T., Pauritsch, M., Mayaud, C., Kellerer-Pirklbauer, A., Thalheim, F., and Winkler, G. (2019). Controlling factors of microclimate in blocky surface layers of two nearby relict rock glaciers (Niedere Tauern Range, Austria). Geogr. Ann. Ser. A, Phys. Geogr. 101, 310–333. doi: 10.1080/04353676.2019.1670950
Wakonigg, H. (1996). Unterkühlte Schutthalden. Arb. aus dem Inst. für Geogr. der Karl Franzens Universität Graz 33, 209–223.
Weisbrod, N., Dragila, M. I., Nachshon, U., and Pillersdorf, M. (2009). Falling through the cracks: the role of fractures in Earth-atmosphere gas exchange. Geophys. Res. Lett. 36, 1–5. doi: 10.1029/2008GL036096
Westermann, S., Schuler, T. V., Gisnås, K., and Etzelmüller, B. (2013). Transient thermal modeling of permafrost conditions in Southern Norway. Cryosph 7, 719–739. doi: 10.5194/tc-7-719-2013
Wicky, J., and Hauck, C. (2017). Numerical modelling of convective heat transport by air flow in permafrost talus slopes. Cryosph 11, 1311–1325. doi: 10.5194/tc-11-1311-2017
Appendix A
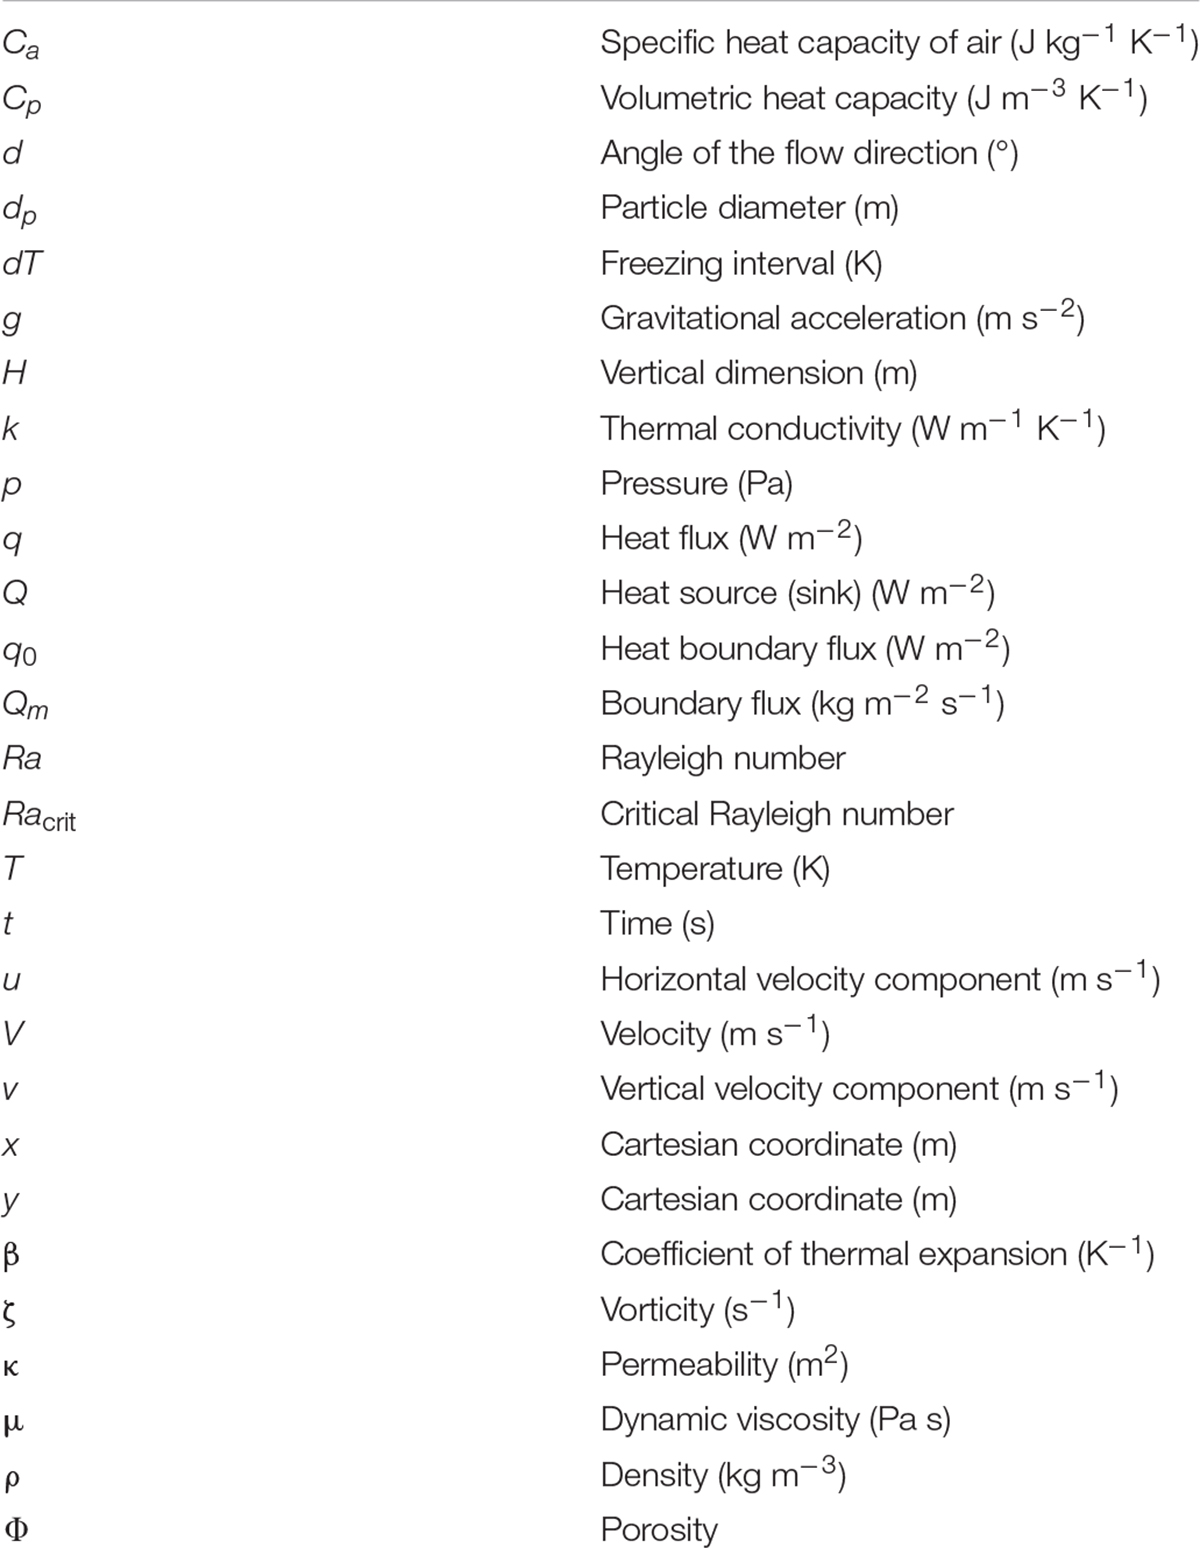
Table | Nomenclature.
Keywords: rock glacier, convection, active layer, two-dimensional modeling, heat transfer, permafrost
Citation: Wicky J and Hauck C (2020) Air Convection in the Active Layer of Rock Glaciers. Front. Earth Sci. 8:335. doi: 10.3389/feart.2020.00335
Received: 06 March 2020; Accepted: 20 July 2020;
Published: 14 August 2020.
Edited by:
Annett Bartsch, Independent Researcher, Korneuburg, AustriaCopyright © 2020 Wicky and Hauck. This is an open-access article distributed under the terms of the Creative Commons Attribution License (CC BY). The use, distribution or reproduction in other forums is permitted, provided the original author(s) and the copyright owner(s) are credited and that the original publication in this journal is cited, in accordance with accepted academic practice. No use, distribution or reproduction is permitted which does not comply with these terms.
*Correspondence: Jonas Wicky, am9uYXMud2lja3lAdW5pZnIuY2g=